

Page 1

9935
Hart Scientific
LogWare II
Real-Time Data Acquisition Software
User’s Guide
9935____ugeng0000
051001
Page 2

Fluke Corporation, Hart Scientific Division (Hart) warrants this product to be free
from defects in material and workmanship under normal use and service for a pe
riod as stated in our current product catalog from the date of shipment. This war
-
ranty extends only to the original purchaser and shall not apply to any product
which, in Hart’s sole opinion, has been subject to misuse, alteration, abuse or abnor
mal conditions of operation or handling.
Software is warranted to operate in accordance with its programmed instructions on
appropriate Hart products. It is not warranted to be error free.
Hart’s obligation under this warranty is limited to repair or replacement of a product
which is returned to Hart within the warranty period and is determined, upon exam
ination by Hart, to be defective. If Hart determines that the defect or malfunction
has been caused by misuse, alteration, abuse or abnormal conditions or operation or
handling, Hart will repair the product and bill the purchaser for the reasonable cost
of repair.
To exercise this warranty, the purchaser must forward the product after calling or
writing Hart for authorization. Hart assumes NO risk for in-transit damage.
For service or assistance, please contact the manufacturer.
THE FOREGOING WARRANTY IS PURCHASER’S SOLE AND EXCLUSIVE
REMEDY AND IS IN LIEU OF ALL OTHER WARRANTIES, EXPRESS OR IMPLIED, INCLUDING BUT NOT LIMITED TO ANY IMPLIED WARRANTY OR
MERCHANTABILITY, OR FITNESS FOR ANY PARTICULAR PURPOSE OR
USE. HART SHALL NOT BE LIABLE FOR ANY SPECIAL, INDIRECT, INCIDENTAL, OR CONSEQUENTIAL DAMAGES OR LOSS WHETHER IN CONTRACT, TORT, OR OTHERWISE.
-
-
Microsoft, MS-DOS, Windows, Window for Workgroups, and Windows 95, 98,
ME, NT, 2000, XP, and VISTA are either registered trademarks or trademarks of
Microsoft Corporation.
Fluke Corporation
Hart Scientific Division
799 E. Utah Valley Drive American Fork, UT 84003-9775 USA
Phone: +1.801.763.1600
Telefax: +1.801.763.1010
Email: support@hartscientific.com
www.hartscientific.com
Subject to change without notice. Copyright © 2008 Printed in USA
Page 3

Table of Contents
1 Introduction . . . . . . . . . . . . . . . . . . . . . . . . . . . . 1
1.1 What is LogWa re . . . . . . . . . . . . . . . . . . . . . . . . . . . 1
1.2 License agreement . . . . . . . . . . . . . . . . . . . . . . . . . . 2
1.3 Features . . . . . . . . . . . . . . . . . . . . . . . . . . . . . . . . 2
1.4 Requirements . . . . . . . . . . . . . . . . . . . . . . . . . . . . . 4
1.4.1 Communications requirements. . . . . . . . . . . . . . . . . . . . . . . . . . 4
1.4.2 Computer hardware requirements . . . . . . . . . . . . . . . . . . . . . . . . 4
1.4.3 Computer software requirements. . . . . . . . . . . . . . . . . . . . . . . . . 5
1.4.4 Firmware requirements. . . . . . . . . . . . . . . . . . . . . . . . . . . . . . 5
1.5 Installation . . . . . . . . . . . . . . . . . . . . . . . . . . . . . . 6
1.6 Running LogWa re . . . . . . . . . . . . . . . . . . . . . . . . . . 6
1.6.1 Getting started . . . . . . . . . . . . . . . . . . . . . . . . . . . . . . . . . . 6
1.7 Using LogWa re . . . . . . . . . . . . . . . . . . . . . . . . . . . . 8
1.7.1 LogWar e main display . . . . . . . . . . . . . . . . . . . . . . . . . . . . . . 9
1.8 LogWa re options . . . . . . . . . . . . . . . . . . . . . . . . . . 11
2 Real-time logging . . . . . . . . . . . . . . . . . . . . . . . . . 13
2.1 File menu . . . . . . . . . . . . . . . . . . . . . . . . . . . . . . 13
2.1.1 New . . . . . . . . . . . . . . . . . . . . . . . . . . . . . . . . . . . . . . . 13
2.1.2 Open. . . . . . . . . . . . . . . . . . . . . . . . . . . . . . . . . . . . . . . 13
2.1.3 Save as . . . . . . . . . . . . . . . . . . . . . . . . . . . . . . . . . . . . . 14
2.2 Datalog menu . . . . . . . . . . . . . . . . . . . . . . . . . . . . 15
2.2.1 Setup . . . . . . . . . . . . . . . . . . . . . . . . . . . . . . . . . . . . . . 15
2.2.2 Start . . . . . . . . . . . . . . . . . . . . . . . . . . . . . . . . . . . . . . . 15
2.2.3 Stop . . . . . . . . . . . . . . . . . . . . . . . . . . . . . . . . . . . . . . . 15
2.2.4 Close . . . . . . . . . . . . . . . . . . . . . . . . . . . . . . . . . . . . . . 16
2.2.5 Mute all alarms . . . . . . . . . . . . . . . . . . . . . . . . . . . . . . . . . 16
2.3 Log session settings dialog . . . . . . . . . . . . . . . . . . . . . 16
2.3.1 Thermometer tab . . . . . . . . . . . . . . . . . . . . . . . . . . . . . . . . 19
2.3.2 Log Session tab . . . . . . . . . . . . . . . . . . . . . . . . . . . . . . . . . 22
2.3.3 Channels tab. . . . . . . . . . . . . . . . . . . . . . . . . . . . . . . . . . . 24
2.3.4 Delayed Start Date/Time dialog . . . . . . . . . . . . . . . . . . . . . . . . 26
2.3.5 Alarm Settings dialog . . . . . . . . . . . . . . . . . . . . . . . . . . . . . . 27
2.3.6 Statistics Settings dialog . . . . . . . . . . . . . . . . . . . . . . . . . . . . 30
2.4 Real-time log session . . . . . . . . . . . . . . . . . . . . . . . . 31
2.4.1 Channels grid . . . . . . . . . . . . . . . . . . . . . . . . . . . . . . . . . . 33
2.4.2 Statistics list . . . . . . . . . . . . . . . . . . . . . . . . . . . . . . . . . . . 35
2.4.3 Graph . . . . . . . . . . . . . . . . . . . . . . . . . . . . . . . . . . . . . . 35
2.4.4 Current Alarm Settings dialog . . . . . . . . . . . . . . . . . . . . . . . . . 37
2.4.5 Output file. . . . . . . . . . . . . . . . . . . . . . . . . . . . . . . . . . . . 37
i
Page 4

2.4.6 Alarm log file . . . . . . . . . . . . . . . . . . . . . . . . . . . . . . . . . . 37
2.4.7 Trace color dialog. . . . . . . . . . . . . . . . . . . . . . . . . . . . . . . . 38
2.4.8 File Viewer window . . . . . . . . . . . . . . . . . . . . . . . . . . . . . . . 39
2.4.9 Statistics dialog . . . . . . . . . . . . . . . . . . . . . . . . . . . . . . . . . 40
2.5 Previous log session . . . . . . . . . . . . . . . . . . . . . . . . . 40
2.5.1 Channels . . . . . . . . . . . . . . . . . . . . . . . . . . . . . . . . . . . . 42
2.5.2 Statistics list . . . . . . . . . . . . . . . . . . . . . . . . . . . . . . . . . . . 43
2.5.3 Graph . . . . . . . . . . . . . . . . . . . . . . . . . . . . . . . . . . . . . . 44
2.5.4 Graph zooming . . . . . . . . . . . . . . . . . . . . . . . . . . . . . . . . . 45
3 Downloading logged data . . . . . . . . . . . . . . . . . . . . 47
3.1 Download menu . . . . . . . . . . . . . . . . . . . . . . . . . . . 47
3.1.1 Download logged data . . . . . . . . . . . . . . . . . . . . . . . . . . . . . 47
3.1.2 Log status . . . . . . . . . . . . . . . . . . . . . . . . . . . . . . . . . . . . 47
3.2 Select Model dialog . . . . . . . . . . . . . . . . . . . . . . . . . 48
3.3 Download options dialogs. . . . . . . . . . . . . . . . . . . . . . 50
3.3.1 1523 Handheld download options dialog. . . . . . . . . . . . . . . . . . . . 50
3.3.2 1524 Handheld download options dialog. . . . . . . . . . . . . . . . . . . . 51
3.3.3 1529 Chub-E4 download options dialog . . . . . . . . . . . . . . . . . . . . 53
3.3.4 1560 Black Stack download options dialog. . . . . . . . . . . . . . . . . . . 55
3.3.5 1575A Super-Thermometer download options dialog . . . . . . . . . . . . . 57
3.3.6 1590 Super-Thermometer II download options. . . . . . . . . . . . . . . . . 58
3.4 Log status dialogs . . . . . . . . . . . . . . . . . . . . . . . . . . 60
3.4.1 1523 Handheld log status dialog . . . . . . . . . . . . . . . . . . . . . . . . 60
3.4.2 1524 Handheld log status dialog . . . . . . . . . . . . . . . . . . . . . . . . 61
3.4.3 1529 Chub-E4 log status dialog. . . . . . . . . . . . . . . . . . . . . . . . . 62
3.4.4 1560 Black Stack log status dialog . . . . . . . . . . . . . . . . . . . . . . . 62
4 Tools . . . . . . . . . . . . . . . . . . . . . . . . . . . . . . . . 65
4.1 Tools menu . . . . . . . . . . . . . . . . . . . . . . . . . . . . . 65
4.1.1 Synchronize date/time . . . . . . . . . . . . . . . . . . . . . . . . . . . . . 65
4.1.2 Logging labels. . . . . . . . . . . . . . . . . . . . . . . . . . . . . . . . . . 66
4.1.3 Thermometer settings . . . . . . . . . . . . . . . . . . . . . . . . . . . . . . 66
4.2 Select Model dialog . . . . . . . . . . . . . . . . . . . . . . . . . 67
4.3 Logging labels dialogs . . . . . . . . . . . . . . . . . . . . . . . 69
4.3.1 1523 Handheld logging label dialog . . . . . . . . . . . . . . . . . . . . . . 69
4.3.2 1524 Handheld logging labels dialog. . . . . . . . . . . . . . . . . . . . . . 70
4.3.3 1529 Chub-E4 logging labels . . . . . . . . . . . . . . . . . . . . . . . . . . 71
4.4 Thermometer settings dialogs . . . . . . . . . . . . . . . . . . . . 72
4.4.1 1523/1524 Handheld Settings. . . . . . . . . . . . . . . . . . . . . . . . . . 72
4.4.1.1 Sampling tab . . . . . . . . . . . . . . . . . . . . . . . . . . . . . . . . . . . . . . 74
4.4.1.2 Channels tab . . . . . . . . . . . . . . . . . . . . . . . . . . . . . . . . . . . . . . 75
4.4.1.3 Calibration tab . . . . . . . . . . . . . . . . . . . . . . . . . . . . . . . . . . . . . 76
4.4.1.4 Misc tab . . . . . . . . . . . . . . . . . . . . . . . . . . . . . . . . . . . . . . . . . 77
4.4.1.5 1523/1524 PRT/thermistor channel settings dialog . . . . . . . . . . . . . . . . . . 78
4.4.1.5.1 Probe tab . . . . . . . . . . . . . . . . . . . . . . . . . . . . . . . . . . . . . . . . . . 79
4.4.1.5.2 Misc tab . . . . . . . . . . . . . . . . . . . . . . . . . . . . . . . . . . . . . . . . . . . 80
4.4.1.6 1523/1524 thermocouple channel settings dialog . . . . . . . . . . . . . . . . . . . 81
ii
Page 5

4.4.1.6.1 Probe tab . . . . . . . . . . . . . . . . . . . . . . . . . . . . . . . . . . . . . . . . . . 82
4.4.1.6.2 Misc tab . . . . . . . . . . . . . . . . . . . . . . . . . . . . . . . . . . . . . . . . . . . 84
4.4.2 1529 Chub-E4 settings dialog. . . . . . . . . . . . . . . . . . . . . . . . . . 84
4.4.2.1 Filtering tab . . . . . . . . . . . . . . . . . . . . . . . . . . . . . . . . . . . . . . . 86
4.4.2.2 Sampling tab . . . . . . . . . . . . . . . . . . . . . . . . . . . . . . . . . . . . . . 87
4.4.2.3 Measurement tab . . . . . . . . . . . . . . . . . . . . . . . . . . . . . . . . . . . .88
4.4.2.4 Channels Tab . . . . . . . . . . . . . . . . . . . . . . . . . . . . . . . . . . . . . . 88
4.4.2.5 Misc tab . . . . . . . . . . . . . . . . . . . . . . . . . . . . . . . . . . . . . . . . . 89
4.4.2.6 1529 Chub-E4 PRT/thermistor channel settings dialog . . . . . . . . . . . . . . . . 90
4.4.2.6.1 Probe tab . . . . . . . . . . . . . . . . . . . . . . . . . . . . . . . . . . . . . . . . . . 91
4.4.2.6.2 Calibration tab. . . . . . . . . . . . . . . . . . . . . . . . . . . . . . . . . . . . . . . . 93
4.4.2.7 1529 Chub-E4 thermocouple channel settings . . . . . . . . . . . . . . . . . . . . . 94
4.4.2.7.1 Probe tab . . . . . . . . . . . . . . . . . . . . . . . . . . . . . . . . . . . . . . . . . . 95
4.4.2.7.2 Calibration tab. . . . . . . . . . . . . . . . . . . . . . . . . . . . . . . . . . . . . . . . 96
4.4.3 1560 Black Stack settings dialog . . . . . . . . . . . . . . . . . . . . . . . . 96
4.4.3.1 Filtering tab . . . . . . . . . . . . . . . . . . . . . . . . . . . . . . . . . . . . . . . 98
4.4.3.2 Sampling tab . . . . . . . . . . . . . . . . . . . . . . . . . . . . . . . . . . . . . . 99
4.4.3.3 Measurement tab . . . . . . . . . . . . . . . . . . . . . . . . . . . . . . . . . . . 100
4.4.3.4 Modules tab . . . . . . . . . . . . . . . . . . . . . . . . . . . . . . . . . . . . . . 101
4.4.3.5 2560 SPRT Module Settings Dialog . . . . . . . . . . . . . . . . . . . . . . . . . 101
4.4.3.5.1 General tab. . . . . . . . . . . . . . . . . . . . . . . . . . . . . . . . . . . . . . . . . 103
4.4.3.5.2 Channels tab . . . . . . . . . . . . . . . . . . . . . . . . . . . . . . . . . . . . . . . . 103
4.4.3.5.3 Calibration tab . . . . . . . . . . . . . . . . . . . . . . . . . . . . . . . . . . . . . . . 104
4.4.3.6 2561 HPRT Module Settings dialog. . . . . . . . . . . . . . . . . . . . . . . . . . 105
4.4.3.6.1 General tab. . . . . . . . . . . . . . . . . . . . . . . . . . . . . . . . . . . . . . . . . 106
4.4.3.6.2 Channels tab . . . . . . . . . . . . . . . . . . . . . . . . . . . . . . . . . . . . . . . . 106
4.4.3.6.3 Calibration tab . . . . . . . . . . . . . . . . . . . . . . . . . . . . . . . . . . . . . . . 107
4.4.3.7 2562 PRTS Module Settings dialog. . . . . . . . . . . . . . . . . . . . . . . . . . 108
4.4.3.7.1 General tab. . . . . . . . . . . . . . . . . . . . . . . . . . . . . . . . . . . . . . . . . 109
4.4.3.7.2 Channels tab . . . . . . . . . . . . . . . . . . . . . . . . . . . . . . . . . . . . . . . . 110
4.4.3.7.3 Calibration tab . . . . . . . . . . . . . . . . . . . . . . . . . . . . . . . . . . . . . . . 110
4.4.3.8 2563 STHR Module Settings dialog . . . . . . . . . . . . . . . . . . . . . . . . . 111
4.4.3.8.1 General tab. . . . . . . . . . . . . . . . . . . . . . . . . . . . . . . . . . . . . . . . . 113
4.4.3.8.2 Channels tab . . . . . . . . . . . . . . . . . . . . . . . . . . . . . . . . . . . . . . . . 113
4.4.3.8.3 Calibration tab . . . . . . . . . . . . . . . . . . . . . . . . . . . . . . . . . . . . . . . 114
4.4.3.9 2564 THRS Module Settings dialog . . . . . . . . . . . . . . . . . . . . . . . . . 115
4.4.3.9.1 General tab. . . . . . . . . . . . . . . . . . . . . . . . . . . . . . . . . . . . . . . . . 116
4.4.3.9.2 Channels tab . . . . . . . . . . . . . . . . . . . . . . . . . . . . . . . . . . . . . . . . 117
4.4.3.9.3 Calibration tab . . . . . . . . . . . . . . . . . . . . . . . . . . . . . . . . . . . . . . . 117
4.4.3.10 2565 PTC Module Settings dialog . . . . . . . . . . . . . . . . . . . . . . . . . . 118
4.4.3.10.1 Channels tab . . . . . . . . . . . . . . . . . . . . . . . . . . . . . . . . . . . . . . . . 120
4.4.3.10.2 Calibration tab . . . . . . . . . . . . . . . . . . . . . . . . . . . . . . . . . . . . . . . 121
4.4.3.11 2566 TCS Module Settings dialog . . . . . . . . . . . . . . . . . . . . . . . . . . 122
4.4.3.11.1 Channels tab . . . . . . . . . . . . . . . . . . . . . . . . . . . . . . . . . . . . . . . . 123
4.4.3.11.2 Calibration tab . . . . . . . . . . . . . . . . . . . . . . . . . . . . . . . . . . . . . . . 124
4.4.3.11.2.1 Inputs 1 to 6 tab . . . . . . . . . . . . . . . . . . . . . . . . . . . . . . 125
4.4.3.12 2567 RTD Module Settings dialog . . . . . . . . . . . . . . . . . . . . . . . . . . 126
4.4.3.13 2568 RTDS Module Settings . . . . . . . . . . . . . . . . . . . . . . . . . . . . . 130
4.4.3.14 1560 Black Stack PRT/Thermistor Channel Settings dialog . . . . . . . . . . . . . 133
4.4.3.15 1560 Black Stack Thermocouple Channel Settings dialog . . . . . . . . . . . . . . 135
4.4.3.11.2.2 Inputs 7 to 12 tab . . . . . . . . . . . . . . . . . . . . . . . . . . . . . 126
4.4.3.12.1 General tab. . . . . . . . . . . . . . . . . . . . . . . . . . . . . . . . . . . . . . . . . 128
4.4.3.12.2 Channels tab . . . . . . . . . . . . . . . . . . . . . . . . . . . . . . . . . . . . . . . . 128
4.4.3.12.3 Calibration tab . . . . . . . . . . . . . . . . . . . . . . . . . . . . . . . . . . . . . . . 129
4.4.3.13.1 General tab. . . . . . . . . . . . . . . . . . . . . . . . . . . . . . . . . . . . . . . . . 131
4.4.3.13.2 Channels tab . . . . . . . . . . . . . . . . . . . . . . . . . . . . . . . . . . . . . . . . 132
4.4.3.13.3 Calibration tab . . . . . . . . . . . . . . . . . . . . . . . . . . . . . . . . . . . . . . . 132
4.4.3.14.1 Probe tab . . . . . . . . . . . . . . . . . . . . . . . . . . . . . . . . . . . . . . . . . . 134
4.4.3.15.1 Probe tab . . . . . . . . . . . . . . . . . . . . . . . . . . . . . . . . . . . . . . . . . . 136
4.4.4 1575A Super-Thermometer Settings . . . . . . . . . . . . . . . . . . . . . 137
4.4.4.1 Filtering tab . . . . . . . . . . . . . . . . . . . . . . . . . . . . . . . . . . . . . . 139
4.4.4.2 Sampling tab. . . . . . . . . . . . . . . . . . . . . . . . . . . . . . . . . . . . . . 140
4.4.4.3 Measurement tab . . . . . . . . . . . . . . . . . . . . . . . . . . . . . . . . . . . 142
4.4.4.4 Channels tab . . . . . . . . . . . . . . . . . . . . . . . . . . . . . . . . . . . . . . 143
4.4.4.5 Calibration tab . . . . . . . . . . . . . . . . . . . . . . . . . . . . . . . . . . . . . 145
4.4.4.6 1575A Super Thermometer/2575 Mighty Mux Channel Settings . . . . . . . . . . 146
4.4.4.6.1 Probe tab . . . . . . . . . . . . . . . . . . . . . . . . . . . . . . . . . . . . . . . . . . 147
4.4.5 1590 Super-Thermometer II Settings dialog . . . . . . . . . . . . . . . . . 148
4.4.5.1 Filtering tab . . . . . . . . . . . . . . . . . . . . . . . . . . . . . . . . . . . . . . 150
4.4.5.2 Sampling tab. . . . . . . . . . . . . . . . . . . . . . . . . . . . . . . . . . . . . . 151
iii
Page 6

4.4.5.3 Measurement tab . . . . . . . . . . . . . . . . . . . . . . . . . . . . . . . . . . . 153
4.4.5.4 Channels tab . . . . . . . . . . . . . . . . . . . . . . . . . . . . . . . . . . . . . . 154
4.4.5.5 Calibration tab . . . . . . . . . . . . . . . . . . . . . . . . . . . . . . . . . . . . . 156
4.4.5.6 1590 Super-Thermometer II/2590 ‘Mighty Mux II’Channel Settings dialog . . . . 157
4.4.5.6.1 Probe tab . . . . . . . . . . . . . . . . . . . . . . . . . . . . . . . . . . . . . . . . . . 158
4.4.6 1594A/1595A Hart Super-Thermometer Settings dialog . . . . . . . . . . . 159
4.4.6.1 Filtering tab . . . . . . . . . . . . . . . . . . . . . . . . . . . . . . . . . . . . . . 161
4.4.6.2 Display tab. . . . . . . . . . . . . . . . . . . . . . . . . . . . . . . . . . . . . . . 162
4.4.6.3 4.4.6.3 Timing tab. . . . . . . . . . . . . . . . . . . . . . . . . . . . . . . . . . . 163
4.4.6.4 Scanning tab . . . . . . . . . . . . . . . . . . . . . . . . . . . . . . . . . . . . . . 164
4.4.6.5 Channel Setup tab . . . . . . . . . . . . . . . . . . . . . . . . . . . . . . . . . . . 165
4.4.6.6 1594A/1595A Hart Super-Thermometer Probe Settings dialog . . . . . . . . . . . 166
4.4.6.7 1594A/1595A Hart Super-Thermometer Channel Settings dialog . . . . . . . . . . 168
4.4.6.8 1594A/1595A Hart Super-Thermometer Rs Settings dialog . . . . . . . . . . . . . 170
5 Menus . . . . . . . . . . . . . . . . . . . . . . . . . . . . . . 173
5.1 File menu. . . . . . . . . . . . . . . . . . . . . . . . . . . . . . 173
5.1.1 New . . . . . . . . . . . . . . . . . . . . . . . . . . . . . . . . . . . . . . 173
5.1.2 Open . . . . . . . . . . . . . . . . . . . . . . . . . . . . . . . . . . . . . . 173
5.1.3 Save as . . . . . . . . . . . . . . . . . . . . . . . . . . . . . . . . . . . . . 174
5.1.4 Print . . . . . . . . . . . . . . . . . . . . . . . . . . . . . . . . . . . . . . 175
5.1.4.1 Readings . . . . . . . . . . . . . . . . . . . . . . . . . . . . . . . . . . . . . . . . 175
5.1.4.2 Graph . . . . . . . . . . . . . . . . . . . . . . . . . . . . . . . . . . . . . . . . . 175
5.1.5 Exit. . . . . . . . . . . . . . . . . . . . . . . . . . . . . . . . . . . . . . . 175
5.2 Datalog menu . . . . . . . . . . . . . . . . . . . . . . . . . . . 175
5.2.1 Setup . . . . . . . . . . . . . . . . . . . . . . . . . . . . . . . . . . . . . . 175
5.2.2 Start . . . . . . . . . . . . . . . . . . . . . . . . . . . . . . . . . . . . . . 176
5.2.3 Stop . . . . . . . . . . . . . . . . . . . . . . . . . . . . . . . . . . . . . . 176
5.2.4 Close . . . . . . . . . . . . . . . . . . . . . . . . . . . . . . . . . . . . . . 176
5.2.5 Mute all alarms . . . . . . . . . . . . . . . . . . . . . . . . . . . . . . . . 176
5.3 Download menu . . . . . . . . . . . . . . . . . . . . . . . . . . 177
5.3.1 Download logged data . . . . . . . . . . . . . . . . . . . . . . . . . . . . . 177
5.3.2 Log status . . . . . . . . . . . . . . . . . . . . . . . . . . . . . . . . . . . 177
5.4 View menu . . . . . . . . . . . . . . . . . . . . . . . . . . . . . 178
5.4.1 Toolbar . . . . . . . . . . . . . . . . . . . . . . . . . . . . . . . . . . . . . 178
5.4.2 Status bar. . . . . . . . . . . . . . . . . . . . . . . . . . . . . . . . . . . . 178
5.4.3 Alarm settings . . . . . . . . . . . . . . . . . . . . . . . . . . . . . . . . . 178
5.4.4 Show trace . . . . . . . . . . . . . . . . . . . . . . . . . . . . . . . . . . . 179
5.4.5 Alarm log . . . . . . . . . . . . . . . . . . . . . . . . . . . . . . . . . . . 179
5.4.6 Readings history . . . . . . . . . . . . . . . . . . . . . . . . . . . . . . . . 179
5.4.7 Open previously logged data file . . . . . . . . . . . . . . . . . . . . . . . 179
5.4.8 MRU list . . . . . . . . . . . . . . . . . . . . . . . . . . . . . . . . . . . . 179
5.5 Graph menu . . . . . . . . . . . . . . . . . . . . . . . . . . . . 180
5.5.1 Graph settings dialog . . . . . . . . . . . . . . . . . . . . . . . . . . . . . 180
5.5.1.1 Titles tab . . . . . . . . . . . . . . . . . . . . . . . . . . . . . . . . . . . . . . . . 180
5.5.1.2 Axis tab . . . . . . . . . . . . . . . . . . . . . . . . . . . . . . . . . . . . . . . . 183
5.5.1.3 Fonts tab . . . . . . . . . . . . . . . . . . . . . . . . . . . . . . . . . . . . . . . . 185
5.5.1.4 Trends tab . . . . . . . . . . . . . . . . . . . . . . . . . . . . . . . . . . . . . . . 186
5.5.1.5 Background tab . . . . . . . . . . . . . . . . . . . . . . . . . . . . . . . . . . . . 189
5.5.1.6 Legend tab . . . . . . . . . . . . . . . . . . . . . . . . . . . . . . . . . . . . . . . 190
5.5.2 Restore default settings . . . . . . . . . . . . . . . . . . . . . . . . . . . . 191
5.5.3 Trace color . . . . . . . . . . . . . . . . . . . . . . . . . . . . . . . . . . . 191
5.5.4 Zoom in . . . . . . . . . . . . . . . . . . . . . . . . . . . . . . . . . . . . 191
iv
Page 7

5.5.5 Restore . . . . . . . . . . . . . . . . . . . . . . . . . . . . . . . . . . . . . 191
5.5.6 Print graph . . . . . . . . . . . . . . . . . . . . . . . . . . . . . . . . . . . 192
5.6 Tools menu . . . . . . . . . . . . . . . . . . . . . . . . . . . . . 192
5.6.1 Synchronize date/time . . . . . . . . . . . . . . . . . . . . . . . . . . . . . 192
5.6.2 Logging labels . . . . . . . . . . . . . . . . . . . . . . . . . . . . . . . . . 192
5.6.3 Thermometer settings . . . . . . . . . . . . . . . . . . . . . . . . . . . . . 193
5.6.4 Options. . . . . . . . . . . . . . . . . . . . . . . . . . . . . . . . . . . . . 193
5.6.4.1 General tab. . . . . . . . . . . . . . . . . . . . . . . . . . . . . . . . . . . . . . . 194
5.6.4.2 Folders tab . . . . . . . . . . . . . . . . . . . . . . . . . . . . . . . . . . . . . . . 197
5.6.4.3 Tools tab . . . . . . . . . . . . . . . . . . . . . . . . . . . . . . . . . . . . . . . . 198
5.6.4.4 Admin. Passcode tab . . . . . . . . . . . . . . . . . . . . . . . . . . . . . . . . . 199
5.7 Window menu . . . . . . . . . . . . . . . . . . . . . . . . . . . 202
5.7.1 Cascade . . . . . . . . . . . . . . . . . . . . . . . . . . . . . . . . . . . . 202
5.7.2 Tile horizontal . . . . . . . . . . . . . . . . . . . . . . . . . . . . . . . . . 202
5.7.3 Tile vertical . . . . . . . . . . . . . . . . . . . . . . . . . . . . . . . . . . 202
5.7.4 Arrange icons . . . . . . . . . . . . . . . . . . . . . . . . . . . . . . . . . 202
5.7.5 Window list . . . . . . . . . . . . . . . . . . . . . . . . . . . . . . . . . . 202
5.8 Help menu . . . . . . . . . . . . . . . . . . . . . . . . . . . . . 203
5.8.1 LogWar e help . . . . . . . . . . . . . . . . . . . . . . . . . . . . . . . . . 203
5.8.2 Technical support . . . . . . . . . . . . . . . . . . . . . . . . . . . . . . . 203
5.8.3 About LogWar e . . . . . . . . . . . . . . . . . . . . . . . . . . . . . . . . 203
6 How to . . . . . . . . . . . . . . . . . . . . . . . . . . . . . . 205
6.1 Setting up and starting a real-time log session . . . . . . . . . . . 205
6.2 Starting a real-time log session unattended (delayed start) . . . . 205
6.3 Stopping a real-time log session automatically . . . . . . . . . . 206
6.4 Opening a configuration file automatically on start-up . . . . . . 207
6.5 Changing thermometer and probe settings. . . . . . . . . . . . . 209
6.6 Importing logged data into a spreadsheet . . . . . . . . . . . . . 210
6.7 Synchronizing the thermometer readout’s clock to the computer . 214
6.8 Protecting calibration parameters and probe conversion settings . 215
6.9 Setting up an administrator passcode . . . . . . . . . . . . . . . 216
6.10 Viewing remaining memory for logging data . . . . . . . . . . . 218
6.11 Downloading logged data from the memory of a thermometer readout
218
6.12 Saving probe coefficients to a configuration file. . . . . . . . . . 219
6.13 Using an IR dongle with LogWa re . . . . . . . . . . . . . . . . . 220
6.14 Changing logging label names . . . . . . . . . . . . . . . . . . . 221
6.15 Unlocking a demo version of LogWa re . . . . . . . . . . . . . . 222
6.16 Setting up LogWa re to read multiple scales . . . . . . . . . . . . 223
7 Files . . . . . . . . . . . . . . . . . . . . . . . . . . . . . . . 227
7.1 Configuration files . . . . . . . . . . . . . . . . . . . . . . . . . 227
v
Page 8

7.1.1 Log session configuration file . . . . . . . . . . . . . . . . . . . . . . . . . 227
7.1.2 Alarm configuration file . . . . . . . . . . . . . . . . . . . . . . . . . . . 228
7.1.3 Conversion configuration files. . . . . . . . . . . . . . . . . . . . . . . . . 228
7.2 Data files . . . . . . . . . . . . . . . . . . . . . . . . . . . . . . 229
7.2.1 Output file . . . . . . . . . . . . . . . . . . . . . . . . . . . . . . . . . . . 229
7.2.2 Download file . . . . . . . . . . . . . . . . . . . . . . . . . . . . . . . . . 231
7.2.3 Alarm Log File . . . . . . . . . . . . . . . . . . . . . . . . . . . . . . . . 231
8 Download process . . . . . . . . . . . . . . . . . . . . . . . . 233
8.1 1523/1524 Handheld and 1529 Chub-E4 download process . . . 233
8.2 1560 Black Stack download process . . . . . . . . . . . . . . . . 234
8.3 1575A Super-Thermometer download process . . . . . . . . . . 235
8.4 1590 Super-Thermometer II download process . . . . . . . . . . 236
9 Conversion settings dialogs . . . . . . . . . . . . . . . . . . . 239
9.1 ITS-90 Settings dialog . . . . . . . . . . . . . . . . . . . . . . . 239
9.1.1 Low Range tab. . . . . . . . . . . . . . . . . . . . . . . . . . . . . . . . . 240
9.1.2 High Range tab . . . . . . . . . . . . . . . . . . . . . . . . . . . . . . . . 240
9.2 IPTS-68 settings dialog . . . . . . . . . . . . . . . . . . . . . . 242
9.3 Callendar-Van Dusen Settings dialog . . . . . . . . . . . . . . . 243
9.4 PT100 Settings dialog . . . . . . . . . . . . . . . . . . . . . . . 244
9.5 High-Temperature PRT Settings dialog . . . . . . . . . . . . . . 245
9.6 Polynomial Settings dialog. . . . . . . . . . . . . . . . . . . . . 246
9.7 W(T90) Settings dialog . . . . . . . . . . . . . . . . . . . . . . 247
9.8 Thermistor Settings dialog . . . . . . . . . . . . . . . . . . . . . 247
9.8.1 Thermistor T(R) Settings dialog. . . . . . . . . . . . . . . . . . . . . . . . 248
9.8.2 Thermistor R(T) Settings dialog. . . . . . . . . . . . . . . . . . . . . . . . 249
9.9 Thermocouple Polynomial Settings dialog . . . . . . . . . . . . 250
9.10 Thermocouple Table Settings dialog. . . . . . . . . . . . . . . . 251
9.11 Thermocouple Type Settings dialog . . . . . . . . . . . . . . . . 252
9.12 Thermocouple Type Polynomial Settings dialog . . . . . . . . . 254
10 Troubleshooting . . . . . . . . . . . . . . . . . . . . . . . . . 257
10.1 Technical support . . . . . . . . . . . . . . . . . . . . . . . . . 257
10.2 Troubleshooting common problems . . . . . . . . . . . . . . . . 259
10.3 Communication error . . . . . . . . . . . . . . . . . . . . . . . 261
vi
Page 9

Figures and Tables
Figure 1 9935 LogWare II Main Display . . . . . . . . . . . . . . . . . . . . . . 9
Figure 2 File Toolbar . . . . . . . . . . . . . . . . . . . . . . . . . . . . . . . 10
Figure 3 Datalog Toolbar . . . . . . . . . . . . . . . . . . . . . . . . . . . . . 10
Figure 4 Graph Toolbar . . . . . . . . . . . . . . . . . . . . . . . . . . . . . . 10
Figure 5 Tools Toolbar. . . . . . . . . . . . . . . . . . . . . . . . . . . . . . . 11
Figure 6 Help Toolbar . . . . . . . . . . . . . . . . . . . . . . . . . . . . . . . 11
Figure 7 File Menu . . . . . . . . . . . . . . . . . . . . . . . . . . . . . . . . 13
Figure 8 Datalog Menu . . . . . . . . . . . . . . . . . . . . . . . . . . . . . . 15
Figure 9 Log Session Settings dialog . . . . . . . . . . . . . . . . . . . . . . . 17
Figure 10 Log Session Settings - Thermometer tab. . . . . . . . . . . . . . . . . 19
Figure 11 Log Session Settings - Log Session tab . . . . . . . . . . . . . . . . . 22
Figure 12 Log Session Settings - Channels Tab . . . . . . . . . . . . . . . . . . 24
Figure 13 Delayed Start Date/Time Dialog . . . . . . . . . . . . . . . . . . . . . 26
Figure 14 Alarm Settings dialog . . . . . . . . . . . . . . . . . . . . . . . . . . 27
Figure 15 Statistics Settings dialog . . . . . . . . . . . . . . . . . . . . . . . . . 30
Figure 16 Real-time log session window . . . . . . . . . . . . . . . . . . . . . . 31
Figure 17 Channels popup menu . . . . . . . . . . . . . . . . . . . . . . . . . . 34
Figure 18 Graph popup menu . . . . . . . . . . . . . . . . . . . . . . . . . . . . 36
Figure 19 Current Alarm Settings dialog . . . . . . . . . . . . . . . . . . . . . . 37
Figure 20 Trace color dialog . . . . . . . . . . . . . . . . . . . . . . . . . . . . 38
Figure 21 File Viewer window . . . . . . . . . . . . . . . . . . . . . . . . . . . 39
Figure 22 Statistics dialog. . . . . . . . . . . . . . . . . . . . . . . . . . . . . . 40
Figure 23 Previous Log Session window . . . . . . . . . . . . . . . . . . . . . . 41
Figure 24 Channels popup menu . . . . . . . . . . . . . . . . . . . . . . . . . . 43
Figure 25 Graph popup menu . . . . . . . . . . . . . . . . . . . . . . . . . . . . 44
Figure 26 Graph zooming . . . . . . . . . . . . . . . . . . . . . . . . . . . . . . 45
Figure 27 Download menu . . . . . . . . . . . . . . . . . . . . . . . . . . . . . 47
Figure 28 Select Model dialog . . . . . . . . . . . . . . . . . . . . . . . . . . . 48
Figure 29 1523 Download Options dialog . . . . . . . . . . . . . . . . . . . . . 50
Figure 30 1524 Download Options dialog . . . . . . . . . . . . . . . . . . . . . 52
Figure 31 1529 Chub-E4 Download Options dialog . . . . . . . . . . . . . . . . 54
Figure 32 1560 Black Stack Download Options dialog. . . . . . . . . . . . . . . 55
Figure 33 1575A ‘Super Thermometer’ Download Options dialog . . . . . . . . 57
Figure 34 1590 Super-Thermometer II Download Options dialog . . . . . . . . . 59
Figure 35 1523 Log Status dialog. . . . . . . . . . . . . . . . . . . . . . . . . . 60
Figure 36 1524 Log Status dialog. . . . . . . . . . . . . . . . . . . . . . . . . . 61
Figure 37 1529 Chub-E4 Log Status dialog . . . . . . . . . . . . . . . . . . . . 62
Figure 38 1560 Black Stack Log Status dialog . . . . . . . . . . . . . . . . . . . 63
Figure 39 Tools menu . . . . . . . . . . . . . . . . . . . . . . . . . . . . . . . . 65
Figure 40 Select Model dialog . . . . . . . . . . . . . . . . . . . . . . . . . . . 67
vii
Page 10

Figure 41 1523 Logging Label dialog . . . . . . . . . . . . . . . . . . . . . . . 69
Figure 42 1524 Logging Labels dialog . . . . . . . . . . . . . . . . . . . . . . . 70
Figure 43 1529 Chub-E4 Logging Labels dialog . . . . . . . . . . . . . . . . . . 71
Figure 44 1523/1524 Settings dialog . . . . . . . . . . . . . . . . . . . . . . . . 73
Figure 45 1523/1524 Settings – Sampling tab . . . . . . . . . . . . . . . . . . . 74
Figure 46 1523/1524 Settings – Channels tab . . . . . . . . . . . . . . . . . . . 75
Figure 47 1523/1524 Settings – Calibration tab . . . . . . . . . . . . . . . . . . 76
Figure 48 1523/1524 Settings – Misc tab . . . . . . . . . . . . . . . . . . . . . . 77
Figure 49 1523/1524 PRT/Thermistor Channel Settings dialog . . . . . . . . . . 78
Figure 50 1523/1524 PRT/Thermistor Channel Settings – Probe tab. . . . . . . . 79
Figure 51 1523/1524 PRT/Thermistor Channel Settings – Misc tab . . . . . . . . 80
Figure 52 1523/1524 Thermocouple Channel Settings dialog . . . . . . . . . . . 81
Figure 53 1523/1524 Thermocouple Channel Settings – Probe tab . . . . . . . . 82
Figure 54 1523/1524 Thermocouple Channel Settings – Misc tab . . . . . . . . . 84
Figure 55 1529 Chub-E4 Settings dialog . . . . . . . . . . . . . . . . . . . . . . 85
Figure 56 1529 Chub-E4 Settings - Filtering tab . . . . . . . . . . . . . . . . . . 86
Figure 57 1529 Chub-E4 Settings - Sampling tab . . . . . . . . . . . . . . . . . 87
Figure 58 1529 Chub-E4 Settings - Measurement Tab . . . . . . . . . . . . . . . 88
Figure 59 1529 Chub-E4 Settings - Misc tab . . . . . . . . . . . . . . . . . . . . 89
Figure 60 1529 Chub-E4 Settings - Channels tab. . . . . . . . . . . . . . . . . . 89
Figure 61 1529 Chub-E4 PRT/thermistor channel settings dialog . . . . . . . . . 90
Figure 62 1529 Chub-E4 PRT/thermistor channel settings - Probe tab . . . . . . . 91
Figure 63 1529 Chub-E4 PRT/thermistor channel settings - Calibration tab . . . . 93
Figure 64 1529 Chub-E4 Thermocouple channel settings dialog . . . . . . . . . . 94
Figure 65 1529 Chub-E4 thermocouple channel settings - Probe tab . . . . . . . 95
Figure 66 1529 Chub-E4 thermocouple channel settings - Probe tab . . . . . . . 96
Figure 67 1560 Black Stack Settings dialog . . . . . . . . . . . . . . . . . . . . 97
Figure 68 1560 Black Stack settings - Filtering tab. . . . . . . . . . . . . . . . . 98
Figure 69 1560 Black Stack Settings – Sampling tab . . . . . . . . . . . . . . . . 99
Figure 70 1560 Black Stack settings - Measurement tab . . . . . . . . . . . . . 100
Figure 71 1560 Black Stack settings - Modules tab . . . . . . . . . . . . . . . . 101
Figure 72 2560 SPRT Module Settings dialog . . . . . . . . . . . . . . . . . . 102
Figure 73 2560 SPRT Module Settings - General tab . . . . . . . . . . . . . . . 103
Figure 74 2560 SPRT Module Settings - Channels tab . . . . . . . . . . . . . . 103
Figure 75 2560 SPRT Module Settings - Calibration tab . . . . . . . . . . . . . 104
Figure 76 2561 HPRT Module Settings dialog . . . . . . . . . . . . . . . . . . 105
Figure 77 2561 HPRT Module Settings - General tab. . . . . . . . . . . . . . . 106
Figure 78 2561 HPRT Module Settings - Channels tab . . . . . . . . . . . . . . 106
Figure 79 2561 HPRT Module Settings - Calibration tab . . . . . . . . . . . . . 107
Figure 80 2562 ‘PRTS’ Module Settings dialog . . . . . . . . . . . . . . . . . . 108
Figure 81 2562 PRTS Module Settings - General tab . . . . . . . . . . . . . . . 109
Figure 82 2562 ‘PRTS’ Module Settings - Channels tab . . . . . . . . . . . . . 110
Figure 83 2562 ‘PRTS’ Module Settings - Calibration tab . . . . . . . . . . . . 110
Figure 84 2563 STHR Module Settings dialog . . . . . . . . . . . . . . . . . . 111
Figure 85 2563 STHR Module Settings - General tab. . . . . . . . . . . . . . . 113
viii
Page 11

Figure 86 2563 STHR Module Settings - Channels tab . . . . . . . . . . . . . . 113
Figure 87 2563 STHR Module Settings - Calibration tab . . . . . . . . . . . . . 114
Figure 88 2564 THRS Module Settings dialog . . . . . . . . . . . . . . . . . . 115
Figure 89 2564 THRS Module Settings - General tab. . . . . . . . . . . . . . . 116
Figure 90 2564 THRS Module Settings - Channels tab . . . . . . . . . . . . . . 117
Figure 91 2564 THRS Module Settings - Calibration tab . . . . . . . . . . . . . 117
Figure 92 2565 PTC Module Settings dialog . . . . . . . . . . . . . . . . . . . 119
Figure 93 2565 PTC Module Settings - Channels tab . . . . . . . . . . . . . . . 120
Figure 94 2565 PTC Module Settings - Calibration tab . . . . . . . . . . . . . . 121
Figure 95 2566 TCS Module Settings dialog . . . . . . . . . . . . . . . . . . . 122
Figure 96 2566 TCS Module Settings - Channels tab . . . . . . . . . . . . . . . 123
Figure 97 2566 TCS Module Settings - Calibration tab . . . . . . . . . . . . . . 124
Figure 98 2566 TCS Module Settings - Inputs 1 to 6 tab . . . . . . . . . . . . . 125
Figure 99 2566 TCS Module Settings - Inputs 7 to 12 tab . . . . . . . . . . . . 126
Figure 100 2567 RTD Module Settings dialog . . . . . . . . . . . . . . . . . . . 127
Figure 101 2567 RTD Module Settings - General tab . . . . . . . . . . . . . . . 128
Figure 102 2567 RTD Module Settings - Channels tab . . . . . . . . . . . . . . . 128
Figure 103 2567 RTD Module Settings - Calibration tab . . . . . . . . . . . . . . 129
Figure 104 2568 RTDS Module Settings dialog . . . . . . . . . . . . . . . . . . 130
Figure 105 2568 RTDS Module Settings - General tab . . . . . . . . . . . . . . . 131
Figure 106 2568 RTDS Module Settings - Channels tab . . . . . . . . . . . . . . 132
Figure 107 2568 RTDS Module Settings - Calibration tab . . . . . . . . . . . . . 132
Figure 108 1560 Black Stack PRT/Thermistor Channel Settings dialog . . . . . . 133
Figure 109 1560 Black Stack PRT/Thermistor Channel Settings - Probe tab . . . 134
Figure 110 1560 Black Stack Thermocouple Channel Settings dialog . . . . . . . 135
Figure 111 1560 Black Stack PRT/Thermistor Channel Settings - Probe tab . . . 136
Figure 112 1575A Super-Thermometer Settings dialog . . . . . . . . . . . . . . 137
Figure 113 1575A Super-Thermometer Settings - Filtering tab . . . . . . . . . . 139
Figure 114 1575A Super-Thermometer Settings - Sampling tab . . . . . . . . . . 140
Figure 115 1575A Super-Thermometer Settings - Measurement tab . . . . . . . . 142
Figure 116 1575A Super-Thermometer Settings - Channels tab . . . . . . . . . . 144
Figure 117 1575A Super-Thermometer Settings - Calibration tab . . . . . . . . . 145
Figure 118 1575A Super Thermometer/2575 Mighty Mux Channel
Settings dialog . . . . . . . . . . . . . . . . . . . . . . . . . . . . . 146
Figure 119 1575A Super-Thermometer/2575 Mighty Mux Channel
Settings - Probe tab . . . . . . . . . . . . . . . . . . . . . . . . . . . 147
Figure 120 1590 Super-Thermometer II Settings dialog . . . . . . . . . . . . . . 149
Figure 121 1590 Super-Thermometer II Settings - Filtering tab . . . . . . . . . . 150
Figure 122 1590 Super-Thermometer II Settings - Sampling tab. . . . . . . . . . 151
Figure 123 1590 Super-Thermometer II Settings - Measurement tab . . . . . . . 153
Figure 124 1590 Super-Thermometer II Settings - Channels tab . . . . . . . . . . 155
Figure 125 1590 Super-Thermometer II Settings - Calibration tab. . . . . . . . . 156
Figure 126 1590 Super-Thermometer II/2590 ‘Mighty Mux II’ Channel
Settings dialog . . . . . . . . . . . . . . . . . . . . . . . . . . . . . 157
ix
Page 12

Figure 127 1590 Super-Thermometer II/2590 ‘Mighty Mux II’ Channel
Settings - Probe tab . . . . . . . . . . . . . . . . . . . . . . . . . . . 158
Figure 128 1594A/1595A Hart Super-Thermometer settings . . . . . . . . . . . 160
Figure 129 1594A/1595A Hart Super-Thermometer Filtering tab . . . . . . . . . 161
Figure 130 1594A/1595A Hart Super-Thermometer Display tab . . . . . . . . . 162
Figure 131 1594A/1595A Hart Super-Thermometer Timing tab . . . . . . . . . . 163
Figure 132 1594A/1595A Hart Super-Thermometer Scanning tab . . . . . . . . . 164
Figure 133 1594A/1595A Hart Super-Thermometer Channel setup tab . . . . . . 165
Figure 134 1594A/1595A Hart Super-Thermometer Probe settings dialog . . . . 166
Figure 135 1594A/1595A Hart Super-Thermometer Channel settings . . . . . . . 168
Figure 136 1594A/1595A Hart Super-Thermometer Rs1 settings . . . . . . . . . 170
Figure 137 File menu . . . . . . . . . . . . . . . . . . . . . . . . . . . . . . . . 173
Figure 138 Datalog menu . . . . . . . . . . . . . . . . . . . . . . . . . . . . . . 175
Figure 139 Download Menu . . . . . . . . . . . . . . . . . . . . . . . . . . . . 177
Figure 140 View Menu . . . . . . . . . . . . . . . . . . . . . . . . . . . . . . . 178
Figure 141 Graph Menu. . . . . . . . . . . . . . . . . . . . . . . . . . . . . . . 180
Figure 142 Graph Settings - Titles tab . . . . . . . . . . . . . . . . . . . . . . . 181
Figure 143 Graph Settings - Axis tab . . . . . . . . . . . . . . . . . . . . . . . . 183
Figure 144 Graph Settings - Fonts tab . . . . . . . . . . . . . . . . . . . . . . . 185
Figure 145 Graph Settings - Trends tab. . . . . . . . . . . . . . . . . . . . . . . 186
Figure 146 Graph Settings - Background tab . . . . . . . . . . . . . . . . . . . . 189
Figure 147 Graph Settings - Legend tab . . . . . . . . . . . . . . . . . . . . . . 190
Figure 148 Tools Menu . . . . . . . . . . . . . . . . . . . . . . . . . . . . . . . 192
Figure 149 LogWare Options Dialog . . . . . . . . . . . . . . . . . . . . . . . . 193
Figure 150 LogWare Options - General tab. . . . . . . . . . . . . . . . . . . . . 194
Figure 151 LogWare Options - Folders tab . . . . . . . . . . . . . . . . . . . . . 197
Figure 152 LogWare Options - Tools tab . . . . . . . . . . . . . . . . . . . . . . 198
Figure 153 LogWare Options - Admin. Passcode tab. . . . . . . . . . . . . . . . 199
Figure 154 Enter Passcode dialog. . . . . . . . . . . . . . . . . . . . . . . . . . 200
Figure 155 Change Passcode dialog . . . . . . . . . . . . . . . . . . . . . . . . 201
Figure 156 Window menu . . . . . . . . . . . . . . . . . . . . . . . . . . . . . 202
Figure 157 Help menu . . . . . . . . . . . . . . . . . . . . . . . . . . . . . . . 203
Figure 158 About LogWare dialog . . . . . . . . . . . . . . . . . . . . . . . . . 203
Figure 159 Excel XP Text Import Wizard – Step 1 of 3 . . . . . . . . . . . . . . 211
Figure 160 Excel XP data. . . . . . . . . . . . . . . . . . . . . . . . . . . . . . 212
Figure 161 Excel XP Text Import Wizard – Step 2 of 3 . . . . . . . . . . . . . . 212
Figure 162 Excel XP Chart Wizard – Step 1 of 4 – Chart Type . . . . . . . . . . 213
Figure 163 Excel XP graph . . . . . . . . . . . . . . . . . . . . . . . . . . . . . 214
Figure 164 IR dongle . . . . . . . . . . . . . . . . . . . . . . . . . . . . . . . . 220
Figure 165 Unlock Code dialog. . . . . . . . . . . . . . . . . . . . . . . . . . . 223
Figure 166 Output file example. . . . . . . . . . . . . . . . . . . . . . . . . . . 230
Figure 167 Download file example . . . . . . . . . . . . . . . . . . . . . . . . . 231
Figure 168 Alarm log file example . . . . . . . . . . . . . . . . . . . . . . . . . 232
Figure 169 Downloaded Files dialog . . . . . . . . . . . . . . . . . . . . . . . . 234
Figure 170 ITS-90 Settings dialog . . . . . . . . . . . . . . . . . . . . . . . . . 239
x
Page 13

Figure 171 ITS-90 Settings – Low Range tab . . . . . . . . . . . . . . . . . . . 240
Figure 172 ITS-90 Settings – High Range tab . . . . . . . . . . . . . . . . . . . 241
Figure 173 IPTS-68 Settings dialog. . . . . . . . . . . . . . . . . . . . . . . . . 242
Figure 174 Callendar-Van Dusen Settings dialog. . . . . . . . . . . . . . . . . . 243
Figure 175 PT100 Settings dialog . . . . . . . . . . . . . . . . . . . . . . . . . 244
Figure 176 High-Temp PRT Settings dialog . . . . . . . . . . . . . . . . . . . . 245
Figure 177 Polynomial Settings dialog . . . . . . . . . . . . . . . . . . . . . . . 246
Figure 178 W(T90) Settings dialog . . . . . . . . . . . . . . . . . . . . . . . . . 247
Figure 179 Thermistor T(R) Settings dialog . . . . . . . . . . . . . . . . . . . . 248
Figure 180 Thermistor R(T) Settings dialog . . . . . . . . . . . . . . . . . . . . 249
Figure 181 Thermocouple Polynomial Settings dialog . . . . . . . . . . . . . . . 250
Figure 182 Thermocouple Table Settings dialog . . . . . . . . . . . . . . . . . . 251
Figure 183 Thermocouple Polynomial Settings dialog . . . . . . . . . . . . . . . 252
Figure 184 Thermocouple Type Polynomial Settings dialog . . . . . . . . . . . . 254
Table 1 Troubleshooting Common Problems . . . . . . . . . . . . . . . . . . 259
xi
Page 14

1 Introduction
1 Introduction
What is LogWare
1.1 What is Log
The 9935 LogWare II Software (LogWa re ) is a real-time data acquisition, stor
age and analysis program designed specifically for use with the following Hart
Scientific’s multi-channel digital thermometer readouts:
1523 and 1524 Handheld Thermometer readouts
•
1529, 1529-R, 1529-T Chub-E4 Thermometer readouts
•
1560 Black Stack Thermometer readout
•
♦
2560 SPRT Module
♦
2561 HTPRT Module
♦
2562 PRTS Module
♦
2563 STHR Module
♦
2564 THRS Module
♦
2565 PTC Module
♦
2566 TCS Module
♦
2567 RTD Module
♦
2568 RTDS Module
♦
3560 Communication Module
• 1575 Super Thermometer readout (real-time logging only!)
♦
2575 Mighty Mux Multiplexer
•
1575A Super Thermometer readout
♦
2575 Mighty Mux Multiplexer
•
1590 Super Thermometer II readout
♦
Up to five 2590 Mighty Mux II Multiplexers
•
1594A/1595A Super-Thermometer Readout
♦
Up to 2 Model 2590 Mighty Mux II Multiplexers
LogWare also provides utilities for:
Ware
-
•
Downloading data that has been logged to the thermometer readout’s logs
or memory.
•
Setting logging labels in the thermometer readout (for thermometer read
outs that support this feature).
•
Synchronizing thermometer readout’s clock to the computer’s clock.
-
1
Page 15

User’s Guide
1.2 License agreement
Viewing and editing many thermometer readout, module and probe set
•
tings including probe coefficients.
This manual is intended to document the use and features of LogWar e. To e n
sure correct results, verify that the thermometer readout is properly configured
before collecting data. Refer to the individual thermometer readout’s User’s
Guide for specifics pertaining to the instrument. Follow all warnings and cau
tions documented in the readout’s User’s Guide.
-
-
-
For information and details regarding the software End User License Agree
ment (EULA), refer to the online help file's License Agreement topic.
1.3 Features
LogWare provides an easy-to-use Windows® interface to acquire, store and an
alyze data from Hart Scientific’s multi-channel digital thermometer readouts.
LogWare also provides a method to download readings that are stored in the
logs or memory of thermometer readouts. After being acquired or downloaded,
the readings are written to a file that can be opened by LogWa re , a spreadsheet
or other analysis software.
LogWare ’s data logging features include:
• Quick and easy configuration
• Ability to save and open configuration files
• Selectable sample interval from 1 second to 60 hours (depending on ther-
mometer readout)
•
Selectable scan sequence interval from 1 minute to 60 hours
•
Selectable delayed start date/time for off-hours logging
•
Selectable end log options (to stop session after specified time or number
of readings)
•
Acquires readings to ASCII text files which can be opened, graphed and
printed
•
Graphs readings as they are being acquired
•
Ability to acquire data in multiple scales simultaneously
•
Maintains statistical data for all channels
•
Selectable high and low alarm settings with user defined events
♦
Can be configured to play .WAV file or launch an application (such as
pager software) when an alarm trips
-
-
•
User-customizable graph settings including titles, legend, grid lines and
statistical and trend lines
2
Page 16

LogWare ‘s data analysis features include:
Can open both real-time log files and downloaded files
•
Spreadsheet-style grid to view all acquired readings
•
Graph zooming capability
•
User-customizable graph settings including titles, legend, grid lines and
•
statistical and trend lines
Printing graph and acquired readings
•
Can have multiple windows open simultaneously
•
Can superimpose up to 10 sets of data on the same graph
•
1 Introduction
Features
LogWar e also provides utilities that allow access to the following digital ther
-
mometer readout features (as applicable):
Downloading data stored in the thermometer readout’s logs and/or mem
•
ory
• Viewing log status and clearing log data
• Synchronizing thermometer readout's date/time with computer’s clock
• Changing thermometer readout-specific parameters (filtering, sampling,
measurement, calibration constants, etc.)
• Changing probe-specific parameters (serial numbers, conversion type and
coefficients, calibration dates, cold junction settings, etc.)
New Features in Version 1.3
Version 1.3 has added support for Models 1594A and 1595A Super-Thermometer readouts. Features supported by these new thermometer readouts include:
•
Real-Time logging
•
Thermometer settings
•
Synchronize Date/Time
Version 1.2
Version 1.2 has added support for Models 1523 and 1524 Handheld Thermom
eter readouts. Also, previously logged data files containing more than one data
set (up to a maximum of 10 data sets) can now be opened.
-
-
Version 1.1
A list of features and enhancements in Version 1.1 follows
•
Simultaneous Logging of All Channels in Real Time - A feature has
been added to allow readings to be taken on all enabled channels of a
real-time log session simultaneously (as fast as possible).
3
Page 17

User’s Guide
Download Logged Data from Serial Port on 3560 Communication
•
Module - A feature has been added to allow logged readings to be down
loaded to the serial port on the Model 3560 Communication Module on a
Model 1560 Black Stack thermometer readout.
Write All Real-Time Data to a Single File - A new feature has been
•
added to allow data from all channels of a real-time log session to be writ
ten to the same output file. In these output files, a new column has been
added for the channel number.
-
-
Note: Although LogWare is still able to open these files, it does not sepa
rate the data for each channel. All readings are plotted on the graph as if
all data was from a single channel.
Branding/Logo change - The logos and graphics displayed in LogWa re
•
have been updated.
Also, various features have been added to the software to aid in troubleshooting
issues related to real-time log sessions and downloading logged data.
1.4 Requirements
LogWare is designed to work with Hart Scientific’s multi-channel digital thermometer readouts. Refer to Section 1.1, What is LogWa re, for a complete list
of supported thermometer readouts.
1.4.1 Communications requirements
The thermometer readout being used with LogWare must be connected to an
RS-232 serial port (COM port) on a computer using a “null modem” cable. For
more information on this type of cable, refer to the thermometer readout’s
User's Guide. The baud rate of the thermometer readout must be set to match
the baud rate selected in LogWa re .LogWare supports a wide choice of baud
rate settings, depending on the thermometer readout being used.
Selected features of LogWa re can also utilize an IR dongle with thermometer
readouts that have an IR port for wireless communications.
-
1.4.2 Computer hardware requirements
The following minimum computer configuration is required to use LogWa re :
•
IBM Compatible 486 PC or better with 8MB RAM (Pentium® class pro
cessor with 16MB RAM or more recommended)
•
VGA monitor or better
•
CD-ROM drive for installation
•
1 - RS-232 serial (COM) port
•
Optional - IR dongle
4
-
Page 18

Minimum of about 25MB of disk space for installation (additional space
•
is required as data is acquired or downloaded)
1.4.3 Computer software requirements
1 Introduction
Requirements
Note: To use LogWare, Windows login accounts must be granted full ac
cess to the folder to which the software is installed and all subfolders. If
the folder has read-only access, errors will occur when LogWare attempts
to access its configuration files.
The LogWare Software requires one of the following operating systems:
Windows® 95/98/ME
•
Windows® NT with Service Pack 4 or later installed
•
Windows® 2000
•
Windows® XP
•
• Windows® Vista
1.4.4 Firmware requirements
The thermometer readouts supported by LogWare must have a certain firmware
version installed to use the Thermometer Settings option in the Tools menu and
the Download Logged Data option in the Download menu. Prior versions of
firmware do not fully support these features. Real-time logging can be performed with any firmware version. The required firmware versions are indicated below:
•
Model 1523 and 1524 – Requires firmware version 1.0 or later
•
Model 1529, 1529-R and 1529-T Chub-E4 – Requires firmware version
1.35 or later
•
Model 1560 Black Stack – Requires firmware version 1.31 or later
•
Model 1575 Super-Thermometer – NOT SUPPORTED BY TOOLS
FEATURES!
•
Model 1575A Super-Thermometer – Requires firmware version 5.03n or
5.03o or later
-
•
Model 1590 Super-Thermometer II – Requires firmware version 2.03n or
2.03o or later
•
Model 1594A, 1595A – Requires firmware version 1.0 or later
5
Page 19

User’s Guide
1.5 Installation
Note: Before installing LogWare, be sure to read the License Agreement
and Warranty.
A backup should always be made of your hard disk drive and registry before in
stalling any software, and all running applications should be closed.
Note: To successfully install LogWare, you must be logged into Windows
as an Administrator.
Installing LogWare
1. Insert the LogWare CD-ROM into your CD-ROM drive. The Setup pro
gram should run automatically.
2. Follow the on-screen instructions to install LogWar e.
3. When prompted, enter the product serial number. The serial number is
provided on a sticker typically located on the CD pouch on the inside
back cover of the LogWare User's Guide.
4. After all files have been installed, a program group is created with icons
for the software, the Help file, the README.TXT file, and an icon to
uninstall the software. The installation process is complete.
5. The README.TXT file can be displayed by checking the appropriate
check box before the setup program finishes. Read this file for important
information that was not available when the User Guide was printed.
Uninstalling LogWare
To uninstall the software, use the Windows® Add/Remove Programs icon in
the Control Panel. Follow the instructions given. The program files that were
installed to your system are removed. Any files that were created or saved by
users will not be removed from the system. These files, along with the folders
that these files are in, must be manually deleted using Windows® Explorer to
remove them from your system.
-
-
1.6 Running Log
The following sections describe how to get LogWa re up and running quickly.
Ware
1.6.1 Getting started
The following information is intended to provide a brief overview on how to
get LogWare up and running quickly.
6
Page 20

1 Introduction
Running LogWare
To use this software:
1. Click the Start button, then locate and click the icon created by the setup
process.
2. The software will start with the Log Session Settings dialog displayed. If
the Log Session Settings dialog is not displayed when the software starts,
select the Setup option in the Datalog menu to display the Log Session
Settings dialog.
Note: In order to make the Log Session Settings dialog appear automati
cally every time LogWare starts, check the “Show Log Session Settings di
-
alog on start-up” check box on the General tab of the Options dialog. The
Options dialog can be displayed by selecting the Options option in the
Tools menu. Please refer to Section 5.6.4, Options, for more details.
3. To start a log session, fill in the information on the Log Session Settings
dialog. The following information must be entered before a log session
can start:
Thermometer:
• Select the model of the thermometer readout to use, enter the serial number and select the session temperature scale from the available choices.
The reading resolution may also be selected.
• Select the COM port that the thermometer readout is connected to and
choose the baud rate to use.
• Power up the thermometer readout and make sure it is connected to the
selected COM port and set to the selected baud rate. Click the Test Com
munication button to make sure LogWa re can communicate with the ther
mometer readout.
Log session:
•
Select the interval between readings.
•
Optional - Enable and select the interval between scan sequences.
•
To set a delayed start date/time, click the Delayed Start button and choose
the appropriate date and time for the log session to start. Otherwise, the
log session will begin when the Start button is clicked.
-
-
•
Choose the appropriate end log session option and set the other end log
settings as required.
Channels:
•
Query the channels from the thermometer readout by clicking the Query
Channels button.
7
Page 21

User’s Guide
Enable or disable each channel as needed by selecting each channel in the
•
Channels list and checking or unchecking the Acquire data from this
channel box.
Optional - To customize the statistical data for each channel, click the
•
Statistics Settings button.
Optional - To configure alarms for each channel, click the Alarm Settings
•
button.
Enter the channel name, output filename, and select the trace color for
•
each channel.
These settings can be saved to a configuration file by clicking the Save As but
ton. To open the current configuration file every time the software runs, click
the Set as Default button.
After entering this information, click the Start button to start the real-time log
session.
1.7 Using Log
The following sections describe some of the main features of LogWare .
-
Ware
8
Page 22
1 Introduction
Using LogWare
1.7.1 Log
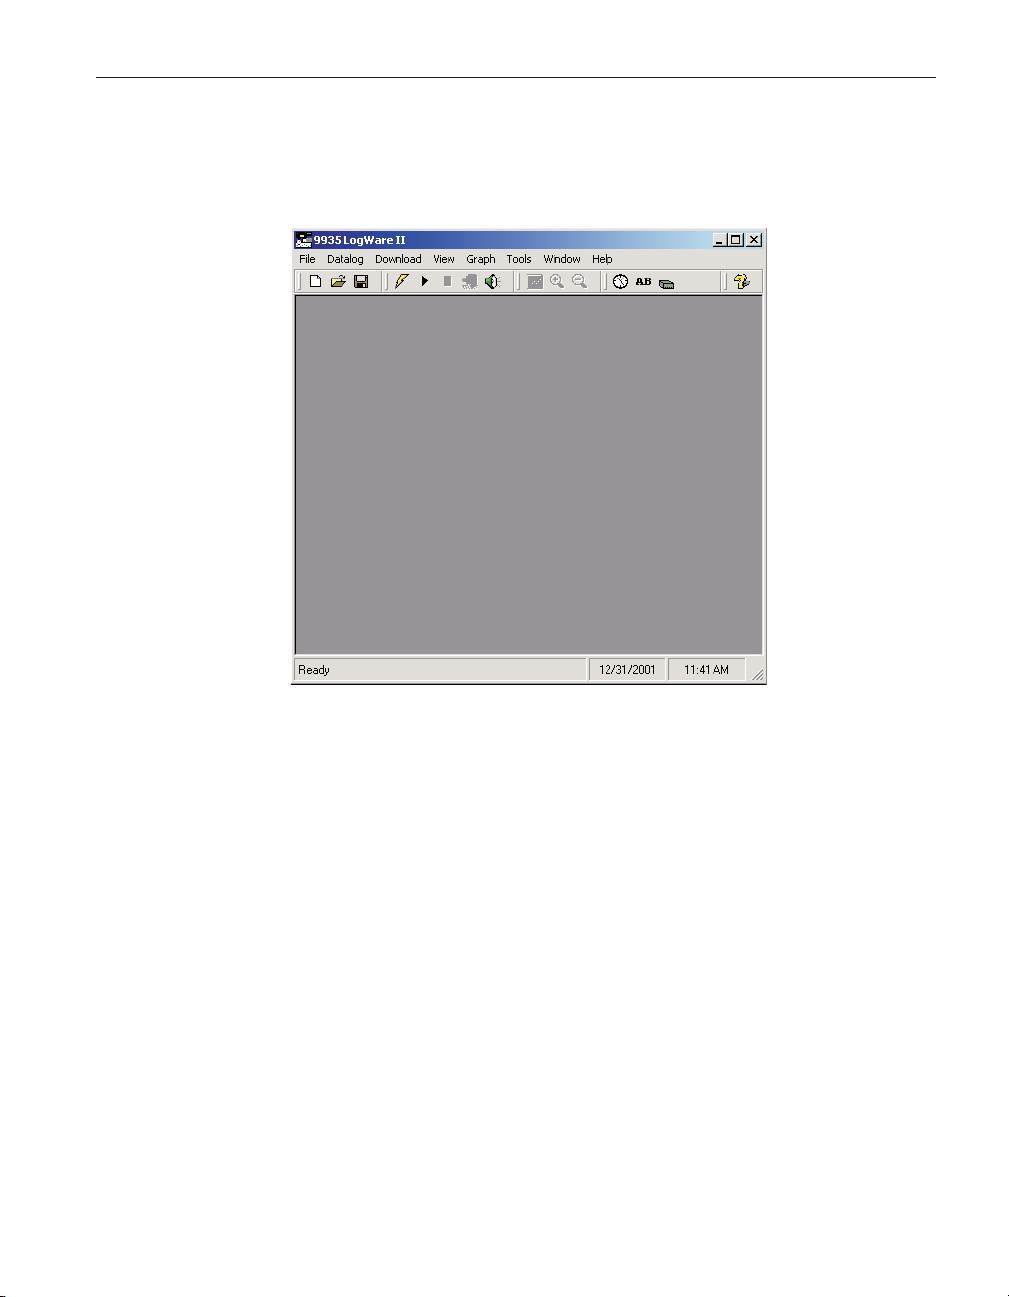
The main display consists of the menus, toolbar, a workspace area and a status
bar.
Figure 1 9935 LogWare II Main Display
Ware
main display
The menus allow access to the various features of the software. A general de
scription of the options in each menu is given below. These menus are de
-
scribed in more detail in Section 5, Menus:
•
File - Open and save configuration files, print options and exit the soft
ware.
•
Datalog - Setup, Start, Stop and Close real-time log sessions.
•
Download - Download logged readings and view log status.
•
View - View alarm log, reading history and open previously logged data
files.
•
Graph - Change graph settings, zoom in and out, and print the current
graph.
•
Tools - Synchronize thermometer readout date/time, access logging la
bels, configure thermometer readout and probe settings, change LogWa re
options.
•
Window - Rearrange and switch between open windows.
•
Help - Display help topics and About dialog.
-
-
-
9
Page 23
User’s Guide
The toolbar allows quick access to the most common menu functions. The
toolbar is divided into sections that correspond to related functions. Toolbar
sections may be rearranged as desired by clicking on the vertical bar on the left
side of the section and dragging it to the desired location.
The following toolbars are available:
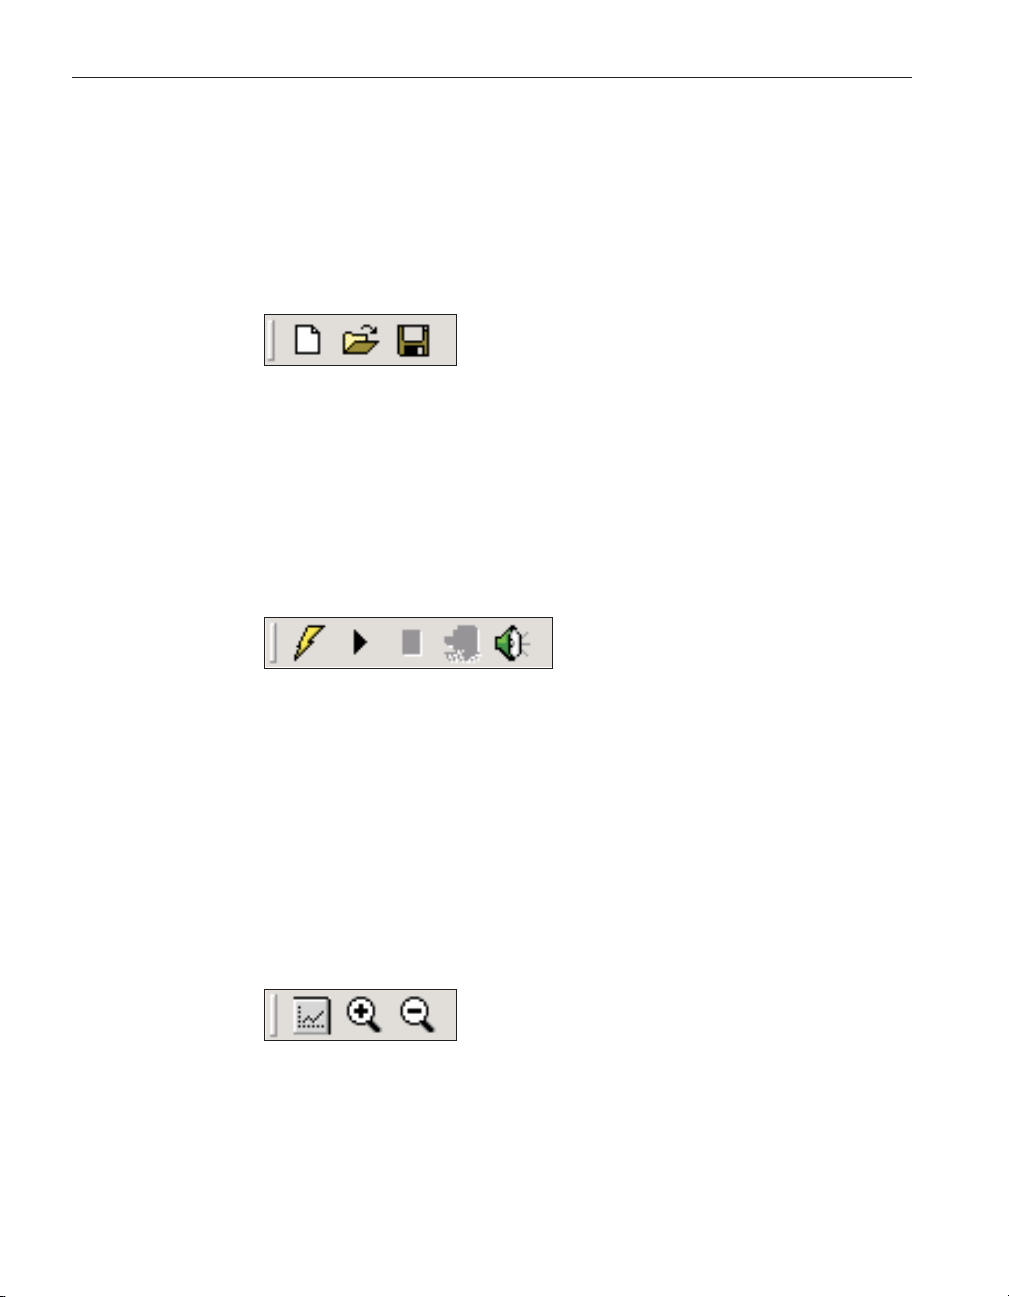
File Toolbar
Figure 2 File Toolbar
New - Create a new real-time log session configuration
Open - Open a real-time log session configuration file
Save As - Save the current real-time log session configuration to a configura
tion file
Datalog Toolbar
Figure 3 Datalog Toolbar
Setup - Display the Log Session Settings dialog to configure a real-time log
session
Start - Start a real-time log session
Stop - Stop a real-time log session
Close - Close the real-time log session window
Mute All Alarms - Mute/unmute all audible real-time log session alarms
Graph Toolbar
Figure 4 Graph Toolbar
-
10
Graph Settings - Change graph settings, add trend lines, alarm lines, titles,
captions, etc.
Zoom In - Zoom in to view a section of the graph
Restore (Zoom Out) - Restore the graph to its original zoom setting
Page 24
1 Introduction
LogWare options
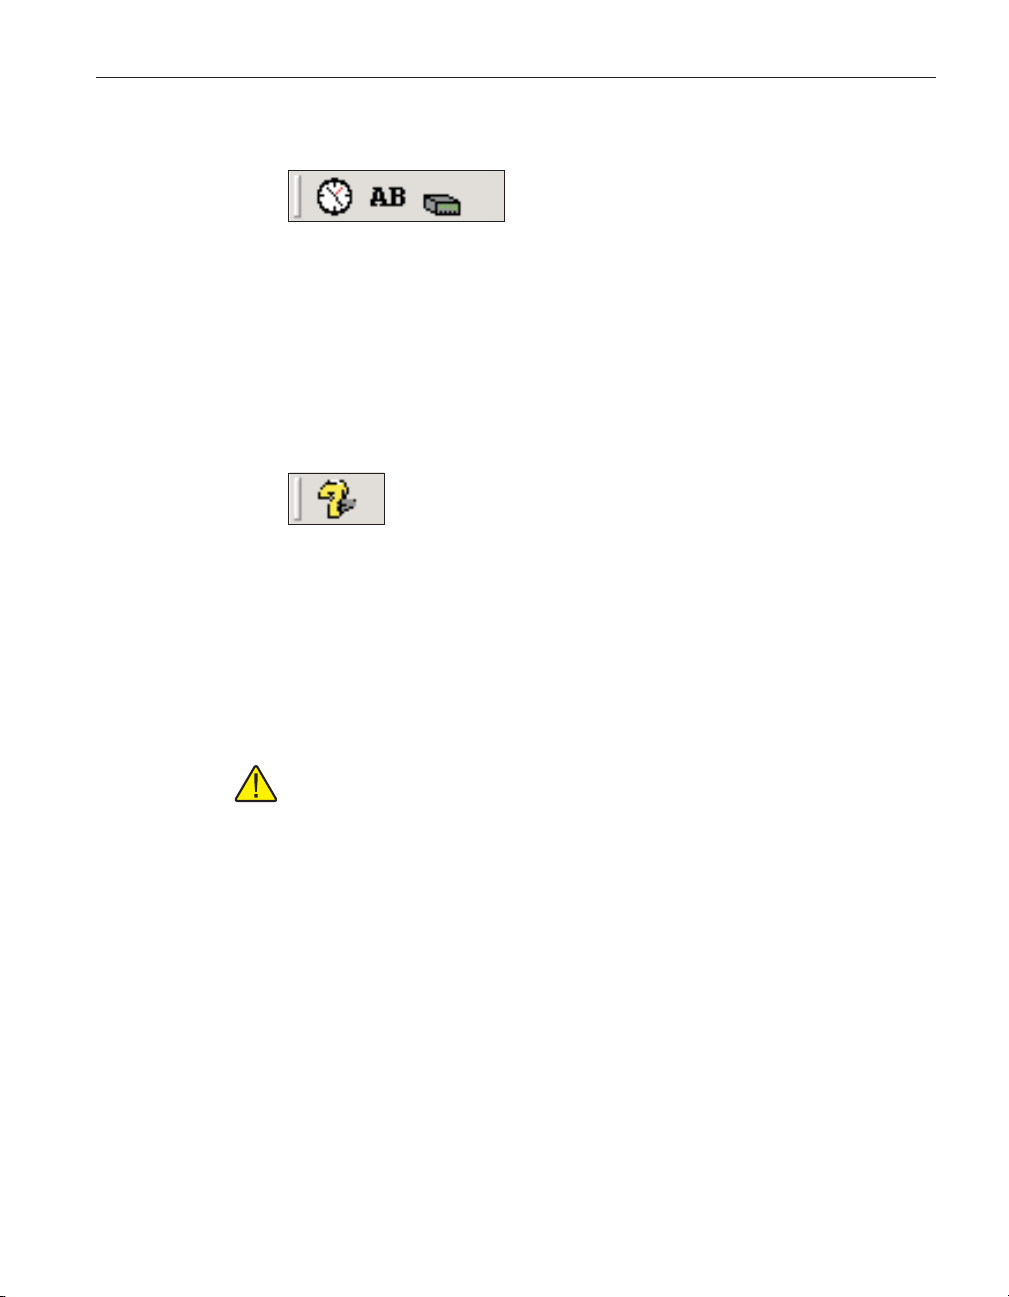
Tools Toolbar
Figure 5 Tools Toolbar
Synchronize Date/Time - Synchronize thermometer readout’s date/time with
computer
Logging Labels - View/change logging labels
Thermometer Settings - View/change thermometer readout settings
Help Toolbar
Figure 6
Help Toolbar
Help - Open the LogWare Help file
Status Bar
The status bar indicates the function that the software is currently performing
as well as the current system date and time.
Note: The date and time displayed are based on the computer’s clock set
tings and can be modified through the Windows® Control Panel.
1.8 Log
LogWare has many features and settings that can be customized by the user to
allow LogWare to operate in certain ways. Many of these settings can also be
protected by an administrator passcode to prevent unauthorized persons from
changing these settings. For more information on these options, please refer to
Section 5.6.4, Options.
Ware
-
options
11
Page 25

2 Real-time logging
The main purpose of LogWare is to perform real-time data acquisition from
Hart Scientific multi-channel digital thermometer readouts. This section de
scribes in detail how to configure, start and stop a real-time log session. This
section also describes the features available during a real-time log session.
2.1 File menu
The File menu contains some options for creating a new real-time log session
and for opening and saving real-time log session configuration files.
Figure 7 File Menu
2 Real-time logging
File menu
-
2.1.1 New
The New menu option can be used to clear the current real-time log session settings and display the Log Session Settings dialog.
The button on the toolbar corresponds to the New menu option.
When selecting the New option, a prompt is displayed to confirm that the cur
rent real-time log session settings (if any) will be reset. To abort resetting the
current real-time log session settings, click the No button. Otherwise, click the
Yes button to reset the current log session settings. The Log Session Settings
dialog will be displayed. Please refer to Section 2, Real-Time Logging, for
more information on configuring a real-time log session.
2.1.2 Open
The Open option allows a real-time log session configuration file to be opened.
If the same basic configuration is frequently used to perform real-time logging,
saving the log session settings to a configuration file can greatly reduce the
time it takes to configure and start a real-time log session.
The button on the toolbar corresponds to the Open menu option.
-
13
Page 26
User’s Guide
Note: When opening a configuration file, LogWare attempts to communi
cate with the thermometer readout to verify that the settings saved in the
configuration file are compatible with the current thermometer readout
configuration. Therefore, it is necessary to have the thermometer readout
connected and powered on in order to successfully open a configuration
file.
When selecting the Open option, the Windows® Open dialog is displayed. The
\Config folder should be selected by default (or the folder that is specified for
configuration files on the LogWare Options dialog). Real-time log session con
figuration files should have a .rls extension. To cancel opening a configuration
file, click the Cancel button. Otherwise, select the configuration file to open
and click the Open button. For more details about the real-time log session con
figuration file, refer to Section 7.1.1, Log Session Configuration File. Real-time
log session configuration files can also be opened by clicking the Open button
on the Log Session Settings dialog.
LogWare then reads the log session settings from the configuration file and verifies that the configuration of the currently connected thermometer readout is
compatible with the log session settings. If there are any conflicts, or if
LogWare is unable to communicate with the thermometer readout, appropriate
messages are displayed.
Once the configuration file has been read in, the Log Session Settings dialog is
displayed. If LogWare was unable to communicate with the thermometer readout or any other error occurred, the log session settings may be incomplete.
-
-
14
2.1.3 Save as
The Save As option allows the current real-time log session settings to be saved
to a configuration file. If the same basic configuration is frequently used to per
form real-time logging, saving the log session settings to a configuration file
can greatly reduce the time it takes to configure and start a real-time log ses
sion. Before attempting to save a real-time log session configuration, use the
Log Session Settings dialog to configure the log session.
The button on the toolbar corresponds to the Save As menu option.
When selecting the Save As option, the Windows® Save As dialog is dis
played. The \Config folder should be selected by default (or the folder that is
specified for configuration files on the LogWa re Options dialog). Real-time log
session configuration files are saved with a .rls extension. To cancel saving a
configuration file, click the Cancel button. Otherwise, enter the filename for the
configuration file and click the Save button. For more details about the
real-time log session configuration file, refer to Section 7.1.1, Log Session
Configuration File. Real-time log session configuration files can also be saved
by clicking the Save As button on the Log Session Settings dialog.
-
-
-
Page 27
2.2 Datalog menu
The Datalog menu is used to access the Log Session Settings dialog, to start,
stop and close the real-time log session and to mute audible alarms.
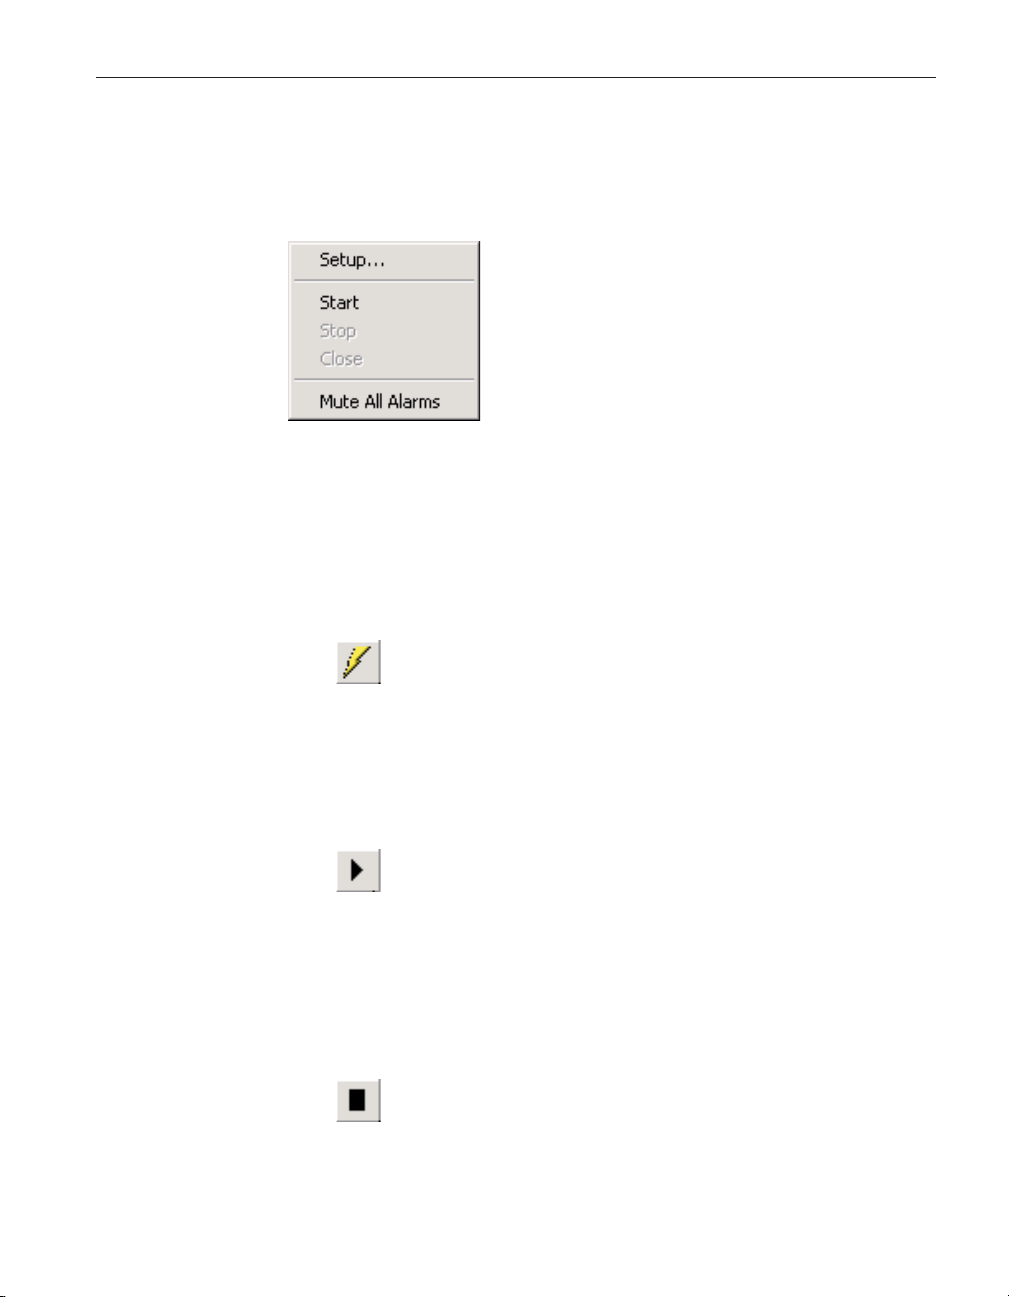
Figure 8 Datalog Menu
2.2.1 Setup
The Setup option displays the Log Session Settings dialog. This dialog is used
to configure a real-time log session. If a log session has already been configured or a real-time log session configuration file has already been opened, this
dialog displays the current log session settings.
2 Real-time logging
Datalog menu
The button on the toolbar corresponds to the Setup menu option.
Please refer to Section 2.3, Log Session Settings Dialog, for more details on
configuring a real-time log session.
2.2.2 Start
The Start option starts a real-time log session. This option is disabled until a
log session has been completely configured.
The button on the toolbar corresponds to the Start menu option.
Please refer to Section 2, Real-Time Logging, for more details on a real-time
log session.
2.2.3 Stop
The Stop option stops the current real-time log session. This option is only en
abled when a real-time log session is running. A log session may be stopped at
any time by selecting this option.
The button on the toolbar corresponds to the Stop menu option.
When selecting the Stop option, a message is displayed to confirm stopping the
log session.
-
15
Page 28
User’s Guide
2.2.4 Close
2.2.5 Mute all alarms
2.3 Log session settings dialog
The Close option closes the current real-time log session window. This option
is only enabled once the real-time log session has stopped and the log session
window is still open.
The button on the toolbar corresponds to the Close menu option.
The Mute All Alarms option can be used to mute any audible alarms associated
with the current real-time log session. When the alarms are muted, a check
mark appears next to this option. Muting the alarms does not prevent alarm
events from happening.
The button on the toolbar corresponds to the Mute All Alarms menu
option.
When alarms are muted, the toolbar button appears as .
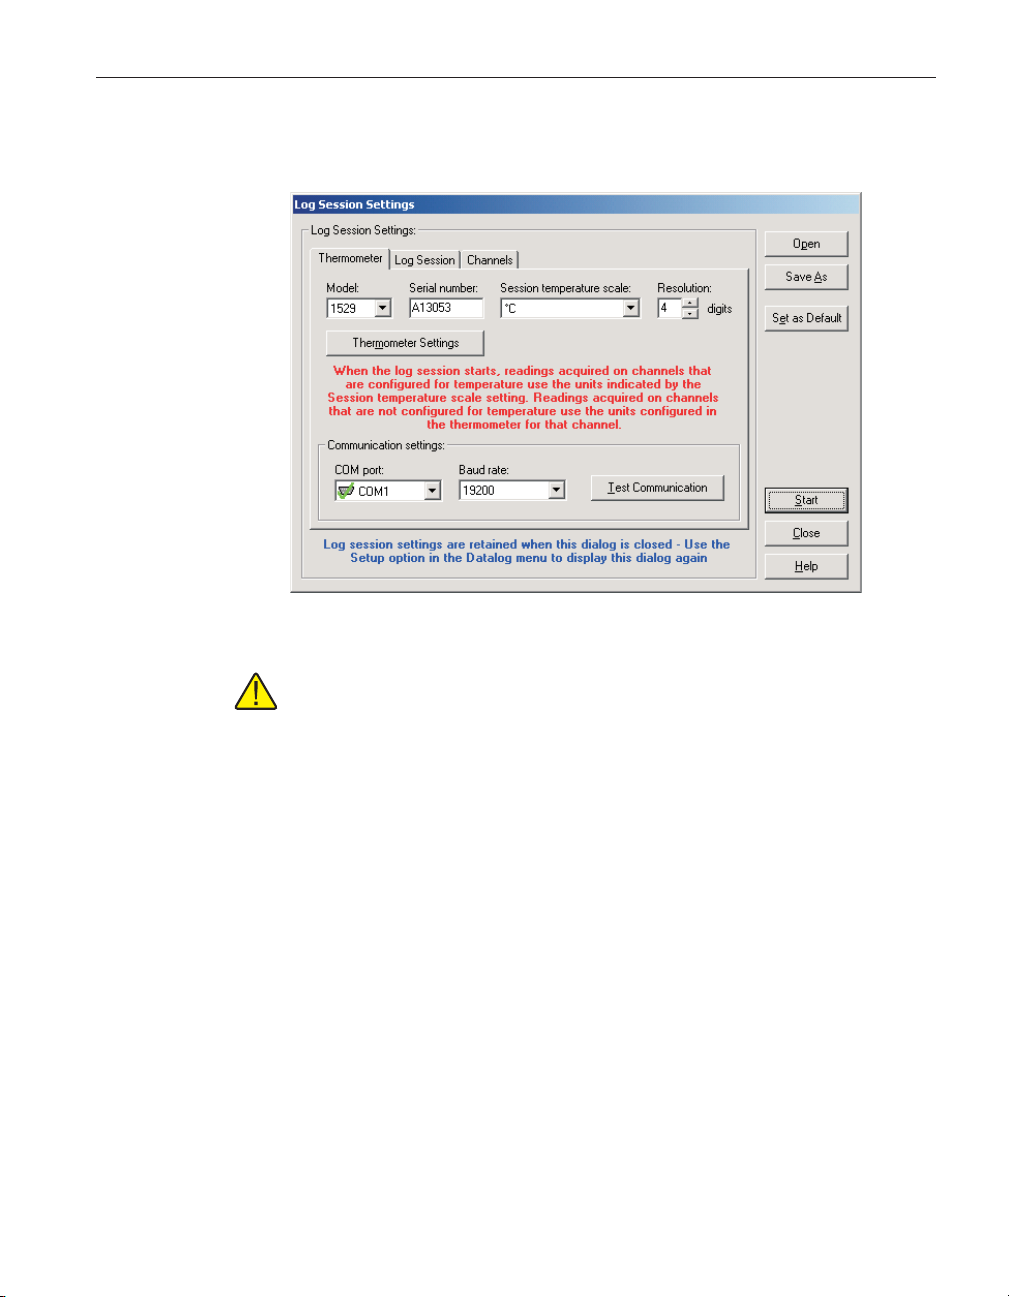
The Log Session Settings dialog is used to configure the real-time log session
settings. These settings include the thermometer readout to acquire data from,
communications settings, log session sample interval and start and end options,
and thermometer readout channel configuration. This dialog can be displayed
16
by selecting the Setup option in the Datalog menu or by clicking the
Page 29
2 Real-time logging
Log session settings dialog
button on the toolbar. This dialog is also displayed after opening a log session
configuration file.
Figure 9 Log Session Settings dialog
Note: This dialog displays the current real-time log session settings.
Clicking the Close button on this dialog does not cause these settings to be
lost. To display this dialog again, select the Setup option in the Datalog
menu.
This dialog has three tabs: Thermometer, Log Session and Channels. All of the
information on each of these tabs must be configured before a real-time log
session can be started. The following sections describe in detail each of the set
tings on these tabs.
Once the log session has been completely configured, the settings can be saved
to a configuration file by clicking the Save As button. If these same settings
may be used again at a later date, saving the settings to a configuration file
greatly reduces the amount of time required to get a log session started.
When clicking the Save As button, the Windows® Save As dialog is displayed.
The \Config folder should be selected by default (or the folder that is specified
for configuration files on the LogWa re Options dialog). Real-time log session
configuration files are saved with a .rls extension. To cancel saving a configu
ration file, click the Cancel button. Otherwise, enter the filename for the config
uration file and click the Save button. For more details about the real-time log
session configuration file, refer to Section 7.1.1, Log Session Configuration
File. Real-time log session configuration files can also be saved by selecting the
Save As option in the File menu.
17
-
-
Page 30
User’s Guide
A log session settings configuration file that has been saved previously can be
opened by clicking the Open button.
Note: When opening a configuration file, LogWare attempts to communi
cate with the thermometer to verify that the settings saved in the configu
-
ration file are compatible with the current thermometer configuration.
Therefore, it is necessary to have the thermometer connected and powered
on in order to successfully open a configuration file.
When clicking the Open button, the Windows® Open dialog is displayed. The
\Config folder should be selected by default (or the folder that is specified for
configuration files on the LogWare Options dialog). Real-time log session con
figuration files should have a .rls extension. To cancel opening a configuration
file, click the Cancel button. Otherwise, select the configuration file to open
and click the Open button. For more details about the real-time log session con
figuration file, refer to Section 7.1.1, Log Session Configuration File. Real-time
log session configuration files can also be opened by selecting the Open option
in the File menu.
LogWare then reads the log session settings from the configuration file and verifies that the configuration of the currently connected thermometer readout is
compatible with the log session settings. If there are any conflicts, or if
LogWare is unable to communicate with the thermometer readout, appropriate
messages are displayed.
If LogWare was unable to communicate with the thermometer readout or any
other error occurred, the log session settings may be incomplete.
LogWare has a feature which allows a log session configuration file to be defined as the default configuration file. The default configuration file is automatically loaded every time LogWa re is started. To set the current configuration as
the default configuration, select the Set as Default button. If the current config
uration has not been saved yet, a prompt is displayed indicating that the config
uration must be saved to a file before it can be set as the default. The next time
LogWare is started, the default configuration file will be loaded.
-
-
-
-
18
Note: Real-time log session configuration files contain information about
the current thermometer readout configuration. If the thermometer read
-
out configuration changes, the configuration file needs to be updated also.
Once the log session settings are complete, click the Start button to start a log
session. Please refer to Section 2.4, Real-Time Log Session, for more details on
a real-time log session.
If the log session does not need to be started yet, click the Close button. The
Log Session Settings dialog is closed but all settings are retained. To display
the Log Session Settings dialog again, select the Setup option in the Datalog
menu or click the button on the toolbar.
Page 31

Click the Help button to display the appropriate help topic for this dialog.
2.3.1 Thermometer tab
2 Real-time logging
Log session settings dialog
The Thermometer tab allows the thermometer readout that will be used to ac
-
quire data to be identified and configured.
Figure 10 Log Session Settings - Thermometer tab
Use the Model drop-down list to select the type of thermometer readout to use
to acquire data. All other controls on this tab will be disabled until a valid
model is selected.
Enter the serial number of the thermometer readout to use in the Serial number
box. The thermometer readout’s serial number should be located on a label,
generally on the back or bottom of the thermometer readout.
Note: Optionally, you may use the Thermometer Settings button to auto
matically determine the serial number of the thermometer readout and fill
in this box.
Select the scale of the readings to be acquired from channels that are config
ured to read temperature using the Session temperature scale drop-down list.
LogWare supports the following temperature scales:
•
°C
•
°F
•
K (Kelvin)
-
19
Page 32

User’s Guide
When a log session starts, LogWare will automatically set the thermometer
readout’s system units to use the selected scale. However, if the <keep exist
ing> option is selected, LogWare will query the thermometer readout to deter
mine the current system units.
Note: When starting a log session, LogWare checks the conversion setting
for each enabled channel. If a channel is configured to read temperature,
the units that were selected in the Session temperature scale drop-down
list are used. If a channel is not configured to read temperature (i.e. resis
tance or voltage), LogWare automatically determines the non-temperature
units for that channel.
Enter the resolution (number of digits after the decimal point) that LogWare
should use to format all of the measurements acquired. This setting is common
to all channels from which measurements are acquired. Where applicable,
LogWare will automatically set the thermometer readout’s resolution to this set
ting when a log session starts. Where not applicable, LogWar e will round more
precise measurements or add 0’s to less precise measurements to obtain the desired format.
Note: The resolution setting should be set prior to configuring the alarm
settings for each channel since the alarm values will also use this resolution. Changing the resolution setting after configuring the alarms does not
reformat the alarm values!!
-
-
20
Select the COM port on the computer to which the thermometer readout is connected using the COM port drop-down list. Only COM ports that the operating
system reports as being available can be used. The following symbols are used
to show the status of each COM port:
•
•
•
- Indicates a COM port that is currently available.
- Indicates the COM port that is currently selected by LogWa re .
- Indicates a COM port that is currently being used by another appli
cation.
•
•
- Indicates an IR port (virtual COM port) that is currently available.
- Indicates an IR port (virtual COM port) that is currently selected by
LogWa re.
•
- Indicates an IR port (virtual COM port) that is currently being used
by another application.
Note: For a real-time log session, LogWare requires the use of one COM
port. An IR port (virtual COM port) cannot be selected as the port to use.
-
Page 33

2 Real-time logging
Log session settings dialog
Select the baud rate that the computer should use to communicate over the
COM port with the thermometer readout using the Baud rate drop-down list.
The baud rate setting of the thermometer readout must be set to the same value
as this setting. For best results, use the maximum allowable baud rate setting
when possible.
After the model, COM port and baud rate settings are configured, click the Test
Communication button to make sure LogWare is able to communicate with the
thermometer readout. At this time, the thermometer readout must be connected
to the COM port on the computer using a null modem cable. For more informa
tion, please refer to the thermometer readout’s User's Guide.
When testing communications with the thermometer readout, there are three
possible results:
The thermometer readout is communicating at the correct baud rate on the
•
selected COM port.
The thermometer readout is communicating, but possibly at the wrong
•
baud rate or the thermometer readout model does not match the selected
model.
• The thermometer readout failed to communicate at all. Check the COM
port and baud rate settings, make sure the cable is a null modem cable,
and make sure the thermometer readout is plugged in and turned on.
-
Optional: The Thermometer Settings button may be clicked at this time to gain
access to various thermometer readout settings as applicable to the selected
thermometer readout. This feature is provided solely as a convenience to check
the thermometer readout configuration and/or to configure each channel of the
thermometer readout with appropriate conversion settings and probe coefficients. The Test Communication button should be clicked prior to clicking the
Thermometer Settings button to make sure the thermometer readout is commu
nicating successfully.
Warning: When using the Thermometer Settings tool, make sure that the
thermometer readout is not currently in any menu. Using the thermometer
readout's menus while using the Thermometer Settings tool may cause the
thermometer readout to fail to accept new settings.
Note: When starting a log session, LogWare will override many of the
current thermometer readout settings as needed to acquire data from the
configured channels using the specified log session settings!!
Note: If the serial number and session temperature scale settings have not
been configured prior to clicking the Thermometer Settings button, these
settings will be configured automatically after successfully viewing the
thermometer readout settings dialog.
-
21
Page 34

User’s Guide
2.3.2 Log Session tab
After the thermometer readout and communication settings are configured, the
log session settings may be configured.
Figure 11 Log Session Settings - Log Session tab
Select the interval at which LogWare should take readings on subsequent channels using the Interval between readings settings. The range of possible settings
is limited by the capabilities of the selected thermometer readout. For most
Hart Scientific multi-channel digital thermometer readouts, the minimum sample interval is 2 seconds.
22
Note: Due to the latency inherent in the measurement process, a thermom
eter readout may not be able to take readings at the exact selected interval
(i.e. the 1560 thermometer readout allows a minimum interval of 2 sec
onds, but actually takes about 2.3 seconds to make one measurement). For
this reason, using the minimum interval supported by the thermometer
readout may cause some duplicate readings to be taken. To avoid this
problem, see the Wait until new measurement is ready (when applicable)
option on the LogWare Options dialog. Please refer to Seciton 5.6.4, Op
-
tions, for more details.
If this interval is set to a value of 0, LogWa re will attempt to take simultaneous
readings on all enabled channels of the thermometer readout. If this feature is
used, you should use the Interval between scan sequences setting to limit how
often all channels are sampled.
Note: when using this feature, the Wait until new measurement is ready
option on the General tab of the Options dialog MUST be disabled (un
-
checked).
Page 35

2 Real-time logging
Log session settings dialog
Typically, LogWar e is used to take continuous measurements on all enabled
channels. However, LogWa re has a feature that allows one measurement to be
taken on each enabled channel at a set interval. For example, LogWar e could be
used to monitor the gradients in a liquid bath using 10 probes at various loca
tions in the bath. To measure gradients, readings should be taken simulta
-
neously, or at least as close together as possible, but maybe a set of readings
only needs to be taken once every minute, or once every five minutes. This can
be accomplished using LogWa re by enabling the Interval between scan se
-
quences option. The Interval between scan sequences settings are then enabled.
A scan sequence is defined by LogWare as taking a single reading on each en
abled channel. Select the interval to use. LogWare allows this interval to be set
anywhere between 1 minute and 60 hours at 1 minute or 1 hour increments.
Leaving this feature disabled causes LogWare to begin a new scan sequence
immediately following completion of the previous scan sequence.
The Start log session box indicates the current setting for starting a log session.
By default, this setting is configured to start a log session immediately after the
Start button is clicked. LogWa re may optionally be configured to start a log ses
sion unattended on any date at any time. To set the start date and time, click the
Delayed Start button. The Delayed Start Date/Time dialog is displayed. Please
refer to Section 2.3.4, Delayed Start Date/Time Dialog, for details on using this
dialog.
Clicking the Reset button resets the start date/time setting. The log session will
start immediately after the Start button is clicked.
The End log session settings allow the log session to be configured to automatically stop logging at a certain time or after a certain number of readings. By default, a log session will continue until manually stopped by the user. Select the
method to use to end the log session using the drop-down list. Choices are:
-
•
By user (default)
•
After specified number of readings
•
After specified time elapses
If the After specified number of readings or After specified time elapses option
is selected, the end log criteria must be selected. Enter either the number of
readings to acquire on each channel or the desired elapsed time setting. The
range of choices is from 1 to 1,000,000 readings (10,000 default) or 1 second
to 480 hours (1 hour default).
Note: If either the After specified number of readings or After specified
time elapses option is selected and the Interval between scan sequences
feature is enabled, the log session will stop automatically when the end
log criteria is met and the current scan sequence is complete.
23
Page 36

User’s Guide
2.3.3 Channels tab
After the thermometer readout and communication settings are configured, the
channels to acquire data from may be configured.
Figure 12 Log Session Settings - Channels Tab
24
All controls on the Channels tab (with the exception of the Query Channels
button) are disabled until the channel information has been queried from the
thermometer readout.
Click the Query Channels button to allow LogWa re to communicate with the
thermometer readout to collect as much information regarding the current chan
nel configuration as possible.
After querying the thermometer readout for channel information, the Channels
list displays one item for each channel on the thermometer readout. The chan
nel number, module name, module channel number and currently assigned
channel name are displayed in the list.
By default, all channels are enabled, meaning data should be acquired from all
channels. The Enable All Channels and Disable All Channels buttons can be
used to enable or disable acquiring data from all channels of the thermometer
readout respectively.
To configure a channel, select the channel from the Channels list. The selected
channel’s settings are displayed in the other controls on this tab.
To acquire data from the selected channel, make sure the Acquire data from
this channel box is checked. If this box is not checked, all other channel con
-
trols are disabled and data will not be acquired for this channel.
-
-
Page 37

2 Real-time logging
Log session settings dialog
Click the Statistics Settings button to display the Statistics Settings dialog. This
dialog is used to specify which statistics are to be maintained and displayed for
the selected channel. Please refer to Section 2.3.6, Statistics Settings Dialog,
for more details on the Statistics Setting dialog. By default, the statistics that
are enabled are: Minimum, Maximum, Spread, Average and Standard
deviation.
Note: Statistics are maintained for each channel independent of all other
channels. As a result, each channel has its own settings which must be
configured separately.
Each channel can be configured to trip an alarm if the reading on that channel
ever exceeds specific low and/or high values. To enable alarms for the selected
channel, click the Alarm Settings button. The Alarm Settings dialog is dis
played. This dialog is used to specify the alarm values and the actions associ
-
ated with each alarm. Please refer to Section 2.3.5, Alarm Settings Dialog, for
more details on the Alarm Settings dialog. By default, alarms are disabled.
Note: The alarm settings for each channel are independent of all other
channels. As a result, each channel must be configured separately.
Enter the name for the selected channel in the Channel name box. The channel
name should be something unique that identifies the purpose, location or other
information about the data being acquired on that channel. When a channel
name is changed, the Channels list is updated to reflect the change. By default
each channel is assigned the generic name ‘Channel n’(wheren is the channel
number). This name appears in the Channels grid on the real-time log session
window while the log session is running.
Enter the filename to which the data acquired from this channel is to be written
using the Acquire data to file box. The default filename for each channel is
Channel n.txt (where n is the channel number). The file is saved to the \Output
folder or the folder specified for output files on the LogWa re Options dialog.
The location for this file can be changed by selecting the “…” (Browse) button.
Check the Overwrite existing check box to allow LogWa re to automatically
overwrite an existing file of the same name in the same folder. If this box is not
checked and a file of the same name exists, a prompt is displayed and the op
-
tion to overwrite the existing file or choose another filename is given.
If you want to write the acquired data for all enabled channels to the same out
put file, check the Write all acquired data to the same file option. If this option
is checked, LogWare will use the filename and path of the first enabled channel
for all channels. The header of the output file will then contain information for
all enabled channels, and an additional column is added to the file for the chan
nel number for each reading.
-
-
25
Page 38

User’s Guide
2.3.4 Delayed Start Date/Time dialog
Note: This feature should typically only be used if you are using other
software to sort and analyze the logged data. The output file created when
using this feature can still be opened by LogWare and displayed
on-screen, however all readings are displayed on the graph as if they
came from the same channel (single trace).
Select the color to use for this channel’s trace on the graph using the Trace
color drop-down list. LogWa re supports 15 different trace colors. By default,
each channel is assigned one of the 15 colors.
If the trace for the selected channel is to be shown on the graph, check the
Show on graph check box. Once the log session starts, each channel can be
shown or hidden at any time. This setting only determines which channels are
shown initially when the log session starts.
Continue configuring the other channels as needed by selecting the next chan
nel in the list and following this process again.
The Delayed Start Date/Time dialog allows the real-time log session to be
scheduled to start at a future date and/or time.
-
26
Figure 13 Delayed Start Date/Time Dialog
Select the date on which the log session should start by clicking on the appro
priate date in the calendar. Today’s date is indicated by the red outline circle.
The currently selected date is indicated by a gray filled circle. Use the left and
right arrow buttons at the top of the calendar to scroll through the months and
years.
Enter the time at which the log session should start using the At this time box.
-
Page 39

2 Real-time logging
Log session settings dialog
Note: When using the Delayed Start feature, make sure the Prompt to syn
chronize real-time log session option on the LogWare Options dialog is not
checked! Otherwise the log session will not start as expected! Please refer
to Section 5.6.4, Options, for more information.
Once the start date and/or time have been selected, click the OK button to close
this dialog.
To cancel setting the delayed start date and/or time, click the Cancel button.
Click the Help button to display the appropriate help topic for this dialog.
2.3.5 Alarm Settings dialog
The Alarm Settings dialog is used to configure low and/or high alarms. The
current low alarm or high alarm settings can be changed by selecting the Low
alarm or High alarm tab respectively. Low and high alarms are independent of
each other and must be configured independently.
-
Figure 14 Alarm Settings dialog
27
Page 40

User’s Guide
The Low alarm tab and High alarm tab indicate the current low alarm and high
alarm settings for the selected channel respectively.
To enable an alarm for the selected channel, check the Enable alarm check box
on the appropriate tab. If this check box is unchecked, all other settings on the
tab are disabled.
Enter the value to be used for this alarm in the Value box. The low alarm will
be tripped if the reading on the selected channel meets or drops below the value
on the Low alarm tab. The high alarm will be tripped if the reading on the se
-
lected channel meets or exceeds the value on the High alarm tab.
Select the event that should occur when each alarm is tripped. The choices are:
No event
•
System beep
•
Display message
•
Play .WAV file indicated below
•
• Launch .EXE file indicated below
If either the Play .WAV file indicated below or Launch .EXE file indicated below option is selected, the Path and filename box and Browse button are enabled and the appropriate file must be entered or selected. Use the Browse
button to browse for the file. The Test button is enabled once a file has been entered. Select the Test button to make sure the selected file can be played or
launched.
28
Note: The file entered in the Path and filename box MUST exist! When the
OK button is clicked, a search is performed to locate the file. If the file is
not found, a warning message is displayed. If the selected file resides on a
network resource, the resource must be available and properly connected
when the alarm event occurs!
LogWare ships with a few sample .WAV files that can be used. These files are
located in the \Config folder.
The Launch .EXE file indicated below option can be used to launch any appli
cation such as pager software which could be configured to dial a phone num
ber automatically and transmit a fixed message to a pager indicating that an
alarm has tripped.
-
-
Page 41

2 Real-time logging
Log session settings dialog
Note: It is not recommended that the Launch .EXE file indicated below
option be used (especially in conjunction with the After every update op
tion) until the user is familiar with how this feature works. Unless the
.EXE file terminates itself automatically (or is limited to a single in
stance), this software will continue to launch new instances of the .EXE
file every time the alarm trips, possibly causing the computer to run out of
resources.
Select when the specified event for each alarm should occur. The choices are:
Only once when the alarm value is exceeded
•
After every update
•
If the Only once when the alarm value is exceeded option is selected, the cho
sen event will occur on the first reading that trips the alarm. Subsequent read
-
ings that also exceed the alarm value will not cause the event to occur again
until one or more readings are taken that are back within the alarm value (alarm
reset).
If the After every update option is selected, every reading that is taken that exceeds the alarm value causes the event to happen again.
The alarm settings can be saved to a configuration file. If the same alarm settings are to be used on multiple channels, this provides a method to quickly
configure the alarms on subsequent channels.
When clicking the Save As button, the Windows® Save As dialog is displayed.
The \Config folder should be selected by default (or the folder that is specified
for configuration files on the LogWa re Options dialog). Alarm configuration
files are saved with a .alm extension. To cancel saving a configuration file,
click the Cancel button. Otherwise, enter the filename for the configuration file
and click the Save button. For more details about the alarm configuration file,
refer to Section 7.1.2, Alarm Configuration File.
An alarm configuration file that has been saved previously can be opened by
clicking the Open button.
When clicking the Open button, the Windows® Open dialog is displayed. The
\Config folder should be selected by default (or the folder that is specified for
configuration files on the LogWare Options dialog). Alarm configuration files
should have a .alm extension. To cancel opening a configuration file, click the
Cancel button. Otherwise, select the configuration file to open and click the
Open button. For more details about the alarm configuration file, refer to Sec
-
tion 7.1.2, Alarm Configuration File.
Once the alarm settings are complete, click the OK button to save these settings
and close this dialog.
Click the Cancel button to discard any changes you have made and close this
dialog.
29
Page 42

User’s Guide
2.3.6 Statistics Settings dialog
Click the Help button to display the appropriate help topic for this dialog.
The Statistics Settings dialog allows specific statistical functions to be enabled
or disabled for the selected channel.
Figure 15 Statistics Settings dialog
To enable a statistical function for the selected channel, check the box next to
the appropriate function.
The statistical functions supported are:
30
• Minimum
• Maximum
• Spread
• Average
•
Standard deviation
•
Sliding window
If the Sliding window function is enabled, a value must be entered into the
Readings box. All other statistical values are calculated based on the most re
cent n measurements as indicated by the value in the Readings box. The read
ings setting can be set to any value between 10 and 1,000.
If the Sliding window function is disabled, the statistical values are calculated
based on all readings since the last reset was performed.
Once the statistics settings are complete, click the OK button to save these set
tings and close this dialog.
Click the Cancel button to discard any changes you have made and close this
dialog.
Click the Help button to display the appropriate help topic for this dialog.
-
-
-
Page 43

2.4 Real-time log session
The Log Session window is displayed when a real-time log session starts. This
window is divided into three main sections: channels grid, statistics and graph.
These three sections can be resized by dragging the bars that divide the sections
with the mouse.
2 Real-time logging
Real-time log session
Figure 16 Real-time log session window
LogWare was designed to communicate with only one thermometer readout at a
time. Therefore, only one real-time log session can be running at a time. In or
der to optimize data acquisition, many menu options are disabled during a
real-time log session.
When a log session is started, LogWa re prepares to acquire data from the en
abled channels. The current conversion settings for each channel and system
units are determined at this time. The scale of the readings for each channel de
pends on the conversion setting for each channel and the session temperature
scale as set on the Log Session Settings dialog.
LogWare attempts to create the output file for each enabled channel. If
LogWare is unable to create an output file, or if there is an existing file of the
same name and the overwrite option was not selected, a prompt is displayed
and a new path and/or filename may be entered for the output file.
31
-
Page 44

User’s Guide
If a delayed start time was selected, a dialog appears indicating the time that the
log session will begin. Otherwise, a dialog appears indicating that the log ses
sion will begin momentarily while LogWa re initializes the thermometer readout
and finishes preparing to start the log session.
Note: If a delayed start time was selected and the Prompt to synchronize
real-time log session option is selected on the LogWare Options dialog, a
prompt is displayed asking if the synchronize feature should be disabled. If
the synchronize feature is not disabled, the log session will not start as ex
-
pected! For more details, please refer to Section 5.6.4, Options.
Once logging starts, one measurement is taken on each enabled channel at the
interval specified on the Log Session Settings dialog. If the Interval between
scan sequences feature was enabled, LogWare then waits the specified time and
repeats this process. Otherwise, this process is repeated without delay.
Note: Be aware that selecting any menu option while a real-time log ses-
sion is running may cause the measurement process to halt temporarily
until the menu is closed or the dialog that is displayed is closed! Also,
running other applications on the computer while logging real-time data,
especially those that require a lot of processing time or that access the
disk frequently, may cause the measurement process to halt temporarily
while the other application is busy. It is recommended that, once a
real-time log session is started, the software and the computer be left
alone to log the data without interruption.
32
If the log session was configured to stop logging at a specified time or after a
specific number of readings, LogWare continues to acquire data until the end
log criteria is met. The log session can be stopped manually at any time by se
-
lecting the Stop option in the Datalog menu or by clicking the button
on the toolbar.
When a log session is stopped manually, a prompt is displayed asking if the log
session window should be closed. The log session window may be closed at
this time or left open. In order to start a new log session, the current log session
window must be closed. Select Yes to close the log session window immedi
-
ately or select No to leave the window open.
To close the real-time log session window, select the Close option in the
Datalog menu or click the button on the toolbar. If the Show Log Ses
sion Settings dialog after closing log session option on the LogWare Options
dialog is checked, the Log Session Settings dialog is automatically displayed.
To prevent LogWare from displaying the Log Session Settings dialog after the
log session window is closed, uncheck this option. For more details, please re
fer to Section 5.6.4, Options.
-
-
Page 45

Once the log session has been stopped, the output file which contains all of the
acquired readings can be opened by selecting the Open Previously Logged Data
File option in the View menu. For more details on opening previously logged
data files, please refer to Section 5.4.7, Open Previously Logged Data File.
2.4.1 Channels grid
The Channels grid is located in the upper left corner of the log session window
and displays the most recent data for each enabled channel. This data includes
the channel name, date, time and value and scale of the most recent reading, the
current alarm state and whether or not the trace for the channel is currently dis
played on the graph. The color of the data in the Channels grid matches the se
lected trace color for that channel. The currently selected channel is
highlighted.
The first column in the Channels grid indicates the channel names as entered on
the Log Session Settings dialog. The second and third columns indicate the
date and time that the last reading was taken on each channel. The fourth col
umn indicates the last reading value and scale on each channel. The fifth column indicates the current alarm state and the sixth column indicates whether
the trace for each channel is currently shown on the graph. Each of these columns may be resized as desired by dragging the lines that separate each column
with the mouse.
The current alarm state is determined by comparing the most recent reading on
each channel to that channel’s alarm settings. If the low and/or high alarms
have been configured, the reading is compared to the alarm values. If the low
alarm is enabled and the reading is less than or equal to the low alarm value,
the Alarm box in the Channel grid flashes Low to indicate the low alarm has
“tripped”. If the high alarm is enabled and the reading is greater than or equal
to the high alarm value, the Alarm box flashes High to indicate the high alarm
has “tripped”. If the reading falls between the low and high alarm values or if
the alarms are not enabled, the Alarms box remains blank (alarm reset).
Double-clicking on a row in the Channels grid toggles the state of the trace on
the graph. The current state for each channel is indicated in the Graph column.
Right-clicking on the Channels grid displays a popup menu. This menu consists
of some of the more common options for working with channels during a
2 Real-time logging
Real-time log session
-
-
-
33
Page 46

User’s Guide
real-time log session. The menu options apply only to the currently selected
channel.
Figure 17 Channels popup menu
The alarm settings for the selected channel can be viewed by selecting the
Alarm Settings option in the popup menu, or by selecting the Alarm Settings
option in the View menu. If the selected channel does not have any alarms configured, this menu option is disabled. Selecting the Alarm Settings option displays the Current Alarm Settings dialog. Please refer to Section 2.4.4, Current
Alarm Settings Dialog, for more information on this dialog.
The graph trace color for the selected channel can be changed while the log
session is running by selecting the Trace Color option in the popup menu, or by
selecting the Trace Color option in the Graph menu. Please refer to Section
2.4.7, Trace Color Dialog, for more details on using the Trace Color dialog.
The color of the channel in the Channels grid, statistics list and the graph trace
are all updated to the new color.
The Show Trace option in the popup menu indicates whether the trace for this
channel is currently shown on the graph. A check appears next to this menu op
tion is the trace is visible. The Graph column of the Channels grid also indi
cates whether the trace is currently shown on the graph. To toggle showing the
trace for the selected channel on the graph, select the Show Trace option in the
popup menu, or select the Show Trace option in the View menu.
The View Alarm Log option in the popup menu displays the alarm log file for
this log session. Every time an alarm is tripped or reset, an entry is written to
the alarm log file. This file is named “alarms.log” and is located in the default
output folder. The alarm log file can also be viewed by selecting the Alarm Log
option in the View menu. The alarm log file is displayed in the File Viewer
window. Please refer to Section 7.2.3, Alarm Log File, for more information on
the contents of the alarm log file. Please refer to Section 2.4.8, File Viewer
Window, for more information on using the File Viewer window.
-
34
Page 47

2 Real-time logging
Real-time log session
Note: When viewing the alarm log file while a real-time log session is
running, the File Viewer window displays only the information that had
been written to the file at the time the file was opened. Click the Refresh
button on the File Viewer window to update the file. The alarm log file can
also be printed by clicking the Print button on the File Viewer window.
The output file for each channel can be opened and viewed by selecting the
View Readings History option in the popup menu or be selecting the Readings
History option in the View menu. The output file contains all of the data that
has been logged for the selected channel during the current log session. The
output file is displayed in the File Viewer window. Please refer to Section 7.2.1,
Output File, for more information on the contents of the output file. Please re
fer to Section 2.4.8, File Viewer Window, for more information on using the
File Viewer window.
Note: If the data is being acquired using the Write all acquired data to the
same file option, the View Readings History feature displays all readings
for all channels!
Note: When viewing the output file while a real-time log session is run-
ning, the File Viewer window displays only the information that had been
written to the file at the time the file was opened. Click the Refresh button
on the File Viewer window to update the file. To see the statistics for the
output file, click the Statistics button on the File Viewer window. The output file can also be printed by clicking the Print button on the File Viewer
window or by selecting the Print | Readings option in the File menu.
2.4.2 Statistics list
The Statistics list is located in the upper right corner of the log session window
and displays statistical information for the currently selected channel. The color
of the statistics data matches the trace color for the selected channel. Each of
the statistical settings can be enabled or disabled by clicking the Settings but
ton. Only the enabled statistics are displayed in the Statistics list. Please refer to
Section 2.3.6, Statistics Settings Dialog, for more information on the Statistics
Settings dialog.
Clicking the Clear button resets all statistical values for the selected channel
and begins calculating the statistical data again starting with the next reading
acquired on the selected channel.
2.4.3 Graph
The graph is located at the bottom of the log session window. The graph gives a
visual representation of the readings on all enabled channels.
The trace for each enabled channel can be toggled on or off. The Graph column
in the Channels grid indicates the current state of the trace for each channel. To
-
35
Page 48

User’s Guide
show or hide the trace for the selected channel, either double-click on the chan
nel, or right-click on the Channels grid and select the Show Trace option in the
popup menu or select the Show trace option in the View menu.
The Y-axis of the graph is always labeled in the session temperature scale that
was selected on the Log Session Settings dialog. The Y-axis is automatically
scaled to keep the entire visible portion of all traces within the graph bounds.
As traces are shown and/or hidden, the graph should automatically rescale to
maximize the resolution.
Note: For readings on all channels that are configured for non-tempera
ture units (i.e. Ohms or mV), the units of the Y-axis are assumed to be in
the appropriate units for that channel.
The X-axis of the graph displays the current time according to the computer’s
clock. As the traces reach the right side of the graph, the traces shift to the left
and the left-most part of the traces are pushed off the graph. The graph is set to
display 600 readings on the X-axis at a time. This setting is fixed and cannot be
changed.
Gridlines can be automatically displayed on the graph by checking the Show
gridlines on graphs option of the General tab of the LogWar e Options dialog.
Please refer to Section 5.6.4.1, General Tab, for more details.
Right-clicking on the graph displays a popup menu. This menu is identical to
the Graph menu and consists of options for working with the graph during a
real-time log session. Some of the menu options apply only to the currently selected channel.
-
36
Figure 18 Graph popup menu
There are many customizable settings for the graph such as titles, a legend,
background and text colors, grid lines and trend lines. All of these features can
be accessed by selecting the Graph Settings option in the popup menu or in the
Graph menu. The default graph settings can be restored by selecting the Re
store Default Settings option in the popup menu or in the Graph menu. For
more details on customizing the graph settings, please refer to Section 5.5.1,
Graph Settings Dialog.
Page 49

The Zoom In and Restore options are not applicable to a real-time log session
and are disabled.
The graph may be printed at any time by selecting the Print Graph option in the
popup menu or in the Graph menu, or by selecting the Print | Graph option in
the File menu.
2.4.4 Current Alarm Settings dialog
The Current Alarm Settings dialog displays the current alarm settings.
Figure 19 Current Alarm Settings dialog
2 Real-time logging
Real-time log session
The Low alarm box indicates the current low alarm value and units. If the low
alarm is not enabled, the Low alarm box is disabled and no value is displayed.
The High alarm box indicates the current high alarm value and units. If the
high alarm is not enabled, the High alarm box is disabled and no value is
displayed.
Click the Close button to close this dialog.
2.4.5 Output file
The data that is acquired during a real-time log session is written to a file,
called an output file. This file contains information about the thermometer read
out used to acquire the data, alarm settings (if applicable), and the date, time,
value, scale and alarm state for each reading.
To view the contents of an output file during a real-time log session, select the
Readings History option in the View menu, or right-click on the Channels grid
and select the View Readings History option in the popup menu.
The output file is described in detail in Section 7.2.1, Output File.
2.4.6 Alarm log file
During a real-time log session, a log of all alarm activity is recorded in a file
call the alarm log. This file contains alarm setting information for each channel
-
37
Page 50

User’s Guide
2.4.7 Trace color dialog
and the date, time, value, scale and alarm state for each time an alarm tripped
or reset.
To view the contents of the alarm log file during a real-time log session, select
the Alarm Log option in the View menu, or right-click on the Channels grid
and select the View Alarm Log option in the popup menu.
The alarm log file is described in detail in Section 7.2.3, Alarm Log File.
The Trace Color dialog allows a new color to be selected for the graph trace.
Figure 20 Trace color dialog
38
The current trace color is selected when the dialog is displayed. Select the new
color using the Trace color drop-down list.
Click the OK button to save the settings you have selected and to close the
dialog.
Click the Cancel button to discard any changes and close the dialog.
Click the Help button to display the appropriate help topic for this dialog.
Page 51

2.4.8 File Viewer window
The File Viewer window displays the contents of the indicated file.
Figure 21 File Viewer window
2 Real-time logging
Real-time log session
The data grid displays the contents of the file at the time the viewer window is
displayed. The data displayed in the data grid will vary depending on the contents of the file being viewed.
To update the data in the data grid, click the Refresh button. The contents of
file will be read in again and the data grid is updated.
To print the contents of the indicated file to the default printer, click the Print
button.
The Statistics button is shown if there is statistical data associated with the dis
played data. To see the statistical data, click the Statistics button. The Statistics
dialog is displayed. Please refer to Section 2.4.9, Statistics Dialog, for more de
tails on this dialog.
The Close button closes this window.
-
-
39
Page 52

User’s Guide
2.4.9 Statistics dialog
The Statistics dialog displays the current statistical values. Only the values for
the enabled statistics are displayed.
Figure 22 Statistics dialog
If the Sliding window statistical setting is enabled, the statistical values are
based on the number of readings specified for the sliding window. Otherwise,
the statistical values are based on all readings since the statistics were last reset.
Click the Reset button to reset the statistical values.
Click the Close button to close this dialog.
40
2.5 Previous log session
The Previous Log Session window allows multiple output files or download
files to be opened and viewed. This window is divided into three main sections:
Page 53

2 Real-time logging
Previous log session
channels, statistics and graph. These three sections can be resized by dragging
the bars that divide the sections with the mouse.
Figure 23 Previous Log Session window
A Previous Log Session window can be opened by selecting the Open Previously Logged Data File option in the View menu or by selecting one of the files
in the Most Recently Used (MRU) section at the bottom of the View menu. Up
to 8 Previous Log Session windows can be open at a time.
When selecting the Open Previously Logged Data File option, the Windows®
Open dialog is displayed. The \Config folder should be selected by default (or
the folder that is specified for configuration files on the LogWa re Options dia
-
log). Both output files and download files can be opened in the Previous Log
Session window. These files should have a .txt extension. To cancel opening a
file, click the Cancel button. Otherwise, select up to 10 files to open and click
the Open button. If more than 10 files are selected, only the first 10 files are
opened and the rest are ignored. For more details about output files, please re
-
41
Page 54

User’s Guide
fer to Section 7.2.1, Output file. For more details about download files, please
refer to Section 7.2.2, Download file.
Note:To open an output file that was created when using the Write all ac
quired data to the same file option (multiple data sets in the same file),
you must not select more than one file on the Windows® Open dialog. If
the file contains data from more than 10 channels, only the data from the
first 10 channels will be displayed. Data sets from each channel are sepa
rated into individual files and may be opened in another window if de
sired. A message is displayed if the selected file contains more than 10
data sets and indicates the names and path where the files are located.
A progress dialog is displayed as each of the selected files are read in and ana
lyzed. As each of the files is read in, a tab is created in the Channels section of
the window and statistical data is calculated. Each channel is automatically as
signed a trace color that can be changed at any time. The X-axis of the graph
automatically grows to accommodate the file with the most readings. The
Y-axis of the graph is automatically scaled to display all traces on the graph.
Note: The graph allows a maximum of 32,767 readings per channel. If
any one file contains more readings than that, the first 32,767 readings are
read in and the rest are ignored. The graph also limits the total number of
data points to 128,000 for all channels. So, for 10 channels, a maximum of
12,800 readings per channel can be displayed.
To close the Previous Log Session window, click the button in the title
bar.
2.5.1 Channels
The Channels section is located in the upper left corner of the previous log ses
sion window and displays one tab for each file that was opened. Each tab is
given the name of the file and the grid on the tab contains all of the data that
was read in from the file. Depending on the type of file being opened, this data
can include but is not necessarily limited to, the date, time, value and scale of
each reading as well as the alarm state at the time that reading was taken.
-
-
-
-
-
-
42
Note: When opening files that contain data that was downloaded from
some of the thermometers supported by LogWare, no date or time informa
-
tion is available. Download files never contain alarm information.
Selecting a tab in the Channels section displays the data associated with that
channel. The color of the data in the grid matches the graph trace color as
-
signed to this channel.
Right-clicking on any of the channel tabs displays a popup menu. This menu
Page 55

2 Real-time logging
Previous log session
allows channels to be added to or removed from this session, and also allows
the trace color to be changed, or the trace can be hidden.
Figure 24 Channels popup
menu
LogWare is capable of opening up to 10 files (channels) in the same Previous
Log Session window. To add another channel to the window, select the Add
Channel option in the popup menu. The Windows® Open dialog is displayed.
The \Config folder should be selected by default (or the folder that is specified
for configuration files on the LogWa re Options dialog). To cancel opening a
file, click the Cancel button. Otherwise, select up to 9 more files to open and
click the Open button. Since LogWar e only allows a total of 10 files to be
opened, any additional files are ignored. The Add Channel option is disabled if
the log session already has 10 channels open.
To remove a channel from the Previous Log Session window, select the tab for
the channel and select the Remove Channel option in the popup menu. Any
channel can be removed except the first channel. The first channel cannot be
removed. When a channel is removed, the corresponding tab, grid and graph
trace are also removed and the graph Y-axis is rescaled as needed.
To change the color of the trace on the graph for any channel, select the tab for
the channel and select the Trace Color option in the popup menu, or by select
ing the Trace Color option in the Graph menu. The Trace Color dialog is dis
played. Please refer to Section 2.4.7, Trace Color Dialog, for more information
on this dialog.
The Show Trace option in the popup menu indicates whether the trace for the
selected channel is currently shown on the graph. A check appears next to this
option if the trace is visible. The trace on the graph for any channel can be tog
gled on or off at any time. To toggle the trace for any channel, select the tab for
the channel and select the Show Trace option in the popup menu or select the
Show trace option in the View menu. If a check appears next to this option, the
trace is currently shown. If no check appears, the trace is hidden.
-
-
2.5.2 Statistics list
The Statistics list is located in the upper right corner of the Previous Log Ses
sion window and displays statistical information for the currently selected
channel. The statistics are calculated when the data is read in from the file. The
color of the statistics data matches the trace color for the selected channel.
-
43
Page 56

User’s Guide
Each of the statistical settings can be enabled or disabled by clicking the Set
tings button. Only the enabled statistics are displayed in the Statistics list.
Please refer to Section 2.3.6, Statistics Settings Dialog, for more information
on the Statistics Settings dialog.
2.5.3 Graph
The graph is located at the bottom of the Previous Log Session window. The
graph gives a visual representation of the readings on all channels.
The trace for each channel can be toggled on or off. To show or hide the trace
for the selected channel, right-click on the tab in the Channels grid and select
the Show Trace option in the popup menu or select the Show Trace option in
the View menu.
The Y-axis of the graph is automatically scaled to display all visible traces in
their entirety. The Y-axis is labeled Value by default and the resolution of the
values is extracted from the data read in from the channels. The X-axis of the
graph grows automatically to display the entire trace of the channel with the
most readings. The X-axis is labeled Readings by default and is numbered according to the number of readings in each file.
Note: The graph allows a maximum of 32,767 readings per channel. If
any one file contains more readings than that, the first 32,767 readings are
read in and the rest are ignored. The graph also limits the total number of
data points to 128,000 for all channels. So, for 10 channels, a maximum of
12,800 readings per channel can be displayed.
-
44
Gridlines can be automatically displayed on the graph by checking the show
gridlines on graphs option of the General tab of the LogWar e Options dialog.
Please refer to Section 5.6.4.1, General Tab, for more details.
Right-clicking on the graph displays a popup menu. This menu is identical to
the Graph menu and allows quick access to graph-related functions. Some of
the options apply only to the currently selected channel.
Figure 25 Graph popup menu
Page 57

There are many customizable settings for the graph such as titles, a legend,
background and text colors, grid lines and trend lines. All of these features can
be accessed by selecting the Graph Settings option in the popup menu or in the
Graph menu. The default graph settings can be restored by selecting the Re
store Default Settings option in the popup menu or in the Graph menu. For
more details on customizing the graph settings, please refer to Section 5.5.1,
Graph Settings Dialog.
The Zoom In and Restore options are can be used to zoom in to a small section
of the graph and to restore the graph to its default state respectively. Please re
fer to Section 2.5.4, Graph Zooming, for more details on using the graph zoom
ing feature.
The graph may be printed at any time by selecting the Print Graph option in the
popup menu or in the Graph menu, or by selecting the Print | Graph option in
the File menu.
2.5.4 Graph zooming
LogWare allows the graph in the Previous Log Session window to be zoomed
to view a small section of the graph in more detail. The zoom feature can be enabled by selecting the Zoom In option in the Graph menu, or by right-clicking
on the graph and selecting the Zoom In option in the popup menu, or by click-
2 Real-time logging
Previous log session
-
-
-
ing the button on the toolbar. When the zoom feature is enabled, the
mouse pointer turns into a crosshair when positioned over the graph, the
toolbar button remains depressed and a check mark appears next to the Zoom
In option indicating that the graph is now in “zoom mode”.
Figure 26 Graph zooming
To zoom in to a portion of the graph, use the mouse to select the portion of the
graph to zoom by clicking the left mouse button and holding it down while
dragging the mouse to draw a rectangular box around the desired area. Releas
-
45
Page 58

User’s Guide
ing the mouse button causes the graph to zoom in to the selected area. Repeat
this process to zoom in closer and closer.
To restore the graph to its normal state, select the Restore option in the Graph
menu, or right-click on the graph and select the Restore option in the popup
menu, or click the button on the toolbar. The check mark is then re
moved in the Zoom In option and the Zoom In toolbar button no longer appears
depressed.
46
Page 59

3 Downloading logged data
3 Downloading logged data
Download menu
LogWare provides tools to download data that has been logged to the thermom
eter readout’s memory or logs and to view the current status of the thermometer
readout’s logs or memory. These tools are accessible by selecting options in the
Download menu. The following sections describe the download and log status
dialogs for each of the thermometer readouts supported by LogWa re.
3.1 Download menu
The Download menu contains options for downloading logged data from the
thermometer readout’s memory or logs and viewing the current status of the
thermometer readout’s logs or memory.
Figure 27 Download menu
3.1.1 Download logged data
The Download Logged Data option can be used to download data that has been
logged to the thermometer readout’s logs or memory. All thermometer readouts
supported by LogWare support logging of some type. Please refer to Section
1.4.4, Firmware Requirements, for more information.
When selecting the Download Logged Data option, the Select Model dialog is
displayed. LogWare needs to know the model of the thermometer readout in or
der to display appropriate options dialog. Please refer to Section 3.2, Select
Model Dialog, for more details.
After the thermometer readout model and communication settings have been
selected, the appropriate Download Options dialog for the selected thermome
ter readout is displayed. The Download Options dialogs are described in more
detail in Section 3.3, Download Options Dialogs.
-
-
-
3.1.2 Log status
The Log Status option can be used to view the current status of the thermome
ter readout’s logs or memory. This feature is only supported by some of the
thermometer readouts supported by LogWare .
When selecting the Log Status option, the Select Model dialog is displayed.
LogWare needs to know the model of the thermometer readout in order to dis
play appropriate status dialog. Please refer to Section 3.2, Select Model Dialog,
for more details on the Select Model dialog.
-
-
47
Page 60

User’s Guide
3.2 Select Model dialog
After the thermometer readout model and communication settings have been
selected, the appropriate Log Status dialog for the selected thermometer read
-
out is displayed. The Log Status dialogs are described in more detail in Section
3.4, Log Status Dialogs.
When any of the Download menu options is selected, the Select Model dialog
is displayed. LogWare needs to know the model of the thermometer readout to
interface with.
48
Figure 28 Select Model dialog
If this dialog has been used previously to select a thermometer readout model
and communication settings, the previous settings are restored.
Use the Model drop-down list to select the type of thermometer readout being
used. All other controls on this dialog are disabled until a model is selected.
The list of available thermometer readouts depends on the Download menu op
tion selected. Only thermometer readouts that support the selected feature are
listed.
Select the COM port on the computer to which the thermometer readout is con
nected using the COM port drop-down list. Only COM ports that the operating
system reports as being available can be used. The following symbols are used
to show the status of each COM port:
•
•
•
- Indicates a COM port that is currently available.
- Indicates the COM port that is currently selected by LogWa re .
- Indicates a COM port that is currently being used by another appli
cation.
•
- Indicates an IR port (virtual COM port) that is currently available.
-
-
-
Page 61

3 Downloading logged data
Select Model dialog
•
- Indicates an IR port (virtual COM port) that is currently selected by
LogWa re.
•
- Indicates an IR port (virtual COM port) that is currently being used
by another application.
Select the baud rate that the computer should use to communicate over the
COM port with the thermometer readout using the Baud rate drop-down list.
The baud rate setting of the thermometer readout must be set to the same value
as this setting. For best results, use the maximum allowable baud rate setting
when possible.
Check the Use IR dongle option to use the thermometer readout’s IR port in
stead of an RS-232 cable. This option is only enabled when the selected ther
-
mometer readout has an IR port and the selected download feature allows using
the IR port to communicate with the thermometer readout. For more informa
tion on using the IR dongle, please refer to Section 6.13, Using an IR Dongle
with LogWa re.
After the model, COM port, baud rate and/or IR settings are configured, click
the Test Communication button to make sure communication with the thermometer readout is successful. At this time, the thermometer readout must be
connected to the COM port on the computer using a null modem cable or, if the
IR dongle is being used, the IR dongle must be connected to the selected COM
port and the dongle must be aligned with the thermometer readout’s IR port.
For more information, please refer to the thermometer’s User's Guide.
When testing communication with the thermometer readout, there are three
possible results:
• The thermometer readout is communicating at the correct baud rate on the
selected COM port.
•
The thermometer readout is communicating, but possibly at the wrong
baud rate or the thermometer readout model does not match the selected
model.
•
The thermometer readout failed to communicate at all. Check the COM
port and baud rate settings, make sure the cable is a null modem cable,
and make sure the thermometer readout is plugged in and turned on. If us
ing the IR dongle, make sure the dongle is connected to the selected COM
port and the dongle is aligned properly with the thermometer readout’s IR
port.
After all of the settings on this dialog are configured and communication with
the thermometer readout is successful, click the OK button to accept the set
-
tings and continue.
Click the Cancel button close this dialog and abort using the selected feature.
Click the Help button to display the appropriate help topic for this dialog.
-
49
Page 62

User’s Guide
3.3 Download options dialogs
3.3.1 1523 Handheld download options dialog
LogWare provides a tool to download data from the thermometer readout’s
memory or logs. This tool is accessible by selecting the Download Logged
Data option in the Download menu. The following sections describe the dialogs
for each of the thermometer readouts that support this feature.
The Model 1523 Handheld Thermometer readout can store readings in a log,
called the demand log. LogWare can download the readings from this log and
write the readings into download files. For more information on download files,
please refer to Section 7.2.2, Download File on page 231. When the Download
Logged Data option in the Download menu is selected and the 1523
Thermometer readout is selected on the Select Model dialog, the 1523 Down
load Options dialog is displayed.
-
50
Figure 29 1523 Download Options dialog
Page 63

3 Downloading logged data
Download options dialogs
The demand log stores up to 25 readings. For more details on the demand log,
see the 1523 User’s Guide.
The Readings section allows the readings to be downloaded to be specified.
Selecting the Download all readings from log option indicates that all of the
readings in the selected log should be downloaded.
Selecting the Download only reading for this index option allows only the read
ing at the selected index (1 to 25) to be downloaded. If this option is selected,
use the drop-down list to select the appropriate index of the reading to
download.
Select the resolution to use to format the readings when they are written to the
download file. This value can be set between 0 and 3 digits (places after deci
-
mal point).
Select the method to use when writing the downloaded readings to a file using
the options in the Files section.
Selecting the Write all readings into a single file option causes all of the down
loaded readings to be written to one file.
Selecting the Separate readings by index option causes one file to be created for
each index for which there is a reading available. Each file will contain a single
reading.
If the Prompt to enter filename(s) check box is checked, a prompt is displayed
after the data is downloaded for each file that needs to be created, depending on
the other selections above. If this option is not checked, the default filenames
are used.
After selecting the appropriate options on this dialog, click the Download button to start the download process. For more details on the download process,
please refer to Section 8, Download Process.
To close this dialog, click the Close button.
Click the Help button to display the appropriate help topic for this dialog.
-
-
3.3.2 1524 Handheld download options dialog
The Model 1524 Handheld Thermometer readout can store readings in any of
two logs: demand log and auto log. LogWar e can download the readings from
these logs and write the readings into download files. For more information on
download files, please refer to Section 7.2.2, Download File. When the Down
load Logged Data option in the Download menu is selected and the 1524
-
51
Page 64

User’s Guide
Thermometer readout is selected on the Select Model dialog, the 1524 Down
load Options dialog is displayed.
-
52
Figure 30 1524 Download Options dialog
The Select log to download section allows the log to be specified. The 1524
Handheld Thermometer readout has two logs: demand log and auto log. The
demand log stores up to 25 readings while the auto log stores up to 15,000
readings. For more details on the demand and auto logs, see the 1524 User’s
Guide.
The Readings section allows the readings to be downloaded to be specified.
Selecting the Download all readings from log option indicates that all of the
readings in the selected log should be downloaded.
Selecting the Download only readings with this label option allows only read
ings that are assigned the label indicated below to be downloaded from the se
lected log. If this option is selected, a list of current labels is read in from the
thermometer readout. Use the drop-down list to select the appropriate label.
-
-
Page 65

3 Downloading logged data
Download options dialogs
Select the resolution to use to format the readings when they are written to the
download file. This value can be set between 0 and 3 digits (places after deci
-
mal point).
Select the method to use when writing the downloaded readings to a file using
the options in the Files section.
Selecting the Write all readings into a single file option causes all of the down
loaded readings to be written to one file.
Selecting the Separate readings by channel option causes all of the downloaded
readings to be separated according to the channel that each reading was taken
from and written into separate files.
If the Prompt to enter filename(s) check box is checked, a prompt is displayed
after the data is downloaded for each file that needs to be created, depending on
the other selections above. If this option is not checked, the default filenames
are used.
After selecting the appropriate options on this dialog, click the Download but
ton to start the download process. For more details on the download process,
please refer to Section 8, Download Process.
To close this dialog, click the Close button.
Click the Help button to display the appropriate help topic for this dialog.
-
3.3.3 1529 Chub-E4 download options dialog
The Model 1529 Chub-E4 Thermometer readout (including models 1529,
1529-R and 1529-T) can store readings in any of two logs: demand log and
auto log. LogWa re can download the readings from these logs and write the
readings into download files. For more information on download files, please
refer to Section 7.2.2, Download File. When the Download Logged Data option
in the Download menu is selected and the 1529 thermometer readout is selected
on the Select Model dialog, the 1529 Chub-E4 Download Options dialog is dis
played (Figure 31).
The Select log to download section allows the log to be specified. The 1529
Chub-E4 Thermometer readout has two logs: demand log and auto log. The de
mand log stores up to 100 readings while the auto log stores up to 8,160 read
ings. For more details on the demand and auto logs, see the 1529 Chub-E4
Thermometer readout User's Guide.
The Readings section allows the number of readings to be downloaded to be
specified.
Selecting the Download all readings from log option indicates that all of the
readings in the selected log should be downloaded.
Selecting the Download only readings with this label option allows only read
ings that are assigned the label indicated below to be downloaded from the se
lected log. If this option is selected, a list of current labels is read in from the
thermometer readout. Use the drop-down list to select the appropriate label.
-
-
-
-
-
53
Page 66

User’s Guide
Enter the resolution to use to format the readings when they are written to the
download file in the Resolution box. This value can be set between 0 and 4 dig
its (places after decimal point).
Select the method to use when writing the downloaded readings to a file using
the options in the Files section.
Selecting the Write all readings into a single file option causes all of the down
loaded readings to be written to one file.
-
-
54
Figure 31 1529 Chub-E4 Download Options dialog
Selecting the Separate readings by channel option causes all of the downloaded
readings to be separated according to the channel that each reading was taken
from and written into separate files.
If the Prompt to enter filename(s) check box is checked, a prompt is displayed
after the data is downloaded for each file that needs to be created, depending on
the other selections above. If this option is not checked, the default filenames
are used.
After selecting the appropriate options on this dialog, click the Download but
ton to start the download process. For more details on the download process,
please refer to Section 8, Download Process.
Page 67

3 Downloading logged data
Download options dialogs
To close this dialog, click the Close button.
Click the Help button to display the appropriate help topic for this dialog.
3.3.4 1560 Black Stack download options dialog
The Model 1560 Black Stack Thermometer readout stores the values of up to
the last 1,000 readings taken in the thermometer readout’s memory, and is re
ferredtobyLogWar e as the history log. LogWa re can download the readings
from the history log and write the readings into download files. For more infor
mation on download files, please refer to Section 7.2.2, Download File. When
the Download Logged Data option in the Download menu is selected and the
1560 Black Stack Thermometer readout is selected on the Select Model dialog,
the 1560 Black Stack Download Options dialog is displayed.
-
-
Figure 32 1560 Black Stack Download Options dialog
The Select communication device setting determines the device (serial port) to
which the readings will be downloaded.
•
Use base serial port - Select this option if the serial cable is connected to
the serial port on the base unit of the 1560 (immediately behind the dis
-
play).
•
Use communication module serial port - Select this option if the serial
cable is connected to the serial port on the Model 3560 Communication
Module.
55
Page 68

User’s Guide
The Readings section allows the number of readings to be downloaded to be
specified. The history log can contain up to 1,000 readings.
Note: The actual number of readings in the history log depends on the
number of channels on the thermometer readout. Typically, the history log
can hold 1,000 readings as long as there are not more than 63 total input
channels on the thermometer readout. For every channel over 63, the num
-
ber of readings that the history log can hold decreases by approximately
16.
Selecting the Download all readings from history log option indicates that the
entire history log should be downloaded.
Selecting the Download last n readings from history log option allows a spe
cific number of readings to be downloaded from the history log. If this option
is selected, enter the number of readings to download in the readings box. This
value can be set between 1 and the total number of readings in the history log.
Enter the resolution to use to format the readings when they are written to the
download file in the Resolution box. This value can be set between 0 and 12
digits (places after decimal point).
Select the method to use when writing the downloaded readings to a file using
the options in the Files section.
Selecting the Write all readings into a single file option causes all of the downloaded readings to be written to one file.
Selecting the Separate readings by channel option causes all of the downloaded
readings to be separated according to the channel that each reading was taken
from and written into separate files.
If the Prompt to enter filename(s) check box is checked, a prompt is displayed
after the data is downloaded for each file that needs to be created, depending on
the other selections above. If this option is not checked, the default filenames
are used.
56
Note: When downloading data from the 1560, the measurement process in
the thermometer readout is halted until downloading is complete!
After selecting the appropriate options on this dialog, click the Download but
ton to start the download process. For more details on the download process,
please refer to Section 8, Download Process.
To close this dialog, click the Close button.
Click the Help button to display the appropriate help topic for this dialog.
-
Page 69

3 Downloading logged data
Download options dialogs
3.3.5 1575A Super-Thermometer download options dialog
The Model 1575A Super-Thermometer readout can store readings in any of
two logs: history log and memory log. LogWa re can download the readings
from these logs and write the readings into download files. For more informa
tion on download files, please refer to Section 7.2.2, Download File. When the
Download Logged Data option in the Download menu is selected and the
1575A Super-Thermometer readout is selected on the Select Model dialog, the
1575A Super-Thermometer Download Options dialog is displayed.
-
Figure 33 1575A ‘Super Thermometer’ Download Options dialog
The Select log to download section allows the log to be specified. The 1575A
Super-Thermometer readout has two logs: history log and memory log. The
history log stores the most recent 100 readings taken by the thermometer read
out. The memory log can be used to store up to 100 readings manually. For
more details on the history and memory logs, see the 1575A Super-Thermome
ter readout User’s Guide.
The Readings section allows the number of readings to be downloaded to be
specified.
Selecting the Download all readings from log option indicates that all of the
readings in the selected log should be downloaded.
Selecting the Download last n readings from log option allows a specific num
ber of readings to be downloaded from the selected log. If this option is se
-
-
-
-
57
Page 70

User’s Guide
lected, enter the number of readings to download in the readings box. This
value can be set between 1 and 100.
Note: It is not possible for LogWare to determine exactly how many read
ings are currently stored in the memory log. Therefore, memory locations
that do not have a value stored in them always return a value of 0 °C.
Enter the resolution to use to format the readings when they are written to the
download file in the Resolution box. This value can be set between 0 and 8 dig
its (places after decimal point).
Select the options regarding the file to create in the Files section.
If the Prompt to enter filename check box is checked, a prompt is displayed af
ter the data is downloaded for the file that needs to be created. If this option is
not checked, the default filename is used.
After selecting the appropriate options on this dialog, click the Download but
ton to start the download process. For more details on the download process,
please refer to Section 8, Download Process.
To close this dialog, click the Close button.
Click the Help button to display the appropriate help topic for this dialog.
3.3.6 1590 Super-Thermometer II download options
The Model 1590 Super-Thermometer II readout can store readings in any of
two logs: history log and memory log. LogWa re can download the readings
from these logs and write the readings into download files. For more information on download files, please refer to Section 7.2.2, Download File. When the
Download Logged Data option in the Download menu is selected and the 1590
Super-Thermometer II readout is selected on the Select Model dialog, the 1590
Super-Thermometer II Download Options dialog is displayed (Figure 34).
The Select log to download section allows the log to be specified. The 1590
Super-Thermometer II readout has two logs: history log and memory log. The
history log stores the most recent 100 readings taken by the thermometer read
out. The memory log can be used to store up to 100 readings manually. For
more details on the history and memory logs, see the 1590 Super-Thermometer
II readout User’s Guide.
The Readings section allows the number of readings to be downloaded to be
specified.
Selecting the Download all readings from log option indicates that all of the
readings in the selected log should be downloaded.
Selecting the Download last n readings from log option allows a specific num
ber of readings to be downloaded from the selected log. If this option is se
lected, enter the number of readings to download in the readings box. This
value can be set between 1 and 100.
-
-
-
-
-
-
-
58
Page 71

3 Downloading logged data
Download options dialogs
Note: It is not possible for LogWare to determine exactly how many read
ings are currently stored in the memory log. Therefore, memory locations
that do not have a value stored in them always return a value of 0 °C.
Enter the resolution to use to format the readings when they are written to the
download file in the Resolution box. This value can be set between 0 and 8 dig
its (places after decimal point).
-
Figure 34 1590 Super-Thermometer II Download Options dialog
Select the options regarding the file to create in the Files section.
If the Prompt to enter filename check box is checked, a prompt is displayed af
ter the data is downloaded for the file that needs to be created. If this option is
not checked, the default filename is used.
After selecting the appropriate options on this dialog, click the Download but
ton to start the download process. For more details on the download process,
please refer to Section 8, Download Process.
To close this dialog, click the Close button.
Click the Help button to display the appropriate help topic for this dialog.
-
-
59
Page 72

User’s Guide
3.4 Log status dialogs
LogWare provides a tool to view the status of the thermometer readout’s mem
ory or logs. This tool is accessible by selecting the Log Status option in the
Download menu. The only thermometer readouts supported by LogWar e that
have this feature are the 1529 Chub-E4 Thermometer readout and the 1560
Black Stack Thermometer readout. The following section describes the dialogs
for viewing the log status for each supported thermometer readout.
3.4.1 1523 Handheld log status dialog
The Model 1523 Handheld Thermometer readout can store readings in a log,
called the demand log. LogWare can display the current status of this log and
provides a way to clear all readings from the log. When the Log Status option
in the Download menu is selected and the 1523 Thermometer readout is se
lected on the Select Model dialog, the 1523 Log Status dialog is displayed.
-
-
60
Figure 35 1523 Log Status dialog
The Demand log progress bar indicates the current state of the demand log. The
demand log in the 1523 Handheld Thermometer readout holds up to 25
readings.
To clear all readings from the demand log, click the Clear Demand Log button.
To refresh the log status information on this dialog, click the Refresh button.
The log status is read in from the thermometer readout again and the dialog is
updated.
To close this dialog, click the Close button.
Click the Help button to display the appropriate help topic for this dialog.
Page 73

3.4.2 1524 Handheld log status dialog
The Model 1524 Handheld Thermometer readout can store readings in any of
two logs: demand log and auto log. LogWare can display the current status of
these logs and provides a way to clear all readings from these logs. When the
Log Status option in the Download menu is selected and the 1524 Thermome
ter readout is selected on the Select Model dialog, the 1524 Log Status dialog is
displayed.
3 Downloading logged data
Log status dialogs
-
Figure 36 1524 Log Status dialog
The Demand log progress bar indicates the current state of the demand log. The
demand log in the 1524 Handheld Thermometer readout holds up to 25
readings.
To clear all readings from the demand log, click the Clear Demand Log button.
The Auto log progress bar indicates the current state of the auto log. The auto
log in the 1524 Handheld Thermometer readout holds up to 15,000 readings.
To clear all readings from the auto log, click the Clear Auto Log button.
To refresh the log status information on this dialog, click the Refresh button.
The log status is read in from the thermometer readout again and the dialog is
updated.
To close this dialog, click the Close button.
Click the Help button to display the appropriate help topic for this dialog.
61
Page 74

User’s Guide
3.4.3 1529 Chub-E4 log status dialog
The Model 1529 Chub-E4 Thermometer readout (including models 1529,
1529-R and 1529-T) can store readings in any of two logs: demand log and
auto log. LogWa re can display the current status of these logs and provides a
way to clear all readings from these logs. When the Log Status option in the
Download menu is selected and the 1529 Chub-E4 Thermometer readout is se
lected on the Select Model dialog, the 1529 Chub-E4 Log Status dialog is dis
played.
-
-
62
Figure 37 1529 Chub-E4 Log Status dialog
The Demand log progress bar indicates the current status of the demand log.
The demand log in the 1529 Chub-E4 Thermometer readout can hold up to 100
readings.
To clear all readings from the demand log, click the Clear Demand Log button.
The Auto log progress bar indicates the current state of the auto log. The auto
log in the 1529 Chub-E4 Thermometer readout can hold up to 8,160 readings.
To clear all readings from the auto log, click the Clear Auto Log button.
To refresh the log status information on this dialog, click the Refresh button.
The log status is read in from the thermometer readout again and the dialog is
updated.
To close this dialog, click the Close button.
Click the Help button to display the appropriate help topic for this dialog.
3.4.4 1560 Black Stack log status dialog
The Model 1560 Black Stack Thermometer readout stores the values of up to
the last 1,000 readings taken in the thermometer’s memory, and is referred to
by LogWare as the history log. LogWa re can display the current status of the
Page 75

3 Downloading logged data
Log status dialogs
history log. When the Log Status option in the Download menu is selected and
the 1560 Black Stack Thermometer readout is selected on the Select Model dia
log, the 1560 Black Stack Log Status dialog is displayed.
Figure 38 1560 Black Stack Log Status dialog
The history log progress bar indicates the current state of the history log. The
history log in the 1560 Black Stack Thermometer readout stores the values of
up to the last 1,000 readings taken. The history log of the 1560 Black Stack
Thermometer readout will nearly always indicate 100% full. It is not possible
for LogWare to clear the history log.
-
Note: The actual number of readings in the history log depends on the
number of channels on the thermometer readout. Typically, the history log
can hold 1,000 readings as long as there are not more than 63 total input
channels on the thermometer readout. For every channel over 63, the number of readings that the history log can hold decreases by approximately
16.
To refresh the log status information on this dialog, click the Refresh button.
The log status is read in from the thermometer readout again and the dialog is
updated.
To close this dialog, click the Close button.
Click the Help button to display the appropriate help topic for this dialog.
63
Page 76

4 Tools
LogWare provides tools to synchronize the thermometer readout’s clock,
view/modify logging labels and view/modify various thermometer readout set
tings including filtering, sampling, measurement, calibration, module, channel
and probe settings. These tools are accessible by selecting options in the Tools
menu. The following sections describe the dialogs for these tools for each of
the thermometer readouts supported by LogWare .
4.1 Tools menu
The Tools menu contains options for synchronizing the thermometer readout’s
clock, viewing/modifying logging labels and viewing/modifying thermometer
readout settings.
Figure 39 Tools menu
4 Tools
Tools menu
-
4.1.1 Synchronize date/time
The Synchronize Date/Time option can be used to synchronize the thermometer
readout’s clock to the computer’s clock. All thermometer readouts supported by
LogWare support this feature.
When selecting the Synchronize Date/Time option, the Select Model dialog is
displayed. LogWare needs to know the model of the thermometer readout in or
der to send the proper commands to synchronize the thermometer readout’s
clock. Please refer to Section 4.2, Select Model Dialog, for more details on the
Select Model dialog.
After the thermometer readout model and communication settings have been
selected, the appropriate commands are sent to the thermometer readout to up
date its date and time settings (as applicable to the selected thermometer read
out). After the commands have been sent, a message is displayed indicating
that the thermometer readout’s clock has been updated.
Note: Before synchronizing the thermometer readout’s clock, make sure
the computer’s clock is accurate. Use the Windows® Control Panel to ad
just the date and time as necessary.
-
-
-
-
65
Page 77

User’s Guide
4.1.2 Logging labels
4.1.3 Thermometer settings
Note: The thermometer readout's display may not immediately reflect the
updated time.
The Logging Labels option can be used to view and/or modify the labels that
the thermometer readout assigns to readings that are stored in the thermometer
readout’s log(s). This feature is only supported by the 1529 Chub-E4 Ther
mometer readout.
When selecting the Logging Labels option, the Select Model dialog is dis
played. LogWare needs to know the model of the thermometer readout. Please
refer to Section 4.2, Select Model Dialog, for more details on the Select Model
dialog.
After the thermometer readout model and communication settings have been
selected, the Logging Labels dialog for the selected thermometer readout is dis
played. The Logging Labels dialog is described in more detail in Section 4.3,
Logging Labels Dialogs.
The Thermometer Settings option can be used to view and/or modify many
thermometer readout, module, and probe settings including filtering, sampling,
measurement, calibration, and conversion settings. All thermometer readouts
supported by LogWare support this feature. Please refer to Section 1.4.4, Firmware Requirements, for more information.
When selecting the Thermometer Settings option, the Select Model dialog is
displayed. LogWare needs to know the model of the thermometer readout in order to display the appropriate thermometer readout settings dialogs. Please re
fer to Section 4.2, Select Model Dialog, for more details on the Select Model
dialog.
After the thermometer readout model and communication settings have been
selected, the appropriate Thermometer Settings dialog for the selected ther
mometer readout is displayed. The Thermometer Settings dialogs are described
in more detail in Section 4.4, Thermometer Settings Dialogs.
-
-
-
-
-
66
Warning: When using the Thermometer Settings tool, make sure that the
thermometer readout is not currently in any menu. Using the thermometer
readout's menus while using the Thermometer Settings tool may cause the
thermometer readout to fail to accept new settings.
Page 78

4.2 Select Model dialog
Select Model dialog
4 Tools
When any of the Tools menu options is selected, the Select Model dialog is dis
played. LogWare needs to know the model of the thermometer readout to inter
face with.
Figure 40 Select Model dialog
If this dialog has been used previously to select a thermometer readout model
and communication settings, the previous settings are restored.
Use the Model drop-down list to select the type of thermometer readout being
used. All other controls on this dialog are disabled until a model is selected.
The list of available thermometer readouts depends on the Tools menu option
selected. Only thermometer readouts that support the selected feature are listed.
Select the COM port on the computer to which the thermometer readout is con
nected using the COM port drop-down list. Only COM ports that the operating
system reports as being available can be used. The following symbols are used
to show the status of each COM port:
-
-
-
•
•
•
cation.
•
•
LogWa re.
- Indicates a COM port that is currently available.
- Indicates the COM port that is currently selected by LogWa re .
- Indicates a COM port that is currently being used by another appli
- Indicates an IR port (virtual COM port) that is currently available.
- Indicates an IR port (virtual COM port) that is currently selected by
-
67
Page 79

User’s Guide
•
- Indicates an IR port (virtual COM port) that is currently being used
by another application.
Select the baud rate that the computer should use to communicate over the
COM port with the thermometer readout using the Baud rate drop-down list.
The baud rate setting of the thermometer readout must be set to the same value
as this setting. For best results, use the maximum allowable baud rate setting
when possible.
Check the Use IR dongle option to use the thermometer readout’s IR port in
stead of an RS-232 cable. This option is only enabled when the selected ther
-
mometer readout has an IR port and the selected feature allows using the IR
port to communicate with the thermometer readout. For more information on
using the IR dongle, please refer to Section 6.13, Using an IR Dongle with
LogWare .
After the model, COM port, baud rate and/or IR settings are configured, click
the Test Communication button to make sure communication with the ther
mometer readout is successful. At this time, the thermometer readout must be
connected to the COM port on the computer using a null modem cable or, if the
IR dongle is being used, the IR dongle must be connected to the selected COM
port and the dongle must be aligned with the thermometer readout’s IR port.
For more information, please refer to the thermometer readout’s User’s Guide.
When testing communication with the thermometer readout, there are three
possible results:
• The thermometer readout is communicating at the correct baud rate on the
selected COM port.
• The thermometer readout is communicating, but possibly at the wrong
baud rate or the thermometer readout model does not match the selected
model.
68
•
The thermometer readout failed to communicate at all. Check the COM
port and baud rate settings, make sure the cable is a null modem cable,
and make sure the thermometer readout is plugged in and turned on. If us
ing the IR dongle, make sure the dongle is connected to the selected COM
port and the dongle is aligned properly with the thermometer readout’s IR
port.
After all of the settings on this dialog are configured and communication with
the thermometer readout is successful, click the OK button to accept the set
-
tings and continue.
Click the Cancel button close this dialog and abort using the selected feature.
Click the Help button to display the appropriate help topic for this dialog.
-
Page 80

4.3 Logging labels dialogs
LogWare provides a tool to view and/or modify the labels that the thermometer
readout assigns to readings that are stored in the thermometer readout’s log(s).
This tool is accessible by selecting the Logging Labels option in the Tools
menu. The following sections describe the dialogs for each of the thermometer
readouts that support this feature.
4.3.1 1523 Handheld logging label dialog
The Model 1523 Handheld Thermometer readout can store readings into a log,
called the demand log. When readings are stored in the log, a label can be as
signed to each reading to indicate the reason, purpose or to otherwise identify
the reading(s). LogWare provides a tool that can be used to view and/or modify
the current logging label. When the Logging Labels option in the Tools menu is
selected and the 1523 Thermometer readout is selected on the Select Model di
alog, the 1523 Logging Label dialog is displayed.
Logging labels dialogs
4 Tools
-
-
Figure 41 1523 Logging Label dialog
When the 1523 Logging Label dialog is displayed, the current label name is
read in from the thermometer readout.
The 1523 Handheld Thermometer readout has a single logging label for the de
mand log. The Label name box indicates the current name for this label. Enter
the new name for the demand log label.
After the label has been modified as needed, click the OK button to write the
new label name to the thermometer readout. A progress dialog is displayed
while the new label name is being written to the thermometer readout.
If the label was not modified, or to close this dialog without writing the new la
bel name to the thermometer readout, click the Close button.
Click the Help button to display the appropriate help topic for this dialog.
-
-
69
Page 81

User’s Guide
4.3.2 1524 Handheld logging labels dialog
The Model 1524 Handheld Thermometer readout can store readings into logs.
When readings are stored in a log, a label can be assigned to each reading or set
of readings to indicate the reason, purpose or to otherwise identify the read
ing(s). LogWare provides a tool that can be used to view and/or modify the cur
rent logging label settings. When the Logging Labels option in the Tools menu
is selected and the 1524 Thermometer readout is selected on the Select Model
dialog, the 1524 Logging Labels dialog is displayed.
-
70
Figure 42 1524 Logging Labels dialog
When the 1524 Logging Labels dialog is displayed, all of the current label
names are read in from the thermometer readout. The label used for the demand
log is displayed in the 1524 Demand Log Label section. The labels used for the
auto log are displayed in the 1524 Auto Log Labels section.
The 1524 Handheld Thermometer readout has a single logging label for the de
mand log. The Label name box indicates the current name for this label. Enter
the new name for the demand log label.
The Labels list in the 1524 Auto Log Labels section indicates the current
names of all auto log labels. The 1524 Handheld Thermometer readout has 25
logging labels for the auto log.
To modify any of one of the labels, click on the appropriate label in the Labels
list. The Label name box indicates the name of the label that is currently se
lected. Enter the new name for the selected label and press the Enter key or
click the Apply —> button. The Labels list is updated to reflect the change. If
-
Page 82

Logging labels dialogs
4 Tools
the Enter key was pressed, the next label in the list will automatically be se
lected and the name of the next label can be entered in the Label name box.
Repeat this process for all labels that need to be modified.
To reset all labels to their default names, click the Reset All button. The Labels
list is updated to show the default names for all labels.
The 1524 Handheld Thermometer readout has a single logging label for the de
mand log. The Demand Log Label box indicates the current name for this label.
Enter the new name for the demand log label.
After all labels have been modified as needed, click the OK button to write the
new label names to the thermometer readout. A progress dialog is displayed
while the new label names are being written to the thermometer readout.
If no labels were modified, or to close this dialog without writing the new label
names to the thermometer readout, click the Close button.
Click the Help button to display the appropriate help topic for this dialog.
4.3.3 1529 Chub-E4 logging labels
The Model 1529 Chub-E4 Thermometer readout (including models 1529,
1529-R and 1529-T) can store readings into logs. When readings are stored in a
log, a label can be assigned to each reading or set of readings to indicate the
reason, purpose or to otherwise identify the reading(s). LogWar e provides a
tool that can be used to view and/or modify the current logging label settings.
When the Logging Labels option in the Tools menu is selected and the 1529
Chub-E4 Thermometer readout is selected on the Select Model dialog, the 1529
Chub-E4 Logging Labels dialog is displayed.
-
-
Figure 43 1529 Chub-E4 Logging Labels dialog
When the Logging Labels dialog is displayed, the current logging labels are
read in from the thermometer readout. The Labels list indicates the current log
ging labels. The 1529 Chub-E4 Thermometer readout has 25 logging labels.
-
71
Page 83

User’s Guide
4.4 Thermometer settings dialogs
To modify any of one of the labels, click on the appropriate label in the Labels
list. The Label name box indicates the name of the label that is currently se
lected. Enter the new name for the selected label and press the Enter key or
click the Apply --> button. The Labels list is updated to reflect the change. If
the Enter key was pressed, the next label in the list will automatically be se
lected and the name of the next label can be entered in the Label name box.
Repeat this process for all labels that need to be modified.
To reset all labels to their default names, click the Reset All button. The Labels
list is updated to show the default names for all labels.
After all labels have been modified as needed, click the OK button to write the
new label names to the thermometer readout. A progress dialog is displayed
while the new label names are being written to the thermometer readout.
If no labels were modified, or to close this dialog without writing the new label
names to the thermometer readout, click the Close button.
Click the Help button to display the appropriate help topic for this dialog.
LogWare provides tools to view and/or modify various thermometer readout
settings including filtering, sampling, measurement, calibration, module, channel, and probe settings. These tools are accessible by selecting the Thermometer Settings option in the Tools menu. The following sections describe the
dialogs for each of the thermometer readouts that support this feature.
-
-
72
4.4.1 1523/1524 Handheld Settings
The 1523/1524 Settings dialog displays information about the thermometer
readout including model number, serial number, identification information and
Page 84

Thermometer settings dialogs
4 Tools
the total number of channels. It also allows many thermometer readout settings
to be viewed and modified.
Figure 44 1523/1524 Settings dialog
The 1523/1524 Handheld Thermometer readout must be connected to an available COM port and the communication settings must be properly configured so
that this information can be read in from the thermometer readout. If communi
cation with the thermometer readout is not successful, an error message is dis
-
played and this dialog is blank.
The Model box indicates the model number of the thermometer readout. The
Serial box indicates the serial number assigned to this thermometer readout.
The Identification box indicates the manufacturer name, model number, serial
number and firmware version installed in this thermometer readout. The Chan
nels box indicates the total number of input channels on this thermometer
readout.
The sampling settings can be viewed and modified by selecting the Sampling
tab. The Channels tab displays a list of channels and allows access to channel
and probe settings dialogs. The thermometer readout’s calibration settings can
be viewed and modified by selecting the Calibration tab. Other settings can be
viewed and modified by selecting the Misc tab.
Some of the settings on the 1523/1524 Settings dialog may be passcode pro
tected. If they are, a message appears at the bottom of the dialog and the Edit
button is displayed. The controls for the passcode protected settings are dis
-
73
-
-
Page 85

User’s Guide
4.4.1.1 Sampling tab
abled. To edit the protected settings, click the Edit button and enter the currentabled. To edit the protected settings, click the Edit button and enter the current
passcode for the thermometer readout. If the correct passcode is entered, the
controls are enabled and the values may be changed. The controls remain en
abled until this dialog is closed or until the current changes are applied by
clicking the Apply button.
After modifying any of the settings on this dialog, click the Apply or OK but
ton to write the new settings to the thermometer readout. If the Apply button is
clicked, this dialog remains open. If the OK button is clicked, this dialog closes
after writing the settings.
LogWare has a feature that causes all of the thermometer readout settings to be
read back in from the thermometer readout after the Apply button is clicked
and the new settings have been written to the thermometer readout. This feature
can be useful to verify that the desired settings were properly applied to the
thermometer readout. To enable or disable this feature, see Section 5.6.4,
Options.
To close this dialog without writing the settings to the thermometer readout,
click the Cancel button.
Click the Help button to open the appropriate help topic for this dialog.
Select the Sampling tab to view and/or modify sampling settings.
74
Figure 45 1523/1524 Settings – Sampling tab
Select the units to use when displaying readings in temperature using the Units
drop-down list. Temperature readings can be displayed in either °C or °F. This
setting applies to all channels that are configured to display readings in
temperature.
Page 86

Select the Channels tab to view a list of channels and to access the channel and
probe settings dialogs to view and/or modify channel and probe specific
settings.
4.4.1.2 Channels tab
Select the channel to view or modify from the Channels list. This list indicates
the channel number, channel type and the serial number of the probe on each
channel.
Thermometer settings dialogs
4 Tools
Figure 46 1523/1524 Settings – Channels tab
Click the Channel Settings button to display the appropriate channel settings dialog. When this button is clicked, the settings for the selected channel and
probe are read in from the thermometer readout.
75
Page 87

User’s Guide
4.4.1.3 Calibration tab
Select the Calibration tab to view and/or modify the thermometer readout’s cal
ibration settings.
Figure 47 1523/1524 Settings – Calibration tab
-
CAUTION!! DO NOT CHANGE THESE VALUES UNLESS THIS READ-
OUT HAS BEEN RECALIBRATED OR UNLESS THESE VALUES DO
NOT MATCH THE VALUES LOCATED ON THE LATEST REPORT OF
CALIBRATION! CHANGING THESE VALUES VOIDS THE CURRENT
CALIBRATION!
Select the date this readout was last calibrated using the drop-down calendar or
by entering the date. This date should be located on the Report of Calibration.
Enter the reference and offset values for each calibration range in the grid. The
calibration ranges are indicated in the first row of the grid. Each calibration
range can have up to 4 adjustment pairs consisting of a reference and an offset
value. Reference and offset values for unused adjustment pairs must be left
blank. These values can be found on the Report of Calibration for the readout
only if this readout received an accredited calibration.
76
Page 88

4.4.1.4 Misc tab
Select the Misc tab to view and/or modify other miscellaneous thermometer
readout settings.
Figure 48 1523/1524 Settings – Misc tab
Thermometer settings dialogs
4 Tools
The Enable automatic power off setting determines whether the thermometer
readout will automatically shut itself off after a specific amount of time. By
checking this option, the time period is set to 30 minutes.
The Disable serial communication setting determines whether the serial port of
the thermometer readout is enabled. Disabling the serial port increases battery
life. If the serial port is disabled, it can only be re-enabled using the thermome
ter readout’s SETUP menu.
-
77
Page 89

User’s Guide
4.4.1.5 1523/1524 PRT/thermistor channel settings dialog
The 1523/1524 PRT/Thermistor Channel Settings dialog displays information
about the selected channel.
78
Figure 49 1523/1524 PRT/Thermistor Channel Settings dialog
Some or all of the settings on this dialog may be passcode protected. If so, a
message appears at the bottom of the Probe tab and the Edit button is dis
played. The protected controls are disabled. To edit the protected settings, click
the Edit button and enter the current passcode for the thermometer readout. If
the correct passcode is entered, the protected controls are enabled and the val
ues may be changed. The controls remain enabled until this dialog is closed or
until the current changes are applied by clicking the Apply button.
After modifying any of the settings on this dialog, click the Apply or OK but
ton to write the new settings to the thermometer readout. If the Apply button is
clicked, this dialog remains open. If the OK button is clicked, this dialog closes
after writing the settings.
LogWare has a feature that causes all of the channel settings to be read back in
from the thermometer readout after the Apply button is clicked and the new set
tings have been written to the thermometer readout. This feature can be useful
to verify that the desired settings were properly applied to the thermometer
readout. To enable or disable this feature, see Section 5.6.4, Options.
To close this dialog without writing the channel settings to the thermometer
readout, click the Cancel button.
-
Page 90

Click the Help button to open the appropriate help topic for this dialog.
4.4.1.5.1 Probe tab
Select the Probe tab to view and/or modify probe settings.
Thermometer settings dialogs
4 Tools
Figure 50 1523/1524 PRT/Thermistor Channel Settings – Probe tab
Enter the serial number of the probe attached to this channel in the probe serial
number box. The serial number can be any combination of numbers and/or let
ters up to 8 characters in length. The underscore “_“ character can also be used
in serial numbers.Select the date this probe was last calibrated using the
drop-down calendar or by entering the date. This date should be located on the
Report of Calibration for the probe.
Select the appropriate probe type for this probe using the Probe Type
drop-down list. The choices are PRT or Thermistor.
Select the conversion type to use for the probe on this channel. The conversion
types available in the drop-down list are dependent on the Probe Type selection.
For PRT probe types, the available conversion types are:
•
ITS-90
•
ITS-90 Subrange 5
•
PT100
•
Callendar-Van Dusen
•
Ohms
79
Page 91

User’s Guide
4.4.1.5.2 Misc tab
For Thermistor probe types, the available conversion types are:
R(T)
•
Ohms
•
Refer to the Report of Calibration for the probe for information on the conver
sion type that the probe was calibrated for.
If the selected conversion type requires coefficients or other settings, the Con
version Settings button is enabled. Click the Conversion Settings button to dis
play the dialog for the selected conversion type. Otherwise, the Conversion
Settings button is disabled.
Note: The conversion settings are not written to the thermometer readout
until the Apply or OK button is clicked on this dialog!
Select the Misc tab to view and/or modify other probe settings.
-
-
-
80
Figure 51 1523/1524 PRT/Thermistor Channel Settings – Misc tab
Select the resolution for the readings for this probe using the Resolution
drop-down list. The resolution can be set to any value between 0 and 3, or
Auto.
Page 92

Thermometer settings dialogs
Enter the minimum operating temperature for this probe in the MINOP box. If
the temperature measured by the thermometer readout is less than this setting,
the display indicates an overload condition (OL).
Enter the maximum operating temperature for this probe in the MAXOP box. If
the temperature measured by the thermometer readout is greater than this set
ting, the display indicates an overload condition (OL).
To exclusively lock the connected probe to this channel, check the Exclusively
lock probe to channel checkbox. Locking a probe to a channel prevents any
other probe from being used on this channel, and also prevents this probe from
being used on any other channel, including channels of other thermometer
readouts.
4.4.1.6 1523/1524 thermocouple channel settings dialog
The Channel Settings dialog for thermocouple probes displays information
about the selected channel.
4 Tools
-
Figure 52 1523/1524 Thermocouple Channel Settings dialog
Some or all of the settings on this dialog may be passcode protected. If so, a
message appears at the bottom of the Probe tab and the Edit button is dis
played. The protected controls are disabled. To edit the protected settings, click
the Edit button and enter the current passcode for the thermometer readout. If
the correct passcode is entered, the protected controls are enabled and the val
ues may be changed. The controls remain enabled until this dialog is closed or
until the current changes are applied by clicking the Apply button.
After modifying any of the settings on this dialog, click the Apply or OK but
-
ton to write the new settings to the thermometer readout. If the Apply button is
81
Page 93

User’s Guide
4.4.1.6.1 Probe tab
clicked, this dialog remains open. If the OK button is clicked, this dialog closes
after writing the settings.
LogWare has a feature that causes all of the channel settings to be read back in
from the thermometer readout after the Apply button is clicked and the new set
tings have been written to the thermometer readout. This feature can be useful
to verify that the desired settings were properly applied to the thermometer
readout. To enable or disable this feature, see Section 5.6.4, Options.
To close this dialog without writing the channel settings to the thermometer
readout, click the Cancel button.
Click the Help button to open the appropriate help topic for this dialog.
Select the Probe tab to view and/or modify probe settings.
-
82
Figure 53 1523/1524 Thermocouple Channel Settings – Probe tab
Enter the serial number of the probe attached to this channel in the probe serial
number box. The serial number can be any combination of numbers and/or let
ters up to 8 characters in length. The underscore “_“ character can also be used
in serial numbers.Select the date this probe was last calibrated using the
drop-down calendar or by entering the date. This date should be located on the
Report of Calibration for the probe.
Select the appropriate probe type for this probe using the Probe Type
drop-down list. Currently, the only choice is TC.
-
Page 94

Thermometer settings dialogs
4 Tools
Select the conversion type to use for the probe on this channel. For TC probe
types, the available conversion types are:
Thermocouple Type
•
Volts
•
Refer to the Report of Calibration for the probe for information on the conver
-
sion type that the probe was calibrated for.
If the selected conversion type requires coefficients or other settings, the Con
version Settings button is enabled. Click the Conversion Settings button to dis
play the dialog for the selected conversion type. Otherwise, the Conversion
Settings button is disabled.
Note: The conversion settings are not written to the thermometer readout
until the Apply or OK button is clicked on this dialog!
Select the type of reference junction compensation to use on this channel using
the RJC type drop-down list. Available choices are Internal and External. If External is chosen as the RJC type, the external RJC temperature must be entered
in the RJC temperature box.
Enter the external RJC temperature value in the RJC temperature box. This box
is disabled if the RJC type is set to Internal.
-
Note: The RJC temperature value must always be in °C!
83
Page 95

User’s Guide
4.4.1.6.2 Misc tab
Select the Misc tab to view and/or modify other probe settings.
Figure 54 1523/1524 Thermocouple Channel Settings – Misc tab
84
Select the resolution for the readings for this probe using the Resolution
drop-down list. The resolution can be set to any value between 0 and 3, or
Auto.
Enter the minimum operating temperature for this probe in the MINOP box. If
the temperature measured by the thermometer readout is less than this setting,
the display indicates an overload condition (OL).
Enter the maximum operating temperature for this probe in the MAXOP box. If
the temperature measured by the thermometer readout is greater than this set
ting, the display indicates an overload condition (OL).
To exclusively lock the connected probe to this channel, check the Exclusively
lock probe to channel checkbox. Locking a probe to a channel prevents any
other probe from being used on this channel, and also prevents this probe from
being used on any other channel, including channels of other thermometer
readouts.
4.4.2 1529 Chub-E4 settings dialog
The 1529 Chub-E4 Settings dialog displays information about the thermometer
readout including model number, serial number, identification information, and
-
Page 96

Thermometer settings dialogs
4 Tools
the total number of channels. It also allows many thermometer readout settings
to be viewed and/or modified.
Figure 55 1529 Chub-E4 Settings dialog
The 1529 Chub-E4 must be connected to an available COM port or IR dongle
and the communication settings must be properly configured so that this information can be read in from the thermometer readout. If communication with
the thermometer readout is not successful, an error message is displayed and
this dialog is blank. A progress dialog is displayed while the current thermome
ter readout settings are being read in.
The Model box indicates the model number of the thermometer readout. The
Serial box indicates the serial number assigned to this thermometer readout.
The Identification box indicates the manufacturer name, model number, serial
number, and firmware version installed in this thermometer readout. The Chan
nels box indicates the total number of input channels on this thermometer
readout.
The filtering settings can be viewed and modified by selecting the Filtering tab.
The sampling settings can be viewed and modified by selecting the Sampling
tab. The measurement settings can be viewed and modified by selecting the
Measurement tab. The Channels tab displays a list of channels and allows ac
cess to channel and probe settings dialogs. The settings on each of these tabs
are described in detail in the following sections. For more details on these set
-
tings, please refer to the thermometer readout’s User's Guide.
Some of the settings on the 1529 Chub-E4 Settings dialog may be passcode
protected. If they are, a message appears at the bottom of the dialog and the
Edit button is displayed. The controls for the passcode protected settings are
-
-
85
Page 97

User’s Guide
disabled. To edit the protected settings, click the Edit button and enter the cur
rent passcode for the thermometer readout. If the correct passcode is entered,
the controls are enabled and the values may be changed. The controls remain
enabled until this dialog is closed or until the current changes are applied by
clicking the Apply button.
After modifying any of the settings on this dialog, click the Apply or OK but
ton to write the new settings to the thermometer readout. If the Apply button is
clicked, this dialog remains open. If the OK button is clicked, this dialog closes
after writing the settings.
LogWare has a feature that causes all of the thermometer readout settings to be
read back in from the thermometer readout after the Apply button is clicked
and the new settings have been written to the thermometer readout. This feature
can be useful to verify that the desired settings were properly applied to the
thermometer readout. To enable or disable this feature, see Section 5.6.4,
Options.
To close this dialog without writing the settings to the thermometer readout,
click the Cancel button.
Click the Help button to open the appropriate help topic for this dialog.
4.4.2.1 Filtering tab
Select the Filtering tab to view and/or modify the filter settings.
-
-
86
Figure 56 1529 Chub-E4 Settings - Filtering tab
The Moving average setting is sometimes also called a sliding window filter.
Enter the number of readings to average (size of window) in the box provided.
Setting this option to any value other than 1 causes the thermometer readout to
display the average of the last n readings on a specific channel as the current
reading for that channel. If the moving average is set to 1, the most recent mea
surement on each channel is displayed as the current reading. The moving aver
age can be set to any value between 1 and 10.
-
-
Page 98

4.4.2.2 Sampling tab
Select the Sampling tab to view and/or modify sampling settings.
Figure 57 1529 Chub-E4 Settings - Sampling tab
Select the units to use when displaying readings in temperature using the Units
drop-down list. Temperature readings can be displayed in either °C, °F or K.
This setting applies to all channels that are configured to display readings in
temperature.
Select the resolution for the readings using the Resolution drop-down list. The
resolution can be set to any value between 0 and 4, or Auto.
Select the time interval between subsequent measurements using the Sample interval drop-down list. The sample interval can be set to any one of the following settings:
Thermometer settings dialogs
4 Tools
• 0.1, 0.2 or 0.5 seconds
• 1, 2, 5, 10 or 30 seconds
•
1, 2, 5, 10 or 30 minutes
•
1 hour
Note: Setting the sample interval to 0.1 or 0.2 seconds causes the 1529 to
enter a special “fast” sampling mode. Please refer to the 1529 Chub-E4
User’s Guide for more information on using sample interval settings of
less than 0.5 seconds.
Select the decimal format character using the Decimal format drop-down list.
The 1529 Chub-E4 Thermometer readout supports using either the period (.) or
comma (,) as the decimal separator.
Select the date format using the Date format drop-down list. The 1529 Chub-E4
Thermometer readout supports displaying the date in one of four formats:
•
MM-DD-YY
•
MM-DD-YYYY
•
DD/MM/YY
87
Page 99

User’s Guide
4.4.2.3 Measurement tab
DD/MM/YYYY
•
Select the time format using the Time format drop-down list. The 1529
Chub-E4 Thermometer readout supports displaying the time in either 12-hour
or 24-hour format.
Checking the Stamp all measurements with date and time option causes the
1529 Chub-E4 Thermometer readout to always send date and time information
with the measurement when querying measurements using an RS-232, IR, or
IEEE interface.
Select the Measurement tab to view and/or modify measurement related set
-
tings.
88
Figure 58 1529 Chub-E4 Settings - Measurement
Ta b
Select the scan mode for the 1529 Chub-E4 Thermometer readout using the
Scan mode drop-down list. The scan mode can be set to one of the following
options:
•
Scan
•
Simultaneous
Select the channels that the thermometer readout should measure. Each channel
can be enabled or disabled by checking or unchecking the box next to the chan
nel number independent of all other channels.
To enable all channels, click the Enable All button. This causes the box next to
every channel to be checked.
To disable all channels, click the Disable All button. This causes the box next
to every channel to be unchecked.
4.4.2.4 Channels Tab
Select the Channels tab to view a list of channels and to access the channel and
-
Page 100

Thermometer settings dialogs
4 Tools
probe settings dialogs to view and/or modify channel and probe specific set
-
tings.
Figure 60 1529 Chub-E4 Settings - Channels tab
Select the channel to view and/or modify from the Channels list. This list indi
cates the channel number, channel type and the serial number of the probe on
each channel.
Click the Channel Settings button to display the appropriate Channel Settings
dialog. When this button is clicked, the settings for the selected channel and
probe are read in from the thermometer readout. The Channel Settings dialogs
are described in detail in Section 4.4.2.6, 1529 Chub-E4 PRT/Thermistor Channel Settings Dialog and Section 4.4.2.7, 1529 Chub-E4 Thermocouple Channel
Settings Dialog.
4.4.2.5 Misc tab
Select the Misc tab to view and/or modify other miscellaneous thermometer
readout settings.
Figure 59 1529 Chub-E4 Settings - Misc tab
The Battery indicator displays the remaining charge available in the battery.
Select the setting for the lamp on the thermometer readout’s display using the
Lamp drop-down list. The lamp can be set to one of the following settings:
•
Off
89
 Loading...