

Page 1
Transmitter Calibration
754
DOCUMENTING PROCESS CALIBRATOR
with the Fluke 750 Series
Documenting Process Calibrator
Application Note
The precision sourcing and measurement
capabilities of the rugged Fluke Documenting
Process Calibrator (DPC) make it an ideal choice
for the calibration of process instrumentation.
The following examples show how to address transmitter calibrations quickly and effectively using the
Fluke 753 or 754 Documenting Process Calibrators.
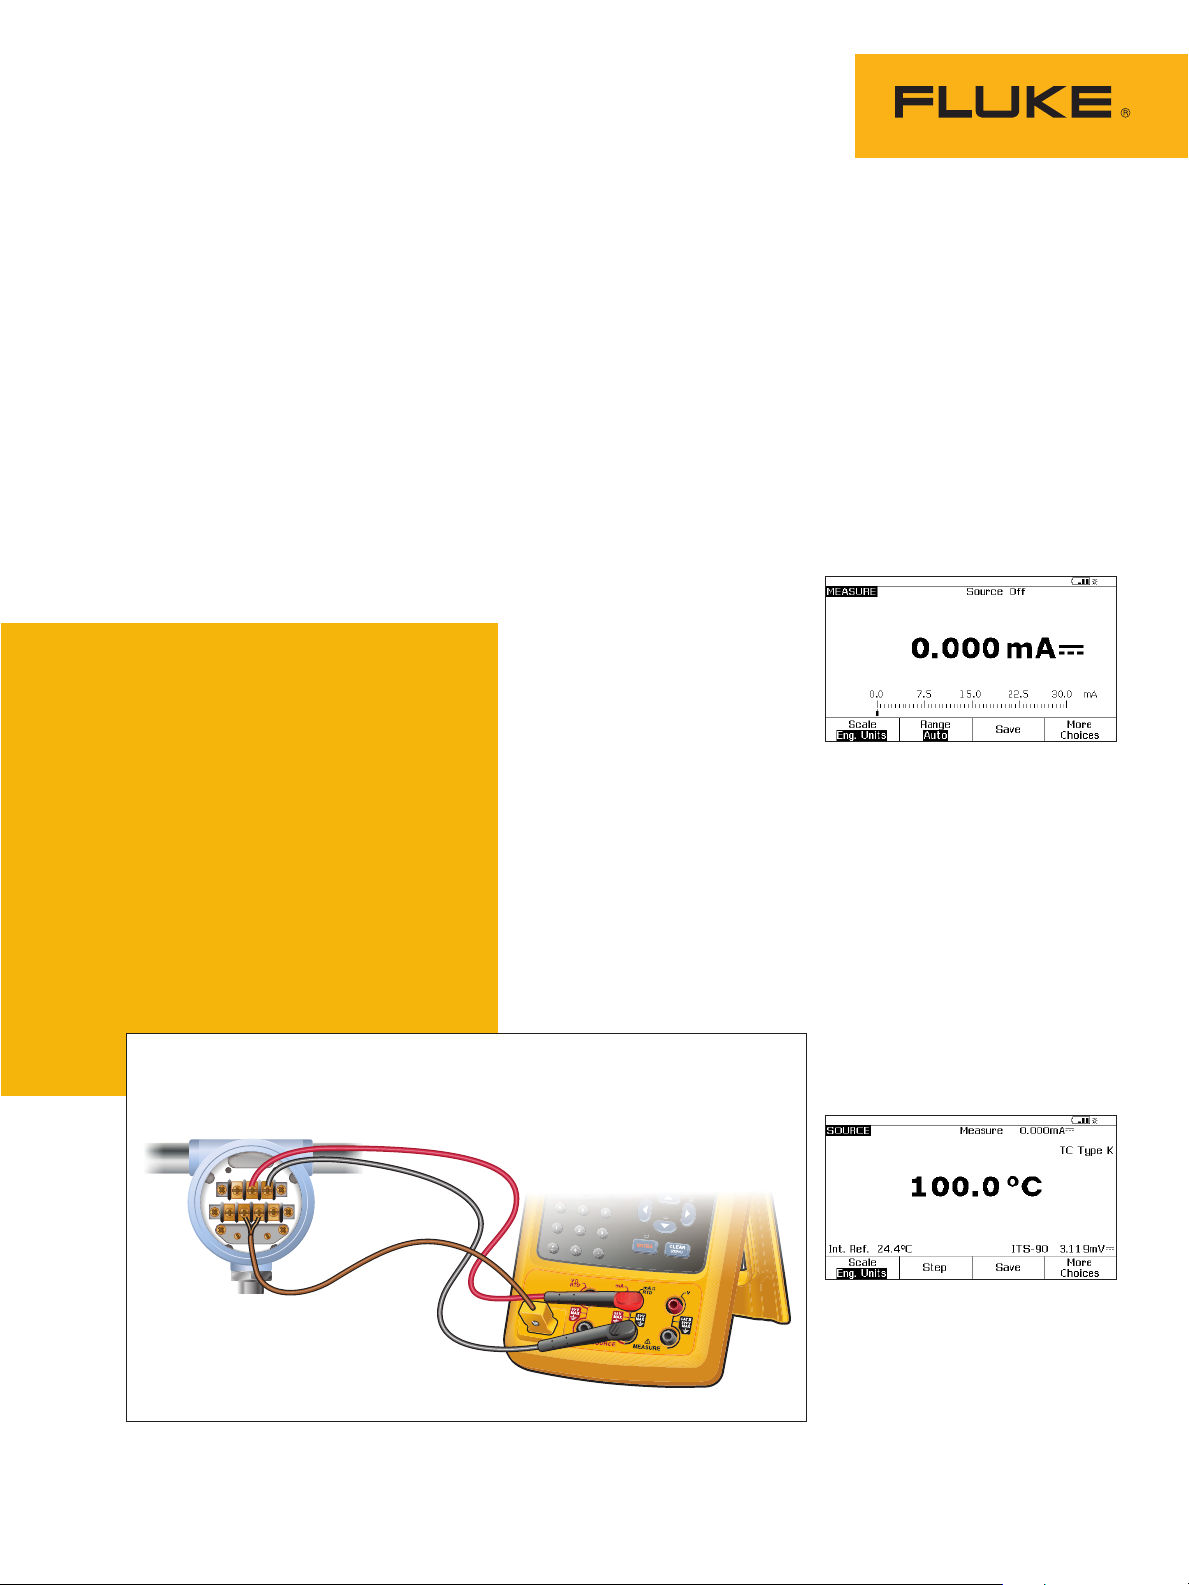
Calibrating a 2 Wire Thermocouple
Transmitter with the Fluke 750 Series
Documenting Process Calibrators
The transmitter in this example is a 2 wire transmitter (needs loop power). The input stimulus for
this device is from a type K thermocouple with an
input range of 100 °C to 300 °C at 0 % and 100 %.
The output drawn against loop power is 4-20 mA
at 0 % and 100 % with a tolerance of 0.25 %. The
steps below show how to: 1) perform a three point
ascending (3↑) As Found (pre-adjustment) test at
0-50-100 %, and Tag the results, 2) adjust the
zero and span (span = 100 %) of the transmitter,
then 3) perform a three point ascending As Left
(post-adjustment) test at 0-50-100 %, Tag those
results and review them in memory.
Rosemount 444
1. Connect a type K miniconnector into the “TC” input
of the DPC and connect to
the thermocouple input of
the transmitter (Figure 1). It
is necessary that you use the
correct type of mini-connector for this connection to the
DPC.
2. Connect the center two terminals of the DPC to the connections on the transmitter
where loop power is applied
(Figure 1).
Note: If you prefer to use house
loop power rather than supplying
loop power from the DPC, connect
these two leads in series with the
loop supply to the transmitter.
3. Once your connections are
made, starting from the DPC
power up state (or measure
screen), select the “mA” button to measure milliamps
(Figure 2).
Figure 2.
4. Next depress the “MEAS/
SOURCE” button; now you are
in the source screen.
Since you want to source a
thermocouple, press “TC/RTD”
once. Press ENTER to select
TC. Use the down arrow to
move the cursor to “K” and
then press “ENTER.” Select
“Linear T” and press ENTER.
The DPC will respond with
????? asking for a temperature to source. Depress “100”
and “ENTER” (Figure 3).
Figure 3.
Figure 1.
TEST DC PWR
++
––
Fluke DPC
Page 2
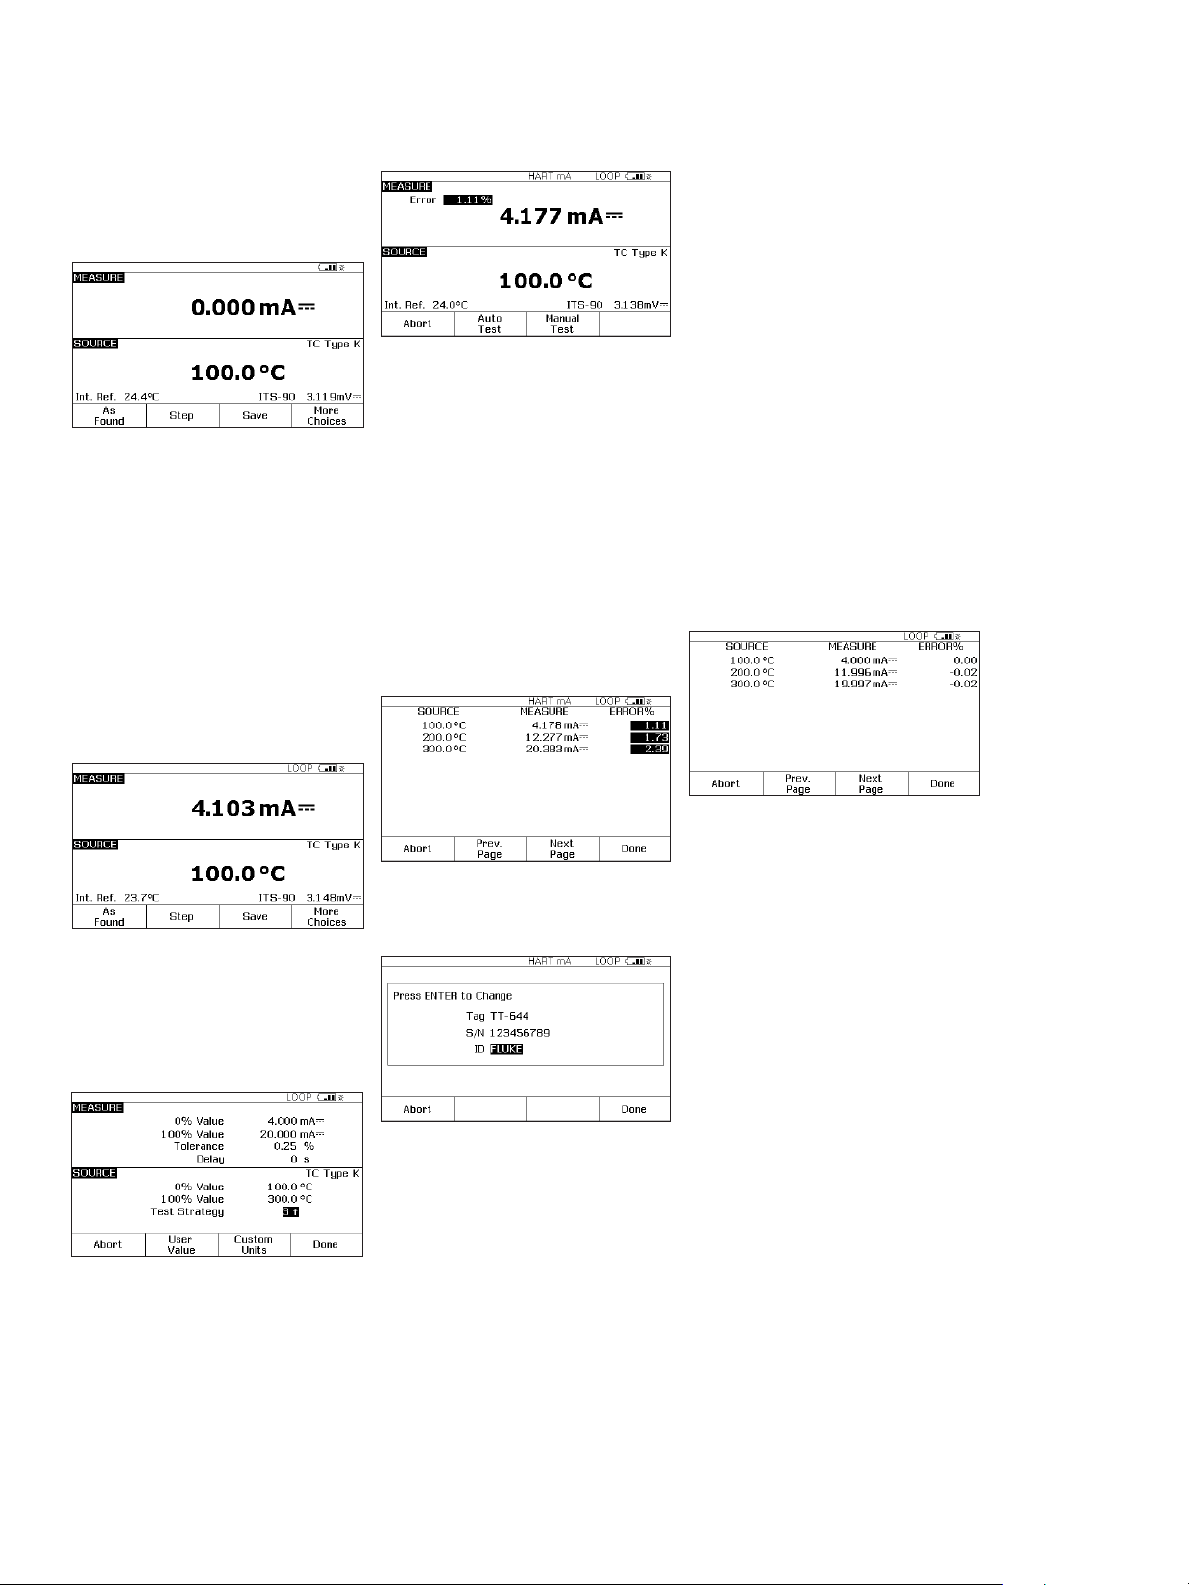
5. Next press the “MEAS/
SOURCE” button once and
you will be in the split screen
mode (Figure 4).
Figure 4.
Note: Skip to step 7 if you are
measuring current in series using
the house loop power source
mentioned in step (2).
6. Next, depress the “SETUP”
button on the DPC. The cursor
should begin on loop power.
Depress “ENTER,” down
arrow until the DPC cursor
is on Enabled and depress
“ENTER.” Next depress the
“Done” softkey (Figure 5).
Figure 7.
8. Select “Auto Test,” and watch
the DPC take 0 %, 50 % and
100 % measurements of current (4, 12 and 20 mA nominal) while sourcing 100 °C,
200 °C and 300 °C.
9. Once the DPC has completed
this evaluation, it will display
the post test summary screen
with the SOURCE, MEASURE
and ERROR columns. Failures
in the error column will be
in reverse video (Figure 8).
Depress “Done.”
0.25 %. As long as the error
exceeds .25 % the error window in the measure half of
the screen will be in reverse
video. Adjust the zero on the
transmitter until the error is
less than 0.25 %. Next, select
“Go to 100 %” and adjust the
transmitter span in the same
way. You may also “Go to
50 %” to check linearity at
mid-span.
12. After adjustment is complete,
select “As Left,” “Done” and
“Autotest.” Watch the 0-50100 % evaluations. If the
adjustment was successful,
all the errors in the post run
summary should be in normal
video (or less than .25 %)
(Figure 10).
Figure 5.
7. At this point depress
“As Found” and select
“Instrument” and press
“ENTER,” then fill in the
template, use the default
“Delay=0 seconds.”)
Figure 6.
Depress “DONE.” You should
now see the split screen and
are presented with soft key
choices of “Abort,” “Auto
Test,” and “Manual Test”
(Figure 7).
Figure 8.
10. Now you are presented with
the Tag entry screen (Figure 9).
Figure 9.
Press the “ENTER” key to edit
the entries. Depress “Done”
when complete until the split
screen reappears with the
soft key options of “As Left,”
“Adjust,” “Save” and “More
Choices” on the display of the
DPC.
11. At this point, select “Adjust”
and the DPC will source 0 %
and measure for 4 mA to
Figure 10.
13. Select “Done,” “Done,” and
“Done” again and you are
done!
To review your results
in memory, select the “More
Choices” soft key, the “Review
Memory” soft key and move your
cursor to the applicable result and
press enter. Select “As Found”
or “As Left,” then “ENTER” and
review the setup for the test,
select “Next Page” for the results,
and press “Tag” for its associated
label. Select “Done” and “Done”.
Move your cursor to the applicable
“As Left” result and press “ENTER”
and review the test setup, select
“Next Page” for the results, and
press “Tag” for its associated
label. When you are finished
reviewing results, press “Done”
until right-most soft key label
changes to “More Choices.”
2 Fluke Corporation 750 Series Documenting Process Calibrators
Page 3
3 and 4 Wire RTD Sourcing for the Fluke 750 Series
754
DOCUMENTING PROCESS CALIBRATOR
TEST DC PWR
++
––
Fluke DPC
C-2
C-1
S-3
S-2
S-4
S-1
Documenting Process Calibrators
One of the most frequently asked application questions pertaining to
the 750 Series Documenting Process Calibrators is, “How do I hook
up the test leads to the DPC to source 3 and 4 wire RTDs?” For 3 and
4 wire RTD measurement, the DPC has embedded hookup diagrams
that easily show you how to connect the DPC. However, for 3 and 4
wire RTD source, the DPC does not offer that assistance.
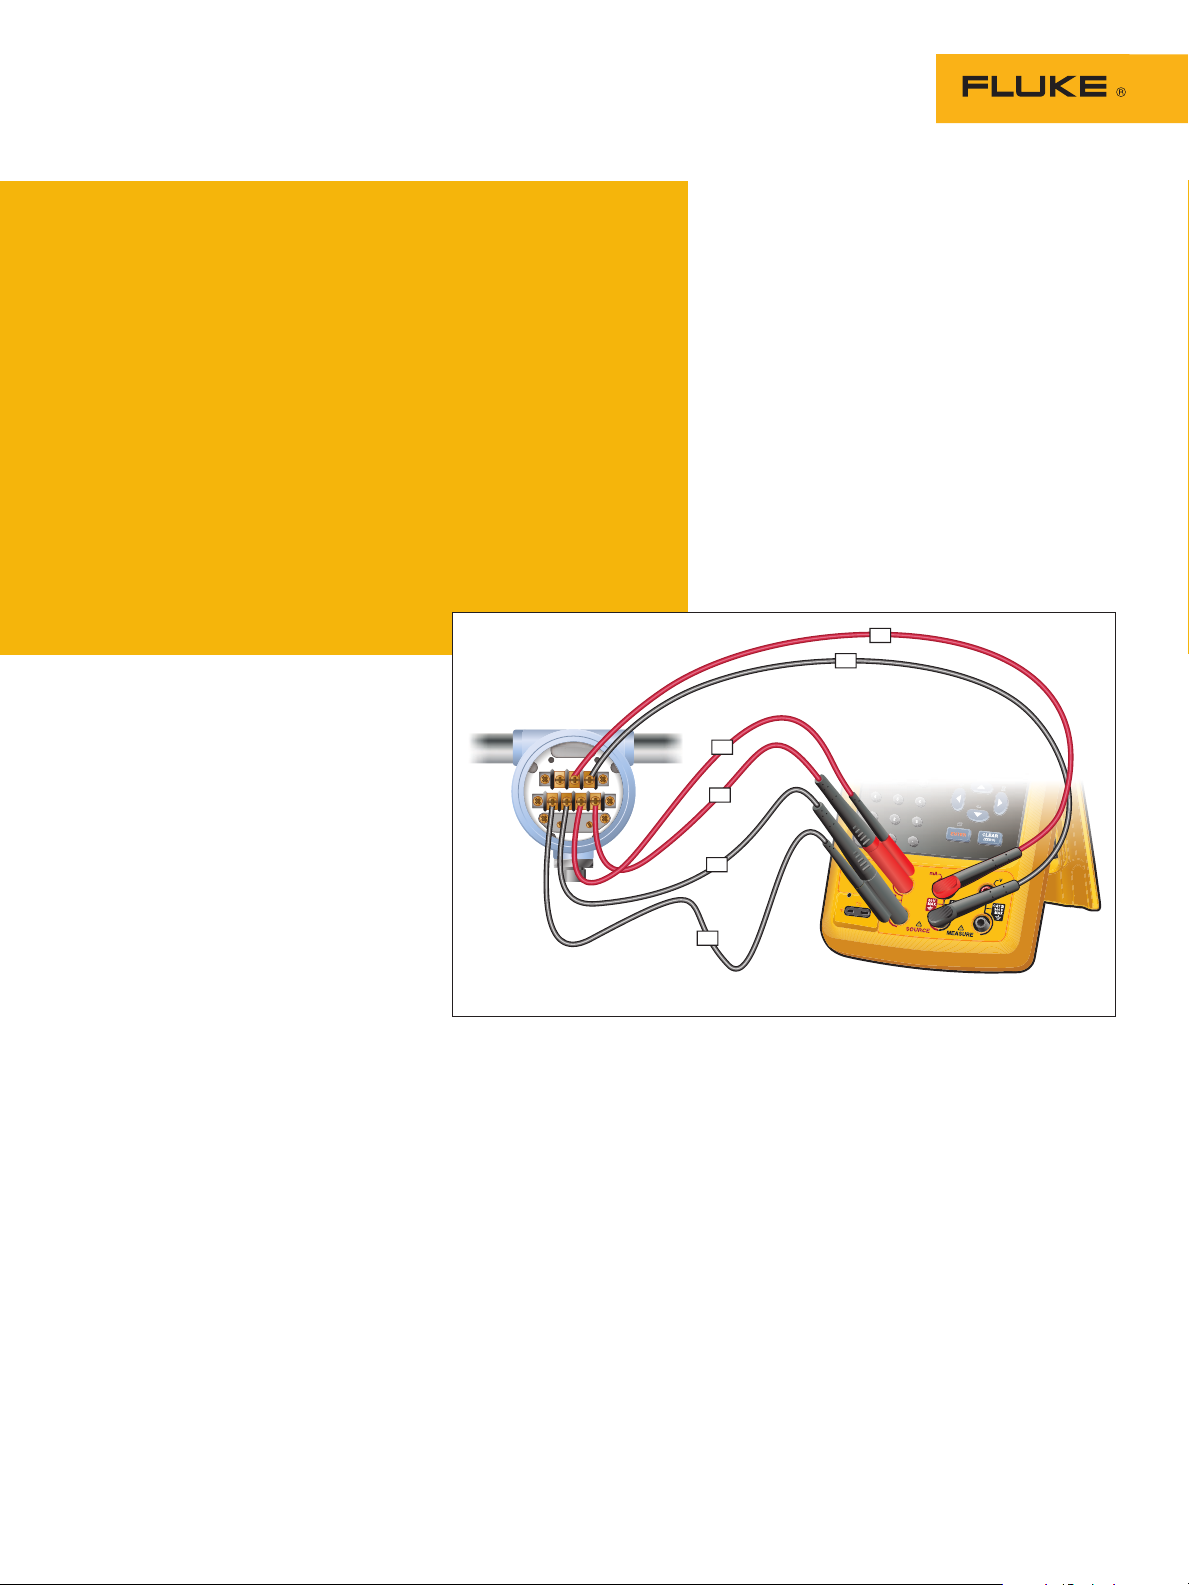
The example shown below (Figure 11) depicts the hookup for a 3
and 4 wire Rosemount 444 RTD Transmitter. You will need an additional pair of TL22 test leads and AC20 industrial test clips to complete
all the connections necessary for this application. In order to double
the available connections to the source terminals on the DPC, you also
will need to utilize the short black jumpers supplied with the Documenting Process Calibrator.
1. Make the RTD source
connections, S1, S2, S3 and
S4 (omit S3 and S4 for 2 wire
RTDs and S4 for 3 wire RTDs;
S4 is only needed for 4 wire
RTD sourcing).
2. Next, connect the loop power
and current measurement
connections, C1 and C2.
Figure 11.
3. Once the connections are
made as per the diagram in
Figure 11, enable the loop
24 volt power from the setup
screen, source the pertinent
RTD for the specific transmitter being evaluated, and set
the measure mode to mA.
4. At this point, enter the split
screen mode of the DPC and
perform the As Found, Adjust
and As Left tests as you did
in the previous thermocouple
transmitter example.
Fluke Corporation 750 Series Documenting Process Calibrators 3
Page 4

754
DOCUMENTING PROCESS CALIBRATOR
Pressure Button
Calibration of an I to P (Current to
Pressure) with the Fluke 750 Series
Documenting Process Calibrators
A common device in the Fluke DPC workload
is the I to P. The I to P device is used to convert electrical loop analog control of 4-20 mA
to pneumatic analog loop control of 3-15 PSI.
The device in this example is an I to P with
current input values of 4-20 mA for 0 % and
100 % with output range of 3-15 PSI for 0 %
and 100 %, +/- 2 %. This step-by-step example describes how to: 1) perform a three point
ascending (3↑) As Found (pre-adjustment) test
at 0-50-100 %, Tag the results, 2) Adjust the
zero and span (span = 100 %) of the I to P,
then 3) perform a three point ascending As
Left (post-adjustment) test at 0-50-100 %, Tag
those results and review them in memory.
1. Connect the pressure module
to the DPC. Connect the output of the I to P to the input
of the pressure module. If you
are using a differential pressure module, make sure (for
this example) that it is a 15
PSI module and connect to
the input labeled “H”
(Figure 12).
2. Connect from the center two
banana type connections of
the DPC to the input of the I
to P where control current is
supplied (Figure 12).
3. Once your connections are
made, assuming you are in
the power up state (or measure screen), select the “Pressure” button (directly above
the “Range” button) (Figure
13).
4. Next depress the “MEAS/
SOURCE” button; now you are
in the source screen
(Figure 14).
Figure 13.
Figure 12.
DOCUMENTING PROCESS CALIBRATOR
754
+
Pressure
Module
Since you want to source a
current, depress “mA.” Depress
“ENTER” which chooses “Source
mA” when given the choice of
“Source mA” or “Simulate Transmitter.” When the DPC responds
with ????? asking for a current to
source, depress “4” and “ENTER.”
5. Next depress the “MEAS/
SOURCE” button once and you
should be in the split screen
mode (Figure 15).
Figure 15.
Figure 14.
4 Fluke Corporation 750 Series Documenting Process Calibrators
Page 5

6. At this point depress “As
Found”, select “Instrument”
and press “ENTER,” then fill
in the template as shown in
figure 16.
9. Now you see the Tag entry
screen (Figure 18).
Figure 18.
Figure 16.
Press “DONE.” You should
now see the split screen,
with soft key choices of
“Abort,” “Auto Test” and
“Manual Test.”
7. Select “Manual Test,” and
watch the DPC start at 0 %.
Once the reading has settled,
depress “accept point.” Perform the 50 % and 100 %
measurements the same way.
8. Once the 753/754 has completed this evaluation, it
will display the post test
summary screen with the
SOURCE, MEASURE and
ERROR columns. Failures
appear in reverse video in
the Error column (Figure 17).
Depress “Done.”
Figure 17.
Press the “ENTER” key to edit
the entries. Depress “Done”
when complete until the split
screen reappears with the
soft key options of: “As Left,”
“Adjust,” “Save,” and ”More
Choices.”
10. At this point, select “Adjust”
and the DPC will source 0 %
(4 mA) and measure for 3 PSI
to 2 %. As long as the error
exceeds 2 % the Error window in the measure half of
the screen will be in reverse
video. Adjust the zero on the
I to P until the error is less
than 2 %. Next select “Go to
100 %” and adjust span in
the same way. Select “Go to
50 %” and evaluate linearity.
11. After adjustments are complete, select “As Left,” “Done”
and “Manual Test” and repeat
step (8). If the adjustment
was successful, all the errors
in the post run summary
should be in normal video
(Figure 19).
Figure 19.
12. Select “Done,” “Done,” and
“Done” again and you are
done!
To review your results in
memory, select the “More
Choices” soft key, then the
“Review Memory” soft key.
Move your cursor to the
applicable result and press
ENTER. Select “As Found”
or “As Left,” then “ENTER.
Press “Next Page” for the
results, and press “Tag” for its
associated label. Select “Done”
and “Done” and move your
cursor to the applicable “As
Left” result and press “enter.”
Review the setup for the test,
select “Next Page” for the
results, and press “Tag” for
its associated label. When you
are finished reviewing results,
press “Done” until right-most
soft key label changes to
“More Choices.”
Fluke Corporation 750 Series Documenting Process Calibrators 5
Page 6

+
754
DOCUMENTING PROCESS CALIBRATOR
Hand Pump
Pressure
Module
754
DOCUMENTING PROCESS CALIBRATOR
Pressure Button
Calibration of a Pressure Transmitter
(Pressure to Current or P to I) with
the Fluke 750 Series Documenting
Process Calibrators
A common device in the Fluke DPC workload is the pressure transmitter or P to I
device. The P to I device is used to convert
pneumatic analog loop control signals of
3-15 PSI or other measured pressures to
electrical loop analog control signals of
4-20 mA. The device in this example is a
P to I with pressure input values of 3-15
PSI for 0 % and 100 % with output range
(drawn from loop power) of
4-20 mA for 0 % and 100 %, +/- 2 %.
In this step-by-step example we will:
1) perform a three point ascending (3↑)
As Found (pre-adjustment) test at 0-50100 %, and Tag the results, 2) adjust the
zero and span (100 %) of the P to I, then
3) perform a three point ascending As Left
(post-adjustment) test at 0-50-100 %, tag
those results and review them in memory.
Figure 20.
1. Connect the pressure module
to the DPC. Connect the input
of the P to I and the output
of a pressure hand pump
to the input of the pressure
module using a “T” connector
(Figure 20). If you are using a
differential pressure module,
ensure (for this example) it is
a 15 PSI module and connect
to input labeled “H.”
2. Connect from the center 2
banana type connections of
the DPC to the input of the P
to I where loop power
is supplied (Figure 20).
3. Next, depress the “SETUP” button on the DPC. The cursor
should begin on loop power.
Depress “ENTER,” down
arrow to Enabled and depress
“ENTER.” Next depress the
“Done” softkey.
4. Once your connections are
made, assuming you are
in the power up state (or
measure screen), select the
mA button.
5. Next depress the “MEAS/
SOURCE” button; now you are
in the source screen (Figure
21).
Figure 21.
6. Since we wish to source
a pressure (using a hand
pump) depress the pressure
button, (directly above the
HART or range button)
(Figure 22).
7. Next depress the “MEAS/
SOURCE” button once and
you should be in the split
screen mode (Figure 23).
Figure 23.
6 Fluke Corporation 750 Series Documenting Process Calibrators
Figure 22.
Page 7

8. At this point depress “As
Found”, select “Instrument”
and press “ENTER,” then fill
in the template per Figure 24.
Figure 24.
Depress “DONE.” You should
now see the split screen and
are presented with soft key
choices of “Abort,” “Auto
Test,” and “Manual Test.”
9. Select Manual Test, and
watch the DPC for the
prompt: “Go to 3 PSI”
(Figure 25).
if you are sourcing 3.120 PSI
(1% of span above nominal),
the DPC will look for a mA
reading of 4.160 mA (also 1%
of span above nominal). In
order to make a proper evaluation of the device you need
only to get reasonably close
to the nominal pressure values with the hand pump. The
remaining source pressure
error is compensated for by
the DPC during mA measure
calculations.
10. Once the DPC has completed
this evaluation, it will display
the post test summary screen
with the SOURCE, MEASURE
and ERROR columns (Figure
26). Depress “Done.”
Figure 26.
Press the “ENTER” key to
edit the entries, press “Done”
when complete until the split
screen reappears with the
soft key options of: “As Left,”
“Adjust,” “Save,” and “More
Choices.”‘
12. At this point, select “Adjust”
and the DPC will source
0%, instruct you to “Go to
3 PSI” and measure for 4 mA
to 2%. As long as the error
exceeds 2% the Error window in the measure half of
the screen will be in reverse
video. Adjust the zero on the
P to I until the error is less
than 2 %. Next select “Go to
100 %” and adjust span in
the same way.
13. After adjustment is complete,
select “As Left,” “Done” and
“Manual Test” and repeat
step (9). If the adjustment
was successful, all the errors
in the post run summary
should be in normal video
(Figure 28).
Figure 25.
At that point using the hand
pump, pump until the DPC
display is reasonably close
to 3 PSI and depress “Accept
Point.” Now the DPC should
display “Go to 9 PSI.” Again,
using the hand pump, pump
up reasonably close to 9 PSI
and depress “Accept Point.”
When the DPC responds with
“Go to 15 PSI” pump to that
value and “Accept Point.”
It is important to understand
a key feature of the DPC at
this point. When the error
is being calculated on the
measured mA by the DPC,
it will make the calculation
based on the deviation of
the amount of pressure being
sourced. What this means is,
11. Now you are presented with
the Tag entry screen (Figure
27).
Figure 28.
14. Select “Done,” “Done,” and
“Done” again and you are
done!
Figure 27.
To review your results in memory, select “More
Choices” soft key, “Review Memory” soft key, move your
cursor to the applicable and press “ENTER” and review
the setup for the test, select “Next Page” for the results,
depress “Tag” for its associated label. Select “Done” and
“Done” next move your cursor to the applicable “As Left”
result and depress “ENTER” and review the setup for the
test, select “Next Page” for the results, depress “Tag”
for its associated label. When you are finished reviewing results, press “Done” until right-most soft key label
changes to “More Choices.”
Fluke Corporation 750 Series Documenting Process Calibrators 7
Page 8

Note on Uploading Results to Your PC
If you are using a 743/744 or 753/754, you may choose an
instrumentation management software package from this list:
Fluke DPC/TRACK2
AMS from Emerson Process
Management, (formerly
Fisher-Rosemount).
™
PRM (Plant Resource
Manager) from Yokogawa
Electric Corporation.
On Time Support
Process/Track
All trademarks are the property of their respective holders.
Additional information is available for download from
www.fluke.com on these products
• Pressure Calibration Application Note
• Custom Units Application Note
• Switch Test Application Note
• HART Calibration Application Note
• Process Tools Accessories
E
G
M
A
N
E
N
A
T
M
S
Y
Y
T
S
I
L
A
U
Q
ISO 9001
C
E
R
T
I
F
I
T
E
M
‚
1
0
0
9
O
E
S
I
D
T
T
E
O
E
M
8 Fluke Corporation 750 Series Documenting Process Calibrators
Fluke. Keeping your world
up and running.
Fluke Corporation
PO Box 9090, Everett, WA 98206 U.S.A.
Fluke Europe B.V.
PO Box 1186, 5602 BD
Eindhoven, The Netherlands
For more information call:
In the U.S.A. (800) 443-5853 or
Fax (425) 446-5116
In Europe/M-East/Africa +31 (0) 40 2675 200 or
Fax +31 (0) 40 2675 222
In Canada (800)-36-FLUKE or
Fax (905) 890-6866
From other countries +1 (425) 446-5500 or
Fax +1 (425) 446-5116
Web access: http://www.fluke.com
©2010-2011 Fluke Corporation.
Specifications subject to change without notice.
Printed in U.S.A. 8/2011 3792201B A-EN-N
Modification of this document is not permitted
without written permission from Fluke Corporation.
®
 Loading...