

Page 1

287/289
True-rms Digital Multimeters
Users Manual
®
June 2007, Rev. 1, 7/08
© 2007, 2008 Fluke Corporation. All rights reserved. Specifications subject to change without notice.
All product names are trademarks of their respective companies.
Find Quality Products Online at: sales@GlobalTestSupply.com
www.GlobalTestSupply.com
Page 2

Lifetime Limited Warranty
Each Fluke 20, 70, 80, 170, 180 and 280 Series DMM will be free from defects in material and workmanship for its lifetime. As used herein,
“lifetime” is defined as seven years after Fluke discontinues manufacturing the product, but the warranty period shall be at least ten years from
the date of purchase. This warranty does not cover fuses, disposable batteries, damage from neglect, misuse, contamination, alteration, accident or abnormal conditions of operation or handling, including failures caused by use outside of the product’s specifications, or normal wear
and tear of mechanical components. This warranty covers the original purchaser only and is not transferable.
For ten years from the date of purchase, this warranty also covers the LCD. Thereafter, for the lifetime of the DMM, Fluke will replace the LCD
for a fee based on then current component acquisition costs.
To establish original ownership and prove date of purchase, please complete and return the registration card accompanying the product, or
register your product on
product purchased through a Fluke authorized sales outlet and at the applicable international price. Fluke reserves the right to charge for
importation costs of repair/replacement parts if the product purchased in one country is sent for repair elsewhere.
If the product is defective, contact your nearest Fluke authorized service center to obtain return authorization information, then send the
product to that service center, with a description of the difficulty, postage and insurance prepaid (FOB Destination). Fluke assumes no risk
for damage in transit. Fluke will pay return transportation for product repaired or replaced in-warranty. Before making any non-warranty
repair, Fluke will estimate cost and obtain authorization, then invoice you for repair and return transportation.
THIS WARRANTY IS YOUR ONLY REMEDY. NO OTHER WARRANTIES, SUCH AS FITNESS FOR A PARTICULAR PURPOSE, ARE
EXPRESSED OR IMPLIED. FLUKE SHALL NOT BE LIABLE FOR ANY SPECIAL, INDIRECT, INCIDENTAL OR CONSEQUENTIAL DAMAGES OR LOSSES, INCLUDING LOSS OF DATA, ARISING FROM ANY CAUSE OR THEORY. AUTHORIZED RESELLERS ARE NOT
AUTHORIZED TO EXTEND ANY DIFFERENT WARRANTY ON FLUKE’S BEHALF. Since some states do not allow the exclusion or limitation of an implied warranty or of incidental or consequential damages, this limitation of liability may not apply to you. If any provision of this
warranty is held invalid or unenforceable by a court or other decision-maker of competent jurisdiction, such holding will not affect the validity
or enforceability of any other provision.
. Fluke will, at its option, repair at no charge, replace or refund the purchase price of a defective
5/07
Find Quality Products Online at: sales@GlobalTestSupply.com
www.GlobalTestSupply.com
Page 3

Table of Contents
Title Page
Lifetime Limited Warranty............................................................................................... ii
Introduction .................................................................................................................... 1
Contacting Fluke ............................................................................................................ 1
Safety Information .......................................................................................................... 1
Hazardous Voltage......................................................................................................... 3
Symbols ......................................................................................................................... 4
Features ......................................................................................................................... 5
Understanding the Push Buttons ............................................................................... 5
Using Auto Repeat .................................................................................................... 6
Understanding the Display ........................................................................................ 7
Bar Graph ............................................................................................................. 8
Status Bar Elements ............................................................................................. 8
Page Area............................................................................................................. 9
Softkey Labels ...................................................................................................... 9
Adjusting Display Contrast.................................................................................... 9
Understanding the Rotary Switch .............................................................................. 10
Using the Input Terminals.......................................................................................... 11
i
Find Quality Products Online at: sales@GlobalTestSupply.com
www.GlobalTestSupply.com
Page 4

287/289
Users Manual
Controlling Meter Power ................................................................................................ 12
Powering the Meter On and Off Manually ................................................................. 12
Battery Level Indicator .............................................................................................. 12
Automatic Power-Off ................................................................................................. 12
Battery Saver Mode .................................................................................................. 12
Controlling the Backlight ........................................................................................... 13
Selecting the Range ...................................................................................................... 13
Understanding Function Menus ..................................................................................... 13
Input Alert™ Feature...................................................................................................... 15
Using the Info Button ..................................................................................................... 15
Hold and AutoHold Mode............................................................................................... 15
Measuring Crest Factor ................................................................................................. 16
Capturing Minimum and Maximum Values .................................................................... 16
Capturing Peak Values .................................................................................................. 18
Low Pass Filter (Model 289 only)................................................................................... 20
Making Relative Measurements..................................................................................... 21
Making Measurements................................................................................................... 22
Measuring AC Voltage .............................................................................................. 22
Using LoZ for Voltage Measurements (Model 289 only) ........................................... 23
Making dB Measurements ........................................................................................ 23
Measuring DC Voltage .............................................................................................. 25
Measuring AC and DC Signals ................................................................................. 26
Measuring Temperature............................................................................................ 28
Using the Y Function (Model 289 Only) ............................................................... 31
Testing for Continuity ................................................................................................ 31
Using Conductance for High Resistance Tests......................................................... 34
Measuring Capacitance ............................................................................................ 35
Testing Diodes .......................................................................................................... 36
ii
Find Quality Products Online at: sales@GlobalTestSupply.com
www.GlobalTestSupply.com
Page 5

Contents
Measuring Current..................................................................................................... 38
Measuring Frequency................................................................................................ 42
Measuring Duty cycle ................................................................................................ 43
Measuring Pulse Width.............................................................................................. 45
Changing Meter Setup Options ...................................................................................... 47
Resetting Meter Setup Options.................................................................................. 47
Setting Display Contrast ............................................................................................ 47
Setting the Meter’s Language.................................................................................... 47
Setting Date and Time............................................................................................... 48
Setting Backlight and Auto Off Timeouts ................................................................... 48
Setting a Custom dBm Reference ............................................................................. 48
Disabling and Enabling the Beeper ........................................................................... 48
Enabling and Disabling the Smoothing Mode ............................................................ 49
Using Other Setup Options........................................................................................ 49
Using Memory ................................................................................................................ 49
Storing Individual Measurement Data........................................................................ 49
Naming Saved Data .................................................................................................. 49
Viewing Memory Data ............................................................................................... 50
Viewing Snapshot and Summary Data ................................................................. 50
Viewing Trend Data .............................................................................................. 50
Zooming in on Trend Data .................................................................................... 51
Deleting Stored Measurement Data .......................................................................... 51
Recording Measurement Data ....................................................................................... 52
Setting up a Recording Session ................................................................................ 53
Setting the Event Threshold Value ............................................................................ 54
Starting a Recording Session .................................................................................... 54
Stopping a Recording Session .................................................................................. 54
Using Communications .................................................................................................. 55
(continued)
iii
Find Quality Products Online at: sales@GlobalTestSupply.com
www.GlobalTestSupply.com
Page 6

287/289
Users Manual
Error Messages ............................................................................................................. 56
Maintenance .................................................................................................................. 57
General Maintenance................................................................................................ 57
Testing the Fuses...................................................................................................... 57
Replacing the Batteries ............................................................................................. 59
Replacing the Fuses ................................................................................................. 59
Test Lead Storage..................................................................................................... 59
In Case of Difficulty........................................................................................................ 61
Service and Parts .......................................................................................................... 62
General Specifications ................................................................................................... 66
Detailed Specifications................................................................................................... 67
AC Voltage Specifications......................................................................................... 68
AC Current Specifications ......................................................................................... 69
DC Voltage Specification .......................................................................................... 70
DC Current Specifications......................................................................................... 71
Resistance Specifications ......................................................................................... 72
Temperature Specifications ...................................................................................... 72
Capacitance and Diode Test Specifications .............................................................. 73
Frequency Counter Specifications ............................................................................ 74
Frequency Counter Sensitivity .................................................................................. 75
MIN MAX, Recording, and Peak Specifications ........................................................ 76
Input Characteristics ................................................................................................. 77
Burden Voltage (A, mA, μA)...................................................................................... 78
iv
Find Quality Products Online at: sales@GlobalTestSupply.com
www.GlobalTestSupply.com
Page 7

List of Tables
Table Title Page
1. Symbols................................................................................................................................. 4
2. Push Buttons ......................................................................................................................... 5
3. Display Features ................................................................................................................... 7
4. Rotary Switch Positions......................................................................................................... 10
5. Input Terminals...................................................................................................................... 11
6. Battery Level Indicator........................................................................................................... 12
7. Trend Data Display................................................................................................................ 51
8. Recording Display ................................................................................................................. 53
9. Stopped Recording Display ................................................................................................... 55
10. Error Messages ..................................................................................................................... 56
11. Replacement Parts................................................................................................................ 62
12. Accessories ........................................................................................................................... 65
v
Find Quality Products Online at: sales@GlobalTestSupply.com
www.GlobalTestSupply.com
Page 8

List of Figures
Figure Title Page
1. Push Buttons ......................................................................................................................... 5
2. Display Features ................................................................................................................... 7
3. Rotary Switch ........................................................................................................................ 10
4. Input Terminals...................................................................................................................... 11
5. Function Menu....................................................................................................................... 14
6. MIN MAX Record Display...................................................................................................... 17
7. Peak Record Display............................................................................................................. 18
8. Low Pass Filter...................................................................................................................... 20
9. Relative Mode Functions ....................................................................................................... 21
10. AC Voltage Measurements.................................................................................................... 22
11. dBm Display .......................................................................................................................... 23
12. DC Voltage Measurements ................................................................................................... 25
13. AC and DC Display................................................................................................................ 26
14. Temperature Measurement ................................................................................................... 28
15. Resistance Measurement...................................................................................................... 30
16. Continuity Indicator................................................................................................................ 31
17. Continuity Testing.................................................................................................................. 32
vii
Find Quality Products Online at: sales@GlobalTestSupply.com
www.GlobalTestSupply.com
Page 9

287/289
Users Manual
18. Conductance Measurement .................................................................................................. 34
19. Capacitance Measurement ................................................................................................... 35
20. Diode Testing........................................................................................................................ 37
21. Current Measurement Setup................................................................................................. 40
22. Current Measurement Circuit Connection............................................................................. 41
23. Functions Allowing Frequency Measurement ....................................................................... 42
24. Frequency Display ................................................................................................................ 43
25. Duty Cycle Measurements.................................................................................................... 44
26. Duty Cycle Display................................................................................................................ 45
27. Pulse Width Measurements .................................................................................................. 46
28. Testing the Current Fuses..................................................................................................... 58
29. Test Lead Storage ................................................................................................................ 59
30. Replacing Batteries and Fuses ............................................................................................. 60
31. Replaceable Parts................................................................................................................. 64
viii
Find Quality Products Online at: sales@GlobalTestSupply.com
www.GlobalTestSupply.com
Page 10

Introduction
XWWarning
Read “Safety Information” before using this Meter.
The descriptions and instructions in this manual apply to the
model 289 and model 287 True-rms Digital Multimeters
(hereafter referred to as the Meter). The model 289 appears in all
illustrations.
Safety Information
The Meter complies with:
• ANSI/ISA 82.02.01 (61010-1) 2004
• UL 61010B (2003)
• CAN/CSA-C22.2 No. 61010-1-04
• IEC/EN 61010-1 2
• EMC EN 61326-1
• Measurement Category III, 1000V, Pollution Degree 2
• Measurement Category IV, 600 V, Pollution Degree 2
In this manual, a Warning identifies hazardous conditions and
actions that could cause bodily harm or death. A Caution
identifies conditions and actions that could damage the Meter,
the equipment under test, or cause permanent loss of data.
To avoid possible electric shock or personal
injury, follow these guidelines:
• Use this Meter only as specified in this
manual or the protection provided by the
Meter might be impaired.
• Do not use the Meter if it is damaged. Before
you use the Meter, inspect the case. Look for
cracks or missing plastic. Pay particular
attention to the insulation surrounding the
connectors.
nd
Edition Pollution Degree 2
XWWarning
1
Find Quality Products Online at: sales@GlobalTestSupply.com
www.GlobalTestSupply.com
Page 11

287/289
Users Manual
• Make sure the battery door is closed and
latched before operating the Meter.
• Remove test leads from the Meter before
opening the battery door.
• Inspect the test leads for damaged insulation
or exposed metal. Check the test leads for
continuity. Replace damaged test leads before
you use the Meter.
• Do not apply more than the rated voltage, as
marked on the Meter, between the terminals or
between any terminal and earth ground.
• Never operate the Meter with the cover
removed or the case open.
• Use caution when working with voltages above
30 V ac rms, 42 V ac peak, or 60 V dc. These
voltages pose a shock hazard.
• Use only the replacement fuses specified by
the manual.
• Use the proper terminals, function, and range
for measurements.
• Avoid working alone.
• When measuring current, turn off circuit power
before connecting the Meter in the circuit.
Remember to place the Meter in series with the
circuit.
• When making electrical connections, connect
the common test lead before connecting the
live test lead; when disconnecting, disconnect
the live test lead before disconnecting the
common test lead.
• Do not use the Meter if it operates abnormally.
Protection may be impaired. When in doubt,
have the Meter serviced.
• Do not operate the Meter around explosive
gas, vapor, or dust.
• Use only 1.5 V AA batteries, properly installed
in the Meter case, to power the Meter.
• When servicing the Meter, use only specified
replacement parts.
• When using probes, keep fingers behind the
finger guards on the probes.
• Do not use the Low Pass Filter option to verify
the presence of hazardous voltages. Voltages
greater than what is indicated may be present.
First, make a voltage measurement without the
filter to detect the possible presence of
hazardous voltage. Then select the filter
function.
• Only use test leads that have the same voltage,
category, and amperage ratings as the meter
and that have been approved by a safety
agency.
2
Find Quality Products Online at: sales@GlobalTestSupply.com
www.GlobalTestSupply.com
Page 12

True-rms Digital Multimeters
Hazardous Voltage
• Use proper protective equipment, as required
by local or national authorities when working
in hazardous areas.
• Comply with local and national safety
requirements when working in hazardous
locations.
WCaution
To avoid possible damage to the Meter or to the
equipment under test, follow these guidelines:
• Disconnect circuit power and discharge all
high-voltage capacitors before testing
resistance, continuity, diodes, or capacitance.
• Use the proper terminals, function, and range
for all measurements.
• Do not remove batteries while the Meter is
turned on or a signal is applied to the Meter’s
input jacks.
• Before measuring current, check the Meter's
fuses. (See "Testing the Fuses" in the Users
Manual on the accompanying CD.)
• Do not use the LoZ mode to measure voltages
in circuits that could be damaged by this
mode’s low impedance (≈3 kΩ). (Model 289
only)
Hazardous Voltage
To alert you to the presence of a potentially hazardous voltage,
when the Meter detects a voltage ≥30 V or a voltage overload
(OL), the
Ysymbol is displayed.
3
Find Quality Products Online at: sales@GlobalTestSupply.com
www.GlobalTestSupply.com
Page 13

287/289
Users Manual
Symbols
Table 1 lists and describes the symbols used on the Meter and in this manual.
Table 1. Symbols
Symbol Description Symbol Description
B
F
X
E
R
P
t
CAT III
~
AC (Alternating Current or Voltage)
DC (Direct Current or Voltage)
Hazardous voltage
Battery (Low battery when shown on the
display)
Continuity test or continuity beeper tone
Conforms to European Union directives
Underwriters Laboratory listed product
IEC Measurement Category III – CAT III
equipment is designed to protect against
transients in equipment in fixed equipment
installations, such as distribution panels,
feeders and short branch circuits, and
lighting systems in large buildings.
Do not dispose of this product as unsorted municipal waste. Go to Fluke’s website for recycling
information.
I
T
W
J
$
;
N10140
s
CAT IV
Fuse
Double Insulated
Important Information; refer to manual
Earth ground
Conforms to relevant Canadian and US
standards
Conforms to relevant Australian standards
Inspected and licensed by TÜV Product
Services
IEC Measurement Category IV – CAT IV
equipment is designed to protect against
transients from the primary supply level,
such as an electricity meter or an overhead
or underground utility service.
4
Find Quality Products Online at: sales@GlobalTestSupply.com
www.GlobalTestSupply.com
Page 14
True-rms Digital Multimeters
Features
Features
Tables 2 through 5 briefly describe the Meter’s features.
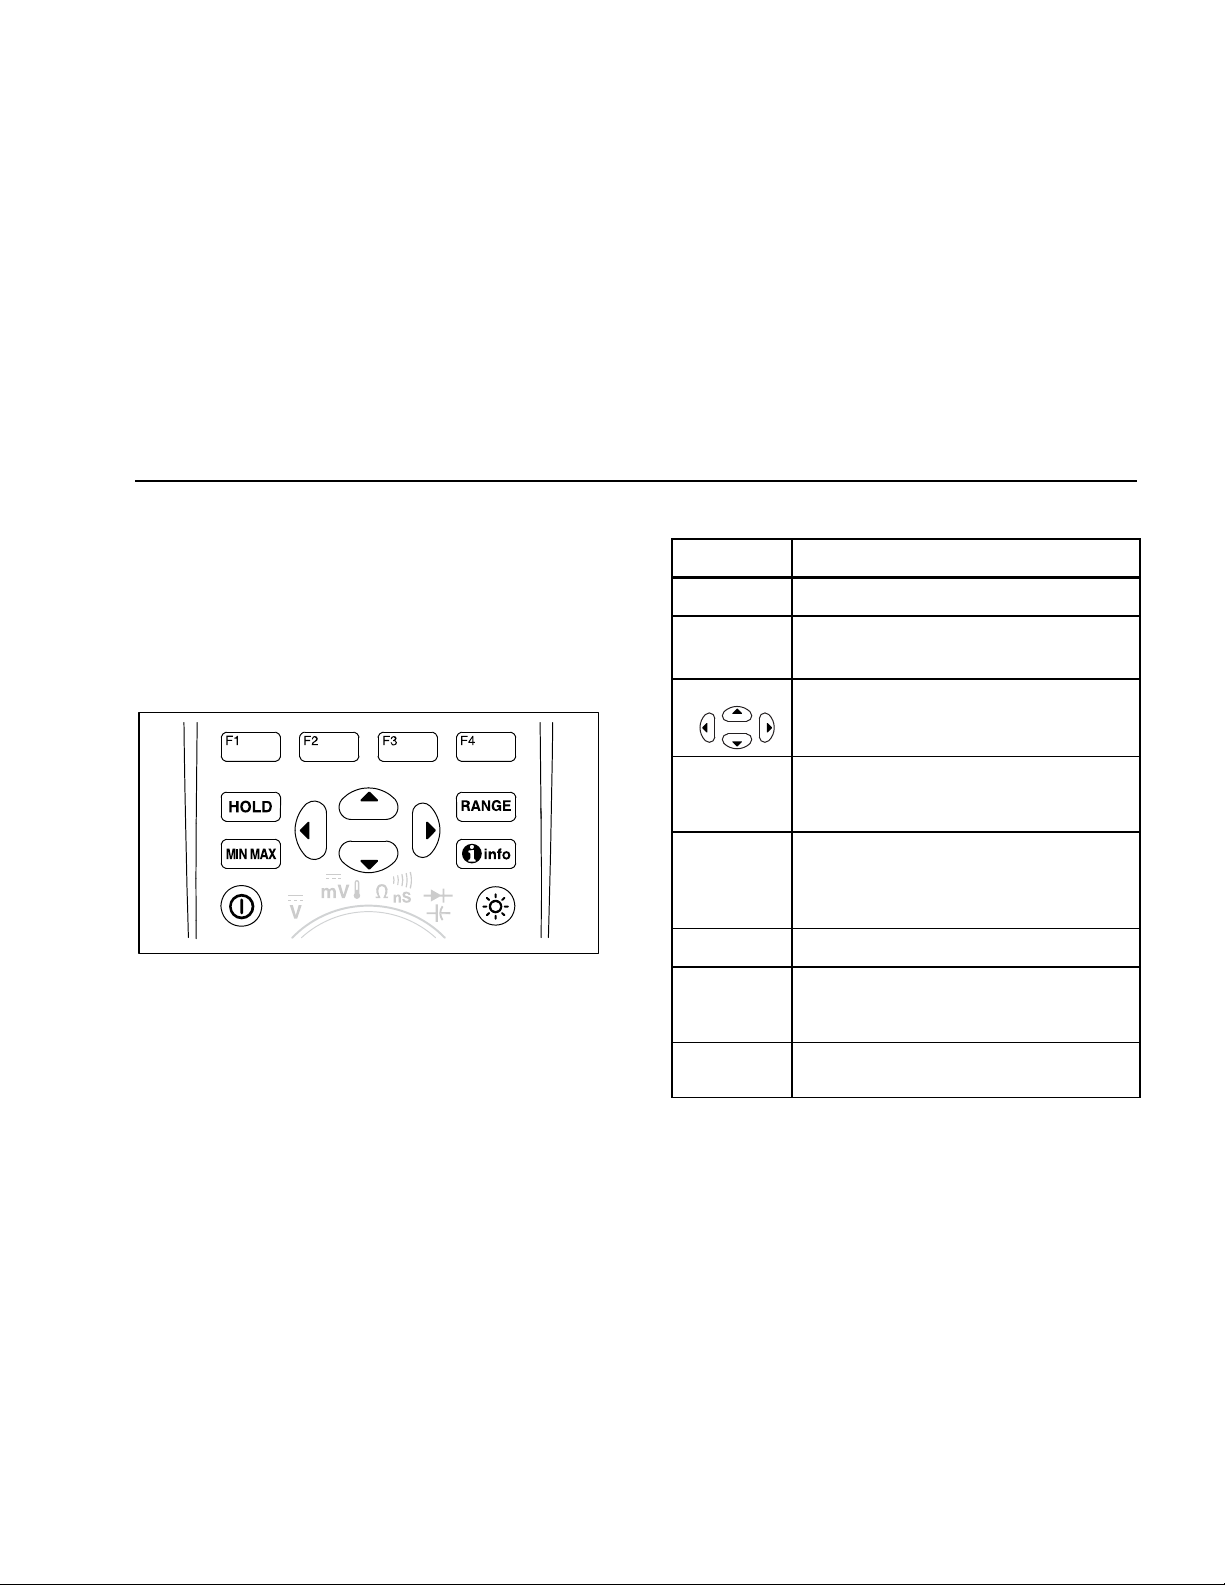
Understanding the Push Buttons
The 14 push buttons on the front of the Meter activate features
that augment the function selected using the rotary switch,
navigate menus or control power to Meter circuits. The buttons
shown in Figure 1 are described in Table 2.
est02.emf
Figure 1. Push Buttons
Table 2. Push Buttons
Button Function
O
12
34
H
R
M
I
G
Turns the Meter on or off.
Selects sub-functions and modes related
to the rotary switch function.
Cursor buttons select an item in a menu,
adjust display contrast, scroll through
information, and perform data entry.
Freezes the present reading in the
display and allows the display to be
saved. Also accesses AutoHold.
Switches the Meter range mode to
manual and then cycles through all
ranges. To return to autoranging, press
the button for 1 second.
Starts and stops MIN MAX recording.
Displays information about the present
function or items on the display at the
moment the info button is pressed.
Switches the display backlight between
off, low, and high.
5
Find Quality Products Online at: sales@GlobalTestSupply.com
www.GlobalTestSupply.com
Page 15

287/289
Users Manual
Using Auto Repeat
For some menu selections, holding down a softkey or cursor
button will continuously change (or advance) a selection until the
button is released. Normally, each press of a button causes the
selection to change once. During some selections, the selections
will change faster if the button is held for two or more seconds.
This is helpful when scrolling through a list of selections, such as
a list of stored measurements.
6
Find Quality Products Online at: sales@GlobalTestSupply.com
www.GlobalTestSupply.com
Page 16

True-rms Digital Multimeters
Features
Understanding the Display
Display features shown in Figure 2 are described in Table 3 and
the following sections.
9
87 11 12
6
8:10pm
5
4
123.45
3
2
AutoHOLD
1
Figure 2. Display Features
10
123.45 VAC
100 200 300 400
Save Setup
06/13/07
AutoSAVEHOLDREL
mVAC
Crest Factor
5 mVDC
Auto Range
500 VAC0
Hz60.000
13
14
15
16
est01.eps
Table 3. Display Features
Item Function Indication
A
Softkey labels Indicates the function of the button
B
Bar graph Analog display of the input signal
C
Relative Indicates the displayed value is
D
Minus sign Indicates a negative reading.
E
Lightning bolt Indicates hazardous voltage present
F
Remote
communication
G
Battery level Indicates the charge level of the six
H
Time Indicates the time set in the internal
I
Mode
annunciators
just below the displayed label.
(See the “Bar Graph” section for
more information).
relative to a reference value.
at the Meter’s input.
Indicates activity over the
communication link.
AA batteries.
clock.
Indicates the Meter’s mode.
7
Find Quality Products Online at: sales@GlobalTestSupply.com
www.GlobalTestSupply.com
Page 17

287/289
Users Manual
Table 3. Display Features (cont.)
Item Function Indication
J
Minimeasurement
K
Date Indicates the date set in the internal
L
Beeper Indicates the Meter’s beeper is
M
Units Indicates the units of measure.
N
Auxiliary Units Indicates unitless measurements
O
Range indicator Indicates the range the Meter is in
P
Secondary display Displays secondary measurement
Displays the lightning bolt (when
necessary) and the input value
when the primary and secondary
displays are covered by a menu or
pop-up message.
clock.
enabled (not associated with the
continuity beeper).
like Crest Factor.
and the ranging mode (auto or
manual).
information about the input signal.
Bar Graph
The analog bar graph functions like the needle on an analog
meter, but without the overshoot. The bar graph updates 30
times per second. Because the graph updates faster than the
digital display, it is useful for making peak and null adjustments
and observing rapidly changing inputs. For frequency, duty cycle,
pulse width, dBm, and crest factor functions, the bar graph
represents the amplitude of the input signal (volts or amps) and
not the value in the primary display. The bar graph is not shown
for capacitance, temperature, LoZ, AC+DC, AC over DC, peak,
or min max functions.
For dc voltage, dc current, and all relative percent modes, a
zero-centered bar graph is displayed. For dc voltage and current,
the bar graph range is the maximum of the selected range. For
relative percent mode, the bar graph goes to ±10 %.
The number of lit segments indicates the measured value and is
relative to the full-scale value of the selected range. In the 50
Vac range, for example, the major divisions on the scale
represent 0, 5, 10, 15, 20, 25, 30, 35, 40, 45, and 50 Vac. An
input of 25 Vac turns on segments up to the middle of the scale.
For off-scale values, f appears to the right of the normal bar
graph. For the zero-center bar graph, a e appears at the left end
of the bar graph for negative off-scale values and fappears on
the right end for positive off-scale values.
Status Bar Elements
The status bar at the top of the Meter’s display contains
indicators for battery level, time of day, mini-measurement
display, present date, and beeper on/off icon.
8
Find Quality Products Online at: sales@GlobalTestSupply.com
www.GlobalTestSupply.com
Page 18

True-rms Digital Multimeters
Features
The mini-measurement display shows the measurement value of
the primary function, if it is not already shown in the page area of
the display. For example, when the display is frozen for a HOLD,
the mini-measurement display continues to show the input signal
(Live) measurement and a mini z. In addition, the minimeasurement display will flash, if z (for inputs above 30 volts)
would normally appear in the primary display but is obscured. To
warn of the possibility of blowing a current fuse, the minimeasurement display also flashes when current measurements
exceed the maximum continuous current levels (see
specifications).
Page Area
The page area of the display is where the main meter content is
displayed. The primary display (upper half of the page area) is
where the most important value of the selected function is
shown. The secondary display contains the bar graph and values
that may be measured in addition to the primary function value.
For example, with frequency measurement selected in Vac, the
frequency value will appear in the primary display with the ac
voltage value in the secondary display.
Softkey Labels
Labels for the four function softkeys (F1 through F4) appear in
the bottom row of the display. These labels will change based on
the function and/or menu selection.
Adjusting Display Contrast
When not selecting items on a menu or inputting data, pressing
7 increases display contrast and pressing 8 decreases it.
9
Find Quality Products Online at: sales@GlobalTestSupply.com
www.GlobalTestSupply.com
Page 19

287/289
Users Manual
Understanding the Rotary Switch
Select a primary measurement function by positioning the rotary
switch to one of the icons around its perimeter. For each
function, the Meter presents a standard display for that function
(range, measurement units, and modifiers). Button choices made
in one function do not carry over into another function. The
model 289 offers two additional functions: low ohms (Y) and
low impedance (LoZ) ac volts. Each position shown in Figure 3 is
described in Table 4.
est03.emf
Figure 3. Rotary Switch
Table 4. Rotary Switch Positions
Switch
Position
L
V
T
U
N
S
P
A
X
Y
AC voltage measurement using a low input
impedance (model 289 only)
AC voltage measurements
AC millivolt measurements
DC and ac+dc voltage measurements
DC millivolts, ac+dc millivolt, and
temperature measurements
Resistance, continuity, and conductance
measurements
Diode test and capacitance measurements
AC, dc and ac+dc amps and milliamps
measurements
AC, dc and ac+dc microampere
measurements up to 5,000 μA
Resistance measurements with 50e range
(model 289 only)
Function
10
Find Quality Products Online at: sales@GlobalTestSupply.com
www.GlobalTestSupply.com
Page 20

True-rms Digital Multimeters
Features
Using the Input Terminals
All functions except current use the W and COM input
terminals. The two current input terminals (A and mA/μA) are
used as follows:
Current from 0 to 400 mA, use the
Current between 0 and 10 A use the A and COM terminals.
Figure 4. Input Terminals
€ and COM terminals.
est04.emf
Table 5. Input Terminals
Terminal Description
Input for 0 A to 10.00 A current (20VA
A
€
COM
overload for 30 seconds on, 10 minutes off),
frequency, and duty-cycle measurements.
Input for 0 A to 400 mA current
measurements, frequency, and duty cycle.
Return terminal for all measurements.
Input for voltage, continuity, resistance,
diode test, conductance, capacitance,
frequency, temperature, period, and dutycycle measurements.
11
Find Quality Products Online at: sales@GlobalTestSupply.com
www.GlobalTestSupply.com
Page 21

287/289
Users Manual
Controlling Meter Power
The Meter is powered by six AA batteries and controlled through
a front panel power switch and internal circuits designed to help
conserve battery power. The following sections describe several
techniques for controlling Meter power.
Powering the Meter On and Off Manually
With the Meter off, press O to turn on the Meter. Pressing O
while the Meter is on causes it to turn off.
Note
Collected data is retained when the Meter is turned off
while in record, MIN MAX record, or Peak record
modes. When the Meter is next turned on, the dispay
shows the collected data in stopped mode. Pressing
the softkey labeled Save will save the data.
Battery Level Indicator
The battery level indicator in the upper left-hand corner of the
display indicates the relative condition of the batteries. Table 6
describes the various battery levels the indicator represents.
Table 6. Battery Level Indicator
Indication Battery Capacity
B
C
D
E
F
[1] When critically low, a “Replace batteries” pop-up message
appears 15 seconds before the Meter shuts down.
The Meter will display a “Batteries low” message whenever the
battery level will not support a selected function.
Full capacity
¾ capacity
½ capacity
¼ capacity
[1]
Almost empty (less than one day)
Automatic Power-Off
The Meter automatically turns off if the rotary switch is not moved
or a button is not pressed for 15 minutes (default). Pressing O
will turn the Meter back on after it is powered off automatically.
To change the timeout period or completely disable automatic
power-off, refer to “Setting Backlight and Auto Off Timeouts” later
in this manual.
Battery Saver Mode
If Auto off is enabled (set to a time period), and MIN MAX record,
Peak record, Recording, or AutoHold is enabled, the Meter will
enter a battery-saver mode if a push-button is not pressed or the
rotary switch is not moved for a set period of time. For the
12
Find Quality Products Online at: sales@GlobalTestSupply.com
www.GlobalTestSupply.com
Page 22

True-rms Digital Multimeters
Selecting the Range
recording mode, the time period is five minutes. For MIN MAX,
Peak and AutoHold modes, the time period is the same time the
Auto Off feature is set for. See the “Setting Backlight and Auto
Off Timeouts” section later in this manual. Battery saver mode
conserves battery power by shutting down circuits not necessary
for the selected function, including the display. However, the LED
surrounding the power button (O) will continue to flash to
indicate the Meter is still collecting data.
The Meter “wakes up” from battery-save mode under the
following conditions:
• A button is pressed
• The rotary knob is moved
• A lead is removed or inserted into a current input jack.
• The Meter changes range
• IR Communications begin
These condictions only awaken the Meter and does not change
the Meter’s function or mode of operation.
Controlling the Backlight
If viewing the display becomes difficult in low-light conditions,
press G to activate the LCD backlight. The backlight button
cycles the backlight through three states: low, high, and off. The
Meter displays a message if the battery level will not support the
backlight operation.
To conserve battery life, a user-adjustable timeout controls how
long the backlight stays on. The default timeout is 5 minutes. To
change the timeout, refer to “Setting Backlight and Auto Off
Timeouts” later in this manual.
Selecting the Range
The Meter’s selected range is always displayed above the righthand end of the bar graph, as the range indicator. Pressing R
switches the Meter between manual and autoranging. It also
cycles through the Meter ranges when manual ranging is
enabled.
Note
You cannot use R in conductance, diode test, LoZ,
Low Ohms, and temperature functions. These
functions all use a fixed range.
In autorange, the Meter selects the lowest range to display the
highest available precision (resolution) for the input signal. If
Manual range is already enabled, press and hold R for one
second to enter the autoranging mode.
If autorange is enabled, press R to enter manual ranging.
Each additional press of R sets the Meter to the next higher
range, unless it is already in the highest range, at which point the
range switches to the lowest range.
Understanding Function Menus
Each primary measurement function (rotary switch position) has
a number of optional sub-functions or modes accessed by
pressing the softkey labeled Menu (F1). A typical menu is shown
in Figure 5.
13
Find Quality Products Online at: sales@GlobalTestSupply.com
www.GlobalTestSupply.com
Page 23

287/289
Users Manual
Menu
VAC
REL
Peak, CF
Hz, %, mS
dBm
dBV
REL REL% Close
Figure 5. Function Menu
est05.eps
Menu selection is indicated by the filled-in black square
(hereafter the menu selector) to the left of a menu item. Use the
four front-panel cursor buttons (5 6 7 8) to position the menu
selector next to a menu item. As the menu selector moves
between menu items, the four softkeys and their labels change to
reflect the available functions and/or modes available for the
selection menu item.
The example menu in Figure 5 shows the REL (Relative)
function as the current selection. The function selected when the
menu opens is the function selected the last time the menu was
used. To get to the Hz menu item from the REL item, press 6
once, followed by one press of 7. As the menu selector moves
between the menu items, the softkey labels change to indicate
each softkey’s function. Once the desired function or mode
appears in one of the softkey labels, press the appropriate
softkey to activate it. The pop-up menu closes and the display
changes to reflect the selection just made. Pressing the softkey
labeled Close closes the pop-up menu, leaving the Meter in the
state it was in before pressing the Menu softkey.
In most cases, the softkeys revealed by the menu selection act
like toggles. The example menu shown in Figure 5 shows REL,
REL%, and Close softkeys. In this example, the Meter is not in
the relative mode, so pressing the softkey labeled REL would
activate, or toggle, the relative mode. If, on the other hand the
Meter is already in the relative mode, pressing the same softkey
would disable the relative function.
In some cases, pressing a function that can not be used with
other functions appearing in the menu turns off the previously
selected function. For example, in Figure 5, if the Meter is
already in the relative function, pressing REL% causes the Meter
to turn off relative and display relative percent.
In cases where multiple modes have been selected, selecting the
first (top-left) menu item always turns off all other functions and
modes, and returns the Meter to the primary function selected by
the rotary switch. For example, assume that the Meter is setup
for frequency (Hz) and is displaying in relative mode as selected
through the menu in Figure 5. Moving the menu selector to the
menu item labeled VAC and pressing the softkey labeled VAC,
clears both frequency and relative selections, leaving the Meter
in volts ac only.
Menu selections are remembered for each rotary switch position.
For example, selecting REL for the volts ac position causes REL
to be selected the next time the menu is opened in volts ac, even
though in the interim, Hz,%,ms was selected from a similar menu
for the millivolts ac function.
Up to two columns of four items each are displayed at any one
time. If more than eight menu items are available for a primary
function, g appears in the lower right-hand corner of the page
area of the display, indicating more menu items are available.
With the menu selector on one of the items in the left column,
14
Find Quality Products Online at: sales@GlobalTestSupply.com
www.GlobalTestSupply.com
Page 24

True-rms Digital Multimeters
Input Alert™ Feature
press 5 to scroll the screen horizontally and reveal the off-screen
menu items. Conversely, with the menu selector on an item in
the right-hand column, press 6 to reveal the off-screen menu
items.
Input Alert™ Feature
XW Warning
To avoid circuit damage and possibly blowing the
Meter’s current fuse, do not place the probes
across (in parallel with) a powered circuit when a
lead is plugged into a current terminal. This
causes a short circuit because the resistance
through the Meter's current terminals is very low.
If a test lead is plugged into the mA/μA or A terminal, but the
rotary switch is not set to the correct current position, the beeper
warns you by making a chirping sound and displays “Leads
connected incorrectly”. This warning is intended to stop you from
attempting to measure voltage, continuity, resistance,
capacitance, or diode values when the leads are plugged into a
current terminal.
Using the Info Button
While operating the Meter, more information about a selected
function, a front-panel button, or a menu item may be necessary.
Press I to open an information window that lists topics
covering the functions and modifiers that are available at the time
the button is pressed. Each topic provides a brief explanation on
a Meter function or feature.
The information revealed through I is not meant to replace
the more detailed information found in this manual. Function and
feature explanations are brief and only meant to refresh a
person’s memory.
The number of information topics displayed at any one time may
exceed the display area. Use the softkeys labeled Next and Prev
to move from topic to topic. Use the softkey labeled More or 7
and 8 to scroll through the information a full screen at a time.
Pressing the softkey labeled Close, or I will close the
information window.
Hold and AutoHold Mode
To freeze the display for any function, press H. Only the minimeasurement display and hazardous voltage icon (z) continue to
indicate the actual input. The battery level indicator is also active.
The Meter’s softkeys are relabeled for saving the frozen reading
or activating the AutoHold mode.
If H is pressed while MIN MAX record, peak record, or a
recording session is in progress, the display freezes but the data
acquisition continues in the background. Pressing H again
updates the display to reflect data that was acquired during the
hold.
Pressing the softkey labeled AutoHOLD activates AutoHold if
the Meter is not in the Peak, MIN MAX, or Record modes.
AutoHold operation monitors the input signal and updates the
display and, if enabled, sounds the beeper, whenever a new
stable measurement is detected. A stable measurement is one
that does not vary more than a selected adjustable percentage
(AutoHold threshold) for at least one second. The Meter filters
15
Find Quality Products Online at: sales@GlobalTestSupply.com
www.GlobalTestSupply.com
Page 25

287/289
Users Manual
out open lead conditions so the Meter leads can be moved
between test points without triggering a display update.
Note
For temperature measurements, the AutoHold
threshold is a percent of 100 degrees. The default
AutoHold threshold is 4% of 100 degrees, or 4 degrees
Celsius or Fahrenheit.
Pressing H while in AutoHold mode, forces the Meter’s
display to update with the present measurement, just as if a
stable measurement had been detected.
To set the AutoHOLD Threshold Value, press the softkey labeled
Setup to access the setup menu. Using the cursor buttons, move
the menu selector next to the menu item labeled Recording and
press the softkey labeled Recording to open the recording setup
screen. Using the cursor buttons, move the menu selector next
to the menu item labeled Event Threshold for AutoHOLD and
then press the softkey labeled Edit. Press 7 or 8 to scroll
through the AutoHold threshold values. With the desired value
selected, press the softkey labeled Close.
Measuring Crest Factor
Crest factor is a measure of signal distortion and is calculated as
a signal’s peak value over its rms value. This is an important
measurement when looking at power quality issues.
The Meter’s crest factor function is only available for the ac
measurements: Vac, mVac, Aac, mAac, and μAac. With the
Meter in one of the ac measurement functions, press the softkey
labeled Menu. Next, move the menu selector next to the menu
item labeled Peak,CF and press the softkey labeled CF. The
crest factor value is displayed in the primary display while the ac
measurement appears in the secondary display. Frequency, duty
cycle, and pulse width are not allowed during crest factor
measurements.
Capturing Minimum and Maximum Values
The MIN MAX Record mode captures minimum, average, and
maximum input values. When the input goes below the recorded
minimum value or above the recorded maximum value, the Meter
beeps and records the new value. The Meter stores the elapsed
time since the recording session was started at the same time.
The MIN MAX mode also calculates an average of all readings
taken since the MIN MAX mode was activated.
This mode is for capturing intermittent readings, recording
minimum and maximum readings unattended, or recording
readings while equipment operation precludes watching the
Meter. The MIN MAX mode is best for recording power supply
surges, inrush currents, and finding intermittent failures.
Response time is the length of time an input must stay at a new
value to be captured as a possible new minimum or maximum
value. The Meter has a 100 millisecond MIN MAX response time.
For example, a surge lasting 100 milliseconds would be captured
but one lasting only 50 milliseconds may not be captured at its
actual peak value. See the MIN MAX specification for more
information.
The true average value displayed is the arithmetic mean of all
readings taken since the start of recording (overloads are
discarded). The average reading is useful for smoothing out
unstable inputs, calculating power consumption, or estimating
the percentage of time a circuit is active.
16
Find Quality Products Online at: sales@GlobalTestSupply.com
www.GlobalTestSupply.com
Page 26

True-rms Digital Multimeters
Capturing Minimum and Maximum Values
Note
For input signals that are noisy or change rapidly, turn
on the Smoothing mode to display a steadier reading.
See the “Enabling and Disabling the Smoothing Mode”
section later in this manual.
To extend battery life during MIN MAX recording, the Meter will
enter a battery saver mode. See the “Setting Backlight and Auto
Off Timeouts” section for more information on the battery saver
mode.
To activate the MIN MAX mode, press M. As shown in
Figure 6, the Meter displays e at the top of the
measurement page, and the MIN MAX start date and time along
the bottom of the page. In addition, the recorded maximum,
average, and minimum values appear in the secondary display
with their respective elapsed times.
8:10pm
06/07/07
Min Max
VAC
119.81
Maximum
Average
Minimum
Restart
Figure 6. MIN MAX Record Display
To stop a MIN MAX recording session, press M or the softkey
labeled Stop. The summary information in the display freezes,
and the softkeys change function to allow saving the collected
data. Pressing M again or the softkey labeled Close exits the
MIN MAX record session without saving the collected data.
Turning the rotary switch before saving the MIN MAX
recording data will cause all the accumulated data to
be lost.
To save the MIN MAX screen data, the MIN MAX session must
be ended by pressing the softkey labeled Stop. Next, press the
softkey labeled Save. A dialog box opens where the default
saved name can be selected or another name assigned. Press
127.09
119.50
110.23
Start : 06/07/07 7:00 pm
Note
VAC
VAC
VAC
Auto Range
500 VAC
00:03:17
01:10:09
00:59:59
Stop
est42.eps
17
Find Quality Products Online at: sales@GlobalTestSupply.com
www.GlobalTestSupply.com
Page 27

287/289
Users Manual
the softkey labeled Save to store the MIN MAX screen data. MIN
MAX can not be continued at this point. Press the softkey labeled
Close to exit the MIN MAX mode.
Pressing the softkey labeled Restart while MIN MAX is running
stops the MIN MAX session, discards all MIN MAX data, and
immediately starts a new MIN MAX recording session.
Capturing Peak Values
Peak record is almost the same as MIN MAX record explained
earlier in this manual. The significant difference between the two
recording functions is the shorter response time for peak
recording: 250 μs. With this short response time, the actual peak
values of a sinusoidal signal are measurable. Transients are
more accurately measured using the peak record feature.
To activate the peak mode, press the softkey labeled Menu.
Move the menu selector next to the menu item labeled Peak,CF
or Peak. Press the softkey labeled Peak to start the peak
recording session.
8:10pm
06/07/07
Peak
VAC
119.8
Peak Max
Average
Peak Min
Restart
As shown in Figure 7, the primary display shows the “live”
measurement present on the Meter’s inputs. In the secondary
area of the display, the maximum and minimum peak values as
well as the average value are shown along with their respective
time stamps. The time stamp next to the average value indicates
the elapsed time of the peak recording session. The peak
recording session start time is shown along the bottom of the
page area of the display.
When the peak value of the input signal goes below the recorded
minimum value or above the recorded maximum value, the Meter
beeps and records the new value. At the same time, the elapsed
time since the peak recording session was started is stored as
the recorded value’s time stamp.
168.2
118.9
-173.9
Start : 06/07/07 7:00 pm
Figure 7. Peak Record Display
V
VAC
V
Auto Range
500 VAC
00:03:17
01:10:59
01:10:09
Stop
est43.eps
18
Find Quality Products Online at: sales@GlobalTestSupply.com
www.GlobalTestSupply.com
Page 28

True-rms Digital Multimeters
Capturing Peak Values
Pressing the softkey labeled Stop ends the peak recording
session. The summary information in the display freezes and the
softkeys change function to allow saving the collected data.
Pressing the softkey labeled Close exits the peak recording
session without saving the collected data.
Note
Turning the rotary switch before saving the peak
recording data will cause all the accumulated data to
be lost.
To save peak screen data, the peak capture session must be
ended by pressing the softkey labeled Stop. Next press the
softkey labeled Save. A dialog box opens where the default
saved name can be selected or another name assigned. Press
the softkey labeled Save to store the Peak screen data. Peak
capture can not be continued at this point. Press the softkey
labeled Close to exit the Peak capture mode.
Pressing the softkey labeled Restart while the peak recording
session is running stops the session, discards all peak recorded
data, and immediately starts a new peak record session.
When viewing saved records, snapshot peak records look the
same as a stopped peak records. Therefore, use the elapsed
time (average value time stamp) to identify one record from
another.
To extend battery life during peak record, the Meter enters a
battery-saver mode after a period of time set for the Auto Off
feature. See the “Setting Backlight and Auto Off Timeouts”
section for more information on the battery saver mode.
19
Find Quality Products Online at: sales@GlobalTestSupply.com
www.GlobalTestSupply.com
Page 29

287/289
Users Manual
Low Pass Filter (Model 289 only)
The Meter is equipped with an ac low pass filter. When
measuring ac voltage, or Vac frequency, press the softkey
labeled Menu to open the function menu, and move the menu
selector to the l item. Next, press the softkey labeled
l to toggle the low pass filter mode on (l displayed)
and off.
XWWarning
To avoid possible electric shock or personal
injury, do not use the Low Pass Filter option to
verify the presence of hazardous voltages.
Voltages greater than what is indicated may be
present. First, make a voltage measurement
without the filter to detect the possible presence of
hazardous voltage. Then select the filter function.
The Meter continues measuring in the chosen ac mode, but now
the signal passes through a filter that blocks unwanted voltages
above 1 kHz, as shown in Figure 8. The low pass filter can
improve measurement performance on composite sine
waves that are typically generated by inverters and variable
frequency motor drives.
Note
In Low Pass Mode, the Meter goes to manual mode.
Select ranges by pressing R. Autoranging is not
available when the Low Pass Filter is enabled.
100 Hz
1 kHz
Figure 8. Low Pass Filter
aom11f.eps
20
Find Quality Products Online at: sales@GlobalTestSupply.com
www.GlobalTestSupply.com
Page 30

True-rms Digital Multimeters
Making Relative Measurements
Making Relative Measurements
The Meter displays calculated values that are based on a stored
value when set to relative and relative percent mode. Figure 9
shows the functions for which the two relative modes are
available. In addition, the two relative modes are available in
frequency, duty cycle, pulse width, crest factor, and dB.
est29.eps
Figure 9. Relative Mode Functions
To activate the relative or relative percent modes while in one of
the functions shown in Figure 9, press the softkey labeled Menu.
Move the menu selector to the menu item labeled REL. Next,
press either the softkey labeled REL or REL%. The
measurement value at the time that either Rel or Rel % is
enabled, is stored as the reference value and displayed in the
secondary display. The present or “Live” measurement moves to
the secondary display and the primary display indicates the
difference between the present measurement and the reference
value in measurement units for REL and as a percentage for
REL %.
When relative percent is enabled, the bar graph is a zerocentered bar graph that indicates the percentage difference. The
bar graph’s range is limited to ±10 %, but the display goes to
±999.9 %. At 1000 % or more, the display indicates OL. When
the reference value is 0, the Meter displays OL.
With the exception of dB measurements, ranging is set to
manual and can not be changed. Both auto and manual ranging
is possible when making relative dB measurements.
When relative is enabled during dBm or dBV measurements, the
displayed units change to dB.
In relative or relative percent mode, the softkey label for F3
indicates REL or REL%, depending on which of the two modes
is not presently selected. The F3 button acts as a toggle,
switching the Meter between the two modes. Moving the rotary
switch between V and mV while in relative dBm or dBv mode
does not disable the dB measurement. This allows continuous
measurements over a wide range of input voltage.
21
Find Quality Products Online at: sales@GlobalTestSupply.com
www.GlobalTestSupply.com
Page 31

287/289
Users Manual
Making Measurements
The following sections describe how to take measurements with
the Meter.
Measuring AC Voltage
The Meter displays ac voltage measurements as rms (root mean
square) readings. The rms value is the equivalent dc voltage that
would produce the same amount of heat in a resistance as the
measured voltage. True-rms readings are accurate for sine
waves and other wave forms (with no dc offset) such as square
waves, triangle waves, and staircase waves. For ac with dc
offset, refer to the “Measuring AC and DC Signals” section later
in this manual.
Rotate the Meter’s rotary switch to V or T and set up the Meter
to measure ac volts as shown in Figure 10.
The Meter’s ac volts function offers a number of modes to
provide more details about an ac signal. Pressing the softkey
labeled Menu opens a menu of items that can be used to modify
the basic ac voltage measurement. Refer to the appropriate
section in this manual to learn more about each menu item.
To clear all modes and return to the basic volts ac measurement,
press the softkey labeled Menu. Move the menu selector to the
item labeled VAC. Press the softkey labeled VAC to clear all
functions and modes.
08:10pm
123.45
100 200 300 400
Menu
Save Setup
03 / 13/ 06
VAC
Auto Range
500 VAC0
Switch
Box
est07.eps
Figure 10. AC Voltage Measurements
22
Find Quality Products Online at: sales@GlobalTestSupply.com
www.GlobalTestSupply.com
Page 32

True-rms Digital Multimeters
Making Measurements
Using LoZ for Voltage Measurements (Model 289 only)
W Caution
Do not use the LoZ mode to measure voltages in
circuits that could be damaged by this mode’s low
impedance (≈3 kΩ).
To eliminate ghost voltages, the Meter’s LoZ function presents a
low impedance across the leads to obtain a more accurate
measurement.
To make a LoZ measurement, set the rotary switch to L. The
Meter displays the ac voltage in the primary display and the dc
voltage in the secondary display. During LoZ measurements, the
Meter’s range is set to 1000 volts in the manual ranging mode.
In LoZ, both R and M are disabled. There are no additional
modes for this function and the softkey labeled Menu is therefore
disabled as well.
Making dB Measurements
The Meter is capable of displaying voltage as a dB value, either
relative to 1 milliwatt (dBm), a reference voltage of 1 volt (dBV)
or a user-selectable reference value. See the “Setting a Custom
dBm Reference” section later in this manual.
8:10pm
06/13/07
dBm
41.83
123.45
1000 Reference
Menu
To set the Meter to display values in dBm, set the rotary switch
to V or T and press the softkey labeled Menu. Move the menu
selector to the menu item labeled dBm. Press the softkey
labeled dBm. The dBm, Hz menu selection replaces the
secondary display (123.45 VAC in Figure 11) with the frequency
measurement. All voltage measurements are displayed as a
dBm value, as shown in Figure 11.
A dBm measurement must use a reference impedance
(resistance) to calculate a dB value based on 1 milliwatt. When
set to 600 Ω (default), the reference impedance is not displayed
during a dBm measurement. When set to something other than
600 Ω, the reference impedance is displayed just above the
softkey labels.
Save Setup
Figure 11. dBm Display
Ref
Auto Range
500 VAC0 100 200 300 400
VAC
est08.eps
23
Find Quality Products Online at: sales@GlobalTestSupply.com
www.GlobalTestSupply.com
Page 33

287/289
Users Manual
To select another reference value, press the softkey labeled Ref
to display a message box with the current reference value.
Pressing 7 or 8, scrolls through the nine predefined references:
4, 8, 16, 25, 32, 50, 75, 600, and 1000. Set the reference by
pressing the softkey labeled OK. To add a custom reference
impedance, see the “Setting a Custom dBm Reference” section
later in this manual.
A dBV measurement uses a 1 volt reference voltage to compare
the present measurement against. The difference between the
two ac signals is displayed as a dBV value. The reference
impedance setting is not part of a dBV measurement.
To make a dBV measurement, position the rotary switch to V or
T and place the Meter leads on the voltage to be measured.
Next, press the softkey labeled Menu. Move the menu selector
to the menu item labeled dBV and press the softkey labeled
dBV. The Meter displays the voltage in dBV.
To exit the dBV or dBm function, press the softkey labeled Menu
followed by the softkey labeled dBV or dBm, respectively.
Selecting one of the other modifiers such as ms, %, or CF also
cancels dBV or dBm.
24
Find Quality Products Online at: sales@GlobalTestSupply.com
www.GlobalTestSupply.com
Page 34

True-rms Digital Multimeters
Making Measurements
Measuring DC Voltage
The Meter displays dc volts values as well as their polarity. The
bar graph for dc voltage measurements is a zero-centered bar
graph. Positive dc voltages cause the bar graph to fill to the right
of center while negative dc voltages fill left of center.
To measure a dc voltage with the Meter, rotate the rotary switch
to the U or N position as shown in Figure 12.
The Meter’s dc volts function offers a number of modes to
provide more details about a dc signal. Pressing the softkey
labeled Menu opens a menu of items that can be used to modify
the basic dc voltage measurement. Refer to the appropriate
section in this manual to learn more about each menu item.
To clear all modes and return to the basic volts dc measurement,
press the softkey labeled Menu. Move the menu selector to the
item labeled VDC. Press the softkey labeled VDC to clear all
functions and modes.
8:10pm
9.752
Save Setup
Menu
06/13/07
VDC
Auto Range
50 VDC3020100-10-20-30-40-50 40
VV
est09.eps
Figure 12. DC Voltage Measurements
25
Find Quality Products Online at: sales@GlobalTestSupply.com
www.GlobalTestSupply.com
Page 35

287/289
Users Manual
Measuring AC and DC Signals
The Meter is capable of displaying both ac and dc signal
components (voltage or current) as two separate readings or one
AC+DC (rms) value combined. As shown in Figure 13, the Meter
displays ac and dc combinations three ways: ac displayed over
dc (AC,DC), dc displayed over ac (DC,AC), and ac combined
with dc (AC+DC). Select one of these three displays using the
Function and Mode menu.
With the rotary switch set to U, N, A, or X, press the
softkey labeled Menu. Move the menu selector to the menu item
labeled AC+DC. At this point, three different softkey labels
AC over DC DC over AC AC + DC
8:10pm
06/13/07
8:10pm
VAC
123.45
23.45
Menu
Save Setup
Auto Range
500 VAC
VDC
23.45
Menu
Figure 13. AC and DC Display
Save Setup
indicate AC+DC (F1), AC,DC (F2), and DC,AC (F3). Press the
softkey that presents these two signals as needed.
While in any of the three AC+DC modes, peak measurements,
frequency, duty cycle, and period measurements are not
allowed. In addition to these modes, MIN MAX, relative, and
relative % are not allowed in AC,DC or DC,AC modes.
123.45
Note
The bar graph is not displayed while the Meter is in
any of the three AC+DC modes.
06/13/07
VDC
Auto Range
500 V
VAC
8:10pm
125.66
23.45
Menu
Save Setup
06/13/07
V
AC + DC
Auto Range
VDC
500 V
est30.eps
Both manual and autoranging is available when using the ac+dc
modes. The same range is used for both ac and dc signals.
However, while in autorange, up-ranging occurs when either the
ac or dc signal exceeds the present range. Down-ranging occurs
26
Find Quality Products Online at: sales@GlobalTestSupply.com
www.GlobalTestSupply.com
Page 36

True-rms Digital Multimeters
Making Measurements
only when both the ac and dc signals drop below 10% of the
present range. For AC+DC, ranging is controlled by the
underlying values of the ac and dc signals and not by the sum of
the AC+DC calculation.
To exit the AC+DC mode, press the softkey labeled Menu and
select the default mode for the selected function. For dc volts
and dc millivolts functions, move the menu selector to VDC and
press the softkey labeled VDC. For the current functions, move
the menu selector to the AC,DC menu item and press either the
AC or DC softkey.
27
Find Quality Products Online at: sales@GlobalTestSupply.com
www.GlobalTestSupply.com
Page 37

287/289
Users Manual
Measuring Temperature
XW Warning
To avoid the potential for fire or electric shock, do
not connect the thermocouple to electrically live
circuits.
The Meter uses an 80BK-A Integrated DMM Temperature Probe
or other type-K temperature probe for measuring temperature.
To measure temperature, set up the Meter as shown in
Figure 14. Press the softkey labeled Menu and move the menu
selector to the menu item labeled Temp. Press the softkey
labeled F for temperature in Fahrenheit or C for Celsius.
Note
A Meter classified as “SI” will not have an F selection.
The primary display normally shows temperature or the message
“Open Thermocouple”. The open thermocouple message may be
due to a broken (open) probe or because no probe is installed
into the input jacks of the Meter. Shorting the W terminal to
the COM terminal will display the temperature at the Meter
terminals.
Note
R is disabled when the Meter is in the Temperature
function.
8:10pm
Menu
06/13/07
26.5
+8.0 Offset
Save Offset Setup
C
80BK Type K
Thermocouple
Probe
Figure 14. Temperature Measurement
Vent
or
Pipe
est17.eps
28
Find Quality Products Online at: sales@GlobalTestSupply.com
www.GlobalTestSupply.com
Page 38

True-rms Digital Multimeters
Making Measurements
To input a temperature offset value, press the softkey labeled
Offset to open a message box with the present offset value. Use
6 and 5 to position the cursor over one of the digits or the polarity
sign. Use 7 and 8 to scroll through the numbers for each digit
in the offset or switch between a + or – offset. With the desired
value displayed, press the softkey labeled OK to set the
temperature offset. When set to something other than 0.0, the
offset value is shown in the secondary display.
Measuring Resistance
W Caution
To avoid possible damage to the meter or to the
equipment under test, disconnect circuit power
and discharge all high-voltage capacitors before
measuring resistance.
The Meter measures resistance (opposition to current flow) in
ohms (Ω). This is accomplished by sending a small current out
through the test leads to the circuit under test.
To measure resistance, set the Meter’s rotary switch to
set up the Meter as shown in Figure 15.
S and
Keep the following in mind when measuring resistance.
Because the meter’s test current flows through all possible paths
between the probe tips, the measured value of a resistor in a
circuit is often different from the resistor’s rated value.
The test leads can add 0.1 Ω to 0.2 Ω of error to resistance
measurements. To test the leads, touch the probe tips together
and read the resistance of the leads. To remove lead resistance
from the measurement, hold the test lead tips together and press
the softkey labeled Menu. Next, move the menu selector to the
menu item labeled REL and press the softkey labeled REL. Now
all future displayed readings indicate the resistance at the probe
tips.
The Meter’s resistance function includes modes to help with
resistance measurements. Pressing the softkey labeled Menu
opens a menu of items that can be used to modify the basic
resistance measurement. Refer to the appropriate section in this
manual to learn more about each menu item.
29
Find Quality Products Online at: sales@GlobalTestSupply.com
www.GlobalTestSupply.com
Page 39

287/289
Users Manual
8:10pm
Menu
06/13/07
5.67
Auto Range
Save Setup
In-Circuit Resistance Measurements
Isolating a Potentiometer
Circuit Power
500 0 100 200 300 400
OFF
1
2
3
Disconnect
1
2
3
Isolating a Resistor
Disconnect
est11.eps
Figure 15. Resistance Measurement
30
Find Quality Products Online at: sales@GlobalTestSupply.com
www.GlobalTestSupply.com
Page 40

True-rms Digital Multimeters
Making Measurements
Using the
To avoid damaging the circuit under test, be aware
the Meter sources current up to 10 mA at an open
circuit voltage up to 20 volts.
To measure low resistances with the Meter, position the rotary
switch to Y. This function has a single range and R is
therefore disabled when the Meter is in the Y function.
Only the relative and relative percent functions work with the
Y function. Press the softkey labeled Menu to access these
two functions.
Y
Function (Model 289 Only)
W Caution
Testing for Continuity
W Caution
To avoid possible damage to the meter or to the
equipment under test, disconnect circuit power
and discharge all high-voltage capacitors before
testing continuity.
Continuity is the presence of a complete path for current flow.
The continuity function detects intermittent opens and shorts
lasting as short as 1 ms. The Meter uses three indicators for the
absence and presence of continuity: a resistance reading, an
open/short indicator, and a beeper.
The resistance reading is simply an ohms function measurement.
However, for continuity transitions that are very short, the slow
measurement response of the Meter will not appear in the digital
display. Therefore, the continuity function uses a graphical
indicator for the presence or absence of continuity. Figure 16
shows the short and open continuity indication.
Short
Open
est36.eps
Figure 16. Continuity Indicator
To perform a continuity test, position the rotary switch to S and
set up the Meter as shown in Figure 17. Press the softkey
labeled j. In continuity, a short means a measured value less
than 8 % of full scale for the 500 Ω range and less that 4 % for
other resistance ranges.
Note
The Meter operates in manual range only while the
continuity function is selected.
31
Find Quality Products Online at: sales@GlobalTestSupply.com
www.GlobalTestSupply.com
Page 41

287/289
Users Manual
For in-circuit tests, turn circuit power off.
Beep on short Beep on open
32
8:10pm
Menu
06/13/07
5.67
Beep on SHORT
Save Setup
Continuity
8:10pm
500 0 100 200 300 400
MenuOLSave Setup
Beep on OPEN
06/13/07
Continuity
500 0 100 200 300 400
ON
(closed)
OFF
(open)
ON
(closed)
OFF
(open)
est13.eps
Figure 17. Continuity Testing
Find Quality Products Online at: sales@GlobalTestSupply.com
www.GlobalTestSupply.com
Page 42

True-rms Digital Multimeters
Making Measurements
To change whether the beeper sounds on shorts or opens, press
the softkey labeled Menu. Move the menu selector to the menu
item labeled Beeper and press the softkey labeled Short/O….
This beeper selection, Beep on Short or Beep on Open, is
displayed just above the continuity indicator. The continuity
beeper is always enabled when continuity mode if first entered.
To enable or disable the beeper for continuity, press the softkey
labeled Menu. Move the menu selector to the menu item labeled
Beeper and press the softkey labeled Beeper. The status of the
continuity beeper is displayed to the right of the resistance
reading with j when enabled and i
setting is independent of the Meter’s beeper enable/disable
setting in the setup menu.
Toggle between the continuity and ohms functions by pressing
softkey F3, which is always labeled with the alternate function.
when disabled. This
33
Find Quality Products Online at: sales@GlobalTestSupply.com
www.GlobalTestSupply.com
Page 43

287/289
Users Manual
Using Conductance for High Resistance Tests
Conductance, the inverse of resistance, is the ability of a circuit
to pass current. High values of conductance correspond to low
values of resistance.
The unit of conductance is the Siemens (S). The meter’s 50 nS
range measures conductance in nanosiemens (1 nS =
0.000000001 Siemens). Because such small amounts of
conductance correspond to extremely high resistance, the nS
range is used to measure the resistance of components up to
100,000 MΩ, or 100,000,000,000 Ω (1 nS = 1,000 MΩ).
To measure conductance, position the rotary switch to
set up the Meter as shown in Figure 18. Move the menu selector
to the menu item labeled Ohms,nS,j and press the softkey
labeled nS.
There is normally a residual conductance reading with the test
leads open. To ensure accurate readings, press the softkey
labeled Menu. Move the menu selector to the menu item labeled
REL and press the softkey labeled REL to subtract the residual
value with the test leads open.
Note
R is disabled when the Meter is measuring
conductance.
S and
8:10pm
26.55
Menu
06/13/07
nS
Manual Range
Save Setup
50 nS010203040
est14.eps
Figure 18. Conductance Measurement
34
Find Quality Products Online at: sales@GlobalTestSupply.com
www.GlobalTestSupply.com
Page 44

True-rms Digital Multimeters
Making Measurements
Measuring Capacitance
W Caution
To avoid possible damage to the meter or to the
equipment under test, disconnect circuit power
and discharge all high-voltage capacitors before
measuring capacitance. Use the dc voltage
function to confirm that the capacitor is
discharged.
Capacitance is the ability of a component to store an electrical
charge. The unit of capacitance is the farad (F). Most capacitors
are in the nanofarad (nF) to microfarad (μF) range.
The Meter measures capacitance by charging the capacitor with
a known current for a known period of time, measuring the
resulting voltage, and then calculating the capacitance.
8:10pm
26.52
Menu
06/13/07
Auto Range
Save Setup
100 uF
Figure 19. Capacitance Measurement
+
+
+
+
+
+
+
+
+
est15.eps
35
Find Quality Products Online at: sales@GlobalTestSupply.com
www.GlobalTestSupply.com
Page 45

287/289
Users Manual
To measure capacitance, position the rotary switch to P and set
up the Meter as shown in Figure 19. If the display doesn’t
already indicate the Meter is measuring capacitance, press the
softkey labeled Menu. Next, move the menu selector to the
menu item labeled Diode,Cap and press the softkey labeled
Cap.
Note
To improve measurement accuracy of small value
capacitors, press Menu and move the menu selector
to the menu item labeled REL. With the test leads
open, press the softkey labeled REL to subtract the
residual capacitance of the Meter and leads.
Testing Diodes
W Caution
To avoid possible damage to the meter or to the
equipment under test, disconnect circuit power
and discharge all high-voltage capacitors before
testing diodes.
Use the diode test to check diodes, transistors, silicon controlled
rectifiers (SCRs), and other semiconductor devices. The test
sends a current through a semiconductor junction, and then
measures the junction’s voltage drop. A typical junction drops
0.5 V to 0.8 V.
To test a diode out of a circuit, position the rotary switch to P
and set up the meter as shown in Figure 20. If the display
doesn’t already indicate the Meter is in the Diode Test function,
press the softkey labeled Menu. Next, move the menu selector
to the menu item labeled Diode,Cap and press the softkey
labeled Diode.
If the beeper is enabled during diode test, it will beep briefly for a
normal junction and sound continuously for a shorted junction,
below 0.1 V. See the “Disabling and Enabling the Beeper”
section to disable the beeper.
In a circuit, a similar diode should still indicate a forward-bias
reading of 0.5 V to 0.8 V; however, the reading can vary
depending on the resistance of other pathways between the
probe tips.
Note
R and MIN MAX are disabled when the Meter is
setup for diode test.
36
Find Quality Products Online at: sales@GlobalTestSupply.com
www.GlobalTestSupply.com
Page 46

True-rms Digital Multimeters
Making Measurements
Typical
8:10pm
.567
06/13/07
VDC
Manual Range
Reading
5 VDC01234
8:10pm
OL
06/13/07
VDC
Manual Range
5 VDC01234
Reverse Bias
Menu
Save Setup
Menu
Save Setup
+
Forward Bias
+
est16.eps
Figure 20. Diode Testing
37
Find Quality Products Online at: sales@GlobalTestSupply.com
www.GlobalTestSupply.com
Page 47

287/289
Users Manual
Measuring Current
XW Warning
To avoid damage to the Meter and possible injury,
never attempt an in-circuit current measurement
where the open-circuit potential to earth is greater
than 1000 V.
W Caution
To avoid possible damage to the Meter or to the
equipment under test, check the meter’s fuses
before measuring current. See the Maintenance
section later in this manual. Use the proper
terminals, function, and range for your
measurement. Never place the probes across (in
parallel with) any circuit or component when the
leads are plugged into the current terminals.
Current is the flow of electrons through a conductor. To measure
current, you must open the circuit under test, then place the
meter in series with the circuit.
Note
When measuring current, the display will flash when
the input current exceeds 10 amps for the A terminal
and 400 mA for the mA/
that current is approaching the fuse’s current limit.
To measure ac or dc current, proceed as follows:
1. Turn off power to the circuit. Discharge all high- voltage
capacitors.
μ
A terminal. This is a warning
2. Insert the black lead into the COM terminal. Insert the red
lead in an input appropriate for the measurement range.
Note
To avoid blowing the Meter’s 440 mA fuse, use the
mA/
μ
A terminal only if you are sure the current is less
than 400 mA.
3. If you are using the A terminal, set the rotary switch to A.
If you are using the mA/μA terminal, set the rotary switch to
X for currents below 5000 μA (5 mA), or A for
currents above 5000 μA. See Figure 21 for test lead
connections and function selection. Refer to the “Input Alert
Feature” section for information on the alerts the Meter uses
when leads are not used correctly for current
measurements.
4. As shown in Figure 22, open the circuit path to be tested.
Touch the red probe to the more positive side of the break;
touch the black probe to the more negative side of the
break. Reversing the leads will produce a negative reading,
but will not damage the meter.
5. Turn on power to the circuit; then read the display. Be sure
to note the measurement unit given at the right side of the
display (μA, mA, or A).
6. Turn off power to the circuit and discharge all high-voltage
capacitors. Remove the Meter and restore the circuit to
normal operation.
38
Find Quality Products Online at: sales@GlobalTestSupply.com
www.GlobalTestSupply.com
Page 48

True-rms Digital Multimeters
Making Measurements
Note
While in a current measurement function, the Meter
will stay in the selected AC or DC current
measurement mode when switching between n and
€
. Whenever switched to one of the current
measurement functions, the Meter will default to the
last current type selected (AC or DC).
39
Find Quality Products Online at: sales@GlobalTestSupply.com
www.GlobalTestSupply.com
Page 49

287/289
Users Manual
40
8:10pm
2.5527
Menu
Save Setup
06/13/07
AAC
Auto Range
8:10pm
5 AAC01234
19.783
Menu
06/13/07
mAAC
Auto Range
Save Setup
5 AAC01234
8:10pm
4.863
Menu
06/13/07
uAAC
Auto Range
Save Setup
5 AAC01234
est18.eps
Figure 21. Current Measurement Setup
Find Quality Products Online at: sales@GlobalTestSupply.com
www.GlobalTestSupply.com
Page 50

True-rms Digital Multimeters
Making Measurements
Circuit Power:
8:10pm
06/13/07
mAAC
OFF to connect meter.
ON for measurement.
OFF to disconnect meter.
Total current to circuit
Current through one component
est19.eps
Figure 22. Current Measurement Circuit Connection
41
Find Quality Products Online at: sales@GlobalTestSupply.com
www.GlobalTestSupply.com
Page 51

287/289
Users Manual
W
Caution
Placing the probes across (in parallel with) a
powered circuit when a lead is plugged into a
current terminal can damage the circuit you are
testing and blow the Meter's fuse. This can happen
because the resistance through the Meter's current
terminals is very low, so the Meter acts like a short
circuit.
The following are tips for current measurements:
A current meter drops a small voltage across itself, which might
affect circuit operation. You can calculate this burden voltage
using the values listed in the specifications under Burden Voltage
(A, mA, μA).
The Meter’s current functions have a number of modes which
provide more details about a current signal. Pressing the softkey
labeled Menu opens a menu of items that can be used to modify
the basic current measurement. Refer to the appropriate section
in this manual to learn more about each menu item.
To clear all modes and return to the basic ac or dc current
measurement, press the softkey labeled Menu. Move the menu
selector to the item labeled AC,DC. Press the softkey labeled AC
to clear all functions and modes and make basic ac current
measurements, or DC for basic dc current measurements.
Measuring Frequency
Frequency is the number of cycles a signal completes each
second. The meter measures the frequency of a voltage or
current signal by counting the number of times the signal crosses
a threshold level within a specified period of time.
Figure 23 highlights the functions that allow frequency
measurements.
est21.eps
Figure 23. Functions Allowing Frequency
Measurement
The Meter autoranges to one of five frequency ranges:
99.999 Hz, 999.99 Hz, 9.9999 kHz, 99.999 kHz, and 999.99 kHz.
Figure 24 shows a typical frequency display. Pressing R
controls the input range of the primary function (volts or amps)
and not the frequency range.
To measure frequency, rotate the switch to one of the primary
functions allowing frequency measurements highlighted in
Figure 23. Press the softkey labeled Menu and move the menu
42
Find Quality Products Online at: sales@GlobalTestSupply.com
www.GlobalTestSupply.com
Page 52

True-rms Digital Multimeters
Making Measurements
selector to the menu item labeled Hz,%,ms. Next press the
softkey labeled Hz.
8:10pm
06/13/07
Hz
60.050
123.45
Menu
As shown in Figure 24, the frequency of the input signal is
displayed in the primary display. The volts or amps value of the
signal is shown in the secondary display. The bar graph does not
indicate frequency but indicates the volts or amps value of the
input signal.
Save Setup
Figure 24. Frequency Display
Auto Range
500 VAC0 100 200 300 400
VAC
est22.eps
Selection between a rising trigger c or falling trigger dedge is
performed by pressing the softkey labeled c d. This softkey
toggles the trigger setting between the two selections.
The following are tips for frequency measurements:
If a reading shows as 0 Hz or is unstable, the input signal may be
below or near the trigger level. You can usually correct these
problems by manually selecting a lower input range, which
increases the sensitivity of the meter.
If a reading seems to be a multiple of what you expect, the input
signal may be distorted. Distortion can cause multiple triggerings
of the frequency counter. Selecting a higher voltage range might
solve this problem by decreasing the sensitivity of the meter. In
general, the lowest frequency displayed is the correct one.
Measuring Duty cycle
Duty cycle (or duty factor) is the percentage of time a signal is
above or below a trigger level during one cycle, as shown in
Figure 25.
The duty-cycle mode is optimized for measuring the on or off
time of logic and switching signals. Systems such as electronic
fuel injection systems and switching power supplies are
controlled by pulses of varying width, which can be checked by
measuring duty cycle.
43
Find Quality Products Online at: sales@GlobalTestSupply.com
www.GlobalTestSupply.com
Page 53

287/289
Users Manual
Trigger Level
Measures Positive Pulse
30% Above
Trigger
Level
100%
Measures Negative Pulse
Trigger Level
70% Below
Trigger Level
100%
Figure 25. Duty Cycle Measurements
est28.eps
44
Find Quality Products Online at: sales@GlobalTestSupply.com
www.GlobalTestSupply.com
Page 54

True-rms Digital Multimeters
Making Measurements
To measure duty cycle, position the rotary switch on one of the
functions allowing frequency measurements shown in Figure 23.
Press the softkey labeled Menu and move the menu selector to
the menu item labeled Hz,%,ms. Next press the softkey labeled
%.
8:10pm
123.45 VAC
06/13/07
%
49.75
100 200 300 400
59.756
Menu
As shown in Figure 26, the duty cycle percentage is shown in the
primary display while the signal frequency appears in the
secondary display. The mini-measurement display indicates the
Save Setup
Figure 26. Duty Cycle Display
Duty Cycle
Auto Range
500 VAC0
Hz
est24.eps
volts or amps value of the input signal. The bar graph tracks the
volts or amps value of the signal and not the duty cycle value.
The pulse polarity is displayed to the right of the duty cycle value.
J indicates a positive pulse and K indicates a negative pulse.
To change the polarity being measured, press the softkey
labeled J K. The polarity indicator changes to the opposite
polarity.
For 5 V logic signals, use the 5 V dc range. For 12 V switching
signals in automobiles, use the 50 V dc range. For sine waves,
use the lowest ac or dc range that does not result in multiple
triggering. A manually-selected lower input range will often
measure better than the AUTO-selected input range.
Measuring Pulse Width
The pulse width function measures the amount of time a signal is
high or low, as shown in Figure 27. The measured waveform
must be periodic; its pattern must repeat at equal time intervals.
The meter measures pulse width from 0.025 ms to 1250.0 ms
ranges.
To measure pulse width, position the rotary switch to one of the
functions allowing frequency measurements shown in Figure 23.
Press the softkey labeled Menu and move the menu selector to
the menu item labeled Hz,%,ms. Next, press the softkey labeled
ms.
45
Find Quality Products Online at: sales@GlobalTestSupply.com
www.GlobalTestSupply.com
Page 55

287/289
Users Manual
Trigger Level
Pulse
Width
Measure Positive Pulse Width
Period =
Measure Negative Pulse Width
Trigger Level
1
Frequency
Pulse Width
Period
Figure 27. Pulse Width Measurements
est27.eps
46
Find Quality Products Online at: sales@GlobalTestSupply.com
www.GlobalTestSupply.com
Page 56

True-rms Digital Multimeters
Changing Meter Setup Options
The primary display indicates the input signals pulse width in
milliseconds. The frequency of the signal is displayed in the
secondary display. The mini-measurement display indicates the
volts or amps value of the input signal. The bar graph tracks the
volts or amps value of the signal and not the pulse width value.
The pulse width polarity is displayed to the right of the duty cycle
value. J indicates a positive pulse width and K indicates a
negative pulse. To change the polarity, press the softkey labeled
J K. The polarity indicator changes to the opposite polarity.
Changing Meter Setup Options
The Meter has a number of preset features such as date and
time formats, backlight and battery save mode timeouts, and the
displayed language. These variables are referred to as Meter
setup options. Many setup options affect general Meter
operations and are active in all functions. Others are limited to
one function or group of functions.
Access to the setup options is always available through the
softkey labeled Setup. Information about the Meter, such as
serial number, model, for example. is also accessed through the
setup menu.
Resetting Meter Setup Options
The Meter’s setup options can be reset to default values through
the setup menu. Open the setup menu by pressing the softkey
labeled Setup. Position the menu selector next to the menu item
labeled Reset and press the softkey labeled Setup. A message
will appear asking to confirm the reset action. Press the softkey
labeled OK to perform the reset.
Note
A setup reset also resets the temperature offset and
dBm reference to their default value.
In addition to resetting the setup variables, pressing the softkey
labeled Meter will also clear all saved measurement screens,
MIN MAX screens, peak screens, and recording records. The
Meter’s clock is reset to a default value as well.
Setting Display Contrast
Meter display contrast can be adjusted through the Meter’s setup
menu. Open the setup menu by pressing the softkey labeled
Setup and position the menu selector next to the menu item
labeled Contrast. Pressing the softkey labeled + (F1) increases
display contrast, while the softkey labeled – (F2) decreases
contrast.
Contrast can also be set through the 7 and 8 buttons when not
being used to move between menu selections.
Setting the Meter’s Language
The Meter comes from the factory with the display language set
to English. To select another language, open the setup menu by
pressing the softkey labeled Setup. Move the menu selector next
to the menu item labeled Display. Next, press the softkey
labeled Format (F2) to open the format menu. If not already
selected, move the menu selector to the left of the menu item
labeled Language and press the softkey labeled Edit. The
currently selected language becomes highlighted and f appears
to the right of the language. Use 7 and 8 to scroll through the
available languages, then press the softkey labeled OK to set the
Meter’s display language. Press the softkey labeled Close to
return to normal Meter operation.
47
Find Quality Products Online at: sales@GlobalTestSupply.com
www.GlobalTestSupply.com
Page 57

287/289
Users Manual
Setting Date and Time
The Meter’s internal clock is used in the display and for timestamping recorded measurements. To change the date and time
as well as the display format, press the softkey labeled Setup.
Position the menu selector next to the menu item labeled
Display. To set the date and time, press the softkey labeled
Date/Time to open the date/time menu. Next, position the menu
selector next to either the Set Date item or Set Time item and
press the softkey labeled Edit. Using 5 and 6, position the cursor
on the date or time element to adjust. Use 7 and 8 to change
the selected date or time element value. Press OK to complete
the action.
Setting Backlight and Auto Off Timeouts
The Meter’s backlight and auto off features use timers to
determine when to turn off the backlight, when to automatically
turn the Meter off or enable the battery saver mode. To set these
timeouts, press the softkey labeled Setup and position the menu
selector next to the menu item labeled Instrument. Position the
menu selector next to the menu item labeled Auto Backlight
Timeout or Auto Power Off and then press the softkey labeled
Edit. Use 7 and 8 to adjust the time to one of the preset
values. Press OFF to disable the timeout feature. Press the
softkey labeled OK to set the selected time. Press the softkey
labeled Close to return to normal Meter operation.
The battery-saver mode is used when the Meter is performing a
recording session or during MIN MAX, Peak record and
AutoHold. The battery-saver mode powers down circuits that are
not involved in the operation of these recording sessions,
including the display. For the record mode, the timeout period is
set to five minutes and is enabled only when the Auto Power Off
timeout is set to a value other than Off. For MIN MAX, Peak, and
AutoHold, the timeout is the time period set for Auto Off.
Setting a Custom dBm Reference
To add a custom dBm reference value, press the softkey labeled
Setup and position the menu selector next to the menu item
labeled Instrument. Next press the softkey labeled Instrument
and position the menu selector next to the menu item labeled
dBm Reference. Next, press the softkey labeled Edit. Use 5 and
6 to position the cursor on a specific digit. Press 7 and 8 to
increment or decrement the digit. With the desired reference
displayed, press the softkey labeled OK to add this value to the
dBm reference list. Only one custom value is allowed. Press the
softkey labeled Close to return to normal Meter operation.
Disabling and Enabling the Beeper
The Meter’s beeper alerts users to the presence of messages,
operator errors such as incorrect lead connections for the
selected function, and newly sensed values for MIN MAX and
Peak recording. Although the beeper is also used for the
continuity function, controlling the beeper for that function is not
done through this setup option. See the “Testing for Continuity”
section for information on the continuity beeper.
To enable or disable the Meter’s beeper, press the softkey
labeled Setup and position the menu selector next to the menu
item labeled Instrument. Next press the softkey labeled
Instrument and position the menu selector next to the menu
item labeled Beeper. Press the softkey labeled Edit to move the
cursor to the on or off selection. Use 7 and 8 to switch the
beeper on or off. The status of the beeper is indicated in the
display’s status bar (see item 12 in Figure 2).
48
Find Quality Products Online at: sales@GlobalTestSupply.com
www.GlobalTestSupply.com
Page 58

True-rms Digital Multimeters
Using Memory
Enabling and Disabling the Smoothing Mode
When an AC input signal is noisy or changes rapidly, the
smoothing mode may display a steadier reading. To enable or
disable the smoothing mode, press the softkey labeled Setup
and position the menu selector next to the menu labeled
Instrument. Next press the softkey labeled Instrument and
position the menu selector next to the menu item labeled
Smoothing. Press the softkey labeled Edit to move the cursor to
the on or off selection. Use 7 and 8 to switch the smoothing
mode on or off.
Using Other Setup Options
Additional setup options hold information about the Meter as well
as some general Meter functions. The Meter Info selection lists
the serial number, model number, firmware version, calibration
date, and calibration counter. Operator name, company name,
site name, and contact information are also displayed when this
information has been loaded into the Meter from FlukeView®
Forms software.
The Calibration selection allows a qualified calibration
technician to enter a password that allows the Meter to be
calibrated. See the 287/289 Calibration Information document to
calibrate the Meter.
The Secure Erase option allows user-accessible memory to be
erased as required by Homeland Security regulations. Meter
calibration is not lost when this low-level erase is performed.
As new Meter features are created, the latest version of software
can be downloaded to the Meter from Fluke’s support web page
using the Software Update option.
Using Memory
The Meter has memory for storing individual measurements,
measurements collected over a specified duration, and
measurement events.
All stored data can be viewed on the Meter or downloaded to a
PC through the Meter’s infrared (IR) communication link using
FlukeView™ Forms. See the “Using Communications” section for
more information on communicating with a PC through
FlukeView Forms software.
Storing Individual Measurement Data
For all measurement functions, a snapshot of the screen data is
saved by pressing the softkey labeled Save. Except for the minimeasurement in the status bar, the display freezes and the Save
menu appears. Two choices allow either saving the data under a
previously selected name or choosing another name by pressing
the softkey labeled +Name. See the “Naming Saved Data”
section later in this manual. The displayed data is stored along
with the date and time of day the save was performed.
For MIN MAX and Peak, the displayed summary data can be
stored at any time by pressing the softkey labeled Save, thus
preserving a snapshot of the session at that moment.
Naming Saved Data
The Meter has a list of eight preset names under which
measurement data is saved. Multiple records can be saved using
the same name. For example, one preset name is Save. The first
time a save operation is performed with that name, Save-1 is
used to name the record in memory. The next time the Save
name is used, the number increments to 2 and the record is
49
Find Quality Products Online at: sales@GlobalTestSupply.com
www.GlobalTestSupply.com
Page 59

287/289
Users Manual
saved under the name of Save-2. The auto-incrementing number
can be reset to 1 by positioning the menu selector next to the
save name and then pressing the softkey labeled Reset #.
To save a screen shot, a recording session, or MIN MAX or Peak
record session, press the softkey labeled Save. To select the
name from the preset list, press +Name. To save to the same
name as before but with the next number, press the softkey
labeled Save. This second method makes it easy to save a
series of measurements simply by pressing the Save softkey
twice for each save operation.
When selecting the name for a save operation, position the menu
selector next to the desired name using the cursor buttons. Next
press the softkey labeled Save.
Viewing Memory Data
Viewing data stored in the Meter’s memory is performed through
the save menu. Press the softkey labeled Save. Position the
menu selector next to the menu item labeled View Memory and
press the softkey labeled View.
Note
To view data stored in memory, the Meter must not be
recording or performing a MIN MAX or peak record
session.
The Meter separates stored data into four different categories:
Measurement, MIN MAX, Peak, and Recording. Use the cursor
buttons to position the menu selector next to the desired saved
data category and then press the softkey labeled View. The
Meter displays the last record saved for the selected data
category.
If there are previously stored records, press the softkey labeled
Prev or 5 to page back through previously stored records. Press
the softkey labeled Next or 6 to page in the other direction. Press
Close to return to normal Meter operation.
Viewing Snapshot and Summary Data
After selecting the MIN MAX, Peak, or Measurement category
described in the Viewing Memory Data section above, pressing
View only displays the information stored at the time a Save was
performed. The display is reconstructed from this data when
viewed.
Viewing Trend Data
For the Recording category, the interval and event data stored
during a recording session are viewed on the Meter through a
trend-plot view, similar to a strip-chart recorder. See the
“Recording Measurement Data” section later in this manual for
an explanation of interval and event data.
After selecting the recording category described in the Viewing
Memory Data section above and pressing View, the recording
session’s summary screen is displayed (See Table 9). Press the
softkey labeled Trend to display the recorded data in a trend-plot
view. Table 7 shows the trend view along with a description of
each of its components.
To look at data stored in the individual records that make up the
trend, move the cursor to any point along the plot by pressing 6
or 5. The value and timestamp of the minimum, maximum, and
end-of-record values of the selected record are displayed at the
bottom of the cursor. All data contained in a record can only be
viewed on a PC running FlukeView Forms.
50
Find Quality Products Online at: sales@GlobalTestSupply.com
www.GlobalTestSupply.com
Page 60

True-rms Digital Multimeters
Using Memory
Note
X-axis time labels are shown in elapsed time while the
timestamp shown under the cursor is an absolute time
Table 7. Trend Data Display
3
5
6
est35.eps
VAC
1
40
30
20
10
0
0:15 0:30 0:45
7
2 4
01/16/08 09:43:17am x1
1:00 1:15 1:30
HH:MM
23.456 VAC 08:13:05 6/28/07
Item Description
A
Cursor
B
Start date and time
C
Trend line
D
Zoom level.
Elapsed time. Units in hours and minutes, or
E
minutes and seconds.
F
Time scale legend (HH:MM or MM:SS)
Measured value and timestamp of selected
G
record.
Zooming in on Trend Data
While viewing trend data, pressing 7 or 8 zooms in or out
respectively on the data around the cursor. Each press of 7
reduces the x-axis time period by one half to reveal more details.
Each press of 8 doubles the time period until all the recorded
data is displayed. The zoom level is displayed in the upper-right
hand corner of the display. X1 indicates the trend of the complete
recording period is displayed. X2 is one-half the recording time.
X3 is one-fourth the recoring time. This magnification can
continue until the x-axis time period is one second.
Deleting Stored Measurement Data
Deleting data stored in the Meter’s memory is performed through
the save menu. Press the softkey labeled Save. Use the softkey
labeled Prev and Next to select an item for deletion.
The Meter separates stored data into four different categories:
Measurement, MIN MAX, Peak, and Recording. Use the cursor
buttons to position the menu selector next to a saved data
category and then press the softkey labeled View to view the
item.
Pressing the softkey labeled Delete All will delete all stored data
under the selected saved data category. Or press the softkey
labeled View. After accepting a confirmation message, use the
51
Find Quality Products Online at: sales@GlobalTestSupply.com
www.GlobalTestSupply.com
Page 61

287/289
Users Manual
softkeys labeled Prev and Next to select an item for deletion.
Next, press the softkey labeled Delete. A message asking to
confirm the deletion will appear before anything is deleted from
memory.
Recording Measurement Data
The Meter’s record feature collects measurement information
over a user-specified duration. This collection of information is
called a recording session. A recording session is made up of
one or more measurement records. Each record contains
measurement summary information covering the duration of the
record.
Each record contains the minimum, maximum, and average
value detected over the record’s duration. In addition to
measurement values, time stamps are also captured and saved
with each record. The time stamps consist of the record start
time, the time the maximum value was detected, the time the
minimum value was detected, and the record end time.
Some of a records data can be viewed through the Meter’s
Viewing Trend Data function. Viewing all the data that makes up
a record can only be viewed on a PC running FlukeView Forms
software.
There are two measurement record types that are captured
during a recording session: interval and event. An interval record
covers a user-specified interval. An event record has a duration
determined by the activity of the measured signal and can
interrupt an interval record. Even if an interval record is
interrupted, a record will end and a new interval record will begin
when the scheduled interval time expires.
Event records are triggered by the measured signal varying more
than an adjustable percentage of the value measured at the start
of the record. This adjustable percent is called the Event
Threshold for recording. In addition to the values and time
stamps mentioned above, an event record also stores whether
the signal was stable or unstable during the event record
duration. To be classified as stable, the measured signal’s value
must stay within the selected percentage of the start value for at
least one second. Measured signals that exceed the percentage
threshold in less than one second are classified as unstable. See
the “Setting the Event Threshold Value” section later in this
manual.
Note
For temperature measurements, the AutoHold
threshold is a percent of 100 degrees. The default
AutoHold threshold is 4% of 100 degrees, or 4 degrees
Celsius or Fahrenheit.
A record ends when one of the following occurs:
• The start of a new interval record.
• A range overload, causing the Meter to change range.
• A non-ranging overload, when in manual range or the
highest range.
• The measured value changes more than 4 % of the
measured value at the start of the record.
• The recording session terminates.
A recording session termination can be caused by one of the
following:
52
Find Quality Products Online at: sales@GlobalTestSupply.com
www.GlobalTestSupply.com
Page 62

True-rms Digital Multimeters
Recording Measurement Data
• Recording session duration expiring.
• Manually stopping the recording session.
Setting up a Recording Session
Before starting a recording session, setup the Meter for the
measurements to be recorded. If needed, change the event
threshold value (see the “Setting the Event Threshold Value
section later in this manual). Press the softkey labeled Save to
open the save menu. Using the cursor buttons, move the menu
selector next to the menu item labeled Record and press the
softkey labeled Record to open the configuration display.
There are two variables in setting up a recording session:
Recording session duration, and sample interval duration. Both
variables affect the recording length and number of intervals
recorded. These two variables may interact, in that setting one
variable may adjust the other variable to fit the recording session
within the available memory. The percentage of memory
available at the beginning of a recording session is displayed
below the duration and sample interval settings. Option values
can be adjusted as follows:
The sample interval can be set from one second to 99 minutes
and 59 seconds. Recording session duration can be set from one
minute to 99 days 23 hours 59 minutes.
Table 8. Recording Display
8:10pm
123.45 VAC
06/13/07
Recording
1
VAC
1.75
Auto Range
100 200 300 400
Start Time:
6
5
Remaining Time: 2 Hrs 26 mins
Interval Samples: 47 Events:7
Reference: 121.70 VAC
06/10/07 07:23:55
Item Description
A
Recording session in progress icon.
B
Time and date when recording session started.
C
Time remaining until recording session stops.
D
Total number of event records recorded so far.
E
Reference value for relative measurements.
F
Total number of interval records recorded so far.
500 VAC0
Stop
2
3
4
est31.eps
53
Find Quality Products Online at: sales@GlobalTestSupply.com
www.GlobalTestSupply.com
Page 63

287/289
Users Manual
The Meter allocates memory in such a way as to guarantee
capturing all of the user-specified sample intervals. Event
records will also be captured until the Meter detects the allocated
memory has been used up. At this point, events are not
recorded, but the event counter continues to advance to indicate
the total number of events that occurred. A plus (+) sign appears
after the event count to indicate this condition.
Note
The maximum number of recorded sample intervals is
10,000. The maximum number of recorded events is
15,000 minus the number of sample intervals. These
maximum numbers are proportionally decreased when
the available memory is low.
To change either of the two recording variables, use the cursor
buttons to position the menu selector next to the desired menu
item and press the softkey labeled Edit. Use 5 6 7 and 8 to
move between and set each digit of the selected variable.
If the battery level is anything but full, a message appears at the
bottom of the record menu reminding you of the battery level
before you start the recording session.
Setting the Event Threshold Value
Press the softkey labeled Setup to access the setup menu.
Using the cursor buttons, move the menu selector next to the
menu item labeled Recording and press the softkey labeled
Recording to open the recording setup screen. Using the cursor
buttons, move the menu selector next to the menu item labeled
Event Threshold for Recording and then press the softkey
labeled Edit. Press 7 or 8 to scroll through the event threshold
values. With the desired value selected, press the softkey
labeled Close.
Starting a Recording Session
Once the variables are set, press the softkey labeled Start, at
which point s appears in the display and the green LED
surrounding the power button (O) flashes. Table 8 shows the
recording display and describes the information displayed.
The Menu, Setup, Reference, and Temperature Offset softkey
functions are not available while the Meter is recording. This
ensures that measurements within a recording session are
consistent.
To extend battery life while recording, the Meter may enter a
battery-saver mode five minutes after a push-button is pressed
or IR communications activity ends. If the Auto Power-Off
timeout is set to never, the battery-saver mode is disabled.
Stopping a Recording Session
The recording session will continue until the allocated memory is
used, the batteries expire, the rotary switch is moved, a probe is
inserted or removed from the A or mA/μA jacks, or the session is
terminated by pressing the softkey labeled Stop.
Table 9 shows the display and describes the displayed
information after stopping a recording session.
After stopping a recording session, choose to save the recording
session, view the trend data (see the “Viewing Trend Data”
section), or close the recording session. If the session wasn’t
saved before pressing the Close softkey, the data is lost.
54
Find Quality Products Online at: sales@GlobalTestSupply.com
www.GlobalTestSupply.com
Page 64
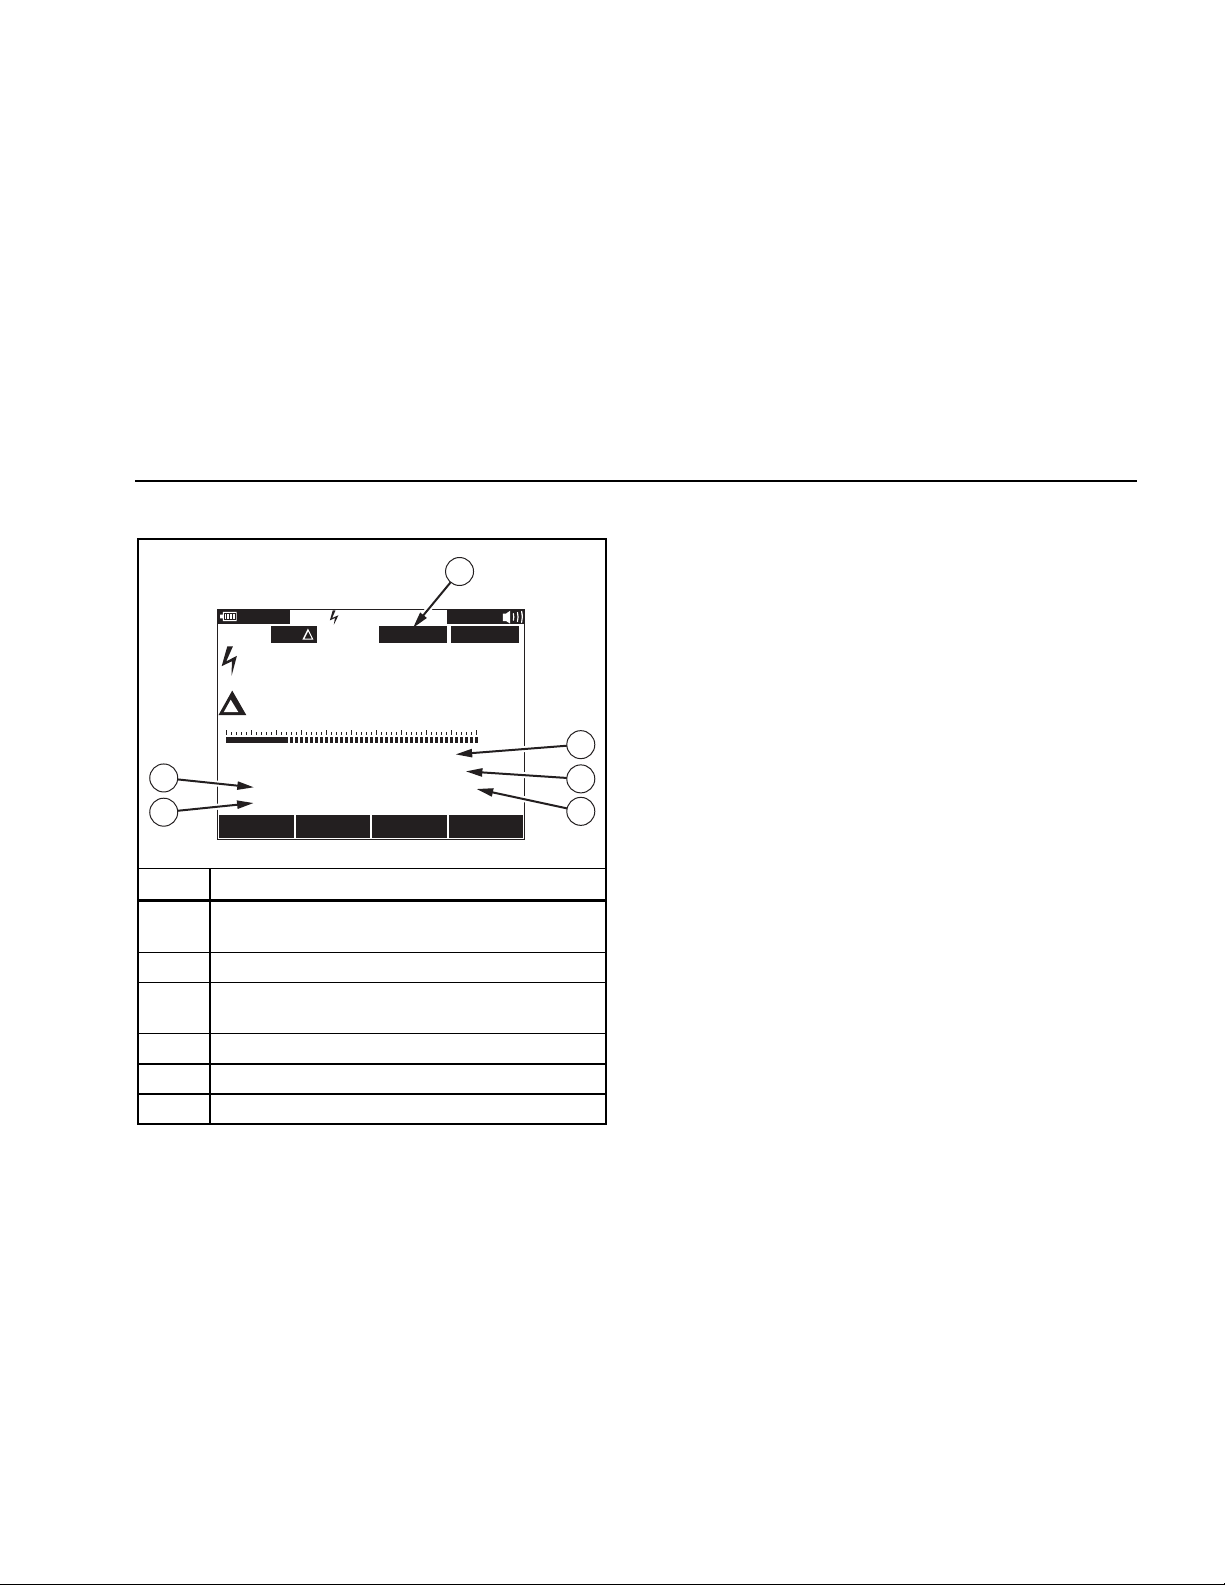
True-rms Digital Multimeters
Using Communications
Table 9. Stopped Recording Display
1
8:10pm
123.45 VAC
06/13/07
RecordingStoppedREL
VAC
1.75
Auto Range
100 200 300 400
Start Time :
6
5
Duration : 3 days 14 Hrs 47 mins
Interval Samples: 135 Events:53
Reference: 121.70 VAC
06/10/07 07:23:55
Save Trend Close
Item Description
Stopped Icon indicating the recording session is
A
stopped.
B
Time and date when the recording began.
Length (duration) of time recording session was
C
in progress.
D
Number of event records detected.
E
Reference value for relative measurements.
F
Number of interval records detected.
500 VAC0
2
3
4
est34.eps
Using Communications
You can use the IR communication link and FlukeView Forms
software to transfer the contents of a meter’s memory to a PC.
When using a PC-to-meter IR (infrared) communication link, refer
to the FlukeView Forms Installation Guide or the on-line help.
Note
The Meter will log in real-time mode to a connected
computer running FlukeView Forms. In addition, the
Meter allows the user to log to internal memory and
connect to the computer later for download.
FlukeView Forms allows you to place the data into standard
(default) or customized forms. The forms display the data in table
and graph form, as well as show user comments. You can use
these forms to satisfy ISO-9000 and other documentation
requirements.
55
Find Quality Products Online at: sales@GlobalTestSupply.com
www.GlobalTestSupply.com
Page 65

287/289
Users Manual
Error Messages
Table 10 list some of the error messages the Meter may display and the conditions that may be causing the error.
Table 10. Error Messages
Message Conditions
Leads connected incorrectly.
Open Thermocouple Thermocouple wire is open or thermocouple junction is corroded.
Batteries low – function
unavailable.
Error: Date and Time need to be
reset.
Not enough memory for
operation.
Batteries critically low, replace
now.
Lead in A or mA/μA jack but rotary switch not in corresponding A/mA or μA
position
Leads in both A and mA/μA jacks.
Rotary switch set to measure current but no lead in either A or mA/μA jack.
No Thermocouple connected to the Meter’s input.
The function selected requires a higher battery level to operate within specifications.
Batteries were left out too long and the Meter’s date and time were lost.
When starting a recording session or saving screen data, the Meter does not have
enough memory to store the information.
Battery is too low to make measurements within stated specifications. The Meter will turn
off within 15 seconds after this message appears to preserve the Meter’s date and time.
.
56
Find Quality Products Online at: sales@GlobalTestSupply.com
www.GlobalTestSupply.com
Page 66

True-rms Digital Multimeters
Maintenance
Maintenance
XWWarning
To avoid electrical shock or personal injury,
repairs or servicing not covered in this manual
should be performed only by qualified personnel
as described in the 287/289 Service Information.
General Maintenance
Periodically wipe the case with a damp cloth and mild detergent.
Do not use abrasives, isopropyl alcohol, or solvents.
Dirt or moisture in the terminals can affect readings and can
falsely activate the Input Alert feature. Clean the terminals as
follows:
1. Turn the Meter off and remove all test leads.
2. Shake out any dirt that may be in the terminals.
3. Soak a clean swab with mild detergent and water. Work the
swab around in each terminal. Dry each terminal using
canned air to force the water and detergent out of the
terminals.
Testing the Fuses
As shown in Figure 28, with the Meter in the S function, insert
a test lead into the W jack and place the probe tip on the
other end of the test lead against the metal of the current input
jack. If the “Leads Connected Incorrectly” message appears, the
probe tip has been inserted too far into the amps input jack. Back
the lead out a bit until the message disappears and either OL or
a resistance reading appears in the Meter’s display. The
resistance value should be between 0.00 and 0.50 Ω for the A
jack and 10.00 ±0.05 kΩ for the € jack.
XWWarning
To avoid electrical shock or personal injury,
remove the test leads and any input signals before
replacing the battery or fuses. To prevent damage
or injury, install only Fluke specified replacement
fuses with the amperage, voltage, and speed
ratings shown in Table 11.
57
Find Quality Products Online at: sales@GlobalTestSupply.com
www.GlobalTestSupply.com
Page 67

287/289
Users Manual
8:10pm
10.000
Menu Menu
06/13/07
k
Replace F1 if
reading is OL
Figure 28. Testing the Current Fuses
8:10pm
0.50
06/13/07
Replace F2 if
reading is OL
est33.eps
58
Find Quality Products Online at: sales@GlobalTestSupply.com
www.GlobalTestSupply.com
Page 68

True-rms Digital Multimeters
Maintenance
Replacing the Batteries
Refer to Figure 30 and replace the batteries as follows:
1. Turn the Meter off and remove the test leads from the
terminals.
2. Remove the battery door assembly by using a standardblade screwdriver to turn the battery door screw one-half
turn counterclockwise.
3. Replace the batteries with 1.5 volt AA batteries (NEDA 15A
IEC LR6). Observe proper polarity.
4. Reinstall the battery door assembly and secure it by turning
the screw one-half turn clockwise.
Replacing the Fuses
Referring to Figure 30, examine or replace the Meter's fuses as
follows:
1. Turn the Meter off and remove the test leads from the
terminals.
2. Remove the battery door assembly by using a standardblade screwdriver to turn the battery door screw one-half
turn counterclockwise.
3. Remove the fuse by gently prying one end loose, then
sliding the fuse out of its bracket.
4. Install only Fluke specified replacement fuses with the
amperage, voltage, and interrupt ratings shown in Table 11.
5. Reinstall the battery door assembly and secure it by turning
the screw one-half turn clockwise.
Test Lead Storage
Figure 29 shows the proper method for storing the test leads with
the Meter.
est41.eps
Figure 29. Test Lead Storage
59
Find Quality Products Online at: sales@GlobalTestSupply.com
www.GlobalTestSupply.com
Page 69

287/289
Users Manual
F2
11 A
F1
0.44 A
Figure 30. Replacing Batteries and Fuses
est32.eps
60
Find Quality Products Online at: sales@GlobalTestSupply.com
www.GlobalTestSupply.com
Page 70

True-rms Digital Multimeters
In Case of Difficulty
In Case of Difficulty
If the Meter does not seem to work properly:
1. Check that all batteries are installed with the correct
polarity.
2. Examine the case for damage. If damage is detected,
contact Fluke. See the “Contacting Fluke” section earlier in
this manual.
3. Check and replace (as needed) the batteries, fuses, and
test leads.
4. Review this manual to verify correct operation.
5. If the Meter still does not work, pack it securely and forward
it, postage paid, to the location provided by the appropriate
Fluke contact. Include a description of the problem. Fluke
assumes no responsibility for damage in transit.
A Meter under warranty will be repaired or replaced (at Fluke’s
option) and returned at no charge. See the registration card for
warranty terms.
61
Find Quality Products Online at: sales@GlobalTestSupply.com
www.GlobalTestSupply.com
Page 71

287/289
Users Manual
Service and Parts
Replacement parts and accessories are shown in Tables 11 and 12 and Figure 31. To order parts and accessories, refer to the “Contacting
Fluke” section.
Table 11. Replacement Parts
Item Description Qty.
1 Knob 1 2798434
2 Skin 1
3 Keypad 1 2578234
4 O-Ring 1 2740185
5 Case Top 1 2578178
6 Screw, Phillps 5 2743764
7 Mask, LCD 1
8 LCD Module 1 2734828
9 Shock Absorber 3 2793516
10 Spring Detent 1 2723772
11 RSOB Housing, Upper 1 2578283
12 Shield
Upper 1 2578252
Lower 1 2578265
Fluke Part/Model
Number
2798418 (289)
2798429 (287)
2760673 (289)
2798407 (287)
62
Find Quality Products Online at: sales@GlobalTestSupply.com
www.GlobalTestSupply.com
Page 72

True-rms Digital Multimeters
Service and Parts
Table 11. Replacement Parts (cont.)
Item Description Qty. Fluke Part/Model Number
13 RSOB Housing, Lower 1 2578290
14 Case Bottom 1 2578184
15 Shock Absorber, Battery Compartment 1 2793525
16 Battery Contact, Negative 2 2578375
17 Battery Contact, Positive 1 2578353
18 WFuse (F1), 0.440 A, 1000 V, FAST, Interrupt rating 10 kA 1 943121
19 WFuse (F2), 11 A, 1000 V, FAST, Interrupt rating 20 kA 1 803293
20 Battery, 1.5 V NEDA 15C/15F or IEC R6S 6 376756
21 Battery Door Assembly (includes tilt bail) 1 2824477
22 Screw, Phillips 7 853668
23 TL71 Right-Angle Test Lead Set 1 TL71
24 Alligator Clips, one black and one red 2
25 Manual, Manual Pack, Fluke 287/289 1 2748851
26 287/289 Users Manual CD
WTo ensure safety, use exact replacement only.
[1] The Users and Getting Started manuals are available through
[1]
1 2748872
. Click on Support and then Product Manuals.
1670652 (Black)
1670641 (Red)
63
Find Quality Products Online at: sales@GlobalTestSupply.com
www.GlobalTestSupply.com
Page 73

287/289
Users Manual
6
4 PL
2 PL
10
12
13
1
2
14
3
4
5
7
8
9
11
18
19
15
20
21
16
17
22
6 PL
23
25
24
26
est40.eps
Figure 31. Replaceable Parts
64
Find Quality Products Online at: sales@GlobalTestSupply.com
www.GlobalTestSupply.com
Page 74

True-rms Digital Multimeters
Service and Parts
Table 12. Accessories
Item Description
AC72 Alligator Clips for use with TL75 test lead set
AC220 Safety Grip, Wide-Jaw Alligator Clips
80BK-A 80BK-A Integrated DMM Temperature Probe
TPAK ToolPak Magnetic Hanger
C25 Carrying Case, Soft
TL76 4 mm Diameter Test Leads
TL220 Industrial Test Lead Set
TL224 Test Lead Set, Heat-Resistant Silicone
TP1 Test Probes, Flat Blade, Slim Reach
TP4 Test Probes, 4 mm diameter, Slim Reach
Fluke accessories are available from an authorized Fluke distributor.
65
Find Quality Products Online at: sales@GlobalTestSupply.com
www.GlobalTestSupply.com
Page 75

287/289
Users Manual
General Specifications
Maximum voltage between any Terminal and Earth Ground: 1000 V
W Fuse Protection for mA or μA inputs ............. 0.44 A (44/100 A, 440 mA), 1000 V FAST Fuse, Fluke specified part only
W Fuse Protection for A input............................. 11 A, 1000 V FAST Fuse, Fluke specified part only
Battery Type ..........................................................6 AA Alkaline batteries, NEDA 15A IEC LR6
Battery Life ............................................................100 hours minimum. 200 hours in Logging mode
Temperature
Operating ............................................................-20 °C to 55 °C
Storage................................................................-40 °C to 60 °C
Relative Humidity .................................................. 0 % to 90 % (0 °C to 37 °C), 0 % to 65 % (37 °C to 45 °C), 0 % to 45 % (45 °C to 55 °C)
Altitude
Operating ............................................................3,000 m
Storage................................................................10,000 m
Temperature Coefficient.......................................0.05 X (specified accuracy) /°C (<18 °C or >28 °C)
Vibration.................................................................Random Vibration per MIL-PRF-28800F Class 2
Shock .....................................................................1 meter drop per IEC/EN 61010-1 2
Size (HxWxL) .........................................................8.75 in x 4.03 in x 2.38 in (22.2 cm x 10.2 cm x 6.0 cm)
Weight ....................................................................28.0 oz (871 g)
Safety Standards
US ANSI.............................................................. Complies with ANSI/ISA 82.02.01 (61010-1) 2004
CSA..................................................................... CAN/CSA-C22.2 No 61010-1-04 to 1000 V Measurement Category III and 600 V
UL........................................................................UL 61010 (2003)
CE European.......................................................IEC/EN 61010-1 2
Measurement Category IV, Pollution Degree 2
nd
Edition Pollution Degree 2
nd
Edition
66
Find Quality Products Online at: sales@GlobalTestSupply.com
www.GlobalTestSupply.com
Page 76

True-rms Digital Multimeters
Detailed Specifications
Electromagnetic Compatibility Standards (EMC)
European EMC....................................................EN61326-1
Australian EMC ...................................................; N10140
US FCC ...............................................................FCC CFR47: Part 15 CLASS A
Certifications .........................................................UL, CE, CSA, ; (N10140),
s
Detailed Specifications
Accuracy:
Accuracy is specified for a period of one year after calibration, at 18 °C to 28 °C (64 °F to 82 °F), with relative humidity to 90 %. Accuracy
specifications are given as: ±( [ % of reading ] + [ number of least significant digits ] ). Accuracy specification assumes ambient temperature
stable at ±1 °C. For ambient temperature changes of ±5 °C, rated accuracy applies after 2 hours. To obtain full accuracy in DC mV,
Temperature, Ohms and Lo (50) Ohms, let the meter stabilize 20 minutes after using LoZ.
True-rms:
AC mV, AC V, AC μA, AC mA, and AC A specifications are ac-coupled, true rms, and are specified from 2 % of range to 100 % of range,
except 10 A range is specified from 10 % to 100 % of range.
Crest Factor:
Accuracy is specified with AC crest factor ≤ 3.0 at full-scale, increasing linearly to 5.0 at half-scale, except the 1000 V range, where it is 1.5
at full scale, increasing linearly to 3.0 at half-scale and 500 mV and 5000 μA, where it is ≤3.0 at 80 % of full scale, increasing linearly to 5.0
at half-scale. For non-sinusoidal waveforms add ±(0.3 % of range and 0.1 % of reading).
AC Floor:
When the input leads are shorted together in the ac functions, the Meter may display a residual reading up to 200 counts. A 200 count
residual reading will cause only a 20 count change for readings at 2 % of range. Using REL to offset this reading may produce a much larger
constant error in later measurements.
AC+DC:
AC+DC is defined as
22
dcac +
67
Find Quality Products Online at: sales@GlobalTestSupply.com
www.GlobalTestSupply.com
Page 77

287/289
Users Manual
AC Voltage Specifications
Function Range Resolution
[5]
AC V
dBV
Low pass filter
[4]
L
[1] Below 5 % of range, add 20 counts.
[2] Specification increases linearly from -2 % at 200 Hz to -6 % at 440 Hz. Range is limited to 440 Hz.
[3] dBm (600 Ω) is specified by adding +2.2 dB to the dBV range values.
[4] 289 only.
[5] 500 mV range specification between 64.000 kHz and 67.000 kHz is +(0.0 % to -5 % of reading); 50 mV range specification between 64.000 kHz and
[6] Add 2.5 % above 65 kHz.
[7] Range is limited to 440 Hz.
See Detailed Specifications introduction for additional information.
[4]
67.000 kHz is +(0.0 % to -6 % of reading ±40 counts). Valid from -20 °C to <18 °C and >28 °C to +55 °C.
[1]
50 mV
500 mV 0.01 mV 1.5 % + 60 0.3 % + 25 0.4 % + 25 0.7 % + 40 3.5 % + 40
5 V
50 V
500 V
1000 V 0.1 V 1.5 % + 60 0.3 % + 25 0.4 % + 25 Not Spec’d Not Spec’d
-70 to -62 dB
-62 to -52 dB
-52 to -6 dB
-6 to +34 dB
34 to 60 dB
0.001 mV 1.5 % + 60 0.3 % + 25 0.4 % + 25 0.7 % + 40 3.5 % + 40
[1]
0.0001 V 1.5 % + 60 0.3 % + 25 0.6 % + 25 1.5 % + 40 3.5 % + 40
[1]
0.001 V 1.5 % + 60 0.3 % + 25 0.4 % + 25 0.7 % + 40 3.5 % + 40
[1]
0.01 V 1.5 % + 60 0.3 % + 25 0.4 % + 25 Not Spec’d Not Spec’d
[3]
0.01 dB 3 dB 1.5 dB 2 dB 2 dB 3 dB
[3]
0.01 dB 1.5 dB 1.0 dB 1 dB 1 dB 2 dB
[3]
0.01 dB 0.2 dB 0.1 dB 0.1 dB 0.2 dB 0.8 dB
[3]
0.01 dB 0.2 dB 0.1 dB 0.1 dB 0.2 dB 0.8 dB
[3]
0.01 dB 0.2 dB 0.1 dB 0.1 dB Not Spec’d Not Spec’d
1000 V 0.1 V 2 % + 80 2 % + 40 2 % + 40
20 to 45 Hz 45 to 65 Hz 65 Hz to 10 kHz 10 to 20 kHz 20 to 100 kHz
2 % + 80 2 % + 40
Accuracy
2 % +10
-6 % -60 [2]
Not Spec’d Not Spec’d
[7]
Not Spec’d Not Spec’d
[6]
AC mV
[6]
68
Find Quality Products Online at: sales@GlobalTestSupply.com
www.GlobalTestSupply.com
Page 78

True-rms Digital Multimeters
Detailed Specifications
AC Current Specifications
Function Range Resolution
[3]
AC μA
[3]
[2]
[1] 10 A range (10 % to 100 % of range).
[2] 20 A for 30 seconds on, 10 minutes off. >10 A not specified.
[3] 400 mA continuous; 550 mA for 2 minutes on, 1 minute off.
[4] Verified by design and type tests.
See Detailed Specifications introduction for additional information.
500 μA 0.01 μA
5000 μA 0.1 μA
50 mA 0.001 mA 1 % + 20 0.6 % + 20 0.6 % + 20 5 % + 40 AC mA
400 mA 0.01 mA 1 % + 5 0.6 % + 5 1.5 % + 10 5 % + 40
5 A 0.0001 A 1.5 % + 20 0.8 % + 20 3 % + 40
[1]
10 A
0.001 A 1.5 % + 5 0.8 % + 5 3 % + 10
20 to 45 Hz 45 to 1 kHz 1 to 20 kHz 20 to 100 kHz
1 % + 20 0.6 % + 20 0.6 % + 20 5 % + 40
1 % + 5 0.6 % + 5 0.6 % + 10 5 % + 40
Accuracy
[4]
[4]
Not Spec’d AC A
[4]
Not Spec’d
69
Find Quality Products Online at: sales@GlobalTestSupply.com
www.GlobalTestSupply.com
Page 79

287/289
Users Manual
DC Voltage Specification
Accuracy
Function Range Resolution
[3]
DC V
50 mV
[1]
500 mV 0.01 mV 0.025 % + 2
5 V 0.0001 V 0.025 % + 2 1.5 % + 40 5 % + 40
0.001 mV 0.05 % + 20
50 V 0.001 V 0.025 % + 2 1.5 % + 40 5 % + 40
DC
[2]
20 to 45 Hz 45 Hz to 1 kHz 1 to 20 kHz 20 to 35 kHz
[4]
1.5 % + 40 5 % + 40 DC mV
[5]
1.5 % + 40 5 % + 40
2 % + 80 0.5 % + 80
500 V 0.01 V 0.03 % + 2 Not Spec’d Not Spec’d
1000 V 0.1 V 0.03 % + 2
[1]
L
[1] Add 20 counts in dual display ac over dc, dc over ac or ac+dc.
[2] AC+DC ranges are specified from 2 % to 140 % of range, except 1000 V is specified from 2 % to 100 % of range.
[3] When using the relative mode (REL Q) to compensate for offsets.
[4] Add 4 counts/10 mV AC in dual display ac over dc, dc over ac or ac + dc
[5] Add 10 counts/100 mV AC in dual display ac over dc, dc over ac or ac + dc.
1000 V 0.1 V 1 % + 20 Not Spec’d Not Spec’d Not Spec’d Not Spec’d
AC over DC, DC over AC, AC + DC
[2]
Not Spec’d Not Spec’d
70
Find Quality Products Online at: sales@GlobalTestSupply.com
www.GlobalTestSupply.com
Page 80

True-rms Digital Multimeters
Detailed Specifications
DC Current Specifications
Function Range Resolution
DC μA
[4]
[4]
[2]
500 μA 0.01 μA
5000 μA 0.1 μA
50 mA 0.001 mA 0.05 % + 10
400 mA 0.01 mA 0.15 % + 2 1 % + 5 0.6 % + 5 1.5 % + 10 5 % + 40
5 A 0.0001 A 0.3 % + 10 1.5 % + 20 0.8 % + 20 3 % + 40
[1][3]
DC
0.075 % + 20 1 % + 20 0.6 % + 20 0.6 % + 20 5 % + 40
0.075 % + 2 1 % + 5 0.6 % + 5 0.6 % + 10 5 % + 40
10 A 0.001 A 0.3 % + 2 1.5 % + 10 0.8 % + 10 3 % + 10
[1] AC+DC ranges are specified from 2 % to 140 % of range.
[2] 20 A for 30 seconds on, 10 minutes off. >10 A not specified.
[3] Add 20 counts in dual display ac over dc, dc over ac or ac+dc.
[4] 400 mA continuous; 550 mA for 2 minutes on, 1 minute off.
[5] Verified by design and type tests.
[6] Temperature coefficient: 0.1 X (specified accuracy)/ °C (<18 °C or > 28 °C)
Accuracy
AC over DC, DC over AC, AC + DC
20 to 45 Hz 45 Hz to 1 kHz 1 to 20 kHz 20 to 100 kHz
[6]
1 % + 20 0.6 % + 20 0.6 % + 20 5 % + 40 DC mA
[1]
[5]
Not Spec’d DC A
[5]
Not Spec’d
[5]
71
Find Quality Products Online at: sales@GlobalTestSupply.com
www.GlobalTestSupply.com
Page 81

287/289
Users Manual
Resistance Specifications
Function Range Resolution Accuracy
Resistance
Conductance 50 nS
[1] When using the relative mode (REL Q) to compensate for offsets.
[2] Add 20 counts above 33 nS in 50 nS range.
[3] 289 only.
[1][3]
50 Ω
500 Ω
5 kΩ
50 kΩ
0.001 Ω
[1]
0.01 Ω
[1]
0.0001 kΩ
[1]
0.001 kΩ
500 kΩ 0.01 kΩ
5 MΩ 0.0001 MΩ
30 MΩ 0.001 MΩ
50 MΩ 0.01 MΩ
50 MΩ up to 100 MΩ 0.1 MΩ
100 MΩ up to 500 MΩ 0.1 MΩ
[2]
0.01 nS 1 % + 10
0.15 % + 20
0.05 % + 10
0.05 % + 2
0.05 % + 2
0.05 % + 2
0.15 % + 4
1.5 % + 4
1.5 % + 4
3.0 % + 2
8 % + 2
Temperature Specifications
1 % + 10
1 % + 18
[1,2]
Temperature Resolution Accuracy
-200 °C to +1350 °C 0.1 °C
-328 °F to +2462 °F 0.1 °F
[1] Does not include error of the thermocouple probe.
[2] Accuracy specification assumes ambient temperature stable to ±1 °C. For ambient temperature changes of ±5 °C, rated accuracy applies after 2 hours.
72
Find Quality Products Online at: sales@GlobalTestSupply.com
www.GlobalTestSupply.com
Page 82

True-rms Digital Multimeters
Detailed Specifications
Capacitance and Diode Test Specifications
Function Range Resolution Accuracy
Capacitance
Diode Test 3.1 V 0.0001 V 1 % + 20
[1] With a film capacitor or better, using relative mode (REL Δ) to zero residual.
[1]
1 nF
0.001 nF 1 % + 5
[1]
10 nF
0.01 nF 1 % + 5
[1]
100 nF
1 μF 0.001 μF
10 μF 0.01 μF
100 μF 0.1 μF
1000 μF 1 μF
10 mF 0.01 mF 1 % + 5
100 mF 0.1 mF 2 % + 20
0.1 nF 1 % + 5
1 % + 5
1 % + 5
1 % + 5
1 % + 5
73
Find Quality Products Online at: sales@GlobalTestSupply.com
www.GlobalTestSupply.com
Page 83
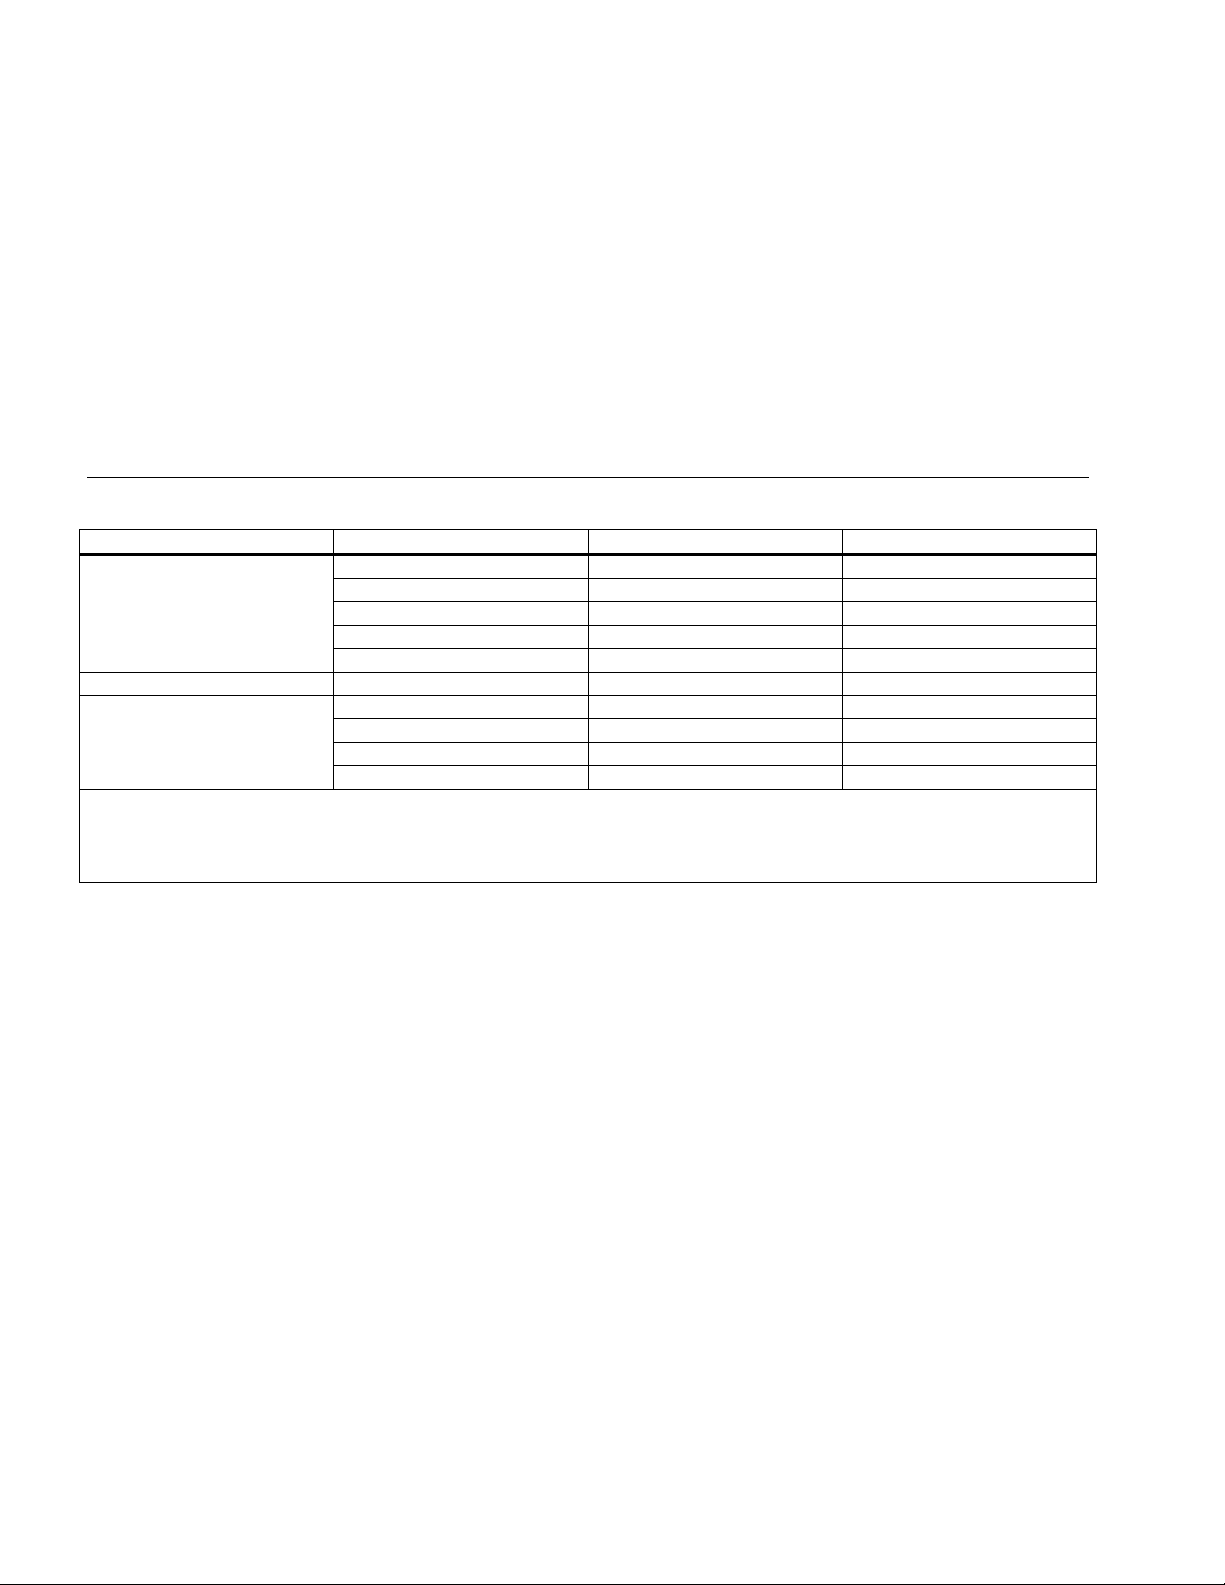
287/289
Users Manual
Frequency Counter Specifications
Function Range Resolution Accuracy
Frequency
(0.5 Hz to 999.99 kHz, pulse
width >0.5 μs)
Duty Cycle
Pulse Width
[1] For 64.000 kHz to 67.000 kHz, accuracy = ±5 Hz, at -20 to +55 °C with R.H. 0 % to 90 % (0 °C to 37 °C), 0 % to 65 % (37 °C to 45 °C), 0 % to 45 %
[2] For rise times <1 μs. Signals centered around trigger levels.
[3] 0.5 to 200 kHz, pulse width >2 μs. Pulse width range is determined by the frequency of the signal.
[2][3]
1.00 % to 99.00 % 0.01 % 0.2 % per kHz + 0.1 %
[2][3]
(45 °C to 55 °C).
99.999 Hz 0.001 Hz 0.02 % + 5
999.99 Hz 0.01 Hz 0.005 % + 5
9.9999 kHz 0.0001 Hz 0.005 % + 5
99.999 kHz 0.001 Hz 0.005 % + 5
999.99 kHz 0.01 Hz 0.005 % + 5
0.1000 ms 0.0001 ms 0.002 ms + 3 counts
1.000 ms 0.001 ms 0.002 ms + 3 counts
10.00 ms 0.01 ms 0.002 ms + 3 counts
1999.9 ms 0.1 ms 0.002 ms + 3 counts
[1]
74
Find Quality Products Online at: sales@GlobalTestSupply.com
www.GlobalTestSupply.com
Page 84

True-rms Digital Multimeters
Detailed Specifications
Frequency Counter Sensitivity
Approximate Voltage Sensitivity
Input Range
50 mV 5 mV 1 MHz 5 mV & 20 mV 600 kHz
500 mV 25 mV 1 MHz 20 mV & 60 mV 1 MHz
5 V 0.25 V 700 kHz 1.4 V & 2.0 V 80 kHz
50 V 2.5 V 1 MHz 0.5 V & 6.5 V 1 MHz
500 V 25 V 300 kHz 5 V & 40 V 300 kHz
1000 V 50 V 300 kHz 5 V & 100 V 300 kHz
Input Range
500 μA 25 μA
5000 μA 250 μA
50 mA 2.5 mA 100 kHz
400 mA 25 mA 100 kHz
5 A 0.25 A 100 kHz
10 A 1.0 A 100 kHz
[1] Maximum input = 10 x range (1000 V maximum, 2 x 10⁷ V-Hz product maximum). Noise at low frequencies and amplitudes may affect accuracy.
[2] Typical frequency bandwidth with full scale (or maximum 2 x 10
(rms sine wave)
15 Hz to 100 kHz
Approximate Current Sensitivity
(rms sine wave)
15 Hz to 10 kHz
[1]
AC Bandwidth
AC Bandwidth
100 kHz
100 kHz
7
V-Hz product) rms sine wave.
[2]
Approximate DC
Trigger Levels
Approximate DC Trigger
Levels
NA NA
DC Bandwidth
DC Bandwidth
[2]
75
Find Quality Products Online at: sales@GlobalTestSupply.com
www.GlobalTestSupply.com
Page 85

287/289
Users Manual
MIN MAX, Recording, and Peak Specifications
Function Nominal Response Accuracy
MIN MAX, Recording
Peak
Crest Factor 350 ms to 80 % For periodic waveforms from 50 to 440 Hz ± (4 % + 1 count).
[1] For repetitive peaks; 2.5 ms for single events. Peak not specified for 500 µA DC, 50 mA DC, 5 A DC.
[2] 200 counts in 500 mV AC, 500 μA AC, 50 mA AC, 5 A AC.
[3] 3 % in 500 mV AC, 500 μA AC, 50 mA AC, 5 A AC.
200 ms to 80% (dc function)
350 ms to 80 % (ac function)
[1]
250 μS (peak)
Specified accuracy ±12 counts for changes >425 ms in duration in manual
range.
Specified Accuracy ±40 counts for changes >1.5 s in duration in manual
range.
Specified accuracy ±100 counts
For higher peak reading (to 12,000 counts), specified accuracy ±2 %
reading.
[2]
up to 5,000 count (full range) reading.
[3]
of
76
Find Quality Products Online at: sales@GlobalTestSupply.com
www.GlobalTestSupply.com
Page 86

True-rms Digital Multimeters
Detailed Specifications
Input Characteristics
Common Mode
Rejection Ratio
(1 kΩ unbalance)
>120 dB at dc, 50 Hz or 60 Hz >60 dB at 50 Hz or 60 Hz
>120 dB at dc, 50 Hz or 60 Hz >60 dB at 50 Hz or 60 Hz
>60 dB, dc to 60 Hz
Not specified Not specified
Full Scale Voltage Typical Short Circuit Current
To 500 kΩ
>5 or 50 nS
500 mV 10 mA
500 Ω 5 kΩ 50 kΩ 500 kΩ 5 MΩ 50 MΩ
Normal Mode Rejection
100 μA 10 μA
1 μA 0.3 μA 0.3 μA
Overload
Protection
1000 V
1000 V
1000 V
1000 V
Overload
Protection
1000 V
1000 V
Function
L
F
mV
K
L
Function
e
50e 1000 V
G
[1] Input is limited to the product of a V rms sinewave times frequency of 2 x 10⁷ V-Hz.
[2] For circuits <0.5 A short circuit. 660V for high energy circuits.
Input Impedance
[1]
10 MΩ <100 pF
[2]
10 MΩ <100 pF
10 MΩ <100 pF
(ac-coupled)
3.2 kΩ <100 pF
(ac-coupled)
Open Circuit
[1]
Test Voltage
[2]
5 V dc 550 mV <5 V 1 mA
20 V decreasing
[2]
to 2.5 V
[2]
5 V dc 3.1 V dc 1 mA
77
Find Quality Products Online at: sales@GlobalTestSupply.com
www.GlobalTestSupply.com
Page 87

287/289
Users Manual
Burden Voltage (A, mA,
Function Range Burden Voltage
mA, μA
μ
A)
500 μA 102 μV/ μA
5000 μA 102 μV/ μA
50.000 mA 1.8 mV/mA
400.00 mA 1.8 mV/mA
5.0000 A 0.04 V/A A
10.000 A 0.04 V/A
78
Find Quality Products Online at: sales@GlobalTestSupply.com
www.GlobalTestSupply.com
 Loading...