

Page 1

123B/124B/125B
January 2016
© 2016 Fluke Corporation. All rights reserved. Specifications are subject to change without notice.
All product names are trademarks of their respective companies.
Industrial ScopeMeter®
Users Manual
Page 2

LIMITED WARRANTY AND LIMITATION OF LIABILITY
Each Fluke product is warranted to be free from defects in material and workmanship under normal use and service. The warranty period is three years and
begins on the date of shipment. Parts, product repairs, and services are warranted for 90 days. This warranty extends only to the original buyer or end-user
customer of a Fluke authorized reseller, and does not apply to fuses, disposable batteries, or to any product which, in Fluke's opinion, has been misused,
altered, neglected, contaminated, or damaged by accident or abnormal conditions of operation or handling. Fluke warrants that software will operate
substantially in accordance with its functional specifications for 90 days and that it has been properly recorded on non-defective media. Fluke does not warrant
that software will be error free or operate without interruption.
Fluke authorized resellers shall extend this warranty on new and unused products to end-user customers only but have no authority to extend a greater or
different warranty on behalf of Fluke. Warranty support is available only if product is purchased through a Fluke authorized sales outlet or Buyer has paid the
applicable international price. Fluke reserves the right to invoice Buyer for importation costs of repair/replacement parts when product purchased in one country
is submitted for repair in another country.
Fluke's warranty obligation is limited, at Fluke's option, to refund of the purchase price, free of charge repair, or replacement of a defective product which is
returned to a Fluke authorized service center within the warranty period.
To obtain warranty service, contact your nearest Fluke authorized service center to obtain return authorization information, then send the product to that service
center, with a description of the difficulty, postage and insurance prepaid (FOB Destination). Fluke assumes no risk for damage in transit. Following warranty
repair, the product will be returned to Buyer, transportation prepaid (FOB Destination). If Fluke determines that failure was caused by neglect, misuse,
contamination, alteration, accident, or abnormal condition of operation or handling, including overvoltage failures caused by use outside the product’s specified
rating, or normal wear and tear of mechanical components, Fluke will provide an estimate of repair costs and obtain authorization before commencing the work.
Following repair, the product will be returned to the Buyer transportation prepaid and the Buyer will be billed for the repair and return transportation charges
(FOB Shipping Point).
THIS WARRANTY IS BUYER'S SOLE AND EXCLUSIVE REMEDY AND IS IN LIEU OF ALL OTHER WARRANTIES, EXPRESS OR IMPLIED, INCLUDING
BUT NOT LIMITED TO ANY IMPLIED WARRANTY OF MERCHANTABILITY OR FITNESS FOR A PARTICULAR PURPOSE. FLUKE SHALL NOT BE LIABLE
FOR ANY SPECIAL, INDIRECT, INCIDENTAL OR CONSEQUENTIAL DAMAGES OR LOSSES, INCLUDING LOSS OF DATA, ARISING FROM ANY CAUSE
OR THEORY.
Since some countries or states do not allow limitation of the term of an implied warranty, or exclusion or limitation of incidental or consequential damages, the
limitations and exclusions of this warranty may not apply to every buyer. If any provision of this Warranty is held invalid or unenforceable by a court or other
decision-maker of competent jurisdiction, such holding will not affect the validity or enforceability of any other provision.
Fluke Corporation
P.O. Box 9090
Everett, WA 98206-9090
U.S.A.
11/99
Fluke Europe B.V.
P.O. Box 1186
5602 BD Eindhoven
The Netherlands
Page 3

Table of Contents
Title Page
Introduction .................................................................................................................... 1
How to Contact Fluke ..................................................................................................... 1
Safety Information .......................................................................................................... 1
Test Tool Kit Contents .................................................................................................... 5
Get Started ..................................................................................................................... 7
Battery Pack .............................................................................................................. 7
Mains Power Source ................................................................................................. 8
SD Memory Cards ..................................................................................................... 8
Test Tool Setup .............................................................................................................. 9
Reset the Test Tool ................................................................................................... 9
Screen Brightness ..................................................................................................... 10
Menu Selection .......................................................................................................... 10
Measurement Connections ........................................................................................ 11
Input A .................................................................................................................. 11
Input B .................................................................................................................. 11
COM ..................................................................................................................... 11
i
Page 4

123B/124B/125B
Users Manual
Measurement Probe Setup ....................................................................................... 11
Tilt Stand ................................................................................................................... 12
Hanger ...................................................................................................................... 12
Language Selection .................................................................................................. 12
Scope and Meter Mode ................................................................................................. 13
How to Read the Screen ........................................................................................... 14
Connect-and-View™ ................................................................................................. 15
Measurements .......................................................................................................... 15
Inputs ........................................................................................................................ 19
Voltage Measurements ........................................................................................ 19
Ohm, Continuity, Diode, Capacitance Measurements .......................................... 19
Current Measurements ........................................................................................ 19
Temperature Measurements ................................................................................ 19
Power Measurements .......................................................................................... 19
IntellaSet™ / AutoReading ........................................................................................ 19
Measurement Type ................................................................................................... 20
Screen Freeze .......................................................................................................... 21
How to Hold a Stable Reading .................................................................................. 21
Relative Measurements ............................................................................................ 22
Auto Range/Manual Range ....................................................................................... 23
Screen Graphic Adjustment ...................................................................................... 23
Amplitude ............................................................................................................. 23
Time Base ............................................................................................................ 23
Waveform Position ............................................................................................... 23
Noise Reduction ................................................................................................... 24
Glitch Display ....................................................................................................... 24
Waveform Smoothing ........................................................................................... 25
Reading Smoothing .............................................................................................. 26
How to Display the Envelope of a Waveform ....................................................... 26
Waveform Acquisition ............................................................................................... 27
ii
Page 5

Contents (continued)
Single Acquisition ................................................................................................. 27
Slow Signals ......................................................................................................... 28
AC Coupling.......................................................................................................... 29
Waveform Trigger ...................................................................................................... 29
Set Trigger Level and Slope ................................................................................. 29
Select Trigger Parameters .................................................................................... 30
Cursor Measurements ............................................................................................... 32
Horizontal Cursors ................................................................................................ 32
Vertical Cursors .................................................................................................... 33
Rise Time Measurements .......................................................................................... 34
High Frequency Measurements with 10:1 Probe ....................................................... 35
Probe Attenuation ................................................................................................. 35
Probe Adjustment ................................................................................................. 35
Power and Harmonics Mode .......................................................................................... 35
Volts/Amps/Watt Measurements ............................................................................... 36
Harmonics Measurements ......................................................................................... 38
Zooming Harmonics .................................................................................................. 42
Fieldbus Mode ................................................................................................................ 42
How to Read the Screen ........................................................................................... 44
How to View the Bus Waveform Screen .................................................................... 47
Test Limits ................................................................................................................. 48
Recorder Mode .............................................................................................................. 49
Start and Stop Meter Recording ................................................................................ 50
Cursor Measurements ............................................................................................... 52
Zoom In/Out on Logged Meter Data .......................................................................... 53
Events ....................................................................................................................... 53
Scope Record Mode .................................................................................................. 53
Save and Recall Data Sets ............................................................................................ 55
Test Sequence .......................................................................................................... 56
Setting Recall ............................................................................................................ 57
iii
Page 6

123B/124B/125B
Users Manual
Data Set Management .............................................................................................. 57
Waveform Comparison ............................................................................................. 58
Communication .............................................................................................................. 59
Optical Interface ........................................................................................................ 59
Wireless Interface ..................................................................................................... 59
Maintenance .................................................................................................................. 61
How to Clean ............................................................................................................ 61
Storage ..................................................................................................................... 61
Battery Replacement ................................................................................................ 61
10:1 Scope Probes ................................................................................................... 62
Calibration Information .............................................................................................. 63
Replaceable Parts and Accessories .............................................................................. 64
Tips ................................................................................................................................ 67
Battery Life ................................................................................................................ 67
Power Off Timer ........................................................................................................ 67
Autoset Options ........................................................................................................ 68
Grounding Guidelines ............................................................................................... 68
Specifications ................................................................................................................ 69
Dual Input Oscilloscope ............................................................................................ 69
Dual Input Meter ....................................................................................................... 71
Cursor Readout (124B, 125B)................................................................................... 78
Recorder ................................................................................................................... 79
Power Quality (125B) ................................................................................................ 80
Field Bus Measurements (125B) ............................................................................... 81
Miscellaneous ........................................................................................................... 82
Environmental ........................................................................................................... 83
iv
Page 7

List of Tables
Table Title Page
1. Symbols ................................................................................................................................. 4
2. Packing List ........................................................................................................................... 5
3. Parts of the Screen ................................................................................................................ 14
4. Volt/Amp Readings ................................................................................................................ 37
5. Watt Readings ....................................................................................................................... 37
6. Harmonics Voltage Measurements ....................................................................................... 39
7. Harmonics Current Measurements ........................................................................................ 40
8. Harmonics Power Measurements ......................................................................................... 41
9. Bus Measurement Inputs....................................................................................................... 43
10. Field Bus Test Screen ........................................................................................................... 44
11. Test Signal Properties ........................................................................................................... 45
12. Bus Test Screen Indicators ................................................................................................... 46
13. Replaceable Parts and Accessories ...................................................................................... 65
14. Optional Accessories ............................................................................................................. 66
v
Page 8

123B/124B/125B
Users Manual
vi
Page 9

List of Figures
Figure Title Page
1. Test Tool Kit .......................................................................................................................... 6
2. Battery Charging ................................................................................................................... 7
3. Power Up/Reset Screen ........................................................................................................ 9
4. Input Connections for Measurement ..................................................................................... 11
5. Tilt Stand and Hanger ........................................................................................................... 12
6. Auto Set Function .................................................................................................................. 15
7. Measurement Setup .............................................................................................................. 16
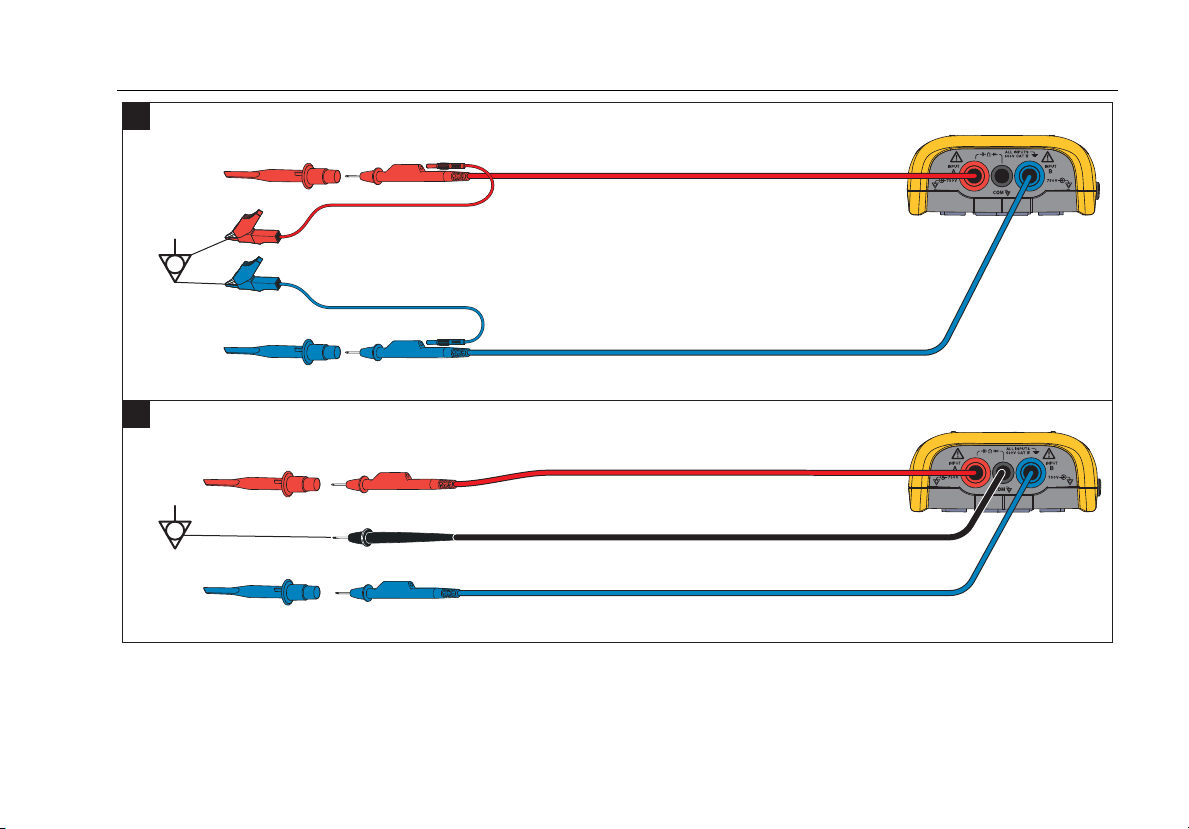
8. Correct Grounding Setup ....................................................................................................... 17
9. Temperature and Current Measurement Setup ..................................................................... 18
10. AutoReading Function ........................................................................................................... 20
11. Waveform Smoothing ............................................................................................................ 25
12. Bus Health Indicator Boundaries ........................................................................................... 47
13. WiFi USB Adapter ................................................................................................................. 59
14. 10:1 Scope Probes ................................................................................................................ 63
15. Max. Input Voltage vs. Frequency for BB120 and STL120-IV ............................................... 85
16. Safe Handling: Max. Voltage Between Test Tool Reference and Earth Ground ................... 85
vii
Page 10

123B/124B/125B
Users Manual
viii
Page 11

Introduction
The 123B/124B/125B ScopeMeter® (the Test Tool or
Product) is an integrated Test Tool, with oscilloscope,
multimeter, and 'paperless' recorder in one easy-to-use
instrument.
How to Contact Fluke
To contact Fluke, call one of the following telephone
numbers:
• Technical Support USA: 1-800-44-FLUKE
(1-800-443-5853)
• Calibration/Repair USA: 1-888-99-FLUKE
(1-888-993-5853)
• Canada: 1-800-36-FLUKE (1-800-363-5853)
• Europe: +31 402-675-200
• Japan: +81-3-6714-3114
• Singapore: +65-6799-5566
• Anywhere in the world: +1-425-446-5500
Or, visit Fluke's website at www.fluke.com.
To register your Product, visit http://register.fluke.com.
To view, print, or download the latest manual supplement,
visit http://us.fluke.com/usen/support/manuals.
Safety Information
A Warning identifies hazardous conditions and
procedures that are dangerous to the user.
A Caution identifies conditions and procedures that can
cause damage to the Product or the equipment under
test.
XW Warning
To prevent possible electrical shock, fire, or
personal injury:
• Read all safety information before you
use the Product.
• Use the Product only as specified, or the
protection supplied by the Product can
be compromised.
• Carefully read all instructions.
1
Page 12

123B/124B/125B
Users Manual
• Do not apply more than one phase of a
multiphase system simultaneously to
any COM
Common (COM) connections should be
equipotential, as marked.
• Remove the batteries if the Product is
not used for an extended period of time,
or if stored in temperatures above 50 °C.
If the batteries are not removed, battery
leakage can damage the Product.
• The battery door must be closed and
locked before you operate the Product.
• Comply with local and national safety
codes. Use personal protective
equipment (approved rubber gloves, face
protection, and flame-resistant clothes)
to prevent shock and arc blast injury
where hazardous live conductors are
exposed.
• Do not apply more than the rated
voltage, between the terminals or
between each terminal and earth ground.
˜ (common) connection. All
• Limit operation to the specified
measurement category, voltage, or
amperage ratings.
• Use Product-approved measurement
category (CAT), voltage, and amperage
rated accessories (probes, test leads,
and adapters) for all measurements.
• Measure a known voltage first to make
sure that the Product operates correctly.
• Use the correct terminals, function, and
range for measurements.
• De-energize the circuit or wear personal
protective equipment in compliance with
local requirements before you apply or
remove the flexible current probe from
hazardous live conductors.
• Do not touch voltages > 30 V ac rms,
42 V ac peak, or 60 V dc.
• Do not use the Product around explosive
gas, vapor, or in damp or wet
environments.
2
Page 13

Industrial ScopeMeter®
Safety Information
• Do not use the Product if it operates
incorrectly.
• Examine the case before you use the
Product. Look for cracks or missing
plastic. Carefully look at the insulation
around the terminals.
• Do not use test leads if they are
damaged. Examine the test leads for
damaged insulation, exposed metal, or if
the wear indicator shows. Check test
lead continuity.
• Use only cables with correct voltage
ratings.
• Connect the common test lead before
the live test lead and remove the live test
lead before the common test lead.
• Keep fingers behind the finger guards on
the probes.
• Remove all probes, test leads, and
accessories before the battery door is
opened.
• Remove all probes, test leads, and
accessories that are not necessary for
the measurement.
• Do not exceed the Measurement
Category (CAT) rating of the lowest rated
individual component of a Product,
probe, or accessory.
• Do not use a current measurement as an
indication that a circuit is safe to touch.
A voltage measurement is necessary to
know if a circuit is hazardous.
• Disable the Product if it is damaged.
• Do not use the Product if it is damaged.
• Do not use the Product above its rated
frequency.
• Do not use the Current Probe if it has
damaged insulation, exposed metal, or if
the wear indicator is visible.
• Do not wear loose-fitting clothing or
jewelry and keep long hair tied back
when near rotating machinery. Use
approved eye protection and approved
personal-protective equipment where
necessary.
3
Page 14

123B/124B/125B
Users Manual
See Table 1 for a list of symbols used on the Product and
in this manual.
Table 1. Symbols
Symbol Description Symbol Description
W
T
˜
/
~
4
WARNING. RISK OF DANGER.
Consult user documentation.
Double Insulated
Earth
Equipotential
Conforms to relevant Australian Safety and EMC standards.
Measurement Category III is applicable to test and measuring circuits connected to the distribution part of the
building’s low-voltage MAINS installation.
Measurement Category IV is applicable to test and measuring circuits connected at the source of the building’s
low-voltage MAINS installation.
This product contains a Lithium-ion battery. Do not mix with solid waste stream. Spent batteries should be
disposed of by a qualified recycler or hazardous materials handler per local regulations. Contact your
authorized Fluke Service Center for recycling information.
This product complies with the WEEE Directive marking requirements. The affixed label indicates that you must
not discard this electrical/electronic product in domestic household waste. Product Category: With reference to
the equipment types in the WEEE Directive Annex I, this product is classed as category 9 "Monitoring and
Control Instrumentation" product. Do not dispose of this product as unsorted municipal waste.
X
P
Ã
)
y
WARNING. HAZARDOUS VOLTAGE. Risk of electric shock.
Conforms to European Union directives.
Conforms to relevant South Korean EMC Standards.
Certified by CSA Group to North American safety standards.
Battery Safety Approval
Page 15

Industrial ScopeMeter®
Test Tool Kit Contents
Test Tool Kit Contents
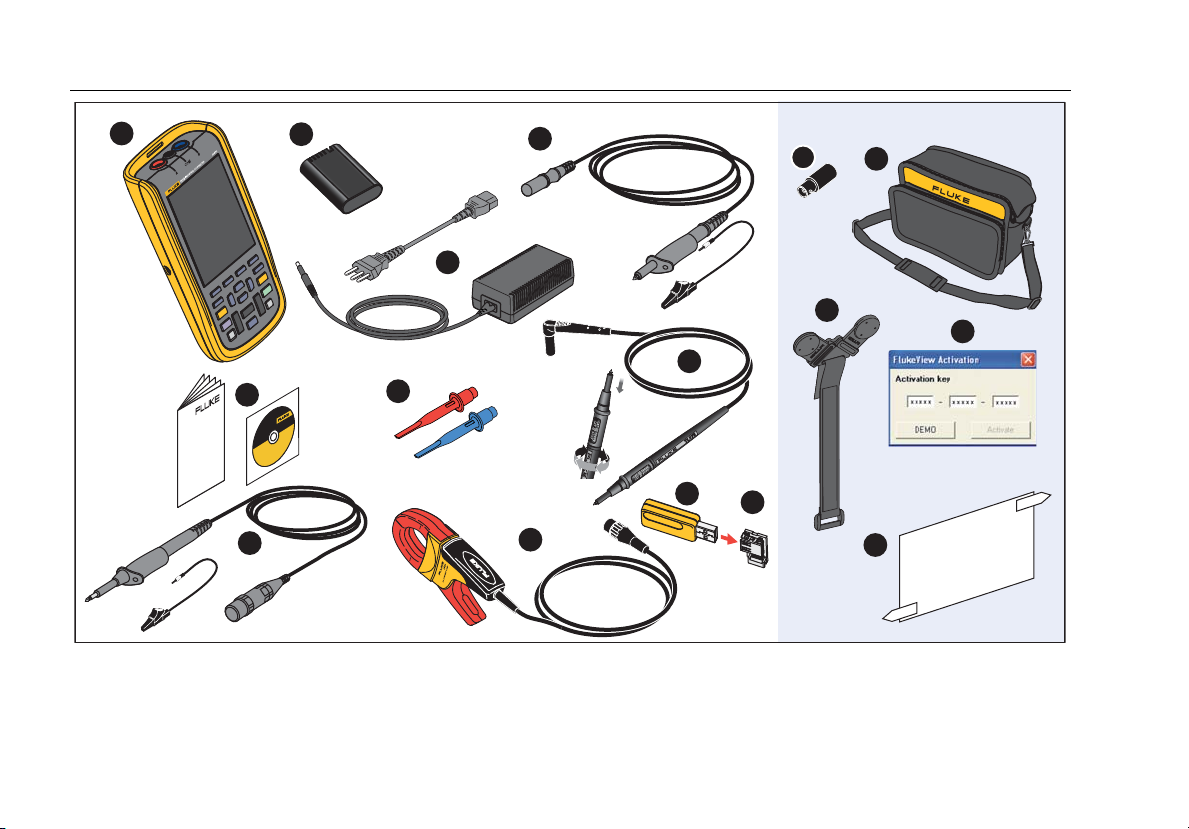
Table 2 is a list of the items included in your Test Tool kit.
Also see Figure 1.
Table 2. Packing List
Item Description 12x-B 12x-B/S
Fluke Test Tool 123B, 124B or 125B 123B/S, 124B/S or 125B/S
Rechargeable Li-ion Battery Pack • •
Switch Mode Power Supply, Adapter/Battery Charger • •
D Shielded Test Leads with Black Ground Leads • •
E Test Lead Black (for Grounding) • •
F Hook Clips (red, blue) • •
G Banana-to-BNC Adapters (black) • (x1) • (x2)
H Safety Information + CD-ROM with Users Manuals • •
I 10:1 Voltage Probe 124B, 125B 124B/S, 125B/S
J i400s AC Current Clamp 125B 125B
K USB Angled Adapter • •
L WiFi USB Adapter depends on version
M Soft Carrying Case •
N Magnetic Hanger •
O FlukeView
ScopeMeter Software for Windows
•
P Screen Protector •
5
Page 16
123B/124B/125B
Users Manual
1
2
3
(2x)
8
9
6
10
(2x)
4
5
12
7
14
11
S-Version
13
12345 - 12345 - 12345
16
15
hxv01.eps
Figure 1. Test Tool Kit
6
Page 17
Industrial ScopeMeter®
Get Started
Get Started
Before you use your Test Tool for the first time, read this
section.
Battery Pack
Li-ion batteries may be discharged at delivery. Completely
discharged batteries can cause the Test Tool not to start
up when it is turned on. To reach full charge, charge for 4
hours with the Test Tool turned off.
When fully charged, the batteries provide up to 7 hours
(single channel, time base slower than 1 µs/div) of use
when the backlight is dimmed.
The battery status shows as an icon in the top right
corner of the screen:
b - full charge
- about 5 minutes of operation remains
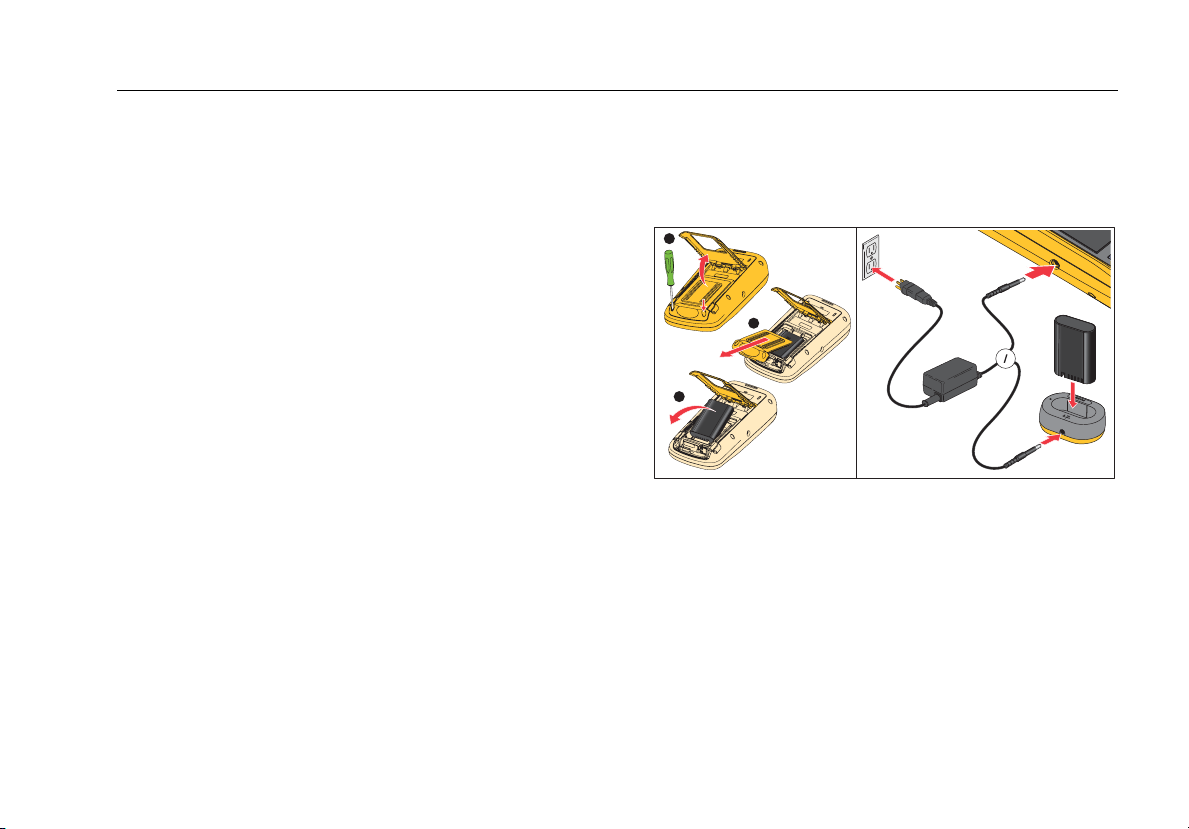
To charge the batteries and power the instrument, connect
the power adapter as shown in Figure 2. To charge the
batteries more quickly, turn off the Test Tool.
W Caution
To prevent overheating of the batteries
during charging, do not exceed the allowable
ambient temperature in the specifications.
Note
The power adapter does not damage the Test
Tool even when connected over consecutive
days. The power adapter automatically switches
to a trickle charge.
1
2
3
Figure 2. Battery Charging
E
G
R
A
H
C
hxv51.eps
7
Page 18

123B/124B/125B
Users Manual
Alternatively, you may choose to exchange the battery
(Fluke accessory BP290) with a fully charged one and
use the external battery charger EBC290 (optional Fluke
accessory).
To accommodate connection to various line power
sockets, the BC430/820 universal Battery Charger /
Power Adapter is equipped with a male plug that must be
connected to a line cord appropriate for local use.
Because the adapter is isolated, the line cord does not
need to be equipped with a terminal for connection to
protective ground. Or use a line cord with a protective
grounding terminal.
Mains Power Source
To use the mains power source:
1. Attach the power cord to the mains power.
2. Attach the DC power connector in the left side of the
Test Tool.
3. Push to turn on the Test Tool.
The Test Tool turns on within 10 seconds in its last setup
configuration.
SD Memory Cards
The Test Tool has a SD Memory Card for storage of
recorder measurement data or data sets (see page 55).
The file format is FAT32. This data is retained also when
the Test Tool is disconnected from its power sources. The
memory card is located in the battery compartment.
To lock or unlock the card, press it down. The correct
position of the card is shown in the compartment. This
compartment also contains a connector for adding WiFi
connectivity with a USB flash drive. See Wireless
Connectivity for more information.
W Caution
To prevent damage to the SD memory card,
do not touch the contacts.
8
Page 19
Industrial ScopeMeter®
Test Tool Setup
Test Tool Setup
This section explains the basics for how to use your Test
Tool.
Reset the Test Tool
To restore the Test Tool to the factory default settings:
1. Push and hold + .
2. Release .
3. Release .
Figure 3 shows the Test Tool screen the first time you
power on or after a successful reset.
hxv10.eps
Figure 3. Power Up/Reset Screen
9
Page 20

123B/124B/125B
Users Manual
Screen Brightness
By default the display is at the brightest setting. To extend
the battery life, you can decrease the brightness setting.
To change the brightness of the display:
1. With the Test Tool turned on, push for >3 seconds
and release.
2. Push
YZ to increase or decrease the backlight.
Menu Selection
The buttons on the keypad provide the navigation through
the functions you see on the display. For example, this is
the basic sequence for how to adjust a parameter:
YZ
YZ
YZ
YZWX
Tips:
• Push a second time to close the MENU and
resume normal measurement. This toggle enables
you to check the menu without changing the settings.
• When you do not change an item with the cursor
keys, push to step through a menu without
changing the setup of the Test Tool.
• Gray text in a menu or button bar indicates that the
function is disabled or the status is not valid.
open the MENU
move cursor to highlight USER OPTIONS
select the USER OPTIONS menu
move cursor to highlight Date Format
select DATE FORMAT menu
move cursor to highlight a date format
confirm the selection
select the date
confirm the selection
10
Page 21
Industrial ScopeMeter®
Test Tool Setup
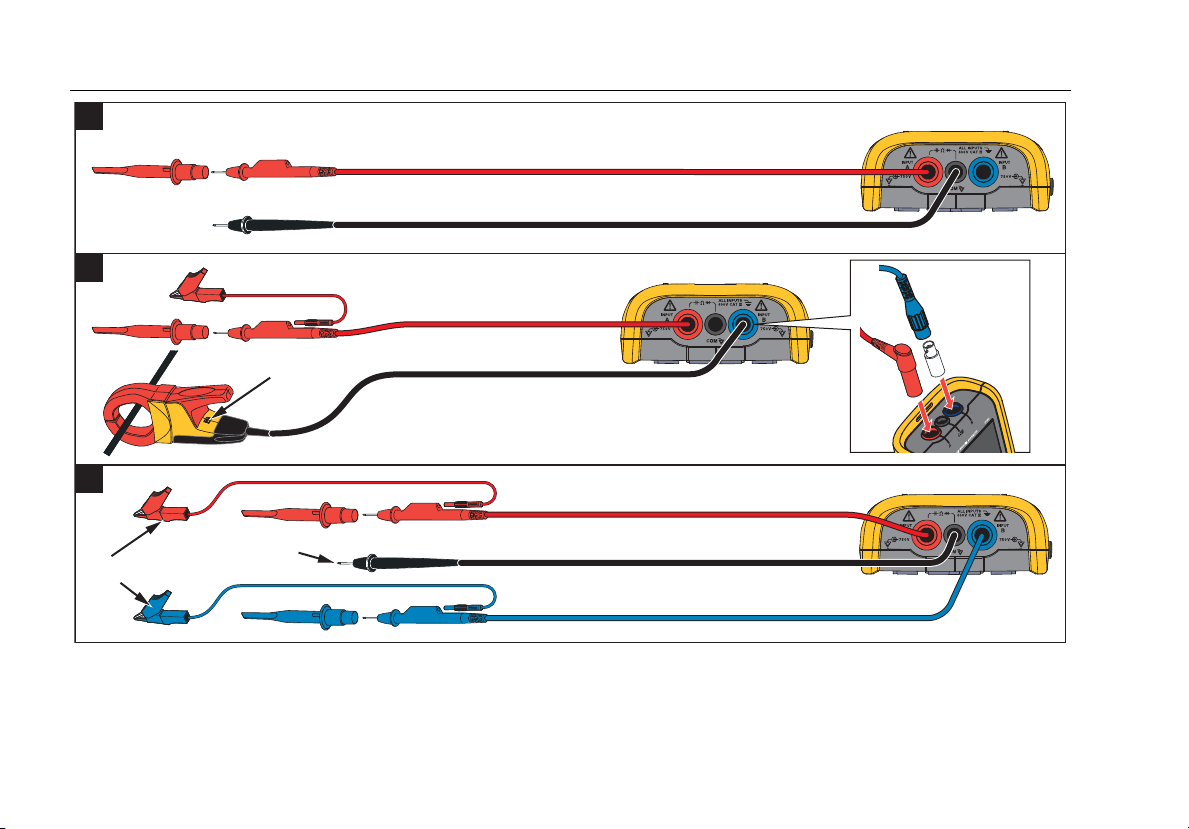
Measurement Connections
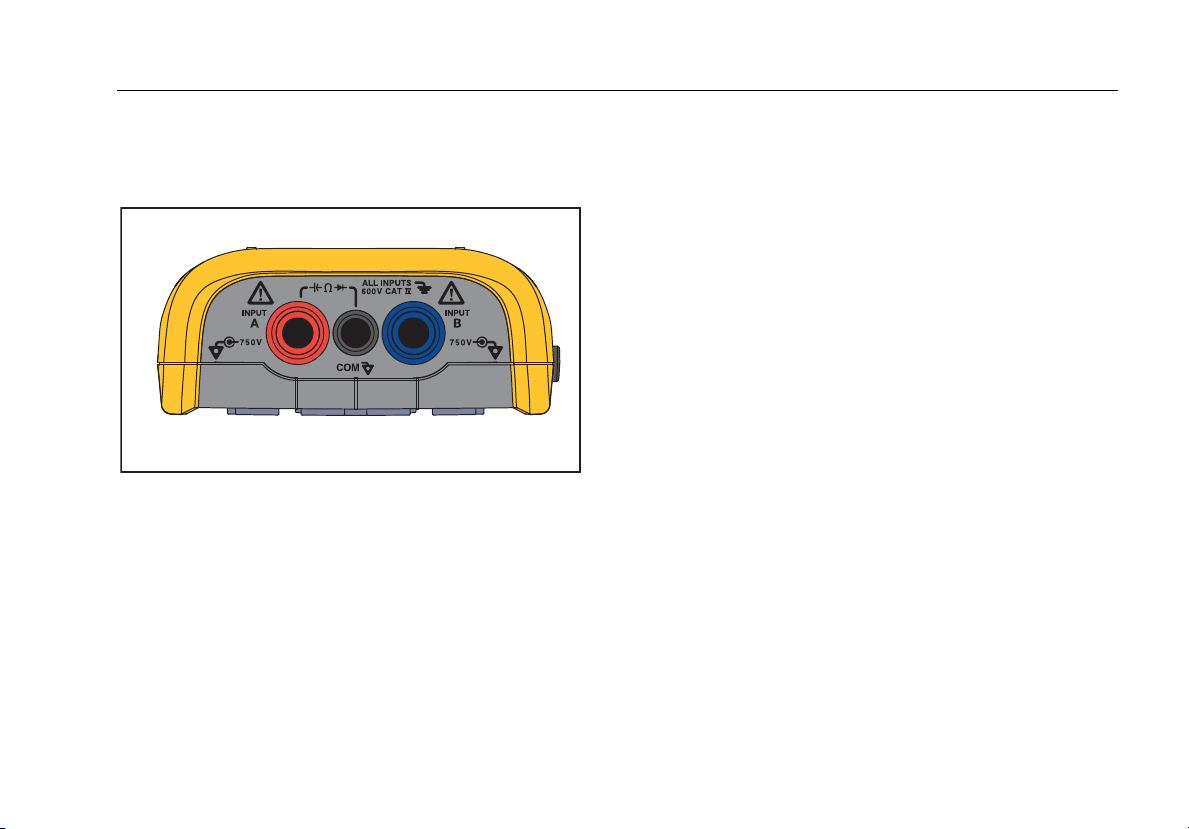
The Test Tool has two 4 mm safety-shielded banana jack
inputs (red input A and blue input B) and a black safety
4 mm banana jack input (COM). See Figure 4.
hxv05.eps
Figure 4. Input Connections for Measurement
Input A
Use the input A (red) for all single input measurements.
Input B
For measurements on two different signals, use B input
(blue) together with input A (red).
COM
Use the COM input (black) as the single ground for low
frequency, continuity, Ohm (Ω), diode, and capacitance
measurements.
XW Warning
To prevent electrical shock or fire, use only
one COM ˜ (common) connection, or ensure
that all connections to COM ˜ are at the
same potential.
Measurement Probe Setup
The Test Tool supports measurement probes, for
example:
• 10:1 voltage probe
• 1 mV/°C temperature probe
• 10 mV/A current clamp
To set up a specific probe type:
1. Push to open the Scope and Meter menu.
2. Push 3 to open the INPUT A menu.
3. Use Y/Z to highlight SELECT.
4. Push to open the PROBE select menu.
5. Use
6. Push to accept the probe type and close the
Y/Z to highlight the probe type.
menu.
11
Page 22

123B/124B/125B
Users Manual
Tilt Stand
The Test Tool is equipped with a tilt stand, allowing
viewing from an angle. You can also use the tilt stand to
hang the Test Tool at a convenient viewing position. See
Figure 5.
Hanger
The optional hanger accessory is magnetic and used to
hang the Test Tool on metal surfaces such as a cabinet
door. See Figure 5.
Language Selection
To change the language:
1. Push to open the Menu.
2. Use YZ to highlight USER OPTIONS.
3. Push to open the USER OPTIONS menu.
4. Use
5. Push to open the USER > LANGUAGE menu.
6. Use YZ to highlight the language preference.
7. Push to accept the change and exit the menu.
YZ to highlight Language.
7.
1
2
3
Figure 5. Tilt Stand and Hanger
hxv50.eps
12
Page 23
Industrial ScopeMeter®
Scope and Meter Mode
Scope and Meter Mode
The Scope and Meter mode is the default operation
mode. When in another mode, such as Recorder, Power
Harmonics, or BusHealth, push to return to Scope
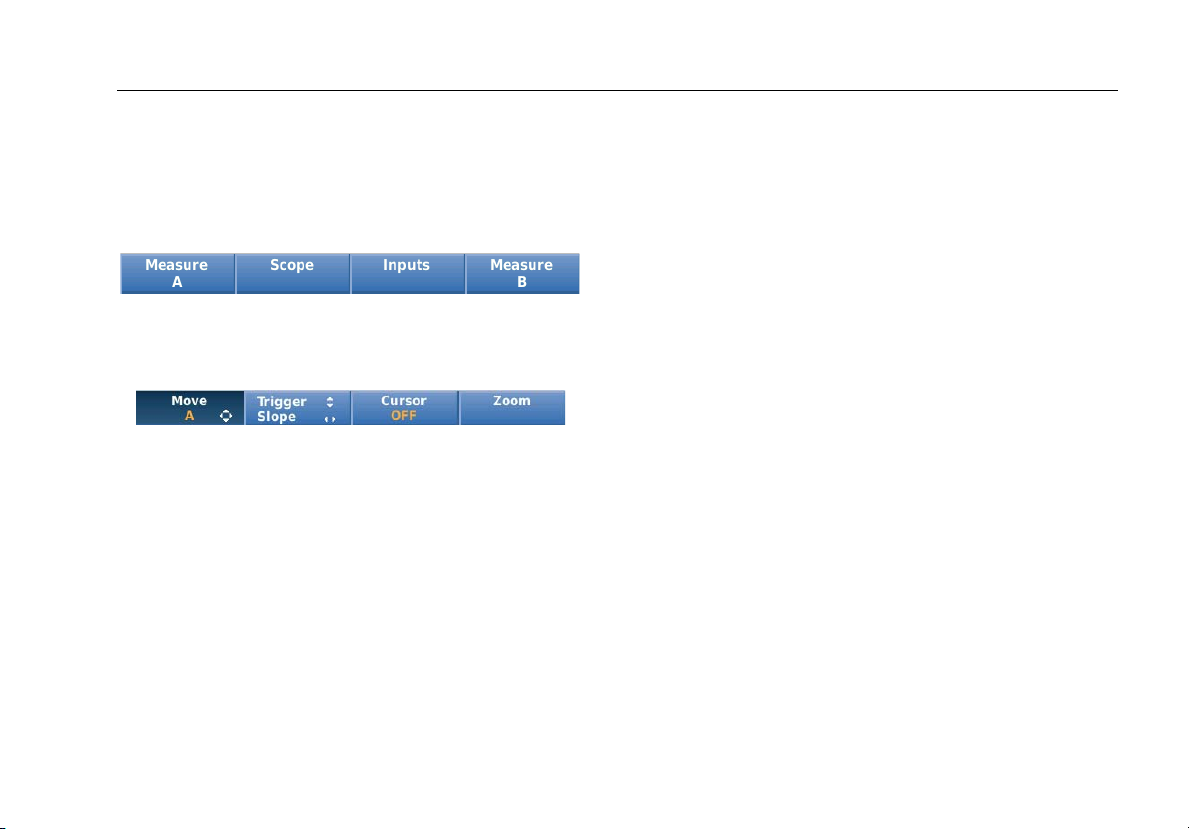
and Meter operation. In Scope and Meter mode, the
button bar looks like this:
sm_bar_eng.eps
To go to the Move and Zoom button bar, push until
you have left any open button bar or menu.
mz_bar_eng.eps
The yellow text on the button bar indicates the status.
Push the button to change the status.
XW Warning
To prevent possible electrical shock, fire, or
personal injury:
• Do not touch exposed metal on banana
plugs. They can have voltages that could
cause death.
• Disconnect power and discharge all
high-voltage capacitors before you
measure resistance, continuity,
capacitance, or a diode junction.
• Do not put metal objects into
connectors.
• Do not use exposed metal BNC or
banana plug connectors.
• Do not use the HOLD function to
measure unknown potentials. When
HOLD is turned on, the display does not
change when a different potential is
measured.
13
Page 24
123B/124B/125B
Users Manual
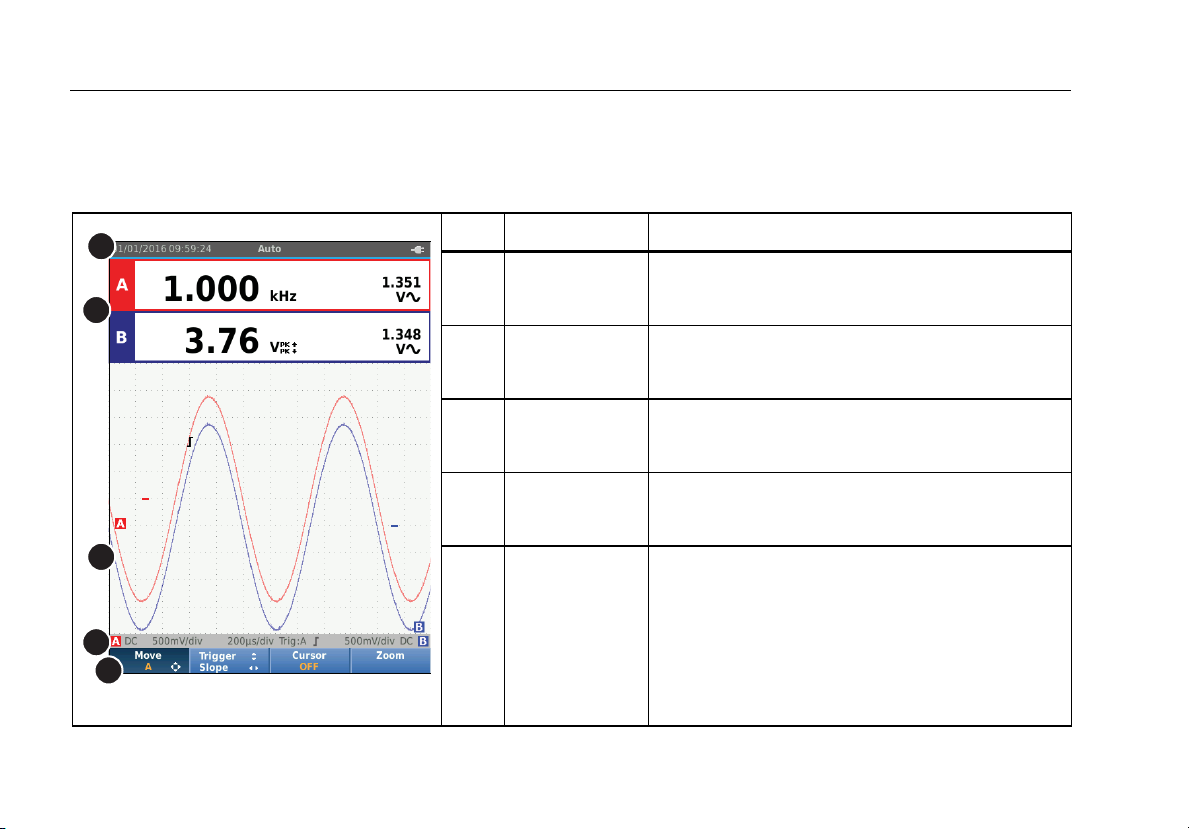
How to Read the Screen
The screen is divided into these areas: Information,
Reading, Waveform, Status, and Menu. See Table 3.
Table 3. Parts of the Screen
1
Item Area Description
2
Reading
D Status
3
4
5
hxv13.eps
E Button Bar
Information
Waveform
Date, time, and indicators like Auto range,
Hold/Run, AutoHold, and battery status.
Numeric readings. If only input A is on, you will see
the input A readings only.
Waveforms. If only input A is on, you will see the
input A waveform only.
Displays status of attenuations, timebase,
couplings, trigger source, and trigger slope.
Displays the choices available with
1234.
14
Page 25
Industrial ScopeMeter®
Scope and Meter Mode
When you change a setup, a part of the screen shows the
choices. Use WXYZ to access the menu choices.
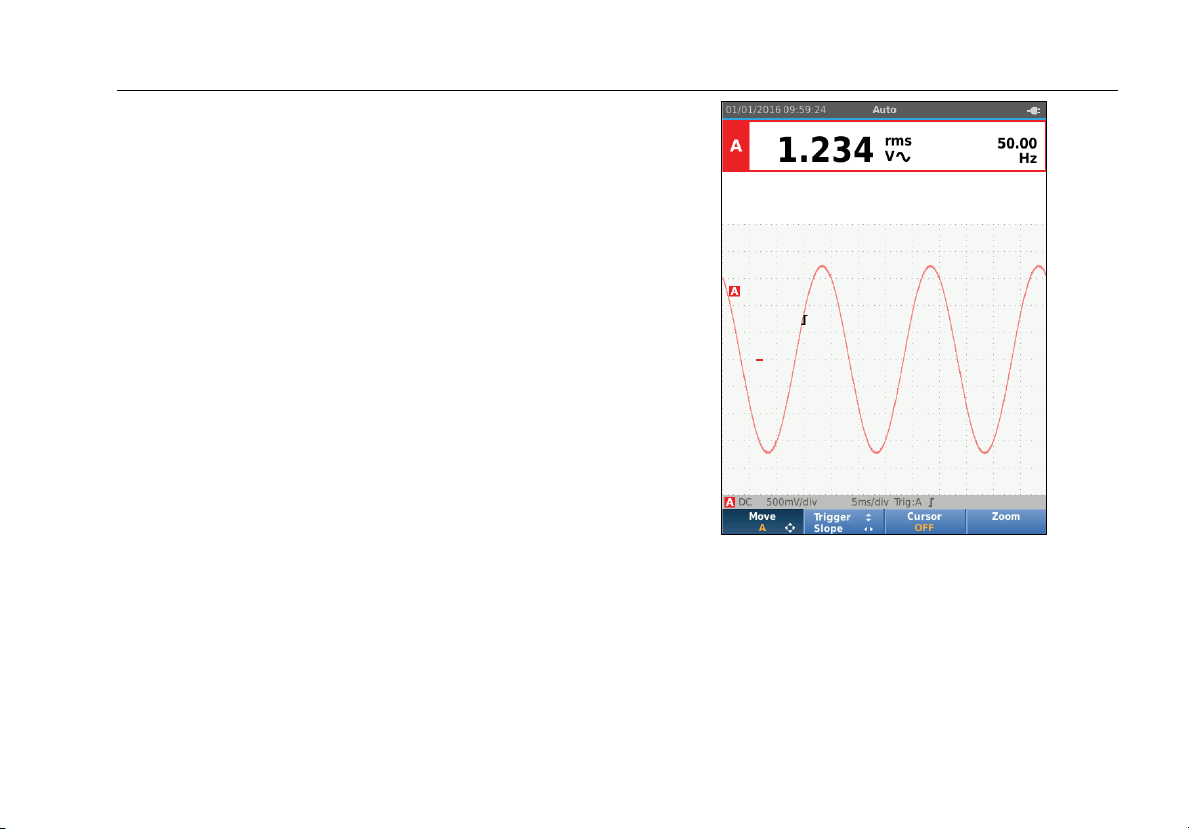
Connect-and-View™
The Connect-and-View™ function (Auto Set) enables
hands-off operation to display complex unknown signals.
This function optimizes the position, range, time base,
and triggering to ensure a stable display on most
waveforms. The setup will track the changes if the signal
changes. This feature is enabled by default.
To enable the Connect-and-View™ function when in
Manual mode:
1. Connect the red test lead from red input A to the
unknown signal to be measured.
2. Push to toggle between the Auto (automatic) and
Manual modes.
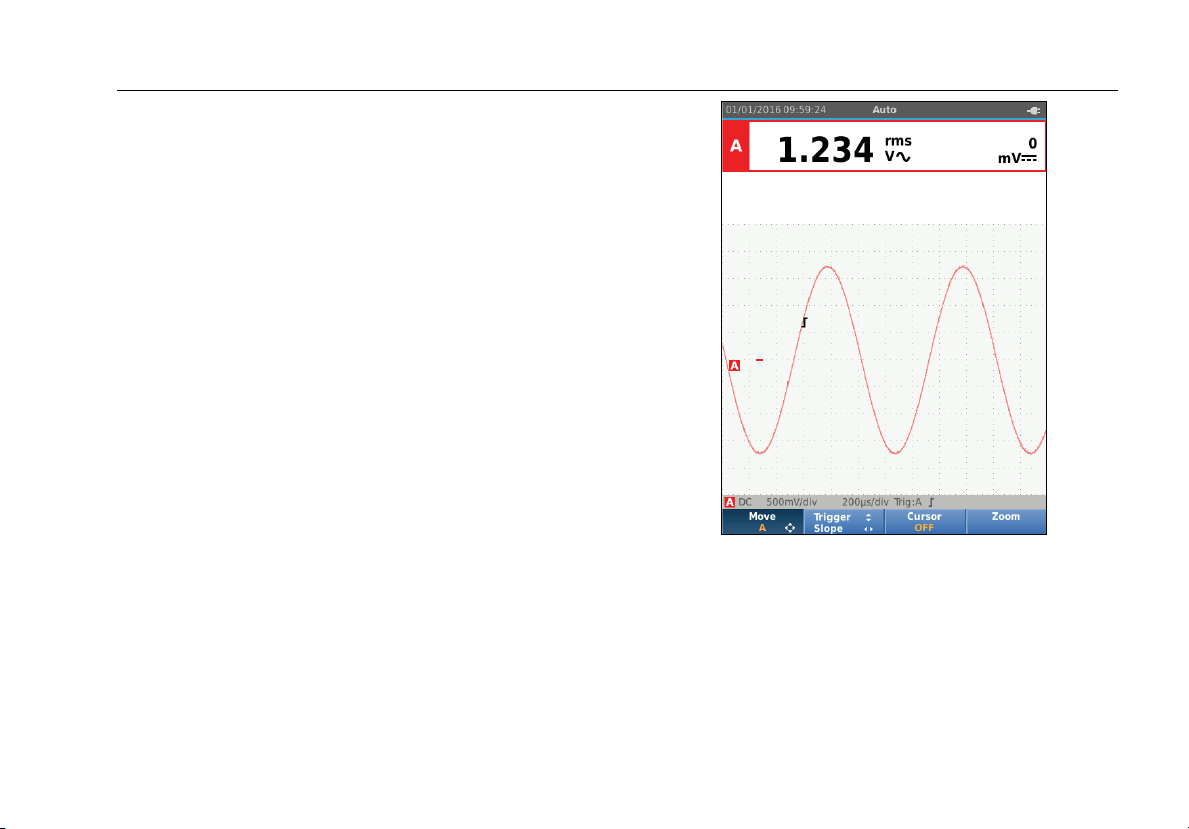
In Figure 6 the screen displays “1.234” in large numbers
and “50.00” in smaller numbers. A scope trace gives a
graphical representation of the waveform.
The trace identifier is visible at the left side of the
waveform area. The zero icon (-) identifies the ground
level of the waveform.
Figure 6. Auto Set Function
Measurements
The reading area shows the numeric readings of the
chosen measurements on the waveform that is applied to
the input jack. Figure 7, Figure 8, and Figure 9 illustrate
the setups for measurements.
hxv55.eps
15
Page 26
123B/124B/125B
Users Manual
1
2
3
2
see Figure 8
item 4
10 mV/A - 1 mV/A
see Figure 8
item 5
AB
Figure 7. Measurement Setup
AB
BB120
AB
hxv03.eps
16
Page 27
Industrial ScopeMeter®
Scope and Meter Mode
4
5
Figure 8. Correct Grounding Setup
AB
AB
hxv04.eps
17
Page 28
123B/124B/125B
Users Manual
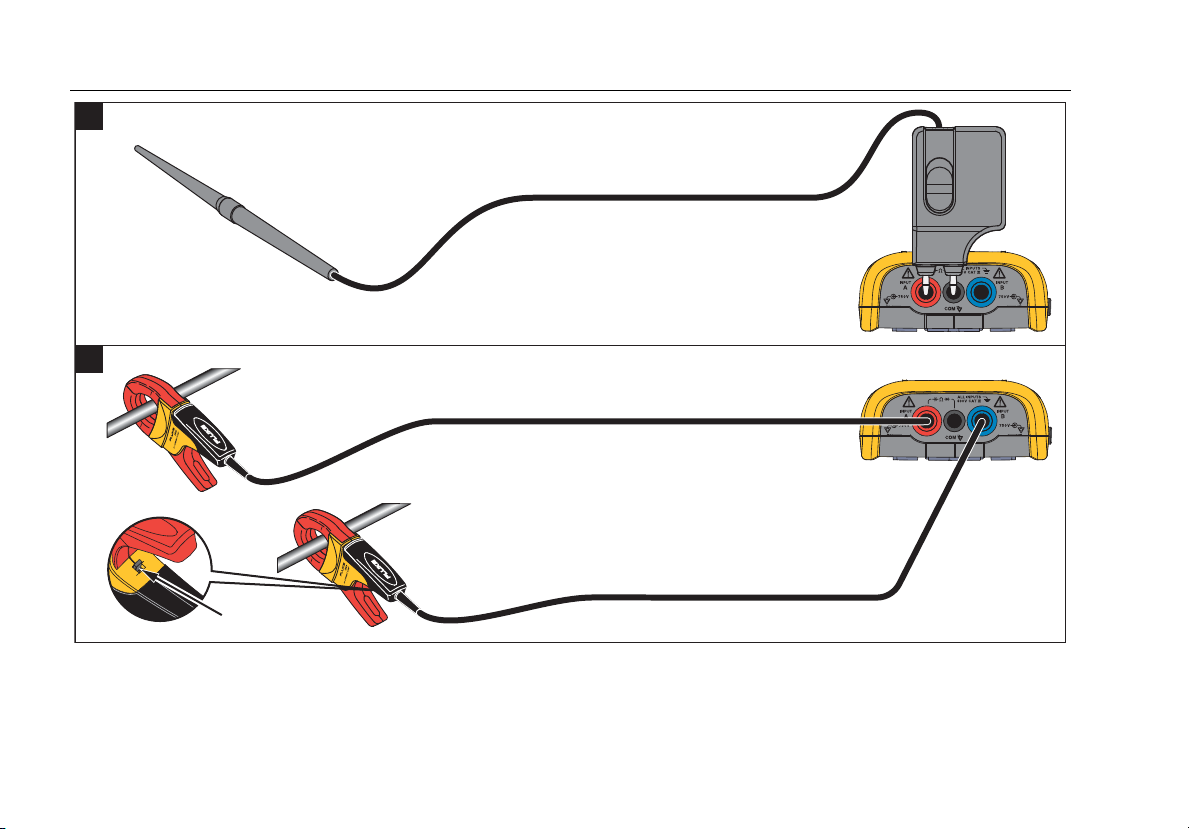
6
7
18
10 mV/A - 1 mV/A
Figure 9. Temperature and Current Measurement Setup
AB
hxv57.eps
Page 29

Industrial ScopeMeter®
Scope and Meter Mode
Inputs
Voltage Measurements
For proper grounding, connect the short ground leads to
the same ground potential, see Figure 8 setup 4. You can
also use test leads for grounding, see Figure 8 setup 5.
See also Grounding Guidelines on page 68.
Ohm, Continuity, Diode, Capacitance Measurements
Use the red shielded test lead from input A and the black
unshielded ground lead from COM (common) for Ohms
(Ω), continuity, diode, and capacitance measurements.
See Figure 7 setup 1.
Current Measurements
Select the probe setting that matches the used current
clamp and its setting, for example, 1 mV/A. See Figure 9
and Measurement Probe Setup.
Temperature Measurements
Use a 1 mV/°C or 1 mV/°F temperature transmitter (not
available in all countries) to get the correct temperature
reading. See Figure 9.
Power Measurements
Select correct probe settings for voltage measurement on
input A and current measurement on input B. See
Figure 7 setup 2.
IntellaSet™ / AutoReading
The AutoReading function uses Fluke IntellaSet™
technology to enable hands-off operation to display meter
readings that correspond with the shape of the waveform.
This function automatically selects the meter readings
that are most often used with the measurement of the
waveform shape. As an example, when the waveform is a
line voltage signal, the V ac + dc and Hz readings show
automatically.
To enable the AutoReading function on input A:
1. Push to open the Scope and Meter button bar.
2. Push 1 to open the MEASURE menu. See
Figure 10.
3. Push 1 to select the AutoReading to ON.
4. Push 4 to select Done and close the menu.
To disable this function, repeat the steps and select the
AutoReading to OFF.
19
Page 30

123B/124B/125B
Users Manual
Measurement Type
To manually set up or change the measurement type:
1. Push to open the Scope and Meter button bar.
2. Push 1 to open the MEASURE menu for Input A.
Push 4 to open the MEASURE menu for Input B.
3. Push Z/Y to highlight the measurement type, for
example, Hz.
When more setup selections are available for a
measurement type, you see a . Push to open
the submenu and make a selection.
20
hxv11.eps
Figure 10. AutoReading Function
hxv12.eps
4. Push to accept the measurement type and
close the menu.
5. Confirm that the selected measurement type is the
main reading. The former main reading moves to the
smaller secondary reading position.
Page 31

Industrial ScopeMeter®
Scope and Meter Mode
Screen Freeze
You can freeze the screen (all readings and waveforms)
at any time:
1. Push to freeze the screen. The information area
at the top of the screen shows .
2. Push again to resume measurements.
How to Hold a Stable Reading
The AutoHold® mode captures a stable main (large)
reading on the display. When the Test Tool detects a new
stable reading, it beeps and shows the new reading.
To use the AutoHold function:
1. Push to open the Scope and Meter button bar.
2. Push 1 to open the MEASURE A button bar.
3. Push 3 to enable AutoHOLD. The Information
area of the screen updates and the button label
shows AutoHOLD ON.
4. Push 4 to close the MEASURE A menu and
button bar.
5. Wait to hear the audible beep that means you have a
stable reading.
6. Repeat Step 1 to Step 4 to disable the AutoHold
function.
hxv13-1.eps
21
Page 32

123B/124B/125B
Users Manual
Relative Measurements
Zero Reference shows the present measurement result
with respect to the defined value. Use this feature to
monitor the measured value in relation to a known good
value.
To setup:
1. Push to open the Scope and Meter button bar.
2. Push 1 to open the MEASURE A button bar.
3. Push 2 to enable the relative measurement
(Zero On).
4. Push 4 to close the MEASURE A menu and
button bar.
The relative measurement is now the main reading,
and the former main measurement is now the smaller
secondary reading position.
5. Repeat Step 1 to Step 4 to disable the relative
measurement.
hxv14.eps
22
Page 33

Industrial ScopeMeter®
Scope and Meter Mode
Auto Range/Manual Range
Push to toggle between the Manual and Auto
Ranging modes.
When Auto Range is active, the Information area shows
Auto and the Test Tool automatically adjusts the position,
range, time base, and triggering (Connect-and-View).
This ensures a stable display on nearly all waveforms.
The Status area shows the range, the time base for both
inputs, and the trigger information.
When Manual is active, the Information area shows
Manual.
Screen Graphic Adjustment
From Auto Range, use YZWX to manually change the
waveform trace. This turns off the Connect-and-View
function. Observe that Auto in the Information area
disappears.
Amplitude
The available amplitude settings are from 5 mV/div to
200 V/div with the use of test leads.
1. Push to enlarge the waveform.
2. Push to reduce the waveform.
Time Base
The available time base settings are 10 ns/div or
20 ns/div (depends on model) to 5 s/div in normal mode.
1. Push (s) to increase the number of periods.
2. Push (ns) to decrease the number of periods.
Waveform Position
You can move the waveforms around on the screen.
Repeatedly push until all menus and secondary
button bars close.
1. Push 1 to select Move A.
2. Use
The trigger identifier () moves horizontally and vertically
on the screen as the waveform moves.
WXYZ to move the A waveform on the
screen.
Note
The waveform positions are fixed for 3-phase
power measurements.
23
Page 34

123B/124B/125B
Users Manual
Noise Reduction
To view the waveform without higher frequency noise:
1. Push to open the Scope and Meter button bar.
2. Push 3 to open the INPUT SETTINGS menu.
3. Use YZ to highlight the Noise filter as ON.
4. Push to make the change.
This noise filter is a 10 kHz bandwidth limit filter.
hxv15.eps
Glitch Display
By default, the displayed waveform shows glitches. For
each time position the minimum and maximum values
since the last time position are shown. A glitch of 25 ns or
wider is still visible on the screen even when using a
slower timebase.
To disable this feature and see one sample/channel for
each sample time:
1. Push to open the Scope and Meter button bar.
2. Push 2 to open the SCOPE menu.
3. Use
4. Push to make the change.
5. Push 4 to exit the menu.
YZ to highlight the Type as Glitch Off.
This feature will be turned off for both channel A and
channel B.
24
Page 35

Industrial ScopeMeter®
Scope and Meter Mode
Waveform Smoothing
To smooth the waveform:
1. Push to open the Scope and Meter button bar.
2. Push 2 to open the SCOPE SETTINGS menu.
hxv16.eps
3. Use YZ to highlight the Type as Smooth. Both the
input A and input B waveforms are smoothed.
4. Push to make the change.
5. Push 4 to exit the menu.
Waveform smoothing suppresses noise without loss of
bandwidth. Waveform samples with and without
smoothing are shown in Figure 11. Smoothing is the
average of eight acquired waveforms. Glitch detect is
turned off in this mode.
hxv17.eps
Figure 11. Waveform Smoothing
25
Page 36

123B/124B/125B
Users Manual
Reading Smoothing
To smooth the readings on A:
1. Push to open the Scope and Meter button bar.
2. Push 3 to open the INPUT SETTINGS menu.
3. Use
4. Push to make the change.
5. Push 4 to exit the menu.
For best results, set Readings to:
• Fast for short averaging, fast response
• Normal is the default setting
• Smooth for long averaging, stable readings
YZ to highlight the Readings as Smooth.
How to Display the Envelope of a Waveform
The Test Tool records the envelope (minimum and
maximum) of the live waveforms for inputs A and B.
Repeat the first two actions of Smoothing the Waveform,
and then do the following:
To display the waveform envelope:
1. Push to open the Scope and Meter button bar.
2. Push 2 to open the SCOPE SETTINGS menu.
3. Use
YZ to highlight the Type as Envelope.
4. Push to make the change.
5. Push 4 to exit the menu.
The screen shows the resultant envelope waveform. You
can use Envelope to observe the variations in time or
amplitude of input waveforms over a longer time period.
hxv18.eps
26
Page 37

Industrial ScopeMeter®
Scope and Meter Mode
Waveform Acquisition
The Test Tool can be setup to acquire waveforms as
needed for a specific application. This section explains
the setup options.
Single Acquisition
To catch single events, you can perform a single shot
(one time screen update).
To set up the Test Tool for a single shot on the input A
waveform:
1. Connect the probe to the signal to be measured.
2. Push to open the Scope and Meter button bar.
3. Push 2 to open the SCOPE SETTINGS menu.
4. Use
5. Push to make the change.
6. Push 4 to exit the menu.
YZ to highlight the Update as Single.
The Test Tool will now show the acquisition screen
and the Information area updates:
Waiting
Run
Hold
Test Tool is waiting for a trigger
single acquisition is triggered
single acquisition is complete
hxv19.eps
To continue with the next single acquisition:
7. Push and wait for another single acquisition
trigger.
27
Page 38

123B/124B/125B
Users Manual
Slow Signals
The roll mode function supplies a visual log of waveform
activity. Use slow signals to measure lower frequency
waveforms.
1. Push to open the Scope and Meter button bar.
2. Push 2 to open the SCOPE SETTINGS menu.
3. Use
4. Push to make the change.
5. Push 4 to exit the menu.
6. Push to freeze the waveform in roll mode.
To capture longer waveform recordings, see Recorder
Mode.
YZ to highlight the Update as Roll.
The waveform moves across the screen from right to
left like a normal chart recorder. The Test Tool does
not make measurements while recording.
The measurement values show only after you push
.
hxv20.eps
28
Page 39

Industrial ScopeMeter®
Scope and Meter Mode
AC Coupling
Use AC-coupling to observe a small ac signal that rides
on a dc signal.
To select ac-coupling on input A:
1. Push to open the Scope and Meter button bar.
2. Push 3 to open the INPUT SETTINGS menu.
3. Use YZ to highlight the Coupling as AC.
4. Push to make the change.
5. Push 4 to exit the menu.
Waveform Trigger
The trigger tells the Test Tool when to start the waveform
trace. You can:
• select which input signal to use
• select which edge this should occur
• define the condition for a new update of the
waveform
The bottom line of the waveform area identifies the trigger
parameters in use. Trigger icons on the screen indicate
the trigger level and slope.
Note
The trigger settings are fixed for 3-phase power
measurements.
Set Trigger Level and Slope
For quick operation, use to automatically trigger on
nearly all signals. toggles between the Auto and
Manual mode. The current operating mode is shown in
the Information Area.
To optimize trigger level and slope manually:
1. Repeatedly push until all menus and
secondary button bars close.
2. Push 2 to enable and use WXYZ to set the
Trigger level and slope adjustment.
29
Page 40

123B/124B/125B
Users Manual
3. Use YZ to adjust the Trigger level continuously.
Observe that the trigger icon on the third time
division line indicates the trigger level.
4. Use WX for Trigger on either positive slope or
negative slope of the chosen waveform.
hxv21.eps
Select Trigger Parameters
To trigger on the Input A waveform and configure the auto
range trigger for waveforms down to 1 Hz:
1. Push to open the Scope and Meter button bar.
2. Push 2 to open the SCOPE SETTINGS menu.
30
hxv22.eps
Page 41

Industrial ScopeMeter®
Scope and Meter Mode
3. Push to highlight A in the Trigger Input group.
4. Use YZ to highlight the Update as On trig.
5. Push to make the change.
6. Push 4 to accept all trigger selections and return
to normal measurement.
To autorange on signals down to 1 Hz:
1. Push to open the MENU.
2. Use
3. Push to open the USER OPTIONS MENU.
4. Use
5. Push to open the USER > AUTOSET MENU.
6. Use
7. Push to make the change.
YZ to highlight USER OPTIONS.
YZ to highlight Autoset Settings.
YZ to highlight the Search For Signals as
> 1 Hz.
8. Push to close all menus.
Note
Setting the automatic triggering to >1 Hz will
slow down the auto range.
The Information area updates with:
Wait
ON TRIGGER
Gray text in a menu or button bar indicates that
the function is disabled or the status is not valid.
no trigger found
screen updates only when valid
triggers occur
Note
31
Page 42

123B/124B/125B
Users Manual
Cursor Measurements
Cursors allow you to make precise digital measurements
on waveforms. Cursors are disabled for 3-phase power
measurements.
Horizontal Cursors
Use horizontal cursors to measure the amplitude, high
and low value, or overshoot of a waveform.
To use the cursors for a voltage measurement:
1. Repeatedly push until all menus and
secondary button bars close.
2. Push 3 to select CURSOR ON.
3. Push 1 to select . Observe that two horizontal
cursor lines are shown on the screen.
4. Push 2 to select the upper cursor.
5. Use
6. Push 2 to select the lower cursor.
7. Use YZ to move the position of the lower cursor
YZ to move the position of the upper cursor
on the waveform.
on the waveform.
Note
Even when the key labels are not displayed at
the bottom of the screen, you can still use the
arrow keys.
The readout shows the voltage difference between the
two cursors and the voltages at the cursors in relation to
the zero icon (-).
hxv23.eps
32
Page 43

Industrial ScopeMeter®
Scope and Meter Mode
Vertical Cursors
Use vertical cursors to measure the time difference “t”
between the cursors and the voltage difference between
the two markers.
To use the cursors for a time measurement:
1. Push 3 to select CURSOR ON.
2. Push 1 to select . Observe that two vertical
cursor lines are shown on the screen. Markers (-)
identify the point where the cursors cross the
waveform.
3. Push 2 to select the left cursor.
4. Use
5. Push 2 to select the right cursor.
6. Use
WX to move the position of the left cursor on the
waveform.
WX to move the position of the right cursor on
the waveform.
hxv24.eps
33
Page 44

123B/124B/125B
Users Manual
Rise Time Measurements
To measure rise time:
1. Push 3 to select CURSOR ON.
2. Push 1 to select (rise time). Observe that two
horizontal cursors are displayed.
3. Push 4 if only one trace is displayed and select
MANUAL or AUTO. AUTO automatically does steps
5 to 7. For two traces, select the required trace A
or B.
4. Use YZ to move the upper cursor to 100% of the
trace height. A marker is shown at 90%.
5. Push 2 to select the other cursor.
6. Use
7. Push 3 to disable the cursors.
YZ to move the lower cursor to 0% of the
trace height. A marker is shown at 10%.
The reading now shows the risetime from 10%-90%
of the trace amplitude and the voltage at the cursors
in relation to the zero icon (-).
hxv25.eps
34
Page 45

Industrial ScopeMeter®
Power and Harmonics Mode
High Frequency Measurements with 10:1 Probe
Fluke recommends the VP41 10:1 Probe to measure high
frequency signals in circuits with high impedance. The
loading of the circuit by a 10:1 Probe is much lower than
that of a 1:1 Shielded Test Lead.
Probe attenuation and probe adjustment must be
observed when using a 10:1 Probe.
Probe Attenuation
The Probe attenuates the signal 10X. The example below
is for a Probe connected to input A.
To adapt the Test Tool’s voltage readout to this
attenuation:
1. Push to open the Scope and Meter button bar.
2. Push 3 to open the INPUT SETTINGS menu.
3. Use
4. Push to open the PROBE SELECT menu.
5. Use
6. Push to make the change.
Observe that the 10X attenuation of the Probe is
compensated in the voltage readout.
YZ to go to Select>.
YZ to highlight 10:1 V.
Probe Adjustment
The VP41 Probe is always adapted correctly to its inputs.
High frequency adjustment is not necessary.
Other 10:1 Probes however must be adjusted for optimal
High Frequency performance. See 10:1 Scope Probes for
information about how to adjust these Probes.
Power and Harmonics Mode
The Power and Harmonics mode offers:
• Single phase power measurements with waveform and
harmonics display
• Voltage RMS, Current RMS, frequency, and phase
measurements
• Active, apparent, and reactive power measurements
• Power factor, cos ϕ, and total harmonic distortion
measurements
This section is a step-by-step introduction to power and
harmonics measurements. It does not cover all of the
capabilities of the Test Tool but gives basic examples to
show how to use the menus and perform basic
operations.
To use the power and harmonics functions, connect the
voltage leads and current probe as shown in Figure 7
setup 2.
35
Page 46

123B/124B/125B
Users Manual
To select the power and harmonics mode:
1. Push to open the SETTINGS menu.
2. Use YZ to highlight POWER HARMONICS.
3. Push to open the Ampere Probe on B
SETTINGS menu.
If the voltage probe on A and current probe on B
have not been selected before, complete Step 4 to
Step 10.
4. Push 3 to select the probe settings.
hxv26.eps
5. Use YZ to highlight SELECT… in Probe A group.
6. Push to open the Probe A menu.
7. Use
8. Push to make the change.
9. Push 3 to select the probe settings.
10. Use
11. Push to make the change.
YZ to highlight the Probe A type.
YZ to highlight the Probe B (current clamp)
type.
Other settings stay the same.
Volts/Amps/Watt Measurements
This function simultaneously shows the voltage and
current signal. Use this function to get a first impression
of the voltage and current signal before you examine the
signal in more detail with the other functions.
To select the type of measurement:
1. Push 2 to select the waveform display.
2. Push 1 to toggle between the Voltage/Current or
Power readings.
36
Page 47

Industrial ScopeMeter®
Power and Harmonics Mode
Table 4 is a list of the visible readings when
Voltage/Current is selected.
Table 4. Volt/Amp Readings
hxv27.eps
Symbol Description
rms
v
Hz
rms
a
A<B
Deg
Voltage AC value on channel A
Frequency of voltage signal on channel A
Current AC value on channel B
Phase angle between voltage on channel A
and current on channel B
Table 5 is a list of the visible readings when Power is
selected.
Table 5. Watt Readings
hxv28.eps
Symbol Description
KW
VA
VAR
Hz
PF
Active power in Watt
Apparent power in Volt Ampere
Reactive power in Volt Ampere
Frequency
Power factor. The ratio between active power
and apparent power.
37
Page 48

123B/124B/125B
Users Manual
Harmonics Measurements
Harmonics are periodic distortions of voltage, current, or
power sine waves. A waveform can be considered a
combination of various sinewaves with different
frequencies and magnitudes. The contribution of each
component to the full signal is measured.
Harmonics power distribution systems are often caused
by non-linear loads such as switched mode DC power
supplies in computers, TVs, and adjustable speed motor
drives. Harmonics can cause transformers, conductors,
and motors to overheat.
In the Harmonics function, the Test Tool measures
harmonics to the 51
components, THD (Total Harmonic Distortion), and
K factor are measured.
You can display the harmonics of:
• Voltage measurements on Input A
• Current measurements on Input B
• Power measurements calculated from Voltage
measurements on Input A and Current
measurements on Input B.
st
. Related data such as DC
In the Harmonics mode the Test Tool always uses the
AUTO mode. The vertical sensitivity range and the time
base range are automatically adjusted to the most
suitable range for the applied input signal. The ranging
keys ( / / ) and are locked.
Input A is forced to measure voltage. Input B is forced to
measure current.
To make harmonics measurements:
1. Push 2 to select the harmonics display.
2. Push 1 to toggle between the voltage, current or
power readings.
3. Push 4 to turn on the cursor.
When the harmonics display with voltage measurements
is selected, the screen shows as in Table 6. For
harmonics display when current measurements are
selected, see Table 7. For harmonics display when watts
measurements are selected, see Table 8.
38
Page 49

Industrial ScopeMeter®
Power and Harmonics Mode
Table 6. Harmonics Voltage Measurements
Readout Description
rms V AC Voltage AC value on channel A
THD is the amount of harmonics in a signal as a percentage
of the total RMS value (THD%r) or as a percentage of the
fundamental (THD%f). It is a measure of the degree to which
a waveform deviates from a purely sinusoidal form. 0%
indicates that there is no distortion. You can select THD%r or
THD%f in the Settings menu (3).
The harmonics component as selected with the cursor. Use
WX to move the cursor. In the example screen this is the third
harmonic. The values to the right of this number will change
when the cursor is moved to another harmonic component.
The amount of the selected harmonic component in the
voltage signal as a percentage of the total RMS value
(THD%r) or as a percentage of the fundamental (THD%f). You
can select %r or %f in the Settings menu (3).
The phase angle between the harmonic component and the
fundamental voltage.
hxv29.eps
THD %f
Nr (3)
V Voltage of the harmonic component as selected by the cursor.
%f
Deg
39
Page 50

123B/124B/125B
Users Manual
Table 7. Harmonics Current Measurements
Readout Description
Rms AAc Current AC value on channel A
THD is the amount of harmonics in a signal as a percentage
of the total RMS value (THD%r) or as a percentage of the
THD %f
fundamental (THD%f). It is a measure of the degree to which
a waveform deviates from a purely sinusoidal form. 0 %
indicates that there is no distortion. You can select THD%r or
THD%f in the Settings menu (1).
40
hxv30.ep
KF
Nr (3)
A Current of the harmonic component as selected by the cursor.
%f
Deg
K-Factor indicates the losses in transformers due to harmonic
currents.
The harmonics component as selected with the cursor. Use
WX to move the cursor. In the example screen this is the third
harmonic. The values to the right of this number will change
when the cursor is moved to another harmonic component.
The amount of the selected harmonic component in the
current signal as a percentage of the total RMS value
(THD%r) or as a percentage of the fundamental (THD%f). You
can select %r or %f in the Settings menu (3).
The phase angle between the harmonic component and the
fundamental current.
Page 51

Industrial ScopeMeter®
Power and Harmonics Mode
Table 8. Harmonics Power Measurements
Readout Description
W Active power in Watts
hxv31.ep
KF
Nr (3)
W Power of the harmonic component as selected by the cursor.
%f
Deg
K-Factor indicates the losses in transformers due to harmonic
currents.
The harmonics component as selected with the cursor. Use
WX to move the cursor. In the example screen this is the third
harmonic. The values to the right of this number will change
when the cursor is moved to another harmonic component.
The amount of the selected harmonic component in the
current signal as a percentage of the total RMS value
(THD%r) or as a percentage of the fundamental (THD%f). You
can select %r or %f in the Settings menu (1).
The phase angle between the harmonic component and the
fundamental current.
41
Page 52

123B/124B/125B
Users Manual
Zooming Harmonics
If the harmonics bars screen is shown, you can zoom
vertically for a more detailed view. Use
or zoom out.
The scale at the left side changes when zooming in or
out.
YZ to zoom in
Fieldbus Mode
Fieldbuses are bi-directional, digital, serial control
networks used in process control and industrial
automation.
The Test Tool can indicate the status of the following
aspects of the OSI model Physical Layer:
• Voltage levels (bias, high level, low level)
• Bit width – baud rate
• Rise and fall time
• Distortion
The Test Tool can show the bus signal waveform in the
Eye-pattern mode, see page 47.
The Test Tool operates in full automatic (ranging and
triggering) mode. Test limits are preset, but can be
changed, see page 47.
For supported bus types and protocols see Table 9.
For extended information on Fieldbuses and fieldbus
measurement, see Appendix A of this manual.
Note
To check a suspected cable you can make
resistance measurements and capacitance
measurements using the Scope/Meter mode.
To do fieldbus measurements:
1. Push to open the MENU.
2. Use YZ to highlight BUSHEALTH.
3. Push to open the BUS HEALTH menu.
4. Use
5. Push to make the change.
6. Connect the inputs as shown in Figure 8, setup 4.
YZ to highlight the bus type.
Select User1 or User2 to create a customized set of
limits to test nonstandard bus systems. See page 48
for information about how to set the test limits.
Default settings are RS232 for User1 and Foundation
Fieldbus H1 for User2.
For bus types with additional options, a secondary
menu is available. Use
and to make the change.
An example of the screen is shown in Table 10.
YZ to highlight the option
42
Page 53

Industrial ScopeMeter®
Fieldbus Mode
Table 9. Bus Measurement Inputs
7. Use the BB120 Banana-to-BNC Adapter to connect a
BNC cable for bus measurements.
You can use the optional BHT190 Bushealth Test
adapter to easily connect the probe tip to a bus that
uses a DB9, RJ-45, or a M12 connector.
hxv32.eps
Bus Subtype
AS-i x - STL120
CAN x x STL120
Interbus S RS-422 x - VP41
DeviceNet x x STL120
Modbus
Foundation
fieldbus
Profibus
RS-232 x - STL120
RS-485 x x STL120
RS-232 x - STL120
RS-485 x x STL120
H1 x - STL120
DP/RS-485 x x STL120
PA/31.25 kBit/s x - STL120
Input
A B
Advised
Probe
43
Page 54

123B/124B/125B
Users Manual
How to Read the Screen
The bus test screen shows the status of the various signal
properties. To open, go the main screen and push 3.
Information is represented in four columns, see Table 10.
Table 10. Field Bus Test Screen
Item Description
Signal property under test, for example, VHigh. Rows show each
A
A B C D
hxv33.eps
signal property and corresponding data. See Table 11 for a description
of the signal properties for the bus types.
Status indicator. See Table 12 for a description of the indicators.
B
Most recent measurement value, for example, 3.5 V.
C
--OL
Used low (LOW) and high (HIGH) test limits (LIMIT), for example 18.5
D
31.6V.
LIMIT *
N/A
indicates that no reading is available
indicates that the signal is out of the measurement range
(overload)
The * indicates that one or more of the limits are not set to
the default value.
The limit does Not Apply to this bus type.
44
Page 55

Industrial ScopeMeter®
Fieldbus Mode
Table 11. Test Signal Properties
Property Explanation Property Explanation
VBias Bias voltage CAN-Rec. L CAN-recessive low level voltage
CAN-Rec. H-L
CAN-Rec. H CAN-recessive high level voltage Vpk-pk Peak to peak voltage
V-Level High-Bias High level to bias level voltage V Low Low level voltage
V-Level Bias-Low Bias level to low level voltage V-Level pk-pk Peak to peak voltage
CAN-DOM. H-L
CAN-DOM. H CAN-dominant high level voltage V-level low Low level voltage
CAN-DOM. L CAN-dominant low level voltage
Data
Rise Rise time as % of bit width
Fall Fall time as % of bit width
Distortion Jitter Jitter distortion Distortion Amplitude Amplitude distortion (AS-i bus)
Distortion Overshoot
CAN-recessive high to low level
voltage
CAN-dominant high to low level
voltage
Bit width Data Baud Baud rate
Signal distortion, over- and
undershoot
V High High level voltage
V-level high High level voltage
45
Page 56

123B/124B/125B
Users Manual
Table 12. Bus Test Screen Indicators
Indicator Description
Bus activity indicators
Bus activity indicator 1:
c No reading available.
f Test OK. Measurement results are within 80% of allowable range, see Figure 12.
d Warning. Measurement results are between 80% and 100% of allowable range, see Figure 12.
e Test failed. Measurement results are out of allowable range, see Figure 12.
(filled) voltage measured
(open) no voltage measured
Bus activity indicators 2 and 3:
(both open) no activity
(blinking)
Busy, the Test Tool is measuring/processing data.
activity
46
Page 57

Industrial ScopeMeter®
Fieldbus Mode
Figure 12 shows the bus health indicator boundaries. The
high level voltage of a bus must be between +3.0 V (MIN)
and +15.0 V (MAX). Depending on the measurement
result, the displayed indicator will be:
f
d
e
Result is between 4.2 and 13.8V. (10 % of
12 V = 1.2 V)
Result is between 3 V and 4.2 V, or between
13.8 V and 15 V.
Result is <3 V or >15 V.
hxv34.eps
Figure 12. Bus Health Indicator Boundaries
How to View the Bus Waveform Screen
To view the waveform eye pattern of the bus voltage:
1. Push 3. The screen shows the eye pattern. The
screen shows the waveforms of one bit time
triggered on a positive, as well as, on a negative
edge in persistence mode.
2. Push 1 to clear the persisted waveforms and
restart to show the waveform.
3. Push to freeze the screen. Push again to
clear the persistence waveform and restart the
waveform eye pattern.
hxv35.eps
47
Page 58

123B/124B/125B
Users Manual
Test Limits
The test limits apply to the selected bus type. To change
the test limits:
1. Push to open the MENU.
2. Use
3. Push to open the BUS HEALTH menu.
4. Use
5. Push to make the change.
6. From the BUSHEALTH main screen, push 1 to
7. Use
YZ to highlight BUSHEALTH.
YZ to highlight the bus type.
Select User1 or User2 to create a customized set of
limits to test nonstandard bus systems.
Default settings are RS232 for User1 and Foundation
Fieldbus H1 for User2.
open the SETUP LIMITS menu. The header shows
the bus type.
YZWX to highlight the property for the limit.
Note
Use 2 to set all limits to the default setting.
hxv36.eps
48
Page 59

Industrial ScopeMeter®
Recorder Mode
8. Edit the limit.
hxv37.eps
An asterisk (*) in the SETUP LIMITS screen
indicates that a signal property has limits that differ
from the default setting.
9. Push 3 to select N/A if a limit should not be
involved in the test.
10. Push 4 to accept the limits and return to the test
screen.
In the test screen the text LIMIT will be followed by
an * if any of the limits is not the default limit.
Note
Changed limits persist until a new change is
made or the Test Tool is reset.
Recorder Mode
The Test Tool offers recording and logging functionality:
• Meter Recorder to log meter readings over a long
period of time.
• Scope Recorder to continuously log waveforms for a
long period of time without time gaps (as is the case
in Scope and Meter mode).
49
Page 60

123B/124B/125B
Users Manual
The Meter Recorder makes the Test Tool act as a
paperless recorder that collects a series of parameter
measurements over time and shows the result as a graph
or a trend-line on screen. This is most useful to
understand the change of individual parameters over time
or the influence of environmental changes like
temperature over time.
The Scope Recorder captures waveforms. The applied
input voltage is registered over time and the resulting
waveform is stored in a long memory record. This can be
used to capture intermittent problems. Deviations from
the original signal are stored as events that can be easily
viewed after recording without the need to check all
information.
Start and Stop Meter Recording
Before you record, apply a stable signal to input A and B.
To set the parameters for recording:
1. Push to open the Recorder button bar.
2. Push 1 to open the RECORDING SETTINGS
menu.
50
hxv38.eps
3. Use YZ to highlight Set Duration.
4. Push to open the RECORDER SETTINGS >
DURATION menu.
hxv39.eps
Page 61

Industrial ScopeMeter®
Recorder Mode
5. Use YZWX and to enter the time in hours
and minutes.
Events are used to determine how often the
measured reading deviates from the initial reading
when recording starts. It is easy to see the time of a
deviation when you view the recording after it stops.
6. Use YZ to highlight Set Threshold.
7. Push and use YZ and to enter the
percentage deviation for meter readings.
8. Use
9. Push to accept the memory location.
10. Push 4 when done.
11. To start or stop a recording, push or 4.
The Test Tool continuously logs all readings to memory
and displays these as graphs. When both input A and
input B are on, the upper graph is input A.
YZ to highlight the memory type for recording
as either the internal memory of the Test Tool or an
SD memory card.
Note
The Test Tool beeps when an event occurs. If
no event is specified, a beep happens when a
new minimum or maximum value is detected.
hxv40.eps
The Recorder shows a graph derived from the MAIN
readings.
The other readings show the average (AVG), the
minimum (MIN), and the maximum (MAX) reading since
the Recorder start and the time of the most recent change
of a value.
51
Page 62

123B/124B/125B
Users Manual
Cursor Measurements
Use the cursor to make precise digital measurements on
the plotted graphs. The display shows the measurement
results, the date, and the time at the cursor position. Each
result is a maximum and a minimum measurement.
To use cursors:
1. Push to stop the graph update and freeze the
screen.
2. Push 2 to open the RECORDING VIEW menu.
3. Use
4. Push to accept the change.
5. Push 4 to exit the menu.
6. Use WX to move the cursors.
YZ to highlight Cursor On.
hxv41.eps
The readings show a minimum and maximum value.
These are the minimum and maximum values of the
readings for the time period that represents one pixel on
the display.
52
Page 63

Industrial ScopeMeter®
Recorder Mode
Zoom In/Out on Logged Meter Data
By default, the display shows a compressed view of all
the data with minimum and maximum pairs for the interval
that corresponds with one pixel on the display.
To view uncompressed data in the normal view:
1. Push 2 to open the RECORDING VIEW menu.
2. Use YZ to highlight View Normal.
3. Press to accept the change.
To zoom in or zoom out on the logged data in normal
view, push . This button is a rocker switch. Use the
left (s) end to zoom in. Use the right end (ns) to zoom out.
When a cursor is on, zoom is centered on the area
around the cursor.
Events
Deviations from the initial readings specified in the
Recorder Settings menu as a percentage, are marked as
events.
To jump between the start of discrete events:
1. Push 3 to select Events < >.
2. Use WX to jump between events. The readings on
the top positions will mark the value at the start of the
event.
Scope Record Mode
The Scope Record mode shows all the waveform data as
a long waveform of each active input. This display mode
can be used to show intermittent events. Because of the
deep memory, recording can be done for a long period.
The Test Tool stores 1 sample/channel for each sample
time. Defining event thresholds allows you to quickly view
details of the signal that deviate from the normal signal.
Cursor Measurements, Zoom, and Events are available in
the Scope Record mode.
Before you record, apply a stable signal to input A and
input B.
To set the parameters for Scope Record:
1. Push to open the Recorder button bar.
2. Push 1 to open the RECORDING SETTINGS
menu.
3. Use YZ to highlight Scope Recording.
4. Push to accept the change.
5. Use YZ to highlight Set Duration.
6. Push to open the DURATION menu.
53
Page 64

123B/124B/125B
Users Manual
hxv39.eps
7. Use YZWX and to set the time.
Events are used to determine how often a waveform
deviates from the initial waveform when recording
starts. It is easy to see the time of a deviation when
you view the recording after it stops.
8. Use
9. Push and use YZ and to set the
10. Use YZ to highlight the memory type for recording
11. Push to accept the memory location.
12. Push 4 when done.
YZ to highlight Threshold.
percentage of deviation for time (relative to 1 period)
and the amplitude deviation (relative to peak-to-peak)
for waveforms. Threshold can be used for signals up
to 10 kHz.
as either the internal memory of the Test Tool or an
SD memory card.
13. To start or stop a recording, push or 4.
The Test Tool continuously logs all data to memory.
While recording, the display does not update since all
the processing capacity is needed for recording.
Note
The Test Tool beeps when an event occurs.
hxv42.eps
54
Page 65

Industrial ScopeMeter®
Save and Recall Data Sets
Save and Recall Data Sets
The Test Tool has 20 internal data memory locations. In
each memory location you can save a data set in Scope
and Meter mode.
A data set consists of the screen data, the waveform
data, and the Test Tool setup.
To save a data set:
1. Push to open the menu.
2. Push 2 to open the SAVE menu.
hxv43.eps
3. Push 1 to toggle between save to Internal
memory or SD Card memory.
4. Use YZ to highlight Save as….
5. Push open the Save as menu. Use this menu
to name the data set.
You can change the name or save the data set to the
default name.
To change the name of the data set:
1. Use
2. Push 4 to accept the name and exit the menu.
As an option, a sequence number can be set for the
stored data set. The number determines the position in
the test sequence.
To change the sequence number:
1. Use
2. Push open the Sequence menu.
3. Use
4. Push 4 to accept the number and exit the menu.
XWYZ and 1 to select the characters for
the name. 2 is the backspace to redo a
character. 3 toggles between upper case and
lower case characters.
YZ to highlight Sequence Number.
XWYZ and 1 to select the characters for
the sequence number. You can also select None as
the option for sequence number.
55
Page 66

123B/124B/125B
Users Manual
If no free memory locations are available, a message
pops up for you to overwrite the oldest data set.
To continue:
1. Push 3 to cancel the overwrite to the oldest data
set. You must delete one or more memory locations
and then save again. See Data Set Management for
more information.
2. Push 4 to overwrite the oldest data set.
Test Sequence
Use test sequences to set up the Test Tool for the most
often-used settings or a sequence of frequent tests.
To recall a setting marked with a test sequence number:
1. Push to open the menu.
2. Push 1 to open the TEST SEQUENCE menu.
3. Use YZ to highlight the setup. The selected test
sequence number is automatically the next number
after a previously selected number and helps you do
a sequence of tests. No cursor keys need to be used.
4. Push to accept the setup.
hxv44.eps
Only the data sets stored as a test sequence number
are visible in the TEST SEQUENCE menu. Other
data sets are visible when you select 3 (Recall).
56
Page 67

Industrial ScopeMeter®
Save and Recall Data Sets
Setting Recall
To recall a setting:
1. Push to open the menu.
2. Push 3 to open the RECALL MEMORY menu.
3. When an SD card in installed, use 1 to toggle
between Internal or SD card memory.
4. Use
5. Push to accept the setting.
YZ to highlight the setting.
Data Set Management
You can copy, move, rename, and delete a data set.
To manage the data set:
1. Push to open the menu.
2. Push 4 to open the MEMORY menu.
3. When an SD card in installed, use 1 to toggle
between Internal or SD card memory.
4. Use YZ to highlight the memory location.
5. Push 3 to open the Action button bar. Use the
corresponding function key for the copy, move,
rename, and delete actions.
57
Page 68

123B/124B/125B
Users Manual
Waveform Comparison
Use Recall to easily compare the A and B waveforms with
previously measured waveforms. You can compare a
waveform of one phase with a waveform of another
phase or compare with a previously measured waveform
on the same test point.
To recall a reference waveform:
1. Push to open the menu.
2. Push 3 to open the RECALL MEMORY menu.
3. When an SD card in installed, use 1 to toggle
between Internal or SD card memory.
4. Push 2 to select the Setup and Waveform menu.
5. Use
6. Push to select the Setup and reference
YZ to highlight the memory location.
waveform.
The reference waveform shows on the screen as
gray. The reference waveform remains on screen
until a setting, such as auto/manual, attenuation, or
timebase, is changed.
hxv45.eps
58
Page 69

Industrial ScopeMeter®
Communication
Communication
The Test Tool can communicate with:
®
• PC or laptop that uses FlukeView
ScopeMeter®
software with an optical cable or wireless interface
• Tablet or smartphone using Fluke Connect with WiFi
interface
Optical Interface
Connect the Test Tool to a computer with a wired
connection that uses FlukeView
for Windows
®
. Use the Optically Isolated USB
Adapter/Cable (OC4USB) to connect a computer to the
OPTICAL PORT of the Test Tool.
For more information about FlukeView
software, see the FlukeView documentation.
®
ScopeMeter® software
®
ScopeMeter®
Wireless Interface
You can connect the Test Tool with a WiFi USB Adapter
to a computer, tablet, or smartphone that has a wireless
LAN interface.
To support wireless communication the Test Tool has a
port that can be used to insert a WiFi USB adapter. The
USB port is behind the battery door. See Figure 13.
1
Figure 13. WiFi USB Adapter
The battery door must be closed to operate the USB port.
A small angled connector is delivered with all versions of
the Test Tool to connect the adapter to the connector
behind the battery door.
2
hxv52.eps
59
Page 70

123B/124B/125B
Users Manual
W Caution
Do not use the USB port to directly
communicate with an external device.
To set up the Test Tool for use with a wireless
connection:
1. Push + 1 to turn on the WiFi. shows in the
Information area.
2. For the first-time setup, push to open the Menu.
3. Use
4. Push to open the USER OPTIONS menu.
5. Use
6. Push to open the INFORMATION menu.
7. Push 1 to open the WiFi Settings menu.
YZ to highlight USER OPTIONS.
YZ to highlight Information.
The menu shows:
• WiFi name. The SSID is used to detect the Test Tool
WiFi.
• IP Address. Additional information about the
connection and not required to establish a
connection.
Push + 1 to turn off WiFi. disappears from the
top of the screen in the Information area.
60
Page 71

Industrial ScopeMeter®
Maintenance
Maintenance
This section covers basic maintenance procedures that
the user can do. For complete service, disassembly,
repair, and calibration information, see the Service
Manual at www.fluke.com.
XW Warning
To prevent personal injury and for safe
operation of the Product:
• Have an approved technician repair the
Product.
• Use only specified replacement parts.
• Before carrying out any maintenance,
carefully read the safety information at
the beginning of this manual.
• Do not operate the Product with covers
removed or the case open. Hazardous
voltage exposure is possible.
• Remove the input signals before you
clean the Product.
How to Clean
Clean the Test Tool with a damp cloth and a mild soap.
Do not use abrasives, solvents, or alcohol. These may
damage the text on the Test Tool.
Storage
If you store the Test Tool for an extended period of time,
charge the Lithium-ion batteries before storage.
Battery Replacement
XW Warning
To prevent possible electrical shock, fire, or
personal injury and for safe operation and
maintenance of the Product:
• Batteries contain hazardous chemicals
that can cause burns or explode. If
exposure to chemicals occurs, clean
with water and get medical aid.
• Use only the Fluke BP290 as a
replacement battery.
• Do not disassemble the battery.
• Repair the Product before use if the
battery leaks.
• Use only Fluke approved power adapters
to charge the battery.
• Do not short the battery terminals
together.
61
Page 72

123B/124B/125B
Users Manual
• Do not disassemble or crush battery
cells and battery packs.
• Do not keep cells or batteries in a
container where the terminals can be
shorted.
• Do not put battery cells and battery
packs near heat or fire. Do not put in
sunlight.
To avoid loss of data, do one of the following before you
remove the battery pack:
• Store the data on a computer or a USB device.
• Connect the power adapter.
To replace the battery pack:
1. Turn off the Test Tool.
2. Remove all probes and test leads
3. Unlock the battery cover.
4. Lift the battery cover and remove it from the Test
Tool.
5. Lift one side of the battery pack and remove it from
the Test Tool.
6. Install a good battery pack.
7. Place the battery cover into position and lock.
10:1 Scope Probes
The 10:1 voltage probe (VP41) that is supplied with the
Test Tool (varies by model) is always adjusted correctly
and needs no further adjustment. You need to adjust
other 10:1 scope probes for optimal response.
XW Warning
To prevent possible electrical shock, fire, or
personal injury, use the BB120 Banana-toBNC adapter (delivered with the Test Tool) to
connect a 10:1 scope probe to the input of
the Test Tool.
To adjust probes:
1. Connect the 10:1 scope probe from the blue input B
jack to the red input A jack.
2. Use the red 4-mm banana adapter (delivered with
the probe) and the banana-to-BNC adapter (BB120).
See Figure 14.
3. Push to open the Menu.
4. Use
5. Push to open the USER OPTIONS menu.
YZ to highlight USER OPTIONS.
62
Page 73

Industrial ScopeMeter®
Maintenance
6. Use
YZ to highlight Probe Adjust.
AB
1
Figure 14. 10:1 Scope Probes
BB120
hxv53.eps
7. Push to open the PROBE ADJUST menu.
A square wave appears on the screen.
8. Adjust the trimmer screw in the probe housing to
give an optimum square wave.
9. Push 4 to exit the menu.
Calibration Information
The Test Tool specifications are based on a 1 year
calibration cycle. Recalibration must be done by qualified
personnel. Contact your local Fluke representative for
more information about recalibration.
To find the firmware version and calibration date of your
Test Tool:
1. Push to open the Menu.
2. Use
3. Push to open the USER OPTIONS menu.
4. Use
YZ to highlight USER OPTIONS.
YZ to highlight Information.
63
Page 74

123B/124B/125B
Users Manual
5. Push to open the INFORMATION menu.
The User Information menu screen has information
about the model number with firmware version, the
serial number, the calibration number with latest
calibration date, installed (firmware) options, and
memory usage information.
6. Push 4 to exit the menu.
Replaceable Parts and Accessories
For complete service, disassembly, repair, and calibration
information, see the Service Manual at www.fluke.com.
Table 13 is a list of user-replaceable parts for the Test
Tool models. To order replacement parts, contact your
nearest service center. Table 14 is a list of optional
accessories. See Figure 1 for an illustration of parts and
accessories.
64
Page 75

Industrial ScopeMeter®
Replaceable Parts and Accessories
Table 13. Replaceable Parts and Accessories
Item (see Figure 1) Description Order Code
Fluke Test Tool
Rechargeable Li-ion Battery Pack
Test Lead Black (for Grounding)
Hook Clips (red, blue)
See Table 14
Safety Information + CD-ROM with Users Manuals
USB Angled Adapter
WiFi USB Adapter
See Table 14
See Table 14
See Table 14
See Table 14
Switch Mode Power Supply, Adapter/Battery Charger BC430/820
Set of two Shielded Test Leads (Red and Blue), designed for use only with
the Fluke ScopeMeter
Lead with Alligator Clip (Black)
VP41 10:1 Voltage Probe with hook clip and ground lead VPS41
i400s AC Current Clamp i400s
®
120 series Test Tool. Set contains the Ground
BP290
STL120-IV
TL175
HC120-II
UA120B
65
Page 76

123B/124B/125B
Users Manual
Table 14. Optional Accessories
Item (see Figure 1) Description Order Code
66
not shown
not shown
Banana-to-BNC Adapters (black)
Soft Carrying Case
Magnetic Hanger
FlukeView® ScopeMeter® Software for Windows®
Screen Protector
Bushealth Test Adapter: connects the probe tip to busses that use a
DB9, RJ-45, or a M12 connector
Software & Cable Carrying Case Kit (Supplied with Fluke 12x/S) SCC 120B
Set contains the following parts:
• Screen Protector
• Magnetic Hanger
• Soft Carrying Case
• FlukeView® ScopeMeter® Software for Windows®
BHT190
SP120B
Fluke-1730-Hanger
C120B
SW90W
BB120-II (set of two)
C120B
Fluke-1730-Hanger
SW90W
SP120B
Page 77

Industrial ScopeMeter®
Tips
Tips
This section is information and tips on how to best use
the Test Tool.
Battery Life
For battery operation, the Test Tool conserves power by
shutting itself down. If you have not pressed a key for at
least 30 minutes, the Test Tool turns itself off
automatically.
Automatic power shutdown will not occur if Record is on,
but the backlight will dim. Recording continues if the
battery is low. Retention of memories is not jeopardized.
To save battery life without automatic power shutdown
you can use the display AUTO-off option. The display
turns off after the selected time (30 seconds or 5
minutes).
Note
If the power adapter is connected, automatic
power shutdown and the display AUTO-off
function is disabled.
Power Off Timer
By default, the power off timer is set to 30 minutes after the
last key press. To change the time to 5 minutes or turn off:
1. Push to open the Menu.
2. Use
3. Push to open the USER OPTIONS menu.
4. Use
5. Push to open the USER > BATTERY SAVE
6. Use
7. Push to accept the change and exit the menu.
YZ to highlight USER OPTIONS.
YZ to highlight Battery Save Options.
menu.
YZ to highlight the preference.
67
Page 78

123B/124B/125B
Users Manual
Autoset Options
On delivery or after a reset, the Autoset function captures
waveforms ≥15 Hz and sets the input coupling to DC.
Note
Setting the Auto Set adjust to 1 Hz slows down
the Auto Set response. The display shows
LF-AUTO.
To configure Auto Set for capturing slow waveforms down
to 1 Hz:
1. Push to open the Menu.
2. Use
3. Push to open the USER OPTIONS menu.
4. Use
5. Push to open the USER > AUTOSET menu.
6. Use
7. Push to accept the change and exit the menu.
To configure Autoset to maintain the actual input coupling
(AC or DC), continue from step 5 above:
6. Use
7. Push to accept the change and exit the menu.
YZ to highlight USER OPTIONS.
YZ to highlight Autoset Settings.
YZ to highlight Search For Signals >1 Hz.
YZ to highlight Couplings Unchanged.
Grounding Guidelines
XW Warning
To prevent possible electrical shock, fire, or
personal injury, use only one COM (common)
connection
to COM
Incorrect grounding can cause problems. Use these
guidelines for proper grounding:
• Use the short ground leads when measuring DC or
AC signals on input A and input B. See Figure 8, item
4 on page 17.
• Use the unshielded black ground lead to COM
(common) for Ohm (Ω), Continuity, Diode, and
Capacitance measurements. See Figure 7, item 1 on
page 16.
• Use of the unshielded ground lead is also possible for
single or dual input measurements for waveforms with
a frequency up to 1 MHz. This may add some hum or
noise to the waveform display due to the unshielded
ground lead.
˜ or ensure that all connections
˜ are at the same potential.
68
Page 79

Industrial ScopeMeter®
Specifications
Specifications
Dual Input Oscilloscope
Vertical
Frequency Response
DC Coupled
without probes and test leads
(with BB120)
125B, 124B ................................................. DC to 40 MHz (-3 dB)
123B ............................................................ DC to 20 MHz (-3 dB)
with STL120-IV 1:1 shielded test leads ........... DC to 12.5 MHz (-3 dB) / DC to 20 MHz (-6 dB)
with VP41 10:1 probe
125B, 124B ................................................. DC to 40 MHz (-3 dB)
123B (optional accessory) ........................... DC to 20 MHz (-3 dB)
AC Coupled (LF roll off):
without probes and test leads ......................... <10 Hz (-3 dB)
with STL120-IV ................................................ <10 Hz (-3 dB)
with VP41 10:1 Probe ..................................... <10 Hz (-3 dB)
Rise Time, excluding probes, test leads ............. <8.75 ns
Input Impedance
without probes and test leads ............................. 1 MΩ//20 pF
with BB120 .......................................................... 1 MΩ//24 pF
with STL120 ........................................................ 1 MΩ//230 pF
with VP41 10:1 Probe ......................................... 5 MΩ//15.5 pF
Sensitivity .............................................................. 5 mV to 200 V/div
Analog Bandwidth Limiter .................................... 10 kHz
Display Modes ....................................................... A, -A, B, -B
69
Page 80

123B/124B/125B
Users Manual
Max. Input Voltage A and B
direct, with test leads, or with VP41 Probe ......... 600 Vrms Cat IV, 750 Vrms maximum voltage.
with BB120 .......................................................... 600 Vrms
(For detailed specifications, see Safety, Figure 15 and Figure 16.)
Max. Floating Voltage, from any
terminal to ground ................................................ 600 Vrms Cat IV, 750 Vrms up to 400 Hz
Vertical Accuracy .................................................. ±(1 % + 0.05 range/div)
Max. Vertical Move ................................................ ±5 divisions
Horizontal
Scope Modes ......................................................... Normal, Single, Roll
Ranges
Normal:
Equivalent sampling
125B, 124B ................................................. 10 ns to 500 ns/div
123B............................................................ 20 ns to 500 ns/div
Real time sampling ......................................... 1 μs to 5 s/div
Single (real time) ............................................. 1 μs to 5 s/div
Roll (real time) ................................................. 1s to 60 s/div
Sampling Rate (for both channels simultaneously)
Equivalent sampling (repetitive signals) .............. up to 4 GS/s
Real time sampling
1 μs to 60 s/div ................................................ 40 MS/s
Time Base Accuracy
Equivalent sampling ............................................ ±(0.4 % + 0.025 time/div)
Real time sampling ............................................. ±(0.1 % + 0.025 time/div)
Glitch Detection .................................................... ≥25 ns @ 20 ns to 60 s/div
Horizontal Move .................................................... 12 divisions, trigger point can be positioned anywhere across the screen
70
Page 81

Industrial ScopeMeter®
Specifications
Trigger
Screen Update ....................................................... Free Run, On Trigger
Source .................................................................... A, B
Sensitivity A and B
@ DC to 5 MHz ................................................... 0.5 divisions or 5 mV
@ 40 MHz
125B, 124B ..................................................... 1.5 divisions
123B ................................................................ 4 divisions
@ 60 MHz
125B, 124B ..................................................... 4 divisions
123B ................................................................ NA
Slope ....................................................................... Positive, Negative
Advanced Scope Functions
Display Modes
Normal ................................................................. Captures up to 25 ns glitches and displays analog-like persistence waveform.
Smooth ................................................................ Suppresses noise from a waveform.
Envelope ............................................................. Records and displays the minimum and maximum of waveforms over time.
Auto Set (Connect-and-View)
Continuous fully automatic adjustments of amplitude, time base, trigger levels, trigger gap, and hold-off. Manual override by user
adjustment of amplitude, time base, or trigger level.
Dual Input Meter
The accuracy of all measurements is within ±(% of reading + number of counts) from 18 °C to 28 °C.
Add 0.1x (specific accuracy) for each °C below 18 °C or above 28 °C. For voltage measurements with 10:1 probe, add probe uncertainty
+1 %. More than one waveform period must be visible on the screen.
71
Page 82

123B/124B/125B
Users Manual
Input A and Input B
DC Voltage (VDC)
Ranges ................................................................ 500 mV, 5 V, 50 V, 500 V, 750 V
Accuracy ............................................................. ±(0.5 % + 5 counts)
Normal Mode Rejection (SMR) ........................... >60 dB @ 50 or 60 Hz ±0.1 %
Common Mode Rejection (CMRR) ..................... >100 dB @ DC
Full Scale Reading .............................................. 5000 counts
True RMS Voltages (VAC and VAC+DC)
Ranges ................................................................ 500 mV, 5 V, 50 V, 500 V, 750 V
Accuracy for 5 to 100 % of range
DC coupled
DC to 60 Hz (VAC+DC) ............................ ±(1 % + 10 counts)
1 Hz to 60 Hz (VAC) ................................. ±(1 % + 10 counts)
AC or DC coupled
60 Hz to 20 kHz ........................................ ±(2.5 % + 15 counts)
20 kHz to 1 MHz ....................................... ±(5 % + 20 counts)
1 MHz to 5 MHz ........................................ ±(10 % + 25 counts)
5 MHz to 12.5 MHz ................................... ±(30 % + 25 counts)
5 MHz to 20 MHz
(without test leads or probes) ................... ±(30 % + 25 counts)
AC coupled with 1:1 (shielded) test leads
60 Hz (6 Hz with 10:1 probe) .................... -1.5 %
50 Hz (5 Hz with 10:1 probe) .................... -2 %
33 Hz (3.3 Hz with 10:1 probe) ................. -5 %
10 Hz (1 Hz with 10:1 probe) .................... -30 %
>60 dB @ 50, 60, or 400 Hz
72
Page 83

Industrial ScopeMeter®
Specifications
Note
For the total accuracy for AC coupled, add the derating values specified in the
table to the table of AC or DC coupled.
DC Rejection (only VAC) ..................................... >50 dB
Common Mode Rejection (CMRR) ..................... >100 dB @ DC
Full Scale Reading .............................................. 5000 counts, reading is independent of any signal crest factor.
Peak
Modes.................................................................. Max peak, Min peak, or pk-to-pk
Ranges ................................................................ 500 mV, 5 V, 50 V, 500 V, 2200 V
Accuracy
Max peak or Min peak ..................................... 5 % of full scale
Peak-to-Peak .................................................. 10 % of full scale
Full Scale Reading .............................................. 500 counts
Frequency (Hz)
Ranges
125B, 124B ..................................................... 1 Hz, 10 Hz, 100 Hz, 1 kHz, 10 kHz, 100 kHz,1 MHz, 10 MHz, and 70 MHz
123B ................................................................ 1 Hz, 10 Hz, 100 Hz, 1 kHz, 10 kHz, 100 kHz,1 MHz, 10 MHz, and 50 MHz
Frequency Range in Continuous Autoset ........... 15 Hz (1 Hz) to 50 MHz
>60 dB @ 50, 60, or 400 Hz
73
Page 84

123B/124B/125B
Users Manual
Accuracy
125B, 124B
@ 1 Hz to 1 MHz ........................................ ±(0.5 % + 2 counts)
@ 1 to 10 MHz ............................................ ±(1.0 % + 2 counts)
@ 10 to 70 MHz .......................................... ±(2.5 % + 2 counts)
123B
@ 1 Hz to 1 MHz ........................................ ±(0.5 % + 2 counts)
@ 1 to 10 MHz ............................................ ±(1.0 % + 2 counts)
@ 10 to 50 MHz .......................................... ±(2.5 % + 2 counts)
(50 MHz in Autorange)
Full Scale Reading .............................................. 10 000 counts
RPM
Max reading ........................................................ 50.00 kRPM
Accuracy ............................................................. ±(0.5 % + 2 counts)
Duty Cycle (PULSE)
Range ................................................................. 2 % to 98 %
Frequency Range in Continuous Autoset ........... 15 Hz (1 Hz) to 30 MHz
Accuracy (Logic or Pulse waveforms)
@ 1 Hz to 1 MHz ............................................ ±(0.5 % + 2 counts)
@ 1 MHz to 10 MHz ....................................... ±(1.0 % + 2 counts)
Pulse Width (PULSE)
Frequency Range in Continuous Autoset ........... 15 Hz (1 Hz) to 30 MHz
Accuracy (Logic or Pulse waveforms)
@ 1 Hz to 1 MHz ............................................ ±(0.5 % + 2 counts)
@ 1 MHz to 10 MHz ....................................... ±(1.0 % + 2 counts)
Full Scale Reading .......................................... 1000 counts
74
Page 85

Industrial ScopeMeter®
Specifications
Amperes (AMP)
with current clamp
Ranges ............................................................ same as VDC, VAC, VAC+DC, or PEAK
Scale Factors .................................................. 0.1 mV/A, 1 mV/A, 10 mV/A, 100 mV/A, 400 mV/A, 1 V/A, 10 mV/mA
Accuracy ......................................................... same as VDC, VAC, VAC+DC, or PEAK (add current clamp uncertainty)
with iFlex clamp
Ranges ............................................................ 20 A/division
Maximum Current ............................................ 75 A @ 40 Hz to 300 Hz
Accuracy ......................................................... ± (1.5 % + 10 counts) @ 40 Hz to 60 Hz
Temperature (TEMP) with optional temperature probe
Range .................................................................. 200 °C/div (200 °F/div)
Scale Factor ........................................................ 1 mV/°C and 1 mV/°F
Accuracy.............................................................. as VDC (add temp. probe uncertainty)
Decibel (dB)
0 dBV................................................................... 1V
0 dBm (600 Ω /50 Ω) ........................................... 1 mW referenced to 600 Ω or 50 Ω
dB on ................................................................... VDC, VAC, or VAC+DC
Full Scale Reading .............................................. 1000 counts
Crest Factor (CREST)
Range .................................................................. 1 to 10
Accuracy.............................................................. ±(5 % + 1 count)
Full Scale Reading .............................................. 90 counts
Frequency derating: I * F <22 500 A*Hz @ 300 Hz to 3000 Hz
± (3 % + 15 counts) @ 60 Hz to 1000 Hz
± (6 % + 15 counts) @ 1000 Hz to 3000 Hz
75
Page 86

123B/124B/125B
Users Manual
Phase
Modes ................................................................. A to B, B to A
Range ................................................................. 0 to 359 degrees
Accuracy
<1 MHz ........................................................... 2 degrees
1 MHz to 5 MHz .............................................. 5 degrees
Resolution ........................................................... 1 degree
Power (125B)
Configurations ..................................................... 1 phase / 3 phase 3 conductor balanced loads (3 phase: fundamental component only,
Power Factor (PF) ............................................... ratio between Watts and VA
Range ............................................................. 0.00 to 1.00
Watt ..................................................................... RMS reading of multiplying corresponding samples of input A (volts) and input B
Full Scale reading ........................................... 999 counts
VA ....................................................................... Vrms x Arms
Full Scale Reading .......................................... 999 counts
VA Reactive (VAR) .............................................
Full Scale Reading .......................................... 999 counts
Vpwm
Purpose ............................................................... to measure on pulse width modulated signals, like motor drive inverter outputs
Principle .............................................................. readings show the effective voltage based on the average value of samples over a whole
Accuracy ............................................................. as Vrms for sinewave signals
AUTOSET mode only)
(amperes)
((VA)2-W2)
√
number of periods of the fundamental frequency
76
Page 87

Industrial ScopeMeter®
Specifications
Input A
Ohm (Ω)
Ranges
125B ................................................................ 50 Ω, 500 Ω, 5 kΩ, 50 kΩ, 500 kΩ, 5 MΩ, 30 MΩ
124B, 123B ..................................................... 500 Ω, 5 kΩ, 50 kΩ, 500 kΩ, 5 MΩ, 30 MΩ
Accuracy.............................................................. ±(0.6 % + 5 counts)
Full Scale Reading:
50 Ω to 5 MΩ ................................................... 5000 counts
30 MΩ ............................................................. 3000 counts
Measurement Current ......................................... 0.5 mA to 50 nA, decreases with increasing ranges
Open Circuit Voltage ........................................... <4 V
Continuity (CONT)
Beep .................................................................... <(30 Ω ±5 Ω) in 50 Ω range
Measurement Current ......................................... 0.5 mA
Detection of shorts .............................................. ≥1 ms
Diode
Measurement Voltage
@0.5 mA ......................................................... >2.8 V
@open circuit .................................................. <4 V
Accuracy.............................................................. ±(2 % + 5 counts)
Measurement Current ......................................... 0.5 mA
Polarity ................................................................ + on input A, - on COM
Capacitance (CAP)
Ranges ................................................................ 50 nF, 500 nF, 5 μF, 50 μF, 500 μF
Accuracy.............................................................. ±(2 % + 10 counts)
50 Ω ±(2 % + 20 counts)
77
Page 88

123B/124B/125B
Users Manual
Full Scale Reading .............................................. 5000 counts
Measurement Current ......................................... 500 nA to 0.5 mA, increases with increasing ranges
Advanced Meter Functions
Zero Set
Set actual value to reference
Fast/Normal/Smooth
Meter settling time Fast: 1 s @ 1 μs to 10 ms/div.
Meter settling time Normal: 2 s @ 1 μs to 10 ms/div.
Meter settling time Smooth: 10 s @ 1 μs to 10 ms/div.
AutoHold (on A)
Captures and freezes a stable measurement result. Beeps when stable. AutoHold works on the main meter reading, with thresholds of
1 Vpp for AC signals and 100 mV for DC signals.
Fixed Decimal Point .............................................. with attenuation keys.
Cursor Readout (124B, 125B)
Sources
A, B
Single Vertical Line
Average, Min and Max Readout
Average, Min, Max and Time from Start of Readout (in ROLL mode, instrument in HOLD)
Min, Max and Time from Start of Readout (in RECORDER mode, instrument in HOLD)
Harmonics values in POWER QUALITY mode.
Dual Vertical Lines
Peak-Peak, Time Distance and Reciprocal Time Distance Readout
Average, Min, Max and Time Distance Readout (in ROLL mode, instrument in HOLD)
Dual Horizontal Lines
High, Low and Peak-Peak Readout
78
Page 89

Industrial ScopeMeter®
Specifications
Rise or Fall Time
Transition Time, 0 %-Level and 100 %-Level Readout (Manual or Auto Leveling; Auto Leveling only possible in Single Channel Mode)
Accuracy
As Oscilloscope Accuracy
Recorder
The recorder captures meter readings in Meter Recorder mode or continuously captures waveform samples in Scope Recorder mode. The
information is stored on internal memory or on optional SD card with the 125B or 124B.
The results are displayed as Chart recorder display that plots a graph of min and max values of Meter measurements over time or as a
waveform recorder display that plots all the captured samples.
Meter Readings
Measurement Speed ........................................... maximum 2 measurements/s
Record Size ......................................................... 2 M readings for 1 channel (400 MB)
Recorded Time Span .......................................... 2 weeks
Maximum number of events ................................ 1024
Waveform record
Maximum sample rate ......................................... 400 K sample/s
Record Size Internal memory .............................. 400 M samples
Recorded Time Span internal memory ............... 15 minutes at 500 μs/div
125B, 124B
Record Size SD card ................................... 15 G samples
Recorded Time Span SD card .................... 11 hours at 500 μs/div
Maximum number of events ................................ 64 events on 1 channel
11 hours at 20 ms/div
14 days at 20 ms/div
79
Page 90

123B/124B/125B
Users Manual
Power Quality (125B)
Readings ................................................................ Watt, VA, VAR, PF, DPF, Hz
Watt, VA, var ranges (auto) .................................. 250 W to 250 MW, 625 MW, 1.56 GW
when selected: total (%r) .................................... ±(2 % + 6 counts)
when selected: fundamental (%f) ........................ ±(4 % + 4 counts)
DPF ......................................................................... 0.00 to 1.00
0.00 to 0.25 ......................................................... not specified
0.25 to 0.90 ......................................................... ±0.04
0.90 to 1.00 ......................................................... ±0.03
PF ........................................................................... 0.00 to 1.00, ±0.04
Frequency range ................................................... 10.0 Hz to 15.0 kHz
Number of Harmonics .......................................... DC to 51
Readings / Cursor readings (fundamental 40 Hz to 70 Hz)
V rms / A rms .................................................. fund. ±(3 % + 2 counts) 31st ±(5 % + 3 counts), 51st ±(15 % + 5 counts)
Watt ................................................................. fund. ±(5 % + 10 counts) 31st ±(10 % + 10 counts), 51st ±(30 % + 5 counts)
Frequency of fundamental .............................. ±0.25 Hz
Phase Angle .................................................... fund. ±3° … 51
K-factor (in Amp and Watt) ............................. ±10 %
40.0 Hz to 70.0 Hz ±(0.5 % + 2 counts)
st ±15°
80
Page 91

Industrial ScopeMeter®
Specifications
Field Bus Measurements (125B)
Type Subtype Protocol
AS-i NEN-EN50295
CAN ISO-11898
Interbus S RS-422 EIA-422
Modbus
Foundation Fieldbus H1 61158 type 1, 31.25 kBit
Profibus
RS-232 EIA-232
RS-485 EIA-485
RS-232
RS-485
DP
PA
RS-232/EIA-232
RS-485/EIA-485
EIA-485
61158 type 1
81
Page 92

123B/124B/125B
Users Manual
Miscellaneous
Display
Type .................................................................... 5.7-inch color active matrix TFT
Resolution ........................................................... 640 x 480 pixels
Waveform Display
Vertical ............................................................ 10 div of 40 pixels
Horizontal ........................................................ 12 div of 40 pixels
Power
External ............................................................... via Power Adapter BC430/820
Input Voltage ................................................... 15 V DC to 22 V DC
Power .............................................................. 4.1 W typical
Input Connector .............................................. 5 mm jack
Internal ................................................................ via Battery Pack BP290
Battery Power ................................................. Rechargeable Li-Ion 10.8 V
Operating Time ............................................... 7 hours with 50 % backlight brightness
Charging Time ................................................ 4 hours with Test Tool turned off, 7 hours with Test Tool turned on
Allowable ambient temperature ...................... 0 °C to 40 °C (32 °F to 104 °F) during charging
Memory
Number of internal Data set Memories ............... 20 data sets (each consists of screen, waveforms and setup
SD card slot with optional SD card
with max size ...................................................... 32 GB for recording, 20 memory locations for saving data sets
Mechanical
Size ..................................................................... 259 mm x 132 mm x 55 mm (10.2 in x 5.2 in x 2.15 in)
Weight ................................................................. 1.4 kg (3.1 lb) including battery pack
82
Page 93

Industrial ScopeMeter®
Specifications
Interface
Optically isolated USB to PC/laptop .................... Transfer screen dumps (bitmaps), settings and data using OC4USB optically isolated
USB adapter/cable, (optional), using FlukeView
Optional WiFi Adapter ......................................... Fast transfer of screen dumps (bitmaps), settings and data to PC/laptop, tablet,
smartphone, etc. A USB port is provided for attaching the WiFi Adapter. Do not use the
USB port with a cable for safety reasons. The USB port is disabled when the battery door
is open.
®
ScopeMeter® software for Windows®).
Environmental
Environmental ....................................................... MIL-PRF-28800F, Class 2
Temperature
Operating and charging ....................................... 0 °C to 40 °C (32 °F to 104 °F)
Operating ............................................................ 0 °C to 50 °C (32 °F to 122 °F)
Storage ................................................................ -20 °C to 60 °C (-4 °F to 140 °F)
Humidity
Operating
@ 0 °C to 10 °C (32 °F to 50 °F) ..................... noncondensing
@ 10 °C to 30 °C (50 °F to 86 °F) ................... 95 %
@ 30 °C to 40 °C (86 °F to 104 °F) ................. 75 %
@ 40 °C to 50 °C (104 °F to 122 °F) ............... 45 %
Storage
@ -20 °C to 60 °C (-4 °F to 140 °F) ................ noncondensing
Altitude
Operating CAT III 600V ....................................... 3 km (10 000 feet)
Operating CAT IV 600V ...................................... 2 km (6 600 feet)
Storage ................................................................ 12 km (40 000 feet)
83
Page 94

123B/124B/125B
Users Manual
Vibration ................................................................ MIL-PRF-28800F, Class 2
Shock ..................................................................... 30 g maximum
Electromagnetic Compatibility (EMC)
International ........................................................ IEC 61326-1: Industrial
CISPR 11: Group 1, Class A
Group 1: Equipment has intentionally generated and/or uses conductively-coupled
radio frequency energy that is necessary for the internal function of the equipment
itself.
Class A: Equipment is suitable for use in all establishments other than domestic and
those directly connected to a low-voltage power supply network that supplies
buildings used for domestic purposes. There may be potential difficulties in ensuring
electromagnetic compatibility in other environments due to conducted and radiated
disturbances.
Emissions that exceed the levels required by CISPR 11 can occur when the
equipment is connected to a test object.
Korea (KCC) ....................................................... Class A Equipment (Industrial Broadcasting & Communication Equipment)
Class A: Equipment meets requirements for industrial electromagnetic wave
equipment and the seller or user should take notice of it. This equipment is intended
for use in business environments and not to be used in homes.
USA (FCC) .......................................................... 47 CFR 15 subpart B. This product is considered an exempt device per clause 15.103.
Wireless Radio with Adapter
Frequency Range ............................................... 2412 MHz to 2462 MHz
Output Power ...................................................... <100 mW
Enclosure Protection ............................................ IP51, ref: EN/IEC60529
84
Page 95

Industrial ScopeMeter®
Specifications
Safety
General................................................................ IEC 61010-1: Pollution Degree 2
Measurement ...................................................... IEC 61010-2-033: CAT IV 600 V / CAT III 750 V
Max. Input Voltage Input A and B
Direct on input or with leads ............................... 600 Vrms CAT IV for derating, see Figure 15.
With Banana-to BNC Adapter BB120 ................. 300 Vrms for derating, see Figure 16.
Max. Floating Voltage
from any terminal to ground ................................ 600 Vrms Cat IV, 750 Vrms up to 400 Hz
Maximum CAT IV input voltage vs. frequency
CAT III
CAT IV
5102050100200
12
FREQUENCY (kHz)
hpp050.ep
hpp049.eps
Figure 15. Max. Input Voltage vs. Frequency for BB120
and STL120-IV
1000
Max.
Input
500
VOLTAGE
(Vrms)
200
100
50
30
20
10
5
2
1
0.01 0.02 0.05 0.1 0.2 0.5
Figure 16. Safe Handling: Max. Voltage Between Test
Tool Reference and Earth Ground
85
Page 96

123B/124B/125B
Users Manual
The Fluke 12xB series, including standard accessories, conforms to the EEC directive 2004/108/EC for EMC immunity, as
defined by EN61326-1: 2006, with the addition of the table below.
Trace disturbance with STL120-IV
Frequency Field strength
80 MHz to 1 GHz 10 V/m 1 V/div to 200 V/div 500 mV/div
1.4 GHz to 2 GHz 3 V/m All ranges -
2 GHz to 2.7 GHz 1 V/m All ranges -
No visible
disturbance
(-) = no visible disturbance
Ranges not specified may have a disturbance of >10 % of full scale.
Disturbance less than
10% of full scale
86
 Loading...