

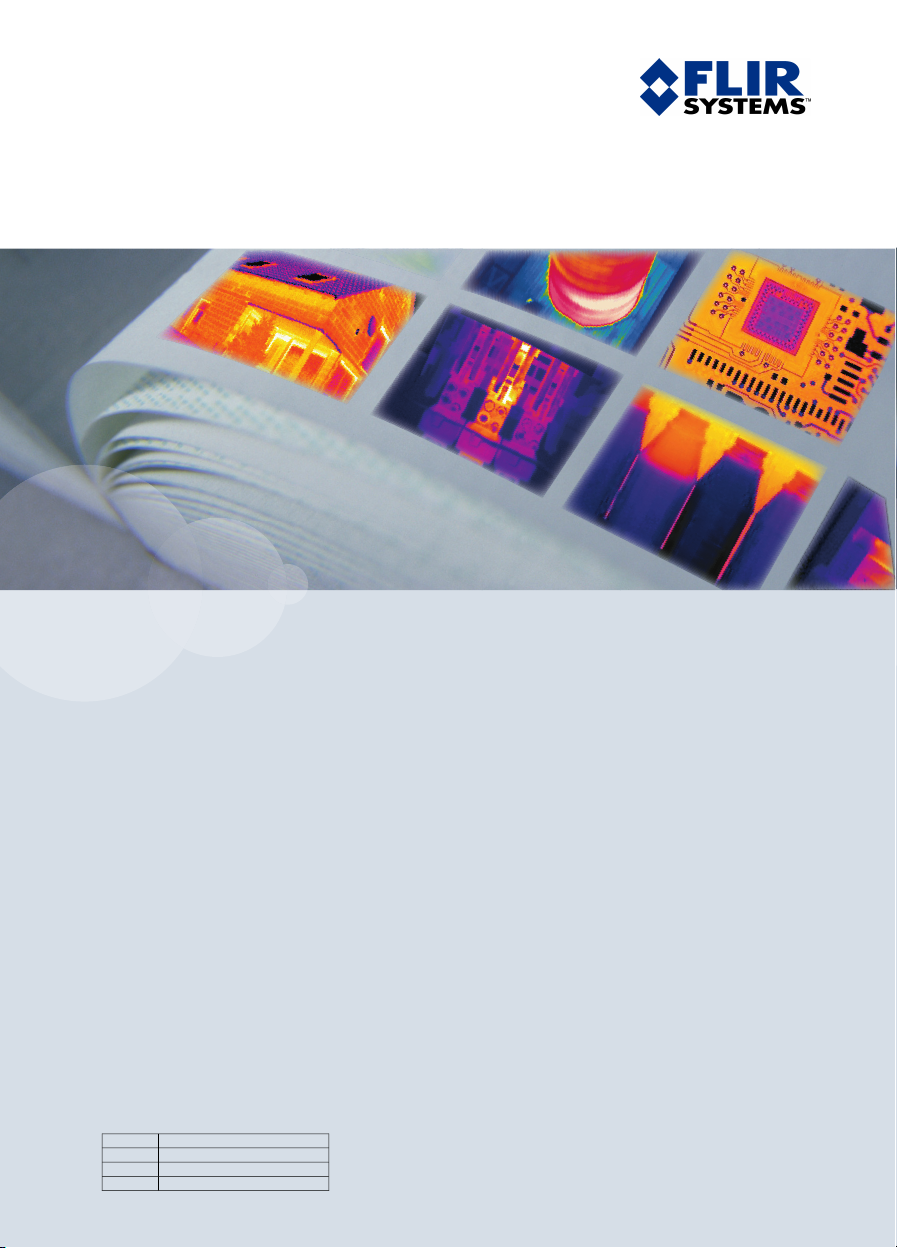
Page 1
User’s manual – Benutzerhandbuch – Manual del usuario – Manuel de l’utilisateur – Manuale dell’utente – Manual do utilizador – Felhas-
ználói kézikönyv – Käyttäjän opas –
Betjeningsvejledning – Brukerveiledning – Instrukcja obsługi – Bruksanvisning – Kullanım
Kılavuzu – Uživatelská příručka –
Gebruikershandleiding
ThermaCAM™ P25
User’s manual
1557978Publ. No.
a155Revision
English (EN)Language
February 6, 2006Issue date
Page 2

Page 3

Warnings & cautions
1
Important note about this manual
Welcome!
Packing list
System overview
Connecting system components
Introduction to thermographic inspections of
electrical installations
Tutorials
Camera overview
Camera program
2
3
4
5
6
7
8
9
10
Folder and file structure
Electrical power system
A note on LEMO connectors
Maintenance & cleaning
Troubleshooting
11
12
13
14
15
Page 4

Page 5

Technical specifications & dimensional drawings
16
Glossary
Thermographic measurement techniques
History of infrared technology
Theory of thermography
The measurement formula
Emissivity tables
17
18
19
20
21
22
Page 6

Page 7

ThermaCAM™ P25
User’s manual
Publ. No. 1557978 Rev. a155 – ENGLISH (EN) – February 6, 2006
Page 8

Legal disclaimer
All products manufactured by FLIR Systemsarewarranted against defectivematerialsandworkmanship for aperiodof one(1)year from the
delivery date of the original purchase, provided such products have been under normal storage, use and service, and in accordance with
FLIR Systems instruction.
All products not manufactured by FLIR Systems included in systemsdelivered by FLIRSystems to theoriginal purchaser carrythe warranty,
if any, of the particular supplier only and FLIR Systems has no responsibilitywhatsoever for such products.
The warranty extends only to the original purchaser and is not transferable. It is not applicable to any product which has been subjected to
misuse, neglect, accident or abnormal conditions of operation. Expendable parts are excluded from the warranty.
In the case of adefect inaproduct coveredbythis warrantytheproduct must notbe furtherusedin order toprevent additional damage.The
purchaser shall promptly report any defect to FLIR Systems or this warranty will not apply.
FLIR Systems will, at its option, repair or replace any such defective product free of charge if, upon inspection, it proves to be defective in
material or workmanship and provided that it is returned to FLIR Systems within the said one-year period.
FLIR Systems has no other obligation or liability for defects than those set forth above.
No other warranty is expressed or implied. FLIR Systems specifically disclaims the implied warranties of merchantability and fitness for a
particular purpose.
FLIR Systems shall not be liable for any direct, indirect, special, incidentalor consequential loss or damage, whether basedon contract, tort
or any other legal theory.
Copyright
© FLIR Systems,2006. All rights reservedworldwide. No parts ofthesoftware including source codemaybe reproduced, transmitted, transcribed
or translated into any language or computer language in any form or by any means, electronic, magnetic, optical, manual or otherwise,
without the prior written permission of FLIR Systems.
This manual must not, in whole or part, be copied, photocopied, reproduced,translated ortransmitted to any electronic mediumor machine
readable form without prior consent, in writing, from FLIR Systems.
Names and marks appearing on the products herein are eitherregistered trademarksor trademarksof FLIR Systems and/or its subsidiaries.
All othertrademarks,trade names or companynames referenced herein areusedfor identification only andarethe property of theirrespective
owners.
Quality assurance
The Quality Management System under which these products are developed and manufactured has been certified in accordance with the
ISO 9001 standard.
FLIR Systems is committed to a policy of continuous development; therefore we reserve the right to make changes and improvements on
any of the products described in this manual without prior notice.
Patents
This product is protected by patents, design patents, patents pending, or design patents pending.
One or several of the following patents, design patents, patents pending, or design patents pending apply to the products and/or features
described in this manual:
Reg. No.StatusDesignation
00809178.1ApplicationChina
01823221.3ApplicationChina
01823226.4ApplicationChina
235308Design PatentChina
ZL02331553.9Design PatentChina
ZL02331554.7Design PatentChina
200530018812.0PendingChina
1188086PatentEPC
01930377.5ApplicationEPO
01934715.2ApplicationEPO
27282912ApplicationEPO
000279476-0001Design PatentEU
1188086PatentFrance
viii Publ. No. 1557978 Rev. a155 – ENGLISH (EN) – February 6, 2006
Page 9

Reg. No.StatusDesignation
60004227.8PatentGermany
106017Design PatentGreat Britain
3006596Design PatentGreat Britain
3006597Design PatentGreat Britain
1188086PatentGreat Britain
DM/057692Design PatentInternational
DM/061609Design PatentInternational
2000-620406ApplicationJapan
2002-588123ApplicationJapan
2002-588070ApplicationJapan
1144833Design PatentJapan
1182246Design PatentJapan
1182620Design PatentJapan
2005-020460PendingJapan
PCT/SE01/00983ApplicationPCT
PCT/SE01/00984ApplicationPCT
PCT/SE02/00857ApplicationPCT
PCT/SE03/00307ApplicationPCT
PCT/SE/00/00739ApplicationPCT
0302837-0ApplicationSweden
68657Design PatentSweden
75530Design PatentSweden
518836PatentSweden
522971PatentSweden
524024PatentSweden
09/576266ApplicationU.S.
10/476,217ApplicationU.S.
10/476,760ApplicationU.S.
466540Design PatentU.S.
483782Design PatentU.S.
484155Design PatentU.S.
5,386,117PatentU.S.
5,637,871PatentU.S.
5,756,999PatentU.S.
6,028,309PatentU.S.
6,707,044PatentU.S.
6,812,465PatentU.S.
Publ. No. 1557978 Rev. a155 – ENGLISH (EN) – February 6, 2006
Page 10

Reg. No.StatusDesignation
29/233,400PendingU.S.
x Publ. No. 1557978 Rev. a155 – ENGLISH (EN) – February 6, 2006
Page 11

Table of contents
11 Warnings & cautions ......................................................................................................................
32 Important note about this manual .................................................................................................
53 Welcome! .........................................................................................................................................
63.1 About FLIR Systems .............................................................................................................
83.1.1 A few images from our facilities ............................................................................
103.2 Comments & questions ........................................................................................................
114 Packing list ......................................................................................................................................
135 System overview .............................................................................................................................
156 Connecting system components ..................................................................................................
156.1 Front connectors ..................................................................................................................
166.2 Rear connectors ...................................................................................................................
177 Introduction to thermographic inspections of electrical installations ......................................
177.1 Important note ......................................................................................................................
177.2 General information ..............................................................................................................
177.2.1 Introduction ...........................................................................................................
187.2.2 General equipment data .......................................................................................
197.2.3 Inspection .............................................................................................................
197.2.4 Classification & reporting ......................................................................................
207.2.5 Priority ...................................................................................................................
207.2.6 Repair ....................................................................................................................
217.2.7 Control ..................................................................................................................
227.3 Measurement technique for thermographic inspection of electrical installations ...............
227.3.1 How to correctly set the equipment .....................................................................
227.3.2 Temperature measurement ...................................................................................
247.3.3 Comparative measurement ..................................................................................
257.3.4 Normal operating temperature .............................................................................
267.3.5 Classification of faults ...........................................................................................
287.4 Reporting ..............................................................................................................................
307.5 Different types of hot spots in electrical installations ...........................................................
307.5.1 Reflections ............................................................................................................
307.5.2 Solar heating .........................................................................................................
317.5.3 Inductive heating ...................................................................................................
317.5.4 Load variations ......................................................................................................
327.5.5 Varying cooling conditions ...................................................................................
337.5.6 Resistance variations ............................................................................................
337.5.7 Overheating in one part as a result of a fault in another ......................................
357.6 Disturbance factors at thermographic inspection of electrical installations ........................
357.6.1 Wind ......................................................................................................................
357.6.2 Rain and snow ......................................................................................................
367.6.3 Distance to object .................................................................................................
377.6.4 Object size ............................................................................................................
397.7 Practical advice for the thermographer ................................................................................
397.7.1 From cold to hot ...................................................................................................
397.7.2 Rain showers ........................................................................................................
397.7.3 Emissivity ..............................................................................................................
Publ. No. 1557978 Rev. a155 – ENGLISH (EN) – February 6, 2006 xi
Page 12

407.7.4 Reflected apparent temperature ...........................................................................
407.7.5 Object too far away ...............................................................................................
418 Tutorials ...........................................................................................................................................
418.1 Switching on & switching off the camera .............................................................................
428.2 Working with images & folders .............................................................................................
428.2.1 Acquiring an image ...............................................................................................
428.2.2 Opening an image ................................................................................................
428.2.3 Deleting one or several images ............................................................................
428.2.4 Navigating in folders .............................................................................................
438.2.5 Create a new folder ...............................................................................................
438.2.6 Freezing & unfreezing an image ...........................................................................
438.2.7 Saving an image ...................................................................................................
448.3 Working with measurements ................................................................................................
448.3.1 Creating & changing an isotherm ........................................................................
458.4 Changing level & span .........................................................................................................
458.4.1 Changing the level ................................................................................................
458.4.2 Changing the span ...............................................................................................
468.5 Changing system settings ....................................................................................................
468.5.1 Changing the language ........................................................................................
468.5.2 Changing the temperature unit .............................................................................
468.5.3 Changing the date format .....................................................................................
468.5.4 Changing the time format .....................................................................................
478.5.5 Changing date & time ...........................................................................................
488.6 Working with the camera ......................................................................................................
488.6.1 Mounting an additional lens .................................................................................
498.6.2 Camera setup when using the Protective Window (P/N 1 194 977) ....................
498.6.3 Focusing the camera using autofocus .................................................................
498.6.4 Focusing the camera manually ............................................................................
498.6.5 Using the electronic zoom ....................................................................................
508.6.6 Inserting & removing the battery ..........................................................................
508.6.6.1 Inserting the battery ..........................................................................
508.6.6.2 Removing the battery ........................................................................
539 Camera overview ............................................................................................................................
539.1 Camera parts ........................................................................................................................
609.2 Keypad buttons & functions .................................................................................................
619.3 Autofocus ..............................................................................................................................
629.4 Camera status LCD ..............................................................................................................
639.5 Laser LocatIR ........................................................................................................................
6510 Camera program .............................................................................................................................
6510.1 Screen objects ......................................................................................................................
6510.1.1 Result table ...........................................................................................................
6510.1.2 Status bar ..............................................................................................................
6610.1.3 Temperature scale ................................................................................................
6610.1.4 System messages .................................................................................................
6610.1.4.1 Status messages ...............................................................................
6610.1.4.2 Warning messages ...........................................................................
6710.2 Menu system ........................................................................................................................
6710.2.1 Navigating in the menu system ............................................................................
6810.2.2 File menu ..............................................................................................................
6810.2.2.1 Images ...............................................................................................
6910.2.2.2 Save ...................................................................................................
xii Publ. No. 1557978 Rev. a155 – ENGLISH (EN) – February 6, 2006
Page 13

7010.2.3 Analysis menu .......................................................................................................
7010.2.3.1 Edit mode ..........................................................................................
7010.2.3.2 Changing the settings for the fixed spot ...........................................
7110.2.3.3 Add isotherm .....................................................................................
7310.2.3.4 Remove all .........................................................................................
7410.2.3.5 Obj par ...............................................................................................
7410.2.3.6 Deactivate local par. ..........................................................................
7510.2.4 Image menu ..........................................................................................................
7510.2.4.1 Freeze/Live ........................................................................................
7510.2.4.2 Range ................................................................................................
7510.2.4.3 Level/Span .........................................................................................
7510.2.4.4 Manual adjust / Continuous adjust ...................................................
7610.2.4.5 Palette ................................................................................................
7610.2.4.6 Hide graphics ....................................................................................
7710.2.5 Setup menu ...........................................................................................................
7710.2.5.1 Image .................................................................................................
7810.2.5.2 Save ...................................................................................................
7910.2.5.3 Power .................................................................................................
8010.2.5.4 Status bar ..........................................................................................
8110.2.5.5 Date/time ...........................................................................................
8110.2.5.6 Local settings ....................................................................................
8210.2.5.7 Camera info .......................................................................................
8210.2.5.8 Factory default ...................................................................................
8311 Folder and file structure ...............................................................................................................
8512 Electrical power system .................................................................................................................
8612.1 Internal battery charging ......................................................................................................
8712.2 External battery charging .....................................................................................................
8812.3 Battery safety warnings ........................................................................................................
9113 A note on LEMO connectors .........................................................................................................
9113.1 How to connect & disconnect LEMO connectors ................................................................
9314 Maintenance & cleaning ................................................................................................................
9314.1 Camera body, cables & accessories ....................................................................................
9314.2 Lenses ...................................................................................................................................
9515 Troubleshooting ..............................................................................................................................
9716 Technical specifications & dimensional drawings ......................................................................
9716.1 Imaging performance ...........................................................................................................
9716.2 Detector ................................................................................................................................
9716.3 Image presentation ...............................................................................................................
9716.4 Temperature ranges .............................................................................................................
9716.5 Correction parameters ..........................................................................................................
9816.6 Laser LocatIR ........................................................................................................................
9816.7 Electrical power system ........................................................................................................
9816.8 Environmental specifications ...............................................................................................
9816.9 Physical specifications .........................................................................................................
9916.10 Interfaces & connectors .......................................................................................................
9916.11 Pin configurations .................................................................................................................
9916.11.1 RS-232/USB connector ........................................................................................
10016.11.2 Remote control connector ....................................................................................
Publ. No. 1557978 Rev. a155 – ENGLISH (EN) – February 6, 2006 xiii
Page 14

10016.11.3 Power connector ...................................................................................................
10116.11.4 CVBS connector ...................................................................................................
10216.12 Relationship between fields of view and distance ...............................................................
11716.13 Basic dimensions – battery charger .....................................................................................
11816.14 Basic dimensions – battery ..................................................................................................
11916.15 Basic dimensions – camera .................................................................................................
12016.16 Basic dimensions – camera .................................................................................................
12117 Glossary ...........................................................................................................................................
12518 Thermographic measurement techniques ...................................................................................
12518.1 Introduction ..........................................................................................................................
12518.2 Emissivity ..............................................................................................................................
12618.2.1 Finding the emissivity of a sample .......................................................................
12618.2.1.1 Step 1: Determining reflected apparent temperature .......................
12818.2.1.2 Step 2: Determining the emissivity ...................................................
12918.3 Reflected apparent temperature ..........................................................................................
12918.4 Distance ................................................................................................................................
12918.5 Relative humidity ..................................................................................................................
12918.6 Other parameters ..................................................................................................................
13119 History of infrared technology ......................................................................................................
13520 Theory of thermography ................................................................................................................
13520.1 Introduction ...........................................................................................................................
13520.2 The electromagnetic spectrum ............................................................................................
13620.3 Blackbody radiation ..............................................................................................................
13720.3.1 Planck’s law ..........................................................................................................
13820.3.2 Wien’s displacement law ......................................................................................
14020.3.3 Stefan-Boltzmann's law .........................................................................................
14020.3.4 Non-blackbody emitters .......................................................................................
14320.4 Infrared semi-transparent materials .....................................................................................
14521 The measurement formula .............................................................................................................
15122 Emissivity tables .............................................................................................................................
15122.1 References ............................................................................................................................
15122.2 Important note about the emissivity tables ..........................................................................
15122.3 Tables ....................................................................................................................................
167Index ................................................................................................................................................
xiv Publ. No. 1557978 Rev. a155 – ENGLISH (EN) – February 6, 2006
Page 15

1 Warnings & cautions
10474103;a1
■ This equipment generates, uses, and can radiate radio frequency energy and if
not installed and used in accordance with the instruction manual, may cause interference to radio communications. It has been tested and found to comply with the
limits for a Class A computing device pursuant to Subpart Jof Part 15 of FCC Rules,
which are designed to provide reasonable protection against such interference
when operated in a commercial environment. Operation of this equipment in a
residential area is likely to cause interference in which case the user at his own
expense will be required to take whatever measures may be required to correct
the interference.
■ An infrared camera is a precision instrument and uses a very sensitive IR detector.
Pointing the camera towards highly intensive energy sources – such as devices
emitting laser radiation, or reflections from such devices – may affect the accuracy
of the camera readings, or even harm – or irreparably damage – the detector. Note
that this sensitivity is also present when the camera is switched off and the lens
cap is mounted on the lens.
■ Each camera from FLIR Systems is calibrated prior to shipping. It is advisable that
the camera is sent in for calibration once a year.
■ For protective reasons, the LCD (where applicable)will beswitched off if the detector
temperature exceeds +60 °C (+149 °F) and the camera will be switched off if the
detector temperature exceeds +68 °C (+154.4 °F).
■ The camera requires a warm-up time of 5 minutes before accurate measurements
(where applicable) can be expected.
■ In certain outdoor conditions, the sun can enter the eyepiece and cause damage
to the LCD. Use an eyepiece protector when you expect to be using the camera
for extended periods of time in outdoor sunlit environments.
1
Publ. No. 1557978 Rev. a155 – ENGLISH (EN) – February 6, 2006 1
Page 16

1 – Warnings & cautions
1
INTENTIONALLY LEFT BLANK
2 Publ. No. 1557978 Rev. a155 – ENGLISH (EN) – February 6, 2006
Page 17

2 Important note about this manual
As far as it is practically possible, FLIR Systems configures each manual to reflect
each customer’s particular camera configuration. However, please note the following
exceptions:
■ The packing list is subject to specific customer configuration and may contain more
or less items
■ FLIR Systems reserves the right to discontinue models,parts andaccessories, and
other items, or change specifications at any time without prior notice
■ In some cases, the manual may describe features that are not available in your
particular camera configuration
2
Publ. No. 1557978 Rev. a155 – ENGLISH (EN) – February 6, 2006 3
Page 18

2 – Important note about this manual
2
INTENTIONALLY LEFT BLANK
4 Publ. No. 1557978 Rev. a155 – ENGLISH (EN) – February 6, 2006
Page 19

3 Welcome!
Thank you for choosing the ThermaCAM™ P25 infrared camera.
The ThermaCAM™ P25 infrared condition monitoring system consists of an infrared
camera with a built-in 36 mm lens, and a range of accessories. The infrared camera
measures and images the emitted infrared radiation from an object. The fact that radiation is a function of object surface temperature makes it possible for the camera
to calculate and show this temperature.
The ThermaCAM™ P25 camera is dust- and splash-proof and tested for shock and
vibration for use in the most demanding field conditions.It is a handheld, truly portable
camera, which is lightweight and operates for more than two hours on one battery
pack. A high-resolution infrared color image is provided in real-time in the integral
viewfinder.
The camera is very easy to use and is operated by using a few buttons which are
conveniently placed on the camera, allowing fingertip control of major functions. A
built-in menu system also gives easy access to the advanced, simple-to-use camera
software for increased functionality.
To document the object under inspection it is possible to capture and store images
on a removable CompactFlash card. The images can be analyzed either in the field
by using the real-time measurement markers built into the camera software, or in a
PC by using FLIR Systems's software for infrared analysis and reporting. This makes
it very easy to create complete survey reports (containing numerous infrared images,
photos, tables etc.) from the inspections.
3
Publ. No. 1557978 Rev. a155 – ENGLISH (EN) – February 6, 2006 5
Page 20
3 – Welcome!
3.1 About FLIR Systems
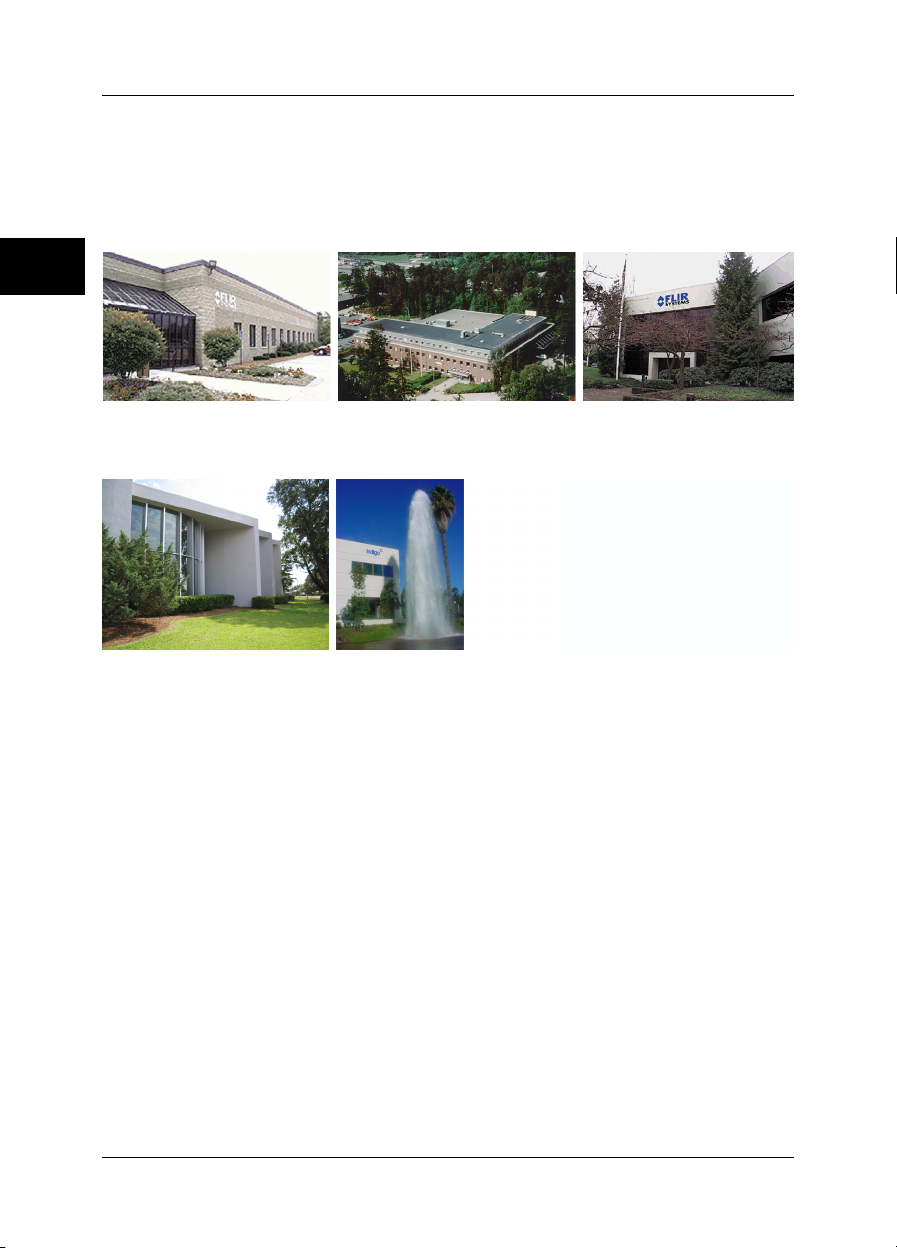
With over 40 years experience in IR systems and applications development, and over
30 000 infrared cameras in use worldwide, FLIR Systems is the undisputed global
commercial IR industry leader.
10380703;a2
3
Figure 3.1 FLIR Systems, Boston, USA, FLIR Systems, Danderyd, Sweden, and FLIR Systems, Portland,
USA.
10570303;a2
Figure 3.2 Indigo Operations, Niceville, USA,and Indigo Operations,SantaBarbara, USA. IndigoOperations
is a division of FLIR Systems.
As pioneers in the IR industry, FLIR Systems has a long list of ‘firsts’ the world of infrared thermography:
■ 1965: 1st thermal imaging system for predictive maintenance (Model 650).
■ 1973: 1st battery-operated portable IR scanner for industrial applications predictive
maintenance (Model 750).
■ 1975: 1st TV compatible system (Model 525).
■ 1978: 1st dual-wavelength scanning system capable of real-time analog recording
of thermal events (Model 780). Instrumental in R & D market development.
■ 1983: 1st thermal imaging and measurement system with on-screen temperature
measurement.
■ 1986: 1st TE (thermo-electrically) cooled system.
■ 1989: 1st single-piece infrared camera system for PM (predictive maintenance)
and R & D (research & development) with on-board digital storage.
■ 1991: 1st Windows-based thermographic analysis and reporting system.
■ 1993: 1st Focal Plane Array (FPA) system for PM and R & D applications.
■ 1995: 1st full-featured camcorder style FPA infrared system (ThermaCAM).
■ 1997: 1st: uncooled microbolometer-based PM/R & D system.
6 Publ. No. 1557978 Rev. a155 – ENGLISH (EN) – February 6, 2006
Page 21

3 – Welcome!
■ 2000: 1st thermography system with both thermal and visual imaging.
■ 2000: 1st thermography system to incorporate thermal/visual/voice and text data
logging.
■ 2002: 1st automated thermography system (model P60) to feature detachable re-
motely controllable LCD, JPEG image storage, enhanced connectivity including
USB and IrDA wireless, thermal/visual/voice and text data logging.
■ 2002: 1st low-cost ultra-compact hand-held thermography camera (E series).
Revolutionary, ergonomic design, lightest IR measurement camera available.
■ 2003: 1st low-cost, ultra-compact infrared camera for fixed installation intended for
automation and security applications. Exceptionally user-friendly due to standard
interfaces and extensive built-in functionality.
■ 2004: 1st camera models specially designed for building thermography (B1, B2
and B20)
10401603;a3
3
Figure 3.3 LEFT: FLIR Systems Thermovision® Model 661. The photo is taken on May 30th, 1969 at the
distribution plant near Beckomberga, in Stockholm, Sweden. The camera weighed approx. 25 kg (55 lb),
the oscilloscope 20 kg (44 lb), the tripod 15 kg (33 lb). The operator also needed a 220 VAC generator
set, and a 10L (2.6US gallon) jar with liquidnitrogen. To theleft ofthe oscilloscope thePolaroid attachment
(6 kg/13 lb) can be seen. RIGHT: FLIR Systems ThermaCAM Model E2 from 2002 – weight: 0.7 kg (1.54
lb), including battery.
With this tradition of unparalleled technical excellence and innovative achievements,
FLIR Systems continues to develop new infrared products, educational venues and
applications expertise to meet the diverse demands of thermographers worldwide.
Publ. No. 1557978 Rev. a155 – ENGLISH (EN) – February 6, 2006 7
Page 22
3 – Welcome!
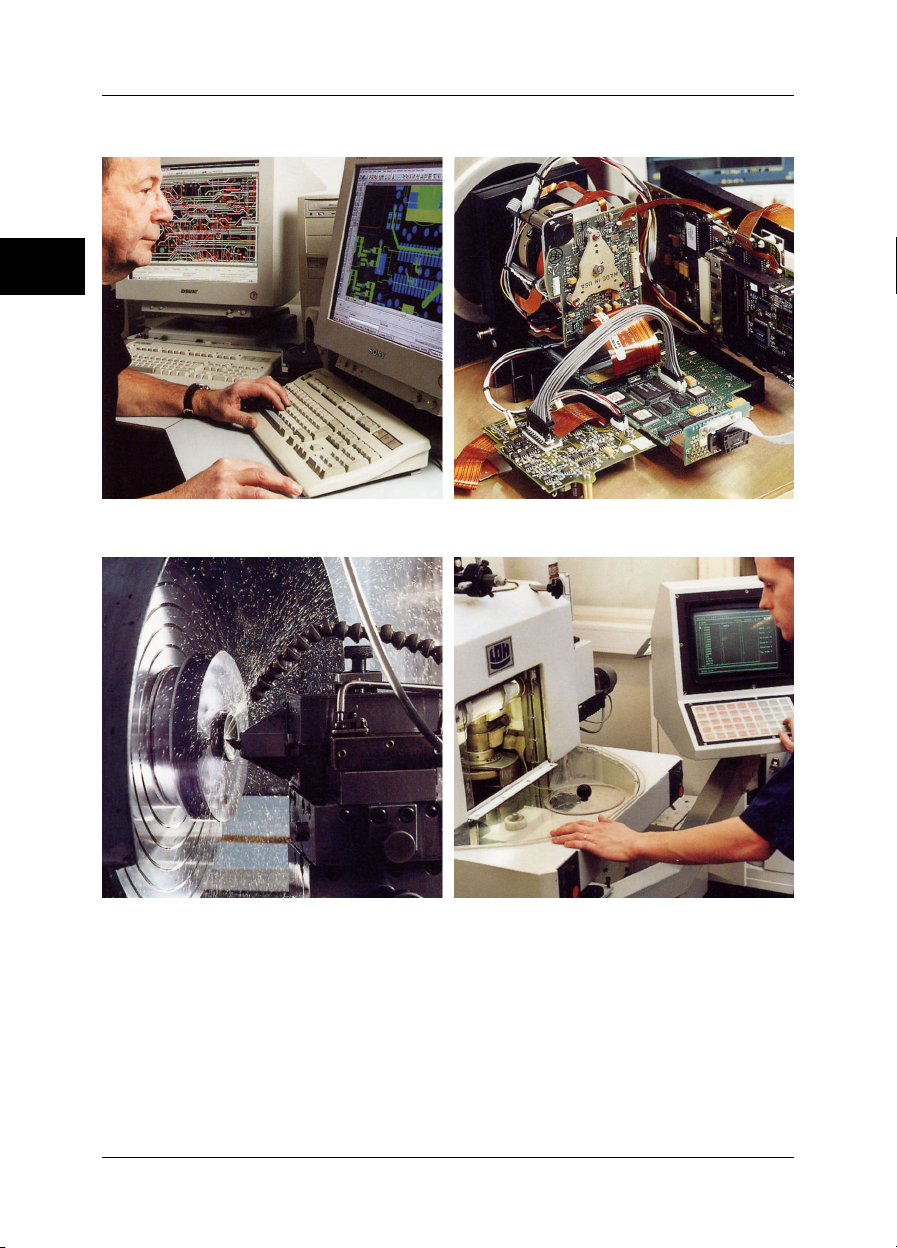
3.1.1 A few images from our facilities
10401303;a1
3
Figure 3.4 LEFT: Development of system electronics; RIGHT: Testing of an FPA detector
10401403;a1
Figure 3.5 LEFT: Diamond turning machine; RIGHT: Lens polishing
8 Publ. No. 1557978 Rev. a155 – ENGLISH (EN) – February 6, 2006
Page 23
3 – Welcome!
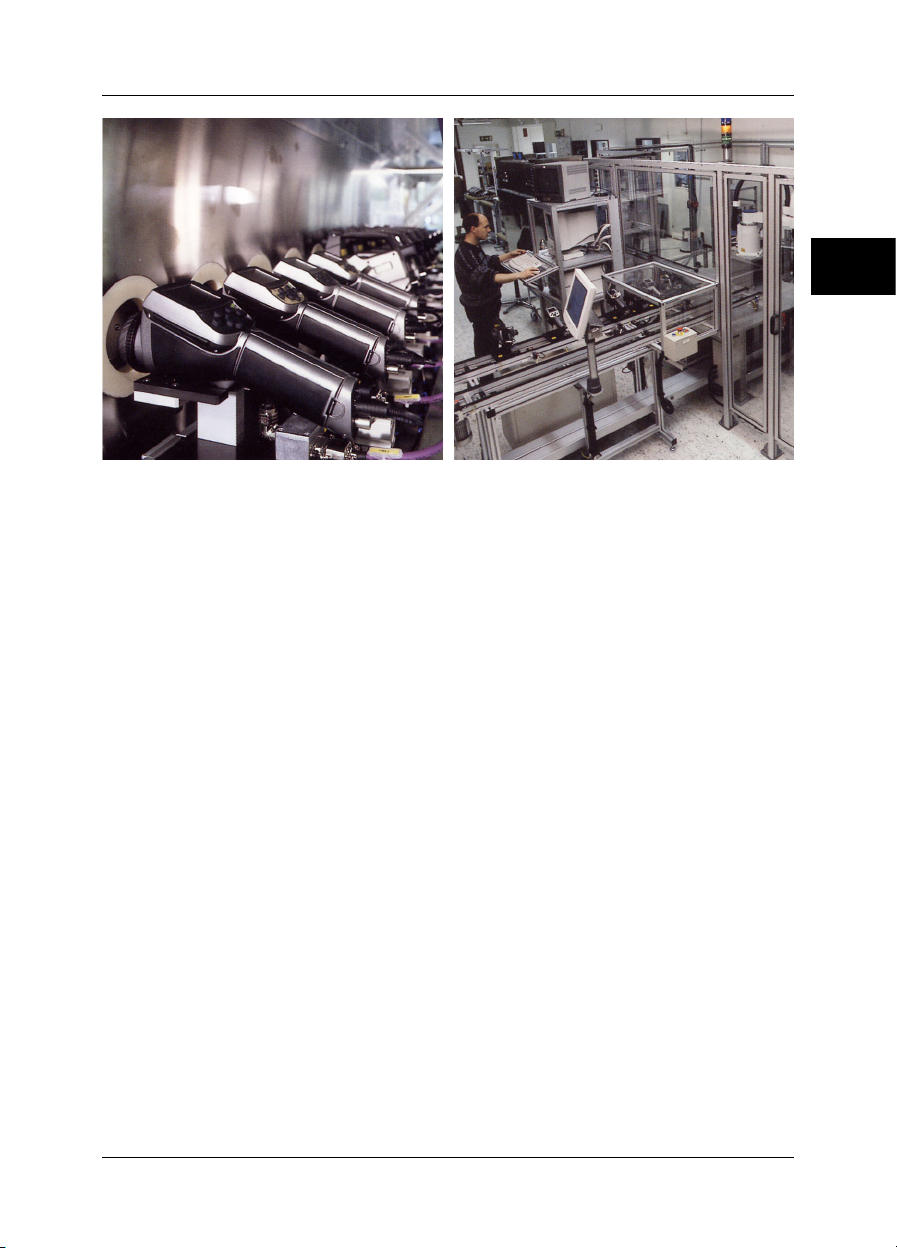
10401503;a1
Figure 3.6 LEFT: Testing of IR cameras in the climatic chamber; RIGHT: Robot for camera testing and
calibration
3
Publ. No. 1557978 Rev. a155 – ENGLISH (EN) – February 6, 2006 9
Page 24

3 – Welcome!
3.2 Comments & questions
FLIR Systems is committed to a policy of continuous development, and although we
have tested and verified the information in this manual to the best of our ability, you
may find that features and specifications have changed since the time of printing.
Please let us know about any errors you find, as well as your suggestions for future
editions, by sending an e-mail to:
3
documentation@flir.se
➲ Do not use this e-mail address for technical support questions. Technical support
is handled by FLIR Systems local sales offices.
10 Publ. No. 1557978 Rev. a155 – ENGLISH (EN) – February 6, 2006
Page 25

4 Packing list
The ThermaCAM™ P25 and its accessories are delivered in a hard transport case
which typically contains the items below. On receipt of the transport case, inspect all
items andcheck them against the delivery note. Any damaged items must be reported
to the local FLIR Systems representative immediately.
QtyPart numberDescription
11 909 820Adapter for CompactFlash card
21 195 268Battery
11 195 267Battery charger
11 909 653CompactFlash card
11 909 775CVBS video cable
11 195 317Lens cap for camera body
11557978Operator’s manual
11 909 528Power supply
1117 132Shoulder strap
1Configuration-dependentThermaCAM™ P25
11 195 314USB cable
4
Publ. No. 1557978 Rev. a155 – ENGLISH (EN) – February 6, 2006 11
Page 26

4 – Packing list
4
INTENTIONALLY LEFT BLANK
12 Publ. No. 1557978 Rev. a155 – ENGLISH (EN) – February 6, 2006
Page 27
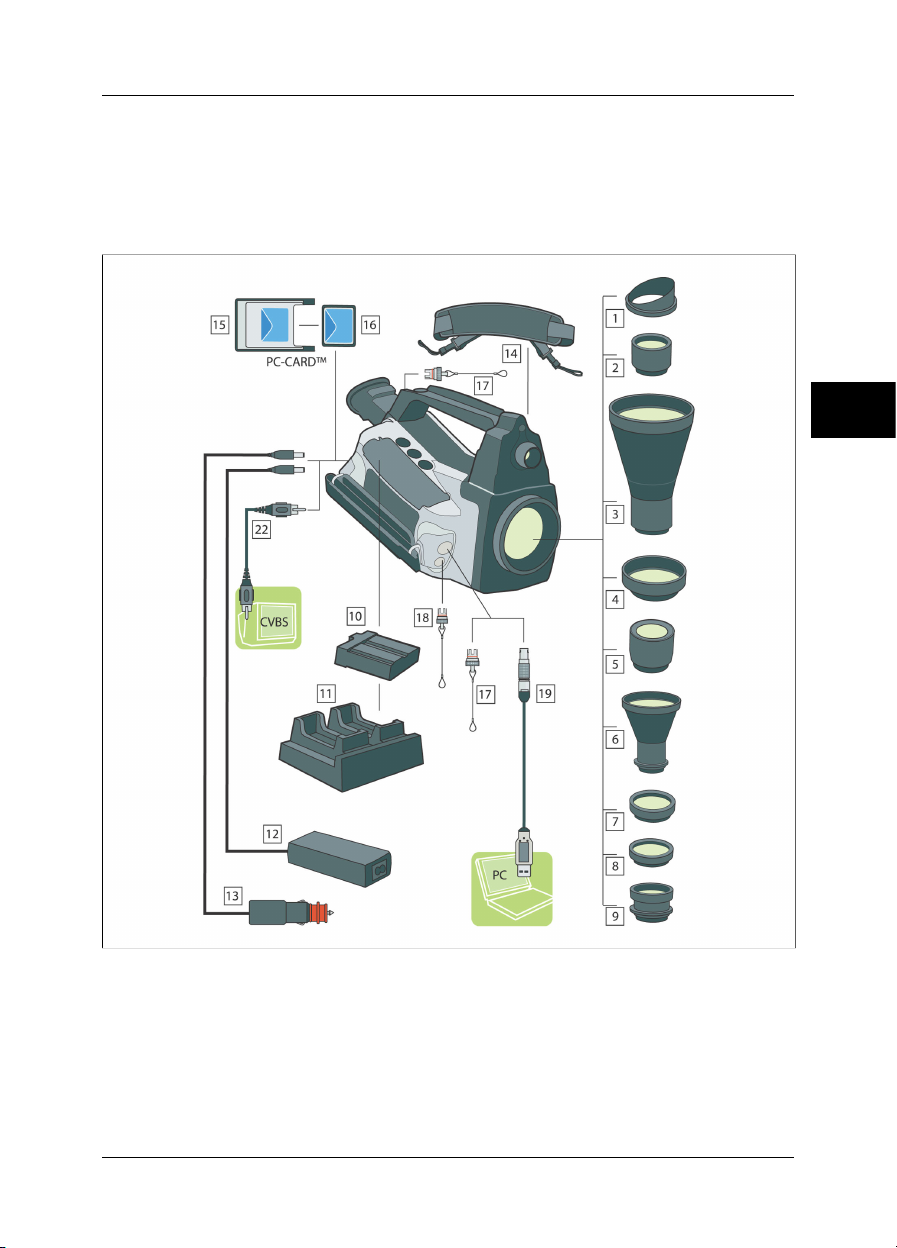
5 System overview
This system overview shows all accessories that are possible to order for a ThermaCAM™ P25.
10570703;a3
5
Figure 5.1 System overview
Publ. No. 1557978 Rev. a155 – ENGLISH (EN) – February 6, 2006 13
Page 28

5 – System overview
Figure 5.2 Explanations of callouts
5
Description of partPart No.Callout
Protective plastic window194 5601
Protective window1 194 9772
124 mm IR lens194 5793
72 mm IR lens194 1764
18 mm IR lens194 4015
9.0 mm IR lens194 7026
64/150 close-up IR lens194 5337
34/80 close-up IR lens1 194 9788
50 μm IR lens1 700 5009
Battery1 195 26810
2-bay battery charger1 195 26711
External power supply1 909 52812
Automotive (cigarette lighter) 12 VDC adapter1 195 14313
Shoulder strap117 13214
Adapter for CompactFlash™ card1 909 82015
CompactFlash™ card1 909 65316
1 910 23317
Protective cap for RS-232/USB connector
■
Protective cap for unused remote control con-
■
nector
Protective cap for unused headset connector1 910 23218
USB cable1 195 31419
RS-232 cable1 195 31320
CVBS cable (composite video cable)1 909 77522
14 Publ. No. 1557978 Rev. a155 – ENGLISH (EN) – February 6, 2006
Page 29
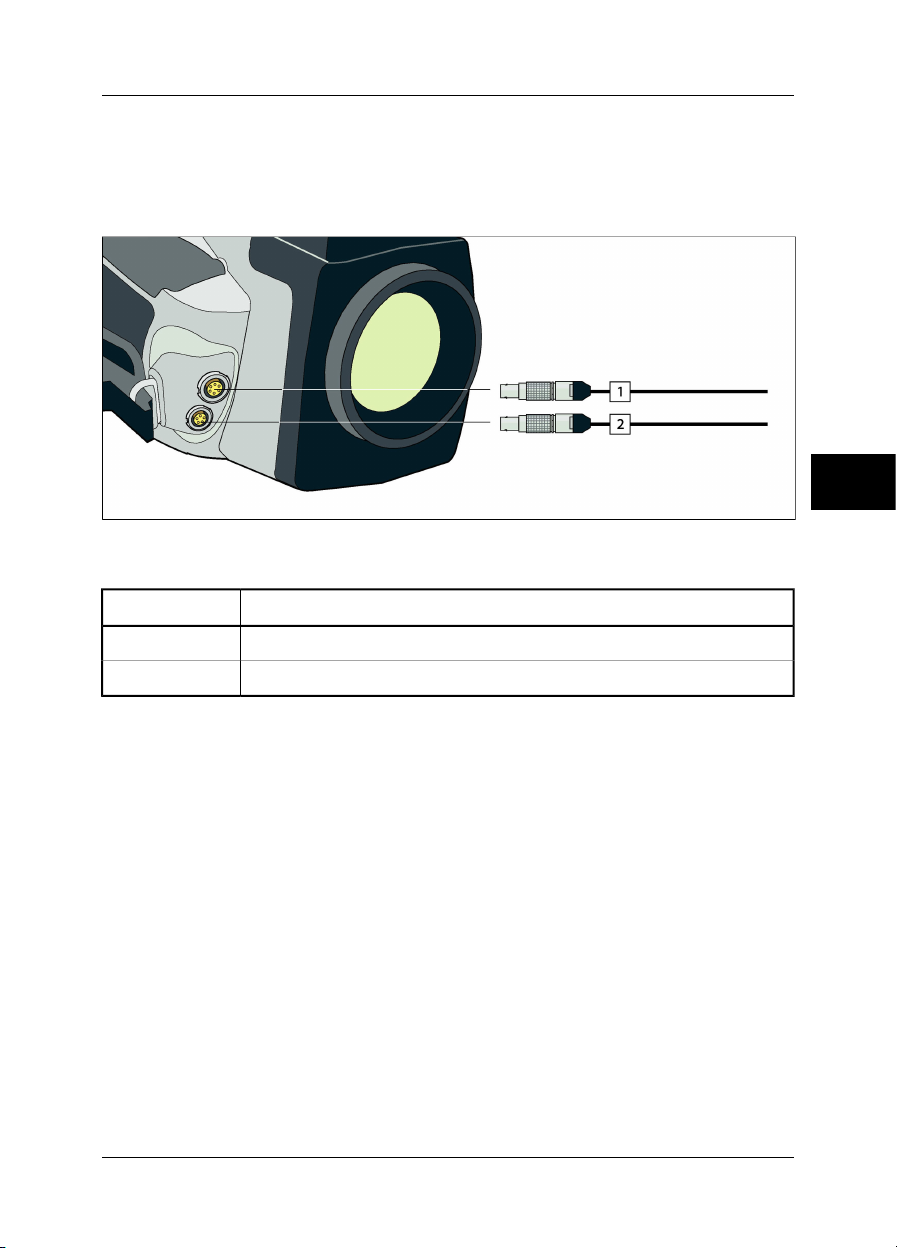
6 Connecting system components
6.1 Front connectors
10438803;a2
Figure 6.1 How to connect system components: Front connectors
Figure 6.2 Explanations of callouts
ExplanationCallout
USB or RS-232 cable.1
Not implemented.2
6
Publ. No. 1557978 Rev. a155 – ENGLISH (EN) – February 6, 2006 15
Page 30
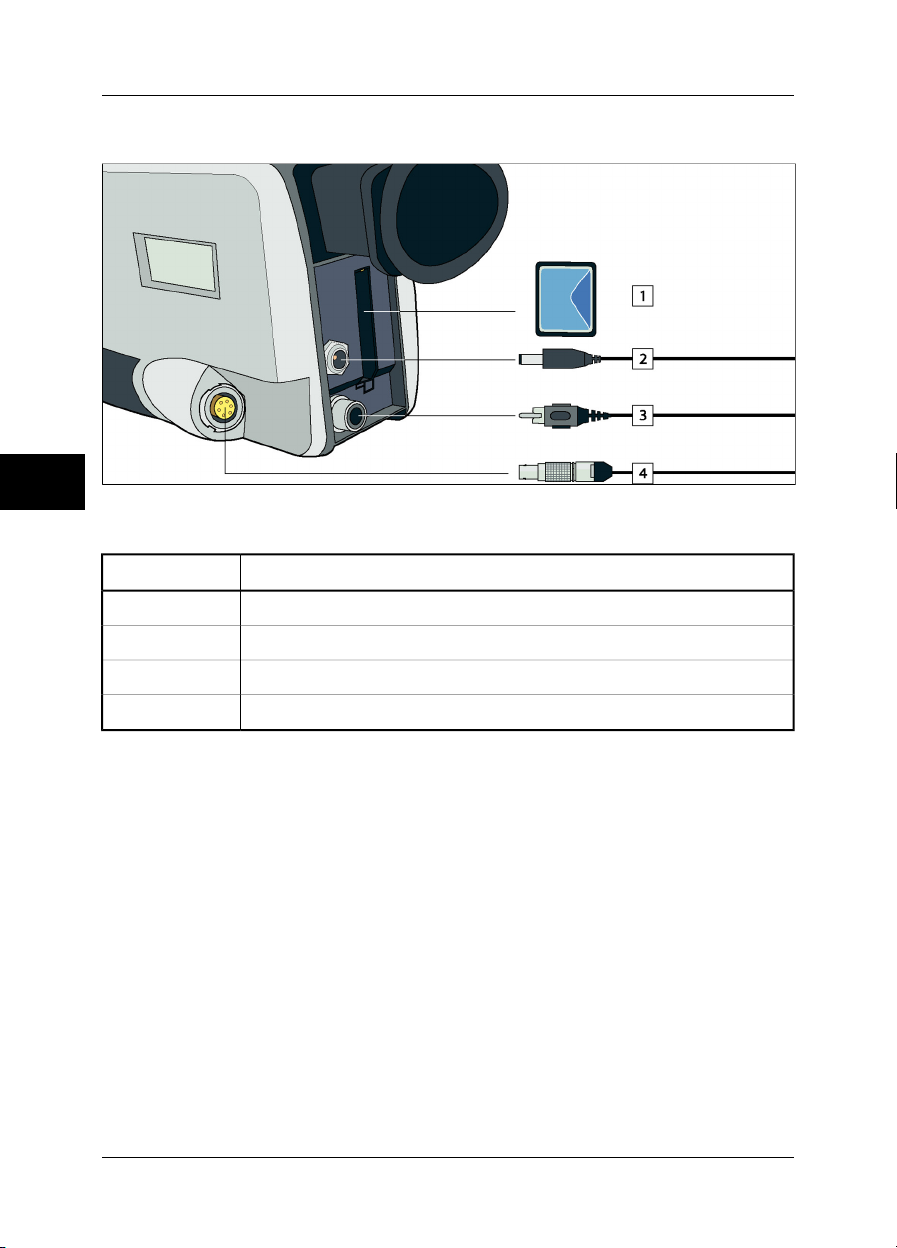
6 – Connecting system components
6.2 Rear connectors
10593503;a1
6
Figure 6.3 How to connect system components: Rear connectors
Figure 6.4 Explanations of callouts
ExplanationCallout
CompactFlash card1
Power supply cable2
CVBS cable (i.e. composite video)3
Remote control cable4
16 Publ. No. 1557978 Rev. a155 – ENGLISH (EN) – February 6, 2006
Page 31

7 Introduction to thermographic
inspections of electrical
installations
7.1 Important note
All camera functions and features that are described in this section may not be supported by your particular camera configuration.
Electrical regulations differ from country to country. For that reason, the electrical
procedures described in this section may not be the standard of procedure in your
particular country. Also, in many countries carrying out electrical inspections requires
formal qualification. Always consult national or regional electrical regulations.
7.2 General information
7.2.1 Introduction
Today, thermography is a well-established technique for the inspection of electrical
installations. This was the first and still is the largest. the largest application of thermography. The infrared camera itself has gone through an explosive development
and we can say that today, the 8th generation of thermographic systems is available.
It all began in 1964, more than 40 years ago. The technique is now established
throughout the whole world. Industrialized countries as well as developing countries
have adopted this technique.
Thermography, in conjunction with vibration analysis, has over the latest decades
been the main method for fault diagnostics in the industry as a part of the preventive
maintenance program. The great advantage with these methods is that it is not only
possible to carry out the inspection on installations in operation; normal working
condition is in fact a prerequisite for a correct measurement result, so the ongoing
production processis notdisturbed. Thermographicinspection ofelectrical installations
are used in three main areas:
■ Power generation
■ Power transmission
■ Power distribution, that is, industrial use of electrical energy.
The fact that these controls are carried out under normal operation conditions has
created a natural division between these groups. The power generation companies
measure during the periods of high load. These periods vary from country to country
7
Publ. No. 1557978 Rev. a155 – ENGLISH (EN) – February 6, 2006 17
Page 32

7 – Introduction to thermographic inspections of electrical installations
and for the climatic zones. The measurement periods may also differ depending on
the type of plant to be inspected, whether they are hydroelectric, nuclear, coal-based
or oil-based plants.
In the industry the inspections are—at least in Nordic countries with clear seasonal
differences—carried out during spring or autumn or before longer stops in the operation. Thus, repairs are made when the operation is stopped anyway. However, this
seems to be the rule less and less, which has led to inspections of the plants under
varying load and operating conditions.
7.2.2 General equipment data
The equipment to be inspected has a certain temperature behavior that should be
known to the thermographer before the inspection takes place. In the case ofelectrical
equipment, the physical principle of why faults show a different temperature pattern
because of increased resistance or increased electrical current is well known.
However, it is useful to remember that, in some cases, for example solenoids, ‘overheating’ is natural and does not correspond to a developing defect. In other cases,
like the connections in electrical motors, the overheating might depend on the fact
7
that the healthy part is taking the entire load and therefore becomes overheated. A
similar example is shown in section 7.5.7 – Overheating in one part as a result of a
fault in another on page 33.
Defective parts of electrical equipment can therefore both indicate overheating and
be cooler than the normal ‘healthy’ components. It is necessary to be aware of what
to expect by getting as much information as possible about the equipment before it
is inspected.
The general rule is, however, that a hot spot is caused by a probable defect. The
temperature and the load of that specific component at the moment of inspection will
give an indication of how serious the fault is and can become in other conditions.
Correct assessment in each specific case demands detailed information about the
thermal behavior of the components, that is, we need to know the maximum allowed
temperature of the materials involved and the role the component plays in the system.
Cable insulations, for example, lose their insulation properties above a certain temperature, which increases the risk of fire.
In the case of breakers, where the temperature is too high, parts can melt and make
it impossible to open the breaker, thereby destroying its functionality.
18 Publ. No. 1557978 Rev. a155 – ENGLISH (EN) – February 6, 2006
Page 33

7 – Introduction to thermographic inspections of electrical installations
The more the IR camera operator knows about the equipment that he or she is about
to inspect, the higher the quality of the inspection. But it is virtually impossible for an
IR thermographerto havedetailed knowledgeabout allthe differenttypes of equipment
that can be controlled. It is therefore common practice that a person responsible for
the equipment is present during the inspection.
7.2.3 Inspection
The preparationof theinspection shouldinclude thechoice ofthe righttype ofreport.
It isoften necessaryto use complementary equipmentsuch as ampere meters in order
to measure the current in the circuits where defects were found. An anemometer is
necessary if you want to measure the wind speed at inspection of outdoorequipment.
Automatic functions help the IR operator to visualize an IR image of the components
with the right contrast to allow easy identification of a fault or a hot spot. It is almost
impossible to miss a hot spot on a scanned component. A measurement function will
also automatically display the hottest spot within an area in the image or the difference
between the maximum temperature in the chosen area and a reference, which can
be chosen by the operator, for example the ambient temperature.
10712703;a3
7
Figure 7.1 An infrared and a visual image of a power line isolator
When the fault is clearly identified and the IR thermographer has made sure that it is
not a reflection or a naturally occurring hot spot, the collection of the data starts, which
will allow the correct reporting of the fault. The emissivity, the identification of the
component, and the actual working conditions, together with the measured temperature, will be used in the report. In order to make it easy to identify the component a
visual photo of the defect is often taken.
7.2.4 Classification & reporting
Reporting has traditionally been the most time-consuming part of the IR survey. A
one-day inspection could result in one or two days’ work to report and classify the
found defects. This is still the case for many thermographers, who have chosen not
to use the advantages that computers and modern reporting software have brought
to IR condition monitoring.
Publ. No. 1557978 Rev. a155 – ENGLISH (EN) – February 6, 2006 19
Page 34

7 – Introduction to thermographic inspections of electrical installations
The classification of the defects gives a more detailed meaning that not only takes
into account the situation at the time of inspection (which is certainly of great importance), but also the possibility to normalize the over-temperature to standard load
and ambient temperature conditions.
An over-temperature of +30°C (+86°F) is certainly a significant fault. But if that overtemperature is valid for one component working at 100% load and for another at 50%
load, it is obvious that the latter will reach a much higher temperature should its load
increase from 50% to 100%. Such a standard can be chosen by the plant’s circumstances. Very often, however, temperatures are predicted for 100% load. A standard
makes it easier to compare the faults over time and thus to make a more complete
classification.
7.2.5 Priority
Based on the classification of the defects, the maintenance manager gives the defects
a repair priority. Very often, the information gathered during the infrared survey is put
together withcomplementary informationon the equipment collected by other means
such as vibration monitoring, ultrasound or the preventive maintenance scheduled.
7
Even if the IR inspection is quickly becoming the most used method of collecting information about electrical components safely with the equipment under normal operating conditions, there are many other sources of information the maintenance or the
production manager has to consider.
The priority of repair should therefore not be a task for the IR camera operator in the
normal case. If a critical situation is detected during the inspection or during the
classification of the defects, the attention of the maintenance manager should of
course be drawn to it, but the responsibility for determining the urgency of the repair
should be his.
7.2.6 Repair
To repair the known defects is the most important function of preventive maintenance.
However, to assure production at the right time or at the right cost can also be important goals for a maintenance group. The information provided by the infrared survey
can be used to improve the repair efficiency as well as to reach the other goals with
a calculated risk.
To monitor the temperature of a known defect that can not be repaired immediately
for instance because spare parts are not available, can often pay for the cost of inspection a thousandfold and sometimes even for the IR camera. To decide not to
repair knowndefects tosave on maintenance costs and avoid unnecessary downtime
is also another way of using the information from the IR survey in a productive way.
20 Publ. No. 1557978 Rev. a155 – ENGLISH (EN) – February 6, 2006
Page 35

7 – Introduction to thermographic inspections of electrical installations
However, themost commonresult of the identification and classification of the detected
faults is a recommendation to repair immediately or as soon as it is practically possible.
It is important that the repair crew is aware of the physical principles for the identification of defects. If a defect shows a high temperature and is in a critical situation, it is
very common that the repair personnel expect to find a highly corroded component.
It should also come as no surprise to the repair crew that a connection, which is
usually healthy, can give the same high temperatures as a corrodedone if it has come
loose. These misinterpretations are quite common and risk putting in doubt the reliability of the infrared survey.
7.2.7 Control
A repaired component should be controlled as soon as possible after the repair. It is
not efficient to wait for the next scheduled IRsurvey in order to combine a new inspection with the control of the repaired defects. The statistics on the effect of the repair
show that up to a third of the repaired defects still show overheating. Thatis the same
as saying that those defects present a potential risk of failure.
To wait until the next scheduled IR survey represents an unnecessary risk for the
plant.
Besides increasing the efficiency of the maintenance cycle (measured in terms of
lower risk for the plant) the immediate control of the repair work brings other advantages to the performance of the repair crew itself.
7
When a defect still shows overheating after the repair, the determination of the cause
of overheating improves the repair procedure, helps choose the best component
suppliers and detect design shortcomings on the electrical installation. The crew
rapidly sees the effect of the work and can learn quickly both from successful repairs
and from mistakes.
Another reason to provide the repair crew with an IR instrument is that many of the
defects detected during the IR survey are of low gravity. Instead of repairing them,
which consumes maintenance and production time, it can be decided to keep these
defects under control. Therefore the maintenance personnel should have access to
their own IR equipment.
It is common to note on the report form the type of fault observed during the repair
as well as the action taken. These observations make an important source of experience that can be used to reduce stock, choose the best suppliers or to train new
maintenance personnel.
Publ. No. 1557978 Rev. a155 – ENGLISH (EN) – February 6, 2006 21
Page 36

7 – Introduction to thermographic inspections of electrical installations
7.3 Measurement technique for thermographic inspection of electrical installations
7.3.1 How to correctly set the equipment
A thermal image may show high temperature variations:
10712803;a4
Figure 7.2 Temperature variations in a fusebox
In the images above, the fuse to the right has a maximum temperature of +61°C
(+142°F), whereas the one to the left is maximum +32°C (+90°F) and the one in the
middle somewhere in between. The three images are different inasmuch as the temperature scale enhances only one fuse in each image. However, it is the same image
and all the information about all three fuses is there. It is only a matter of setting the
7
temperature scale values.
7.3.2 Temperature measurement
Some cameras today can automatically find the highest temperature in the image.
The image below shows how it looks to the operator.
10712903;a3
Figure 7.3 An infrared image of a fusebox where the maximum temperature is displayed
The maximum temperature in the area is +62.2°C (+144.0°F). The spot meter shows
the exact location of the hot spot. The image can easily be stored in the camera
memory.
The correct temperature measurement depends, however, not only on the function
of the evaluation software or the camera. It may happen that the actual fault is, for
example, a connection, which is hidden from the camera in the position it happens
22 Publ. No. 1557978 Rev. a155 – ENGLISH (EN) – February 6, 2006
Page 37

7 – Introduction to thermographic inspections of electrical installations
to be in for the moment. It might be so that you measure heat, which has been conducted oversome distance,whereas the ‘real’ hot spot is hidden from you. An example
is shown in the image below.
10717603;a3
Figure 7.4 A hidden hot spot inside a box
Try to choose different angles and make sure that the hot area is seen in its full size,
that is, that it is not disappearing behind something that might hide the hottest spot.
In this image, the hottest spot of what the camera can‘see’, is +83°C (+181°F), where
the operating temperature on the cables below the box is +60°C (+140°F). However,
the real hot spot is most probably hidden inside the box, see the in yellow encircled
area. This fault is reported as a +23.0°C (+41.4°F) excess temperature, but the real
problem is probably essentially hotter.
7
Another reason for underestimating the temperature of an object is bad focusing. It
is very important that the hot spot found is in focus. See the example below.
10717403;a2
Figure 7.5 LEFT: A hot spot in focus; RIGHT: A hot spot out of focus
In the left image, the lamp is in focus. Its average temperature is +64°C (+147°F). In
the right image, the lamp is out of focus, which will result in only +51°C (+124°F) as
the maximum temperature.
Publ. No. 1557978 Rev. a155 – ENGLISH (EN) – February 6, 2006 23
Page 38

7 – Introduction to thermographic inspections of electrical installations
7.3.3 Comparative measurement
For thermographic inspections of electrical installations a special method is used,
which is based on comparison of different objects, so-called measurement with a
reference. This simply means that you compare the three phases with each other.
This method needs systematic scanning of the three phases in parallel in order to
assess whether a point differs from the normal temperature pattern.
A normal temperature pattern means that current carrying components have a given
operation temperature shown in a certain color (or gray tone) on the display, which
is usually identical for all three phases under symmetrical load. Minor differences in
the color might occur in the current path, for example, at the junction of two different
materials, at increasing or decreasing conductor areas or on circuit breakers where
the current path is encapsulated.
The image below shows three fuses, thetemperatures of which are very close toeach
other. The inserted isotherm actually shows less than +2°C (+3.6°F) temperature
difference between the phases.
Different colors are usually the result if the phases are carrying an unsymmetrical
7
load. This difference in colors does not represent any overheating since this does not
occur locally but is spread along the whole phase.
10713203;a3
Figure 7.6 An isotherm in an infrared image of a fusebox
A ‘real’ hot spot, on the other hand, shows a rising temperature as you look closer
to the source of the heat. See the image below, where the profile (line) shows a
steadily increasing temperature up to about +93°C (+199°F) at the hot spot.
24 Publ. No. 1557978 Rev. a155 – ENGLISH (EN) – February 6, 2006
Page 39

7 – Introduction to thermographic inspections of electrical installations
10713303;a4
Figure 7.7 A profile (line) in an infrared image and a graph displaying the increasing temperature
7.3.4 Normal operating temperature
Temperature measurement with thermography usually gives the absolute temperature
of the object. In order to correctly assess whether the component is too hot, it is
necessary to know its operating temperature, that is, its normal temperature if we
consider the load and the temperature of its environment.
As the direct measurement will give the absolute temperature—which must be considered as well (as most components have an upper limit to their absolute temperatures)—it is necessary to calculate the expected operating temperature given the load
and the ambient temperature. Consider the following definitions:
■ Operating temperature: the absolute temperature of the component. It depends
on the current load and the ambient temperature. It is always higher than the ambient temperature.
■ Excess temperature (overheating): the temperature difference between a properly
working component and a faulty one.
7
The excess temperature is found as the difference between the temperature of a
‘normal’ component and the temperature of its neighbor. It is important to compare
the same points on the different phases with each other.
As an example, see the following images taken from indoor equipment:
10713403;a4
Figure 7.8 An infrared image of indoor electrical equipment (1)
Publ. No. 1557978 Rev. a155 – ENGLISH (EN) – February 6, 2006 25
Page 40

7 – Introduction to thermographic inspections of electrical installations
10713503;a4
Figure 7.9 An infrared image of indoor electrical equipment (2)
The two left phases are considered as normal, whereas the right phase shows a very
clear excess temperature. Actually, the operating temperature of the left phase is
+68°C (+154°F), that is, quite a substantial temperature, whereas the faulty phase
to the right shows a temperature of +86°C (+187°F). This means an excess temperature of +18°C (+33°F), that is, a fault that has to be attended to quickly.
For practical reasons, the (normal, expected) operating temperature of a component
is taken as the temperature of the components in at least two out of three phases,
7
provided that you consider them to be working normally.. The ‘most normal’ case is
of course that all three phases have the same or atleast almost the same temperature.
The operating temperature of outdoor components in substations or power lines is
usually only 1°C or 2°C above the air temperature (1.8°F or 3.6°F). In indoor substations, the operating temperatures vary a lot more.
This fact is clearly shown by the bottom image as well. Here the left phase is the one,
which shows an excess temperature. The operating temperature, taken from the two
‘cold’ phases, is +66°C (+151°F). The faulty phase shows a temperature of +127°C
(+261°F), which has to be attended to without delay.
7.3.5 Classification of faults
Once a faulty connection is detected, corrective measures may be necessary—or
may not be necessary for the time being. In order to recommend the most appropriate
action the following criteria should be evaluated:
■ Load during the measurement
■ Even or varying load
■ Position of the faulty part in the electrical installation
■ Expected future load situation
■ Is the excess temperature measured directlyon thefaulty spot or indirectly through
conducted heat caused by some fault inside the apparatus?
Excess temperatures measured directly on the faulty part are usually divided into
three categories relating to 100% of the maximum load.
26 Publ. No. 1557978 Rev. a155 – ENGLISH (EN) – February 6, 2006
Page 41

7 – Introduction to thermographic inspections of electrical installations
< 5°C (9°F)I
5–30°C (9–54°F)II
>30°C (54°F)III
The start of the overheat condition. This must be carefully
monitored.
Developed overheating. It must
be repaired as soon as possible
(but think about the load situation before a decision is made).
Acute overheating. Must be repaired immediately (but think
about the load situation before
a decision is made).
7
Publ. No. 1557978 Rev. a155 – ENGLISH (EN) – February 6, 2006 27
Page 42

7 – Introduction to thermographic inspections of electrical installations
7.4 Reporting
Nowadays, thermographicinspections of electrical installationsare probably, without
exception, documentedand reportedby theuse ofa reportprogram. Theseprograms,
which differ from one manufacturer to another, are usually directly adapted to the
cameras and will thus make reporting very quick and easy.
The program, which has been used for creating the report page shown below, is
called ThermaCAM™Reporter. It isadapted toseveral typesof infrared cameras from
FLIR Systems.
A professional report is often divided into two sections:
■ Front pages, with facts about the inspection, such as:
Who the client is, for example, customer’s company name and contact person
□
Location of the inspection: site address, city, and so on
□
Date of inspection
□
Date of report
□
Name of thermographer
□
7
Signature of thermographer
□
Summary or table of contents
□
■ Inspection pages containing IR images to document and analyze thermal properties
or anomalies.
Identification of the inspected object:
□
What is the object: designation, name, number, and so on
■
Photo
■
IR image. When collecting IR images there are some details to consider:
□
Optical focus
■
Thermal adjustment of the scene or the problem (level & span)
■
Composition: proper observation distance and viewing angle.
■
Comment
□
Is there an anomaly or not?
■
Is there a reflection or not?
■
Use a measurement tool—spot, area or isotherm—to quantify the problem.
■
Use the simplest tool possible; a profile graph is almost never needed in
electrical reports.
28 Publ. No. 1557978 Rev. a155 – ENGLISH (EN) – February 6, 2006
Page 43

10713603;a3
7 – Introduction to thermographic inspections of electrical installations
7
Figure 7.10 A report example
Publ. No. 1557978 Rev. a155 – ENGLISH (EN) – February 6, 2006 29
Page 44

7 – Introduction to thermographic inspections of electrical installations
7.5 Different types of hot spots in electrical installations
7.5.1 Reflections
The thermographiccamera sees any radiation that enters the lens, not only originating
from the object that you are looking at, but also radiation that comes from other
sources andhas beenreflected by the target. Most of the time, electrical components
are like mirrors to the infrared radiation, even if it is not obvious to the eye. Bare
metal parts are particularly shiny, whereas painted, plastic or rubber insulated parts
are mostly not. In the image below, you can clearly see a reflection from the thermographer. This is of course not a hot spot on the object. A good way to find out if what
you see is a reflection or not, is for you to move. Look at the target from a different
angle and watch the ‘hot spot.’ If it moves when you do, it is a reflection.
Measuring temperature of mirror like details is not possible. The object in the images
below has painted areas which are well suited for temperature measurement. The
material is copper, which is a very good heat conductor. This means that temperature
variation over the surface is small.
10717503;a2
7
Figure 7.11 Reflections in an object
7.5.2 Solar heating
The surface of a component with a high emissivity, for example, a breaker, can on a
hot summer day be heated up to quite considerable temperatures by irradiation from
the sun. The image shows a circuit breaker, which has been heated by the sun.
30 Publ. No. 1557978 Rev. a155 – ENGLISH (EN) – February 6, 2006
Page 45

7 – Introduction to thermographic inspections of electrical installations
10713803;a3
Figure 7.12 An infrared image of a circuit breaker
7.5.3 Inductive heating
10713903;a3
Figure 7.13 An infrared image of hot stabilizing weights
Eddy currents can cause a hot spot in the current path. In cases of very high currents
and close proximity of other metals, this has in some cases caused serious fires. This
type of heating occurs in magnetic material around the current path, such as metallic
bottom plates for bushing insulators. In the image above, there arestabilizing weights,
through which a high current is running. These metal weights, which are made of a
slightly magnetic material, will not conduct any current but are exposed to the alternating magnetic fields, which will eventually heat up the weight. The overheating in
the image is less than +5°C (+9°F). This, however, need not necessarily always be
the case.
7
7.5.4 Load variations
3-phase systems are the norm in electric utilities. When looking foroverheated places,
it is easy to compare the three phases directly with each other, for example, cables,
breakers, insulators. An even load per phase should result in a uniform temperature
pattern forall threephases. Afault maybe suspectedin caseswhere the temperature
of onephase differs considerably from the remaining two. However, you should always
make sure that the load is indeed evenly distributed. Looking at fixed ampere meters
or using a clip-on ampere meter (up to 600 A) will tell you.
Publ. No. 1557978 Rev. a155 – ENGLISH (EN) – February 6, 2006 31
Page 46

7 – Introduction to thermographic inspections of electrical installations
10714003;a3
Figure 7.14 Examples of infrared images of load variations
The image to the left shows three cables next to each other. They are so far apart that
they can be regarded as thermally insulated from each other. The one in the middle
is colder than the others. Unless two phases arefaulty and overheated, this is a typical
example of a very unsymmetrical load. The temperature spreads evenly along the
cables, which indicates a load-dependent temperature increase rather than a faulty
connection.
The image to the right shows two bundles with very different loads. In fact, the bundle
7
to the right carries next to no load. Those which carry a considerable current load,
are about 5°C (9°F) hotter than those which do not. No fault to be reported in these
examples.
7.5.5 Varying cooling conditions
10714103;a3
Figure 7.15 An infrared image of bundled cables
When, for example, a number of cables are bundled together it can happen that the
resulting poorcooling of the cables in the middle can lead to them reaching very high
temperatures. See the image above.
The cables to the right in the image do not show any overheating close to the bolts.
In the vertical part of the bundle, however, the cables are held together very tightly,
the cooling of the cables is poor, the convection can not take the heat away, and the
cables arenotably hotter, actually about 5°C (9°F) above the temperature ofthe better
cooled part of the cables.
32 Publ. No. 1557978 Rev. a155 – ENGLISH (EN) – February 6, 2006
Page 47

7 – Introduction to thermographic inspections of electrical installations
7.5.6 Resistance variations
Overheating can have many origins. Some common reasons are described below.
Low contact pressure can occur when mounting a joint, or through wear of the mate-
rial, for example, decreasing spring tension, worn threads in nuts and bolts, even too
much force applied at mounting. With increasing loads and temperatures, the yield
point of the material is exceeded and the tension weakens.
The image to the left below shows a bad contact due to a loose bolt. Since the bad
contact is of very limited dimensions, it causes overheating only in a very small spot
from which the heat is spread evenly along the connecting cable. Note the lower
emissivity ofthe screw itself, whichmakes it look slightly colder than the insulated—and
thereby it has a high emissivity—cable insulation.
The image to the right shows another overheating situation, this time again due to a
loose connection. It is an outdoor connection, hence it is exposed to the cooling effect
of the wind and it is likely that the overheating wouldhave showna higher temperature,
if mounted indoors.
10714203;a3
7
Figure 7.16 LEFT: An infrared image showing bad contact due to a loose bolt; RIGHT: A loose outdoor
connection, exposed to the wind cooling effect.
7.5.7 Overheating in one part as a result of a fault in another
Sometimes, overheating can appear in a component although that component is OK.
The reason is that two conductors share the load. One of the conductors has an increased resistance, but the other is OK. Thus, the faulty component carries a lower
load, whereas the fresh one has to take a higher load, which may be too high and
which causes the increased temperature. See the image.
Publ. No. 1557978 Rev. a155 – ENGLISH (EN) – February 6, 2006 33
Page 48

7 – Introduction to thermographic inspections of electrical installations
10714303;a3
Figure 7.17 Overheating in a circuit breaker
The overheating of this circuit breaker is most probably caused by bad contact in the
near finger of the contactor. Thus, the far finger carries more current and gets hotter.
The component in the infrared image and in the photo is not the same, however, it is
similar).
7
34 Publ. No. 1557978 Rev. a155 – ENGLISH (EN) – February 6, 2006
Page 49

7 – Introduction to thermographic inspections of electrical installations
7.6 Disturbance factors at thermographic inspection of electrical installations
During thermographic inspections of different types of electrical installations, disturbance factors such as wind, distance to object, rain or snow often influence the
measurement result.
7.6.1 Wind
During outdoorinspection, the cooling effect of the wind should be taken intoaccount.
An overheating measured at a wind velocity of 5 m/s (10 knots) will be approximately
twice as high at 1 m/s (2 knots). An excess temperature measured at 8 m/s (16 knots)
will be 2.5 times as high at 1 m/s (2 knots). This correction factor, which is based on
empirical measurements, is usually applicable up to 8 m/s (16 knots).
There are, however, cases when you have to inspect even if the wind is stronger than
8 m/s (16 knots). There are many windy places in the world, islands, mountains, and
so on but it is important to know that overheated components found would have
shown a considerably higher temperature at a lower wind speed. The empirical correction factor can be listed.
Correction factorWind speed (knots)Wind speed (m/s)
121
1.3642
7
1.6463
1.8684
2.06105
2.23126
2.40147
2.54168
The measured overheating multiplied by the correction factor gives the excess temperature with no wind, that is, at 1 m/s (2 knots).
7.6.2 Rain and snow
Rain and snow also have a cooling effect on electrical equipment. Thermographic
measurement can still be conducted with satisfactory results during light snowfall
with dry snow and light drizzle, respectively. The image qualitywill deteriorate in heavy
Publ. No. 1557978 Rev. a155 – ENGLISH (EN) – February 6, 2006 35
Page 50

7 – Introduction to thermographic inspections of electrical installations
snow or rain and reliable measurement is no longer possible. This is mainly because
a heavy snowfall as well as heavy rain is impenetrable to infrared radiation and it is
rather the temperature of the snowflakes or raindrops that will be measured.
7.6.3 Distance to object
This image is taken from a helicopter 20 meters (66 ft.) away from this faulty connection. The distance was incorrectly set to 1 meter (3 ft.) and the temperature was
measured to+37.9°C (+100.2°F).The measurementvalue afterchanging the distance
to 20 meters (66 ft.), which was done afterwards, is shown in the image to the right,
where the corrected temperature is +38.8°C (+101.8°F). The difference is not too
crucial, but may take the fault into a higher class of seriousness. So the distance
setting must definitely not be neglected.
10714403;a3
7
Figure 7.18 LEFT: Incorrect distance setting; RIGHT: Correct distance setting
The images below show the temperature readings from a blackbody at +85°C
(+185°F) at increasing distances.
10714503;a3
Figure 7.19 Temperature readings from a blackbody at +85°C (+185°F) at increasing distances
36 Publ. No. 1557978 Rev. a155 – ENGLISH (EN) – February 6, 2006
Page 51

7 – Introduction to thermographic inspections of electrical installations
The measured average temperatures are, from left to right, +85.3°C
(+185.5°F),+85.3°C (+185.5°F), +84.8°C (+184.6°F), +84.8°C (+184.6°F), +84.8°C
(+184.6°F) and +84.3°C (+183.7°F) from a blackbody at +85°C (+185°F). The thermograms are taken with a 12° lens. The distances are 1, 2, 3, 4, 5 and 10 meters (3,
7, 10, 13, 16 and 33 ft.). The correction for the distance has been meticulously set
and works, because the object is big enough for correct measurement.
7.6.4 Object size
The second series of images below shows the same but with the normal 24° lens.
Here, the measured average temperatures of the blackbody at +85°C (+185°F) are:
+84.2°C (+183.6°F), +83.7°C (+182.7°F), +83.3°C (+181.9°F), +83.3°C(+181.9°F),
+83.4°C (+181.1°F) and +78.4°C (+173.1°F).
The last value, (+78.4°C (+173.1°F)), is the maximum temperature as it was not
possible to place a circle inside the now very small blackbody image. Obviously, it
is not possible to measure correct values if the object is too small. Distance was
properly set to 10 meters (33 ft.).
10714603;a3
7
Figure 7.20 Temperature readings from ablackbody at +85°C (+185°F) atincreasing distances (24° lens)
The reason for this effect is that there is a smallest object size, which gives correct
temperature measurement. This smallest size is indicated to the user in all FLIR Systems cameras. The image below shows what you see in the viewfinder of camera
model 695. The spot meter has an opening in its middle,more easily seen in the detail
to the right. The size of the object hasto be bigger than that opening or some radiation
from its closest neighbors, which are much colder, will come into the measurement
as well, strongly lowering the reading. In the above case, where we have a pointshaped object, which is much hotter than the surroundings, the temperature reading
will be too low.
Publ. No. 1557978 Rev. a155 – ENGLISH (EN) – February 6, 2006 37
Page 52

7 – Introduction to thermographic inspections of electrical installations
10714703;a3
Figure 7.21 Image from the viewfinder of a ThermaCAM 695
This effect is due to imperfections in the opticsand to the size of the detector elements.
It is typical for all infrared cameras and can not be avoided.
7
38 Publ. No. 1557978 Rev. a155 – ENGLISH (EN) – February 6, 2006
Page 53

7 – Introduction to thermographic inspections of electrical installations
7.7 Practical advice for the thermographer
Working in a practical way with a camera, you will discover small things that make
your job easier. Here are ten of them to start with.
7.7.1 From cold to hot
You have been out with the camera at +5°C (+41°F). To continue your work, you
now have to perform the inspection indoors. If you wear glasses, you are used to
having towipe offcondensed water, or you will not be able to see anything. The same
thing happens with the camera. To measure correctly, you should wait until the
camera has become warm enough for the condensation to evaporate. This will also
allow for the internal temperature compensation system to adjust to the changed
condition.
7.7.2 Rain showers
If it starts raining you should not perform the inspection because the water will drastically change the surface temperature of the object that you are measuring. Nevertheless, sometimes you need to use the camera even under rain showers or splashes.
Protect your camera with a simple transparent polyethylene plastic bag. Correction
for the attenuation which is caused by the plastic bag can be made by adjusting the
object distance until the temperature reading is the same as without the plastic cover.
Some camera models have a separate External optics transmission entry.
7
7.7.3 Emissivity
You have to determine the emissivity for the material, which you are measuring.
Mostly, you will not find the value in tables. Use optical black paint, that is, Nextel
Black Velvet. Paint a small piece of the material you are working with. The emissivity
of the optical paint is normally 0.94. Remember that the object has to have a temperature, which is different—usually higher—than the ambient temperature. The larger
the difference the better the accuracy in the emissivity calculation. The difference
should be at least 20°C (36°F). Remember that there are other paints that support
very high temperatures up to +800°C (+1472°F). The emissivity may, however, be
lower than that of optical black.
Sometimes you can not paint the object that you are measuring. In this case you can
use a tape. A thin tape for which you have previously determined the emissivity will
work in most cases and you can remove it afterwards without damaging the object
of your study. Pay attention to the fact that some tapes are semi-transparent and thus
are not very good for this purpose. One of the best tapes for this purpose is Scotch
electrical tape for outdoor and sub-zero conditions.
Publ. No. 1557978 Rev. a155 – ENGLISH (EN) – February 6, 2006 39
Page 54

7 – Introduction to thermographic inspections of electrical installations
7.7.4 Reflected apparent temperature
You are in a measurement situation where thereare several hot sources that influence
your measurement. You need to have the right value for the reflected apparent temperature to input into the camera and thus get the best possible correction. Do it in
this way: set the emissivity to 1.0. Adjust the camera lens to near focus and, looking
in the opposite direction away from the object, save one image. With the area or the
isotherm, determine the most probable value of the average of the image and use
that value for your input of reflected apparent temperature.
7.7.5 Object too far away
Are you in doubt that the camera you have is measuring correctly at the actual distance? A rule of thumb for your lens is to multiply the IFOV by 3. (IFOV is the detail
of the object seen by one single element of the detector). Example: 25 degrees correspond to about 437 mrad. If your camera has a 120 × 120 pixel image, IFOV becomes 437/120 = 3.6 mrad (3.6 mm/m) and your spot size ratio is about
1000/(3 × 3.6)=92:1. This means that at a distance of 9.2 meters(30.2 ft.), your target
has to be at least about 0.1 meter or 100 mm wide (3.9"). Try to work on the safe side
by coming closer than 9 meters (30 ft.). At 7–8 meters (23–26 ft.), your measurement
7
should be correct.
40 Publ. No. 1557978 Rev. a155 – ENGLISH (EN) – February 6, 2006
Page 55

8 Tutorials
8.1 Switching on & switching off the camera
ActionStep
1
3
Insert a battery into the battery compartment.
For information about inserting a battery, see section 8.6.6 – Inserting & removing
the battery on page 50.
Briefly press the green ON/OFF button to switch on the camera.2
Press and hold down the green on/off button for a few seconds to switch off the
camera.
For information about buttons, see section 9.2 – Keypad buttons & functions on page
60.
8
Publ. No. 1557978 Rev. a155 – ENGLISH (EN) – February 6, 2006 41
Page 56

8 – Tutorials
8.2 Working with images & folders
8.2.1 Acquiring an image
ActionStep
Briefly press the green ON/OFF button to switch on the camera.1
Point the camera at a warm object, like a face or a hand.2
Press and hold down the A button for one second to adjust the focus.3
Briefly press the A button to autoadjust the camera.4
8.2.2 Opening an image
ActionStep
Press the joystick to display the horizontal menu bar.1
Point to Images on the File menu and press the joystick.2
Select the image you want to open by moving the joystick up/down or left/right.3
To recall a selected image, press the joystick.4
For more information about opening images, see section 10.2.2.1 – Images on page
8
68.
8.2.3 Deleting one or several images
ActionStep
Press the joystick to display the horizontal menu bar.1
Point to Images on the File menu and press the joystick.2
Move the joystick up/down or left/right to select the image you want to delete.3
Press and hold down the joystick for two seconds to display a shortcut menu.4
5
On the shortcut menu, select Delete or Delete all images to delete one or several
images.
8.2.4 Navigating in folders
ActionStep
Press the joystick to display the horizontal menu bar.1
Point to Images on the File menu and press the joystick.2
42 Publ. No. 1557978 Rev. a155 – ENGLISH (EN) – February 6, 2006
Page 57

8 – Tutorials
ActionStep
3
Do one of the following:
To go up on level, select the symbol to the left below, and press the joystick.
■
To go down one level, select the symbol to the right below, and press the joy-
■
stick.
10726403;a2
Figure 8.1 LEFT: Folder symbol to go up one level; RIGHT: Folder symbol to
down one level
8.2.5 Create a new folder
ActionStep
Press the joystick to display the horizontal menu bar.1
Point to Images on the File menu and press the joystick.2
3
5
Move the joystick up/down or left/right to any position in a directory where you
want to create a new folder.
Press and hold down the joystick for two seconds to display a shortcut menu.4
On the shortcut menu,select Create new folder to create a new folderat thecurrent
level.
8.2.6 Freezing & unfreezing an image
8
ActionStep
Press and hold down the A button for one second to adjust the focus.1
Briefly press the A button to autoadjust the camera.2
3
Briefly press the S button to freeze the image. To unfreeze the image, press the
S button once again.
8.2.7 Saving an image
ActionStep
Press and hold down the A button for one second to adjust the focus.1
Briefly press the A button to autoadjust the camera.2
Publ. No. 1557978 Rev. a155 – ENGLISH (EN) – February 6, 2006 43
Page 58

8 – Tutorials
ActionStep
3
Do one of the following:
Press and hold down the S button for a few seconds to save the image
■
Point to Save on the File menu and press the joystick
■
For more information about saving images, see section 10.2.2.2 – Save on page 69.
8.3 Working with measurements
8.3.1 Creating & changing an isotherm
ActionStep
Press the joystick to display the horizontal menu bar.1
2
For more information about creating & changing an isotherm, see section 10.2.3.3 –
8
Add isotherm on page 71.
Point to Add isotherm on the Analysis menu and press the joystick. An isotherm
will nowbe added toyourimage. The isothermlevels will be displayedin the result
table in the top right corner of the screen.
You are now in edit mode and can change the isotherm levels by moving the joystick up/down. To leave the edit mode, press the C button twice. You can also
leave the edit mode by holding down the joystick for a few seconds, which will
display a shortcut menu.
44 Publ. No. 1557978 Rev. a155 – ENGLISH (EN) – February 6, 2006
Page 59

8.4 Changing level & span
8.4.1 Changing the level
ActionStep
Press the joystick to display the horizontal menu bar.1
8 – Tutorials
2
3
If the camera is in continuous adjust mode, point to Manual adjust on the Image
menu and press the joystick.
Change the level by moving the joystick up/down. An arrow pointing upwards or
downwards will be displayed.
Press the joystick to leave level/span mode.4
➲ You can also change the level by pointing to Level/Span on the Image menu, and
then change the level by moving the joystick up/down.
For more information about level, see section 10.2.4.3 – Level/Span on page 75.
8.4.2 Changing the span
ActionStep
Press the joystick to display the horizontal menu bar.1
2
3
If the camera is in continuous adjust mode, point to Manual adjust on the Image
menu and press the joystick.
Change the span by moving the joystick left/right. Two arrows pointing away from
each other or towards each other will be displayed.
Press the joystick to leave level/span mode.4
➲ You can also change the span by pointing to Level/Span on the Image menu, and
then change the span by moving the joystick left/right.
For more information about span, see section 10.2.4.3 – Level/Span on page 75.
8
Publ. No. 1557978 Rev. a155 – ENGLISH (EN) – February 6, 2006 45
Page 60

8 – Tutorials
8.5 Changing system settings
8.5.1 Changing the language
ActionStep
Press the joystick to display the horizontal menu bar.1
Point to Local settings on the Setup menu and press the joystick.2
Move the joystick up/down to select Language.3
Move the joystick left/right to change the language.4
5
Press the joystick to confirm your changes and leave the dialog box.
➲ Changing the language will make the camera restart the camera program. This
will take a few seconds.
8.5.2 Changing the temperature unit
ActionStep
Press the joystick to display the horizontal menu bar.1
Point to Local Settings on the Setup menu and press the joystick.2
8
Move the joystick up/down to select Temp unit.3
Move the joystick left/right to change the temperature unit.4
Press the joystick to confirm your changes and leave the dialog box.5
8.5.3 Changing the date format
ActionStep
Press the joystick to display the horizontal menu bar.1
Point to Local Settings on the Setup menu and press the joystick.2
Move the joystick up/down to select Date format.3
Move the joystick left/right to change the date format.4
Press the joystick to confirm your changes and leave the dialog box.5
8.5.4 Changing the time format
ActionStep
Press the joystick to display the horizontal menu bar.1
Point to Local Settings on the Setup menu and press the joystick.2
Move the joystick up/down to select Time format.3
46 Publ. No. 1557978 Rev. a155 – ENGLISH (EN) – February 6, 2006
Page 61

ActionStep
Move the joystick left/right to change the time format.4
Press the joystick to confirm your changes and leave the dialog box.5
8.5.5 Changing date & time
ActionStep
Press the joystick to display the horizontal menu bar.1
Point to Date/time on the Setup menu and press the joystick.2
Move the joystick up/down to select year, month, day, minute and second.3
Move the joystick left/right to change each parameter.4
Press the joystick to confirm your changes and leave the dialog box.5
8 – Tutorials
8
Publ. No. 1557978 Rev. a155 – ENGLISH (EN) – February 6, 2006 47
Page 62

8 – Tutorials
8.6 Working with the camera
8.6.1 Mounting an additional lens
➲ Before trying to remove fingerprints or other marks on the lens elements, see section
14.2 – Lenses on page 93.
10592203;a1
Figure 8.2 Mounting an additional lens
ActionStep
1
8
2
Make sure the index mark on the IR lens is lined up with the index mark on the
camera.
Carefully push the lens into the lens recess.
➲ Do not use excessive force.
Rotate the lens 30° clock-wise.3
48 Publ. No. 1557978 Rev. a155 – ENGLISH (EN) – February 6, 2006
Page 63

8 – Tutorials
8.6.2 Camera setup when using the Protective Window (P/N 1 194 977)
The protective window (P/N 1 194 977) contains an optical material that affects the
transmission of infrared radiation to the FPA detector inside the camera. This means
that you have to specify a temperature and a transmission value for external optics
in the camera software for P and S series cameras.
Follow this procedure to enter the temperature and transmission value for external
optics:
ActionStep
Point to Analysis on the menu bar and press the joystick.1
Point to Object param and press the joystick.2
Set External optics to On.3
4
5
Enter a transmission value of 0.83 in the Optics transmission text box by moving
the joystickleft/right. This valuehasbeen measured atFLIR Systems AB, Sweden.
Enter an external temperature for the lens in the Optics temperature text box by
moving the joystick left/right. Usually, this temperature is the same temperature
as the camera’s ambient temperature.However, in some situations –such as when
looking at very hot targets – the temperature can be considerably higher.
Press the joystick to confirm the changes and leave the dialog box.6
8.6.3 Focusing the camera using autofocus
ActionStep
Press the green ON/OFF button to switch on the camera.1
2
Press and hold down the A button forone secondto adjust the focus. An indicator
will be displayed on the left side of the screen when focusing.
8.6.4 Focusing the camera manually
ActionStep
Press the green ON/OFF button to switch on the camera.1
2
Adjust the focus by moving the joystick up/down. An indicator will be displayed
on the left side of the screen when focusing.
8.6.5 Using the electronic zoom
ActionStep
8
Press the green ON/OFF button to switch on the camera.1
Publ. No. 1557978 Rev. a155 – ENGLISH (EN) – February 6, 2006 49
Page 64

8 – Tutorials
ActionStep
2
Adjust the zoom factor by moving the joystick left/right. An indicator will be displayed on the left side of the screen when zooming.
8.6.6 Inserting & removing the battery
➲ The camera is shipped with charged batteries. To increase battery life, the battery
should be fully discharged and charged a couple of times. You can do this by using
the camera until the battery is fully depleted.
8.6.6.1 Inserting the battery
10592303;a1
8
Figure 8.3 Inserting the battery
ActionStep
Open the lid of the battery compartment by pressing its locking mechanism.1
Push the battery intothe battery compartmentuntil thebattery release springlocks.2
Close the lid of the battery compartment.3
8.6.6.2 Removing the battery
10592403;a1
Figure 8.4 Removing the battery
50 Publ. No. 1557978 Rev. a155 – ENGLISH (EN) – February 6, 2006
Page 65

8 – Tutorials
ActionStep
Open the lid of the battery compartment by pressing its locking mechanism.1
The battery release spring will push out the batteryfrom thebattery compartment.2
Close the lid of the battery compartment.3
For more information about the battery system, see section 12 – Electrical power
system on page 85.
8
Publ. No. 1557978 Rev. a155 – ENGLISH (EN) – February 6, 2006 51
Page 66

8 – Tutorials
8
52 Publ. No. 1557978 Rev. a155 – ENGLISH (EN) – February 6, 2006
INTENTIONALLY LEFT BLANK
Page 67

9 Camera overview
9.1 Camera parts
10592503;a1
9
Figure 9.1 Camera parts, 1
Description of partCallout
1
2
Publ. No. 1557978 Rev. a155 – ENGLISH (EN) – February 6, 2006 53
+/– buttons
For moreinformation about thefunctionality of thisbutton, see section9.2 –Keypad
buttons & functions on page 60.
F1 button
For moreinformation about thefunctionality of thisbutton, see section9.2 –Keypad
buttons & functions on page 60.
Page 68

9 – Camera overview
Description of partCallout
3
4
F2 button
For moreinformation about thefunctionality of thisbutton, see section9.2 –Keypad
buttons & functions on page 60.
Camera status LCD
For more information about the LCD, see section 9.4 – Camera status LCD on
page 62.
Connector for remote control5
Viewfinder6
9
54 Publ. No. 1557978 Rev. a155 – ENGLISH (EN) – February 6, 2006
Page 69

10592703;a1
9 – Camera overview
Figure 9.2 Camera parts, 2
Description of partCallout
1
C button
For more information about the C button, see section 9.2 – Keypad buttons &
functions on page 60.
Lid of the battery compartment2
3
S button
For more information about the S button, see section 9.2 – Keypad buttons &
functions on page 60.
4
A button
For more information about the A button, see section 9.2 – Keypad buttons &
functions on page 60.
Hand strap5
RS-232/USB connector6
Publ. No. 1557978 Rev. a155 – ENGLISH (EN) – February 6, 2006 55
9
Page 70

9 – Camera overview
Description of partCallout
Not implemented.7
Lens8
9
56 Publ. No. 1557978 Rev. a155 – ENGLISH (EN) – February 6, 2006
Page 71

10592803;a1
9 – Camera overview
Figure 9.3 Camera parts, 3
Description of partCallout
Cover for additional connectors1
2
Joystick
For more information about the joystick, see section 9.2 – Keypad buttons &
functions on page 60.
3
ON/OFF button (green)
For more information about the ON/OFF button, see section 9.2 – Keypad buttons
& functions on page 60.
Not implemented.4
Publ. No. 1557978 Rev. a155 – ENGLISH (EN) – February 6, 2006 57
9
Page 72

9 – Camera overview
10394603;a4
9
Figure 9.4 Camera parts, 4
Description of partCallout
Spring-loaded locking latch for the remote control1
58 Publ. No. 1557978 Rev. a155 – ENGLISH (EN) – February 6, 2006
Page 73

9 – Camera overview
Description of partCallout
2
Laser LocatIR with lens cap
➲ Please note the following:
A laser icon appears on the screen when the Laser LocatIR is switched on.
■
Since the distance between the laser beam and the image center will vary by
■
the target distance, LaserLocatIR should onlybe used asan aimingaid. Always
check the LCD to make sure the camera captures the desired target.
Do not look directly into the laser beam.
■
When not in use, the Laser LocatIR should always be protected by the lens
■
cap.
For more information about Laser LocatIR, see section 9.5 – Laser LocatIR on
page 63.
3
Button for Laser LocatIR
For more information about Laser LocatIR, see section 9.5 – Laser LocatIR on
page 63.
Not implemented.4
9
Publ. No. 1557978 Rev. a155 – ENGLISH (EN) – February 6, 2006 59
Page 74

9 – Camera overview
9.2 Keypad buttons & functions
Figure 9.5 Camera buttons – explanations
CommentsButton
ON/OFF
A
S
Press briefly to switch on the camera
■
Press and hold down for a few seconds to switch off the camera
■
Press briefly to autoadjust the camera
■
Press and hold down for a few seconds autofocus the camera
■
Press briefly to freeze an image
■
Press briefly to store an image if the image is currently frozen
■
Press and hold down for a few seconds to store without freezing
■
the image
Press to move between panes in some dialog boxes
■
Press to leave freeze mode and go to live mode
■
C
Press to leave dialog boxes without changing any settings
■
Press twice to leave edit mode
■
If the camera is in manual adjust mode, press to change the
■
function of the joystick to level (up/down) and span (left/right)
Joystick
Press to display the menu system
■
Press to exit the menu system
■
Press to confirm selections and leave dialog boxes
■
Press to select measurement markers
■
Move up/down or left/right to navigate in menus, dialog boxes,
■
and on the screen
Move up/down to change focus and left/right to zoom
9
■
If the camera is in manual adjust mode, press C to change the
■
function of the joystick to level (up/down) and span (left/right)
Press + or – to focus+/–
Press to autoadjustF1
Change paletteF2
Press to switch on Laser LocatIRButton for Laser LocatIR
60 Publ. No. 1557978 Rev. a155 – ENGLISH (EN) – February 6, 2006
Page 75

9 – Camera overview
9.3 Autofocus
To focus the camera using the autofocus feature, press and hold down the A button
for one second.
➲ Please note the following:
■ The area that the camera uses when autofocusing is a 80 × 60 pixel box, centered
vertically and horizontally on the screen
■ The camera will have difficulties autofocusing when the image has low contrasts
between different areas
■ You should keep the camera steady when autofocusing
Publ. No. 1557978 Rev. a155 – ENGLISH (EN) – February 6, 2006 61
9
Page 76

9 – Camera overview
9.4 Camera status LCD
The camera status LCD on the left side of the camera displays information about
battery status, communication status, memory status etc.
10346003;a3
Figure 9.6 Camera status LCD
Figure 9.7 Camera status LCD – explanations
CommentsCallout
1
9
2
Battery status bar. The frame around the battery status bar is switched on when
a battery is inserted.
All segments switched on = fully charged battery
■
All segments switched off = empty battery or no battery inserted
■
Battery indicator. Switched onif a batteryis inserted,flashing if thebattery is being
charged internally.
CompactFlash card indicator. Switched on if a CompactFlash card is inserted.3
4
CompactFlash status bar:
All segments switched on = the card is empty
■
All segments switched off = the card is full
■
Not implemented.5
Communication indicator. Switched on when a communication link is active.6
7
Power indicator:
Both segments switched on when the camera is switched on
■
Both segments switched off when the camera is switched off
■
The outer segment flashing when the camera is in ‘deep sleep’
■
External power indicator. Switched on when the camera is externally powered.8
62 Publ. No. 1557978 Rev. a155 – ENGLISH (EN) – February 6, 2006
Page 77

9 – Camera overview
9.5 Laser LocatIR
The ThermaCAM™ P25 infrared camera features a laser pointer located at the front
of the camera handle. To display the laser dot, press the Laser LocatIR button on left
side of the handle. The laser dot will appear approx. 91 mm/3.6" above the target.
➲ Please note the following:
■ A laser icon appears on the screen when the Laser LocatIR is switched on.
■ Since the distance between the laser beam and the image center will vary by the
target distance,Laser LocatIR should only be used as an aiming aid. Alwayscheck
the LCD to make sure the camera captures the desired target.
■ Do not look directly into the laser beam.
■ When not in use, the Laser LocatIR should always be protected by the lens cap.
10376403;a2
Figure 9.8 Wavelength: 635 nm. Max. output power: 1 mW. This product complies with 21 CFR 1040.10
and 1040.11 except for deviations pursuant to Laser Notice No. 50, dated July 26th, 2001
10395103;a3
Figure 9.9 Distance between the laser beam and the image center
Publ. No. 1557978 Rev. a155 – ENGLISH (EN) – February 6, 2006 63
9
Page 78

9 – Camera overview
INTENTIONALLY LEFT BLANK
9
64 Publ. No. 1557978 Rev. a155 – ENGLISH (EN) – February 6, 2006
Page 79

10 Camera program
10.1 Screen objects
10.1.1 Result table
The results of measurement markers are displayed in a result table in the top righthand corner of the screen.
Figure 10.1 Explanation of measurement markers appearing in the result table
ExplanationIcon
Spot
1
1
1
✴
Isotherm 1, above
Isotherm 1, below
Isotherm 1, interval
The ✴ symbol indicates uncertain result due to an internal updating process after
the range has been changed or the camera has been started. The symbol disappears after 15 seconds.
10.1.2 Status bar
10388403;a2
Figure 10.2 Status bar, showing atmospheric temperature, relative humidity, distance to target, zoom
factor, date & time, temperature range, emissivity, and reflected ambient temperature.
Information aboutan image and the current conditions appear on the first and second
bottom lines of the screen. If text comments are attached to an image file, they are
displayed above these two lines.
➲ If you enter an emissivity value less than 0.30 the emissivity box will begin flashing
to remind you that this value is unusually low.
10
Publ. No. 1557978 Rev. a155 – ENGLISH (EN) – February 6, 2006 65
Page 80

10 – Camera program
10.1.3 Temperature scale
10388503;a2
Figure 10.3 Temperature scale
The temperature scale is displayed on the right-hand side of the screen. The scale
shows how the colors are distributed along the various temperatures in the image,
with high temperatures at the upper end and low temperatures at the lower end.
10.1.4 System messages
10.1.4.1 Status messages
Status messages are displayed at the bottom of the screen, or in the top left part of
the screen. Here you will find information about the current status of the camera, etc.
Figure 10.4 Status messages – a few examples
ExplanationMessage
Message is displayed when the image is frozen.Frozen
Manual
10
Restarting
Message isdisplayedwhen the camera iscurrentlyin manual adjust
mode.
Message is displayed when the software is restarted, i.e. after Fac-
tory default.
Message is displayed while an image is being saved.Saving as
10.1.4.2 Warning messages
Warning messages are displayed in the center of the screen. Here you will find important information about battery status, etc.
Figure 10.5 Critical camera information – a few examples
ExplanationMessage
The battery level is below a critical level.Battery low
The camera will be switched off immediately.Shutting down
The camera will be switched off in 2 seconds.Shutting down in 2 seconds
66 Publ. No. 1557978 Rev. a155 – ENGLISH (EN) – February 6, 2006
Page 81

10 – Camera program
10.2 Menu system
10.2.1 Navigating in the menu system
■ Press the joystick to display the horizontal menu bar
■ Press the joystick to confirm selections in menus and dialog boxes
■ Press the C button to exit the menu system
■ Press the C button to cancel selections in menus and dialog boxes
■ Move the joystick up/down to move up/down in menus, submenus and dialog
boxes
■ Move the joystickright/left tomove right/leftin menus and submenus, and to change
values in dialog boxes
Publ. No. 1557978 Rev. a155 – ENGLISH (EN) – February 6, 2006 67
10
Page 82

10 – Camera program
10.2.2 File menu
10.2.2.1 Images
10565503;a1
Figure 10.6 Images folder
Point to Images and press the joystick to display a thumbnail view of the files on the
CompactFlash® card. The following files are displayed:
■ infrared images
10565603;a4
10
Figure 10.7 Images folder, showing the context menu
In the Images folder you can do the following:
68 Publ. No. 1557978 Rev. a155 – ENGLISH (EN) – February 6, 2006
Page 83

10 – Camera program
■ Open an imageby selectingthe image using the joystick, then pressing the joystick.
For more information, see see section 8.2.2 – Opening an image on page 42.
■ Create a new folder by selecting an image, then pressing and holding down the
joystick, and selecting Create new folder. For more information, see see section
8.2.5 – Create a new folder on page 43.
■ Delete an image by selecting the image, then pressing and holding down the joy-
stick, and selecting Delete. For more information, see see section 8.2.3 – Deleting
one or several images on page 42.
■ Delete all images by selecting an image, then pressing and holding down the joy-
stick, and selecting Delete all. For more information, see see section 8.2.3 –
Deleting one or several images on page 42.
■ Navigate in folders. For more information, see see section 8.2.4 – Navigating in
folders on page 42.
10.2.2.2 Save
Point to Save and press the joystick to save the displayed image to the CompactFlash
card.
For more information about saving images, see section 10.2.5.2 – Save on page 78.
Publ. No. 1557978 Rev. a155 – ENGLISH (EN) – February 6, 2006 69
10
Page 84

10 – Camera program
10.2.3 Analysis menu
10.2.3.1 Edit mode
Point to Edit mode and press the joystick to enter the edit mode of the camera. When
the camera is in edit mode you can select the fixed spot or the isotherm and change
the settings for these measurement markers. You leave edit mode by pressing the C
button.
10.2.3.2 Changing the settings for the fixed spot
Press and hold down the joystick for one second when the spot is selected to display
a shortcut menu.
10569003;a2
Figure 10.8 Shortcut menu for Spot
Figure 10.9 Explanations of the shortcut menu for Spot
ExplanationCommand
Point to Delete and press the joystick to delete the spot.Delete
Point to Exit edit mode and press the joystick to exit the edit mode.Exit edit mode
See below.Settings
Point to Settings and press the joystick to display a Spot settings dialog box where
you can change the settings for the spot.
10
10569103;a2
Figure 10.10 Spot dialog box
Figure 10.11 Explanations of the Spot dialog box
CommentsValueLabel
Local
On
■
Off
■
Select On to set the emissivity, the reflected temperature, and the distance for this spot only.
Selecting On will also assign an asterisk to the
measurement marker’s label.
70 Publ. No. 1557978 Rev. a155 – ENGLISH (EN) – February 6, 2006
Page 85

10 – Camera program
CommentsValueLabel
Emissivity
User-defined
(0.01–1.00)
User-definedT Reflected
User-definedDistance
You can set the Emissivity if Local is enabled. If
not, this option will be shaded.
➲ If you enter an emissivity value less than 0.30
the emissivity box will begin flashing to remind you
that this value is unusually low.
You can set T Reflected if Local is enabled. If not,
this option will be shaded.
You can set Distance if Local is enabled. If not,
this option will be shaded.
10.2.3.3 Add isotherm
The isotherm command colors all pixels with a temperature above, below or between
one or more preset temperature levels.
10390903;a2
Figure 10.12 Temperature scale showing an isotherm set to above +62 °C
Point to Add isotherm and press the joystick to add an isotherm. An isotherm has
now be added to your image. Press and hold down the joystick for one second when
the isotherm (in the temperature scale) is selected to display a shortcut menu.
Publ. No. 1557978 Rev. a155 – ENGLISH (EN) – February 6, 2006 71
10
Page 86

10 – Camera program
10391203;a3
Figure 10.13 Shortcut menu for Isotherm
Figure 10.14 Explanations of the Isotherm shortcut menu
ExplanationCommand
Point to Delete and press the joystick to delete the isotherm.Delete
Point to Exit edit mode and press the joystick to exit the edit mode.Exit edit mode
Set as ref temp
Above
Below
Interval
Point to Settings and press the joystick to display an Isotherm settings dialog box
10
Point to Set as ref temp and press the joystick to use the isotherm
temperature as the reference temperature.
All pixels with a temperature higher than a set temperature will be
colored with the same preset isotherm color.
All pixels with a temperature lower than a set temperature will be
colored with the same preset isotherm color.
All pixels with a temperature within the set interval will be colored
with the same preset isotherm color.
See belowSettings
where you can change the settings for the isotherm.
72 Publ. No. 1557978 Rev. a155 – ENGLISH (EN) – February 6, 2006
Page 87

10397403;a3
Figure 10.15 Isotherm dialog box
Figure 10.16 Explanations of the Isotherm dialog box
10 – Camera program
CommentsValueLabel
Type
■
■
■
User-definedLevel
Interval
Above
Below
For an explanation of isotherm types, see above.
The temperature level in degrees Celsius (°C) or
degrees Fahrenheit (°F).
User-definedWidth
The temperature width in degrees Celsius (°C) or
degrees Fahrenheit (°F).
Color
The colors used for the isotherm.Configuration-depen-
dent
Attribute
Transparent
■
Solid
■
Selecting Transparent will add some transparency
to an isotherm color, making it easier for you to
see objects through the color.
To make the isotherm colors appear solid, select
Solid.
Label
On
■
Off
■
Selecting On will assign a label to the measurement marker (a small box with a number).
10.2.3.4 Remove all
Point to Remove all and press the joystick to remove all measurement functions and
markers from the screen.
10
Publ. No. 1557978 Rev. a155 – ENGLISH (EN) – February 6, 2006 73
Page 88

10 – Camera program
10.2.3.5 Obj par
10439303;a2
Figure 10.17 Object Parameters dialog box
You use this command to set the object parameters Emissivity, Distance, T Reflected,
T Atmosphere, Rel humidity, External optics, Optics transmission, and Optics
temperature. The parameters are selected by moving the joystick up/down and set
by moving the joystick left/right. These parameters settings will be used by all measurement functions that have not been set locally.
➲ Please note the following:
■ The emissivity file can be stored at root level or at directory level. However, the
camera software prioritizes files that are stored at directory level and the directory
has to be selected in order to store the emissivity file in the camera memory. If the
camera software does not find an emissivity file at directory level, it searches for
similar files at root level and saves those instead.
■ If you enter an emissivity value less than 0.30 the emissivity box will begin flashing
to remind you that this value is unusually low.
■ The transmission factor is applied to the signal and not to the temperature
10
For more information about object parameters, see section 18 – Thermographic
measurement techniques on page 125.
10.2.3.6 Deactivate local par.
Point to Deactivate local par. and press the joystick to delete all locally setparameters.
Locally set parameters are the parameters you set in e.g. the Spot settings dialog
box.
74 Publ. No. 1557978 Rev. a155 – ENGLISH (EN) – February 6, 2006
Page 89

10 – Camera program
10.2.4 Image menu
10.2.4.1 Freeze/Live
Point to Freeze/Live and press the joystick to switch between freeze image mode
and live image mode. It has the same effect as if you briefly press the S button.
10.2.4.2 Range
10391903;a6
Figure 10.18 Range dialog box
Point to Range and press the joystick to display a dialog box where you can set the
range.
10.2.4.3 Level/Span
Point to Level/Span and press the joystick to manually change level and span. The
level command can be regarded as the brightness, while the span command can be
regarded as the contrast.
■ Move the joystick up/down to change the level (indicated by an arrow pointing
upwards or downwards in the temperature scale)
■ Move the joystick left/right to change the span (indicated by two arrows pointing
away from each other or towards each other)
10392103;a3
Figure 10.19 Symbols in the temperature scale, indicating (1) increasing span; (2) decreasing span; (3)
increasing level, and (4) decreasing level
For more information about object parameters, see section 18 – Thermographic
measurement techniques on page 125.
10.2.4.4 Manual adjust / Continuous adjust
■ Point to Manual adjust and press the joystick to put the camera in manual adjust
mode. You can now change level and span by first pressing the C button repeatedly (to change the function of the joystick to level/span), and then change level
or span by moving the joystick up/down and left/right, respectively
Publ. No. 1557978 Rev. a155 – ENGLISH (EN) – February 6, 2006 75
10
Page 90

10 – Camera program
■ Point to Continuous adjust and press the joystick to put the camera in automatic
mode, continuously optimizing the image for best level and span
For more information about the Level/Span command, see section 10.2.4.3 – Level/Span on page 75.
10.2.4.5 Palette
10392003;a4
Figure 10.20 Palette dialog box
Point to Palette and press the joystick to display a dialog box where you can change
the color palette.
Figure 10.21 Explanations of the Palette dialog box
CommentsValueLabel
Palette
Inverted
dent
■
■
Yes
No
Move the joystick left/right to change the palette.Configuration-depen-
Move the joystick left/right to reverse the current
palette.
Custom palettes (*.pal) can be used by the camera. For more information about how
to create custom palettes, contact FLIR Systems.
10.2.4.6 Hide graphics
Point to Hide graphics and press the joystick to hide allon-screen graphics (e.g. result
table, status bar etc.). To display the graphics again, press the joystick or the C button.
10
76 Publ. No. 1557978 Rev. a155 – ENGLISH (EN) – February 6, 2006
Page 91

10 – Camera program
10.2.5 Setup menu
➲ Depending on camera configuration, some menu items on the Setup menu may
be displayed in a different order, or on a submenu.
10.2.5.1 Image
10568503;a2
Figure 10.22 Image Setup dialog box
Figure 10.23 Explanations of the Image Setup dialog box
CommentsValueLabel
Adjust method
Scale
Status bar
Saturation colors
Level
■
Level-span
■
On
■
Off
■
On
■
Off
■
On
■
Off
■
Move the joystick left/right to change the adjust
method.
These settings influence the image quality and
different settingsmay besuitable for differenttypes
of images and/or applications.
Move thejoystick left/right toenable or disablethe
scale.
Move thejoystick left/right toenable or disablethe
status bar.
Move thejoystick left/right toenable or disablethe
saturation colors.
If On is selected the areas that contain temperatures outside the present level/span settings are
colored with the saturation colors. The saturation
colors contain an ‘overflow’ color and an ‘underflow’ color.
There is also athird red saturation color thatmarks
everything saturatedby thedetector indicating that
the range should be changed.
10
Publ. No. 1557978 Rev. a155 – ENGLISH (EN) – February 6, 2006 77
Page 92

10 – Camera program
CommentsValueLabel
Noise reduction
On
■
Off
■
Adjust region
10.2.5.2 Save
10568203;a2
Figure 10.24 Save Setup dialog box
Figure 10.25 Explanations of the Save Setup dialog box
Image naming
Overlay
10
Unique counter
■
Date
■
Directory
■
On
■
Off
■
Move the joystick left/right to enable or disable
noise reduction.
When Noise reduction is set to On, the image
noise decreases and the image appears more
stable.
However, when the camera or the object moves,
and Noise reduction set to On, this may create
some image smearing.
Press the Adjust region button to display a region
on the screen thatwill be usedwhen autoadjusting
the camera.
CommentsValueLabel
For a detailed explanation, see below.
If On is selected, all on-screen graphics will be
■
saved together with the image
If Off is selected, only the image (together with
■
any temperature information) will be saved
➲ The difference between images saved with or
without on-screen graphics will only be evident
when looking at the images using a third-party
image viewer.
Figure 10.26 Naming based on unique counter – explanations
Typical syntax: IR_nnnn.jpg
IR = infrared imageIR
■
Unique counternnnn
IR_0003.jpgExample
78 Publ. No. 1557978 Rev. a155 – ENGLISH (EN) – February 6, 2006
Page 93

10 – Camera program
Comment
The counter will be reset when exceeding 9999,
or when you point to Factory default on the Setup
menu and press the joystick.
Figure 10.27 Naming based on current date – explanations
Typical syntax: IR_YYMMDD_nnn.jpg
IR = infrared imageIR
■
YYMMDD
Current date.The format dependson your settings
in the Local settings dialog box.
Counter within directorynnn
IR_020909_001.jpgExample
The counter will be reset every day.Comment
Figure 10.28 Naming based on current directory – explanations
Typical syntax: IR_DIRE_nnn.jpg
IR = infrared imageIR
■
The first four letters in the directory nameDIRE
Counter within directorynnn
IR_ COMP_003.jpgExample
10.2.5.3 Power
10392703;a3
Figure 10.29 Power Setup dialog box
Figure 10.30 Explanations of the Power Setup dialog box
CommentsValueLabel
Auto power off
■
■
None
10 min
Move the joystick left/right to specify the time after
which the camera will be switched off if it is not
used.
Display power off
LCD illumination
Publ. No. 1557978 Rev. a155 – ENGLISH (EN) – February 6, 2006 79
■
■
■
■
■
■
None
30 sec
60 sec
Low
Medium
High
Move the joystick left/right to specify the time after
which the display will be switched off if it is not
used.
Move the joystick left/right to specify the level of
background illumination of the LCD.
10
Page 94

10 – Camera program
➲ For protective reasons, the LCD will be switched off if the detector temperature
exceeds +60 °C (+149 °F) and the camera will be switched off if the detector temperature exceeds +68 °C (+154.4 °F)
10.2.5.4 Status bar
10392903;a3
Figure 10.31 Status bar dialog box
Figure 10.32 Explanations of the Status bar dialog box
CommentsValueLabel
10
Date/time
Distance
Emissivity
T Reflected
T Atmosphere
Relative humidity
Range
Lens
Zoom
On
■
Off
■
On
■
Off
■
On
■
Off
■
On
■
Off
■
On
■
Off
■
On
■
Off
■
On
■
Off
■
On
■
Off
■
On
■
Off
■
Move the joystick left/right to enable/disable this
label on the status bar.
Move the joystick left/right to enable/disable this
label on the status bar.
Move the joystick left/right to enable/disable this
label on the status bar.
Move the joystick left/right to enable/disable this
label on the status bar.
Move the joystick left/right to enable/disable this
label on the status bar.
Move the joystick left/right to enable/disable this
label on the status bar.
Move the joystick left/right to enable/disable this
label on the status bar.
Move the joystick left/right to enable/disable this
label on the status bar.
Move the joystick left/right to enable/disable this
label on the status bar.
80 Publ. No. 1557978 Rev. a155 – ENGLISH (EN) – February 6, 2006
Page 95

10.2.5.5 Date/time
10393803;a3
Figure 10.33 Date/Time dialog box
Figure 10.34 Explanations of the Date/Time dialog box
ValueLabel
1970–2036Year
1–12Month
1 –31Day
10 – Camera program
Hour
12 a.m.–12 p.m.
■
1–24
■
The format depends onthe settings inthe Local settings dialog box.
00–59Minute
00–59Second
10.2.5.6 Local settings
10393903;a3
Figure 10.35 Local settings dialog box
Figure 10.36 Explanations of the Local settings dialog box
ValueLabel
Language
Configuration-dependent
➲ The camera program will be restarted when you change the lan-
guage. This will take a few seconds.
10
Publ. No. 1557978 Rev. a155 – ENGLISH (EN) – February 6, 2006 81
Page 96

10 – Camera program
ValueLabel
Video output
Temp unit
Distance unit
Date format
Time format
NTSC
■
PAL
■
°C
■
°F
■
Feet
■
Meters
■
YYYY-MM-DD
■
YY-MM-DD
■
MM/DD/YY
■
DD/MM/YY
■
24 hour
■
AM/PM
■
10.2.5.7 Camera info
The Camera info dialog box shows information about memory usage, battery status,
serial numbers, software revision etc. No changes can be made.
10.2.5.8 Factory default
Point to Factory default and press the joystick to reset the camera to the factory set-
tings.
➲ The camera will be restarted when you restore factory settings. This will take a few
seconds.
10
82 Publ. No. 1557978 Rev. a155 – ENGLISH (EN) – February 6, 2006
Page 97

11 Folder and file structure
The figure below shows the typical folder and file structure on the CompactFlash™
card, as it is appears using Windows® Explorer.
10726803;a1
Publ. No. 1557978 Rev. a155 – ENGLISH (EN) – February 6, 2006 83
11
Page 98

11 – Folder and file structure
INTENTIONALLY LEFT BLANK
11
84 Publ. No. 1557978 Rev. a155 – ENGLISH (EN) – February 6, 2006
Page 99

12 Electrical power system
The camera’s electrical power system consists of the following parts:
■ a removable battery
■ a power supply
■ an internal battery charger
■ a stand-alone, external battery charger
The camera may powered either by using the battery, or by using the power supply.
When using the power supply, the battery will – if it’s inserted in the battery compartment – automatically be charged. You can still use the camera during charging.
➲ Please note the following:
■ The camera is shipped with charged batteries. To increase the battery life, the
battery should be fully discharged and charged a couple of times by using the
camera or leaving the camera on, until the camera says Battery low.
■ The same power supply can be used for both the internal battery charger and the
external battery charger.
■ The operation time of the camera when run on a battery is substantially shorter in
low temperatures.
The removable battery gives an operation time of approx. 1.5–2 hours. When Battery
low is displayed on the screen it is time to charge the battery.
Publ. No. 1557978 Rev. a155 – ENGLISH (EN) – February 6, 2006 85
12
Page 100

12 – Electrical power system
12.1 Internal battery charging
To charge the battery internally, follow the instructions below.
ActionStep
Make sure that the battery is correctly inserted into the camera.1
Connect the power supply cable to the camera.2
The message Charging battery will appear on the screen.3
While charging, the batterystatus symbol willpulse untilthe battery isfully charged.4
12
86 Publ. No. 1557978 Rev. a155 – ENGLISH (EN) – February 6, 2006
 Loading...