

Page 1
User’s manual – Benutzerhandbuch – Manual del usuario – Manuel de l’utilisateur – Manuale dell’utente – Manual do utilizador – Felhas-
ználói kézikönyv – Käyttäjän opas –
Betjeningsvejledning – Brukerveiledning – Instrukcja obsługi – Bruksanvisning – Kullanım
Kılavuzu – Uživatelská příručka –
Gebruikershandleiding
ThermaCAM™ E320
User’s manual
1558407Publ. No.
a155Revision
English (EN)Language
February 6, 2006Issue date
Page 2

Page 3

Warnings & cautions
1
Important note about this manual
Welcome!
Packing list
System overview
Connecting system components
Introduction to thermographic inspections of
electrical installations
Tutorials
Camera overview
Camera program
2
3
4
5
6
7
8
9
10
Electrical power system
Maintenance & cleaning
Troubleshooting
Technical specifications & dimensional drawings
Glossary
11
12
13
14
15
Page 4

Page 5

Thermographic measurement techniques
16
History of infrared technology
Theory of thermography
Emissivity tables
17
18
19
Page 6

Page 7

ThermaCAM™ E320
User’s manual
Publ. No. 1558407 Rev. a155 – ENGLISH (EN) – February 6, 2006
Page 8

Legal disclaimer
All products manufactured by FLIR Systemsarewarranted against defectivematerialsandworkmanship for aperiodof one(1)year from the
delivery date of the original purchase, provided such products have been under normal storage, use and service, and in accordance with
FLIR Systems instruction.
All products not manufactured by FLIR Systems included in systemsdelivered by FLIRSystems to theoriginal purchaser carrythe warranty,
if any, of the particular supplier only and FLIR Systems has no responsibilitywhatsoever for such products.
The warranty extends only to the original purchaser and is not transferable. It is not applicable to any product which has been subjected to
misuse, neglect, accident or abnormal conditions of operation. Expendable parts are excluded from the warranty.
In the case of adefect inaproduct coveredbythis warrantytheproduct must notbe furtherusedin order toprevent additional damage.The
purchaser shall promptly report any defect to FLIR Systems or this warranty will not apply.
FLIR Systems will, at its option, repair or replace any such defective product free of charge if, upon inspection, it proves to be defective in
material or workmanship and provided that it is returned to FLIR Systems within the said one-year period.
FLIR Systems has no other obligation or liability for defects than those set forth above.
No other warranty is expressed or implied. FLIR Systems specifically disclaims the implied warranties of merchantability and fitness for a
particular purpose.
FLIR Systems shall not be liable for any direct, indirect, special, incidentalor consequential loss or damage, whether basedon contract, tort
or any other legal theory.
Copyright
© FLIR Systems,2006. All rights reservedworldwide. No parts ofthesoftware including source codemaybe reproduced, transmitted, transcribed
or translated into any language or computer language in any form or by any means, electronic, magnetic, optical, manual or otherwise,
without the prior written permission of FLIR Systems.
This manual must not, in whole or part, be copied, photocopied, reproduced,translated ortransmitted to any electronic mediumor machine
readable form without prior consent, in writing, from FLIR Systems.
Names and marks appearing on the products herein are eitherregistered trademarksor trademarksof FLIR Systems and/or its subsidiaries.
All othertrademarks,trade names or companynames referenced herein areusedfor identification only andarethe property of theirrespective
owners.
Quality assurance
The Quality Management System under which these products are developed and manufactured has been certified in accordance with the
ISO 9001 standard.
FLIR Systems is committed to a policy of continuous development; therefore we reserve the right to make changes and improvements on
any of the products described in this manual without prior notice.
Patents
This product is protected by patents, design patents, patents pending, or design patents pending.
One or several of the following patents, design patents, patents pending, or design patents pending apply to the products and/or features
described in this manual:
Reg. No.StatusDesignation
00809178.1ApplicationChina
01823221.3ApplicationChina
01823226.4ApplicationChina
235308Design PatentChina
ZL02331553.9Design PatentChina
ZL02331554.7Design PatentChina
200530018812.0PendingChina
1188086PatentEPC
01930377.5ApplicationEPO
01934715.2ApplicationEPO
27282912ApplicationEPO
000279476-0001Design PatentEU
1188086PatentFrance
viii Publ. No. 1558407 Rev. a155 – ENGLISH (EN) – February 6, 2006
Page 9

Reg. No.StatusDesignation
60004227.8PatentGermany
106017Design PatentGreat Britain
3006596Design PatentGreat Britain
3006597Design PatentGreat Britain
1188086PatentGreat Britain
DM/057692Design PatentInternational
DM/061609Design PatentInternational
2000-620406ApplicationJapan
2002-588123ApplicationJapan
2002-588070ApplicationJapan
1144833Design PatentJapan
1182246Design PatentJapan
1182620Design PatentJapan
2005-020460PendingJapan
PCT/SE01/00983ApplicationPCT
PCT/SE01/00984ApplicationPCT
PCT/SE02/00857ApplicationPCT
PCT/SE03/00307ApplicationPCT
PCT/SE/00/00739ApplicationPCT
0302837-0ApplicationSweden
68657Design PatentSweden
75530Design PatentSweden
518836PatentSweden
522971PatentSweden
524024PatentSweden
09/576266ApplicationU.S.
10/476,217ApplicationU.S.
10/476,760ApplicationU.S.
466540Design PatentU.S.
483782Design PatentU.S.
484155Design PatentU.S.
5,386,117PatentU.S.
5,637,871PatentU.S.
5,756,999PatentU.S.
6,028,309PatentU.S.
6,707,044PatentU.S.
6,812,465PatentU.S.
Publ. No. 1558407 Rev. a155 – ENGLISH (EN) – February 6, 2006
Page 10

Reg. No.StatusDesignation
29/233,400PendingU.S.
x Publ. No. 1558407 Rev. a155 – ENGLISH (EN) – February 6, 2006
Page 11

Table of contents
11 Warnings & cautions ......................................................................................................................
32 Important note about this manual .................................................................................................
53 Welcome! .........................................................................................................................................
63.1 About FLIR Systems .............................................................................................................
83.1.1 A few images from our facilities ............................................................................
103.2 Comments & questions ........................................................................................................
114 Packing list ......................................................................................................................................
135 System overview .............................................................................................................................
156 Connecting system components ..................................................................................................
177 Introduction to thermographic inspections of electrical installations ......................................
177.1 Important note ......................................................................................................................
177.2 General information ..............................................................................................................
177.2.1 Introduction ...........................................................................................................
187.2.2 General equipment data .......................................................................................
197.2.3 Inspection .............................................................................................................
197.2.4 Classification & reporting ......................................................................................
207.2.5 Priority ...................................................................................................................
207.2.6 Repair ....................................................................................................................
217.2.7 Control ..................................................................................................................
227.3 Measurement technique for thermographic inspection of electrical installations ...............
227.3.1 How to correctly set the equipment .....................................................................
227.3.2 Temperature measurement ...................................................................................
247.3.3 Comparative measurement ..................................................................................
257.3.4 Normal operating temperature .............................................................................
267.3.5 Classification of faults ...........................................................................................
287.4 Reporting ..............................................................................................................................
307.5 Different types of hot spots in electrical installations ...........................................................
307.5.1 Reflections ............................................................................................................
307.5.2 Solar heating .........................................................................................................
317.5.3 Inductive heating ...................................................................................................
317.5.4 Load variations ......................................................................................................
327.5.5 Varying cooling conditions ...................................................................................
337.5.6 Resistance variations ............................................................................................
337.5.7 Overheating in one part as a result of a fault in another ......................................
357.6 Disturbance factors at thermographic inspection of electrical installations ........................
357.6.1 Wind ......................................................................................................................
357.6.2 Rain and snow ......................................................................................................
367.6.3 Distance to object .................................................................................................
377.6.4 Object size ............................................................................................................
397.7 Practical advice for the thermographer ................................................................................
397.7.1 From cold to hot ...................................................................................................
397.7.2 Rain showers ........................................................................................................
397.7.3 Emissivity ..............................................................................................................
407.7.4 Reflected apparent temperature ...........................................................................
407.7.5 Object too far away ...............................................................................................
Publ. No. 1558407 Rev. a155 – ENGLISH (EN) – February 6, 2006 xi
Page 12

418 Tutorials ...........................................................................................................................................
418.1 Switching on & switching off the camera .............................................................................
418.1.1 Switching on the camera ......................................................................................
418.1.2 Switching off the camera ......................................................................................
428.2 Working with images ............................................................................................................
428.2.1 Acquiring an image ...............................................................................................
428.2.2 Freezing an image ................................................................................................
428.2.3 Saving an image ...................................................................................................
438.2.4 Deleting one or several images ............................................................................
438.2.5 Opening an image ................................................................................................
448.3 Working with measurements ................................................................................................
448.3.1 Laying out a spot ..................................................................................................
448.3.2 Laying out a measurement area ...........................................................................
458.4 Working with alarms .............................................................................................................
458.4.1 Setting the reference temperature ........................................................................
468.4.2 Setting up a color alarm .......................................................................................
468.4.2.1 Setting up a color alarm using the menu system .............................
468.4.2.2 Setting up a color alarm without using the menu system ................
478.4.3 Setting up a silent alarm (i.e. a visual alarm) .......................................................
478.4.4 Setting up an audible alarm .................................................................................
488.5 Creating files for image descriptions ....................................................................................
498.6 Changing level & span .........................................................................................................
498.6.1 Changing level ......................................................................................................
498.6.2 Changing span .....................................................................................................
508.7 Changing system settings ....................................................................................................
508.7.1 Changing language ..............................................................................................
508.7.2 Changing temperature unit ...................................................................................
508.7.3 Changing date format ...........................................................................................
508.7.4 Changing time format ...........................................................................................
518.7.5 Changing date & time ...........................................................................................
528.8 Working with the camera ......................................................................................................
528.8.1 Removing the lens ................................................................................................
538.8.2 Adjusting the focus ...............................................................................................
538.8.3 Changing digital zoom factor ...............................................................................
548.8.4 Inserting & removing the battery ..........................................................................
548.8.4.1 Inserting the battery ..........................................................................
548.8.4.2 Removing the battery ........................................................................
579 Camera overview ............................................................................................................................
579.1 Camera parts ........................................................................................................................
619.2 Keypad buttons & functions .................................................................................................
639.3 Laser LocatIR ........................................................................................................................
649.4 LED indicator on keypad ......................................................................................................
6510 Camera program .............................................................................................................................
6510.1 Result table ...........................................................................................................................
6610.2 System messages ................................................................................................................
6610.2.1 Status messages ..................................................................................................
6610.2.2 Warning messages ...............................................................................................
6710.3 Selecting screen objects ......................................................................................................
6710.3.1 Selecting screen objects ......................................................................................
6710.3.2 Examples of selected screen objects ...................................................................
6910.4 Menu system ........................................................................................................................
xii Publ. No. 1558407 Rev. a155 – ENGLISH (EN) – February 6, 2006
Page 13

6910.4.1 Navigating the menu system ................................................................................
6910.4.2 Meas. mode ..........................................................................................................
7010.4.3 Manual adjust/Automatic adjust ...........................................................................
7110.4.4 Emissivity ..............................................................................................................
7210.4.5 Palette ...................................................................................................................
7210.4.6 Range (extra option) .............................................................................................
7210.4.7 Hide graphics / Show graphics ............................................................................
7310.4.8 File .........................................................................................................................
7410.4.9 Setup .....................................................................................................................
7410.4.9.1 Settings .............................................................................................
7610.4.9.2 Date/time ...........................................................................................
7710.4.9.3 Local settings ....................................................................................
7710.4.9.4 Camera info ......................................................................................
7710.4.9.5 Factory default ...................................................................................
7911 Electrical power system .................................................................................................................
8111.1 Internal battery charging ......................................................................................................
8211.2 External battery charging .....................................................................................................
8311.3 Battery safety warnings ........................................................................................................
8512 Maintenance & cleaning ................................................................................................................
8512.1 Camera body, cables & accessories ....................................................................................
8512.2 Lenses ...................................................................................................................................
8713 Troubleshooting ..............................................................................................................................
8914 Technical specifications & dimensional drawings ......................................................................
8914.1 Imaging performance ...........................................................................................................
8914.2 Image presentation ...............................................................................................................
8914.3 Temperature range ...............................................................................................................
8914.4 Laser LocatIR ........................................................................................................................
9014.5 Electrical power system ........................................................................................................
9014.6 Environmental specifications ...............................................................................................
9114.7 Physical specifications .........................................................................................................
9114.8 Communications interfaces ..................................................................................................
9114.9 Pin configurations .................................................................................................................
9114.9.1 RS-232/USB connector ........................................................................................
9214.9.2 Power connector ...................................................................................................
9214.9.3 CVBS connector ...................................................................................................
9314.10 Relationship between fields of view and distance ...............................................................
9914.11 Camera – dimensional drawings ..........................................................................................
10214.12 Battery charger – dimensional drawing ...............................................................................
10314.13 Battery – dimensional drawing .............................................................................................
10515 Glossary ...........................................................................................................................................
10916 Thermographic measurement techniques ...................................................................................
10916.1 Introduction ..........................................................................................................................
10916.2 Emissivity ..............................................................................................................................
11016.2.1 Finding the emissivity of a sample .......................................................................
11016.2.1.1 Step 1: Determining reflected apparent temperature .......................
11216.2.1.2 Step 2: Determining the emissivity ...................................................
11316.3 Reflected apparent temperature ..........................................................................................
Publ. No. 1558407 Rev. a155 – ENGLISH (EN) – February 6, 2006 xiii
Page 14

11517 History of infrared technology ......................................................................................................
11918 Theory of thermography ................................................................................................................
11918.1 Introduction ...........................................................................................................................
11918.2 The electromagnetic spectrum ............................................................................................
12018.3 Blackbody radiation ..............................................................................................................
12118.3.1 Planck’s law ..........................................................................................................
12218.3.2 Wien’s displacement law ......................................................................................
12418.3.3 Stefan-Boltzmann's law .........................................................................................
12418.3.4 Non-blackbody emitters .......................................................................................
12718.4 Infrared semi-transparent materials .....................................................................................
12919 Emissivity tables .............................................................................................................................
12919.1 References ............................................................................................................................
12919.2 Important note about the emissivity tables ..........................................................................
12919.3 Tables ....................................................................................................................................
145Index ................................................................................................................................................
xiv Publ. No. 1558407 Rev. a155 – ENGLISH (EN) – February 6, 2006
Page 15

1 Warnings & cautions
10474103;a1
■ This equipment generates, uses, and can radiate radio frequency energy and if
not installed and used in accordance with the instruction manual, may cause interference to radio communications. It has been tested and found to comply with the
limits for a Class A computing device pursuant to Subpart Jof Part 15 of FCC Rules,
which are designed to provide reasonable protection against such interference
when operated in a commercial environment. Operation of this equipment in a
residential area is likely to cause interference in which case the user at his own
expense will be required to take whatever measures may be required to correct
the interference.
■ An infrared camera is a precision instrument and uses a very sensitive IR detector.
Pointing the camera towards highly intensive energy sources – such as devices
emitting laser radiation, or reflections from such devices – may affect the accuracy
of the camera readings, or even harm – or irreparably damage – the detector. Note
that this sensitivity is also present when the camera is switched off and the lens
cap is mounted on the lens.
■ Each camera from FLIR Systems is calibrated prior to shipping. It is advisable that
the camera is sent in for calibration once a year.
■ For protective reasons, the LCD (where applicable)will beswitched off if the detector
temperature exceeds +60 °C (+149 °F) and the camera will be switched off if the
detector temperature exceeds +68 °C (+154.4 °F).
■ The camera requires a warm-up time of 5 minutes before accurate measurements
(where applicable) can be expected.
1
Publ. No. 1558407 Rev. a155 – ENGLISH (EN) – February 6, 2006 1
Page 16

1 – Warnings & cautions
1
INTENTIONALLY LEFT BLANK
2 Publ. No. 1558407 Rev. a155 – ENGLISH (EN) – February 6, 2006
Page 17

2 Important note about this manual
As far as it is practically possible, FLIR Systems configures each manual to reflect
each customer’s particular camera configuration. However, please note the following
exceptions:
■ The packing list is subject to specific customer configuration and may contain more
or less items
■ FLIR Systems reserves the right to discontinue models,parts andaccessories, and
other items, or change specifications at any time without prior notice
■ In some cases, the manual may describe features that are not available in your
particular camera configuration
2
Publ. No. 1558407 Rev. a155 – ENGLISH (EN) – February 6, 2006 3
Page 18

2 – Important note about this manual
2
INTENTIONALLY LEFT BLANK
4 Publ. No. 1558407 Rev. a155 – ENGLISH (EN) – February 6, 2006
Page 19

3 Welcome!
Thank you for choosing the ThermaCAM™ E320 infrared camera!
The ThermaCAM™E320 IR camera measures and images the emitted infrared radiation
from an object. The fact that radiation is a function of object surface temperature
makes it possible for the camera to calculate and display this temperature. The
camera systemalso features a laser pointer,a 2.5" color LCD, an IR lens, a removable
battery and a range of accessories.
The camera is very easy to use. It is operated by using a few buttons which are conveniently placed on the camera, allowing fingertip control of major functions. A builtin menusystem alsogives easyaccess toan advanced,simple-to-use camerasoftware
for increased functionality.
To document the object under inspection it is possible to capture and store images
to the camera’s internal memory. The images can be analyzed either in the field by
using the real-time measurement functions built into the camera, or in a PC using
FLIR Systems ThermaCAM Reporter software by downloading the images from the
camera using ThermaCAM™ QuickView.
3
Publ. No. 1558407 Rev. a155 – ENGLISH (EN) – February 6, 2006 5
Page 20
3 – Welcome!
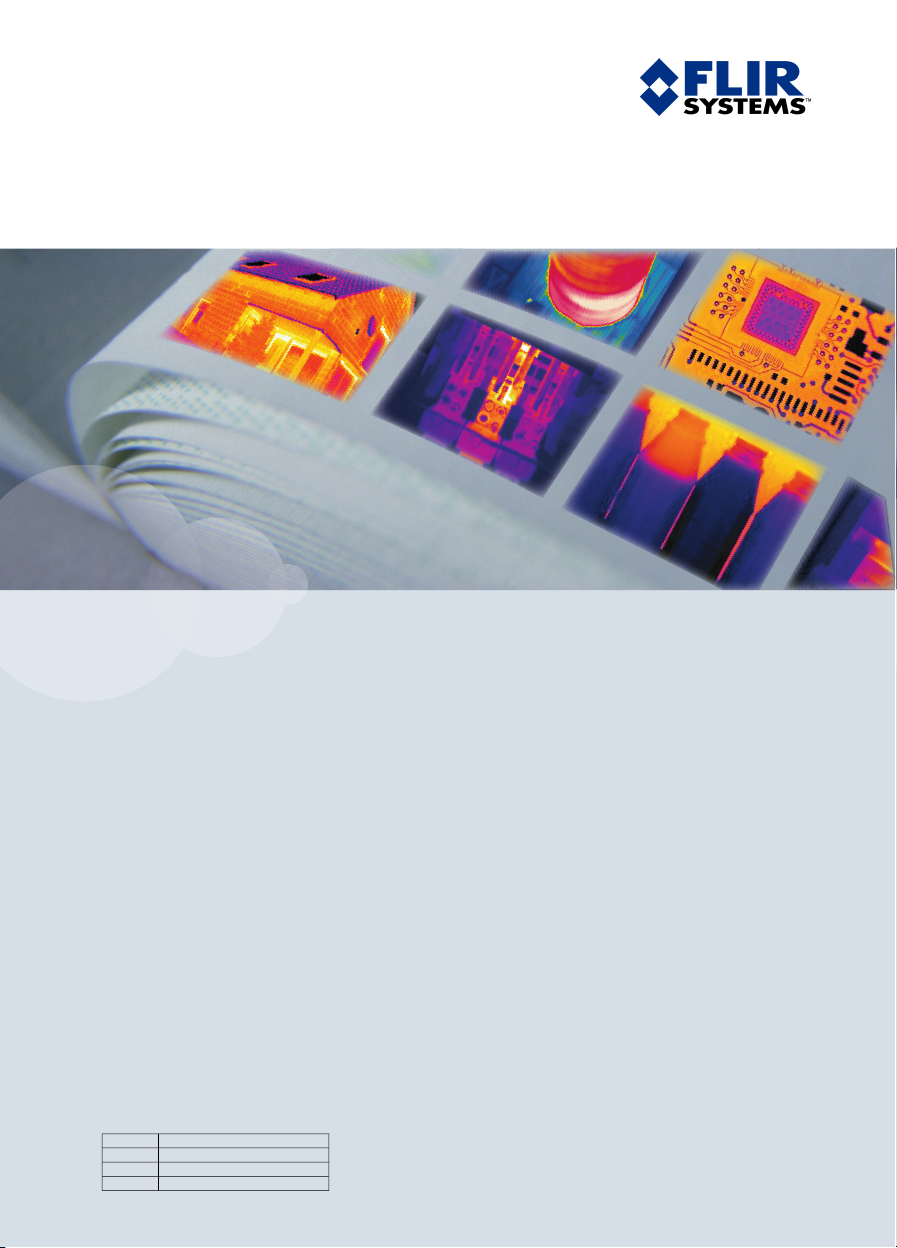
3.1 About FLIR Systems
With over 40 years experience in IR systems and applications development, and over
30 000 infrared cameras in use worldwide, FLIR Systems is the undisputed global
commercial IR industry leader.
10380703;a2
3
Figure 3.1 FLIR Systems, Boston, USA, FLIR Systems, Danderyd, Sweden, and FLIR Systems, Portland,
USA.
10570303;a2
Figure 3.2 Indigo Operations, Niceville, USA,and Indigo Operations,SantaBarbara, USA. IndigoOperations
is a division of FLIR Systems.
As pioneers in the IR industry, FLIR Systems has a long list of ‘firsts’ the world of infrared thermography:
■ 1965: 1st thermal imaging system for predictive maintenance (Model 650).
■ 1973: 1st battery-operated portable IR scanner for industrial applications predictive
maintenance (Model 750).
■ 1975: 1st TV compatible system (Model 525).
■ 1978: 1st dual-wavelength scanning system capable of real-time analog recording
of thermal events (Model 780). Instrumental in R & D market development.
■ 1983: 1st thermal imaging and measurement system with on-screen temperature
measurement.
■ 1986: 1st TE (thermo-electrically) cooled system.
■ 1989: 1st single-piece infrared camera system for PM (predictive maintenance)
and R & D (research & development) with on-board digital storage.
■ 1991: 1st Windows-based thermographic analysis and reporting system.
■ 1993: 1st Focal Plane Array (FPA) system for PM and R & D applications.
■ 1995: 1st full-featured camcorder style FPA infrared system (ThermaCAM).
■ 1997: 1st: uncooled microbolometer-based PM/R & D system.
6 Publ. No. 1558407 Rev. a155 – ENGLISH (EN) – February 6, 2006
Page 21
3 – Welcome!
■ 2000: 1st thermography system with both thermal and visual imaging.
■ 2000: 1st thermography system to incorporate thermal/visual/voice and text data
logging.
■ 2002: 1st automated thermography system (model P60) to feature detachable re-
motely controllable LCD, JPEG image storage, enhanced connectivity including
USB and IrDA wireless, thermal/visual/voice and text data logging.
■ 2002: 1st low-cost ultra-compact hand-held thermography camera (E series).
Revolutionary, ergonomic design, lightest IR measurement camera available.
■ 2003: 1st low-cost, ultra-compact infrared camera for fixed installation intended for
automation and security applications. Exceptionally user-friendly due to standard
interfaces and extensive built-in functionality.
■ 2004: 1st camera models specially designed for building thermography (B1, B2
and B20)
10401603;a3
3
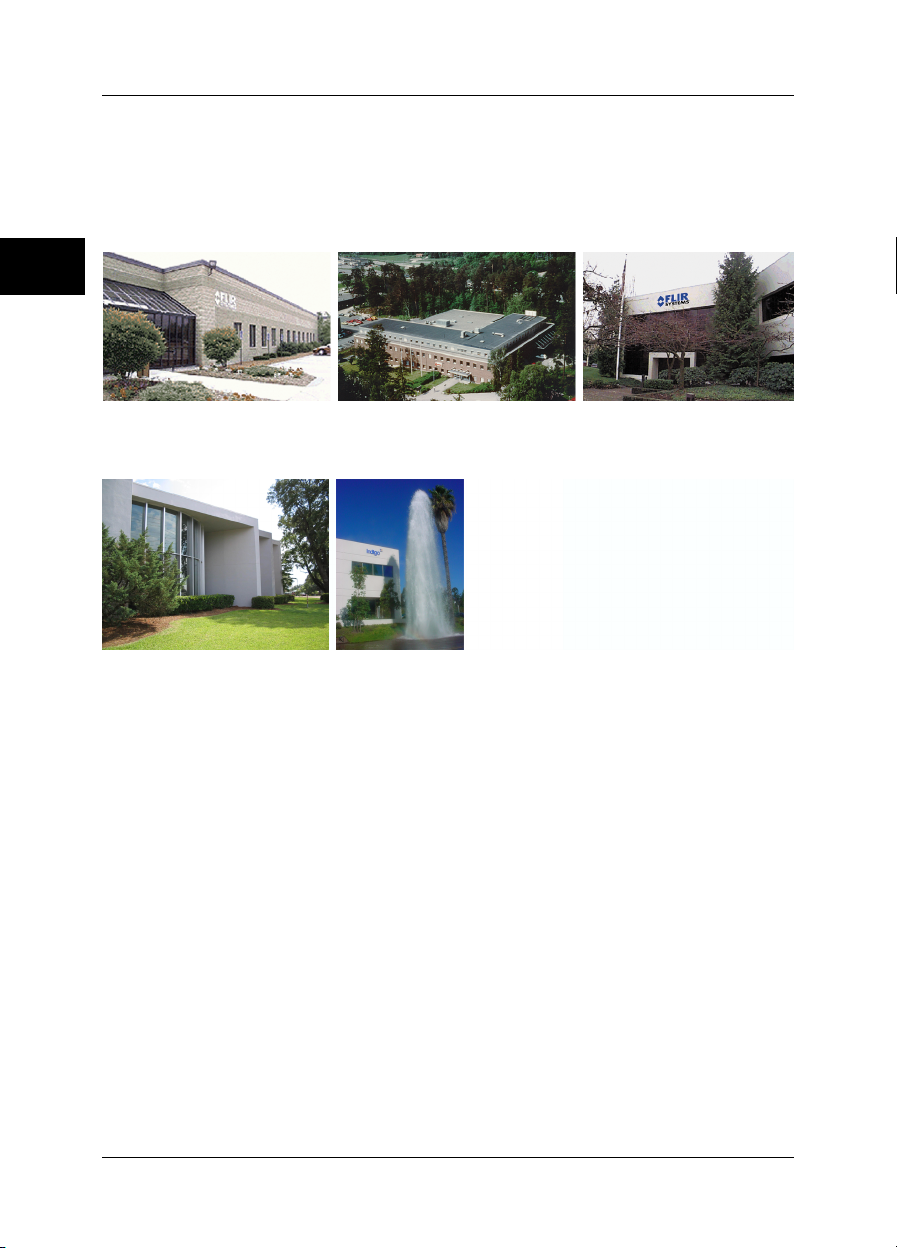
Figure 3.3 LEFT: FLIR Systems Thermovision® Model 661. The photo is taken on May 30th, 1969 at the
distribution plant near Beckomberga, in Stockholm, Sweden. The camera weighed approx. 25 kg (55 lb),
the oscilloscope 20 kg (44 lb), the tripod 15 kg (33 lb). The operator also needed a 220 VAC generator
set, and a 10L (2.6US gallon) jar with liquidnitrogen. To theleft ofthe oscilloscope thePolaroid attachment
(6 kg/13 lb) can be seen. RIGHT: FLIR Systems ThermaCAM Model E2 from 2002 – weight: 0.7 kg (1.54
lb), including battery.
With this tradition of unparalleled technical excellence and innovative achievements,
FLIR Systems continues to develop new infrared products, educational venues and
applications expertise to meet the diverse demands of thermographers worldwide.
Publ. No. 1558407 Rev. a155 – ENGLISH (EN) – February 6, 2006 7
Page 22
3 – Welcome!
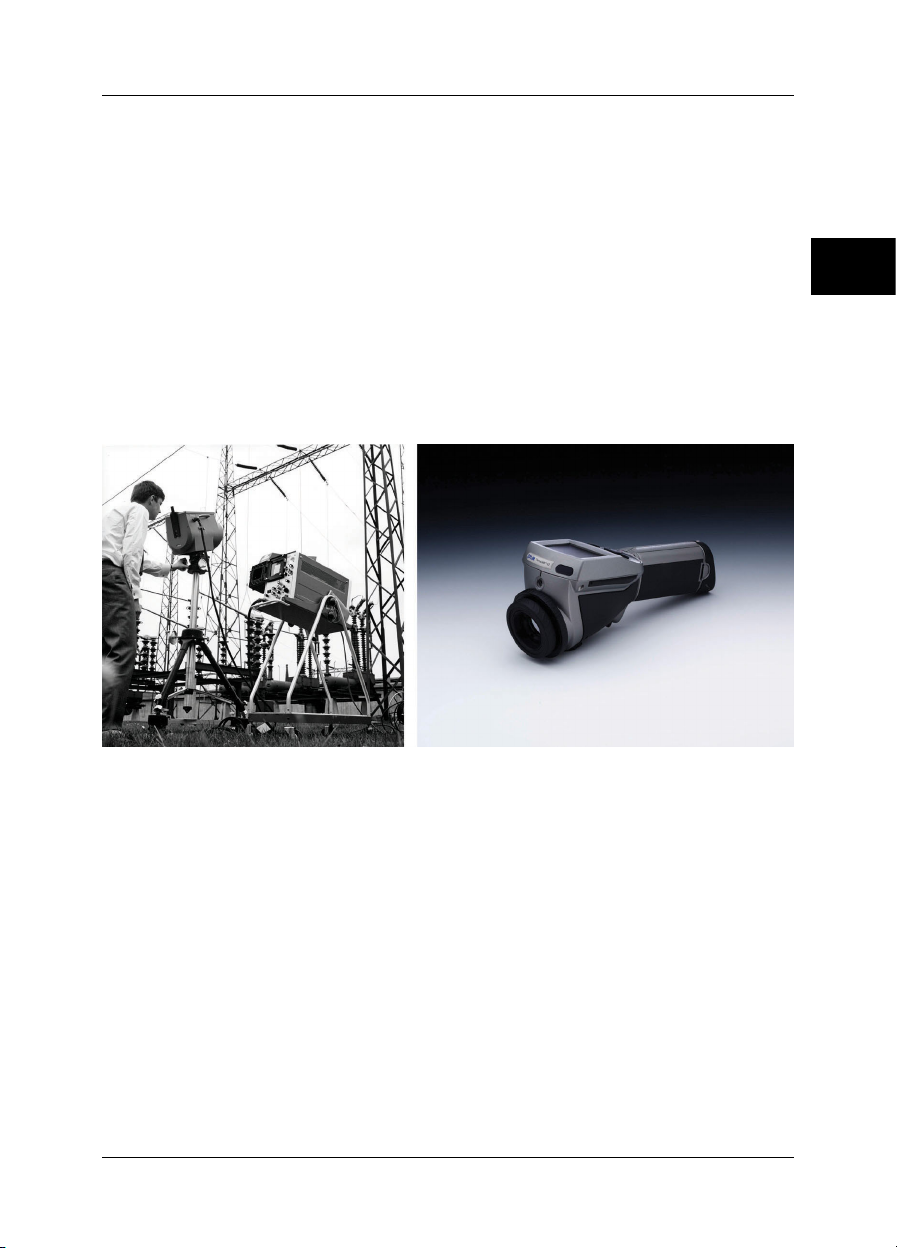
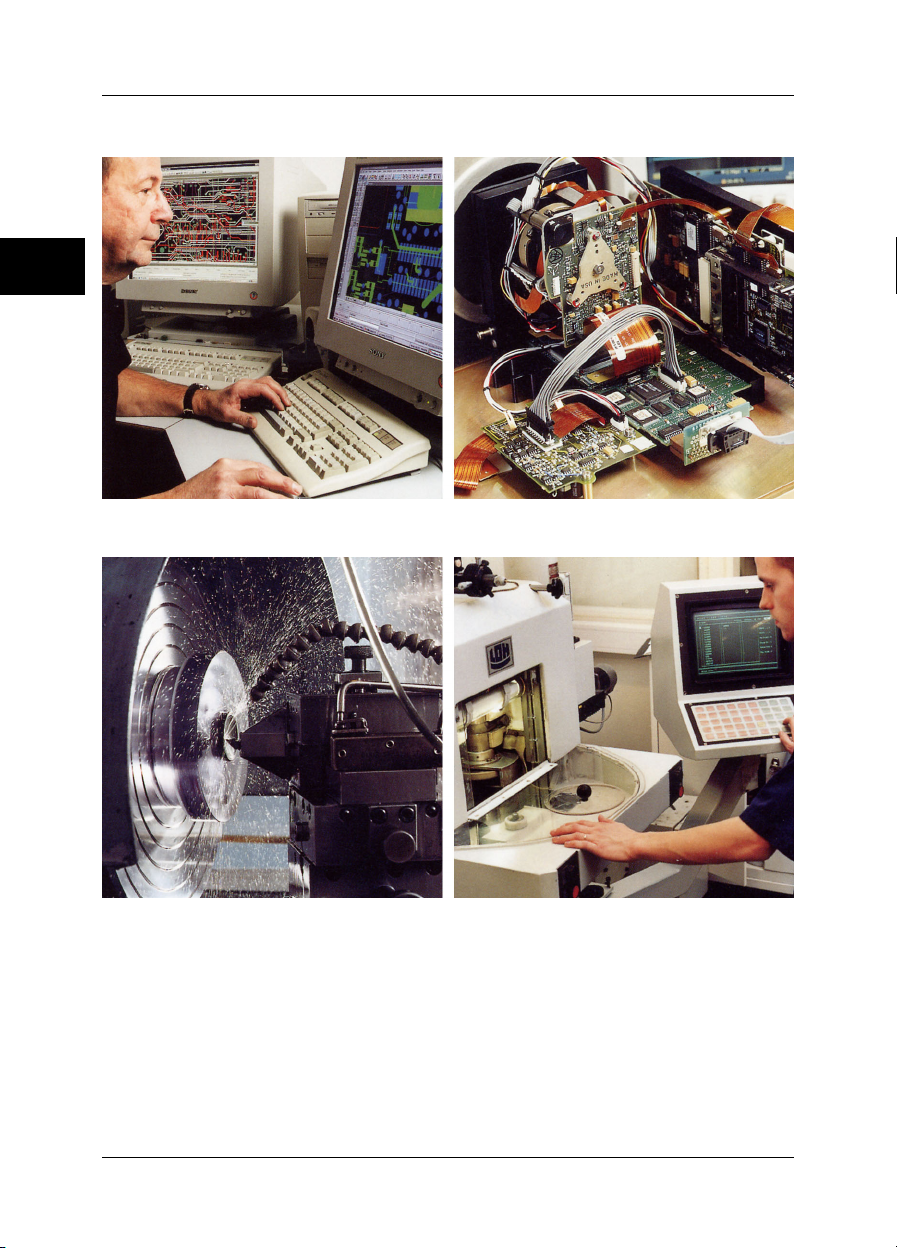
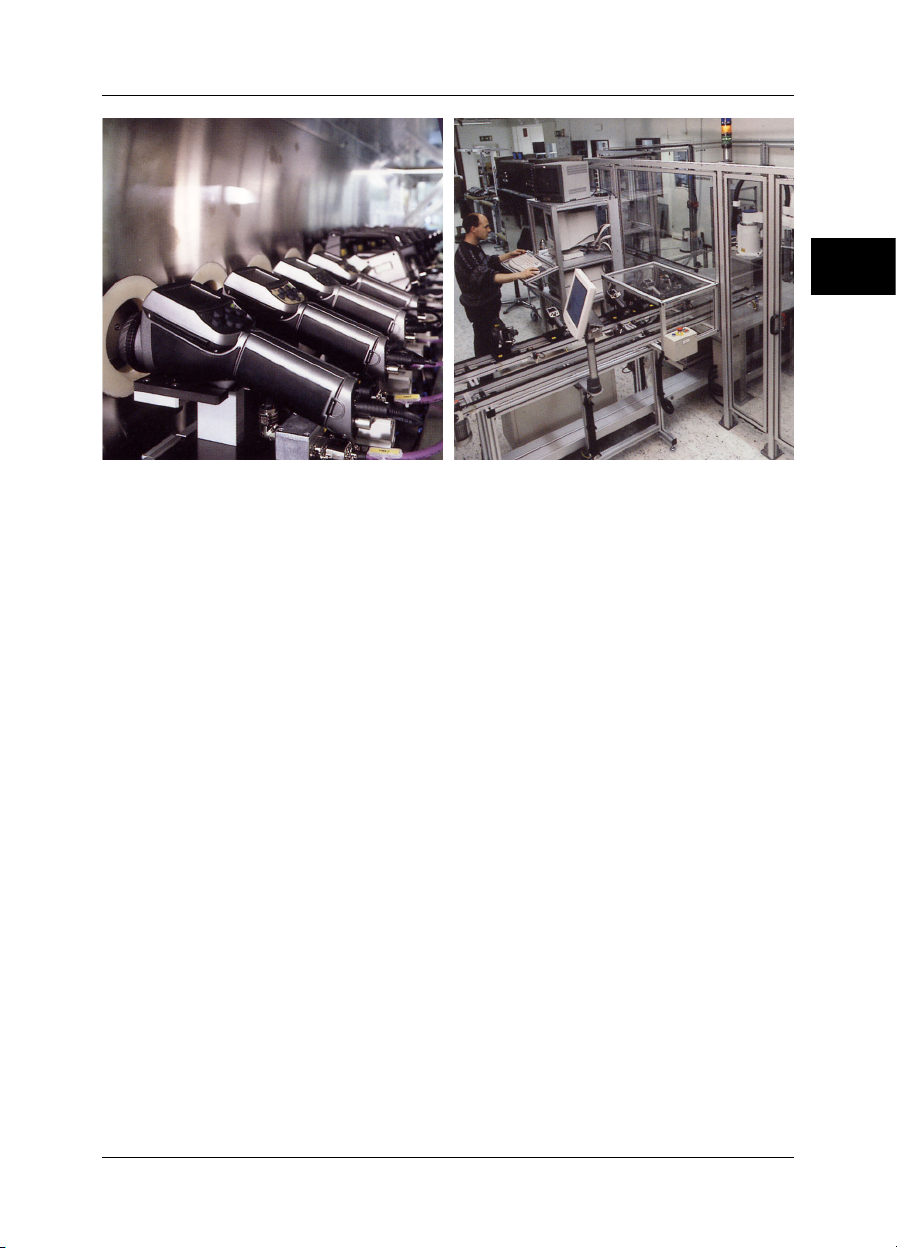
3.1.1 A few images from our facilities
10401303;a1
3
Figure 3.4 LEFT: Development of system electronics; RIGHT: Testing of an FPA detector
10401403;a1
Figure 3.5 LEFT: Diamond turning machine; RIGHT: Lens polishing
8 Publ. No. 1558407 Rev. a155 – ENGLISH (EN) – February 6, 2006
Page 23
3 – Welcome!
10401503;a1
Figure 3.6 LEFT: Testing of IR cameras in the climatic chamber; RIGHT: Robot for camera testing and
calibration
3
Publ. No. 1558407 Rev. a155 – ENGLISH (EN) – February 6, 2006 9
Page 24

3 – Welcome!
3.2 Comments & questions
FLIR Systems is committed to a policy of continuous development, and although we
have tested and verified the information in this manual to the best of our ability, you
may find that features and specifications have changed since the time of printing.
Please let us know about any errors you find, as well as your suggestions for future
editions, by sending an e-mail to:
3
documentation@flir.se
➲ Do not use this e-mail address for technical support questions. Technical support
is handled by FLIR Systems local sales offices.
10 Publ. No. 1558407 Rev. a155 – ENGLISH (EN) – February 6, 2006
Page 25

4 Packing list
The ThermaCAM™ E320 and its accessories are delivered in a hard transport case
which typically contains the items below. On receipt of the transport case, inspect all
items andcheck them against the delivery note. Any damaged items must be reported
to the local FLIR Systems representative immediately.
Qty.Part NumberDescription
21 195 106Battery
11 195 102Battery charger
11 195 221Hand strap
11 120 987Lens cap for camera body
11558407Operator’s manual
11 909 528Power supply
4
lens
1Configuration-dependentThermaCAM™ E320 infrared camera with
11 195 494TrainIR CD
11 195 128USB cable
11 909 775Video cable
Publ. No. 1558407 Rev. a155 – ENGLISH (EN) – February 6, 2006 11
Page 26

4 – Packing list
4
INTENTIONALLY LEFT BLANK
12 Publ. No. 1558407 Rev. a155 – ENGLISH (EN) – February 6, 2006
Page 27
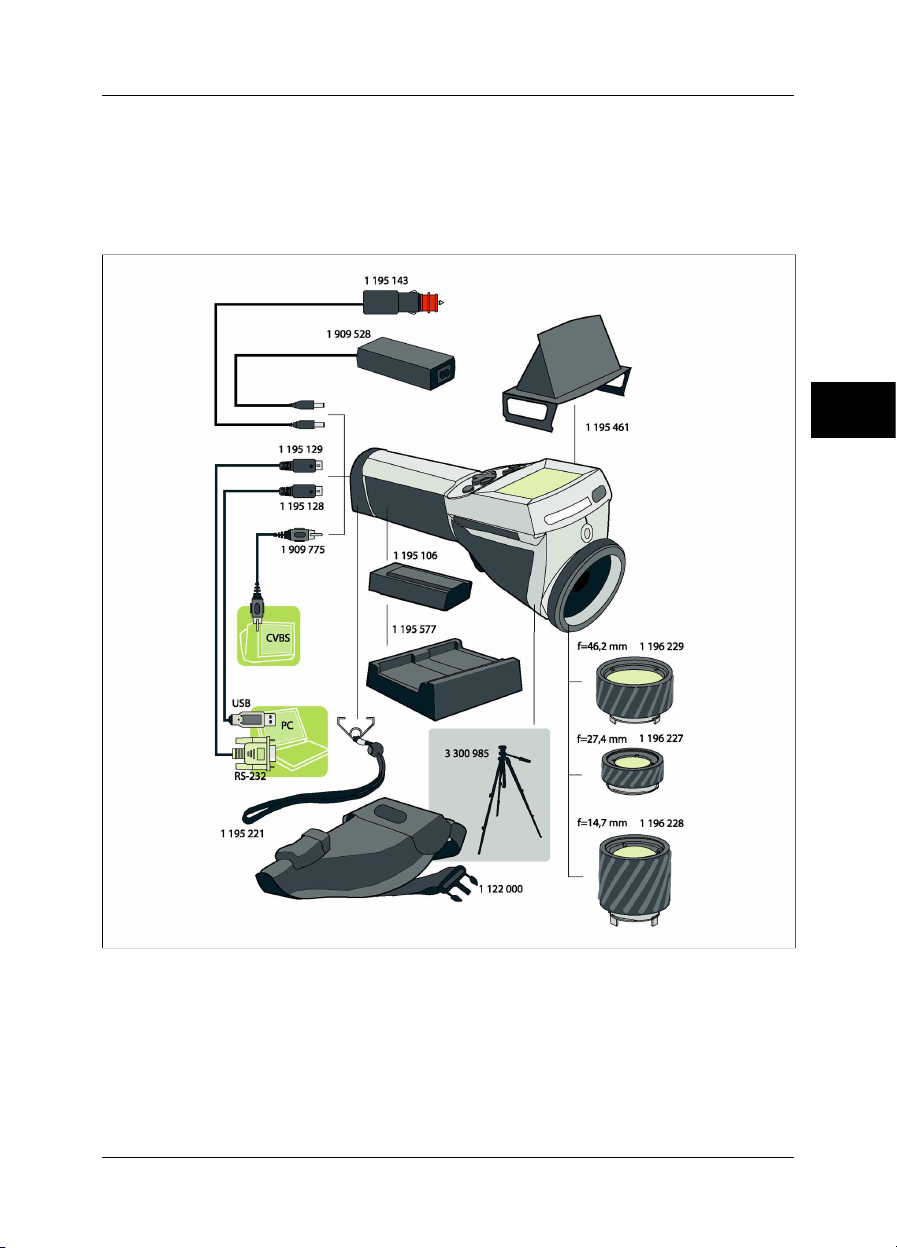
5 System overview
This system overview shows all accessories that are possible to order for a ThermaCAM™ E320.
10582303;a2
5
Figure 5.1 System overview
Publ. No. 1558407 Rev. a155 – ENGLISH (EN) – February 6, 2006 13
Page 28

5 – System overview
5
INTENTIONALLY LEFT BLANK
14 Publ. No. 1558407 Rev. a155 – ENGLISH (EN) – February 6, 2006
Page 29
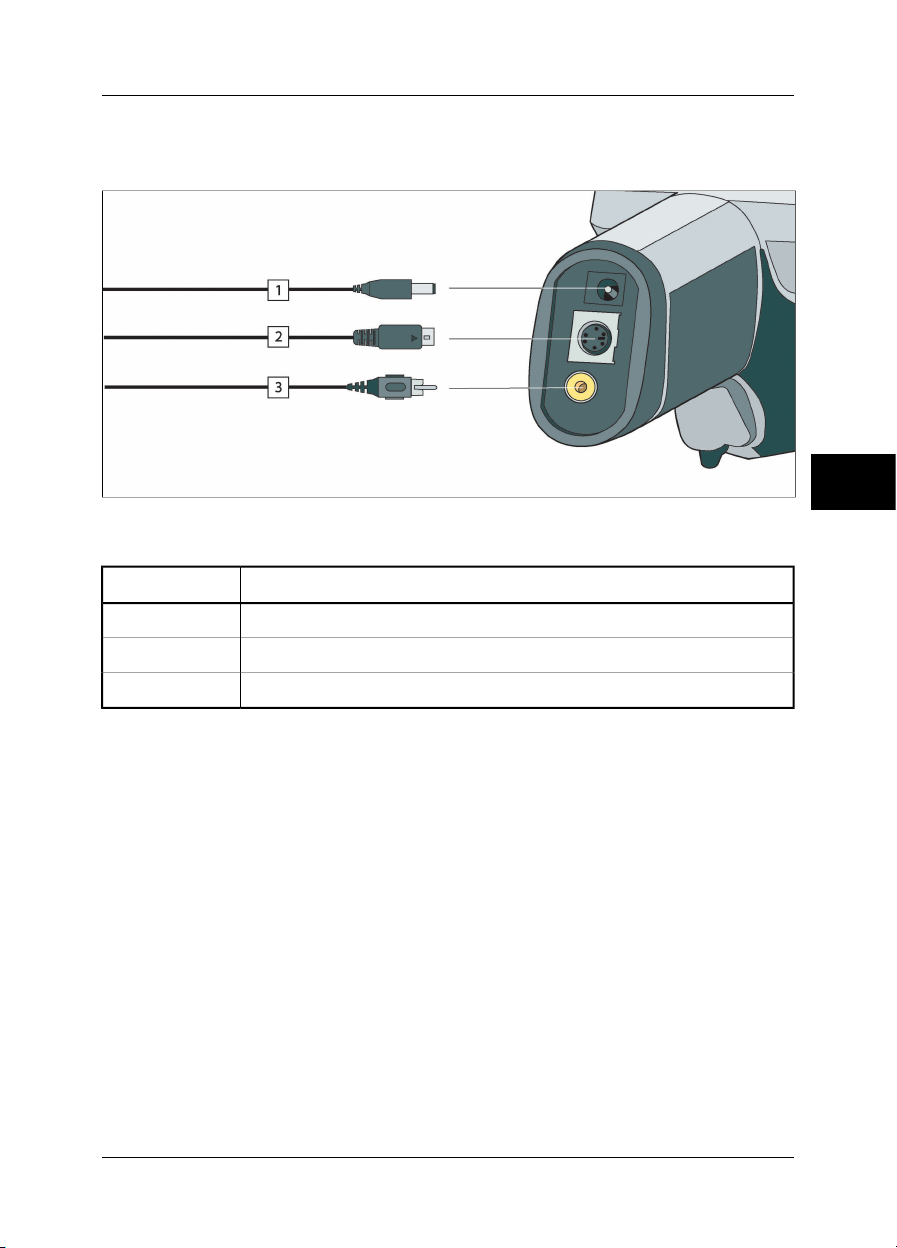
6 Connecting system components
10438203;a2
Figure 6.1 How to connect system components
Figure 6.2 Explanations of callouts
ExplanationCallout
Power supply cable (11–16 VDC)1
USB / RS-232 cable2
Video cable (CVBS, i.e. composite video)3
6
Publ. No. 1558407 Rev. a155 – ENGLISH (EN) – February 6, 2006 15
Page 30

6 – Connecting system components
6
INTENTIONALLY LEFT BLANK
16 Publ. No. 1558407 Rev. a155 – ENGLISH (EN) – February 6, 2006
Page 31

7 Introduction to thermographic
inspections of electrical
installations
7.1 Important note
All camera functions and features that are described in this section may not be supported by your particular camera configuration.
Electrical regulations differ from country to country. For that reason, the electrical
procedures described in this section may not be the standard of procedure in your
particular country. Also, in many countries carrying out electrical inspections requires
formal qualification. Always consult national or regional electrical regulations.
7.2 General information
7.2.1 Introduction
Today, thermography is a well-established technique for the inspection of electrical
installations. This was the first and still is the largest. the largest application of thermography. The infrared camera itself has gone through an explosive development
and we can say that today, the 8th generation of thermographic systems is available.
It all began in 1964, more than 40 years ago. The technique is now established
throughout the whole world. Industrialized countries as well as developing countries
have adopted this technique.
Thermography, in conjunction with vibration analysis, has over the latest decades
been the main method for fault diagnostics in the industry as a part of the preventive
maintenance program. The great advantage with these methods is that it is not only
possible to carry out the inspection on installations in operation; normal working
condition is in fact a prerequisite for a correct measurement result, so the ongoing
production processis notdisturbed. Thermographicinspection ofelectrical installations
are used in three main areas:
■ Power generation
■ Power transmission
■ Power distribution, that is, industrial use of electrical energy.
The fact that these controls are carried out under normal operation conditions has
created a natural division between these groups. The power generation companies
measure during the periods of high load. These periods vary from country to country
7
Publ. No. 1558407 Rev. a155 – ENGLISH (EN) – February 6, 2006 17
Page 32

7 – Introduction to thermographic inspections of electrical installations
and for the climatic zones. The measurement periods may also differ depending on
the type of plant to be inspected, whether they are hydroelectric, nuclear, coal-based
or oil-based plants.
In the industry the inspections are—at least in Nordic countries with clear seasonal
differences—carried out during spring or autumn or before longer stops in the operation. Thus, repairs are made when the operation is stopped anyway. However, this
seems to be the rule less and less, which has led to inspections of the plants under
varying load and operating conditions.
7.2.2 General equipment data
The equipment to be inspected has a certain temperature behavior that should be
known to the thermographer before the inspection takes place. In the case ofelectrical
equipment, the physical principle of why faults show a different temperature pattern
because of increased resistance or increased electrical current is well known.
However, it is useful to remember that, in some cases, for example solenoids, ‘overheating’ is natural and does not correspond to a developing defect. In other cases,
like the connections in electrical motors, the overheating might depend on the fact
7
that the healthy part is taking the entire load and therefore becomes overheated. A
similar example is shown in section 7.5.7 – Overheating in one part as a result of a
fault in another on page 33.
Defective parts of electrical equipment can therefore both indicate overheating and
be cooler than the normal ‘healthy’ components. It is necessary to be aware of what
to expect by getting as much information as possible about the equipment before it
is inspected.
The general rule is, however, that a hot spot is caused by a probable defect. The
temperature and the load of that specific component at the moment of inspection will
give an indication of how serious the fault is and can become in other conditions.
Correct assessment in each specific case demands detailed information about the
thermal behavior of the components, that is, we need to know the maximum allowed
temperature of the materials involved and the role the component plays in the system.
Cable insulations, for example, lose their insulation properties above a certain temperature, which increases the risk of fire.
In the case of breakers, where the temperature is too high, parts can melt and make
it impossible to open the breaker, thereby destroying its functionality.
18 Publ. No. 1558407 Rev. a155 – ENGLISH (EN) – February 6, 2006
Page 33

7 – Introduction to thermographic inspections of electrical installations
The more the IR camera operator knows about the equipment that he or she is about
to inspect, the higher the quality of the inspection. But it is virtually impossible for an
IR thermographerto havedetailed knowledgeabout allthe differenttypes of equipment
that can be controlled. It is therefore common practice that a person responsible for
the equipment is present during the inspection.
7.2.3 Inspection
The preparationof theinspection shouldinclude thechoice ofthe righttype ofreport.
It isoften necessaryto use complementary equipmentsuch as ampere meters in order
to measure the current in the circuits where defects were found. An anemometer is
necessary if you want to measure the wind speed at inspection of outdoorequipment.
Automatic functions help the IR operator to visualize an IR image of the components
with the right contrast to allow easy identification of a fault or a hot spot. It is almost
impossible to miss a hot spot on a scanned component. A measurement function will
also automatically display the hottest spot within an area in the image or the difference
between the maximum temperature in the chosen area and a reference, which can
be chosen by the operator, for example the ambient temperature.
10712703;a3
7
Figure 7.1 An infrared and a visual image of a power line isolator
When the fault is clearly identified and the IR thermographer has made sure that it is
not a reflection or a naturally occurring hot spot, the collection of the data starts, which
will allow the correct reporting of the fault. The emissivity, the identification of the
component, and the actual working conditions, together with the measured temperature, will be used in the report. In order to make it easy to identify the component a
visual photo of the defect is often taken.
7.2.4 Classification & reporting
Reporting has traditionally been the most time-consuming part of the IR survey. A
one-day inspection could result in one or two days’ work to report and classify the
found defects. This is still the case for many thermographers, who have chosen not
to use the advantages that computers and modern reporting software have brought
to IR condition monitoring.
Publ. No. 1558407 Rev. a155 – ENGLISH (EN) – February 6, 2006 19
Page 34

7 – Introduction to thermographic inspections of electrical installations
The classification of the defects gives a more detailed meaning that not only takes
into account the situation at the time of inspection (which is certainly of great importance), but also the possibility to normalize the over-temperature to standard load
and ambient temperature conditions.
An over-temperature of +30°C (+86°F) is certainly a significant fault. But if that overtemperature is valid for one component working at 100% load and for another at 50%
load, it is obvious that the latter will reach a much higher temperature should its load
increase from 50% to 100%. Such a standard can be chosen by the plant’s circumstances. Very often, however, temperatures are predicted for 100% load. A standard
makes it easier to compare the faults over time and thus to make a more complete
classification.
7.2.5 Priority
Based on the classification of the defects, the maintenance manager gives the defects
a repair priority. Very often, the information gathered during the infrared survey is put
together withcomplementary informationon the equipment collected by other means
such as vibration monitoring, ultrasound or the preventive maintenance scheduled.
7
Even if the IR inspection is quickly becoming the most used method of collecting information about electrical components safely with the equipment under normal operating conditions, there are many other sources of information the maintenance or the
production manager has to consider.
The priority of repair should therefore not be a task for the IR camera operator in the
normal case. If a critical situation is detected during the inspection or during the
classification of the defects, the attention of the maintenance manager should of
course be drawn to it, but the responsibility for determining the urgency of the repair
should be his.
7.2.6 Repair
To repair the known defects is the most important function of preventive maintenance.
However, to assure production at the right time or at the right cost can also be important goals for a maintenance group. The information provided by the infrared survey
can be used to improve the repair efficiency as well as to reach the other goals with
a calculated risk.
To monitor the temperature of a known defect that can not be repaired immediately
for instance because spare parts are not available, can often pay for the cost of inspection a thousandfold and sometimes even for the IR camera. To decide not to
repair knowndefects tosave on maintenance costs and avoid unnecessary downtime
is also another way of using the information from the IR survey in a productive way.
20 Publ. No. 1558407 Rev. a155 – ENGLISH (EN) – February 6, 2006
Page 35

7 – Introduction to thermographic inspections of electrical installations
However, themost commonresult of the identification and classification of the detected
faults is a recommendation to repair immediately or as soon as it is practically possible.
It is important that the repair crew is aware of the physical principles for the identification of defects. If a defect shows a high temperature and is in a critical situation, it is
very common that the repair personnel expect to find a highly corroded component.
It should also come as no surprise to the repair crew that a connection, which is
usually healthy, can give the same high temperatures as a corrodedone if it has come
loose. These misinterpretations are quite common and risk putting in doubt the reliability of the infrared survey.
7.2.7 Control
A repaired component should be controlled as soon as possible after the repair. It is
not efficient to wait for the next scheduled IRsurvey in order to combine a new inspection with the control of the repaired defects. The statistics on the effect of the repair
show that up to a third of the repaired defects still show overheating. Thatis the same
as saying that those defects present a potential risk of failure.
To wait until the next scheduled IR survey represents an unnecessary risk for the
plant.
Besides increasing the efficiency of the maintenance cycle (measured in terms of
lower risk for the plant) the immediate control of the repair work brings other advantages to the performance of the repair crew itself.
7
When a defect still shows overheating after the repair, the determination of the cause
of overheating improves the repair procedure, helps choose the best component
suppliers and detect design shortcomings on the electrical installation. The crew
rapidly sees the effect of the work and can learn quickly both from successful repairs
and from mistakes.
Another reason to provide the repair crew with an IR instrument is that many of the
defects detected during the IR survey are of low gravity. Instead of repairing them,
which consumes maintenance and production time, it can be decided to keep these
defects under control. Therefore the maintenance personnel should have access to
their own IR equipment.
It is common to note on the report form the type of fault observed during the repair
as well as the action taken. These observations make an important source of experience that can be used to reduce stock, choose the best suppliers or to train new
maintenance personnel.
Publ. No. 1558407 Rev. a155 – ENGLISH (EN) – February 6, 2006 21
Page 36

7 – Introduction to thermographic inspections of electrical installations
7.3 Measurement technique for thermographic inspection of electrical installations
7.3.1 How to correctly set the equipment
A thermal image may show high temperature variations:
10712803;a4
Figure 7.2 Temperature variations in a fusebox
In the images above, the fuse to the right has a maximum temperature of +61°C
(+142°F), whereas the one to the left is maximum +32°C (+90°F) and the one in the
middle somewhere in between. The three images are different inasmuch as the temperature scale enhances only one fuse in each image. However, it is the same image
and all the information about all three fuses is there. It is only a matter of setting the
7
temperature scale values.
7.3.2 Temperature measurement
Some cameras today can automatically find the highest temperature in the image.
The image below shows how it looks to the operator.
10712903;a3
Figure 7.3 An infrared image of a fusebox where the maximum temperature is displayed
The maximum temperature in the area is +62.2°C (+144.0°F). The spot meter shows
the exact location of the hot spot. The image can easily be stored in the camera
memory.
The correct temperature measurement depends, however, not only on the function
of the evaluation software or the camera. It may happen that the actual fault is, for
example, a connection, which is hidden from the camera in the position it happens
22 Publ. No. 1558407 Rev. a155 – ENGLISH (EN) – February 6, 2006
Page 37

7 – Introduction to thermographic inspections of electrical installations
to be in for the moment. It might be so that you measure heat, which has been conducted oversome distance,whereas the ‘real’ hot spot is hidden from you. An example
is shown in the image below.
10717603;a3
Figure 7.4 A hidden hot spot inside a box
Try to choose different angles and make sure that the hot area is seen in its full size,
that is, that it is not disappearing behind something that might hide the hottest spot.
In this image, the hottest spot of what the camera can‘see’, is +83°C (+181°F), where
the operating temperature on the cables below the box is +60°C (+140°F). However,
the real hot spot is most probably hidden inside the box, see the in yellow encircled
area. This fault is reported as a +23.0°C (+41.4°F) excess temperature, but the real
problem is probably essentially hotter.
7
Another reason for underestimating the temperature of an object is bad focusing. It
is very important that the hot spot found is in focus. See the example below.
10717403;a2
Figure 7.5 LEFT: A hot spot in focus; RIGHT: A hot spot out of focus
In the left image, the lamp is in focus. Its average temperature is +64°C (+147°F). In
the right image, the lamp is out of focus, which will result in only +51°C (+124°F) as
the maximum temperature.
Publ. No. 1558407 Rev. a155 – ENGLISH (EN) – February 6, 2006 23
Page 38

7 – Introduction to thermographic inspections of electrical installations
7.3.3 Comparative measurement
For thermographic inspections of electrical installations a special method is used,
which is based on comparison of different objects, so-called measurement with a
reference. This simply means that you compare the three phases with each other.
This method needs systematic scanning of the three phases in parallel in order to
assess whether a point differs from the normal temperature pattern.
A normal temperature pattern means that current carrying components have a given
operation temperature shown in a certain color (or gray tone) on the display, which
is usually identical for all three phases under symmetrical load. Minor differences in
the color might occur in the current path, for example, at the junction of two different
materials, at increasing or decreasing conductor areas or on circuit breakers where
the current path is encapsulated.
The image below shows three fuses, thetemperatures of which are very close toeach
other. The inserted isotherm actually shows less than +2°C (+3.6°F) temperature
difference between the phases.
Different colors are usually the result if the phases are carrying an unsymmetrical
7
load. This difference in colors does not represent any overheating since this does not
occur locally but is spread along the whole phase.
10713203;a3
Figure 7.6 An isotherm in an infrared image of a fusebox
A ‘real’ hot spot, on the other hand, shows a rising temperature as you look closer
to the source of the heat. See the image below, where the profile (line) shows a
steadily increasing temperature up to about +93°C (+199°F) at the hot spot.
24 Publ. No. 1558407 Rev. a155 – ENGLISH (EN) – February 6, 2006
Page 39

7 – Introduction to thermographic inspections of electrical installations
10713303;a4
Figure 7.7 A profile (line) in an infrared image and a graph displaying the increasing temperature
7.3.4 Normal operating temperature
Temperature measurement with thermography usually gives the absolute temperature
of the object. In order to correctly assess whether the component is too hot, it is
necessary to know its operating temperature, that is, its normal temperature if we
consider the load and the temperature of its environment.
As the direct measurement will give the absolute temperature—which must be considered as well (as most components have an upper limit to their absolute temperatures)—it is necessary to calculate the expected operating temperature given the load
and the ambient temperature. Consider the following definitions:
■ Operating temperature: the absolute temperature of the component. It depends
on the current load and the ambient temperature. It is always higher than the ambient temperature.
■ Excess temperature (overheating): the temperature difference between a properly
working component and a faulty one.
7
The excess temperature is found as the difference between the temperature of a
‘normal’ component and the temperature of its neighbor. It is important to compare
the same points on the different phases with each other.
As an example, see the following images taken from indoor equipment:
10713403;a4
Figure 7.8 An infrared image of indoor electrical equipment (1)
Publ. No. 1558407 Rev. a155 – ENGLISH (EN) – February 6, 2006 25
Page 40

7 – Introduction to thermographic inspections of electrical installations
10713503;a4
Figure 7.9 An infrared image of indoor electrical equipment (2)
The two left phases are considered as normal, whereas the right phase shows a very
clear excess temperature. Actually, the operating temperature of the left phase is
+68°C (+154°F), that is, quite a substantial temperature, whereas the faulty phase
to the right shows a temperature of +86°C (+187°F). This means an excess temperature of +18°C (+33°F), that is, a fault that has to be attended to quickly.
For practical reasons, the (normal, expected) operating temperature of a component
is taken as the temperature of the components in at least two out of three phases,
7
provided that you consider them to be working normally.. The ‘most normal’ case is
of course that all three phases have the same or atleast almost the same temperature.
The operating temperature of outdoor components in substations or power lines is
usually only 1°C or 2°C above the air temperature (1.8°F or 3.6°F). In indoor substations, the operating temperatures vary a lot more.
This fact is clearly shown by the bottom image as well. Here the left phase is the one,
which shows an excess temperature. The operating temperature, taken from the two
‘cold’ phases, is +66°C (+151°F). The faulty phase shows a temperature of +127°C
(+261°F), which has to be attended to without delay.
7.3.5 Classification of faults
Once a faulty connection is detected, corrective measures may be necessary—or
may not be necessary for the time being. In order to recommend the most appropriate
action the following criteria should be evaluated:
■ Load during the measurement
■ Even or varying load
■ Position of the faulty part in the electrical installation
■ Expected future load situation
■ Is the excess temperature measured directlyon thefaulty spot or indirectly through
conducted heat caused by some fault inside the apparatus?
Excess temperatures measured directly on the faulty part are usually divided into
three categories relating to 100% of the maximum load.
26 Publ. No. 1558407 Rev. a155 – ENGLISH (EN) – February 6, 2006
Page 41

7 – Introduction to thermographic inspections of electrical installations
< 5°C (9°F)I
5–30°C (9–54°F)II
>30°C (54°F)III
The start of the overheat condition. This must be carefully
monitored.
Developed overheating. It must
be repaired as soon as possible
(but think about the load situation before a decision is made).
Acute overheating. Must be repaired immediately (but think
about the load situation before
a decision is made).
7
Publ. No. 1558407 Rev. a155 – ENGLISH (EN) – February 6, 2006 27
Page 42

7 – Introduction to thermographic inspections of electrical installations
7.4 Reporting
Nowadays, thermographicinspections of electrical installationsare probably, without
exception, documentedand reportedby theuse ofa reportprogram. Theseprograms,
which differ from one manufacturer to another, are usually directly adapted to the
cameras and will thus make reporting very quick and easy.
The program, which has been used for creating the report page shown below, is
called ThermaCAM™Reporter. It isadapted toseveral typesof infrared cameras from
FLIR Systems.
A professional report is often divided into two sections:
■ Front pages, with facts about the inspection, such as:
Who the client is, for example, customer’s company name and contact person
□
Location of the inspection: site address, city, and so on
□
Date of inspection
□
Date of report
□
Name of thermographer
□
7
Signature of thermographer
□
Summary or table of contents
□
■ Inspection pages containing IR images to document and analyze thermal properties
or anomalies.
Identification of the inspected object:
□
What is the object: designation, name, number, and so on
■
Photo
■
IR image. When collecting IR images there are some details to consider:
□
Optical focus
■
Thermal adjustment of the scene or the problem (level & span)
■
Composition: proper observation distance and viewing angle.
■
Comment
□
Is there an anomaly or not?
■
Is there a reflection or not?
■
Use a measurement tool—spot, area or isotherm—to quantify the problem.
■
Use the simplest tool possible; a profile graph is almost never needed in
electrical reports.
28 Publ. No. 1558407 Rev. a155 – ENGLISH (EN) – February 6, 2006
Page 43

10713603;a3
7 – Introduction to thermographic inspections of electrical installations
7
Figure 7.10 A report example
Publ. No. 1558407 Rev. a155 – ENGLISH (EN) – February 6, 2006 29
Page 44

7 – Introduction to thermographic inspections of electrical installations
7.5 Different types of hot spots in electrical installations
7.5.1 Reflections
The thermographiccamera sees any radiation that enters the lens, not only originating
from the object that you are looking at, but also radiation that comes from other
sources andhas beenreflected by the target. Most of the time, electrical components
are like mirrors to the infrared radiation, even if it is not obvious to the eye. Bare
metal parts are particularly shiny, whereas painted, plastic or rubber insulated parts
are mostly not. In the image below, you can clearly see a reflection from the thermographer. This is of course not a hot spot on the object. A good way to find out if what
you see is a reflection or not, is for you to move. Look at the target from a different
angle and watch the ‘hot spot.’ If it moves when you do, it is a reflection.
Measuring temperature of mirror like details is not possible. The object in the images
below has painted areas which are well suited for temperature measurement. The
material is copper, which is a very good heat conductor. This means that temperature
variation over the surface is small.
10717503;a2
7
Figure 7.11 Reflections in an object
7.5.2 Solar heating
The surface of a component with a high emissivity, for example, a breaker, can on a
hot summer day be heated up to quite considerable temperatures by irradiation from
the sun. The image shows a circuit breaker, which has been heated by the sun.
30 Publ. No. 1558407 Rev. a155 – ENGLISH (EN) – February 6, 2006
Page 45

7 – Introduction to thermographic inspections of electrical installations
10713803;a3
Figure 7.12 An infrared image of a circuit breaker
7.5.3 Inductive heating
10713903;a3
Figure 7.13 An infrared image of hot stabilizing weights
Eddy currents can cause a hot spot in the current path. In cases of very high currents
and close proximity of other metals, this has in some cases caused serious fires. This
type of heating occurs in magnetic material around the current path, such as metallic
bottom plates for bushing insulators. In the image above, there arestabilizing weights,
through which a high current is running. These metal weights, which are made of a
slightly magnetic material, will not conduct any current but are exposed to the alternating magnetic fields, which will eventually heat up the weight. The overheating in
the image is less than +5°C (+9°F). This, however, need not necessarily always be
the case.
7
7.5.4 Load variations
3-phase systems are the norm in electric utilities. When looking foroverheated places,
it is easy to compare the three phases directly with each other, for example, cables,
breakers, insulators. An even load per phase should result in a uniform temperature
pattern forall threephases. Afault maybe suspectedin caseswhere the temperature
of onephase differs considerably from the remaining two. However, you should always
make sure that the load is indeed evenly distributed. Looking at fixed ampere meters
or using a clip-on ampere meter (up to 600 A) will tell you.
Publ. No. 1558407 Rev. a155 – ENGLISH (EN) – February 6, 2006 31
Page 46

7 – Introduction to thermographic inspections of electrical installations
10714003;a3
Figure 7.14 Examples of infrared images of load variations
The image to the left shows three cables next to each other. They are so far apart that
they can be regarded as thermally insulated from each other. The one in the middle
is colder than the others. Unless two phases arefaulty and overheated, this is a typical
example of a very unsymmetrical load. The temperature spreads evenly along the
cables, which indicates a load-dependent temperature increase rather than a faulty
connection.
The image to the right shows two bundles with very different loads. In fact, the bundle
7
to the right carries next to no load. Those which carry a considerable current load,
are about 5°C (9°F) hotter than those which do not. No fault to be reported in these
examples.
7.5.5 Varying cooling conditions
10714103;a3
Figure 7.15 An infrared image of bundled cables
When, for example, a number of cables are bundled together it can happen that the
resulting poorcooling of the cables in the middle can lead to them reaching very high
temperatures. See the image above.
The cables to the right in the image do not show any overheating close to the bolts.
In the vertical part of the bundle, however, the cables are held together very tightly,
the cooling of the cables is poor, the convection can not take the heat away, and the
cables arenotably hotter, actually about 5°C (9°F) above the temperature ofthe better
cooled part of the cables.
32 Publ. No. 1558407 Rev. a155 – ENGLISH (EN) – February 6, 2006
Page 47

7 – Introduction to thermographic inspections of electrical installations
7.5.6 Resistance variations
Overheating can have many origins. Some common reasons are described below.
Low contact pressure can occur when mounting a joint, or through wear of the mate-
rial, for example, decreasing spring tension, worn threads in nuts and bolts, even too
much force applied at mounting. With increasing loads and temperatures, the yield
point of the material is exceeded and the tension weakens.
The image to the left below shows a bad contact due to a loose bolt. Since the bad
contact is of very limited dimensions, it causes overheating only in a very small spot
from which the heat is spread evenly along the connecting cable. Note the lower
emissivity ofthe screw itself, whichmakes it look slightly colder than the insulated—and
thereby it has a high emissivity—cable insulation.
The image to the right shows another overheating situation, this time again due to a
loose connection. It is an outdoor connection, hence it is exposed to the cooling effect
of the wind and it is likely that the overheating wouldhave showna higher temperature,
if mounted indoors.
10714203;a3
7
Figure 7.16 LEFT: An infrared image showing bad contact due to a loose bolt; RIGHT: A loose outdoor
connection, exposed to the wind cooling effect.
7.5.7 Overheating in one part as a result of a fault in another
Sometimes, overheating can appear in a component although that component is OK.
The reason is that two conductors share the load. One of the conductors has an increased resistance, but the other is OK. Thus, the faulty component carries a lower
load, whereas the fresh one has to take a higher load, which may be too high and
which causes the increased temperature. See the image.
Publ. No. 1558407 Rev. a155 – ENGLISH (EN) – February 6, 2006 33
Page 48

7 – Introduction to thermographic inspections of electrical installations
10714303;a3
Figure 7.17 Overheating in a circuit breaker
The overheating of this circuit breaker is most probably caused by bad contact in the
near finger of the contactor. Thus, the far finger carries more current and gets hotter.
The component in the infrared image and in the photo is not the same, however, it is
similar).
7
34 Publ. No. 1558407 Rev. a155 – ENGLISH (EN) – February 6, 2006
Page 49

7 – Introduction to thermographic inspections of electrical installations
7.6 Disturbance factors at thermographic inspection of electrical installations
During thermographic inspections of different types of electrical installations, disturbance factors such as wind, distance to object, rain or snow often influence the
measurement result.
7.6.1 Wind
During outdoorinspection, the cooling effect of the wind should be taken intoaccount.
An overheating measured at a wind velocity of 5 m/s (10 knots) will be approximately
twice as high at 1 m/s (2 knots). An excess temperature measured at 8 m/s (16 knots)
will be 2.5 times as high at 1 m/s (2 knots). This correction factor, which is based on
empirical measurements, is usually applicable up to 8 m/s (16 knots).
There are, however, cases when you have to inspect even if the wind is stronger than
8 m/s (16 knots). There are many windy places in the world, islands, mountains, and
so on but it is important to know that overheated components found would have
shown a considerably higher temperature at a lower wind speed. The empirical correction factor can be listed.
Correction factorWind speed (knots)Wind speed (m/s)
121
1.3642
7
1.6463
1.8684
2.06105
2.23126
2.40147
2.54168
The measured overheating multiplied by the correction factor gives the excess temperature with no wind, that is, at 1 m/s (2 knots).
7.6.2 Rain and snow
Rain and snow also have a cooling effect on electrical equipment. Thermographic
measurement can still be conducted with satisfactory results during light snowfall
with dry snow and light drizzle, respectively. The image qualitywill deteriorate in heavy
Publ. No. 1558407 Rev. a155 – ENGLISH (EN) – February 6, 2006 35
Page 50

7 – Introduction to thermographic inspections of electrical installations
snow or rain and reliable measurement is no longer possible. This is mainly because
a heavy snowfall as well as heavy rain is impenetrable to infrared radiation and it is
rather the temperature of the snowflakes or raindrops that will be measured.
7.6.3 Distance to object
This image is taken from a helicopter 20 meters (66 ft.) away from this faulty connection. The distance was incorrectly set to 1 meter (3 ft.) and the temperature was
measured to+37.9°C (+100.2°F).The measurementvalue afterchanging the distance
to 20 meters (66 ft.), which was done afterwards, is shown in the image to the right,
where the corrected temperature is +38.8°C (+101.8°F). The difference is not too
crucial, but may take the fault into a higher class of seriousness. So the distance
setting must definitely not be neglected.
10714403;a3
7
Figure 7.18 LEFT: Incorrect distance setting; RIGHT: Correct distance setting
The images below show the temperature readings from a blackbody at +85°C
(+185°F) at increasing distances.
10714503;a3
Figure 7.19 Temperature readings from a blackbody at +85°C (+185°F) at increasing distances
36 Publ. No. 1558407 Rev. a155 – ENGLISH (EN) – February 6, 2006
Page 51

7 – Introduction to thermographic inspections of electrical installations
The measured average temperatures are, from left to right, +85.3°C
(+185.5°F),+85.3°C (+185.5°F), +84.8°C (+184.6°F), +84.8°C (+184.6°F), +84.8°C
(+184.6°F) and +84.3°C (+183.7°F) from a blackbody at +85°C (+185°F). The thermograms are taken with a 12° lens. The distances are 1, 2, 3, 4, 5 and 10 meters (3,
7, 10, 13, 16 and 33 ft.). The correction for the distance has been meticulously set
and works, because the object is big enough for correct measurement.
7.6.4 Object size
The second series of images below shows the same but with the normal 24° lens.
Here, the measured average temperatures of the blackbody at +85°C (+185°F) are:
+84.2°C (+183.6°F), +83.7°C (+182.7°F), +83.3°C (+181.9°F), +83.3°C(+181.9°F),
+83.4°C (+181.1°F) and +78.4°C (+173.1°F).
The last value, (+78.4°C (+173.1°F)), is the maximum temperature as it was not
possible to place a circle inside the now very small blackbody image. Obviously, it
is not possible to measure correct values if the object is too small. Distance was
properly set to 10 meters (33 ft.).
10714603;a3
7
Figure 7.20 Temperature readings from ablackbody at +85°C (+185°F) atincreasing distances (24° lens)
The reason for this effect is that there is a smallest object size, which gives correct
temperature measurement. This smallest size is indicated to the user in all FLIR Systems cameras. The image below shows what you see in the viewfinder of camera
model 695. The spot meter has an opening in its middle,more easily seen in the detail
to the right. The size of the object hasto be bigger than that opening or some radiation
from its closest neighbors, which are much colder, will come into the measurement
as well, strongly lowering the reading. In the above case, where we have a pointshaped object, which is much hotter than the surroundings, the temperature reading
will be too low.
Publ. No. 1558407 Rev. a155 – ENGLISH (EN) – February 6, 2006 37
Page 52

7 – Introduction to thermographic inspections of electrical installations
10714703;a3
Figure 7.21 Image from the viewfinder of a ThermaCAM 695
This effect is due to imperfections in the opticsand to the size of the detector elements.
It is typical for all infrared cameras and can not be avoided.
7
38 Publ. No. 1558407 Rev. a155 – ENGLISH (EN) – February 6, 2006
Page 53

7 – Introduction to thermographic inspections of electrical installations
7.7 Practical advice for the thermographer
Working in a practical way with a camera, you will discover small things that make
your job easier. Here are ten of them to start with.
7.7.1 From cold to hot
You have been out with the camera at +5°C (+41°F). To continue your work, you
now have to perform the inspection indoors. If you wear glasses, you are used to
having towipe offcondensed water, or you will not be able to see anything. The same
thing happens with the camera. To measure correctly, you should wait until the
camera has become warm enough for the condensation to evaporate. This will also
allow for the internal temperature compensation system to adjust to the changed
condition.
7.7.2 Rain showers
If it starts raining you should not perform the inspection because the water will drastically change the surface temperature of the object that you are measuring. Nevertheless, sometimes you need to use the camera even under rain showers or splashes.
Protect your camera with a simple transparent polyethylene plastic bag. Correction
for the attenuation which is caused by the plastic bag can be made by adjusting the
object distance until the temperature reading is the same as without the plastic cover.
Some camera models have a separate External optics transmission entry.
7
7.7.3 Emissivity
You have to determine the emissivity for the material, which you are measuring.
Mostly, you will not find the value in tables. Use optical black paint, that is, Nextel
Black Velvet. Paint a small piece of the material you are working with. The emissivity
of the optical paint is normally 0.94. Remember that the object has to have a temperature, which is different—usually higher—than the ambient temperature. The larger
the difference the better the accuracy in the emissivity calculation. The difference
should be at least 20°C (36°F). Remember that there are other paints that support
very high temperatures up to +800°C (+1472°F). The emissivity may, however, be
lower than that of optical black.
Sometimes you can not paint the object that you are measuring. In this case you can
use a tape. A thin tape for which you have previously determined the emissivity will
work in most cases and you can remove it afterwards without damaging the object
of your study. Pay attention to the fact that some tapes are semi-transparent and thus
are not very good for this purpose. One of the best tapes for this purpose is Scotch
electrical tape for outdoor and sub-zero conditions.
Publ. No. 1558407 Rev. a155 – ENGLISH (EN) – February 6, 2006 39
Page 54

7 – Introduction to thermographic inspections of electrical installations
7.7.4 Reflected apparent temperature
You are in a measurement situation where thereare several hot sources that influence
your measurement. You need to have the right value for the reflected apparent temperature to input into the camera and thus get the best possible correction. Do it in
this way: set the emissivity to 1.0. Adjust the camera lens to near focus and, looking
in the opposite direction away from the object, save one image. With the area or the
isotherm, determine the most probable value of the average of the image and use
that value for your input of reflected apparent temperature.
7.7.5 Object too far away
Are you in doubt that the camera you have is measuring correctly at the actual distance? A rule of thumb for your lens is to multiply the IFOV by 3. (IFOV is the detail
of the object seen by one single element of the detector). Example: 25 degrees correspond to about 437 mrad. If your camera has a 120 × 120 pixel image, IFOV becomes 437/120 = 3.6 mrad (3.6 mm/m) and your spot size ratio is about
1000/(3 × 3.6)=92:1. This means that at a distance of 9.2 meters(30.2 ft.), your target
has to be at least about 0.1 meter or 100 mm wide (3.9"). Try to work on the safe side
by coming closer than 9 meters (30 ft.). At 7–8 meters (23–26 ft.), your measurement
7
should be correct.
40 Publ. No. 1558407 Rev. a155 – ENGLISH (EN) – February 6, 2006
Page 55

8 Tutorials
8.1 Switching on & switching off the camera
8.1.1 Switching on the camera
ActionStep
Insert the battery into the battery compartment.1
Press PWR/NO to switch on the camera.2
8.1.2 Switching off the camera
ActionStep
1
To switch off the camera,press and holddown PWR/NO untilthe message Shutting
down... appears. Briefly pressing PWR/NO when the camera is in menu mode will
cancel menu selections.
8
Publ. No. 1558407 Rev. a155 – ENGLISH (EN) – February 6, 2006 41
Page 56

8 – Tutorials
8.2 Working with images
8.2.1 Acquiring an image
ActionStep
Point the camera at a warm object, like a face or a hand.1
2
3
Adjust the focus by turning the focus ring at the front of the lens.
➲ Please note what is the locking ring and what is the focus ring in the figure on
page 52. Trying to adjust the focus by rotating the locking ring will remove the
lens.
If the camera is in manual adjust mode, press and hold down SEL for more than
one second to autoadjust the camera.
8.2.2 Freezing an image
ActionStep
1
2
8
3
Adjust focus by turning the focus ring at the front of the lens.
➲ Please note what is the locking ring and what is the focus ring in the figure on
page 52. Trying to adjust the focus by rotating the locking ring will remove the
lens.
If the camera is in manual adjust mode, press and hold down SEL for more than
one second to autoadjust the camera.
Briefly pressing SAVE/FRZ will display a confirmation box.
To save the image, press YES
■
To leave the confirmation box without saving the image, press NO
■
8.2.3 Saving an image
ActionStep
1
Adjust the focus by turning the focus ring at the front of the lens.
➲ Please note what is the locking ring and what is the focus ring in the figure on
page 52. Trying to adjust the focus by rotating the locking ring will remove the
lens.
2
3
4
If the camera is in manual adjust mode, press and hold down SEL for more than
one second to autoadjust the camera.
Briefly press SAVE/FRZ to freeze the image. This will display a confirmation box
where you will be prompted to accept or cancel the image. Accepting the image
will save it to the internal memory.
To save an image directly (without freezing the image first), press SAVE/FRZ for
more than 1 second.
42 Publ. No. 1558407 Rev. a155 – ENGLISH (EN) – February 6, 2006
Page 57

8.2.4 Deleting one or several images
ActionStep
Press MENU/YES to display the vertical menu bar.1
Point to File on the vertical menu bar and press the MENU/YES.2
8 – Tutorials
3
Point to Delete image or Delete all images and press MENU/YES to delete one
or several images.
8.2.5 Opening an image
ActionStep
Press MENU/YES to display the vertical menu bar.1
Point to File on the vertical menu bar and press MENU/YES.2
Point to Images to display thumbnails of the most recently saved images.3
4
To open an image, select the image by pressing the navigation pad left/right or
up/down and then press MENU/YES.
8
Publ. No. 1558407 Rev. a155 – ENGLISH (EN) – February 6, 2006 43
Page 58

8 – Tutorials
8.3 Working with measurements
8.3.1 Laying out a spot
➲ The camera requires a warm-up time of 5 minutes before accurate measurements
can be expected.
ActionStep
Press MENU/YES to display the vertical menu bar.1
Point to Meas. mode on the vertical menu bar and press MENU/YES.2
Select Spot in the Meas. mode dialog box and press MENU/YES.3
4
Press SEL until small brackets appear around the spot. You can now move the
spot by pressing the navigation pad left/right or up/down.
To add additional spots, repeat step 1–4. A maximum number of three spots can
be added.
The temperature will be displayed in the top right corner of the LCD.5
8.3.2 Laying out a measurement area
➲ The camera needs a warm-up time of 5 minutes before accurate measurements
can be expected.
8
ActionStep
Press MENU/YES to display the vertical menu bar.1
Point to Meas. mode on the vertical menu bar and press MENU/YES.2
3
Select Area max, Area min or Area avg in the Meas. mode dialog box and press
MENU/YES.
The temperature will be displayed in the top right corner of the LCD.4
44 Publ. No. 1558407 Rev. a155 – ENGLISH (EN) – February 6, 2006
Page 59

8 – Tutorials
8.4 Working with alarms
You can choose between the following alarm outputs:
■ a color alarm, which will assign a color to all pixels above or below a preset tem-
perature level
■ a silent alarm, which, compared to the color alarm, will make the font of the temper-
ature result increase in size and its background turn red
■ an audible alarm, which, compared to the visual alarm, also triggers a ’beep’.
A settings can also be made in the camera so that an alarm output takes into account
the referencetemperature. A typical application when you would want to use an alarm
that takes into account the reference temperature is screening of people for face
temperature detection.
Firstly, the reference temperature is set by screening 10 persons with normal face
temperature. The camera puts each of these 10 results in an internal camera buffer
and calculates the average temperature value after having discarded the two highest
and two lowest values in the event of erroneous samples. Every time a new sample
is saved to the internal buffer, the oldest sample will be discarded and a new reference
temperature will be calculated ’on the fly’.
Using an alarm that takes into account the reference temperature means that an alarm
output will only be triggered if the temperature value exceeds the sum of the average
temperature value in the buffer + the user-defined delta alarm offset value.
8
8.4.1 Setting the reference temperature
ActionStep
Press YES to display the vertical menu bar.1
Point to Settings on the Setup menu and press YES.2
3
6
Publ. No. 1558407 Rev. a155 – ENGLISH (EN) – February 6, 2006 45
In the Settings dialog box, press the navigation pad up/down to go to Trigger
button.
Press the navigation pad left/right to select Update ref temp.4
Press the navigation pad up/down to go to Shutter period.5
Press the navigation pad left/right to select shutter period.
Although the shutter period works independently of other functions described in
this document, FLIR Systems recommends that Short is selected when using the
camera for detection of face temperature.
➲ Selecting Normal will calibrate the camera at least every 15th minute, while se-
lecting Short will calibrate the camera at least every 3rd minute.
Page 60

8 – Tutorials
ActionStep
7
8
Pointing the camera to the first personwith a normal face temperature and pulling
the trigger will display the message Sampled nn.n °C.
After having carried out the same procedure on the following 9 persons, you can
do one of the following:
Actively continueto sample everynewperson by pullingthe trigger button, and
■
let camera update the reference temperature
Stop sampling andlet the camera trigger an alarm as soon as the alarm condi-
■
tions are met (> reference temperature + delta alarm value)
8.4.2 Setting up a color alarm
8.4.2.1 Setting up a color alarm using the menu system
ActionStep
Press MENU/YES to display the vertical menu bar.1
Point to Meas. mode and press YES to display the Meas. mode dialog box.2
3
4
8
6
Select Meas. mode by pressing the navigation pad left/right. The alarm function
is typically used together with Area max.
For Alarm, select one of the following by pressing the navigation pad left/right:
Above
■
Below
■
For Alarm output, select Color only by pressing the navigation pad left/right.5
Specify the Alarm temp by pressing the navigation pad left/right. You can also
change the color alarmwithout using the menu systemby pressing the navigation
pad up/down after having selected the temperature result by pressing SEL. A selected temperature result is highlighted in yellow.
➲ Alarm temp will only be availableif Update ref temp has been previously selected
in the Settings dialog box.
7
Specify Delta alarm by pressing the navigation pad left/right.
➲ Delta alarm will only be availableif Update ref temp has been previously selected
in the Settings dialog box.
8.4.2.2 Setting up a color alarm without using the menu system
ActionStep
1
Press SEL until the color alarmsymbol and the color alarm temperature in the top
right hand corner of the screen is selected.
The color alarm symbol is an arrow pointing upwards or downwards.
Press the navigation pad up/down to change the color alarm temperature.2
46 Publ. No. 1558407 Rev. a155 – ENGLISH (EN) – February 6, 2006
Page 61

8.4.3 Setting up a silent alarm (i.e. a visual alarm)
ActionStep
Press MENU/YES to display the vertical menu bar.1
Point to Meas. mode and press YES to display the Meas. mode dialog box.2
8 – Tutorials
3
Select Meas. mode by pressing the navigation pad left/right. The alarm function
is typically used together with Area max.
4
For Alarm, select one of the following by pressing the navigation pad left/right:
Above
■
Below
■
For Alarm output, select Silent by pressing the navigation pad left/right.5
6
Specify the Alarm temp by pressing the navigation pad left/right.
➲ Alarm temp will only be availableif Update ref temp has been previously selected
in the Settings dialog box.
7
Specify Delta alarm by pressing the navigation pad left/right.
➲ Delta alarm will only be availableif Update ref temp has been previously selected
in the Settings dialog box.
8.4.4 Setting up an audible alarm
ActionStep
Press MENU/YES to display the vertical menu bar.1
Point to Meas. mode and press YES to display the Meas. mode dialog box.2
3
4
Select Meas. mode by pressing the navigation pad left/right. The alarm function
is typically used together with Area max.
For Alarm, select one of the following by pressing the navigation pad left/right:
Above
■
Below
■
For Alarm output, select Beep by pressing the navigation pad left/right.5
8
6
Specify the Alarm temp by pressing the navigation pad left/right.
➲ Alarm temp will only be be available if Update ref temp has been previously
selected in the Settings dialog box.
7
Specify Delta alarm by pressing the navigation pad left/right.
➲ Delta alarm will only be availableif Update ref temp has been previously selected
in the Settings dialog box.
Publ. No. 1558407 Rev. a155 – ENGLISH (EN) – February 6, 2006 47
Page 62

8 – Tutorials
8.5 Creating files for image descriptions
Follow this procedure to create a text file where any value of the first label will be used
as an image description:
ActionStep
1
2
3
5
8
Using any ASCII text editor (Notepad, Wordpad etc), type the first label within
brackets:
<Recommendation>
On the next lines, type the values you want to use, but this time without brackets:
Check connections
Check cables
Check gaskets
Check mountings
The final result should look like this:
<Recommendation>
Check connections
Check cables
Check gaskets
Check mountings
Save the file to Desktop, using any file name you want.4
Rename the file name extension to .tcf.
Connect thecamera to yourcomputerusing ThermaCAM™ QuickView. This makes
your camera appear as a hard disk drive in Windows® Explorer.
Move the file from Desktop to your camera using a drag-and-drop operation.6
➲ For information about how to connect the camera to your computer, see the ThermaCAM™ QuickView user’s manual.
48 Publ. No. 1558407 Rev. a155 – ENGLISH (EN) – February 6, 2006
Page 63

8.6 Changing level & span
8.6.1 Changing level
ActionStep
Press MENU/YES to display the vertical menu bar.1
Point to Manual adjust on the vertical menu bar and press MENU/YES.2
8 – Tutorials
3
Press the navigation pad up/down to changethe level. Anarrow pointing upwards
or downwards will be displayed.
For more information about level, seesection 10.4.3 – Manual adjust/Automatic adjust
on page 70.
8.6.2 Changing span
ActionStep
Press MENU/YES to display the vertical menu bar.1
Point to Manual adjust on the vertical menu bar and press MENU/YES.2
3
Press the navigation pad left/right to change the span. Two arrows pointing away
from each other or towards each other will be displayed.
For more information about span, seesection 10.4.3– Manual adjust/Automatic adjust
on page 70.
8
Publ. No. 1558407 Rev. a155 – ENGLISH (EN) – February 6, 2006 49
Page 64

8 – Tutorials
8.7 Changing system settings
8.7.1 Changing language
ActionStep
Press MENU/YES to display the vertical menu bar.1
Point to Local Settings on the Setup menu and press MENU/YES.2
Press the navigation pad up/down to select Language.3
Press the navigation pad left/right to change the language.4
Press MENU/YES to confirm your changes and leave the dialog box.5
8.7.2 Changing temperature unit
ActionStep
Press MENU/YES to display the vertical menu bar.1
Point to Local Settings on the Setup menu and press MENU/YES.2
Press the navigation pad up/down to select Temp unit.3
Press the navigation pad left/right to change the temperature unit.4
8
Press MENU/YES to confirm your changes and leave the dialog box.5
8.7.3 Changing date format
ActionStep
Press MENU/YES to display the vertical menu bar.1
Point to Local Settings on the Setup menu and press MENU/YES.2
Press the navigation pad up/down to select Date format.3
Press the navigation pad left/right to change the date format.4
Press MENU/YES to confirm your changes and leave the dialog box.5
8.7.4 Changing time format
ActionStep
Press MENU/YES to display the vertical menu bar.1
Point to Local Settings on the Setup menu and press MENU/YES.2
Press the navigation pad up/down to select Time format.3
Press the navigation pad left/right to change the time format.4
50 Publ. No. 1558407 Rev. a155 – ENGLISH (EN) – February 6, 2006
Page 65

ActionStep
Press MENU/YES to confirm your changes and leave the dialog box.5
8.7.5 Changing date & time
ActionStep
Press MENU/YES to display the vertical menu bar.1
Point to Date/time on the Setup menu and press MENU/YES.2
8 – Tutorials
3
Press the navigation pad up/down to select year, month, day, hour, minute and
second.
Press the navigation pad left/right to change each parameter.4
Press MENU/YES to confirm your changes and leave the dialog box.5
8
Publ. No. 1558407 Rev. a155 – ENGLISH (EN) – February 6, 2006 51
Page 66

8 – Tutorials
8.8 Working with the camera
8.8.1 Removing the lens
➲ Please note the following:
■ Before trying toremove fingerprintsor other marks on the lens elements, see section
12.2 – Lenses on page 85.
■ Removing an IR lens will expose very sensitive camera parts. Do not touch any
exposed parts.
■ Please note what is the locking ring and what is the focus ring in the figure below.
Trying to remove the lens by rotating the focus ring may damage the lens.
10582103;a1
8
Figure 8.1 Removing a lens. 1: Locking ring; 2: Focus ring
52 Publ. No. 1558407 Rev. a155 – ENGLISH (EN) – February 6, 2006
Page 67

10396303;a3
Figure 8.2 Removing a lens
ActionStep
8 – Tutorials
1
Rotate the locking ring on the camera 30° counter-clock-wise until the index mark
is lined up with the laser window.
Carefully pull out the lens. Do not use excessive force.2
8.8.2 Adjusting the focus
➲ Please note what is the locking ring and what is the focus ring in figure 8.1 on page
52. Trying to adjust the focus by rotating the locking ring will remove the lens.
ActionStep
To adjust the focus, rotate the focus ring clock-wise or counter-clock-wise.1
8.8.3 Changing digital zoom factor
ActionStep
1
2
To change digital zoom factor, press SEL until the zoom indicator appears in the
left bottom corner of the screen.
10583603;a1
Do one of the following:
Press the navigation pad up or right to increase the zoom factor (1x → 2x →
■
4x)
Press the navigation pad down or left to decrease the zoom factor (4x → 2x →
■
1x)
8
➲ Please note the following:
■ The zoom factor when viewing live images will not be saved when you switch off
the camera. Default zoom factor when you switch on the camera is 1x.
Publ. No. 1558407 Rev. a155 – ENGLISH (EN) – February 6, 2006 53
Page 68

8 – Tutorials
■ When you save an image, the zoom factor will be saved too. When you open such
an image in ThermaCAM™ QuickView or ThermaCAM™ Reporter, you can change
the zoom factor again.
8.8.4 Inserting & removing the battery
➲ The camera is shipped with charged batteries. To increase the battery life, the
battery should be fully discharged and charged a couple of times. You can do this
by using the camera until the battery is fully depleted.
8.8.4.1 Inserting the battery
10396403;a2
Figure 8.3 Inserting the battery
8
ActionStep
Remove lid of the battery compartment by pressing the locking mechanism.1
2
Insert the battery with the connectors facing the rear end of the camera and the
arrow symbol facing the front end of the camera.
Replace the lid of the battery compartment.3
8.8.4.2 Removing the battery
10396503;a2
Figure 8.4 Removing the battery
54 Publ. No. 1558407 Rev. a155 – ENGLISH (EN) – February 6, 2006
Page 69

8 – Tutorials
ActionStep
Remove the lid of the battery compartment by pressing the locking mechanism.1
2
Remove the battery by firmly grabbing its rear end and carefully lifting it out from
the battery compartment.
Replace the lid of the battery compartment.3
For more information about the battery system, see section 11 – Electrical power
system on page 79.
8
Publ. No. 1558407 Rev. a155 – ENGLISH (EN) – February 6, 2006 55
Page 70

8 – Tutorials
8
56 Publ. No. 1558407 Rev. a155 – ENGLISH (EN) – February 6, 2006
INTENTIONALLY LEFT BLANK
Page 71

9 Camera overview
9.1 Camera parts
10581503;a1
9
Figure 9.1 Camera parts – front view
Description of partCallout
LCD1
IrDA infrared communication link2
Lid of the battery compartment3
Ring for hand strap4
Publ. No. 1558407 Rev. a155 – ENGLISH (EN) – February 6, 2006 57
Page 72

9 – Camera overview
Description of partCallout
5
Laser LocatIR with lens cap
➲ Please note the following:
A laser icon appears on the screen when the Laser LocatIR is switched on.
■
Since the distance between the laser beam and the image center will vary by
■
the target distance, LaserLocatIR should onlybe used asan aimingaid. Always
check the LCD to make sure the camera captures the desired target.
Do not look directly into the laser beam.
■
When not in use, the Laser LocatIR should always be protected by the lens
■
cap.
Focus ring6
Lens cap7
9
58 Publ. No. 1558407 Rev. a155 – ENGLISH (EN) – February 6, 2006
Page 73

10581903;a1
Figure 9.2 Camera parts – view from below
Description of partCallout
Tripod mount1
Trigger2
Lid of the battery compartment3
9 – Camera overview
Publ. No. 1558407 Rev. a155 – ENGLISH (EN) – February 6, 2006 59
9
Page 74

9 – Camera overview
10310603;a5
Figure 9.3 Camera parts – view from above
Description of partCallout
1
9
2
3
5
6
SEL button
For moreinformation about thefunctionality of thisbutton, see section9.2 –Keypad
buttons & functions on page 61
SAVE/FRZ button
For moreinformation about thefunctionality of thisbutton, see section9.2 –Keypad
buttons & functions on page 61
Navigation pad
For moreinformation aboutthe functionalityof the navigation pad, see section 9.2
– Keypad buttons & functions on page 61
LED indicator4
MENU/YES button
For moreinformation about thefunctionality of thisbutton, see section9.2 –Keypad
buttons & functions on page 61
PWR/NO button
For moreinformation about thefunctionality of thisbutton, see section9.2 –Keypad
buttons & functions on page 61
60 Publ. No. 1558407 Rev. a155 – ENGLISH (EN) – February 6, 2006
Page 75

9.2 Keypad buttons & functions
CommentsButton
9 – Camera overview
SAVE/FRZ button
SEL button
MENU/YES button
PWR/NO button
Navigation pad
Briefly press SAVE/FRZ to freeze the current image and display
■
a dialog box where you can choose to save or cancel the image
Press and hold down SAVE/FRZ for more than one second to
■
save the current image without previewing
➲ The image will be saved according to the syntax IRnnnn.jpg where
nnnn is a unique counter. The counter can be reset by pointing to
Factory default on the Setup menu.
➲ Approx. >80 JPG images can be saved.
Press andhold down SELfor more thanone second toautoadjust
■
the camera
Briefly press SEL toshow current navigationpad focus, i.e. which
■
screen object you can change or move by using the navigation
pad.
Press SEL repeatedly to switch between different screen objects
■
Press MENU/YES to display the vertical menu bar
■
Press MENU/YES to confirm selections in dialog boxes
■
Press MENU/YES to display the graphics if you have previously
■
selected Hide graphics on the vertical menu bar
Press PWR/NO when the camera is switched off to switch on the
■
camera
Press PWR/NO to cancel selections in dialog boxes
■
Press and hold down PWR/NO for more than two seconds to
■
switch off the camera
Press PWR/NO to leave freeze and recall mode
■
Press PWR/NO to display the graphics if you have previously
■
selected Hide graphics on the vertical menu bar.
In menu mode:
Press left/rightor up/downto navigate inmenus and dialogboxes
■
Press left/right or up/down to change or move a screen object
■
previously selected by using SEL
In manual adjust mode:
Press up/down to change the level (after having selected the
■
scale by pressing SEL)
Press left/rightto changethe span (afterhaving selected thescale
■
by pressing SEL)
For more information about level and span, see section 10.4.3 –
Manual adjust/Automatic adjust on page 70
9
Publ. No. 1558407 Rev. a155 – ENGLISH (EN) – February 6, 2006 61
Page 76

9 – Camera overview
CommentsButton
Trigger
Pull the trigger to do one of the following:
Save the image
■
Switch on or switch off the Laser LocatIR
■
Autoadjust the camera
■
Update ref. temp
■
The function of the trigger depends on the trigger settings in the
Settings dialog box. For more information about trigger settings,
see section 10.4.9.1 – Settings on page 74
9
62 Publ. No. 1558407 Rev. a155 – ENGLISH (EN) – February 6, 2006
Page 77

9 – Camera overview
9.3 Laser LocatIR
By pulling the trigger on the bottom side of the camera body, a laser dot appears
approx. 40 mm/1.57" above the target.
➲ Please note the following:
■ A laser icon appears on the screen when the Laser LocatIR is switched on.
■ Since the distance between the laser beam and the image center will vary by the
target distance,Laser LocatIR should only be used as an aiming aid. Alwayscheck
the LCD to make sure the camera captures the desired target.
■ Do not look directly into the laser beam.
■ When not in use, the Laser LocatIR should always be protected by the lens cap.
For more information about trigger settings, see section 10.4.9.1 – Settings on page
74.
10376403;a2
Figure 9.4 Wavelength: 635 nm. Max. output power: 1 mW. This product complies with 21 CFR 1040.10
and 1040.11 except for deviations pursuant to Laser Notice No. 50, dated July 26th, 2001
10581703;a1
Figure 9.5 Distance between the laser beam and the image center
Publ. No. 1558407 Rev. a155 – ENGLISH (EN) – February 6, 2006 63
9
Page 78

9 – Camera overview
9.4 LED indicator on keypad
Figure 9.6 Explanations of the LED indicator on the keypad
ExplanationIndicator mode
Powering up or operating.Continuous green light
Battery charging in standby mode.Flashing green light
(0.25 sec. switched on + 0.25 sec. switched off)
Battery charging in power-on mode.Flashing green light
(3 sec. switched on + 0.06 sec. switched off)
No light
The camerais switchedoff,or the LCDis temporarily switched off.
9
64 Publ. No. 1558407 Rev. a155 – ENGLISH (EN) – February 6, 2006
Page 79

10 Camera program
10.1 Result table
The results of measurement markers are displayed in a result table in the top righthand corner of the screen.
Figure 10.1 Explanation of measurement markers appearing in the result table
ExplanationIcon
Spot
Area, maximum temperatureMax
Area, minimum temperatureMin
Area, average temperature
1
1
✴
Color alarm above
Color alarm below
Difference between spot 1 and spot 2
The ✴ symbol indicates uncertain result due to an internal updating
process after the range has been changed or the camera has been
started. The symbol disappears after 15 seconds.
10
Publ. No. 1558407 Rev. a155 – ENGLISH (EN) – February 6, 2006 65
Page 80

10 – Camera program
10.2 System messages
10.2.1 Status messages
Status messages are displayed at the bottom of the screen, or in the top left part of
the screen. Here you will find information about the current status of the camera.
Figure 10.2 Status messages – a few examples
ExplanationMessage
Message is displayed when the image is frozen.Frozen
Manual
Restarting
Message isdisplayedwhen the camera iscurrentlyin manual adjust
mode.
Message is displayed during operations that take some time.Please wait
Message is displayed when the software is restarted, i.e. after Fac-
tory default.
Message is displayed while an image is being saved.Saving as
10.2.2 Warning messages
Warning messages are displayed in the center of the screen. Here you will find important information about battery status, for example.
Figure 10.3 Critical camera information – a few examples
ExplanationMessage
The battery level is below a critical level.Battery low
The camera will be switched off immediately.Shutting down
10
The camera will be switched off in 2 seconds.Shutting down in 2 seconds
66 Publ. No. 1558407 Rev. a155 – ENGLISH (EN) – February 6, 2006
Page 81

10 – Camera program
10.3 Selecting screen objects
10.3.1 Selecting screen objects
Some screen objects – e.g. the scale, the information field, a spot etc. – can be selected by pressing SEL repeatedly until the object is either highlighted or surrounded
by small brackets. After three seconds the cursor will automatically be hidden.
Pressing SEL or the navigation pad will display the cursor again.
When an object is selected you can use the navigation pad to change its value or,
where applicable, change its position.
10.3.2 Examples of selected screen objects
10383303;a4
Figure 10.4 A selected measurement marker (spot). Press the navigation pad at this stage to move the
spot.
10383503;a4
Figure 10.5 A selected temperature scale. Press the navigation padup/down at this stage to increase/decrease the level, and left/right to increase/decrease the span.
Publ. No. 1558407 Rev. a155 – ENGLISH (EN) – February 6, 2006 67
10
Page 82

10 – Camera program
10383403;a3
Figure 10.6 A selected color alarm. Press the navigation pad up/down at this stage to increase/decrease
the color alarm temperature.
10383803;a3
Figure 10.7 A selected emissivity field.Press the navigationpad up/down atthis stage to increase/decrease
the emissivity.
10
68 Publ. No. 1558407 Rev. a155 – ENGLISH (EN) – February 6, 2006
Page 83

10 – Camera program
10.4 Menu system
10.4.1 Navigating the menu system
■ Press MENU/YES to display the vertical menu bar
■ Press MENU/YES to confirm selections in menus and dialog boxes
■ Press PWR/NO to exit the menu system
■ Press PWR/NO to cancel selections in menus and dialog boxes
■ Press the navigation pad up/down to move up/down in menus, submenus and di-
alog boxes
■ Press the navigation pad right/left to move right/left in menus and submenus, and
to change values in dialog boxes
10.4.2 Meas. mode
10429603;a2
Figure 10.8 Meas. mode dialog box
Figure 10.9 Explanations of the Meas. mode dialog box
ExplanationValueLabel
Meas. mode
None
■
Spot
■
Area max
■
Area min
■
Area avg
■
Diff spots
■
Select None to disable themeasurementmode.
■
Select Spot to layout a spot,where thetemper-
■
ature of the spot will be displayed in the result
table.
Select Area max to lay out an area on the
■
screen, wherethe maximum temperaturein the
area will be displayed in the result table. A
measurement markerinside the areawill continuously indicate the maximum temperature.
Select Area min to lay out an area on the
■
screen, where the minimum temperature in the
area will be displayed in the result table. A
measurement markerinside the areawill continuously indicate the minimum temperature.
Select Area avg to lay out an area on the
■
screen, where the average temperature in the
area will be displayed in the result table.
Select Diff spots to calculate the difference
■
between two spots and display this difference
in the result table.
Publ. No. 1558407 Rev. a155 – ENGLISH (EN) – February 6, 2006 69
10
Page 84

10 – Camera program
ExplanationValueLabel
Alarm
Alarm output
Off
■
Above
■
Below
■
Color only
■
Silent
■
Beep
■
N/ADelta alarm
User-definedRef temp
User-definedAlarm temp
10
10.4.3 Manual adjust/Automatic adjust
Select Off to disable the alarm
■
Select Above to assign an alarm color to all
■
pixels above the alarm temperature
Select Below to assign an alarm color to all
■
pixels below the alarm temperature
Select Color only to assign only a color to the
■
pixels when an alarm is triggered.
Select Silent to additionally make the font of
■
the temperature result increase in size and be
displayed againsta redbackground (i.e. a visual alarm)
Select Beep to additionally make the camera
■
trigger a beep when an alarm is triggered.
Enter an delta alarmvalue bypressing the navigation pad left/right.
➲ This label is only available if Update ref temp
has beenpreviously selected inthe Settings dialog
box.
For information purposes only.
The referencetemperature is calculatedand updat-
ed ’on the fly’.
➲ This label is only available if Update ref temp
has beenpreviously selected inthe Settings dialog
box.
Enter a temperature value by pressing the navigation pad left/right.
Point to Manual adjust and press MENU/YES to manually select level and span settings. Thelevel commandcan beregarded asthe brightness,while thespan command
can be regarded as the contrast.
■ Press the navigation pad up/down to change the level (indicated by an arrow
pointing upwards or downwards in the temperature scale)
■ Press the navigation pad left/right to change the span (indicated by two arrows
pointing away from each other or towards each other)
70 Publ. No. 1558407 Rev. a155 – ENGLISH (EN) – February 6, 2006
Page 85

10 – Camera program
10392103;a3
Figure 10.10 Symbols in the temperature scale, indicating (1) increasing span; (2) decreasing span; (3)
increasing level, and (4) decreasing level
Point to Automatic adjust and pressMENU/YES toput the camera in automatic mode,
continuously optimizing the image for best level and span.
10.4.4 Emissivity
10438903;a2
Figure 10.11 Emissivity dialog box
Point to Emissivity on the vertical menu bar and press MENU/YES to display the
Emissivity dialog box.
■ To change the emissivity, press the navigation pad right/left
■ To display an emissivity table and select a value from the table, press Emissivity
table
■ To confirm the choice, press MENU/YES
■ To cancel any changes, press PWR/NO
■ Tochange T Refl (reflected ambient temperature), press the navigation pad right/left
■ To confirm the choice, press MENU/YES
■ To cancel any changes, press PWR/NO
For more information about emissivity andreflected ambient temperature, see section
16 – Thermographic measurement techniques on page 109 and section 18 – Theory
of thermography on page 119
➲ Please note the following:
■ When the scale is selected, you can change the emissivity directly by using the
navigation pad.
Publ. No. 1558407 Rev. a155 – ENGLISH (EN) – February 6, 2006 71
10
Page 86

10 – Camera program
■ If you enter an emissivity value less than 0.30 the emissivity box will begin flashing
to remind you that this value is unusually low.
10.4.5 Palette
10382603;a4
Figure 10.12 Palette dialog box
Point to Palette on the vertical menu bar and press MENU/YES to display the Palette
dialog box.
■ To select another palette, press the navigation pad left/right
■ To confirm the choice, press MENU/YES
■ To cancel any changes, press PWR/NO
10.4.6 Range (extra option)
Point to Range on the vertical menu bar and press MENU/YES to display the Range
dialog box.
■ To select another temperature range, press the navigation pad left/right
■ To confirm the choice, press MENU/YES
■ To cancel any changes, press PWR/NO
➲ If a specific temperature range requires a high temperature filter, a message will
appear asking you to mount the high temperature filter on the lens. When you select
another temperature range, a similar message will appear asking you to remove the
high temperature filter.
10.4.7 Hide graphics / Show graphics
10
Point to Hide graphics on the vertical menu bar and press MENU/YES to hide all
graphics currently displayed on the screen. To display the graphics again, either:
■ Point to Show graphics on the menu, or
■ Briefly press SEL, or
■ Briefly press MENU/YES, or
■ Briefly press PWR/NO
➲ The laser icon overrides the Hide graphics menu selection. This means that even
though Hide graphics is selected when the Laser LocatIR is lit, the laser icon will still
be displayed on the screen.
72 Publ. No. 1558407 Rev. a155 – ENGLISH (EN) – February 6, 2006
Page 87

10.4.8 File
10567703;a2
Figure 10.13 File menu
Figure 10.14 Explanations of the File menu
ExplanationCommand
10 – Camera program
Images
Delete image
Delete all images
Point to Images and press the joystick to display a thumbnail view
of the images in the internal camera memory. Open an image by
selecting the image using the joystick, then pressing MENU/YES.
10568903;a1
Point to Delete image and press MENU/YES to delete a recalled
image.
This choice will display a confirmation box where you can either
confirm or cancel the deletion.
Point toDelete all images and press MENU/YESto delete allimages.
This choice will display a confirmation box where you can either
confirm or cancel the deletion.
10
Publ. No. 1558407 Rev. a155 – ENGLISH (EN) – February 6, 2006 73
Page 88

10 – Camera program
ExplanationCommand
Image description
Point to Image description and press MENU/YES to display the
Image description dialog box. Using this feature, you can add a
brief description to an image one of the following ways:
By sending a Pocket Wordfile (*.psw) from a PDAto the camera,
■
using the IrDA infrared communication link
By letting the cameraread any value of thefirst label in a standard
■
FLIR Systems *.tcf file (text comment file) located in the camera
file system, and use this value as the image description
The image description can be read out by other software – e.g.
ThermaCAM™ QuickView.
➲ For information about how to create files for image descriptions,
see section 8.5 – Creating files for image descriptions on page 48
➲ Approx. >80 radiometric JPG images can be saved.
10.4.9 Setup
10383003;a4
Figure 10.15 Setup menu
10.4.9.1 Settings
10567203;a2
10
Figure 10.16 Settings dialog box
Figure 10.17 Explanations of the Settings dialog box
ExplanationValueLabel
Scale
On
■
Off
■
Select On to display the scale on the screen
■
Select Off to hide the scale
■
74 Publ. No. 1558407 Rev. a155 – ENGLISH (EN) – February 6, 2006
Page 89

10 – Camera program
ExplanationValueLabel
Info field
Trigger
LCD intensity
Auto power off
On
■
Off
■
On + TRefl
■
Laser
■
Save
■
Disabled
■
One-shot autoadjust
■
Update ref. temp.
■
Low intensity of the
■
LCD
Medium
■
High
■
None
■
2 min
■
5 min
■
10 min
■
Select On to display the informationfield at the
■
bottom of the screen
Select Off to hide the information field
■
Select On + TRefl to display the information
■
field and the reflected ambient temperature
Select Laser to activate the laser when pulling
■
the trigger
Select Save to save the current image when
■
pulling the trigger
Select Disabled to disable the trigger
■
Select One-shot autoadjust to autoadjust the
■
camera when pulling the trigger
Select Update ref. temp to update the reference
■
temperature when pulling the trigger
If Update ref. temp. is selected:
By pulling the trigger for more than 1 second, a
dialog displaying the message Restart ref temp
at nn.n °C? will appear.
Do one of the following:
Select OK to purge the internal camera buffer
■
and begin a new sampling sequence
Select Cancel to leave the dialog box
■
Select Low to setthe LCD intensityto the lowest
■
level
Select Medium to set the LCD intensity to
■
medium level
Select High to set the LCD intensity to the
■
highest level
If the camera isswitched on butcurrently not used,
it will automatically beswitched off after a specified
time.
Set the time by pressing the navigation pad
left/right.
10
Display power off
■
■
■
■
None
30 sec.
60 sec.
2 min.
If the camera isswitched on butcurrently not used,
the display will automatically be switched off after
a specified time.
Set the time by pressing the navigation pad
left/right.
Prompt img. desc.
On
■
Off
■
If you want to be prompted for adding an image
description when saving an infrared image, select
On.
Publ. No. 1558407 Rev. a155 – ENGLISH (EN) – February 6, 2006 75
Page 90

10 – Camera program
➲ For protective reasons, the LCD will be switched off if the detector temperature
exceeds +60 °C (+149 °F) and the camera will be switched off if the detector temperature exceeds +68 °C (+154.4 °F)
10.4.9.2 Date/time
10382103;a3
Figure 10.18 Date/time dialog box
Figure 10.19 Explanations of the Date/time dialog box
ExplanationLabel
1970–2036Year
1–12Month
1–31Day
Hour
10
12 a.m.–12 p.m.
■
1–24
■
The format depends on the settings in the Local Settings dialog
box.
00–59Minute
00–59Second
76 Publ. No. 1558407 Rev. a155 – ENGLISH (EN) – February 6, 2006
Page 91

10.4.9.3 Local settings
10567103;a2
Figure 10.20 Local settings dialog box
Figure 10.21 Explanations of the Local settings dialog box
ExplanationLabel
Configuration-dependentLanguage
10 – Camera program
Video output
Temp unit
Date format
Time format
NTSC
■
PAL
■
°C – degrees Celsius or
■
°F – degrees Fahrenheit
■
YYYY-MM-DD
■
YY-MM-DD
■
MM/DD/YY
■
DD/MM/YY
■
24 hour
■
AM/PM
■
10.4.9.4 Camera info
The camera info panel shows information about memory usage, battery status, serial
numbers, software revisions, etc.
No changes can be made.
10.4.9.5 Factory default
Point to Factory default and press MENU/YES to reset all camera settings to factory
settings.
10
Publ. No. 1558407 Rev. a155 – ENGLISH (EN) – February 6, 2006 77
Page 92

10 – Camera program
INTENTIONALLY LEFT BLANK
10
78 Publ. No. 1558407 Rev. a155 – ENGLISH (EN) – February 6, 2006
Page 93

11 Electrical power system
The camera’s electrical power system consists of the following parts:
■ a removable battery
■ a power supply
■ an internal battery charger
The camera may powered either by using the battery, or by using the power supply.
When using the power supply, the battery will – if it’s inserted in the battery compartment – automatically be charged. You can still use the camera during charging.
➲ Please note the following:
■ The camera is shipped with charged batteries. To increase the battery life, the
battery should be fully discharged and charged a couple of times by using the
camera or leaving the camera on, until the camera says Battery low.
■ The same power supply can be used for both the internal battery charger and the
external battery charger.
10581303;a1
Figure 11.1 Battery and battery compartment
Publ. No. 1558407 Rev. a155 – ENGLISH (EN) – February 6, 2006 79
11
Page 94

11 – Electrical power system
Description of partCallout
Battery1
Battery cover2
Release button3
The removable battery gives an operation time of approx. 1.5–2 hours. When Battery
low is displayed on the screen it is time to charge the battery.
➲ The operation time of the camera when run on a battery is substantially shorter in
low temperatures.
11
80 Publ. No. 1558407 Rev. a155 – ENGLISH (EN) – February 6, 2006
Page 95

11 – Electrical power system
11.1 Internal battery charging
To charge thebattery using the internal battery charger, follow the instructions below:
ActionStep
Make sure that the battery is correctly inserted into the camera.1
Connect the power cable to the camera.2
3
10305803;a2
Figure 11.2 Battery full symbol
While charging, the batterystatus symbol willpulse untilthe battery isfully charged.
When the battery is fully charged the battery symbol will stop pulsing and be
completely filled.
11
Publ. No. 1558407 Rev. a155 – ENGLISH (EN) – February 6, 2006 81
Page 96

11 – Electrical power system
11.2 External battery charging
➲ External battery charger is an extra option.
You can also charge the battery by using the external battery charger. The battery
status during charging is indicated by a number of LEDs.
10379603;a4
Figure 11.3 LED indicators on the external battery charger
Figure 11.4 LED indicators – explanations of callouts
Color & modeLED indicator no.Situation
Fixed red light1The charger is under power, but
no battery is inserted
Fixed green light1The charger isunder power, and
a battery is inserted
Flashing green light1The battery is too cold or too
warm
Flashing red light1The battery is out of order
Pulsing greenlight from LED no.
5 to LED no. 2
Each LED represents 25 % battery capacity and will be lit accordingly.
11
5-2The battery is now being
charged
82 Publ. No. 1558407 Rev. a155 – ENGLISH (EN) – February 6, 2006
Page 97

11 – Electrical power system
11.3 Battery safety warnings
■ Do not place the battery in fire or heat the battery.
■ Do not install the battery backwards so that the polarity is reversed.
■ Do not connect the positive terminal and the negative terminal of the battery to
each other with any metal object (such as wire).
■ Do not pierce the battery with nails, strike the battery with a hammer, step on the
battery, or otherwise subject it to strong impacts or shocks.
■ Do not solder directly onto the battery.
■ Do not expose the battery to water or salt water, or allow the battery to get wet.
■ Do not disassembleor modifythe battery. The battery contains safety and protection
devices which, if damaged, may cause the battery to generate heat, explode or
ignite.
■ Do not placethe battery on or near fires, stoves, or other high-temperature locations.
■ When the battery is worn out, insulate the terminals with adhesive tape or similar
materials before disposal.
■ Immediately discontinue use of the battery if, while using, charging, or storing the
battery, the battery emits an unusual smell, feels hot, changes color, changes
shape, or appears abnormal in any other way. Contact your sales location if any
of these problems are observed.
■ In the event that the battery leaks and the fluid gets into one’s eye, do not rub the
eye. Rinse well with water and immediately seek medical care. If left untreated the
battery fluid could cause damage to the eye.
■ When charging the battery, only use a specified battery charger.
■ Do not attach the batteries to a power supply plug or directly to a car’s cigarette
lighter.
■ Do not place the batteries in or near fire, or into direct sunlight. When the battery
becomes hot, the built-in safety equipment isactivated, preventingthe battery from
charging further, and heating the battery can destroy the safety equipment and
can cause additional heating, breaking, or ignition of the battery.
■ Do not continue charging the battery if it does not recharge within the specified
charging time. Doing so may cause the battery to become hot, explode, or ignite.
■ The temperature range over which the battery can be charged is 0–+45 °C
(+32–+113 °F). Charging the battery at temperatures outside of this range may
cause the battery to become hot or to break. Charging the battery outside of this
temperature range may also harm the performance of the battery or reduce the
battery’s life expectancy.
■ Do not discharge the battery using any device except for the specified device.
When the battery is used in devices aside from the specified device it may damage
the performance of the battery or reduce its life expectancy, and if the device
causes an abnormal current to flow, it may cause the battery to become hot, explode, or ignite and cause serious injury.
11
Publ. No. 1558407 Rev. a155 – ENGLISH (EN) – February 6, 2006 83
Page 98

11 – Electrical power system
■ The temperature range over which the battery can be discharged is -15–+45 °C
(+18.8–+113 °F). Use of the battery outside of this temperature range may damage
the performance of the battery or may reduce its life expectancy.
11
84 Publ. No. 1558407 Rev. a155 – ENGLISH (EN) – February 6, 2006
Page 99

12 Maintenance & cleaning
12.1 Camera body, cables & accessories
The camerabody,cables and accessories may be cleaned by wiping with a soft cloth.
To remove stains, wipe with a soft cloth moistened with a mild detergent solution and
wrung dry, then wipe with a dry soft cloth.
➲ Do not use benzene, thinner, or any other chemical product on the camera, the
cables or the accessories, as this may cause deterioration.
12.2 Lenses
All lenses are coated with an anti-reflective coating and care must be taken when
cleaning them. Cotton wool soaked in 96 % ethyl alcohol (C2H5OH) may be used to
clean the lenses. The lenses should be wiped once with the solution, then the cotton
wool should be discarded.
If ethyl alcohol is unavailable, DEE (i.e. ‘ether’ = diethylether, C4H10O) may be used
for cleaning.
Sometimes drying marks may appear on the lenses. To prevent this, a cleaning solution of 50 % acetone (i.e. dimethylketone, (CH3)2CO)) and 50 % ethyl alcohol
(C2H5OH) may be used.
➲ Please note the following:
■ Excessive cleaning of the lenses may wear down the coating.
■ The chemical substances described in this section may be dangerous. Carefully
read allwarning labelson containersbefore usingthe substances,as wellas applicable MSDS (Material Safety Data Sheets).
Publ. No. 1558407 Rev. a155 – ENGLISH (EN) – February 6, 2006 85
12
Page 100

12 – Maintenance & cleaning
INTENTIONALLY LEFT BLANK
12
86 Publ. No. 1558407 Rev. a155 – ENGLISH (EN) – February 6, 2006
 Loading...