

Page 1
User’s manual
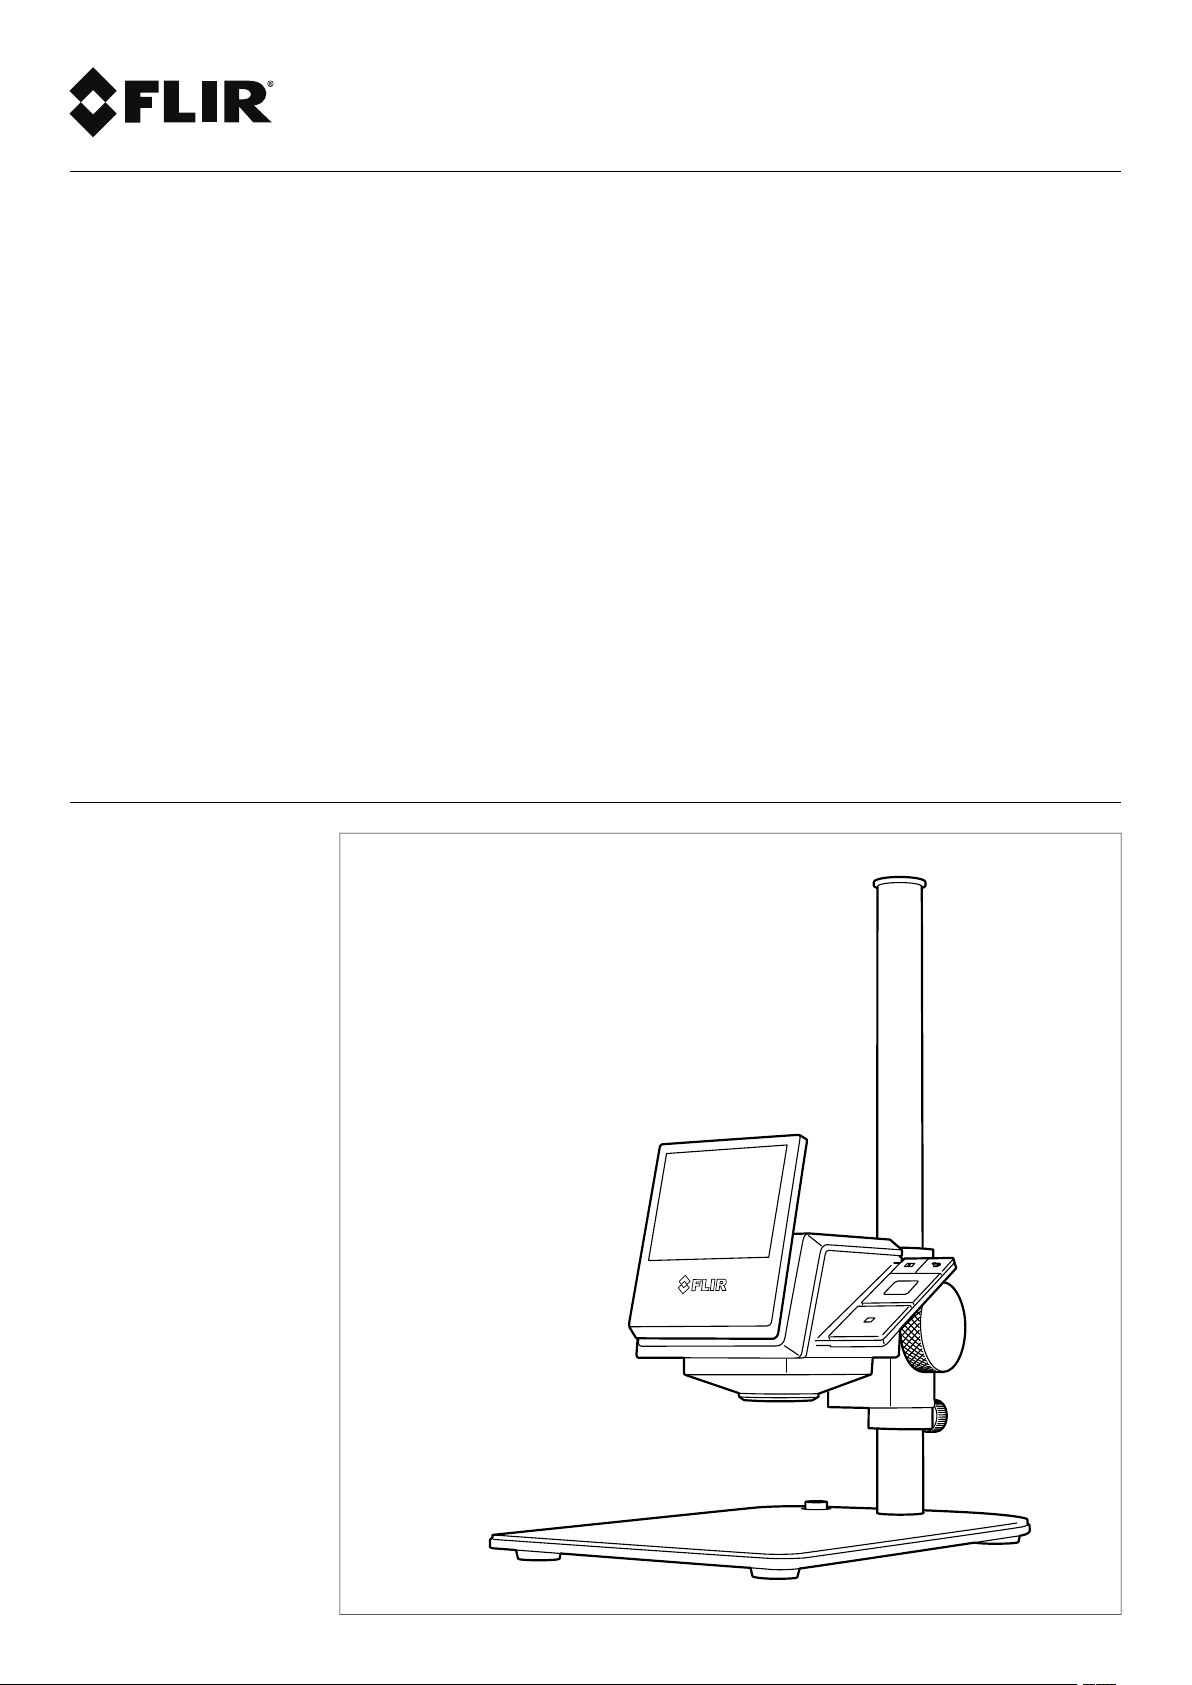
FLIR ETS3xx series
Page 2

Page 3

User’s manual
FLIR ETS3xx series
#T810252; r. AD/43675/43696; en-US
iii
Page 4

Page 5

Table of contents
1 Disclaimers ............ .. ..................................... .. ................................. 1
1.1 Legal disclaimer ....................................................................... 1
1.2 Usage statistics ........................................................................1
1.3 Changes to registry ...................................................................1
1.4 U.S. Government Regulations...................................................... 1
1.5 Copyright ................................................................................1
1.6 Quality assurance .....................................................................1
1.7 Patents...................................................................................1
1.8 EULA Terms ............................................................................1
1.9 EULA Terms ............................................................................1
2 Safety information .......... .. ..................................... .. ..........................2
3 Notice to user ......... .. ..................................... .. ................................. 4
3.1 User-to-user forums .................................................................. 4
3.2 Calibration...............................................................................4
3.3 Accuracy ................................................................................ 4
3.4 Disposal of electronic waste........................................................ 4
3.5 Training .................................................................................. 4
3.6 Documentation updates ............................................................. 4
3.7 Important note about this manual.................................................. 4
3.8 Note about authoritative versions..................................................5
4 Customer help .............. .. .. .. ............................... .. .. .. ......................... 6
4.1 General ..................................................................................6
4.2 Submitting a question ................................................................6
4.3 Downloads ..............................................................................6
5 Introduction............ .. ..................................... .. ................................. 8
5.1 General description ................................................................... 8
5.2 Benefits ..................................................................................8
5.3 Key features ............................................................................8
6 Quick start guide.................. ..................................... .. ......................9
6.1 Procedure ...............................................................................9
7 Description............ ....................................... .................................. 10
7.1 View from the front .................................................................. 10
7.1.1 Figure........................................................................ 10
7.1.2 Explanation................................................................. 10
7.2 View from the rear................................................................... 11
7.2.1 Figure........................................................................ 11
7.2.2 Explanation................................................................. 11
7.3 USB connector....................................................................... 11
7.4 Screen elements .................................................................... 12
7.4.1 Figure........................................................................ 12
7.4.2 Explanation................................................................. 12
8 Handling the camera unit.... .. ..................................... .. .. .. ................. 13
8.1 Charging the battery................................................................ 13
8.1.1 Charging the battery using the FLIR power supply ............... 13
8.1.2 Charging the battery using a USB cable connected to a
8.2 Turning on and turning off the camera.......................................... 13
8.3 Adjusting the position of the camera unit ...................................... 14
8.3.1 Figure........................................................................ 14
8.3.2 Explanation................................................................. 14
8.3.3 Procedure .................................................................. 14
8.4 Removing the stand mount from the camera unit............................ 14
8.4.1 Procedure .................................................................. 15
computer.................................................................... 13
#T810252; r. AD/43675/43696; en-US
v
Page 6

Table of contents
9 Operation ........ .. ..................................... .. ..................................... . 16
9.1 Saving an image ..................................................................... 16
9.1.1 General...................................................................... 16
9.1.2 Image capacity ............................................................ 16
9.1.3 Naming convention....................................................... 16
9.1.4 Procedure .................................................................. 16
9.2 Recalling an image.................................................................. 16
9.2.1 General...................................................................... 16
9.2.2 Procedure .................................................................. 16
9.3 Deleting an image................................................................... 16
9.3.1 General...................................................................... 16
9.3.2 Procedure .................................................................. 16
9.4 Deleting all images.................................................................. 17
9.4.1 General...................................................................... 17
9.4.2 Procedure .................................................................. 17
9.5 Measuring a temperature using a spotmeter ................................. 17
9.5.1 General...................................................................... 17
9.5.2 Procedure .................................................................. 17
9.6 Measuring the hottest temperature within an area .......................... 17
9.6.1 General...................................................................... 17
9.6.2 Procedure .................................................................. 17
9.7 Measuring the coldest temperature within an area.......................... 17
9.7.1 General...................................................................... 17
9.7.2 Procedure .................................................................. 18
9.8 Hiding measurement tools ........................................................ 18
9.8.1 Procedure .................................................................. 18
9.9 Changing the color palette ........................................................ 18
9.9.1 General...................................................................... 18
9.9.2 Procedure .................................................................. 18
9.10 Working with color alarms......................................................... 18
9.10.1 General...................................................................... 18
9.10.2 Image examples .......................................................... 18
9.10.3 Procedure .................................................................. 19
9.11 Changing the temperature scale mode ........................................ 19
9.11.1 General...................................................................... 19
9.11.2 When to use Manual mode............................................. 19
9.11.3 Procedure .................................................................. 20
9.12 Setting the emissivity as a surface property .................................. 20
9.12.1 General...................................................................... 20
9.12.2 Procedure .................................................................. 20
9.13 Setting the emissivity as a custom material................................... 21
9.13.1 General...................................................................... 21
9.13.2 Procedure .................................................................. 21
9.14 Changing the emissivity as a custom value ................................... 21
9.14.1 General...................................................................... 21
9.14.2 Procedure .................................................................. 21
9.15 Changing the reflected apparent temperature ............................... 21
9.15.1 General...................................................................... 21
9.15.2 Procedure .................................................................. 22
9.16 Performing a non-uniformity correction (NUC) ............................... 22
9.16.1 General...................................................................... 22
9.16.2 Procedure .................................................................. 22
9.17 Changing the settings .............................................................. 22
9.17.1 General...................................................................... 22
9.17.2 Procedure .................................................................. 23
#T810252; r. AD/43675/43696; en-US
vi
Page 7

Table of contents
9.18 Updating the camera ............................................................... 23
9.18.1 General...................................................................... 23
9.18.2 Procedure .................................................................. 23
10 Technical data ......... .. ..................................... .. ............................... 24
10.1 Online field-of-view calculator .................................................... 24
10.2 Note about technical data ......................................................... 24
10.3 Note about authoritative versions................................................ 24
10.4 FLIR ETS320 ......................................................................... 25
11 Mechanical drawings .. .. ..................................... .............................. 28
12 Cleaning the camera.......... .. ..................................... ....................... 33
12.1 Camera housing, cables, and other items..................................... 33
12.1.1 Liquids....................................................................... 33
12.1.2 Equipment.................................................................. 33
12.1.3 Procedure .................................................................. 33
12.2 Infrared lens .......................................................................... 33
12.2.1 Liquids....................................................................... 33
12.2.2 Equipment.................................................................. 33
12.2.3 Procedure .................................................................. 33
13 About FLIR Systems .................. .. ..................................... .. ............. 34
13.1 More than just an infrared camera .............................................. 35
13.2 Sharing our knowledge ............................................................ 35
13.3 Supporting our customers......................................................... 36
14 Terms, laws, and definitions............... .. ..................................... .. ...... 37
15 Thermographic measurement techniques .............................. .. .......... 39
15.1 Introduction .......................................................................... 39
15.2 Emissivity.............................................................................. 39
15.2.1 Finding the emissivity of a sample.................................... 39
15.3 Reflected apparent temperature ................................................. 43
15.4 Distance ............................................................................... 43
15.5 Relative humidity .................................................................... 43
15.6 Other parameters.................................................................... 43
16 The secret to a good thermal image .. ..................................... .. .......... 44
16.1 Introduction ........................................................................... 44
16.2 Background........................................................................... 44
16.3 A good image ........................................................................ 44
16.4 The three unchangeables—the basis for a good image ................... 45
16.4.1 Focus ........................................................................ 45
16.4.2 Temperature range ....................................................... 46
16.4.3 Image detail and distance from the object .......................... 46
16.5 The changeables—image optimization and temperature
measurement......................................................................... 47
16.5.1 Level and span ............................................................ 47
16.5.2 Palettes and isotherms .................................................. 48
16.5.3 Object parameters........................................................ 48
16.6 Taking images—practical tips .................................................... 49
16.7 Conclusion ............................................................................ 49
17 About calibration............ .. ..................................... .. ........................ 50
17.1 Introduction ........................................................................... 50
17.2 Definition—what is calibration? .................................................. 50
17.3 Camera calibration at FLIR Systems ........................................... 50
17.4 The differences between a calibration performed by a user and
that performed directly at FLIR Systems....................................... 51
17.5 Calibration, verification and adjustment........................................ 51
17.6 Non-uniformity correction.......................................................... 52
#T810252; r. AD/43675/43696; en-US
vii
Page 8

Table of contents
17.7 Thermal image adjustment (thermal tuning) .................................. 52
18 History of infrared technology................................. .. .. .. .................... 53
19 Theory of thermography.. .. ..................................... .. ........................ 56
19.1 Introduction ........................................................................... 56
19.2 The electromagnetic spectrum................................................... 56
19.3 Blackbody radiation................................................................. 56
19.3.1 Planck’s law ................................................................ 57
19.3.2 Wien’s displacement law................................................ 58
19.3.3 Stefan-Boltzmann's law ................................................. 59
19.3.4 Non-blackbody emitters................................................. 60
19.4 Infrared semi-transparent materials............................................. 62
20 The measurement formula....................... ..................................... .. .. 63
21 Emissivity tables ..................................... .. ..................................... . 67
21.1 References............................................................................ 67
21.2 Tables .................................................................................. 67
#T810252; r. AD/43675/43696; en-US
viii
Page 9

1
Disclaimers
1.1 Legal disclaimer
All products manufactured by FLIR Systems are warranted against defective
materials and workmanship for a period of one (1) year from the delivery date
of the original purchase, provided such products have been under normal
storage, use and service, and in accordance with FLIR Systems instruction.
Uncooled handheld infrared cameras manufactured by FLIR Systems are
warranted against defective materials and workmanship for a period of two
(2) years from the delivery date of theoriginal purchase, provided such products have been under normal storage, use and service, and in accordance
with FLIR Systems instruction, and provided that the camera has been registered within 60 days of original purchase.
Detectors for uncooled handheld infrared cameras manufactured by FLIR
Systems are warranted against defective materials and workmanship for a
period of ten (10) years from the delivery date of the original purchase, provided such products have been under normal storage, use and service, and
in accordance with FLIR Systems instruction, and provided that the camera
has been registered within 60 days of original purchase.
Products which are not manufactured by FLIR Systems but included in systems delivered by FLIR Systems to the original purchaser, carry the warranty,
if any, of the particular supplier only. FLIR Systems has no responsibility
whatsoever for such products.
The warranty extends only to the original purchaser and is not transferable. It
is not applicable to any product which has been subjected to misuse, neglect,
accident or abnormal conditions of operation. Expendable partsare excluded
from the warranty.
In the case of a defect in a product covered by this warranty the product must
not be further used in order to prevent additional damage. The purchaser
shall promptly report any defect to FLIR Systems or this warranty will not
apply.
FLIR Systems will, at its option, repair or replace any such defective product
free of charge if, upon inspection, it proves to be defective in material or workmanship and provided that it is returned to FLIR Systems within the said oneyear period.
FLIR Systems has no other obligation or liability for defects than those set
forth above.
No other warranty is expressed or implied. FLIR Systems specifically disclaims the implied warranties of merchantability and fitness for a particular
purpose.
FLIR Systems shall not be liable for any direct, indirect, special, incidental or
consequential loss or damage, whether based on contract, tort or anyother
legal theory.
This warranty shall be governed by Swedish law.
Any dispute, controversy or claim arising out of or in connection with thiswar-
ranty, shall be finally settled by arbitration in accordance with the Rules of the
Arbitration Institute of the Stockholm Chamber of Commerce. The place of arbitration shall be Stockholm. The language to be used in thearbitral proceedings shall be English.
1.2 Usage statistics
FLIR Systems reserves the right to gather anonymous usage statistics to help
maintain and improve the quality of our software and services.
1.3 Changes to registry
The registry entry HKEY_LOCAL_MACHINE\SYSTEM\CurrentControlSet
\Control\Lsa\LmCompatibilityLevel will be automatically changed to level 2 if
the FLIR Camera Monitor service detects a FLIR camera connected to the
computer with a USB cable. The modification will only be executed if the
camera device implements a remote network service that supports network
logons.
1.4 U.S. Government Regulations
This product may be subject to U.S. Export Regulations. Please send any inquiries to exportquestions@flir.com.
1.5 Copyright
© 2016, FLIR Systems, Inc. All rights reserved worldwide. No parts of the
software including source code may be reproduced, transmitted, transcribed
or translated into any language or computer language in any form or by any
means, electronic, magnetic, optical, manual or otherwise, without the prior
written permission of FLIR Systems.
The documentation must not, in whole or part, be copied, photocopied,reproduced, translated or transmitted to any electronic mediumor machine
readable form without prior consent, in writing, from FLIR Systems.
Names and marks appearing on the products herein are either registered
trademarks or trademarks of FLIR Systems and/or its subsidiaries. All other
trademarks, trade names or company names referenced herein are used for
identification only and are the property of their respective owners.
1.6 Quality assurance
The Quality Management System under which these products are developed
and manufactured has been certified in accordance with the ISO 9001
standard.
FLIR Systems is committed to a policy of continuous development; therefore
we reserve the right to make changes andimprovements on any of the products without prior notice.
1.7 Patents
000439161; 000653423; 000726344; 000859020; 001707738; 001707746;
001707787; 001776519; 001954074; 002021543; 002021543-0002;
002058180; 002249953; 002531178; 002816785; 002816793; 011200326;
014347553; 057692; 061609; 07002405; 100414275; 101796816;
101796817; 101796818; 102334141; 1062100; 11063060001; 11517895;
1226865; 12300216; 12300224; 1285345; 1299699; 1325808; 1336775;
1391114; 1402918; 1404291; 1411581; 1415075; 1421497; 1458284;
1678485; 1732314; 17399650; 1880950; 1886650; 2007301511414;
2007303395047; 2008301285812; 2009301900619; 20100060357;
2010301761271; 2010301761303; 2010301761572; 2010305959313;
2011304423549; 2012304717443; 2012306207318; 2013302676195;
2015202354035; 2015304259171; 204465713; 204967995; 2106017;
2107799; 2115696; 2172004; 2315433; 2381417; 2794760001; 3006596;
3006597; 303330211; 4358936; 483782; 484155; 4889913; 4937897;
4995790001; 5177595; 540838; 579475; 584755; 599392; 60122153;
6020040116815; 602006006500.0; 6020080347796; 6020110003453;
615113; 615116; 664580; 664581; 665004; 665440; 67023029; 6707044;
677298; 68657; 69036179; 70022216; 70028915; 70028923; 70057990;
7034300; 710424; 7110035; 7154093; 7157705; 718801; 723605; 7237946;
7312822; 7332716; 7336823; 734803; 7544944; 7606484; 7634157;
7667198; 7809258; 7826736; 8018649; 8153971; 8212210; 8289372;
8340414; 8354639; 8384783; 8520970; 8565547; 8595689; 8599262;
8654239; 8680468; 8803093; 8823803; 8853631; 8933403; 9171361;
9191583; 9279728; 9280812; 9338352; 9423940; 9471970; 9595087;
D549758.
1.8 EULA Terms
• Youhave acquired a device (“INFRARED CAMERA”) that includes software licensed by FLIR Systems AB from Microsoft Licensing, GP or its
affiliates (“MS”). Those installed software products of MS origin, as well
as associated media, printed materials, and “online” or electronic documentation (“SOFTWARE”) are protected by international intellectual
property laws and treaties. The SOFTWARE is licensed, not sold. All
rights reserved.
• IF YOU DO NOT AGREE TO THIS END USER LICENSE AGREEMENT
(“EULA”), DO NOT USE THE DEVICE OR COPY THE SOFTWARE. INSTEAD, PROMPTLY CONTACT FLIR Systems AB FOR INSTRUCTIONS ON RETURN OF THE UNUSED DEVICE(S) FOR A REFUND.
ANY USE OF THE SOFTWARE, INCLUDING BUT NOT LIMITED TO
USE ON THE DEVICE, WILL CONSTITUTE YOUR AGREEMENT TO
THIS EULA (OR RATIFICATION OF ANY PREVIOUS CONSENT).
• GRANT OF SOFTWARE LICENSE. This EULAgrants you the following
license:
◦ Youmay use the SOFTWARE only on the DEVICE.
◦ NOT FAULT TOLERANT. THE SOFTWARE IS NOT FAULT TOL-
ERANT.FLIR SystemsAB HAS INDEPENDENTLYDETERMINED
HOW TO USE THE SOFTWARE IN THE DEVICE, AND MS HAS
RELIED UPON FLIR Systems AB TO CONDUCT SUFFICIENT
TESTING TO DETERMINE THAT THE SOFTWARE IS SUITABLE
FOR SUCH USE.
◦ NO WARRANTIES FOR THE SOFTWARE. THE SOFTWARE is
provided “AS IS” and with all faults. THE ENTIRE RISK AS TO
SATISFACTORY QUALITY, PERFORMANCE, ACCURACY, AND
EFFORT (INCLUDING LACK OF NEGLIGENCE) IS WITH YOU.
ALSO, THERE IS NO WARRANTYAGAINST INTERFERENCE
WITH YOUR ENJOYMENT OF THE SOFTWARE OR AGAINST
INFRINGEMENT.IF YOU HAVE RECEIVED ANY WARRANTIES
REGARDING THE DEVICE OR THE SOFTWARE, THOSE WARRANTIES DO NOT ORIGINATE FROM, AND ARE NOT BINDING
ON, MS.
◦ No Liability for Certain Damages. EXCEPT AS PROHIBITED BY
LAW,MS SHALL HAVE NO LIABILITY FOR ANY INDIRECT,
SPECIAL, CONSEQUENTIAL OR INCIDENTAL DAMAGES
ARISING FROM OR IN CONNECTION WITH THE USE OR PERFORMANCE OF THE SOFTWARE. THIS LIMITATION SHALL
APPLYEVEN IF ANY REMEDY FAILS OF ITS ESSENTIAL PURPOSE. IN NO EVENT SHALL MS BE LIABLE FOR ANY
AMOUNT IN EXCESS OF U.S. TWO HUNDRED FIFTY DOLLARS (U.S.$250.00).
◦ Limitations on Reverse Engineering, Decompilation, and Dis-
assembly. You may not reverse engineer, decompile, or disas-
semble the SOFTWARE, except and only to the extent that such
activity is expressly permitted by applicable law notwithstanding
this limitation.
◦ SOFTWARE TRANSFER ALLOWED BUT WITH RESTRIC-
TIONS. You may permanently transfer rights under this EULA only
as part of a permanent sale or transfer of the Device, and only if
the recipient agrees to this EULA. If the SOFTWARE is an upgrade,
any transfer must also include all prior versionsof the SOFTWARE.
◦ EXPORT RESTRICTIONS. You acknowledge that SOFTWARE is
subject to U.S. export jurisdiction. You agree to comply with all applicable international and national laws that apply tothe SOFTWARE, including the U.S. Export AdministrationRegulations, as
well as end-user, end-use and destination restrictions issued by U.
S. and other governments. For additional information see http://
www.microsoft.com/exporting/.
1.9 EULA Terms
Qt4 Core and Qt4 GUI, Copyright ©2013 Nokia Corporation and FLIR Systems AB. This Qt library is a free software; you can redistribute it and/or modify it under the terms of the GNU Lesser General PublicLicense as published
by the Free Software Foundation; either version 2.1 of the License, or (at your
option) any later version. This library is distributed in the hope that it willbe
useful, but WITHOUT ANY WARRANTY; without even the implied warranty of
MERCHANTABILITYor FITNESS FOR A PARTICULAR PURPOSE. See the
GNU Lesser General Public License, http://www.gnu.org/licenses/lgpl-2.1.
html. The source code for the libraries Qt4 Core and Qt4GUI may be requested from FLIR Systems AB.
#T810252; r. AD/43675/43696; en-US
1
Page 10

2
Safety information
WARNING
Applicability: Class B digital devices.
This equipment has been tested and found to comply with the limits for a Class B digital device, pursuant to Part 15 of the FCC Rules. These limits are designed to provide reasonable protection against
harmful interference in a residential installation. This equipment generates, uses and can radiate radio
frequency energy and, if not installed and used in accordance with the instructions, may cause harmful
interference to radio communications. However, there is no guarantee that interference will not occur in
a particular installation. If this equipment does cause harmful interference to radio or television reception, which can be determined by turning the equipment off and on, the user is encouraged to try to correct the interference by one or more of the following measures:
• Reorient or relocate the receiving antenna.
• Increase the separation between the equipment and receiver.
• Connect the equipment into an outlet on a circuit different from that to which the receiver is
connected.
• Consult the dealer or an experienced radio/TV technician for help.
WARNING
Applicability: Digital devices subject to 15.19/RSS-210.
NOTICE: This device complies with Part 15 of the FCC Rules and with RSS-210 of Industry Canada.
Operation is subject to the following two conditions:
1. this device may not cause harmful interference, and
2. this device must accept any interference received, including interference that may cause undesired
operation.
WARNING
Applicability: Digital devices subject to 15.21.
NOTICE: Changes or modifications made to this equipment not expressly approved by FLIR Systems
may void the FCC authorization to operate this equipment.
WARNING
Applicability: Digital devices subject to 2.1091/2.1093/OET Bulletin 65.
Radiofrequency radiation exposure Information: The radiated output power of the device is below
the FCC/IC radio frequency exposure limits. Nevertheless, the device shall be used in such a manner
that the potential for human contact during normal operation is minimized.
WARNING
Applicability: Cameras with one or more batteries.
Do not continue to charge the battery if it does not become charged in the specified charging time. If
you continue to charge the battery, it can become hot and cause an explosion or ignition. Injury to persons can occur.
WARNING
Applicability: Cameras with one or more batteries.
Only use the correct equipment to remove the electrical power from the battery. If you do not use the
correct equipment, you can decrease the performance or the life cycle of the battery. If you do not use
the correct equipment, an incorrect flow of current to the battery can occur. This can cause the battery
to become hot, or cause an explosion. Injury to persons can occur.
WARNING
Make sure that you read all applicable MSDS (Material Safety Data Sheets) and warning labels on containers before you use a liquid. The liquids can be dangerous. Injury to persons can occur.
#T810252; r. AD/43675/43696; en-US
2
Page 11

2
Safety information
CAUTION
Do not point the infrared camera (with or without the lens cover) at strong energy sources, for example,
devices that cause laser radiation, or the sun. This can have an unwanted effect on the accuracy of the
camera. It can also cause damage to the detector in the camera.
CAUTION
Do not use the camera in temperatures more than +50°C (+122°F), unless other information is specified
in the user documentation or technical data. High temperatures can cause damage to the camera.
CAUTION
Do not attach the camera unit directly to a car’s cigarette lighter socket, unless FLIR Systems supplies
a specific adapter to connect the camera unit to a cigarette lighter socket. Damage to the camera unit
can occur.
CAUTION
Applicability: Cameras with one or more batteries.
Only use a specified battery charger when you charge the battery. Damage to the battery can occur if
you do not do this.
CAUTION
Applicability: Cameras with one or more batteries.
The temperature range through which you can charge the battery is ±0°C to +45°C (+32°F to +113°F),
except for the Korean market where the approved range is +10°C to + 45°C (+50°F to +113°F). If you
charge the battery at temperatures out of this range, it can cause the battery to become hot or to break.
It can also decrease the performance or the life cycle of the battery.
CAUTION
Applicability: Cameras with one or more batteries.
The temperature range through which you can remove the electrical power from the battery is +10°C to
+40°C (+50°F to +104°F), unless other information is specified in the user documentation or technical
data. If you operate the battery out of this temperature range, it can decrease the performance or the life
cycle of the battery.
CAUTION
Do not apply solvents or equivalent liquids to the camera, the cables, or other items. Damage to the battery and injury to persons can occur.
CAUTION
Be careful when you clean the infrared lens. The lens has an anti-reflective coating which is easily damaged. Damage to the infrared lens can occur.
CAUTION
Do not use too much force to clean the infrared lens. This can cause damage to the anti-reflective
coating.
Note The encapsulation rating is only applicable when all the openings on the camera
are sealed with their correct covers, hatches, or caps. This includes the compartments
for data storage, batteries, and connectors.
#T810252; r. AD/43675/43696; en-US
3
Page 12

3
Notice to user
3.1 User-to-user forums
Exchange ideas, problems, and infrared solutions with fellow thermographers around the
world in our user-to-user forums. To go to the forums, visit:
http://forum.infraredtraining.com/
3.2 Calibration
We recommend that you send in the camera for calibration once a year. Contact your local sales office for instructions on where to send the camera.
3.3 Accuracy
For very accurate results, we recommend that you wait 5 minutes after you have started
the camera before measuring a temperature.
3.4 Disposal of electronic waste
As with most electronic products, this equipment must be disposed of in an environmentally friendly way, and in accordance with existing regulations for electronic waste.
Please contact your FLIR Systems representative for more details.
3.5 Training
To read about infrared training, visit:
• http://www.infraredtraining.com
• http://www.irtraining.com
• http://www.irtraining.eu
3.6 Documentation updates
Our manuals are updated several times per year, and we also issue product-critical notifications of changes on a regular basis.
To access the latest manuals, translations of manuals, and notifications, go to the Download tab at:
http://support.flir.com
It only takes a few minutes to register online. In the download area you will also find the
latest releases of manuals for our other products, as well as manuals for our historical
and obsolete products.
3.7 Important note about this manual
FLIR Systems issues generic manuals that cover several cameras within a model line.
#T810252; r. AD/43675/43696; en-US
4
Page 13

Notice to user3
This means that this manual may contain descriptions and explanations that do not apply
to your particular camera model.
3.8 Note about authoritative versions
The authoritative version of this publication is English. In the event of divergences due to
translation errors, the English text has precedence.
Any late changes are first implemented in English.
#T810252; r. AD/43675/43696; en-US
5
Page 14
4
Customer help
4.1 General
For customer help, visit:
http://support.flir.com
4.2 Submitting a question
To submit a question to the customer help team, you must be a registered user. It only
takes a few minutes to register online. If you only want to search the knowledgebase for
existing questions and answers, you do not need to be a registered user.
When you want to submit a question, make sure that you have the following information
to hand:
• The camera model
• The camera serial number
• The communication protocol, or method, between the camera and your device (for example, SD card reader, HDMI, Ethernet, USB, or FireWire)
• Device type (PC/Mac/iPhone/iPad/Android device, etc.)
• Version of any programs from FLIR Systems
• Full name, publication number, and revision number of the manual
4.3 Downloads
On the customer help site you can also download the following, when applicable for the
product:
#T810252; r. AD/43675/43696; en-US
6
Page 15

4
Customer help
• Firmware updates for your infrared camera.
• Program updates for your PC/Mac software.
• Freeware and evaluation versions of PC/Mac software.
• User documentation for current, obsolete, and historical products.
• Mechanical drawings (in *.dxf and *.pdf format).
• Cad data models (in *.stp format).
• Application stories.
• Technical datasheets.
• Product catalogs.
#T810252; r. AD/43675/43696; en-US
7
Page 16

5
Introduction
5.1 General description
The FLIR ETS3xx is FLIR’s first electronic test bench camera, designed for a quick temperature check of PCB boards and electronic devices. The FLIR ETS3xx is sensitive
enough to detect subtle temperature difference with an accuracy of ±3°C (±5.4°F), so
you can quickly find hot spots and potential points of failure. The 320 × 240 pixel infrared
detector offers more than 76 000 points of temperature measurement, eliminating the
guesswork of legacy measurement tools. Designed specifically for bench-top work, the
battery-powered FLIR ETS3xx connects to your PC for immediate analysis and sharing
of thermal data.
5.2 Benefits
• Reduces test times: Quickly identify hot spots, thermal gradients, and potential points
of failure.
• Improves product design: Know where and when to add fans and heatsinks, and ensure products are operating within specification for their maximum lifetime.
• Saves money: Improve rapid prototyping and reduce product development cycles.
• Optimizes lab time: Battery powered and hands-free, and offers complete measurement and analysis in the camera.
5.3 Key features
• >76 000 points of non-contact temperature measurement at the push of a button.
• 320 × 240 pixel detector provides crisp thermal imagery.
• Time versus temperature measurement with FLIR Tools+.
• Small-component measurement, down to 170 µm per pixel spot size.
• Lens offers a 45° thermal view of the target for the quick detection of hot spots.
• Records radiometric imagery in standard JPEG format for easy sharing.
• ±3% accuracy promotes quality assurance and factory acceptance of PCBs.
• Quickly mounts on the supplied stand for immediate use.
• Crisp 3 in. LCD display provides immediate thermal feedback.
• World-class software provided for advanced measurement corrections/capabilities.
#T810252; r. AD/43675/43696; en-US
8
Page 17

6
Quick start guide
6.1 Procedure
Follow this procedure:
1. Charge the battery. You can do this in different ways:
• Charge the battery using the FLIR power supply.
• Charge the battery using a USB cable connected to a computer.
Note Charging the camera using a USB cable connected to a computer takes
considerably longer than using the FLIR power supply or the FLIR stand-alone
battery charger.
2. Connect a ground cord to the ground stud on the ESD mat of the camera stand.
3. Push the On/off button to turn on the camera.
4. Adjust the position of the camera unit.
5. Push the Save button to save an image.
(Optional steps)
6. Go to the following website to download FLIR Tools/Tools+
http://support.flir.com/tools
7. Install FLIR Tools/Tools+ on your computer.
8. Start FLIR Tools/Tools+.
9. Connect the camera to your computer, using the USB cable.
10. Import the images into FLIR Tools/Tools+.
1
:
1. For online documentation about FLIR Tools/Tools+, go to http://support.flir.com/resources/f22s/. FLIR Tools+ is
licensed software.
#T810252; r. AD/43675/43696; en-US
9
Page 18
7
Description
7.1 View from the front
7.1.1 Figure
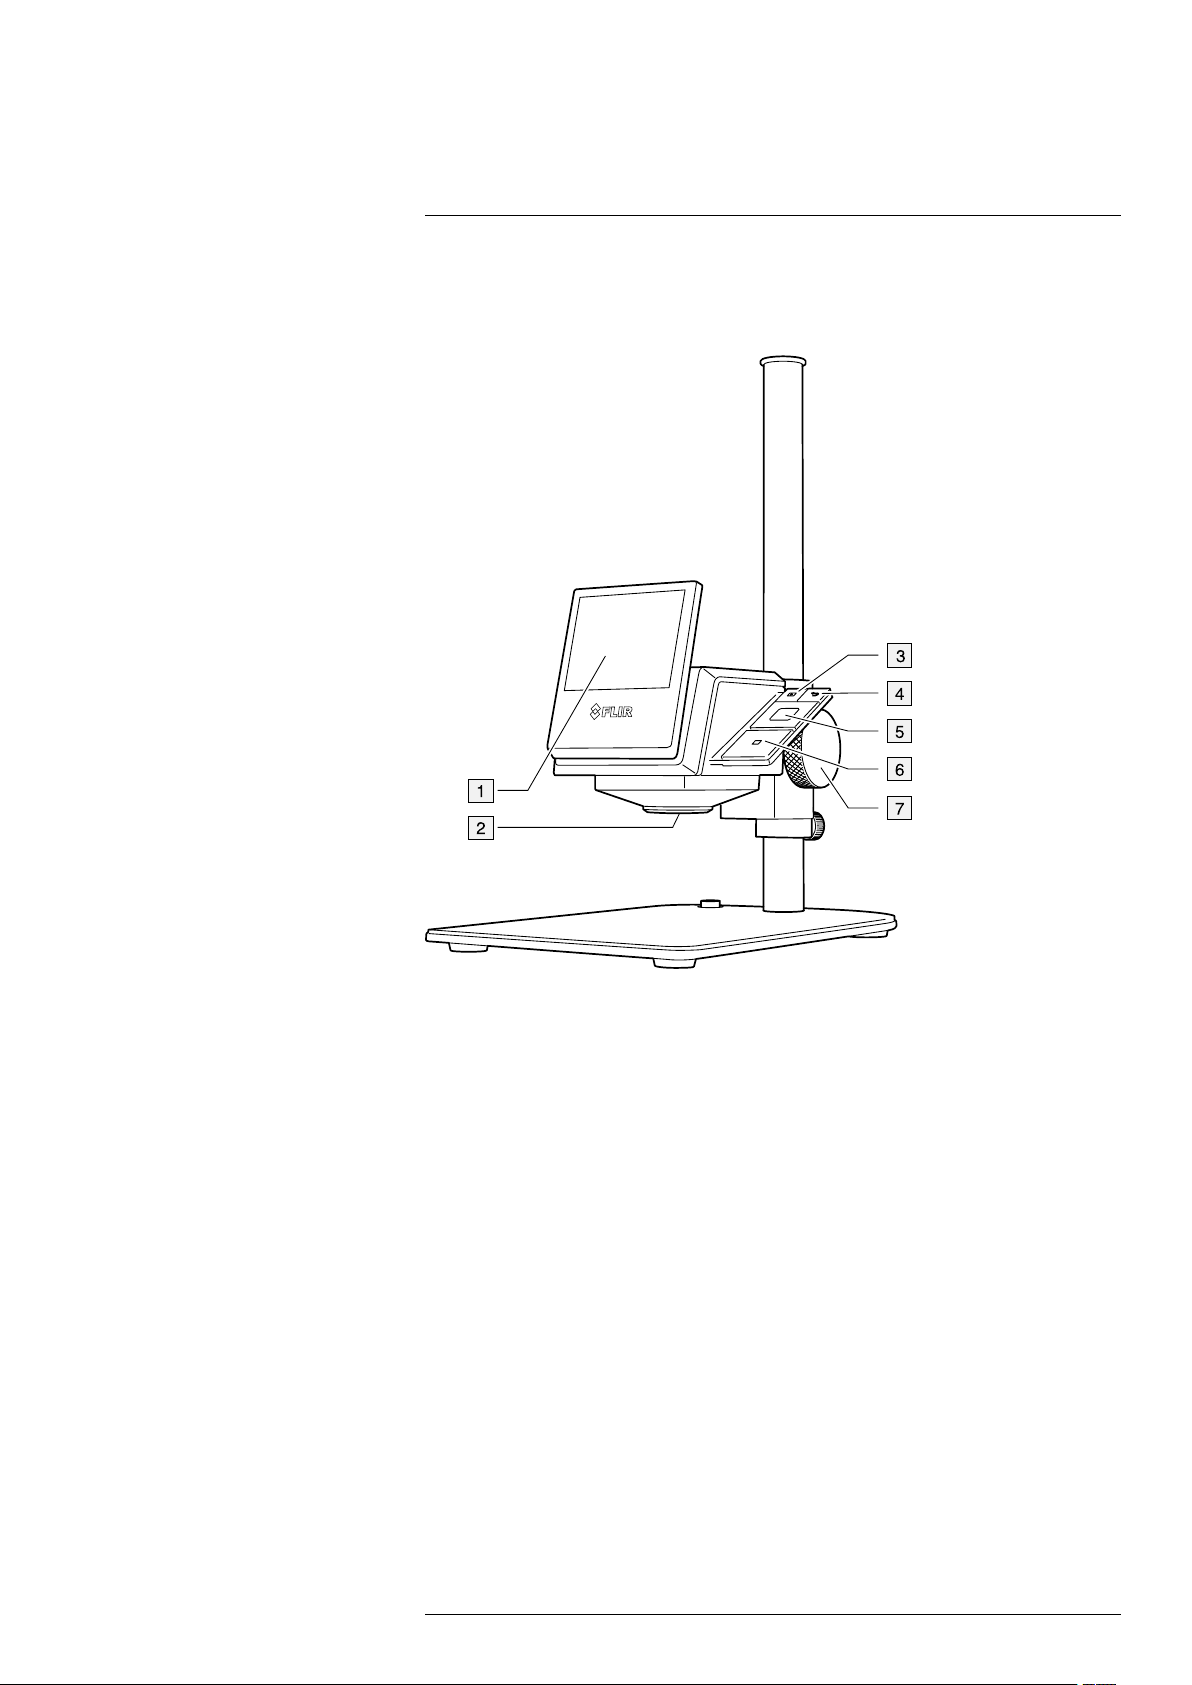
7.1.2 Explanation
1. LCD display.
2. Infrared camera lens.
3. Archive button.
Function:
• Push to open the image archive.
4. Back/Cancel button.
Function:
• Push to go back into the menu system.
• Push to cancel a choice.
5. Navigation pad.
Function:
• Push left/right or up/down to navigate in menus, submenus, and dialog boxes.
• Push the center to confirm.
6. Save button.
Function:
• Push to save an image.
7. Fine-adjustment knob.
#T810252; r. AD/43675/43696; en-US
10
Page 19
7
Description
7.2 View from the rear
7.2.1 Figure
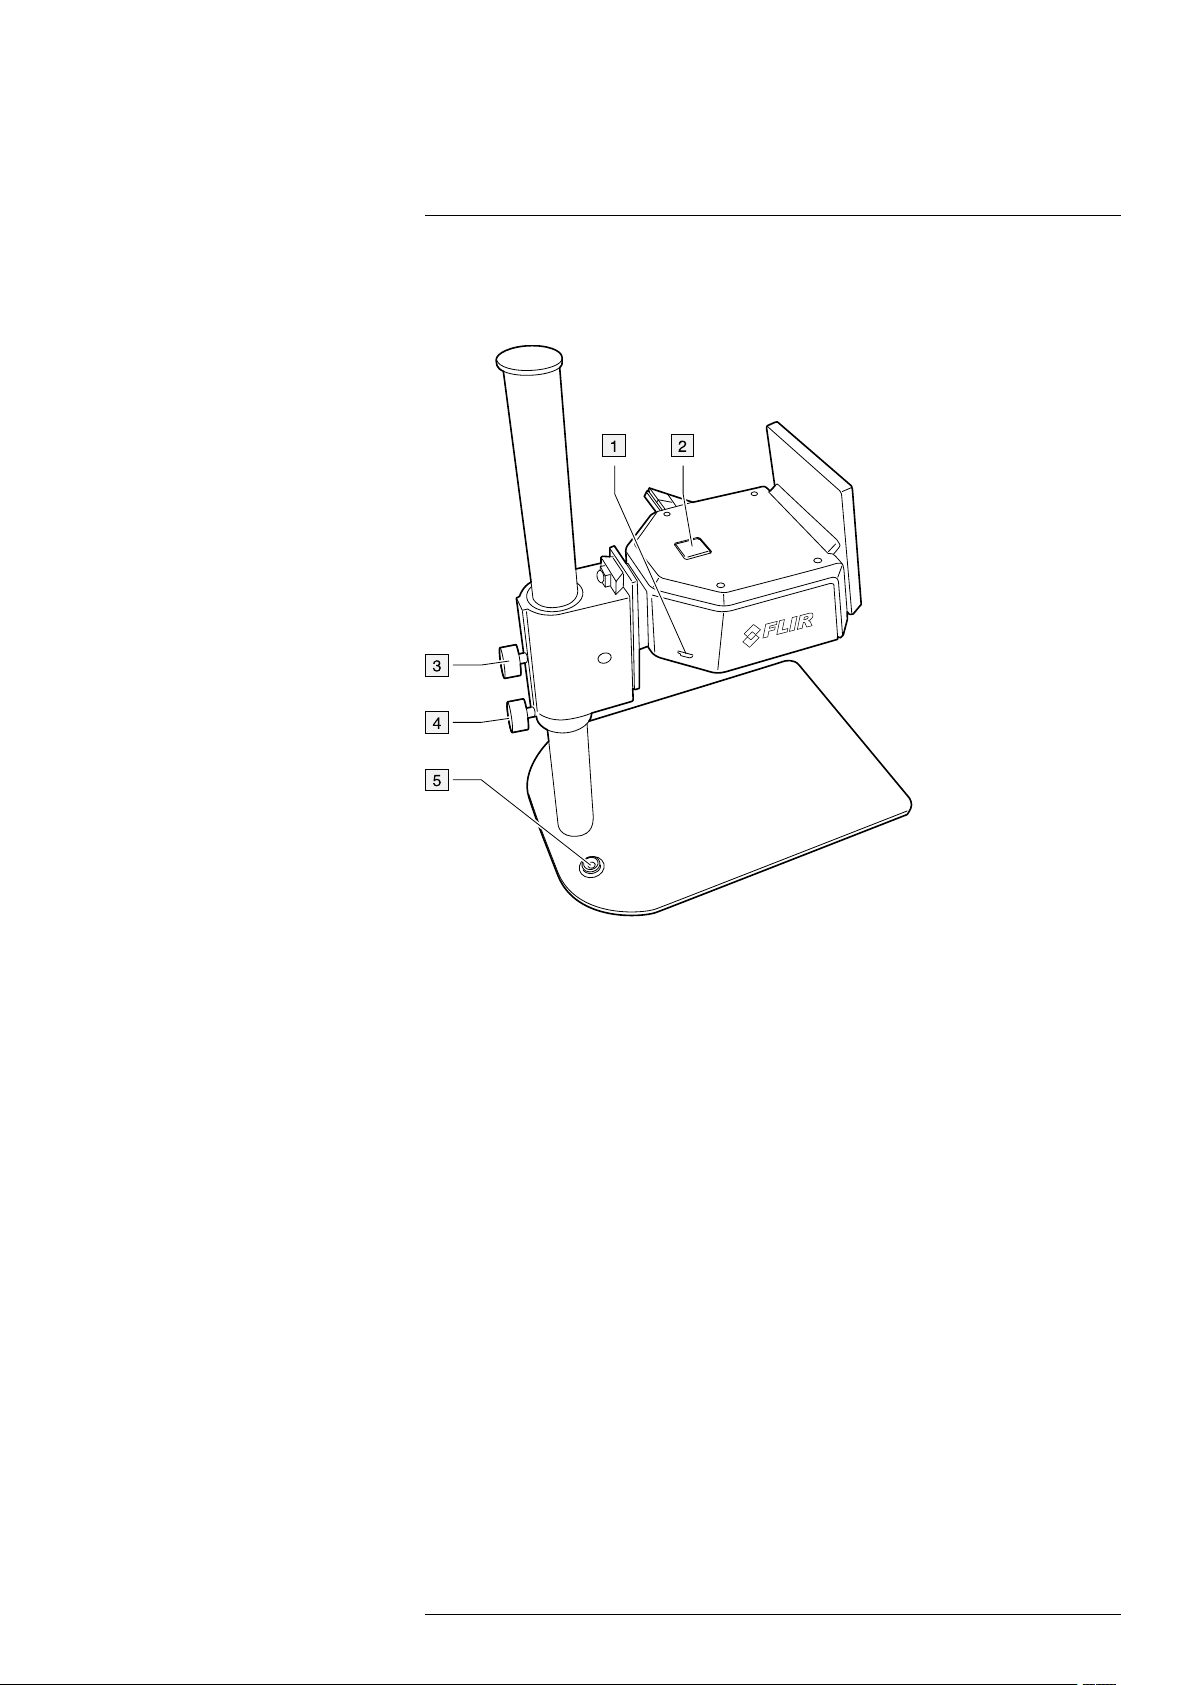
7.2.2 Explanation
1. USB connector.
2. On/off button.
Function:
• Push the On/off button to turn on the camera.
• Push and hold the On/off button for less than 5 seconds to put the camera into
standby mode. The camera then automatically turns off after 48 hours.
• Push and hold the On/off button for more than 10 seconds to turn off the camera.
3. Stand mount knob.
4. Supporting ring knob.
5. Ground stud.
7.3 USB connector
The purpose of this USB connector is the following:
• Charging the battery using the FLIR power supply.
• Charging the battery using a USB cable connected to a computer.
Note Charging the camera using a USB cable connected to a computer takes con-
siderably longer than using the FLIR power supply.
• Moving images from the camera to a computer for further analysis in FLIR Tools/Tools
+.
Note Install FLIR Tools/Tools+ on your computer before you move the images.
#T810252; r. AD/43675/43696; en-US
11
Page 20
7
Description
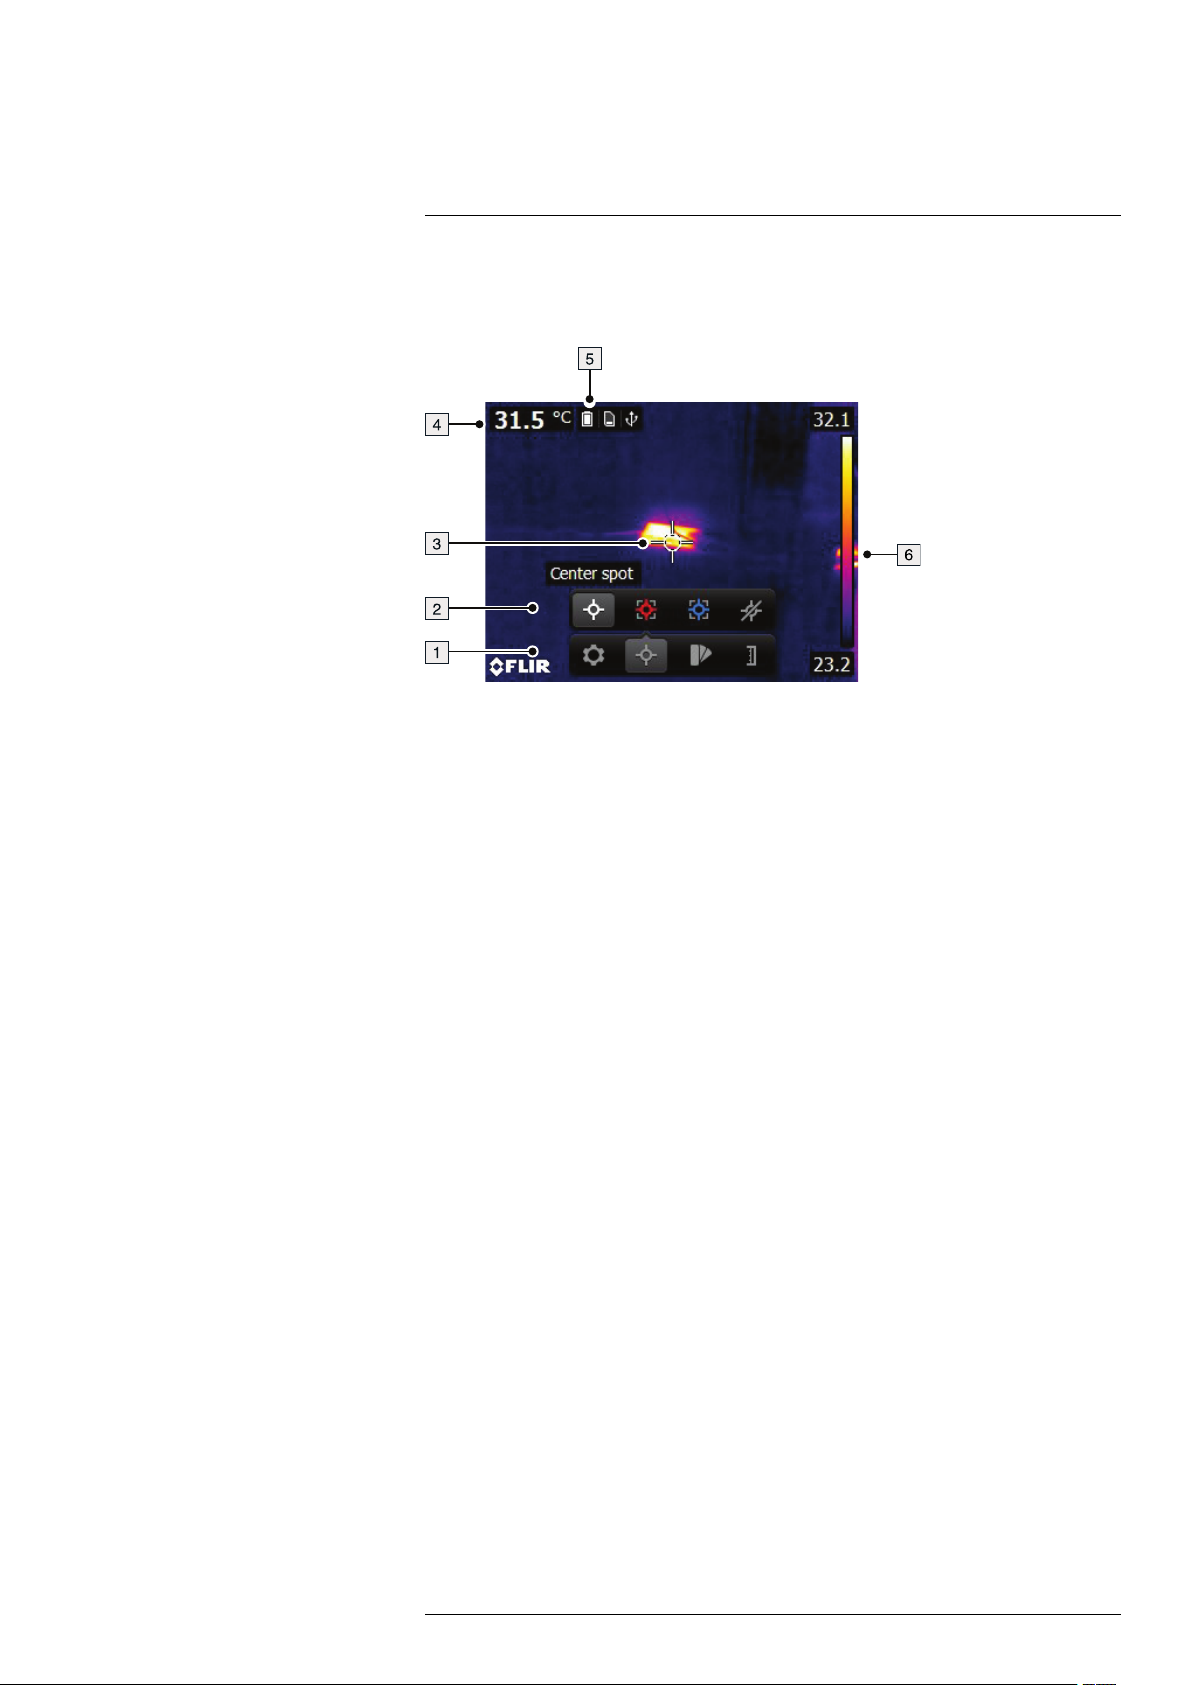
7.4 Screen elements
7.4.1 Figure
7.4.2 Explanation
1. Main menu toolbar.
2. Submenu toolbar.
3. Spotmeter.
4. Result table.
5. Status icons.
6. Temperature scale.
#T810252; r. AD/43675/43696; en-US
12
Page 21

8
Handling the camera unit
8.1 Charging the battery
WARNING
Make sure that you install the socket-outlet near the equipment and that it is easy to get access to.
8.1.1 Charging the battery using the FLIR power supply
Follow this procedure:
1. Connect the power supply to a mains socket.
2. Connect the power supply cable to the USB connector on the camera unit.
3. It is good practice to disconnect the power supply from the mains socket when the
battery is fully charged.
Note The charging time for a fully depleted battery is 2 hours.
8.1.2 Charging the battery using a USB cable connected to a computer
Follow this procedure:
1. Connect the camera unit to a computer using a USB cable.
Note
• To charge the camera, the computer must be turned on.
• Charging the camera using a USB cable connected to a computer takes considerably
longer than using the FLIR power supply.
8.2 Turning on and turning off the camera
• Push the On/off button to turn on the camera.
• Push and hold the On/off button for less than 5 seconds to put the camera in standby
mode. The camera then automatically turns off after 48 hours.
• Push and hold the On/off button for more than 10 seconds to turn off the camera.
#T810252; r. AD/43675/43696; en-US
13
Page 22
Handling the camera unit8
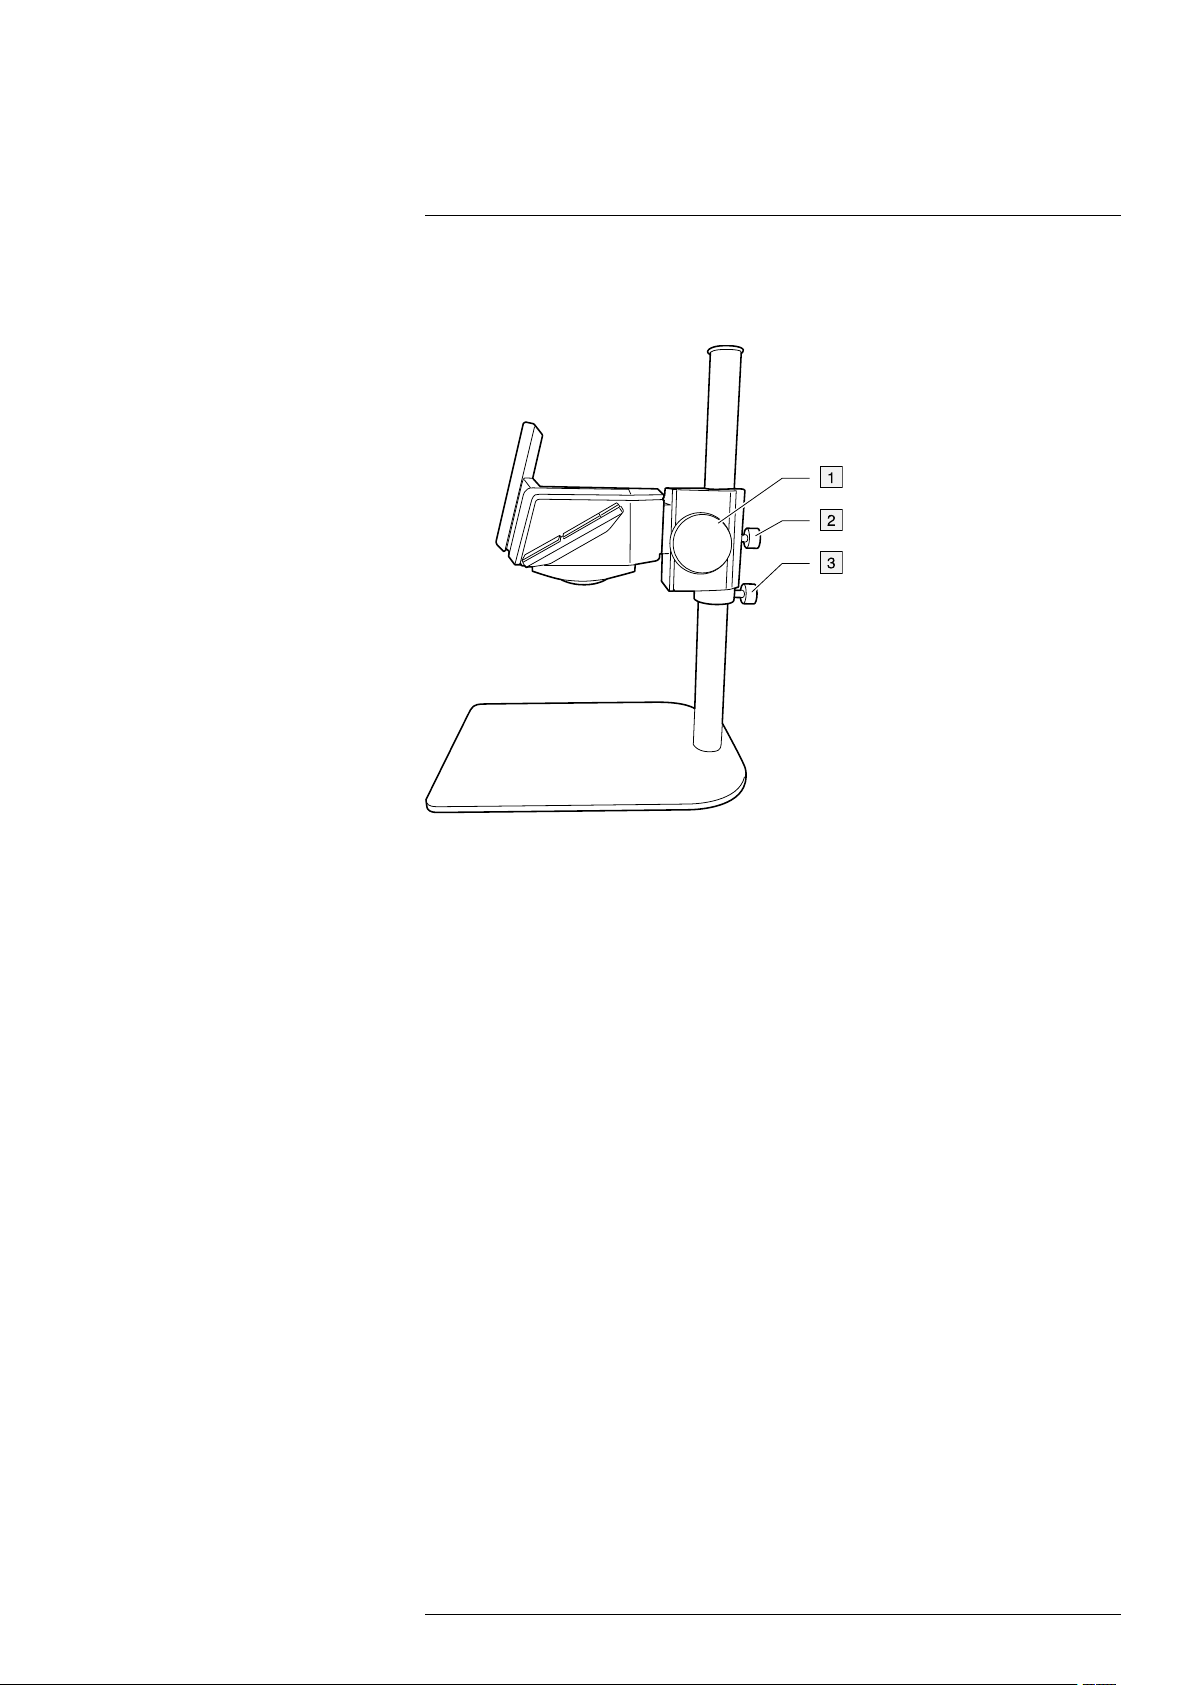
8.3 Adjusting the position of the camera unit
8.3.1 Figure
8.3.2 Explanation
1. Fine-adjustment knob.
2. Stand mount knob.
3. Supporting ring knob.
8.3.3 Procedure
Note Do not touch the lens surface. If this happens, clean the lens according to the in-
structions in 12.2 Infrared lens, page 33.
Follow this procedure:
1. For fine adjustments, turn the fine-adjustment knob.
2. For coarse adjustments, do the following:
2.1. Loosen the stand mount knob and move the stand mount to the desired posi-
tion. Tighten the stand mount knob.
2.2. Loosen the supporting ring knob and move the supporting ring near the stand
mount. Tighten the supporting ring knob.
8.4 Removing the stand mount from the
camera unit
Note Do not touch the lens surface. If this happens, clean the lens according to the in-
structions in 12.2 Infrared lens, page 33.
#T810252; r. AD/43675/43696; en-US
14
Page 23
Handling the camera unit8
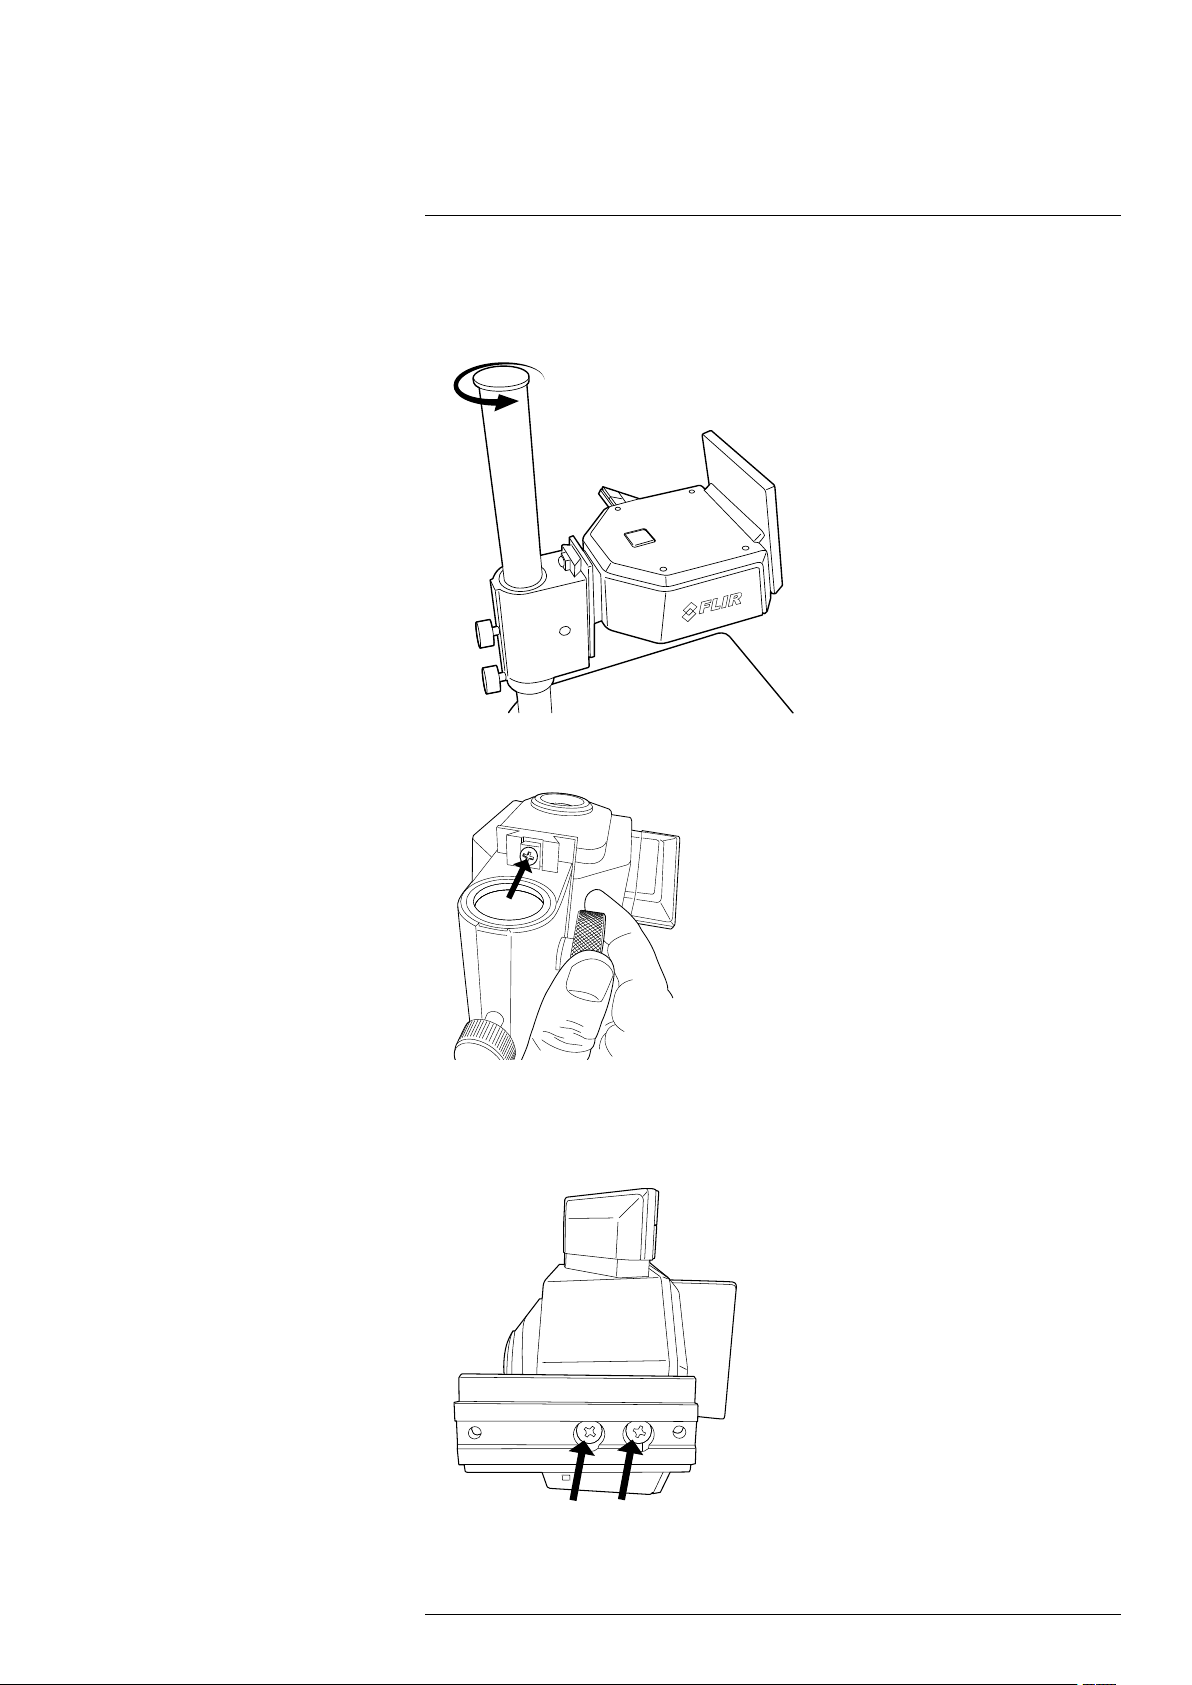
8.4.1 Procedure
Follow this procedure:
1. Turn and remove the top of the stand.
2. Loosen the stand mount knob and remove the camera unit from the stand.
3. Turn the fine-adjustment knob counter-clockwise until you can see a screw. Remove
the screw.
4. Turn the fine-adjustment knob clockwise until you can see a screw on the other side.
Remove the screw.
5. Remove the stand mount from the camera unit.
6. Remove the two screws that hold the bracket to the camera unit.
7. Remove the two screws that hold the bracket to the camera unit.
8. Remove the bracket from the camera unit.
#T810252; r. AD/43675/43696; en-US
15
Page 24

9
Operation
9.1 Saving an image
9.1.1 General
You can save multiple images to the internal camera memory.
9.1.2 Image capacity
Approximately 1500 images can be saved to the internal camera memory.
9.1.3 Naming convention
The naming convention for images is FLIRxxxx.jpg, where xxxx is a unique counter.
9.1.4 Procedure
Follow this procedure:
1. To save an image, push the Save button.
9.2 Recalling an image
9.2.1 General
When you save an image, it is stored in the internal camera memory. To display the image again, you can recall it from the internal camera memory.
9.2.2 Procedure
Follow this procedure:
1. Push the Archive button.
2. Push the navigation pad left/right or up/down to select the image you want to view.
3. Push the center of the navigation pad. This displays the selected image.
4. Do one or more of the following:
• To view the image in full screen, display image information, or delete the image,
push the center of the navigation pad. This displays a toolbar.
• To view the previous/next image, push the navigation pad left/right.
5. To return to live mode, push the Back button repeatedly or push the Archive button.
9.3 Deleting an image
9.3.1 General
You can delete one or more images from the internal camera memory.
9.3.2 Procedure
Follow this procedure:
1. Push the Archive button.
2. Push the navigation pad left/right or up/down to select the image you want to delete.
3. Push the center of the navigation pad. This displays the selected image.
4. Push the center of the navigation pad. This displays a toolbar.
5. On the toolbar, select Delete
delete the image or to cancel the delete action.
. This displays a dialog box where you can choose to
#T810252; r. AD/43675/43696; en-US
16
Page 25

9
Operation
9.4 Deleting all images
9.4.1 General
You can delete all images from the internal camera memory.
9.4.2 Procedure
Follow this procedure:
1. Push the center of the navigation pad. This displays a toolbar.
2. On the toolbar, select Settings
3. In the dialog box, select Device settings. This displays a dialog box.
4. In the dialog box, select Reset options. This displays a dialog box.
5. In the dialog box, select Delete all saved images. This displays a dialog box where
you can choose to permanently delete all the saved images or to cancel the delete
action.
. This displays a dialog box.
9.5 Measuring a temperature using a
spotmeter
9.5.1 General
You can measure a temperature using a spotmeter. This will display the temperature at
the position of the spotmeter on the screen.
9.5.2 Procedure
Follow this procedure:
1. Push the center of the navigation pad. This displays a toolbar.
2. On the toolbar, select Measurement
3. On the toolbar, select Center spot
The temperature at the position of the spotmeter will now be displayed in the top left
corner of the screen.
. This displays a toolbar.
.
9.6 Measuring the hottest temperature within
an area
9.6.1 General
You can measure the hottest temperature within an area. This displays a moving spotmeter that indicates the hottest temperature.
9.6.2 Procedure
Follow this procedure:
1. Push the center of the navigation pad. This displays a toolbar.
2. On the toolbar, select Measurement
3. On the toolbar, select Hot spot
. This displays a toolbar.
.
9.7 Measuring the coldest temperature within
an area
9.7.1 General
You can measure the coldest temperature within an area. This displays a moving spotmeter that indicates the coldest temperature.
#T810252; r. AD/43675/43696; en-US
17
Page 26

9
Operation
9.7.2 Procedure
Follow this procedure:
1. Push the center of the navigation pad. This displays a toolbar.
2. On the toolbar, select Measurement
3. On the toolbar, select Cold spot
. This displays a toolbar.
.
9.8 Hiding measurement tools
9.8.1 Procedure
Follow this procedure:
1. Push the center of the navigation pad. This displays a toolbar.
2. On the toolbar, select Measurement
3. On the toolbar, select No measurements
. This displays a toolbar.
.
9.9 Changing the color palette
9.9.1 General
You can change the color palette that the camera uses to display different temperatures.
A different palette can make it easier to analyze an image.
9.9.2 Procedure
Follow this procedure:
1. Push the center of the navigation pad. This displays a toolbar.
2. On the toolbar, select Color
3. On the toolbar, select a new color palette.
. This displays a toolbar.
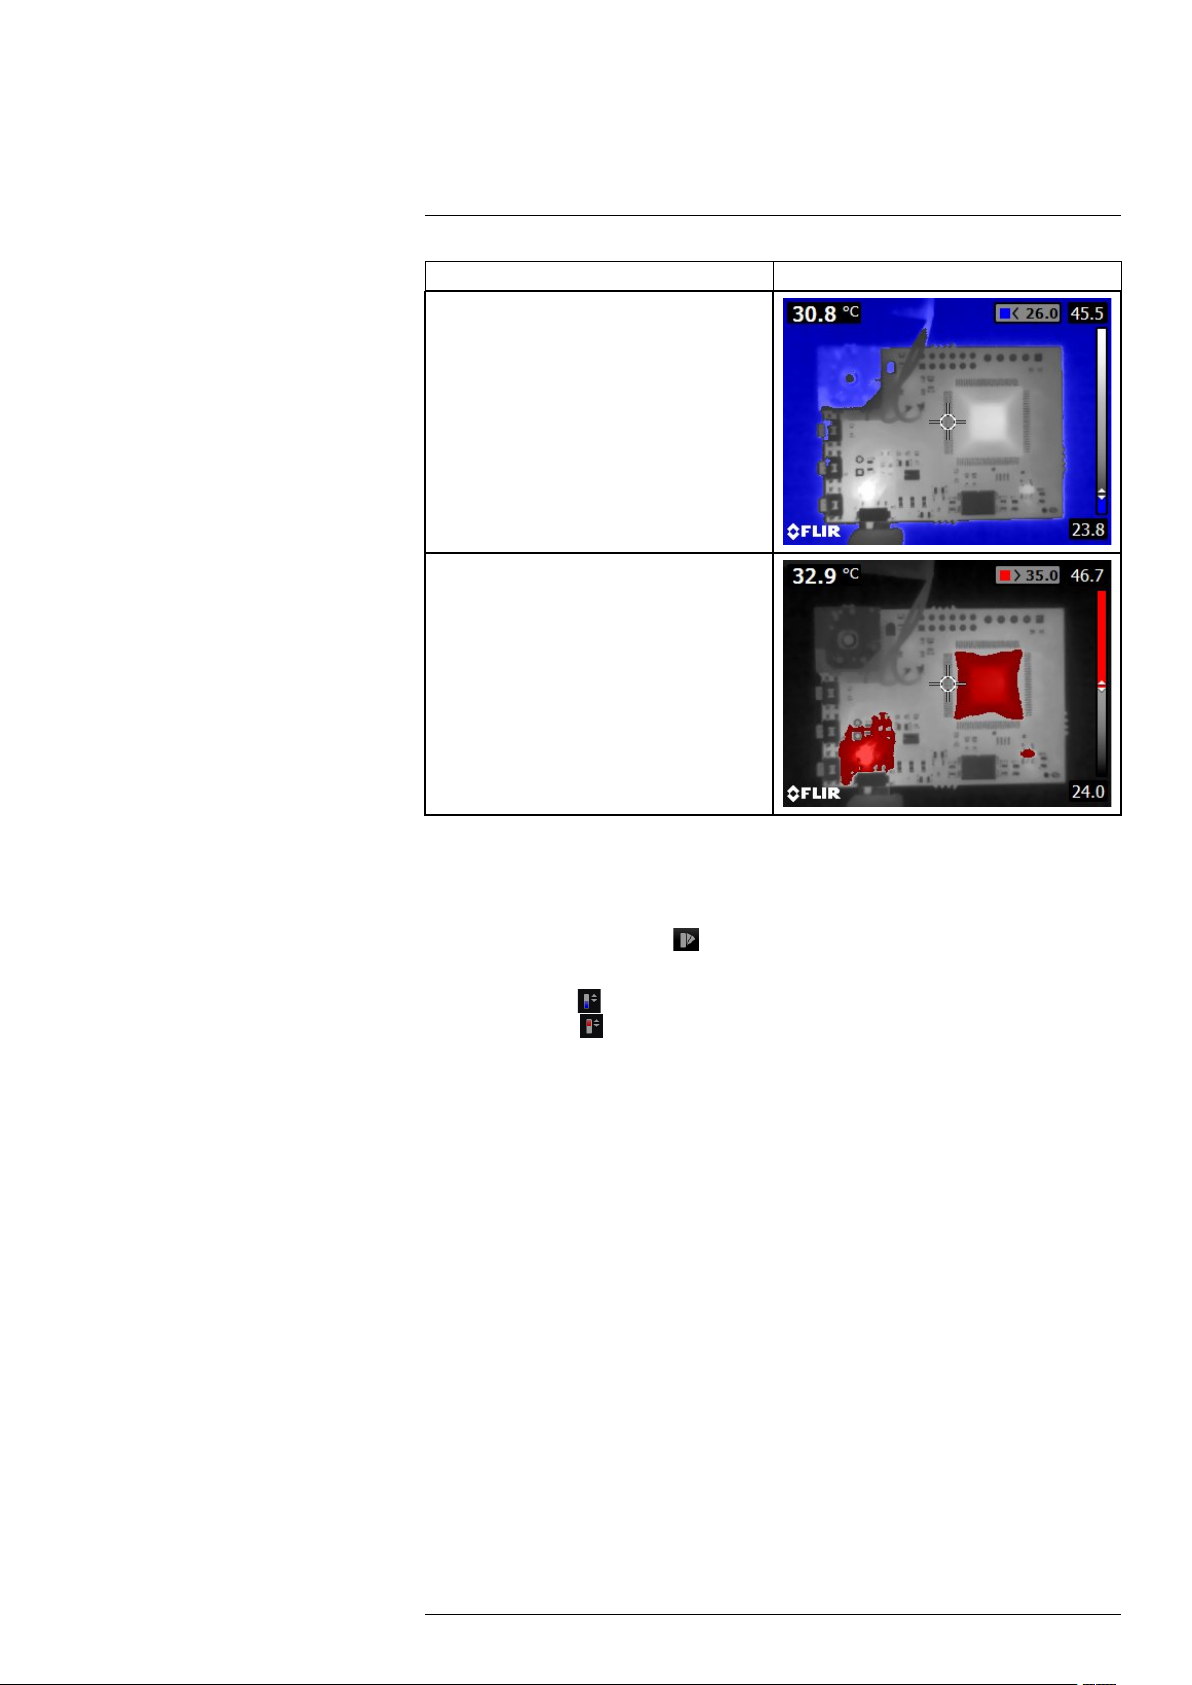
9.10 Working with color alarms
9.10.1 General
By using color alarms (isotherms), anomalies can easily be discovered in an infrared image. The isotherm command applies a contrasting color to all pixels with a temperature
above or below the specified temperature level.
9.10.2 Image examples
This table explains the different color alarms (isotherms).
#T810252; r. AD/43675/43696; en-US
18
Page 27
9
Operation
Color alarm
Below alarm
Above alarm
Image
9.10.3 Procedure
Follow this procedure:
1. Push the center of the navigation pad. This displays a toolbar.
2. On the toolbar, select Color
. This displays a toolbar.
3. On the toolbar, select the type of alarm:
• Below alarm
• Above alarm
.
.
4. Push the center of the navigation pad. The threshold temperature is displayed at the
top of the screen.
5. To change the threshold temperature, push the navigation pad up/down.
9.11 Changing the temperature scale mode
9.11.1 General
The camera can, depending on the camera model, operate in different temperature scale
modes:
• Auto mode: In this mode, the camera is continuously auto-adjusted for the best image
brightness and contrast.
• Manual mode: This mode allows manual adjustments of the temperature span and
the temperature level.
9.11.2 When to use Manual mode
Here are two infrared images of a PCB board. To make it easier to analyze the temperature variations in the component in the upper left corner, the temperature scale in the
right image has been changed to values close to the temperature of the component.
#T810252; r. AD/43675/43696; en-US
19
Page 28

9
Operation
Automatic Manual
9.11.3 Procedure
Follow this procedure:
1. Push the center of the navigation pad. This displays a toolbar.
2. On the toolbar, select Temperature scale
3. On the toolbar, select one of the following:
. This displays a toolbar.
• Auto
• Manual
4. To change the temperature span and the temperature level in Manual mode, do the
following:
• Push the navigation pad left/right to select (highlight) the maximum and/or mini-
mum temperature.
• Push the navigation pad up/down to change the value of the highlighted
temperature.
.
.
9.12 Setting the emissivity as a surface
property
9.12.1 General
To measure temperatures accurately, the camera must know what kind of surface you
are measuring. You can choose between the following surface properties:
• Matt.
• Semi-matt.
• Semi-glossy.
For more information about emissivity, see section 15 Thermographic measurement
techniques, page 39.
9.12.2 Procedure
Follow this procedure:
1. Push the center of the navigation pad. This displays a toolbar.
2. On the toolbar, select Settings
3. In the dialog box, select Measurement parameters. This displays a dialog box.
4. In the dialog box, select Emissivity. This displays a dialog box.
5. In the dialog box, select one of the following:
• Matt.
• Semi-matt.
• Semi-glossy.
. This displays a dialog box.
#T810252; r. AD/43675/43696; en-US
20
Page 29

9
Operation
9.13 Setting the emissivity as a custom
material
9.13.1 General
Instead of specifying a surface property as matt, semi-matt or semi-glossy, you can specify a custom material from a list of materials.
For more information about emissivity, see section 15 Thermographic measurement
techniques, page 39.
9.13.2 Procedure
Follow this procedure:
1. Push the center of the navigation pad. This displays a toolbar.
2. On the toolbar, select Settings
3. In the dialog box, select Measurement parameters. This displays a dialog box.
4. In the dialog box, select Emissivity. This displays a dialog box.
5. In the dialog box, select Custom material. This displays a list of materials with known
emissivities.
6. In the list, select the material.
. This displays a dialog box.
9.14 Changing the emissivity as a custom
value
9.14.1 General
For very precise measurements, you may need to set the emissivity, instead of selecting
a surface property or a custom material. You also need to understand how emissivity and
reflectivity affect measurements, rather than just simply selecting a surface property.
Emissivity is a property that indicates how much radiation originates from an object as
opposed to being reflected by it. A lower value indicates that a larger proportion is being
reflected, while a high value indicates that a lower proportion is being reflected.
Polished stainless steel, for example, has an emissivity of 0.14, while a structured PVC
floor typically has an emissivity of 0.93.
For more information about emissivity, see section 15 Thermographic measurement
techniques, page 39.
9.14.2 Procedure
Follow this procedure:
1. Push the center of the navigation pad. This displays a toolbar.
2. On the toolbar, select Settings
3. In the dialog box, select Measurement parameters. This displays a dialog box.
4. In the dialog box, select Emissivity. This displays a dialog box.
5. In the dialog box, select Custom value. This displays a dialog box where you can set
a custom value.
. This displays a dialog box.
9.15 Changing the reflected apparent
temperature
9.15.1 General
This parameter is used to compensate for the radiation reflected by the object. If the
emissivity is low and the object temperature significantly different from that of the
#T810252; r. AD/43675/43696; en-US
21
Page 30

9
Operation
reflected temperature, it will be important to set and compensate for the reflected apparent temperature correctly.
For more information about reflected apparent temperature, see section 15 Thermo-
graphic measurement techniques, page 39.
9.15.2 Procedure
Follow this procedure:
1. Push the center of the navigation pad. This displays a toolbar.
2. On the toolbar, select Settings
3. In the dialog box, select Measurement parameters. This displays a dialog box.
4. In the dialog box, select Reflected apparent temperature. This displays a dialog box
where you can set a value.
. This displays a dialog box.
9.16 Performing a non-uniformity correction
(NUC)
9.16.1 General
When the thermal camera displays Calibrating... it is performing what in thermography is
called a ”non-uniformity correction” (NUC). An NUC is an image correction carried out by
the camera software to compensate for different sensitivities of detector elements and
other optical and geometrical disturbances
calibration, page 50.
An NUC is performed automatically, for example at start-up or when the environment
temperature changes.
You can also perform an NUC manually. This is useful when you have to perform a critical
measurement with as little image disturbance as possible.
9.16.2 Procedure
Follow this procedure:
1. To perform a manual NUC, push and hold down the Archive button for more than 2
seconds.
2
. For more information, see section 17 About
9.17 Changing the settings
9.17.1 General
You can change a variety of settings for the camera.
The Settings menu includes the following:
• Measurement parameters.
• Device settings.
9.17.1.1 Measurement parameters
• Emissivity: Default value: 0.95.
• Reflected temperature: Default value: 20°C (69°F).
• Distance: Default value: 1.0 m (3.3 ft.).
2. Definition from the European standard EN 16714-3:2016, Non-destructive Testing—Thermographic Testing—
Part 3: Terms and Definitions.
#T810252; r. AD/43675/43696; en-US
22
Page 31

9
Operation
Note During normal operation there is typically no need to change the default meas-
urement parameters. For very accurate measurements, you may need to set the Emissivity and/or the Reflected temperature. For more information, see sections 9.12 Setting the
emissivity as a surface property, 9.13 Setting the emissivity as a custom material, 9.14
Changing the emissivity as a custom value, and 9.15 Changing the reflected apparent
temperature.
9.17.1.2 Device settings
• Language, time & units:
◦ Language.
◦ Temperature unit.
◦ Distance unit.
◦ Date & time.
◦ Date & time format.
• Reset options:
◦ Reset default camera mode.
◦ Reset device settings to factory default.
◦ Delete all saved images.
• Auto power off.
• Display intensity.
• Camera information: This menu command displays various items of information about
the camera, such as the model, serial number, and software version.
9.17.2 Procedure
Follow this procedure:
1. Push the center of the navigation pad. This displays a toolbar.
2. On the toolbar, select Settings
3. In the dialog box, select the setting that you want to change and use the navigation
pad to display additional dialog boxes.
. This displays a dialog box.
9.18 Updating the camera
9.18.1 General
To take advantage of our latest camera firmware, it is important that you keep your camera updated. You update your camera using FLIR Tools/Tools+.
9.18.2 Procedure
Follow this procedure:
1. Start FLIR Tools/Tools+.
2. Start the camera.
3. Connect the camera to the computer using the USB cable.
4. On the Help menu in FLIR Tools/Tools+, click Check for updates.
5. Follow the on-screen instructions.
#T810252; r. AD/43675/43696; en-US
23
Page 32

10
Technical data
10.1 Online field-of-view calculator
Please visit http://support.flir.com and click the photo of the camera series for field-of-
view tables for all lens–camera combinations.
10.2 Note about technical data
FLIR Systems reserves the right to change specifications at any time without prior notice.
Please check http://support.flir.com for latest changes.
10.3 Note about authoritative versions
The authoritative version of this publication is English. In the event of divergences due to
translation errors, the English text has precedence.
Any late changes are first implemented in English.
#T810252; r. AD/43675/43696; en-US
24
Page 33

Technical data10
10.4 FLIR ETS320
P/N: 63950-1001
Rev.: 42969
General description
The FLIR ETS320 is FLIR’s first electronic test bench camera, designed for a quick temperature check
of PCB boards and electronic devices. The FLIR ETS320 is sensitive enough to detect subtle temperature difference with an accuracy of ±3°C (5.4°F), so you can quickly find hot spots and potential points
of failure. The 320 × 240 pixel infrared detector offers more than 76 000 points of temperature measurement, eliminating the guesswork of legacy measurement tools. Designed specifically for bench-top
work, the battery-powered FLIR ETS 320 connects to your PC for immediate analysis and sharing of
thermal data.
Benefits:
• Reduces test times: Quickly identify hot spots, thermal gradients, and potential points of failure.
• Improves product design: Know where and when to add fans and heatsinks, and ensure products
are operating within specification for their maximum lifetime.
• Saves money: Improve rapid prototyping and reduce product development cycles.
• Optimizes lab time: Battery powered and hands-free, and offers complete measurement and analysis in the camera.
Key features:
• >76 000 points of non-contact temperature measurement at the push of a button.
• 320 × 240 pixel detector provides crisp thermal imagery.
• Time versus temperature measurement with FLIR Tools+.
• Small-component measurement, down to 170 µm per pixel spot size.
• Lens offers a 45° thermal view of the target for the quick detection of hot spots.
• Records radiometric imagery in standard JPEG format for easier sharing.
• ±3% accuracy promotes quality assurance and factory acceptance of PCBs.
• Quickly mounts on the supplied stand for immediate use.
• Crisp 3 in. LCD display provides immediate thermal feedback.
• World-class software provided for advanced measurement corrections/capabilities.
Imaging and optical data
IR resolution 320 × 240 pixels
Thermal sensitivity/NETD <0.06°C (0.11°F)/<60 mK
Field of view (FOV)
Fixed focus distance 70 mm ± 10 mm (2.8 in. ±0.4 in.)
Spatial resolution (IFOV)
F-number 1.5
Image frequency 9 Hz
Detector data
Detector type Focal plane array (FPA), uncooled
Spectral range
Image presentation
Display
Image adjustment
Measurement
Object temperature range –20°C to +250°C (–4°F to +482°F)
Accuracy ±3°C (±5.4°F) or ±3% of reading, whichever
45° × 34°
2.6 mrad
microbolometer
7.5–13 µm
3.0 in. 320 × 240 color LCD
Automatic/manual
greatest, for ambient temperature 10°C (50°F) to
35°C (95°F) and object temperature above +0°C
(+32°F)
#T810252; r. AD/43675/43696; en-US
25
Page 34

Technical data10
Measurement analysis
Spotmeter Center spot
Area
Emissivity correction Variable from 0.1 to 1.0
Emissivity table Emissivity table of predefined materials
Reflected apparent temperature correction Automatic, based on input of reflected
Set-up
Color palettes Black and white, iron, and rainbow
Set-up commands Local adaptation of units, language, date and time
Video streaming
Radiometric IR video streaming Full dynamic to PC (FLIR Tools/Tools+) using
Non-radiometric IR video streaming
Box with maximum/minimum
temperature
formats
USB
Uncompressed colorized video using USB
Storage of images
File formats Standard JPEG, 14-bit measurement data
Data communication interfaces
Interfaces USB Micro: Data transfer to and from PC and
Power system
Battery type Rechargeable Li ion battery
Battery voltage 3.7 V
Battery operating time
Charging system
Charging time 2.5 hours to 90% capacity
Power management Automatic shut-down
AC operation AC adapter, 90–260 V AC input, 5 V DC output to
Environmental data
Operating temperature range 10–40°C (50–104°F)
Storage temperature range –40 to +70°C (–40 to +158°F)
Humidity (operating and storage) IEC 60068-2-30/24 h 95% relative humidity
Encapsulation
included
Mac devices
Approximately 4 hours at 25°C (77°F) ambient
temperature and typical use
Battery is charged inside the unit
camera
IP 40 (IEC 60529)
Directives and regulations
Directives and regulations
#T810252; r. AD/43675/43696; en-US
• Battery Directive 2006/66/EC
• EMC Directive 2014/30/EU
• FCC 47 CFR Part 15 Class B Subpart B
• REACH Regulation EC 1907/2006
• RoHS2 Directive 2011/65/EC
• WEEE Directive 2012/19/EC
26
Page 35

Technical data10
Physical data
System weight, incl. battery 1.8 kg (4.0 lb.)
System size (L × W × H) 220 mm × 150 mm × 300 mm (8.7 in. × 5.9 in. ×
Color Black and gray
Shipping information
Packaging, type
List of contents
Packaging, weight 2.9 kg (6.4 lb.)
Packaging, size (L × W × H) 290 mm × 170 mm × 378 mm (11.4 in. × 6.7 in. ×
EAN-13 4743254002913
UPC-12
Country of origin Designed & Engineered by FLIR Systems,
11.8 in.)
Cardboard box
• FLIR Tools+
• Infrared camera unit
• Power supply
• Printed documentation
• USB cable
14.9 in.)
845188014186
Sweden.
Assembled in Taiwan.
#T810252; r. AD/43675/43696; en-US
27
Page 36

11
Mechanical drawings
[See next page]
#T810252; r. AD/43675/43696; en-US
28
Page 37

0,06in
1,5mm
(ESD discharge plate)
4,39in
111,6mm
11,81in
300mm
0,38in
9,7mm
1,83in
46,4mm
2,48in
63mm
0,84in
21,3mm
5,91in
150mm
8,66in
220mm
0,31in
R8mm
1,97in
R50mm
4,43in
112,5mm
Optical Center
2,95in
75mm
1,58in
40,2mm
6,94in
176,2mm
2,17in
55,2mm
0,36in
9,2mm
1,57in
40mm
Optical Center
3,98in
101,2mm
Front View
Top View
Sheet
Drawing No.
Size
Check
Drawn by
Denomination
A3
1(4)
T130266
Basic Dimension ETS 320
TMHA
2017-03-01
R&D Instruments
Modified
1 2 3 4 5 6 7 8 9 10
A
B
C
D
E
F
G
H
1 32 54
C
F
B
D
G
E
A
6
Rev
A
1:2
Scale
© 2016, FLIR Systems, Inc. All rights reserved worldwide. No part of this drawing may be reproduced, stored in a retrieval system, or transmitted in any form, or by any means, electronic, mechanical, photocopying, recording, or otherwise,
without written permission from FLIR Systems, Inc. Specifications subject to change without further notice. Dimensional data is based on nominal values. Products may be subject to regional market considerations. License procedures may apply.
Product may be subject to US Export Regulations. Please refer to exportquestions@flir.com with any questions. Diversion contrary to US law is prohibited.
Page 38

2,56in
±0,39
65mm
±10
( 0 - 6,9 in)
Max object height 0 - 176mm
0,87in
22mm
1,23in
31,15mm
2,56in
±0,39
65mm
±10
Sheet
Drawing No.
Size
Check
Drawn by
Denomination
A3
2(4)
T130266
Basic Dimension ETS 320
TMHA
2017-03-01
R&D Instruments
Modified
1 2 3 4 5 6 7 8 9 10
A
B
C
D
E
F
G
H
1 32 54
C
F
B
D
G
E
A
6
Rev
A
1:2
Scale
© 2016, FLIR Systems, Inc. All rights reserved worldwide. No part of this drawing may be reproduced, stored in a retrieval system, or transmitted in any form, or by any means, electronic, mechanical, photocopying, recording, or otherwise,
without written permission from FLIR Systems, Inc. Specifications subject to change without further notice. Dimensional data is based on nominal values. Products may be subject to regional market considerations. License procedures may apply.
Product may be subject to US Export Regulations. Please refer to exportquestions@flir.com with any questions. Diversion contrary to US law is prohibited.
Page 39

A
0,94in
24mm
0,83in
21mm
DETAIL A
SCALE 1 : 1
Total adjustment length (locked): 45mm (1,77 in)
Sheet
Drawing No.
Size
Check
Drawn by
Denomination
A3
3(4)
T130266
Basic Dimension ETS 320
TMHA
2017-03-01
R&D Instruments
Modified
1 2 3 4 5 6 7 8 9 10
A
B
C
D
E
F
G
H
1 32 54
C
F
B
D
G
E
A
6
Rev
A
1:2
Scale
© 2016, FLIR Systems, Inc. All rights reserved worldwide. No part of this drawing may be reproduced, stored in a retrieval system, or transmitted in any form, or by any means, electronic, mechanical, photocopying, recording, or otherwise,
without written permission from FLIR Systems, Inc. Specifications subject to change without further notice. Dimensional data is based on nominal values. Products may be subject to regional market considerations. License procedures may apply.
Product may be subject to US Export Regulations. Please refer to exportquestions@flir.com with any questions. Diversion contrary to US law is prohibited.
Page 40

Sheet
Drawing No.
Size
Check
Drawn by
Denomination
A3
4(4)
T130266
Basic Dimension ETS 320
TMHA
2017-03-01
R&D Instruments
Modified
1 2 3 4 5 6 7 8 9 10
A
B
C
D
E
F
G
H
1 32 54
C
F
B
D
G
E
A
6
Rev
A
1:2
Scale
© 2016, FLIR Systems, Inc. All rights reserved worldwide. No part of this drawing may be reproduced, stored in a retrieval system, or transmitted in any form, or by any means, electronic, mechanical, photocopying, recording, or otherwise,
without written permission from FLIR Systems, Inc. Specifications subject to change without further notice. Dimensional data is based on nominal values. Products may be subject to regional market considerations. License procedures may apply.
Product may be subject to US Export Regulations. Please refer to exportquestions@flir.com with any questions. Diversion contrary to US law is prohibited.
Page 41

12
Cleaning the camera
12.1 Camera housing, cables, and other items
12.1.1 Liquids
Use one of these liquids:
• Warm water
• A weak detergent solution
12.1.2 Equipment
A soft cloth
12.1.3 Procedure
Follow this procedure:
1. Soak the cloth in the liquid.
2. Twist the cloth to remove excess liquid.
3. Clean the part with the cloth.
CAUTION
Do not apply solvents or similar liquids to the camera, the cables, or other items. This can cause
damage.
12.2 Infrared lens
12.2.1 Liquids
Use one of these liquids:
• A commercial lens cleaning liquid with more than 30% isopropyl alcohol.
• 96% ethyl alcohol (C
12.2.2 Equipment
Cotton wool
CAUTION
If you use a lens cleaning cloth it must be dry. Do not use a lens cleaning cloth with the liquids that are
given in section 12.2.1 above. These liquids can cause material on the lens cleaning cloth to become
loose. This material can have an unwanted effect on the surface of the lens.
12.2.3 Procedure
Follow this procedure:
1. Soak the cotton wool in the liquid.
2. Twist the cotton wool to remove excess liquid.
3. Clean the lens one time only and discard the cotton wool.
2H5
OH).
WARNING
Make sure that you read all applicable MSDS (Material Safety Data Sheets) and warning labels on containers before you use a liquid: the liquids can be dangerous.
CAUTION
• Be careful when you clean the infrared lens. The lens has a delicate anti-reflective coating.
• Do not clean the infrared lens too vigorously. This can damage the anti-reflective coating.
#T810252; r. AD/43675/43696; en-US
33
Page 42

13
About FLIR Systems
FLIR Systems was established in 1978 to pioneer the development of high-performance
infrared imaging systems, and is the world leader in the design, manufacture, and marketing of thermal imaging systems for a wide variety of commercial, industrial, and government applications. Today, FLIR Systems embraces five major companies with
outstanding achievements in infrared technology since 1958—the Swedish AGEMA Infrared Systems (formerly AGA Infrared Systems), the three United States companies Indigo Systems, FSI, and Inframetrics, and the French company Cedip.
Since 2007, FLIR Systems has acquired several companies with world-leading expertise
in sensor technologies:
• Extech Instruments (2007)
• Ifara Tecnologías (2008)
• Salvador Imaging (2009)
• OmniTech Partners (2009)
• Directed Perception (2009)
• Raymarine (2010)
• ICx Technologies (2010)
• TackTick Marine Digital Instruments (2011)
• Aerius Photonics (2011)
• Lorex Technology (2012)
• Traficon (2012)
• MARSS (2013)
• DigitalOptics micro-optics business (2013)
• DVTEL (2015)
• Point Grey Research (2016)
• Prox Dynamics (2016)
Figure 13.1 Patent documents from the early 1960s
FLIR Systems has three manufacturing plants in the United States (Portland, OR, Boston,
MA, Santa Barbara, CA) and one in Sweden (Stockholm). Since 2007 there is also a
manufacturing plant in Tallinn, Estonia. Direct sales offices in Belgium, Brazil, China,
France, Germany, Great Britain, Hong Kong, Italy, Japan, Korea, Sweden, and the USA
—together with a worldwide network of agents and distributors—support our international customer base.
#T810252; r. AD/43675/43696; en-US
34
Page 43

13
About FLIR Systems
FLIR Systems is at the forefront of innovation in the infrared camera industry. We anticipate market demand by constantly improving our existing cameras and developing new
ones. The company has set milestones in product design and development such as the
introduction of the first battery-operated portable camera for industrial inspections, and
the first uncooled infrared camera, to mention just two innovations.
Figure 13.2 1969: Thermovision Model 661. The
camera weighed approximately 25 kg (55 lb.), the
oscilloscope 20 kg (44 lb.), and the tripod 15 kg
(33 lb.). The operator also needed a 220 VAC
generator set, and a 10 L (2.6 US gallon) jar with
liquid nitrogen. To the left of the oscilloscope the
Polaroid attachment (6 kg (13 lb.)) can be seen.
Figure 13.3 2015: FLIR One, an accessory to
iPhone and Android mobile phones. Weight: 90 g
(3.2 oz.).
FLIR Systems manufactures all vital mechanical and electronic components of the camera systems itself. From detector design and manufacturing, to lenses and system electronics, to final testing and calibration, all production steps are carried out and
supervised by our own engineers. The in-depth expertise of these infrared specialists ensures the accuracy and reliability of all vital components that are assembled into your infrared camera.
13.1 More than just an infrared camera
At FLIR Systems we recognize that our job is to go beyond just producing the best infrared camera systems. We are committed to enabling all users of our infrared camera systems to work more productively by providing them with the most powerful camera–
software combination. Especially tailored software for predictive maintenance, R & D,
and process monitoring is developed in-house. Most software is available in a wide variety of languages.
We support all our infrared cameras with a wide variety of accessories to adapt your
equipment to the most demanding infrared applications.
13.2 Sharing our knowledge
Although our cameras are designed to be very user-friendly, there is a lot more to thermography than just knowing how to handle a camera. Therefore, FLIR Systems has
founded the Infrared Training Center (ITC), a separate business unit, that provides certified training courses. Attending one of the ITC courses will give you a truly hands-on
learning experience.
The staff of the ITC are also there to provide you with any application support you may
need in putting infrared theory into practice.
#T810252; r. AD/43675/43696; en-US
35
Page 44

13
About FLIR Systems
13.3 Supporting our customers
FLIR Systems operates a worldwide service network to keep your camera running at all
times. If you discover a problem with your camera, local service centers have all the
equipment and expertise to solve it within the shortest possible time. Therefore, there is
no need to send your camera to the other side of the world or to talk to someone who
does not speak your language.
#T810252; r. AD/43675/43696; en-US
36
Page 45

14
Terms, laws, and definitions
Term Definition
Absorption and emission
Apparent temperature uncompensated reading from an infrared instrument, con-
Color palette assigns different colors to indicate specific levels of apparent
Conduction direct transfer of thermal energy from molecule to molecule,
Convection heat transfer mode where a fluid is brought into motion, ei-
Diagnostics examination of symptoms and syndromes to determine the
Direction of heat transfer
Emissivity ratio of the power radiated by real bodies to the power that is
Energy conservation
Exitant radiation radiation that leaves the surface of an object, regardless of
Heat thermal energy that is transferred between two objects (sys-
Heat transfer rate
Incident radiation radiation that strikes an object from its surroundings
IR thermography process of acquisition and analysis of thermal information
Isotherm replaces certain colors in the scale with a contrasting color. It
Qualitative thermography thermography that relies on the analysis of thermal patterns
Quantitative thermography thermography that uses temperature measurement to deter-
3
The capacity or ability of an object to absorb incident radiated energy is always the same as the capacity to emit its
own energy as radiation
taining all radiation incident on the instrument, regardless of
its sources
4
temperature. Palettes can provide high or low contrast, depending on the colors used in them
caused by collisions between the molecules
ther by gravity or another force, thereby transferring heat
from one place to another
nature of faults or failures
6
Heat will spontaneously flow from hotter to colder, thereby
transferring thermal energy from one place to another
radiated by a blackbody at the same temperature and at the
same wavelength
9
The sum of the total energy contents in a closed system is
5
7
8
constant
its original sources
tems) due to their difference in temperature
10
The heat transfer rate under steady state conditions is directly proportional to the thermal conductivity of the object,
the cross-sectional area of the object through which the heat
flows, and the temperature difference between the two ends
of the object. It is inversely proportional to the length, or
thickness, of the object
11
from non-contact thermal imaging devices
marks an interval of equal apparent temperature
to reveal the existence of and to locate the position of
anomalies
mine the seriousness of an anomaly, in order to establish repair priorities
13
13
12
3. Kirchhoff’s law of thermal radiation.
4. Based on ISO 18434-1:2008 (en).
5. Based on ISO 13372:2004 (en).
6. 2nd law of thermodynamics.
7. This is a consequence of the 2nd law of thermodynamics, the law itself is more complicated.
8. Based on ISO 16714-3:2016 (en).
9. 1st law of thermodynamics.
10.Fourier’s law.
11.This is the one-dimensional form of Fourier’s law, valid for steady-state conditions.
12.Based on ISO 18434-1:2008 (en)
13.Based on ISO 10878-2013 (en).
#T810252; r. AD/43675/43696; en-US
37
Page 46

14
Terms, laws, and definitions
Term Definition
Radiative heat transfer Heat transfer by the emission and absorption of thermal
Reflected apparent temperature apparent temperature of the environment that is reflected by
Spatial resolution ability of an IR camera to resolve small objects or details
Temperature measure of the average kinetic energy of the molecules and
Thermal energy total kinetic energy of the molecules that make up the
Thermal gradient gradual change in temperature over distance
Thermal tuning process of putting the colors of the image on the object of
radiation
the target into the IR camera
14
atoms that make up the substance
15
object
analysis, in order to maximize contrast
14
14.Based on ISO 16714-3:2016 (en).
15.Thermal energy is part of the internal energy of an object.
#T810252; r. AD/43675/43696; en-US
38
Page 47

15
Thermographic measurement techniques
15.1 Introduction
An infrared camera measures and images the emitted infrared radiation from an object.
The fact that radiation is a function of object surface temperature makes it possible for
the camera to calculate and display this temperature.
However, the radiation measured by the camera does not only depend on the temperature of the object but is also a function of the emissivity. Radiation also originates from
the surroundings and is reflected in the object. The radiation from the object and the reflected radiation will also be influenced by the absorption of the atmosphere.
To measure temperature accurately, it is therefore necessary to compensate for the effects of a number of different radiation sources. This is done on-line automatically by the
camera. The following object parameters must, however, be supplied for the camera:
• The emissivity of the object
• The reflected apparent temperature
• The distance between the object and the camera
• The relative humidity
• Temperature of the atmosphere
15.2 Emissivity
The most important object parameter to set correctly is the emissivity which, in short, is a
measure of how much radiation is emitted from the object, compared to that from a perfect blackbody of the same temperature.
Normally, object materials and surface treatments exhibit emissivity ranging from approximately 0.1 to 0.95. A highly polished (mirror) surface falls below 0.1, while an oxidized
or painted surface has a higher emissivity. Oil-based paint, regardless of color in the visible spectrum, has an emissivity over 0.9 in the infrared. Human skin exhibits an emissivity 0.97 to 0.98.
Non-oxidized metals represent an extreme case of perfect opacity and high reflexivity,
which does not vary greatly with wavelength. Consequently, the emissivity of metals is
low – only increasing with temperature. For non-metals, emissivity tends to be high, and
decreases with temperature.
15.2.1 Finding the emissivity of a sample
15.2.1.1 Step 1: Determining reflected apparent temperature
Use one of the following two methods to determine reflected apparent temperature:
#T810252; r. AD/43675/43696; en-US
39
Page 48

Thermographic measurement techniques15
15.2.1.1.1 Method 1: Direct method
Follow this procedure:
1. Look for possible reflection sources, considering that the incident angle = reflection
angle (a = b).
Figure 15.1 1 = Reflection source
2. If the reflection source is a spot source, modify the source by obstructing it using a
piece if cardboard.
Figure 15.2 1 = Reflection source
#T810252; r. AD/43675/43696; en-US
40
Page 49

Thermographic measurement techniques15
3. Measure the radiation intensity (= apparent temperature) from the reflection source
using the following settings:
• Emissivity: 1.0
• D
: 0
obj
You can measure the radiation intensity using one of the following two methods:
Figure 15.3 1 = Reflection source Figure 15.4 1 = Reflection source
You can not use a thermocouple to measure reflected apparent temperature, because a
thermocouple measures temperature, but apparent temperatrure is radiation intensity.
15.2.1.1.2 Method 2: Reflector method
Follow this procedure:
1. Crumble up a large piece of aluminum foil.
2. Uncrumble the aluminum foil and attach it to a piece of cardboard of the same size.
3. Put the piece of cardboard in front of the object you want to measure. Make sure that
the side with aluminum foil points to the camera.
4. Set the emissivity to 1.0.
#T810252; r. AD/43675/43696; en-US
41
Page 50

Thermographic measurement techniques15
5. Measure the apparent temperature of the aluminum foil and write it down. The foil is
considered a perfect reflector, so its apparent temperature equals the reflected apparent temperature from the surroundings.
Figure 15.5 Measuring the apparent temperature of the aluminum foil.
15.2.1.2 Step 2: Determining the emissivity
Follow this procedure:
1. Select a place to put the sample.
2. Determine and set reflected apparent temperature according to the previous
procedure.
3. Put a piece of electrical tape with known high emissivity on the sample.
4. Heat the sample at least 20 K above room temperature. Heating must be reasonably
even.
5. Focus and auto-adjust the camera, and freeze the image.
6. Adjust Level and Span for best image brightness and contrast.
7. Set emissivity to that of the tape (usually 0.97).
8. Measure the temperature of the tape using one of the following measurement
functions:
• Isotherm (helps you to determine both the temperature and how evenly you have
heated the sample)
• Spot (simpler)
• Box Avg (good for surfaces with varying emissivity).
9. Write down the temperature.
10. Move your measurement function to the sample surface.
11. Change the emissivity setting until you read the same temperature as your previous
measurement.
12. Write down the emissivity.
Note
• Avoid forced convection
• Look for a thermally stable surrounding that will not generate spot reflections
• Use high quality tape that you know is not transparent, and has a high emissivity you
are certain of
• This method assumes that the temperature of your tape and the sample surface are
the same. If they are not, your emissivity measurement will be wrong.
#T810252; r. AD/43675/43696; en-US
42
Page 51

Thermographic measurement techniques15
15.3 Reflected apparent temperature
This parameter is used to compensate for the radiation reflected in the object. If the
emissivity is low and the object temperature relatively far from that of the reflected it will
be important to set and compensate for the reflected apparent temperature correctly.
15.4 Distance
The distance is the distance between the object and the front lens of the camera. This
parameter is used to compensate for the following two facts:
• That radiation from the target is absorbed by the atmosphere between the object and
the camera.
• That radiation from the atmosphere itself is detected by the camera.
15.5 Relative humidity
The camera can also compensate for the fact that the transmittance is also dependent
on the relative humidity of the atmosphere. To do this set the relative humidity to the correct value. For short distances and normal humidity the relative humidity can normally be
left at a default value of 50%.
15.6 Other parameters
In addition, some cameras and analysis programs from FLIR Systems allow you to compensate for the following parameters:
• Atmospheric temperature – i.e. the temperature of the atmosphere between the cam-
era and the target
• External optics temperature – i.e. the temperature of any external lenses or windows
used in front of the camera
• External optics transmittance – i.e. the transmission of any external lenses or windows
used in front of the camera
#T810252; r. AD/43675/43696; en-US
43
Page 52

16
The secret to a good thermal image
16.1 Introduction
The use of thermal cameras has spread to many professional environments in recent
years. They are easy to handle, and thermal images are quick to take. Images can also
be attached to reports easily, e.g., for an inspection of an electrical installation or building
as evidence of work carried out or of any faults or deviations identified. However, people
often forget that an image to be used as evidence or even proof before the courts must
meet certain requirements: this is not achieved with a quick snapshot. So, what characterizes a really good thermal image?
16.2 Background
During the practical exercises in our thermography training classes we notice, time and
time again, how difficult some participants find choosing the optimal camera settings for
different tasks. Not everyone has a background in, for example, amateur photography
(more on the difference between thermography and photography in the next section),
and to take a good and meaningful thermal image you need some knowledge of photography, including its practical application. For this reason, it is hardly surprising that thermographers, particularly those without training, repeatedly produce reports with thermal
images that are devoid of meaning or even support the wrong conclusions and are fit only for the waste bin. Unfortunately, such reports are found not only in companies in which
thermography is more of an added bonus but also in businesses where these reports
may be part of a critical process monitoring or maintenance program. There are two main
reasons for this: either the users don't know what a good thermal image is or how to take
one, or—for whatever reason—the job is not being done properly.
16.3 A good image
As thermography and photography are related, it makes sense to take a look at what is
important to professional photographers. How do they characterize a good image? Three
aspects can be pointed out as the most important:
1. An image has to touch the observer in some way. That means it needs to be unusual,
striking, or unique, and has to arouse interest and, depending on the genre, emotion.
2. The composition and balance must be in harmony; the image detail and content must
go together aesthetically.
3. The lighting must be interesting, such as back lighting or side lighting that casts dramatic shadows, or evening light or other pleasing illumination—whatever fits the overall effect that the photographer wants.
To what extent can these concepts be applied to thermography?
With thermography, the motif should also be interesting. In other words, our aim is to de-
pict an object or its condition. Emotions are not required—facts have priority in thermal
images (assuming they are not an art project!). In everyday working life, it is important to
illustrate thermal patterns clearly and to facilitate temperature measurements.
The thermal image must also have suitable image detail and display the object at an appropriate size and position.
Without external illumination, neither visual sight nor photography is possible because
what we see with our eyes or capture with a camera is reflected light. In thermography,
the camera records both emitted and reflected radiation. Therefore, the relationship and
intensity of the infrared radiation, both emitted by the object and by the surrounding environment, are important. Brightness and contrast in the image are then adjusted by
changing the displayed temperature interval.
The comparison between photography and thermography can be summarized in a table
using a few keywords:
Photography Thermography
Interesting motif The object to be examined
“Tells a story” “Presents facts”
#T810252; r. AD/43675/43696; en-US
44
Page 53

The secret to a good thermal image16
Photography Thermography
Aesthetically pleasing Clear heat patterns
Emotive Objective
Image detail Image detail
Focus Focus
Lighting Emission and reflection
Brightness Brightness
Contrast Contrast
As with photography, in thermography there are countless possibilities for editing images
—provided they are saved as radiometric images. However, not all settings can be
changed, and not all image errors can be corrected.
16.4 The three unchangeables—the basis for a good image
16.4.1 Focus
A professional thermal image is always focused and sharp, and the object and heat pattern must be clear and easy to recognize.
Figure 16.1 Only hazy “patches of heat” can be seen in the unfocused image (left). The focused image
(right) clearly shows which object is being observed and where the object is warm.
A blurred image not only comes across as unprofessional and makes it harder to identify
the object and any faults (see Figure 16.1) but can also lead to measurement errors (see
Figure 16.2), which are more serious the smaller the measurement object. Even if all other parameters are set correctly, the measurement values from an unfocused thermal image are highly likely to be incorrect.
Figure 16.2 Focused thermal image (left) with a maximum temperature of T
unfocused thermal image (right) with a maximum temperature of T
= 73.7°C (164.7°F).
max
= 89.7°C (193.5°F) and an
max
Of course, the size of the detector matrix also plays a role in image quality. Images taken
by cameras with small detectors (i.e., with fewer pixels) are more blurred or “grainier”
and give the impression that they are not focused (see Figure 16.3). It should also be
noted that not every camera can be focused, and in this case the only means of focusing
the camera is by changing the distance from the object.
#T810252; r. AD/43675/43696; en-US
45
Page 54

The secret to a good thermal image16
Figure 16.3 The same radiator from the same distance with the same settings, taken by three different
thermal cameras: FLIR C2 (left), FLIR T440 (middle), and FLIR T640 (right).
16.4.2 Temperature range
For hand-held uncooled microbolometer cameras, the “exposure” is essentially preset by
the image frame rate. This means that it is not possible to choose for how long—and
therefore how much—radiation hits the camera detector. For this reason, an appropriate
temperature range must be selected that matches the amount of incident radiation. If a
temperature range is selected that is too low, the image will be oversaturated, as objects
with higher temperatures emit more infrared radiation than colder objects. If you select a
temperature range that is too high, the thermal image will be “underexposed,” as can be
seen in Figure 16.4.
Figure 16.4 Images from a FLIR T440 with temperature ranges of –20 to +120°C, (left, –4 to +248°F), 0 to
+650°C (middle, +32 to +1202°F) and +250 to +1200°C (right, +482 to +2192°F). All other settings are
unchanged.
To take an image or temperature measurement, the lowest possible temperature range
available on the camera should be selected. However, it must also include the highest
temperature in the image (see Figure 16.5).
Figure 16.5 An image of the same object taken with different temperature ranges: –20 to 120°C (left, –4
to +248°F) and 0 to 650°C (right, +32 to +1202°F). The temperature in the left image is displayed with a
warning sign (a red circle with a white cross) because the measured values are outside the calibrated
range.
Depending on the camera model and configuration options, overdriven and underdriven
areas can be displayed in a contrasting color.
16.4.3 Image detail and distance from the object
Illumination in photography corresponds in thermography to the interplay of radiation
from the object and reflected radiation from the surrounding environment. The latter is
unwanted because interfering—or, at the very least, spot—reflections need to be
avoided. This is achieved by choosing a suitable position from where to take images. It is
also advisable to select a position from which the object of interest can be seen clearly
and is not hidden. This may seem obvious but in the building sector, for example, it is
common to find reports in which pipes or windows to be investigated are hidden behind
#T810252; r. AD/43675/43696; en-US
46
Page 55

The secret to a good thermal image16
sofas, indoor plants or curtains. Figure 16.6 illustrates this situation—which occurs all
too regularly.
Figure 16.6 “Thermographic inspection” of an inaccessible object.
It is also important that the object under investigation, or its areas of interest, take up the
whole thermal image. This is particularly true when measuring the temperature of small
objects. The spot tool must be completely filled by the object to enable correct temperature measurements. Since the field of view and therefore the spot size are determined by
both the distance to the object and the camera’s optics, in such situations the distance to
the object must either be reduced (get closer!) or a telephoto lens must be used (see Figure 16.7).
Figure 16.7 Supply and return lines from radiators in an open-plan office. The left image was taken from a
distance of 1 m: the measurement spot is filled and the temperature measurement is correct. The right image was taken from a distance of 3 m: the measurement spot is not completely filled and the measured
temperature values are incorrect (31.4 and 24.4°C (88.5 and 75.9°F) instead of 33.2 and 25.9°C (91.8 and
78.6°F)).
16.5 The changeables—image optimization and temperature measurement
16.5.1 Level and span
After choosing the appropriate temperature range, you can adjust the contrast and
brightness of the thermal image by changing the temperature intervals displayed. In
manual mode, the false colors available in the palette can be assigned to the temperatures of the object of interest. This process is often referred to as “thermal tuning.” In automatic mode, the camera selects the coldest and warmest apparent temperatures in the
image as the upper and lower limits of the temperature interval currently displayed.
A good or problem-specific scaling of the thermal image is an important step in the interpretation of the image, and is, unfortunately, often underestimated (see Figure 16.8).
#T810252; r. AD/43675/43696; en-US
47
Page 56

The secret to a good thermal image16
Figure 16.8 A thermal image in automatic mode (left) and in manual model (right). The adjusted tempera-
ture interval increases the contrast in the image and makes the faults clear.
16.5.2 Palettes and isotherms
Palettes represent intervals with the same apparent temperatures using different sets of
colors. In other words, they translate specific radiation intensities into colors that are specific to a particular palette. Frequently used palettes include the gray, iron, and rainbow
palettes (see Figure 16.9). Gray tones are particularly suited to resolving small geometric
details but are less suited to displaying small differences in temperature. The iron palette
is very intuitive and also easy to understand for those without much experience in thermography. It offers a good balance between geometric and thermal resolution. The rainbow palette is more colorful and alternates between light and dark colors. This results in
greater contrast, but this can lead to a noisy image for objects with different surfaces or
many temperatures.
Figure 16.9 Gray, iron, and rainbow palettes (left to right).
The isotherm is a measuring function that displays a given interval of the same apparent
temperature or radiation intensity in a color that is different from the palette. It allows you
to emphasize temperature patterns in the image (see Figure 16.10).
Figure 16.10 Foundation wall: connection between the old (left in image) and the new (right in image)
parts of the building. The isotherm highlights an area of air leakage.
16.5.3 Object parameters
As we have seen, the appearance of thermal images is dependent on the thermographer’s technique and choice of settings, and the look of saved radiometric images can
be altered by editing. However, it is also possible to change the settings that are relevant
for the calculation of temperatures. In practice, this means that the emissivity and reflected apparent temperature can be altered retrospectively. If you notice that these parameters have been set incorrectly or want to add more measurement spots, the
temperature measurement values will be calculated or recalculated according to the
changes (see Figure 16.11).
#T810252; r. AD/43675/43696; en-US
48
Page 57

The secret to a good thermal image16
Figure 16.11 Change in emissivity for a saved image. The maximum temperature is 65.0°C (149°F) for ε
= 0.95 in the left image and 77.3°C (171.1°F) for ε = 0.7 in the right image.
16.6 Taking images—practical tips
The following list includes some practical tips. However, note that this is not a comprehensive description of the thermal imaging procedure.
• Ensure that the camera is saving radiometric images.
• Choose an appropriate position from which to take images:
◦ Observe the radiative situation.
◦ Check that the object is clearly visible and displayed at an appropriate size and
position.
• If you change the emissivity, monitor the temperature range and make sure that it re-
mains appropriate.
• Focus.
• Use a tripod to minimize camera shake.
• Carry out thermal tuning.
• Take note of the object description, object size, actual distance, environmental condi-
tions, and operating conditions.
It is easier to edit the thermal image when it is saved or “frozen” (in “Preview”). Also,
since you don't have to do everything on site, you can leave dangerous zones immediately after taking the image. If possible, take a few more images than you need—including from different angles. This is preferable to taking too few! You can then choose the
best image afterwards, at leisure.
16.7 Conclusion
Taking a good thermal image does not require any magic tricks—solid craft and sound
work is all that is required. Many of the points mentioned may seem trivial and “old news,”
particularly to amateur photographers. Of course, the equipment plays a role easier to
ensure sharp images. Better, i.e. high-definition, cameras allow the fast localization of
even small anomalies, and without focusing capabilities it is always difficult to capture a
sharp image. However, high-end cameras are no guarantee of good images if used incorrectly. The basis for good, professional work is education and training in thermography, exchange of knowledge with other thermographers, and, of course, practical
experience.
#T810252; r. AD/43675/43696; en-US
49
Page 58

17
About calibration
17.1 Introduction
Calibration of a thermal camera is a prerequisite for temperature measurement. The calibration provides the relationship between the input signal and the physical quantity that
the user wants to measure. However, despite its widespread and frequent use, the term
“calibration” is often misunderstood and misused. Local and national differences as well
as translation-related issues create additional confusion.
Unclear terminology can lead to difficulties in communication and erroneous translations,
and subsequently to incorrect measurements due to misunderstandings and, in the worst
case, even to lawsuits.
17.2 Definition—what is calibration?
The International Bureau of Weights and Measures16defines calibration17in the following
way:
an operation that, under specified conditions, in a first step, establishes a relation between the quantity values with measurement uncertainties provided by measurement
standards and corresponding indications with associated measurement uncertainties
and, in a second step, uses this information to establish a relation for obtaining a measurement result from an indication.
The calibration itself may be expressed in different formats: this can be a statement, calibration function, calibration diagram
Often, the first step alone in the above definition is perceived and referred to as being
“calibration.” However, this is not (always) sufficient.
Considering the calibration procedure of a thermal camera, the first step establishes the
relation between emitted radiation (the quantity value) and the electrical output signal
(the indication). This first step of the calibration procedure consists of obtaining a homogeneous (or uniform) response when the camera is placed in front of an extended source
of radiation.
As we know the temperature of the reference source emitting the radiation, in the second
step the obtained output signal (the indication) can be related to the reference source’s
temperature (measurement result). The second step includes drift measurement and
compensation.
To be correct, calibration of a thermal camera is, strictly, not expressed through temperature. Thermal cameras are sensitive to infrared radiation: therefore, at first you obtain a
radiance correspondence, then a relationship between radiance and temperature. For
bolometer cameras used by non-R&D customers, radiance is not expressed: only the
temperature is provided.
18
, calibration curve19, or calibration table.
17.3 Camera calibration at FLIR Systems
Without calibration, an infrared camera would not be able to measure either radiance or
temperature. At FLIR Systems, the calibration of uncooled microbolometer cameras with
a measurement capability is carried out during both production and service. Cooled cameras with photon detectors are often calibrated by the user with special software. With
this type of software, in theory, common handheld uncooled thermal cameras could be
calibrated by the user too. However, as this software is not suitable for reporting
16.http://www.bipm.org/en/about-us/ [Retrieved 2017-01-31.]
17.http://jcgm.bipm.org/vim/en/2.39.html [Retrieved 2017-01-31.]
18.http://jcgm.bipm.org/vim/en/4.30.html [Retrieved 2017-01-31.]
19.http://jcgm.bipm.org/vim/en/4.31.html [Retrieved 2017-01-31.]
#T810252; r. AD/43675/43696; en-US
50
Page 59

About calibration17
purposes, most users do not have it. Non-measuring devices that are used for imaging
only do not need temperature calibration. Sometimes this is also reflected in camera terminology when talking about infrared or thermal imaging cameras compared with thermography cameras, where the latter are the measuring devices.
The calibration information, no matter if the calibration is done by FLIR Systems or the
user, is stored in calibration curves, which are expressed by mathematical functions. As
radiation intensity changes with both temperature and the distance between the object
and the camera, different curves are generated for different temperature ranges and exchangeable lenses.
17.4 The differences between a calibration
performed by a user and that performed directly
at FLIR Systems
First, the reference sources that FLIR Systems uses are themselves calibrated and
traceable. This means, at each FLIR Systems site performing calibration, that the sources are controlled by an independent national authority. The camera calibration certificate is confirmation of this. It is proof that not only has the calibration been performed by
FLIR Systems but that it has also been carried out using calibrated references. Some
users own or have access to accredited reference sources, but they are very few in
number.
Second, there is a technical difference. When performing a user calibration, the result is
often (but not always) not drift compensated. This means that the values do not take into
account a possible change in the camera’s output when the camera’s internal temperature varies. This yields a larger uncertainty. Drift compensation uses data obtained in climate-controlled chambers. All FLIR Systems cameras are drift compensated when they
are first delivered to the customer and when they are recalibrated by FLIR Systems service departments.
17.5 Calibration, verification and adjustment
A common misconception is to confuse calibration with verification or adjustment. Indeed, calibration is a prerequisite for verification, which provides confirmation that specified requirements are met. Verification provides objective evidence that a given item
fulfills specified requirements. To obtain the verification, defined temperatures (emitted
radiation) of calibrated and traceable reference sources are measured. The measurement results, including the deviation, are noted in a table. The verification certificate
states that these measurement results meet specified requirements. Sometimes, companies or organizations offer and market this verification certificate as a “calibration
certificate.”
Proper verification—and by extension calibration and/or recalibration—can only be
achieved when a validated protocol is respected. The process is more than placing the
camera in front of blackbodies and checking if the camera output (as temperature, for instance) corresponds to the original calibration table. It is often forgotten that a camera is
not sensitive to temperature but to radiation. Furthermore, a camera is an imaging system, not just a single sensor. Consequently, if the optical configuration allowing the camera to “collect” radiance is poor or misaligned, then the “verification” (or calibration or
recalibration) is worthless.
For instance, one has to ensure that the distance between the blackbody and the camera
as well as the diameter of the blackbody cavity are chosen so as to reduce stray radiation
and the size-of-source effect.
To summarize: a validated protocol must comply with the physical laws for radiance, and
not only those for temperature.
#T810252; r. AD/43675/43696; en-US
51
Page 60

About calibration17
Calibration is also a prerequisite for adjustment, which is the set of operations carried out
on a measuring system such that the system provides prescribed indications corresponding to given values of quantities to be measured, typically obtained from measurement standards. Simplified, adjustment is a manipulation that results in instruments that
measure correctly within their specifications. In everyday language, the term “calibration”
is widely used instead of “adjustment” for measuring devices.
17.6 Non-uniformity correction
When the thermal camera displays ”Calibrating…” it is adjusting for the deviation in response of each individual detector element (pixel). In thermography, this is called a ”nonuniformity correction” (NUC). It is an offset update, and the gain remains unchanged.
The European standard EN 16714-3, Non-destructive Testing—Thermographic Testing
—Part 3: Terms and Definitions, defines an NUC as “Image correction carried out by the
camera software to compensate for different sensitivities of detector elements and other
optical and geometrical disturbances.”
During the NUC (the offset update), a shutter (internal flag) is placed in the optical path,
and all the detector elements are exposed to the same amount of radiation originating
from the shutter. Therefore, in an ideal situation, they should all give the same output signal. However, each individual element has its own response, so the output is not uniform.
This deviation from the ideal result is calculated and used to mathematically perform an
image correction, which is essentially a correction of the displayed radiation signal.
Some cameras do not have an internal flag. In this case, the offset update must be performed manually using special software and an external uniform source of radiation.
An NUC is performed, for example, at start-up, when changing a measurement range, or
when the environment temperature changes. Some cameras also allow the user to trigger it manually. This is useful when you have to perform a critical measurement with as
little image disturbance as possible.
17.7 Thermal image adjustment (thermal
tuning)
Some people use the term “image calibration” when adjusting the thermal contrast and
brightness in the image to enhance specific details. During this operation, the temperature interval is set in such a way that all available colors are used to show only (or mainly)
the temperatures in the region of interest. The correct term for this manipulation is “thermal image adjustment” or “thermal tuning”, or, in some languages, “thermal image optimization.” You must be in manual mode to undertake this, otherwise the camera will set the
lower and upper limits of the displayed temperature interval automatically to the coldest
and hottest temperatures in the scene.
#T810252; r. AD/43675/43696; en-US
52
Page 61

18
History of infrared technology
Before the year 1800, the existence of the infrared portion of the electromagnetic spectrum wasn't even suspected. The original significance of the infrared spectrum, or simply
‘the infrared’ as it is often called, as a form of heat radiation is perhaps less obvious today than it was at the time of its discovery by Herschel in 1800.
Figure 18.1 Sir William Herschel (1738–1822)
The discovery was made accidentally during the search for a new optical material. Sir
William Herschel – Royal Astronomer to King George III of England, and already famous
for his discovery of the planet Uranus – was searching for an optical filter material to reduce the brightness of the sun’s image in telescopes during solar observations. While
testing different samples of colored glass which gave similar reductions in brightness he
was intrigued to find that some of the samples passed very little of the sun’s heat, while
others passed so much heat that he risked eye damage after only a few seconds’
observation.
Herschel was soon convinced of the necessity of setting up a systematic experiment,
with the objective of finding a single material that would give the desired reduction in
brightness as well as the maximum reduction in heat. He began the experiment by actually repeating Newton’s prism experiment, but looking for the heating effect rather than
the visual distribution of intensity in the spectrum. He first blackened the bulb of a sensitive mercury-in-glass thermometer with ink, and with this as his radiation detector he proceeded to test the heating effect of the various colors of the spectrum formed on the top
of a table by passing sunlight through a glass prism. Other thermometers, placed outside
the sun’s rays, served as controls.
As the blackened thermometer was moved slowly along the colors of the spectrum, the
temperature readings showed a steady increase from the violet end to the red end. This
was not entirely unexpected, since the Italian researcher, Landriani, in a similar experiment in 1777 had observed much the same effect. It was Herschel, however, who was
the first to recognize that there must be a point where the heating effect reaches a maximum, and that measurements confined to the visible portion of the spectrum failed to locate this point.
Figure 18.2 Marsilio Landriani (1746–1815)
Moving the thermometer into the dark region beyond the red end of the spectrum, Herschel confirmed that the heating continued to increase. The maximum point, when he
found it, lay well beyond the red end – in what is known today as the ‘infrared
wavelengths’.
#T810252; r. AD/43675/43696; en-US
53
Page 62

18
History of infrared technology
When Herschel revealed his discovery, he referred to this new portion of the electromagnetic spectrum as the ‘thermometrical spectrum’. The radiation itself he sometimes referred to as ‘dark heat’, or simply ‘the invisible rays’. Ironically, and contrary to popular
opinion, it wasn't Herschel who originated the term ‘infrared’. The word only began to appear in print around 75 years later, and it is still unclear who should receive credit as the
originator.
Herschel’s use of glass in the prism of his original experiment led to some early controversies with his contemporaries about the actual existence of the infrared wavelengths.
Different investigators, in attempting to confirm his work, used various types of glass indiscriminately, having different transparencies in the infrared. Through his later experiments, Herschel was aware of the limited transparency of glass to the newly-discovered
thermal radiation, and he was forced to conclude that optics for the infrared would probably be doomed to the use of reflective elements exclusively (i.e. plane and curved mirrors). Fortunately, this proved to be true only until 1830, when the Italian investigator,
Melloni, made his great discovery that naturally occurring rock salt (NaCl) – which was
available in large enough natural crystals to be made into lenses and prisms – is remarkably transparent to the infrared. The result was that rock salt became the principal infrared optical material, and remained so for the next hundred years, until the art of synthetic
crystal growing was mastered in the 1930’s.
Figure 18.3 Macedonio Melloni (1798–1854)
Thermometers, as radiation detectors, remained unchallenged until 1829, the year Nobili
invented the thermocouple. (Herschel’s own thermometer could be read to 0.2 °C
(0.036 °F), and later models were able to be read to 0.05 °C (0.09 °F)). Then a breakthrough occurred; Melloni connected a number of thermocouples in series to form the
first thermopile. The new device was at least 40 times as sensitive as the best thermometer of the day for detecting heat radiation – capable of detecting the heat from a person
standing three meters away.
The first so-called ‘heat-picture’ became possible in 1840, the result of work by Sir John
Herschel, son of the discoverer of the infrared and a famous astronomer in his own right.
Based upon the differential evaporation of a thin film of oil when exposed to a heat pattern focused upon it, the thermal image could be seen by reflected light where the interference effects of the oil film made the image visible to the eye. Sir John also managed
to obtain a primitive record of the thermal image on paper, which he called a
‘thermograph’.
#T810252; r. AD/43675/43696; en-US
54
Page 63

18
History of infrared technology
Figure 18.4 Samuel P. Langley (1834–1906)
The improvement of infrared-detector sensitivity progressed slowly. Another major breakthrough, made by Langley in 1880, was the invention of the bolometer. This consisted of
a thin blackened strip of platinum connected in one arm of a Wheatstone bridge circuit
upon which the infrared radiation was focused and to which a sensitive galvanometer responded. This instrument is said to have been able to detect the heat from a cow at a
distance of 400 meters.
An English scientist, Sir James Dewar, first introduced the use of liquefied gases as cooling agents (such as liquid nitrogen with a temperature of –196°C (–320.8°F)) in low temperature research. In 1892 he invented a unique vacuum insulating container in which it
is possible to store liquefied gases for entire days. The common ‘thermos bottle’, used
for storing hot and cold drinks, is based upon his invention.
Between the years 1900 and 1920, the inventors of the world ‘discovered’ the infrared.
Many patents were issued for devices to detect personnel, artillery, aircraft, ships – and
even icebergs. The first operating systems, in the modern sense, began to be developed
during the 1914–18 war, when both sides had research programs devoted to the military
exploitation of the infrared. These programs included experimental systems for enemy
intrusion/detection, remote temperature sensing, secure communications, and ‘flying torpedo’ guidance. An infrared search system tested during this period was able to detect
an approaching airplane at a distance of 1.5 km (0.94 miles), or a person more than 300
meters (984 ft.) away.
The most sensitive systems up to this time were all based upon variations of the bolometer idea, but the period between the two wars saw the development of two revolutionary
new infrared detectors: the image converter and the photon detector. At first, the image
converter received the greatest attention by the military, because it enabled an observer
for the first time in history to literally ‘see in the dark’. However, the sensitivity of the image converter was limited to the near infrared wavelengths, and the most interesting military targets (i.e. enemy soldiers) had to be illuminated by infrared search beams. Since
this involved the risk of giving away the observer’s position to a similarly-equipped enemy
observer, it is understandable that military interest in the image converter eventually
faded.
The tactical military disadvantages of so-called 'active’ (i.e. search beam-equipped) thermal imaging systems provided impetus following the 1939–45 war for extensive secret
military infrared-research programs into the possibilities of developing ‘passive’ (no
search beam) systems around the extremely sensitive photon detector. During this period, military secrecy regulations completely prevented disclosure of the status of infraredimaging technology. This secrecy only began to be lifted in the middle of the 1950’s, and
from that time adequate thermal-imaging devices finally began to be available to civilian
science and industry.
#T810252; r. AD/43675/43696; en-US
55
Page 64

19
Theory of thermography
19.1 Introduction
The subjects of infrared radiation and the related technique of thermography are still new
to many who will use an infrared camera. In this section the theory behind thermography
will be given.
19.2 The electromagnetic spectrum
The electromagnetic spectrum is divided arbitrarily into a number of wavelength regions,
called bands, distinguished by the methods used to produce and detect the radiation.
There is no fundamental difference between radiation in the different bands of the electromagnetic spectrum. They are all governed by the same laws and the only differences
are those due to differences in wavelength.
Figure 19.1 The electromagnetic spectrum. 1: X-ray; 2: UV; 3: Visible; 4: IR; 5: Microwaves; 6:
Radiowaves.
Thermography makes use of the infrared spectral band. At the short-wavelength end the
boundary lies at the limit of visual perception, in the deep red. At the long-wavelength
end it merges with the microwave radio wavelengths, in the millimeter range.
The infrared band is often further subdivided into four smaller bands, the boundaries of
which are also arbitrarily chosen. They include: the near infrared (0.75–3 μm), the middle
infrared (3–6 μm), the far infrared (6–15 μm) and the extreme infrared (15–100 μm).
Although the wavelengths are given in μm (micrometers), other units are often still used
to measure wavelength in this spectral region, e.g. nanometer (nm) and Ångström (Å).
The relationships between the different wavelength measurements is:
19.3 Blackbody radiation
A blackbody is defined as an object which absorbs all radiation that impinges on it at any
wavelength. The apparent misnomer black relating to an object emitting radiation is explained by Kirchhoff’s Law (after Gustav Robert Kirchhoff, 1824–1887), which states that
a body capable of absorbing all radiation at any wavelength is equally capable in the
emission of radiation.
#T810252; r. AD/43675/43696; en-US
56
Page 65

19
Theory of thermography
Figure 19.2 Gustav Robert Kirchhoff (1824–1887)
The construction of a blackbody source is, in principle, very simple. The radiation characteristics of an aperture in an isotherm cavity made of an opaque absorbing material represents almost exactly the properties of a blackbody. A practical application of the
principle to the construction of a perfect absorber of radiation consists of a box that is
light tight except for an aperture in one of the sides. Any radiation which then enters the
hole is scattered and absorbed by repeated reflections so only an infinitesimal fraction
can possibly escape. The blackness which is obtained at the aperture is nearly equal to
a blackbody and almost perfect for all wavelengths.
By providing such an isothermal cavity with a suitable heater it becomes what is termed
a cavity radiator. An isothermal cavity heated to a uniform temperature generates blackbody radiation, the characteristics of which are determined solely by the temperature of
the cavity. Such cavity radiators are commonly used as sources of radiation in temperature reference standards in the laboratory for calibrating thermographic instruments,
such as a FLIR Systems camera for example.
If the temperature of blackbody radiation increases to more than 525°C (977°F), the
source begins to be visible so that it appears to the eye no longer black. This is the incipient red heat temperature of the radiator, which then becomes orange or yellow as the
temperature increases further. In fact, the definition of the so-called color temperature of
an object is the temperature to which a blackbody would have to be heated to have the
same appearance.
Now consider three expressions that describe the radiation emitted from a blackbody.
19.3.1 Planck’s law
Figure 19.3 Max Planck (1858–1947)
Max Planck (1858–1947) was able to describe the spectral distribution of the radiation
from a blackbody by means of the following formula:
#T810252; r. AD/43675/43696; en-US
57
Page 66

19
Theory of thermography
where:
W
λb
c
h Planck’s constant = 6.6 × 10
k
T Absolute temperature (K) of a blackbody.
λ Wavelength (μm).
Blackbody spectral radiant emittance at wavelength λ.
Velocity of light = 3 × 10
Boltzmann’s constant = 1.4 × 10
8
m/s
-34
Joule sec.
-23
Joule/K.
Note The factor 10-6is used since spectral emittance in the curves is expressed in
2
Watt/m
, μm.
Planck’s formula, when plotted graphically for various temperatures, produces a family of
curves. Following any particular Planck curve, the spectral emittance is zero at λ = 0,
then increases rapidly to a maximum at a wavelength λ
and after passing it ap-
max
proaches zero again at very long wavelengths. The higher the temperature, the shorter
the wavelength at which maximum occurs.
Figure 19.4 Blackbody spectral radiant emittance according to Planck’s law, plotted for various absolute
temperatures. 1: Spectral radiant emittance (W/cm
2
× 103(μm)); 2: Wavelength (μm)
19.3.2 Wien’s displacement law
By differentiating Planck’s formula with respect to λ, and finding the maximum, we have:
This is Wien’s formula (after Wilhelm Wien, 1864–1928), which expresses mathematically the common observation that colors vary from red to orange or yellow as the temperature of a thermal radiator increases. The wavelength of the color is the same as the
wavelength calculated for λ
. A good approximation of the value of λ
max
for a given
max
blackbody temperature is obtained by applying the rule-of-thumb 3 000/T μm. Thus, a
very hot star such as Sirius (11 000 K), emitting bluish-white light, radiates with the peak
of spectral radiant emittance occurring within the invisible ultraviolet spectrum, at wavelength 0.27 μm.
#T810252; r. AD/43675/43696; en-US
58
Page 67

19
Theory of thermography
Figure 19.5 Wilhelm Wien (1864–1928)
The sun (approx. 6 000 K) emits yellow light, peaking at about 0.5 μm in the middle of
the visible light spectrum.
At room temperature (300 K) the peak of radiant emittance lies at 9.7 μm, in the far infrared, while at the temperature of liquid nitrogen (77 K) the maximum of the almost insignificant amount of radiant emittance occurs at 38 μm, in the extreme infrared wavelengths.
Figure 19.6 Planckian curves plotted on semi-log scales from 100 K to 1000 K. The dotted line represents
the locus of maximum radiant emittance at each temperature as described by Wien's displacement law. 1:
Spectral radiant emittance (W/cm
2
(μm)); 2: Wavelength (μm).
19.3.3 Stefan-Boltzmann's law
By integrating Planck’s formula from λ = 0 to λ = ∞, we obtain the total radiant emittance
(W
) of a blackbody:
b
This is the Stefan-Boltzmann formula (after Josef Stefan, 1835–1893, and Ludwig Boltz-
mann, 1844–1906), which states that the total emissive power of a blackbody is proportional to the fourth power of its absolute temperature. Graphically, W
represents the
b
area below the Planck curve for a particular temperature. It can be shown that the radiant
emittance in the interval λ = 0 to λ
is only 25% of the total, which represents about the
max
amount of the sun’s radiation which lies inside the visible light spectrum.
#T810252; r. AD/43675/43696; en-US
59
Page 68

19
Theory of thermography
Figure 19.7 Josef Stefan (1835–1893), and Ludwig Boltzmann (1844–1906)
Using the Stefan-Boltzmann formula to calculate the power radiated by the human body,
at a temperature of 300 K and an external surface area of approx. 2 m
2
, we obtain 1 kW.
This power loss could not be sustained if it were not for the compensating absorption of
radiation from surrounding surfaces, at room temperatures which do not vary too drastically from the temperature of the body – or, of course, the addition of clothing.
19.3.4 Non-blackbody emitters
So far, only blackbody radiators and blackbody radiation have been discussed. However,
real objects almost never comply with these laws over an extended wavelength region –
although they may approach the blackbody behavior in certain spectral intervals. For example, a certain type of white paint may appear perfectly white in the visible light spectrum, but becomes distinctly gray at about 2 μm, and beyond 3 μm it is almost black.
There are three processes which can occur that prevent a real object from acting like a
blackbody: a fraction of the incident radiation α may be absorbed, a fraction ρ may be reflected, and a fraction τ may be transmitted. Since all of these factors are more or less
wavelength dependent, the subscript λ is used to imply the spectral dependence of their
definitions. Thus:
• The spectral absorptance α
= the ratio of the spectral radiant power absorbed by an
λ
object to that incident upon it.
• The spectral reflectance ρ
= the ratio of the spectral radiant power reflected by an ob-
λ
ject to that incident upon it.
• The spectral transmittance τ
= the ratio of the spectral radiant power transmitted
λ
through an object to that incident upon it.
The sum of these three factors must always add up to the whole at any wavelength, so
we have the relation:
For opaque materials τλ= 0 and the relation simplifies to:
Another factor, called the emissivity, is required to describe the fraction ε of the radiant
emittance of a blackbody produced by an object at a specific temperature. Thus, we
have the definition:
The spectral emissivity ε
= the ratio of the spectral radiant power from an object to that
λ
from a blackbody at the same temperature and wavelength.
Expressed mathematically, this can be written as the ratio of the spectral emittance of
the object to that of a blackbody as follows:
Generally speaking, there are three types of radiation source, distinguished by the ways
in which the spectral emittance of each varies with wavelength.
• A blackbody, for which ε
• A graybody, for which ε
#T810252; r. AD/43675/43696; en-US
= ε = 1
λ
= ε = constant less than 1
λ
60
Page 69

19
Theory of thermography
• A selective radiator, for which ε varies with wavelength
According to Kirchhoff’s law, for any material the spectral emissivity and spectral absorp-
tance of a body are equal at any specified temperature and wavelength. That is:
From this we obtain, for an opaque material (since αλ+ ρλ= 1):
For highly polished materials ελapproaches zero, so that for a perfectly reflecting material (i.e. a perfect mirror) we have:
For a graybody radiator, the Stefan-Boltzmann formula becomes:
This states that the total emissive power of a graybody is the same as a blackbody at the
same temperature reduced in proportion to the value of ε from the graybody.
Figure 19.8 Spectral radiant emittance of three types of radiators. 1: Spectral radiant emittance; 2: Wavelength; 3: Blackbody; 4: Selective radiator; 5: Graybody.
Figure 19.9 Spectral emissivity of three types of radiators. 1: Spectral emissivity; 2: Wavelength; 3: Blackbody; 4: Graybody; 5: Selective radiator.
#T810252; r. AD/43675/43696; en-US
61
Page 70

19
Theory of thermography
19.4 Infrared semi-transparent materials
Consider now a non-metallic, semi-transparent body – let us say, in the form of a thick flat
plate of plastic material. When the plate is heated, radiation generated within its volume
must work its way toward the surfaces through the material in which it is partially absorbed. Moreover, when it arrives at the surface, some of it is reflected back into the interior. The back-reflected radiation is again partially absorbed, but some of it arrives at the
other surface, through which most of it escapes; part of it is reflected back again.
Although the progressive reflections become weaker and weaker they must all be added
up when the total emittance of the plate is sought. When the resulting geometrical series
is summed, the effective emissivity of a semi-transparent plate is obtained as:
When the plate becomes opaque this formula is reduced to the single formula:
This last relation is a particularly convenient one, because it is often easier to measure
reflectance than to measure emissivity directly.
#T810252; r. AD/43675/43696; en-US
62
Page 71

20
The measurement formula
As already mentioned, when viewing an object, the camera receives radiation not only
from the object itself. It also collects radiation from the surroundings reflected via the object surface. Both these radiation contributions become attenuated to some extent by the
atmosphere in the measurement path. To this comes a third radiation contribution from
the atmosphere itself.
This description of the measurement situation, as illustrated in the figure below, is so far
a fairly true description of the real conditions. What has been neglected could for instance be sun light scattering in the atmosphere or stray radiation from intense radiation
sources outside the field of view. Such disturbances are difficult to quantify, however, in
most cases they are fortunately small enough to be neglected. In case they are not negligible, the measurement configuration is likely to be such that the risk for disturbance is
obvious, at least to a trained operator. It is then his responsibility to modify the measurement situation to avoid the disturbance e.g. by changing the viewing direction, shielding
off intense radiation sources etc.
Accepting the description above, we can use the figure below to derive a formula for the
calculation of the object temperature from the calibrated camera output.
Figure 20.1 A schematic representation of the general thermographic measurement situation.1: Surroundings; 2: Object; 3: Atmosphere; 4: Camera
Assume that the received radiation power W from a blackbody source of temperature
T
on short distance generates a camera output signal U
source
the power input (power linear camera). We can then write (Equation 1):
or, with simplified notation:
where C is a constant.
Should the source be a graybody with emittance ε, the received radiation would conse-
quently be εW
We are now ready to write the three collected radiation power terms:
1. Emission from the object = ετW
transmittance of the atmosphere. The object temperature is T
source
.
, where ε is the emittance of the object and τ is the
obj
that is proportional to
source
.
obj
#T810252; r. AD/43675/43696; en-US
63
Page 72

20
The measurement formula
2. Reflected emission from ambient sources = (1 – ε)τW
tance of the object. The ambient sources have the temperature T
It has here been assumed that the temperature T
, where (1 – ε) is the reflec-
refl
.
refl
is the same for all emitting surfa-
refl
ces within the halfsphere seen from a point on the object surface. This is of course
sometimes a simplification of the true situation. It is, however, a necessary simplification in order to derive a workable formula, and T
can – at least theoretically – be giv-
refl
en a value that represents an efficient temperature of a complex surrounding.
Note also that we have assumed that the emittance for the surroundings = 1. This is
correct in accordance with Kirchhoff’s law: All radiation impinging on the surrounding
surfaces will eventually be absorbed by the same surfaces. Thus the emittance = 1.
(Note though that the latest discussion requires the complete sphere around the object to be considered.)
3. Emission from the atmosphere = (1 – τ)τW
mosphere. The temperature of the atmosphere is T
, where (1 – τ) is the emittance of the at-
atm
atm
.
The total received radiation power can now be written (Equation 2):
We multiply each term by the constant C of Equation 1 and replace the CW products by
the corresponding U according to the same equation, and get (Equation 3):
Solve Equation 3 for U
(Equation 4):
obj
This is the general measurement formula used in all the FLIR Systems thermographic
equipment. The voltages of the formula are:
Table 20.1 Voltages
U
obj
U
tot
U
refl
U
atm
Calculated camera output voltage for a blackbody of temperature
i.e. a voltage that can be directly converted into true requested
T
obj
object temperature.
Measured camera output voltage for the actual case.
Theoretical camera output voltage for a blackbody of temperature
T
according to the calibration.
refl
Theoretical camera output voltage for a blackbody of temperature
according to the calibration.
T
atm
The operator has to supply a number of parameter values for the calculation:
• the object emittance ε,
• the relative humidity,
• T
atm
• object distance (D
obj
)
• the (effective) temperature of the object surroundings, or the reflected ambient tem-
perature T
• the temperature of the atmosphere T
refl
, and
atm
This task could sometimes be a heavy burden for the operator since there are normally
no easy ways to find accurate values of emittance and atmospheric transmittance for the
actual case. The two temperatures are normally less of a problem provided the surroundings do not contain large and intense radiation sources.
A natural question in this connection is: How important is it to know the right values of
these parameters? It could though be of interest to get a feeling for this problem already
here by looking into some different measurement cases and compare the relative
#T810252; r. AD/43675/43696; en-US
64
Page 73

20
The measurement formula
magnitudes of the three radiation terms. This will give indications about when it is important to use correct values of which parameters.
The figures below illustrates the relative magnitudes of the three radiation contributions
for three different object temperatures, two emittances, and two spectral ranges: SW and
LW. Remaining parameters have the following fixed values:
• τ = 0.88
• T
= +20°C (+68°F)
refl
• T
= +20°C (+68°F)
atm
It is obvious that measurement of low object temperatures are more critical than measuring high temperatures since the ‘disturbing’ radiation sources are relatively much stronger in the first case. Should also the object emittance be low, the situation would be still
more difficult.
We have finally to answer a question about the importance of being allowed to use the
calibration curve above the highest calibration point, what we call extrapolation. Imagine
that we in a certain case measure U
= 4.5 volts. The highest calibration point for the
tot
camera was in the order of 4.1 volts, a value unknown to the operator. Thus, even if the
object happened to be a blackbody, i.e. U
obj
= U
, we are actually performing extrapola-
tot
tion of the calibration curve when converting 4.5 volts into temperature.
Let us now assume that the object is not black, it has an emittance of 0.75, and the trans-
mittance is 0.92. We also assume that the two second terms of Equation 4 amount to 0.5
volts together. Computation of U
by means of Equation 4 then results in U
obj
obj
= 4.5 /
0.75 / 0.92 – 0.5 = 6.0. This is a rather extreme extrapolation, particularly when considering that the video amplifier might limit the output to 5 volts! Note, though, that the application of the calibration curve is a theoretical procedure where no electronic or other
limitations exist. We trust that if there had been no signal limitations in the camera, and if
it had been calibrated far beyond 5 volts, the resulting curve would have been very much
the same as our real curve extrapolated beyond 4.1 volts, provided the calibration algorithm is based on radiation physics, like the FLIR Systems algorithm. Of course there
must be a limit to such extrapolations.
Figure 20.2 Relative magnitudes of radiation sources under varying measurement conditions (SW camera). 1: Object temperature; 2: Emittance; Obj: Object radiation; Refl: Reflected radiation; Atm: atmosphere radiation. Fixed parameters: τ = 0.88; T
#T810252; r. AD/43675/43696; en-US
= 20°C (+68°F); T
refl
= 20°C (+68°F).
atm
65
Page 74

20
The measurement formula
Figure 20.3 Relative magnitudes of radiation sources under varying measurement conditions (LW cam-
era). 1: Object temperature; 2: Emittance; Obj: Object radiation; Refl: Reflected radiation; Atm: atmosphere radiation. Fixed parameters: τ = 0.88; T
= 20°C (+68°F); T
refl
= 20°C (+68°F).
atm
#T810252; r. AD/43675/43696; en-US
66
Page 75

21
Emissivity tables
This section presents a compilation of emissivity data from the infrared literature and
measurements made by FLIR Systems.
21.1 References
1. Mikaél A. Bramson: Infrared Radiation, A Handbook for Applications, Plenum press,
N.Y.
2. William L. Wolfe, George J. Zissis: The Infrared Handbook, Office of Naval Research,
Department of Navy, Washington, D.C.
3. Madding, R. P.: Thermographic Instruments and systems. Madison, Wisconsin: Uni-
versity of Wisconsin – Extension, Department of Engineering and Applied Science.
4. William L. Wolfe: Handbook of Military Infrared Technology, Office of Naval Research,
Department of Navy, Washington, D.C.
5. Jones, Smith, Probert: External thermography of buildings..., Proc. of the Society of
Photo-Optical Instrumentation Engineers, vol.110, Industrial and Civil Applications of
Infrared Technology, June 1977 London.
6. Paljak, Pettersson: Thermography of Buildings, Swedish Building Research Institute,
Stockholm 1972.
7. Vlcek, J: Determination of emissivity with imaging radiometers and some emissivities
at λ = 5 µm. Photogrammetric Engineering and Remote Sensing.
8. Kern: Evaluation of infrared emission of clouds and ground as measured by weather
satellites, Defence Documentation Center, AD 617 417.
9. Öhman, Claes: Emittansmätningar med AGEMA E-Box. Teknisk rapport, AGEMA
1999. (Emittance measurements using AGEMA E-Box. Technical report, AGEMA
1999.)
10. Matteï, S., Tang-Kwor, E: Emissivity measurements for Nextel Velvet coating 811-21
between –36°C AND 82°C.
11. Lohrengel & Todtenhaupt (1996)
12. ITC Technical publication 32.
13. ITC Technical publication 29.
14. Schuster, Norbert and Kolobrodov, Valentin G. Infrarotthermographie. Berlin: Wiley-
VCH, 2000.
Note The emissivity values in the table below are recorded using a shortwave (SW)
camera. The values should be regarded as recommendations only and used with
caution.
21.2 Tables
Table 21.1 T: Total spectrum; SW: 2–5 µm; LW: 8–14 µm, LLW: 6.5–20 µm; 1: Material; 2: Specification;
3:Temperature in °C; 4: Spectrum; 5: Emissivity: 6:Reference
1 2 3 4 5 6
3M type 35 Vinyl electrical
3M type 88 Black vinyl electri-
3M type 88 Black vinyl electri-
3M type Super 33
+
Aluminum anodized sheet 100 T 0.55 2
Aluminum anodized, black,
Aluminum anodized, black,
#T810252; r. AD/43675/43696; en-US
tape (several
colors)
cal tape
cal tape
Black vinyl electrical tape
dull
dull
< 80 LW ≈ 0.96 13
< 105 LW ≈ 0.96 13
< 105 MW < 0.96 13
< 80 LW ≈ 0.96 13
70
70 LW 0.95 9
SW
0.67 9
67
Page 76

Emissivity tables21
Table 21.1 T: Total spectrum; SW: 2–5 µm; LW: 8–14 µm, LLW: 6.5–20 µm; 1: Material; 2: Specification;
3:Temperature in °C; 4: Spectrum; 5: Emissivity: 6:Reference (continued)
1 2 3 4 5 6
Aluminum anodized, light
70
SW
gray, dull
Aluminum anodized, light
70 LW 0.97 9
gray, dull
Aluminum as received, plate 100 T 0.09 4
Aluminum as received,
100 T 0.09 2
sheet
Aluminum cast, blast
70
SW
cleaned
Aluminum cast, blast
70 LW 0.46 9
cleaned
Aluminum dipped in HNO
100 T 0.05 4
,
3
plate
Aluminum foil
Aluminum foil
27 10 µm 0.04 3
27 3 µm 0.09 3
Aluminum oxidized, strongly 50–500 T 0.2–0.3 1
Aluminum polished 50–100 T 0.04–0.06 1
Aluminum polished plate 100 T 0.05 4
Aluminum polished, sheet 100 T 0.05 2
Aluminum rough surface
20–50 T 0.06–0.07 1
Aluminum roughened 27 10 µm 0.18 3
Aluminum roughened 27 3 µm 0.28 3
Aluminum sheet, 4 samples
70
SW
differently
scratched
Aluminum sheet, 4 samples
70 LW 0.03–0.06 9
differently
scratched
Aluminum
vacuum
20 T 0.04 2
deposited
Aluminum weathered,
17
SW
heavily
Aluminum bronze 20 T 0.60 1
Aluminum
powder T 0.28 1
hydroxide
Aluminum oxide activated, powder T 0.46 1
Aluminum oxide pure, powder
T 0.16 1
(alumina)
Asbestos board 20 T 0.96 1
Asbestos fabric T 0.78 1
Asbestos floor tile
Asbestos
paper 40–400 T 0.93–0.95 1
35
SW
Asbestos powder T 0.40–0.60 1
Asbestos slate 20 T 0.96 1
Asphalt paving 4 LLW 0.967 8
Brass dull, tarnished 20–350 T 0.22 1
Brass oxidized 100 T 0.61 2
Brass oxidized 70
SW
0.61 9
0.47 9
0.05–0.08 9
0.83–0.94 5
0.94 7
0.04–0.09 9
#T810252; r. AD/43675/43696; en-US
68
Page 77

Emissivity tables21
Table 21.1 T: Total spectrum; SW: 2–5 µm; LW: 8–14 µm, LLW: 6.5–20 µm; 1: Material; 2: Specification;
3:Temperature in °C; 4: Spectrum; 5: Emissivity: 6:Reference (continued)
1 2 3 4 5 6
Brass oxidized 70 LW 0.03–0.07 9
Brass oxidized at 600°C
Brass polished 200 T 0.03 1
Brass polished, highly 100 T 0.03 2
Brass rubbed with 80-
grit emery
Brass sheet, rolled 20 T 0.06 1
Brass sheet, worked
with emery
Brick alumina 17
Brick
common 17
Brick Dinas silica,
glazed, rough
Brick Dinas silica,
refractory
Brick Dinas silica, un-
glazed, rough
Brick firebrick
Brick fireclay
Brick fireclay
Brick fireclay
Brick
Brick
masonry 35
masonry,
plastered
Brick red, common 20 T 0.93 2
Brick red, rough 20 T 0.88–0.93 1
Brick refractory,
corundum
Brick refractory,
magnesite
Brick refractory,
strongly radiating
Brick refractory, weakly
radiating
Brick
silica, 95% SiO
Brick sillimanite, 33%
SiO
, 64% Al2O
2
Brick waterproof
Bronze phosphor bronze 70
Bronze phosphor bronze 70 LW 0.06 9
Bronze polished 50 T 0.1 1
Bronze porous, rough 50–150 T 0.55 1
Bronze powder T 0.76–0.80 1
Carbon candle soot 20 T 0.95 2
Carbon charcoal powder T 0.96 1
Carbon
graphite powder T 0.97 1
200–600 T 0.59–0.61 1
20 T 0.20 2
20 T 0.2 1
SW
SW
0.68 5
0.86–0.81 5
1100 T 0.85 1
1000 T 0.66 1
1000 T 0.80 1
17
SW
0.68 5
1000 T 0.75 1
1200 T 0.59 1
20 T 0.85 1
SW
0.94 7
20 T 0.94 1
1000 T 0.46 1
1000–1300 T 0.38 1
500–1000 T 0.8–0.9 1
500–1000 T 0.65–0.75 1
1230 T 0.66 1
2
1500 T 0.29 1
3
17
SW
SW
0.87 5
0.08 9
#T810252; r. AD/43675/43696; en-US
69
Page 78

Emissivity tables21
Table 21.1 T: Total spectrum; SW: 2–5 µm; LW: 8–14 µm, LLW: 6.5–20 µm; 1: Material; 2: Specification;
3:Temperature in °C; 4: Spectrum; 5: Emissivity: 6:Reference (continued)
1 2 3 4 5 6
Carbon graphite, filed
Carbon
Chipboard untreated 20 SW
Chromium polished 50 T 0.10 1
Chromium
Clay fired
Cloth
Concrete
Concrete dry 36 SW
Concrete
Concrete
Copper commercial,
Copper
Copper electrolytic,
Copper
Copper
Copper
Copper oxidized, black 27 T 0.78 4
Copper oxidized, heavily 20 T 0.78 2
Copper polished 50–100 T 0.02 1
Copper polished 100 T 0.03 2
Copper polished,
Copper
Copper pure, carefully
Copper
Copper dioxide
Copper oxide
Ebonite T 0.89 1
Emery
Enamel 20 T 0.9 1
Enamel lacquer 20 T 0.85–0.95 1
Fiber board hard, untreated 20
Fiber board masonite 70
Fiber board masonite 70 LW 0.88 9
Fiber board particle board 70
Fiber board particle board 70 LW 0.89 9
Fiber board porous, untreated 20
surface
lampblack 20–400 T 0.95–0.97 1
polished 500–1000 T 0.28–0.38 1
black 20 T 0.98 1
rough 17
walkway
burnished
electrolytic, care-
fully polished
polished
molten 1100–1300 T 0.13–0.15 1
oxidized 50 T 0.6–0.7 1
oxidized to
blackness
commercial
polished,
mechanical
prepared surface
scraped 27 T 0.07 4
powder T 0.84 1
red, powder T 0.70 1
coarse 80 T 0.85 1
20 T 0.98 2
0.90 6
70 T 0.91 1
20 T 0.92 2
0.95 7
SW
5
20 T 0.07 1
80 T 0.018 1
–34 T 0.006 4
27 T 0.03 4
22 T 0.015 4
22 T 0.008 4
LLW 0.974 8
T 0.88 1
SW
SW
SW
SW
0.97 5
0.85 6
0.75 9
0.77 9
0.85 6
#T810252; r. AD/43675/43696; en-US
70
Page 79

Emissivity tables21
Table 21.1 T: Total spectrum; SW: 2–5 µm; LW: 8–14 µm, LLW: 6.5–20 µm; 1: Material; 2: Specification;
3:Temperature in °C; 4: Spectrum; 5: Emissivity: 6:Reference (continued)
1 2 3 4 5 6
Glass pane (float
glass)
Gold
Gold polished, carefully
Gold
Granite polished 20 LLW 0.849 8
Granite
Granite rough, 4 different
Granite rough, 4 different
Gypsum
Ice: See Water
Iron and steel cold rolled 70
Iron and steel cold rolled 70 LW 0.09 9
Iron and steel covered with red
Iron and steel electrolytic 100 T 0.05 4
Iron and steel electrolytic 22 T 0.05 4
Iron and steel electrolytic 260 T 0.07 4
Iron and steel electrolytic, care-
Iron and steel freshly worked
Iron and steel ground sheet 950–1100 T 0.55–0.61 1
Iron and steel heavily rusted
Iron and steel hot rolled 130 T 0.60 1
Iron and steel hot rolled 20 T 0.77 1
Iron and steel oxidized 100 T 0.74 4
Iron and steel oxidized 100 T 0.74 1
Iron and steel oxidized 1227 T 0.89 4
Iron and steel oxidized 125–525 T 0.78–0.82 1
Iron and steel oxidized 200 T 0.79 2
Iron and steel oxidized 200–600 T 0.80 1
Iron and steel oxidized strongly 50 T 0.88 1
Iron and steel oxidized strongly 500 T 0.98 1
Iron and steel polished 100 T 0.07 2
Iron and steel polished 400–1000 T 0.14–0.38 1
Iron and steel polished sheet 750–1050 T 0.52–0.56 1
Iron and steel rolled sheet 50 T 0.56 1
Iron and steel rolled, freshly
Iron and steel rough, plane
Iron and steel rusted red, sheet 22 T 0.69 4
Iron and steel rusted, heavily 17
non-coated 20 LW 0.97 14
polished 130 T 0.018 1
200–600 T 0.02–0.03 1
polished, highly 100 T 0.02 2
rough 21 LLW 0.879 8
samples
samples
rust
fully polished
with emery
sheet
surface
70
70 LW 0.77–0.87 9
20 T 0.8–0.9 1
20 T 0.61–0.85 1
175–225 T 0.05–0.06 1
20 T 0.24 1
20 T 0.69 2
20 T 0.24 1
50 T 0.95–0.98 1
SW
SW
SW
0.95–0.97 9
0.20 9
0.96 5
#T810252; r. AD/43675/43696; en-US
71
Page 80

Emissivity tables21
Table 21.1 T: Total spectrum; SW: 2–5 µm; LW: 8–14 µm, LLW: 6.5–20 µm; 1: Material; 2: Specification;
3:Temperature in °C; 4: Spectrum; 5: Emissivity: 6:Reference (continued)
1 2 3 4 5 6
Iron and steel rusty, red 20 T 0.69 1
Iron and steel shiny oxide layer,
Iron and steel shiny, etched 150 T 0.16 1
Iron and steel wrought, carefully
Iron galvanized heavily oxidized 70
Iron galvanized heavily oxidized 70 LW 0.85 9
Iron galvanized sheet 92 T 0.07 4
Iron galvanized sheet, burnished 30 T 0.23 1
Iron galvanized sheet, oxidized 20 T 0.28 1
Iron tinned sheet 24 T 0.064 4
Iron, cast casting 50 T 0.81 1
Iron, cast ingots 1000 T 0.95 1
Iron, cast liquid 1300 T 0.28 1
Iron, cast machined 800–1000 T 0.60–0.70 1
Iron, cast oxidized 100 T 0.64 2
Iron, cast oxidized 260 T 0.66 4
Iron, cast oxidized 38 T 0.63 4
Iron, cast oxidized 538 T 0.76 4
Iron, cast oxidized at 600°C
Iron, cast polished 200 T 0.21 1
Iron, cast polished 38 T 0.21 4
Iron, cast polished 40 T 0.21 2
Iron, cast unworked 900–1100 T 0.87–0.95 1
Krylon Ultra-flat
black 1602
Krylon Ultra-flat
black 1602
Lacquer 3 colors sprayed
Lacquer 3 colors sprayed
Lacquer Aluminum on
Lacquer bakelite 80 T 0.83 1
Lacquer black, dull 40–100 T 0.96–0.98 1
Lacquer black, matte 100 T 0.97 2
Lacquer black, shiny,
Lacquer heat–resistant 100 T 0.92 1
Lacquer white 100 T 0.92 2
Lacquer white 40–100 T 0.8–0.95 1
Lead oxidized at 200°C
Lead oxidized, gray 20 T 0.28 1
sheet,
polished
Flat black Room tempera-
Flat black Room tempera-
on Aluminum
on Aluminum
rough surface
sprayed on iron
20 T 0.82 1
40–250 T 0.28 1
SW
200–600 T 0.64–0.78 1
ture up to 175
ture up to 175
70
70 LW 0.92–0.94 9
20 T 0.4 1
20 T 0.87 1
200 T 0.63 1
LW ≈ 0.96 12
MW ≈ 0.97 12
SW
0.64 9
0.50–0.53 9
#T810252; r. AD/43675/43696; en-US
72
Page 81

Emissivity tables21
Table 21.1 T: Total spectrum; SW: 2–5 µm; LW: 8–14 µm, LLW: 6.5–20 µm; 1: Material; 2: Specification;
3:Temperature in °C; 4: Spectrum; 5: Emissivity: 6:Reference (continued)
1 2 3 4 5 6
Lead oxidized, gray 22 T 0.28 4
Lead shiny 250 T 0.08 1
Lead unoxidized,
Lead red 100 T 0.93 4
Lead red, powder 100 T 0.93 1
Leather tanned T 0.75–0.80 1
Lime T 0.3–0.4 1
Magnesium 22 T 0.07 4
Magnesium 260 T 0.13 4
Magnesium 538 T 0.18 4
Magnesium polished 20 T 0.07 2
Magnesium
powder
Molybdenum 1500–2200 T 0.19–0.26 1
Molybdenum 600–1000 T 0.08–0.13 1
Molybdenum filament
Mortar 17
Mortar dry 36
Nextel Velvet
811-21 Black
Nichrome rolled 700 T 0.25 1
Nichrome sandblasted 700 T 0.70 1
Nichrome wire, clean 50 T 0.65 1
Nichrome wire, clean 500–1000 T 0.71–0.79 1
Nichrome wire, oxidized 50–500 T 0.95–0.98 1
Nickel bright matte 122 T 0.041 4
Nickel commercially
Nickel commercially
Nickel electrolytic 22 T 0.04 4
Nickel electrolytic 260 T 0.07 4
Nickel electrolytic 38 T 0.06 4
Nickel electrolytic 538 T 0.10 4
Nickel electroplated on
Nickel electroplated on
Nickel electroplated on
Nickel electroplated,
Nickel oxidized 1227 T 0.85 4
Nickel oxidized 200 T 0.37 2
Nickel oxidized 227 T 0.37 4
polished
Flat black –60–150 LW > 0.97 10 and
pure, polished
pure, polished
iron, polished
iron, unpolished
iron, unpolished
polished
100 T 0.05 4
T 0.86 1
700–2500 T 0.1–0.3 1
SW
SW
100 T 0.045 1
200–400 T 0.07–0.09 1
22 T 0.045 4
20 T 0.11–0.40 1
22 T 0.11 4
20 T 0.05 2
0.87 5
0.94 7
11
#T810252; r. AD/43675/43696; en-US
73
Page 82

Emissivity tables21
Table 21.1 T: Total spectrum; SW: 2–5 µm; LW: 8–14 µm, LLW: 6.5–20 µm; 1: Material; 2: Specification;
3:Temperature in °C; 4: Spectrum; 5: Emissivity: 6:Reference (continued)
1 2 3 4 5 6
Nickel
Nickel polished 122 T 0.045 4
Nickel wire 200–1000 T 0.1–0.2 1
Nickel oxide 1000–1250 T 0.75–0.86 1
Nickel oxide 500–650 T 0.52–0.59 1
Oil, lubricating 0.025 mm film
Oil, lubricating 0.050 mm film
Oil, lubricating 0.125 mm film
Oil, lubricating film on Ni base:
Oil, lubricating thick coating 20 T 0.82 2
Paint 8 different colors
Paint 8 different colors
Paint Aluminum, vari-
Paint cadmium yellow T 0.28–0.33 1
Paint chrome green T 0.65–0.70 1
Paint cobalt blue T 0.7–0.8 1
Paint oil 17
Paint oil based, aver-
Paint oil, black flat
Paint oil, black gloss 20
Paint oil, gray flat
Paint oil, gray gloss 20
Paint oil, various colors 100 T 0.92–0.96 1
Paint plastic, black 20
Paint plastic, white 20
Paper 4 different colors
Paper 4 different colors
Paper black T 0.90 1
Paper black, dull T 0.94 1
Paper black, dull 70
Paper black, dull 70 LW 0.89 9
Paper blue, dark T 0.84 1
Paper coated with black
Paper
Paper red T 0.76 1
Paper white 20 T 0.7–0.9 1
Paper white bond 20 T 0.93 2
Paper white, 3 different
oxidized at 600°C
Ni base only
and qualities
and qualities
ous ages
age of 16 colors
lacquer
green
glosses
200–600 T 0.37–0.48 1
20 T 0.27 2
20 T 0.46 2
20 T 0.72 2
20 T 0.05 2
70
70 LW 0.92–0.94 9
50–100 T 0.27–0.67 1
100 T 0.94 2
20
20
70
70 LW 0.92–0.94 9
70
SW
SW
SW
SW
SW
SW
SW
SW
SW
SW
T 0.93 1
T 0.85 1
SW
0.88–0.96 9
0.87 5
0.94 6
0.92 6
0.97 6
0.96 6
0.95 6
0.84 6
0.68–0.74 9
0.86 9
0.76–0.78 9
#T810252; r. AD/43675/43696; en-US
74
Page 83

Emissivity tables21
Table 21.1 T: Total spectrum; SW: 2–5 µm; LW: 8–14 µm, LLW: 6.5–20 µm; 1: Material; 2: Specification;
3:Temperature in °C; 4: Spectrum; 5: Emissivity: 6:Reference (continued)
1 2 3 4 5 6
Paper white, 3 different
Paper yellow T 0.72 1
Plaster 17
Plaster plasterboard,
Plaster rough coat 20 T 0.91 2
Plastic glass fibre lami-
Plastic glass fibre lami-
Plastic polyurethane iso-
Plastic polyurethane iso-
Plastic
Plastic
Platinum 100 T 0.05 4
Platinum 1000–1500 T 0.14–0.18 1
Platinum 1094 T 0.18 4
Platinum 17 T 0.016 4
Platinum 22 T 0.03 4
Platinum 260 T 0.06 4
Platinum 538 T 0.10 4
Platinum pure, polished 200–600 T 0.05–0.10 1
Platinum ribbon 900–1100 T 0.12–0.17 1
Platinum wire 1400 T 0.18 1
Platinum wire 500–1000 T 0.10–0.16 1
Platinum wire 50–200 T 0.06–0.07 1
Porcelain glazed 20 T 0.92 1
Porcelain white, shiny T 0.70–0.75 1
Rubber hard 20 T 0.95 1
Rubber soft, gray, rough
Sand T 0.60 1
Sand
Sandstone
Sandstone rough 19 LLW 0.935 8
Silver polished 100 T 0.03 2
Silver
Skin human 32 T 0.98 2
Slag boiler 0–100 T 0.97–0.93 1
Slag boiler 1400–1800 T 0.69–0.67 1
Slag
glosses
untreated
nate (printed circ.
board)
nate (printed circ.
board)
lation board
lation board
PVC, plastic floor,
dull, structured
PVC, plastic floor,
dull, structured
polished 19 LLW 0.909 8
pure, polished 200–600 T 0.02–0.03 1
boiler 200–500 T 0.89–0.78 1
70 LW 0.88–0.90 9
SW
20
70
70 LW 0.91 9
70 LW 0.55 9
70
70
70 LW 0.93 9
20 T 0.95 1
20 T 0.90 2
SW
SW
SW
SW
0.86 5
0.90 6
0.94 9
0.29 9
0.94 9
#T810252; r. AD/43675/43696; en-US
75
Page 84

Emissivity tables21
Table 21.1 T: Total spectrum; SW: 2–5 µm; LW: 8–14 µm, LLW: 6.5–20 µm; 1: Material; 2: Specification;
3:Temperature in °C; 4: Spectrum; 5: Emissivity: 6:Reference (continued)
1 2 3 4 5 6
Slag
Snow: See Water
Soil
Soil saturated with
Stainless steel
Stainless steel rolled 700 T 0.45 1
Stainless steel
Stainless steel
Stainless steel sheet, polished 70 LW 0.14 9
Stainless steel
Stainless steel sheet, untreated,
Stainless steel type 18-8, buffed
Stainless steel
Stucco
Styrofoam
Tar T 0.79–0.84 1
Tar
Tile glazed 17
Tin burnished 20–50 T 0.04–0.06 1
Tin tin–plated sheet
Titanium
Titanium oxidized at 540°C
Titanium
Titanium polished 1000 T 0.36 1
Titanium polished 200 T 0.15 1
Titanium polished 500 T 0.20 1
Tungsten 1500–2200 T 0.24–0.31 1
Tungsten 200 T 0.05 1
Tungsten 600–1000 T 0.1–0.16 1
Tungsten filament
Varnish flat
Varnish on oak parquet
Varnish on oak parquet
Wallpaper slight pattern,
Wallpaper slight pattern, red 20
Water distilled 20 T 0.96 2
boiler 600–1200 T 0.76–0.70 1
dry 20 T 0.92 2
water
alloy, 8% Ni, 18%
Cr
sandblasted 700 T 0.70 1
sheet, polished 70
sheet, untreated,
somewhat
scratched
somewhat
scratched
type 18-8, oxidized at 800°C
rough, lime 10–90 T 0.91 1
insulation 37
paper 20 T 0.91–0.93 1
iron
oxidized at 540°C
oxidized at 540°C
floor
floor
light gray
20 T 0.95 2
500 T 0.35 1
SW
70
70 LW 0.28 9
20 T 0.16 2
60 T 0.85 2
100 T 0.07 2
1000 T 0.60 1
200 T 0.40 1
500 T 0.50 1
3300 T 0.39 1
20
70
70 LW 0.90–0.93 9
20
SW
SW
SW
SW
SW
SW
SW
0.18 9
0.30 9
0.60 7
0.94 5
0.93 6
0.90 9
0.85 6
0.90 6
#T810252; r. AD/43675/43696; en-US
76
Page 85

Emissivity tables21
Table 21.1 T: Total spectrum; SW: 2–5 µm; LW: 8–14 µm, LLW: 6.5–20 µm; 1: Material; 2: Specification;
3:Temperature in °C; 4: Spectrum; 5: Emissivity: 6:Reference (continued)
1 2 3 4 5 6
Water frost crystals
Water ice, covered with
Water ice, smooth 0 T 0.97 1
Water ice, smooth –10 T 0.96 2
Water layer >0.1 mm
Water
Water
Wood 17
Wood 19 LLW 0.962 8
Wood ground T 0.5–0.7 1
Wood pine, 4 different
Wood pine, 4 different
Wood planed 20 T 0.8–0.9 1
Wood planed oak 20 T 0.90 2
Wood planed oak 70
Wood planed oak 70 LW 0.88 9
Wood plywood, smooth,
Wood plywood,
Wood white, damp 20 T 0.7–0.8 1
Zinc
Zinc oxidized surface
Zinc polished 200–300 T 0.04–0.05 1
Zinc sheet 50 T 0.20 1
heavy frost
thick
snow
snow –10 T 0.85 2
samples
samples
dry
untreated
oxidized at 400°C
–10 T 0.98 2
0 T 0.98 1
0–100 T 0.95–0.98 1
T 0.8 1
SW
70
70 LW 0.81–0.89 9
36
20
400 T 0.11 1
1000–1200 T 0.50–0.60 1
SW
SW
SW
SW
0.98 5
0.67–0.75 9
0.77 9
0.82 7
0.83 6
#T810252; r. AD/43675/43696; en-US
77
Page 86

A note on the technical production of this publication
This publication was produced using XML — the eXtensible Markup Language. For more information
about XML, please visit http://www.w3.org/XML/
A note on the typeface used in this publication
This publication was typeset using Linotype Helvetica™ World. Helvetica™ was designed by Max
Miedinger (1910–1980)
LOEF (List Of Effective Files)
T501250.xml; en-US; AD; 43675; 2017-07-06
T505552.xml; en-US; 9599; 2013-11-05
T505469.xml; en-US; 39689; 2017-01-25
T505013.xml; en-US; 39689; 2017-01-25
T506128.xml; en-US; 40817; 2017-03-02
T505470.xml; en-US; 39513; 2017-01-18
T505007.xml; en-US; 42810; 2017-05-23
T506125.xml; en-US; 40753; 2017-03-02
T505000.xml; en-US; 39687; 2017-01-25
T506155.xml; en-US; 42220; 2017-04-26
T506051.xml; en-US; 40460; 2017-02-20
T505005.xml; en-US; 42810; 2017-05-23
T505001.xml; en-US; 41563; 2017-03-23
T505006.xml; en-US; 41563; 2017-03-23
T505002.xml; en-US; 39512; 2017-01-18
#T810252; r. AD/43675/43696; en-US
78
Page 87

Page 88

Website
last page
http://www.flir.com
Customer support
http://support.flir.com
Copyright
© 2017, FLIR Systems, Inc. All rights reserved worldwide.
Disclaimer
Specifications subject to change without further notice. Models and accessories subject to regional market considerations. License procedures may apply.
Products described herein may be subject to US Export Regulations. Please refer to exportquestions@flir.com with any questions.
Publ. No.: T810252
Release: AD
Commit:
Head: 43696
Language: en-US
Modified: 2017-07-06
Formatted: 2017-07-06
43675
 Loading...