

Page 1
Installation Manual
FLIR A3XX series
FLIR A6XX series
T559498Publ. No.
a461Revision
English (EN)Language
August 19, 2010Issue date
Page 2

Page 3

Installation Manual
Publ. No. T559498 Rev. a461 – ENGLISH (EN) – August 19, 2010
Page 4

Legal disclaimer
All products manufactured by FLIR Systemsarewarranted against defectivematerialsandworkmanship for aperiodof one(1)year from the
delivery date of the original purchase, provided such products have been under normal storage, use and service, and in accordance with
FLIR Systems instruction.
Products which are not manufactured by FLIR Systems but included in systems delivered by FLIR Systems to the original purchaser, carry
the warranty, if any, of the particular supplier only. FLIR Systems has no responsibility whatsoever for such products.
The warranty extends only to the original purchaser and is not transferable. It is not applicable to any product which has been subjected to
misuse, neglect, accident or abnormal conditions of operation. Expendable parts are excluded from the warranty.
In the case of adefect inaproduct coveredbythis warrantytheproduct must notbe furtherusedin order toprevent additional damage.The
purchaser shall promptly report any defect to FLIR Systems or this warranty will not apply.
FLIR Systems will, at its option, repair or replace any such defective product free of charge if, upon inspection, it proves to be defective in
material or workmanship and provided that it is returned to FLIR Systems within the said one-year period.
FLIR Systems has no other obligation or liability for defects than those set forth above.
No other warranty is expressed or implied. FLIR Systems specifically disclaims the implied warranties of merchantability and fitness for a
particular purpose.
FLIR Systems shall not be liable for any direct, indirect, special, incidentalor consequential loss or damage, whether basedon contract, tort
or any other legal theory.
This warranty shall be governed by Swedish law.
Any dispute, controversy or claim arising out of or in connection with this warranty, shall be finally settled by arbitration in accordance with
the Rules of the Arbitration Institute of the Stockholm Chamber of Commerce. The place of arbitration shall be Stockholm. The language to
be used in the arbitral proceedings shall be English.
Copyright
© 2010, FLIRSystems. All rights reservedworldwide. No parts ofthesoftware including source codemaybe reproduced, transmitted, transcribed
or translated into any language or computer language in any form or by any means, electronic, magnetic, optical, manual or otherwise,
without the prior written permission of FLIR Systems.
This documentation must not, in whole or part, be copied, photocopied, reproduced, translated or transmitted to any electronic medium or
machine readable form without prior consent, in writing, from FLIR Systems.
Names and marks appearing on the products herein are eitherregistered trademarksor trademarksof FLIR Systems and/or its subsidiaries.
All othertrademarks,trade names or companynames referenced herein areusedfor identification only andarethe property of theirrespective
owners.
Quality assurance
The Quality Management System under which these products are developed and manufactured has been certified in accordance with the
ISO 9001 standard.
FLIR Systems is committed to a policy of continuous development; therefore we reserve the right to make changes and improvements on
any of the products described in this manual without prior notice.
iv Publ. No. T559498 Rev. a461 – ENGLISH (EN) – August 19, 2010
Page 5

Table of contents
11 Warnings & Cautions .....................................................................................................................
32 Notice to user ..................................................................................................................................
53 Customer help ................................................................................................................................
64 Documentation updates .................................................................................................................
75 Important note about this manual .................................................................................................
86 Overview of camera models ..........................................................................................................
86.1 FLIR A300 .............................................................................................................................
96.2 FLIR A310 .............................................................................................................................
106.3 FLIR A315 .............................................................................................................................
116.4 FLIR A320 Tempscreen ........................................................................................................
126.5 FLIR A615 .............................................................................................................................
137 Packing list ......................................................................................................................................
148 Installation .......................................................................................................................................
148.1 General information ..............................................................................................................
158.2 System requirements ...........................................................................................................
168.3 Installation .............................................................................................................................
179 Mechanical installation ..................................................................................................................
179.1 Installation of fixed cameras .................................................................................................
189.2 Mounting and removing lenses (FLIR A3XX series) ............................................................
189.2.1 Mounting an additional infrared lens ....................................................................
199.2.2 Removing an additional infrared lens ...................................................................
209.3 Mounting and removing lenses (FLIR A6XX series) ............................................................
209.3.1 Removing an infrared lens ....................................................................................
219.3.2 Mounting an infrared lens .....................................................................................
2210 Connectors, controls, and indicators ...........................................................................................
2611 Example system overviews ...........................................................................................................
2912 Temperature screening ..................................................................................................................
3113 Cleaning the camera ......................................................................................................................
3113.1 Camera housing, cables, and other items ...........................................................................
3213.2 Infrared lens ..........................................................................................................................
3313.3 Infrared detector ...................................................................................................................
3414 Technical data .................................................................................................................................
3515 Pin configurations ..........................................................................................................................
3716 Mechanical drawings .....................................................................................................................
3716.1 FLIR A3XX series ..................................................................................................................
3716.1.1 Camera dimensions (front) ...................................................................................
3816.1.2 Camera dimensions (side) ...................................................................................
Publ. No. T559498 Rev. a461 – ENGLISH (EN) – August 19, 2010 v
Page 6

3916.1.3 Camera dimensions (bottom) ...............................................................................
4016.1.4 Camera dimensions (with 10 mm/45° lens) .........................................................
4116.1.5 Camera dimensions (with 30 mm/15° lens) .........................................................
4216.1.6 Infrared lens (10 mm/45°) .....................................................................................
4316.1.7 Infrared lens (30 mm/15°) .....................................................................................
4416.2 FLIR A6XX series ..................................................................................................................
4416.2.1 Camera dimensions (front view, without lens) .....................................................
4516.2.2 Camera dimensions (side view, without lens) ......................................................
4616.2.3 Camera dimensions (side view, with 24.5 mm/25° lens) ......................................
4716.2.4 Specification of mounting interfaces, #1 .............................................................
4816.2.5 Specification of mounting interfaces, #2 .............................................................
4916.2.6 Camera dimensions (rear view) ............................................................................
5016.2.7 Infrared lens (24.5 mm/25°) ..................................................................................
5117 About FLIR Systems .......................................................................................................................
5217.1 More than just an infrared camera .......................................................................................
5217.2 Sharing our knowledge ........................................................................................................
5217.3 Supporting our customers ...................................................................................................
5317.4 A few images from our facilities ...........................................................................................
5518 Glossary ...........................................................................................................................................
5919 Thermographic measurement techniques ...................................................................................
5919.1 Introduction ..........................................................................................................................
5919.2 Emissivity ..............................................................................................................................
6019.2.1 Finding the emissivity of a sample .......................................................................
6019.2.1.1 Step 1: Determining reflected apparent temperature .......................
6219.2.1.2 Step 2: Determining the emissivity ...................................................
6319.3 Reflected apparent temperature ..........................................................................................
6319.4 Distance ................................................................................................................................
6319.5 Relative humidity ..................................................................................................................
6319.6 Other parameters ..................................................................................................................
6420 History of infrared technology ......................................................................................................
6821 Theory of thermography ................................................................................................................
6821.1 Introduction ...........................................................................................................................
6821.2 The electromagnetic spectrum ............................................................................................
6921.3 Blackbody radiation ..............................................................................................................
7021.3.1 Planck’s law ..........................................................................................................
7121.3.2 Wien’s displacement law ......................................................................................
7321.3.3 Stefan-Boltzmann's law .........................................................................................
7421.3.4 Non-blackbody emitters .......................................................................................
7621.4 Infrared semi-transparent materials .....................................................................................
7822 The measurement formula .............................................................................................................
8423 Emissivity tables .............................................................................................................................
8423.1 References ............................................................................................................................
8423.2 Important note about the emissivity tables ..........................................................................
8523.3 Tables ....................................................................................................................................
vi Publ. No. T559498 Rev. a461 – ENGLISH (EN) – August 19, 2010
Page 7

1 Warnings & Cautions
This equipment generates, uses, and can radiate radio frequency energy and if
WARNING
■
not installed and used in accordance with the instruction manual, may cause interference to radio communications. It has been tested and found to comply with
the limits for a Class A computing device pursuant to Subpart J of Part 15 of FCC
Rules, which are designedto providereasonable protection againstsuch interference when operated in a commercial environment. Operation of this equipment
in a residential area is likely to cause interference in which case the user at his
own expense will be required to take whatever measures may be required to
correct the interference.
(Applies only to cameras with laser pointer:) Do not look directly into the laser
■
beam. The laser beam can cause eye irritation.
Applies only to cameras with battery:
■
Do not disassemble or do a modification to the battery. The battery contains
■
safety and protection devices which, if they become damaged, can cause the
battery to become hot, or cause an explosion or an ignition.
If there is a leak from the battery and the fluid gets into your eyes, do not rub
■
your eyes.Flush well withwater and immediatelyget medical care. Thebattery
fluid can cause injury to your eyes if you do not do this.
Do not continue to charge the battery if it does not become charged in the
■
specified charging time. If you continue to charge the battery, it can become
hot and cause an explosion or ignition.
Only use the correct equipment to discharge the battery. If you do not use the
■
correct equipment, you can decrease the performance or the life cycle of the
battery. If you do not use the correct equipment, an incorrect flow of current
to the battery can occur. This can cause the battery to become hot, or cause
an explosion and injury to persons.
Make sure that you read all applicable MSDS (Material Safety Data Sheets) and
■
warning labelson containersbeforeyou usea liquid: theliquids can bedangerous.
Do not point theinfrared camera (withor without the lens cover)at intensive energy
CAUTION
■
sources, for example devices that emit laser radiation, or the sun. This can have
an unwanted effect on the accuracy of the camera. It can also cause damage to
the detector in the camera.
Do not use the camera in a temperature higher than +50°C (+122°F), unless
■
specified otherwise in the user documentation. High temperatures can cause
damage to the camera.
(Applies only to cameras with laser pointer:) Protect the laser pointer with the
■
protective cap when you do not operate the laser pointer.
Applies only to cameras with battery:
■
Do not attach the batteries directly to a car’s cigarette lighter socket, unless a
■
specific adapter for connecting the batteries to a cigarette lighter socket is
provided by FLIR Systems.
Do not connect the positive terminal and the negative terminal of the battery
■
to each other with a metal object (such as wire).
Do not get water or salt water on the battery, or permit the battery to get wet.
■
Publ. No. T559498 Rev. a461 – ENGLISH (EN) – August 19, 2010 1
Page 8

1 – Warnings & Cautions
■
■
■
■
■
Do not make holes in the battery with objects. Do not hit the battery with a
■
hammer. Do not step on the battery, or apply strong impacts or shocks to it.
Do not put thebatteries inor near a fire, orinto direct sunlight. When thebattery
■
becomes hot, the built-in safety equipment becomes energized and can stop
the battery charging process. If the battery becomes hot, damage can occur
to the safety equipment and this can cause more heat, damage or ignition of
the battery.
Do not put the battery on a fire or increase the temperature of the battery with
■
heat.
Do not put the battery on or near fires, stoves, or other high-temperature loca-
■
tions.
Do not solder directly onto the battery.
■
Do not use the battery if, when you use, charge, or store the battery, there is
■
an unusual smell fromthe battery,the battery feelshot, changes color, changes
shape, or is in an unusual condition. Contact your sales office if one or more
of these problems occurs.
Only use a specified battery charger when you charge the battery.
■
The temperature range through which you can charge the battery is ±0°C to
■
+45°C (+32°F to +113°F), unless specified otherwise in the user documentation. If you charge the battery at temperatures out of this range, it can cause
the battery to become hot or to break. It can also decrease the performance
or the life cycle of the battery.
The temperature range through which you can dischargethe battery is −15°C
■
to +50°C (+5°F to +122°F), unless specified otherwise in the user documentation. Use of the battery out of this temperature range can decrease the performance or the life cycle of the battery.
When the battery is worn, apply insulation to the terminals with adhesive tape
■
or similar materials before you discard it.
Remove any water or moisture on the battery before you install it.
■
Do not apply solvents or similar liquids to the camera, the cables, or other items.
This can cause damage.
Be careful when you cleanthe infraredlens. The lens has a delicate anti-reflective
coating.
Do not clean the infrared lens too vigorously. This can damage the anti-reflective
coating.
In furnace and other high-temperature applications,you mustmount aheatshield
on the camera. Using the camera in furnace and other high-temperature applications without a heatshield can cause damage to the camera.
(Applies only to cameras with an automatic shutter that can be disabled.) Do not
disable the automatic shutter in the camera for a prolonged time period (typically
max. 30 minutes). Disabling the shutter for a longer time period may harm, or irreparably damage, the detector.
2 Publ. No. T559498 Rev. a461 – ENGLISH (EN) – August 19, 2010
Page 9

2 Notice to user
Typographical
conventions
User-to-user
forums
Calibration
Accuracy
Disposal of
electronic waste
This manual uses the following typographical conventions:
Semibold is used for menu names, menu commands and labels, and buttons in
■
dialog boxes.
Italic is used for important information.
■
Monospace is used for code samples.
■
UPPER CASE is used for names on keys and buttons.
■
Exchange ideas,problems, and infraredsolutions with fellowthermographers around
the world in our user-to-user forums. To go to the forums, visit:
http://www.infraredtraining.com/community/boards/
(This notice only applies to cameras with measurement capabilities.)
We recommend that you send in the camera for calibration once a year. Contact
your local sales office for instructions on where to send the camera.
(This notice only applies to cameras with measurement capabilities.)
For very accurate results, we recommend that you wait 5 minutes after you have
started the camera before measuring a temperature.
For cameras where the detector is cooled by a mechanical cooler, this time period
excludes the time it takes to cool down the detector.
10742803;a1
As with most electronic products, this equipment must be disposed of in an environmentally friendlyway, and in accordancewith existingregulationsfor electronicwaste.
Please contact your FLIR Systems representative for more details.
Training
Additional license
information
To read about infrared training, visit:
http://www.infraredtraining.com
■
http://www.irtraining.com
■
http://www.irtraining.eu
■
This license permits the user to install and use the software on any compatible
computer, provided the software is used on a maximum of two (2) computers at the
same time (for example, one laptop computer for on-site data acquisition, and one
desktop computer for analysis in the office).
Publ. No. T559498 Rev. a461 – ENGLISH (EN) – August 19, 2010 3
Page 10

2 – Notice to user
One (1) back-up copy of the software may also be made for archive purposes.
4 Publ. No. T559498 Rev. a461 – ENGLISH (EN) – August 19, 2010
Page 11

3 Customer help
General
Submitting a
question
Downloads
For customer help, visit:
http://support.flir.com
To submit a question to the customer help team, you must be a registered user. It
only takes a fewminutes to registeronline. If you only wantto search the knowledgebase for existing questions and answers, you do not need to be a registered user.
When you want to submit a question, makesure thatyou have the following information to hand:
The camera model
■
The camera serial number
■
The communication protocol, or method, between the camera and your PC (for
■
example, HDMI, Ethernet, USB™, or FireWire™)
Operating system on your PC
■
Microsoft®Office version
■
Full name, publication number, and revision number of the manual
■
On the customer help site you can also download the following:
Firmware updates for your infrared camera
■
Program updates for your PC software
■
User documentation
■
Application stories
■
Technical publications
■
Publ. No. T559498 Rev. a461 – ENGLISH (EN) – August 19, 2010 5
Page 12

4 Documentation updates
General
Our manuals are updated several times per year, and we also issue product-critical
notifications of changes on a regular basis.
To access the latest manuals and notifications, go to the Download tab at:
http://support.flir.com
It only takes a few minutes to register online. In the download area you will also find
the latest releases of manuals for our other products, as well as manuals for our
historical and obsolete products.
6 Publ. No. T559498 Rev. a461 – ENGLISH (EN) – August 19, 2010
Page 13

5 Important note about this manual
General
NOTE
FLIR Systems issues generic manuals that cover several cameras within a model
line.
This means that this manual may contain descriptions and explanations that do not
apply to your particular camera model.
FLIR Systemsreserves therightto discontinuemodels,software, parts oraccessories,
and other items, or to change specifications and/or functionality at any time without
prior notice.
Publ. No. T559498 Rev. a461 – ENGLISH (EN) – August 19, 2010 7
Page 14
6 Overview of camera models
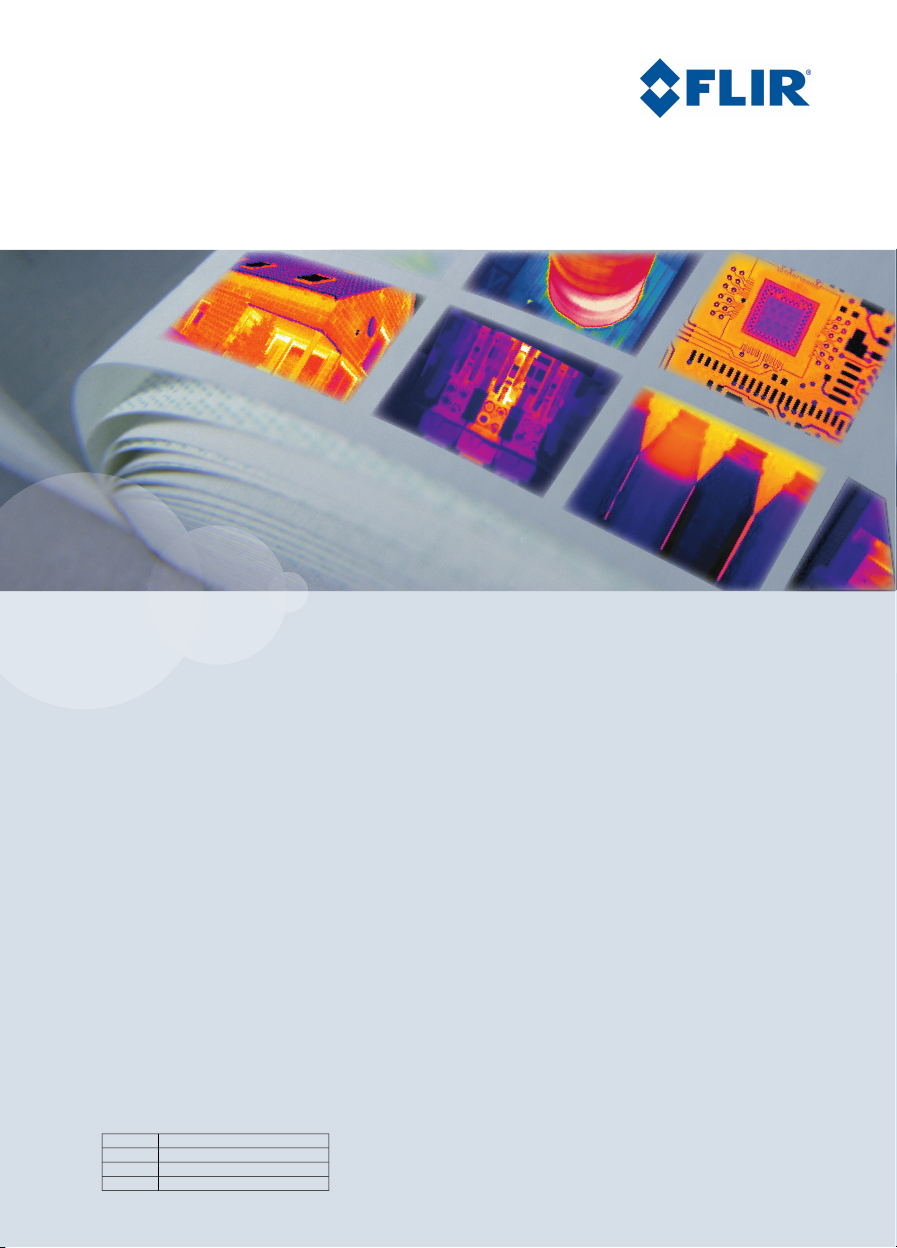
6.1 FLIR A300
T638517;a1
The FLIR A300 camera offers an affordable and accurate temperature measurement
solution for anyone who needs to solve problems that do not call forthe highest speed
or reaction and who uses a PC. Due to to its composite video output, it is also an
excellent choice for thermal image automation applications, where you can utilize its
unique properties such as looking through steam.
Key features:
■ MPEG-4 streaming
■ PoE (Power over Ethernet)
■ Built-in web server
■ General purpose I/O
■ 100 Mbps Ethernet (100 m cable, wireless, fiber, etc.)
■ Synchronization through SNTP
■ Composite video output
■ Multi-camera utility software: IP Config Utility and IR Monitor included
■ Open and well-described TCP/IP protocol for control and set-up
■ 16-bit 320 × 240 images @ 3 Hz, radiometric
■ Lenses: 25° included, 15° and 45° optional
Typical applications:
■ Fire prevention, critical vessel monitoring, and power utility asset management
■ Volume-oriented industrial control (multi-camera installation is possible)
8 Publ. No. T559498 Rev. a461 – ENGLISH (EN) – August 19, 2010
Page 15

6 – Overview of camera models
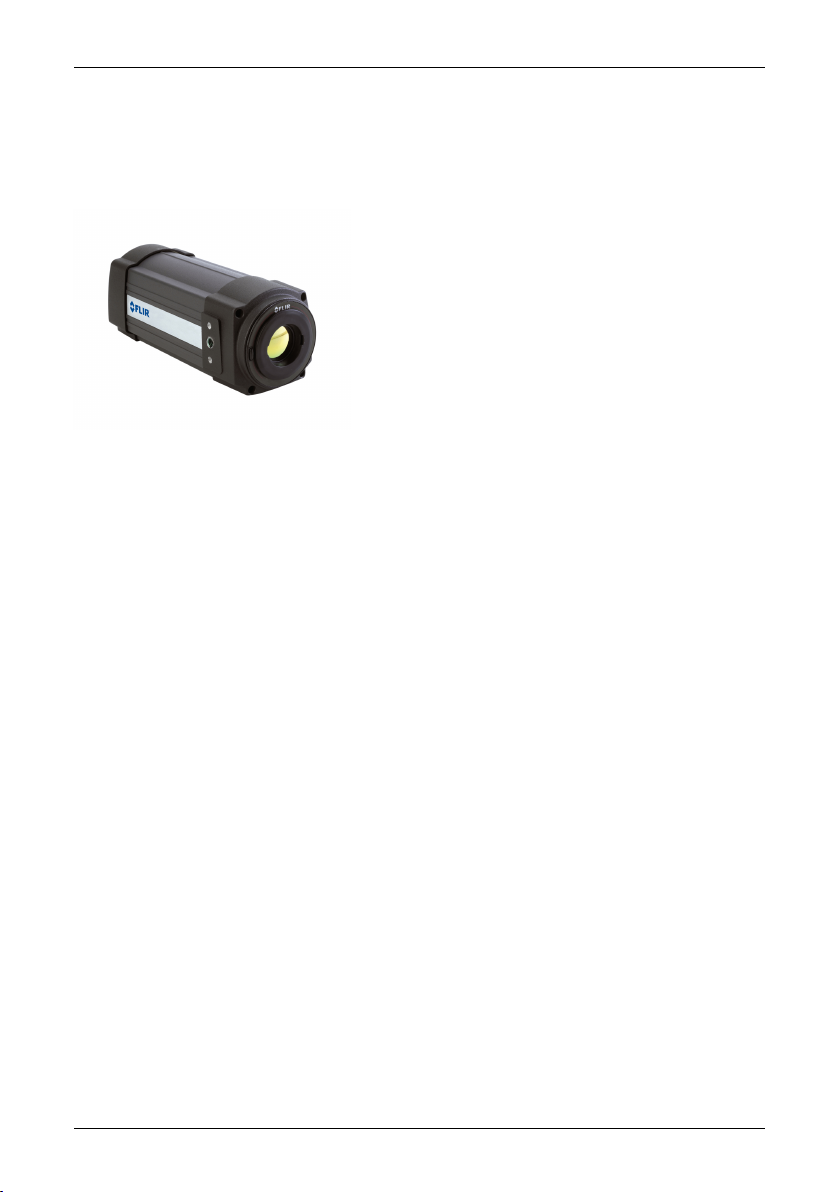
6.2 FLIR A310
T638517;a1
The FLIR A310 camera offers an affordable and accurate temperature measurement
solution for anyone who needs to solve problems that need built in “smartness” such
as analysis, alarm functionality and autonomous communication using standard
protocols. The FLIR A310 camera also has all the necessary features and functions
to build distributed single- or multi-camera solutions utilizing standard Ethernet
hardware and software protocols.
The FLIR A310 camera also has built in support to connect to industrial control
equipment such as PLCs, and allows for sharing of analysis and alarm results and
simple control using the Ethernet/IP and Modbus TCP field bus protocol.
Key features:
■ Support forEthernetIP fieldbus protocol (analyse, alarm, and simple camera control)
■ Support for Modbus TCP field bus protocol (analyse, alarm, and simple camera
control)
■ Built-in extensive analysis functionality
■ Extensive alarm functionality, as a function of analysis and more
■ On schedule: file sending (FTP) or email (SMTP) of analysis results or images
■ On alarms: file sending (FTP) or email (SMTP) of analysis results or images
■ MPEG-4 streaming
■ PoE (Power over Ethernet)
■ Built-in web server
■ General purpose I/O
■ 100 Mbps Ethernet (100 m cable, wireless, fiber, etc.)
■ Synchronization through SNTP
■ Composite video output
■ Multi-camera utility software: IP Config Utility and IR Monitor included
■ Open and well-described TCP/IP protocol for control and set-up
■ 16-bit 320 ×240 images @ 7–8 Hz, radiometric
■ Lenses: 25° included, 15° and 45° optional
Publ. No. T559498 Rev. a461 – ENGLISH (EN) – August 19, 2010 9
Page 16
6 – Overview of camera models
Typical applications:
■ Safety with temperature alarms (multi-camera applications), fire prevention, critical
vessel monitoring, and power utility asset management
■ Volume-oriented industrial control (multi-camera installation is possible)
6.3 FLIR A315
T638517;a1
The FLIR A315 camera has features and functions that make it the natural choice for
anyone who uses PC software to solve problems and for whom 320 × 240 pixel resolution is sufficient. Among its main features are GigE Vision™ and GenICam™ compliance, which makes it plug-and-play when used with software packages such as
IMAQ Vision and Halcon.
Key features:
■ Affordable
■ GigE compliant
■ GenICam compliant
■ Trigg/synchronization/GPIO
■ 16-bit 320 × 240 images @ 60 Hz, signal, temperature linear, and radiometric
■ Compliant withany softwarethat supports GenICam, includingNational Instruments
IMAQ Vision and Stemmers Common Vision Blox
■ Lenses: 25° included, 15° and 45° optional
Typical applications:
■ High-end infrared machine vision that needs temperature measurement
■ Slag detection
■ Food processing
■ Electronics testing
■ Power resistor testing
■ Automotive
10 Publ. No. T559498 Rev. a461 – ENGLISH (EN) – August 19, 2010
Page 17

6 – Overview of camera models
6.4 FLIR A320 Tempscreen
T638517;a1
The FLIR A320 Tempscreen is a camera preconfigured to work well in applications
where you want to find temperature deviations in a population of people, utilizing
difference temperature alarms with a dynamically updated reference temperature.
In addition, the FLIR A320 Tempscreen camera offers an affordable and accurate
temperature measurement solution for anyone who needs to solve problems that
need built in “smartness” such as analysis, alarm functionality and autonomous
communication using standard protocols. The FLIR A320 Tempscreen camera also
has all the necessary features and functions to build distributed single- or multicamera solutions utilizing standard Ethernet hardware and software protocols.
Key features:
■ Screening: difference temperature alarm with a dynamic updated reference tem-
perature (visualized by the isotherm)
■ Built-in extensive analysis functionality
■ Extensive alarm functionality, as a function of analysis and more
■ On schedule: file sending (FTP) or email (SMTP) of analysis results or images
■ On alarms: file sending (FTP) or email (SMTP) of analysis results or images
■ MPEG-4 streaming
■ PoE (Power over Ethernet)
■ Built-in web server
■ General purpose I/O
■ 100 Mbps Ethernet (100 m cable, wireless, fiber, etc.)
■ Synchronization through SNTP
■ Composite video output
■ Multi-camera utility software: IP Config Utility and IR Monitor included
■ Open and well-described TCP/IP protocol for control and set-up
■ 16-bit 320 × 240 images semi-real time, signal and temperature linear
■ Lenses: 25° included, 15° and 45° optional
Typical applications:
Publ. No. T559498 Rev. a461 – ENGLISH (EN) – August 19, 2010 11
Page 18
6 – Overview of camera models
■ Safety with temperature alarms (multi-camera applications), fire prevention, critical
vessel monitoring, and power utility asset management
■ Volume-oriented industrial control (multi-camera installation is possible)
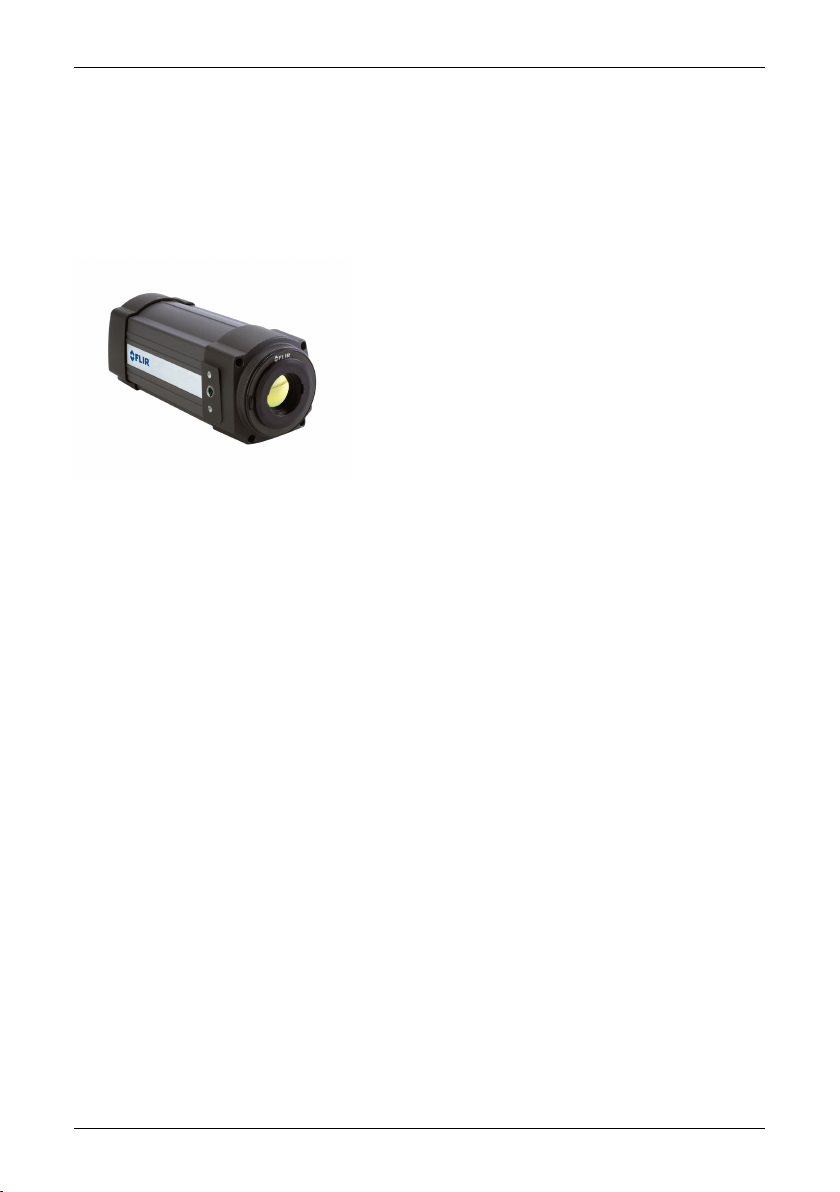
6.5 FLIR A615
T638519;a1
The FLIR A615 camera has features and functions that make it the natural choice for
anyone whouses PCsoftware tosolve problemsand needs640 ×480 pixel resolution.
Among its main features are GigE Vision™and GenICam™compliance, which makes
it plug-and-playwhen used with software packages such as IMAQ Visionand Halcon.
Key features:
■ Affordable
■ GigE compliant
■ GenICam compliant
■ Trigg/synchronization/GPIO
■ 16-bit 640 × 480 images @ 50 Hz, signal, temperature linear, and radiometric
■ Windowing mode: 640 × 240 @ 100 Hz or 640 × 120 @ 200 Hz
■ Compliant withany softwarethat supports GenICam, includingNational Instruments
IMAQ Vision and Stemmers Common Vision Blox
■ Open and well described TCP/IP protocol for control and set-up
■ Lenses: 25° included, 15° and 45° optional
Typical applications:
■ High-end infrared machine vision that needs temperature measurement
■ Slag detection
■ Food processing
■ Electronics testing
■ Power resistor testing
■ Automotive
12 Publ. No. T559498 Rev. a461 – ENGLISH (EN) – August 19, 2010
Page 19

7 Packing list
General
Contents
NOTE
The numberofpartsand accessories included depends onthecameramodel and/or
customer configuration.
Hard transport case or cardboard box
■
Infrared camera with lens
■
ThermoVision™ System Tools & Utilities CD-ROM
■
Application CD-ROM
■
Calibration certificate
■
Ethernet™ cable
■
Mains cable
■
Power cable, pig-tailed
■
Power supply
■
Printed Getting Started Guide
■
Printed Important Information Guide
■
User documentation CD-ROM
■
Warranty extension card or Registration card
■
six-pole screw terminal (mounted on camera)
■
Hard transport case or cardboard box
■
USB cable
■
FLIR Systems reserves the right to discontinue models, parts or accessories, and
other items, or to change specifications at any time without prior notice.
Publ. No. T559498 Rev. a461 – ENGLISH (EN) – August 19, 2010 13
Page 20

8 Installation
8.1 General information
Explanation
Default installation
paths
NOTE
The following programs are included on the ThermoVision™ System Tools & Utilities
application CD:
FLIR IP Config: A set-up and configuration program to detect and find FLIR au-
■
tomation andscience cameras ona networkand automatically assign or manually
set IP addresses.
FLIR IR Monitor: A program to control FLIR automation and science cameras on
■
a network. You typically use FLIR IR Monitor to change camera settings, lay out
measurement tools on the screen, set up alarms, etc.
FLIR IRCamera Player: APC-based remotecontrol and videoplayerfor IR cameras
■
from FLIR Systems.
A link to aweb installationof FLIR AXXXControl & Image Interfaces: Aninstallation
■
that includes Interface Control Documents (ICDs), user documentation and Ccode examples. We recommend that you read through the documentation.
C:\Program Files\FLIR Systems\FLIR IP Config
■
C:\Program Files\FLIR Systems\FLIR IR Monitor
■
C:\Program Files\FLIR Systems\FLIR IR Camera Player
■
C:\Program Files\FLIR Systems\AXXX Control & Image Interfaces
■
Functionality in the PC programs is dependent on the camera model.
14 Publ. No. T559498 Rev. a461 – ENGLISH (EN) – August 19, 2010
Page 21

8.2 System requirements
Microsoft®Windows®XP Professional, with Service Pack 2 (SP2)
Operating system
Hardware
■
Microsoft®Windows®Vista Ultimate 32-bit
■
Microsoft®Windows®7, 32- and 64-bit
■
Personal computer with a 2 GHz 32-bit or 64-bit processor
■
1 GB of RAM, or greater
■
20 GB of hard disk space
■
Super VGA (1024 × 768) or higher-resolution monitor
■
Support for DirectX 9 graphics with:
■
WDDM driver
■
128 MB of graphics memory (minimum)
■
Pixel Shader 2.0 (in hardware)
■
32 bits per pixel
■
DVD-ROM drive
■
Audio output
■
Keyboard and Microsoft®mouse, or a compatible pointing device
■
8 – Installation
Software
SEE
Microsoft®Internet Explorer 6 or later
For specific information about system requirements for the operating systems mentioned above, please visit: http://www.microsoft.com/windows/.
Publ. No. T559498 Rev. a461 – ENGLISH (EN) – August 19, 2010 15
Page 22

8 – Installation
8.3 Installation
General
NOTE
Procedure
Last-minute changes and other important information can be found in the read-me
file on the CD-ROM. We recommend that you read this file before you install the
programs.
If you experience problemsduring theinstallation, please visit our CustomerHelp
■
by pointing your browser to http://support.flir.com.
You must be an Adminstrator or a user with Administrative Rights to install the
■
programs.
A complete installation consists of several subinstallations, some of which are
■
from third-party vendors. Do not abort these subinstallations, as they are needed
for the complete installation.
A complete installation can take up to 10 minutes to complete.
■
Follow this procedure:
Close down all applications.1
Insert the ThermoVision™ System Tools & Utilities CD-ROM into the CD-
2
ROM drive on the computer. The installation should start automatically.
Should the installation notstart automatically,start Windows®Explorer and
double-click SETUP.HTM on the CD-ROM.
Click one of the following:
3
Install FLIR IP Config.
■
Install FLIR IR Monitor.
■
Install FLIR Camera Player.
■
Install AXXX Control & Image Interfaces.
■
Follow the on-screen instructions.4
16 Publ. No. T559498 Rev. a461 – ENGLISH (EN) – August 19, 2010
Page 23

9 Mechanical installation
9.1 Installation of fixed cameras
Mounting
interfaces
Notes on
permanent
mounting
Vibrations
Further
information
The camera unit has been designed to allow it to be mounted in any position. The
housing hasthree mounting interfaces–bottom, left, andright – eachwith the following threaded holes.
FLIR A3XX cameras:
2 × M4 metric threaded holes
■
1 × UNC ¼-20 standard tripod mount.
■
FLIR A6XX cameras:
2 × M4 metric threaded holes
■
1 × UNC ¼-20 standard tripod mount.
■
If the camera unit is to be permanently mounted at the application site, certain steps
are required.
The camera unit might need to be enclosed in a protective housing and, depending
on the ambient conditions (e.g. temperature), the housing may need to be cooled
or heated by means of water or air.
In very dusty conditions the installationmight also need to have a stream of pressurized air directed at the lens, in order to prevent dust build-up.
When mounting the camera unit in harsh industrial environments, every precaution
should be taken when securing the unit.
If the environment exposesthe unit tosevere vibrations, theremay be aneed to secure
the mounting screws by means of Loctite™ or another industrial brand of threadlocking liquid, as well as to dampen the vibrations by mounting the camera unit on
a specially designed base.
For further information regarding mounting recommendations and environmental
enclosures, contact FLIR Systems.
Publ. No. T559498 Rev. a461 – ENGLISH (EN) – August 19, 2010 17
Page 24

9 – Mechanical installation
9.2 Mounting and removing lenses (FLIR A3XX series)
9.2.1 Mounting an additional infrared lens
NOTE
Procedure
Do nottouchthe lens surfacewhenyou mount an infraredlens. If this happens,clean
the lens according to the instructions in section 13.2 – Infrared lens on page 32.
Follow this procedure to mount an additional infrared lens:
Push the lens release button to unlock the lens ring. The lens ring is made
1
of plastic and holds the plastic lens cap.
Rotate the lens ring 30° counter-clockwise (looking at the front of the lens).2
Carefully pull out the lens ring from the bayonet ring.3
Correctly position the lens in front of the bayonet ring.4
Carefully push the lens into position.5
Rotate the lens 30° clockwise (looking at the front of the lens).6
18 Publ. No. T559498 Rev. a461 – ENGLISH (EN) – August 19, 2010
Page 25

9.2.2 Removing an additional infrared lens
Do not touch the lens surface when you remove an infrared lens. If this happens,
NOTE
■
clean the lens according to the instructions in section 13.2 – Infrared lens on
page 32.
When you have removed the lens, put the lens caps on the lens immediately, to
■
protect it from dust and fingerprints.
9 – Mechanical installation
Procedure
Follow this procedure to remove an additional infrared lens:
Push the lens release button to unlock the lens.1
Rotate the lens counter-clockwise 30° (looking at the front of the lens).2
Carefully pull out the lens from the bayonet ring.3
Correctly position the lens ring in front of the bayonet ring.4
Carefully push the lens ring into position.5
Rotate the lens ring 30° clockwise (looking at the front of the lens).6
Publ. No. T559498 Rev. a461 – ENGLISH (EN) – August 19, 2010 19
Page 26

9 – Mechanical installation
9.3 Mounting and removing lenses (FLIR A6XX series)
9.3.1 Removing an infrared lens
Do not touch the lens surface when you remove an infrared lens. If this happens,
NOTE
■
clean the lens according to the instructions in section 13.2 – Infrared lens on
page 32.
When you have removed the lens, put the lens caps on the lens immediately, to
■
protect it from dust and fingerprints.
Procedure
Follow this procedure to remove an infrared lens:
Rotate the lens counter-clockwise 30° (looking at the front of the lens).1
Carefully pull out the lens from the bayonet ring.2
20 Publ. No. T559498 Rev. a461 – ENGLISH (EN) – August 19, 2010
Page 27

9.3.2 Mounting an infrared lens
9 – Mechanical installation
NOTE
Procedure
Do nottouchthe lens surfacewhenyou mount an infraredlens. If this happens,clean
the lens according to the instructions in section 13.2 – Infrared lens on page 32.
Follow this procedure to mount an infrared lens:
Correctly position the lens in front of the bayonet ring.1
Carefully push the lens into position.2
Rotate the lens 30° clockwise (looking at the front of the lens) until a click
3
is heard.
Publ. No. T559498 Rev. a461 – ENGLISH (EN) – August 19, 2010 21
Page 28
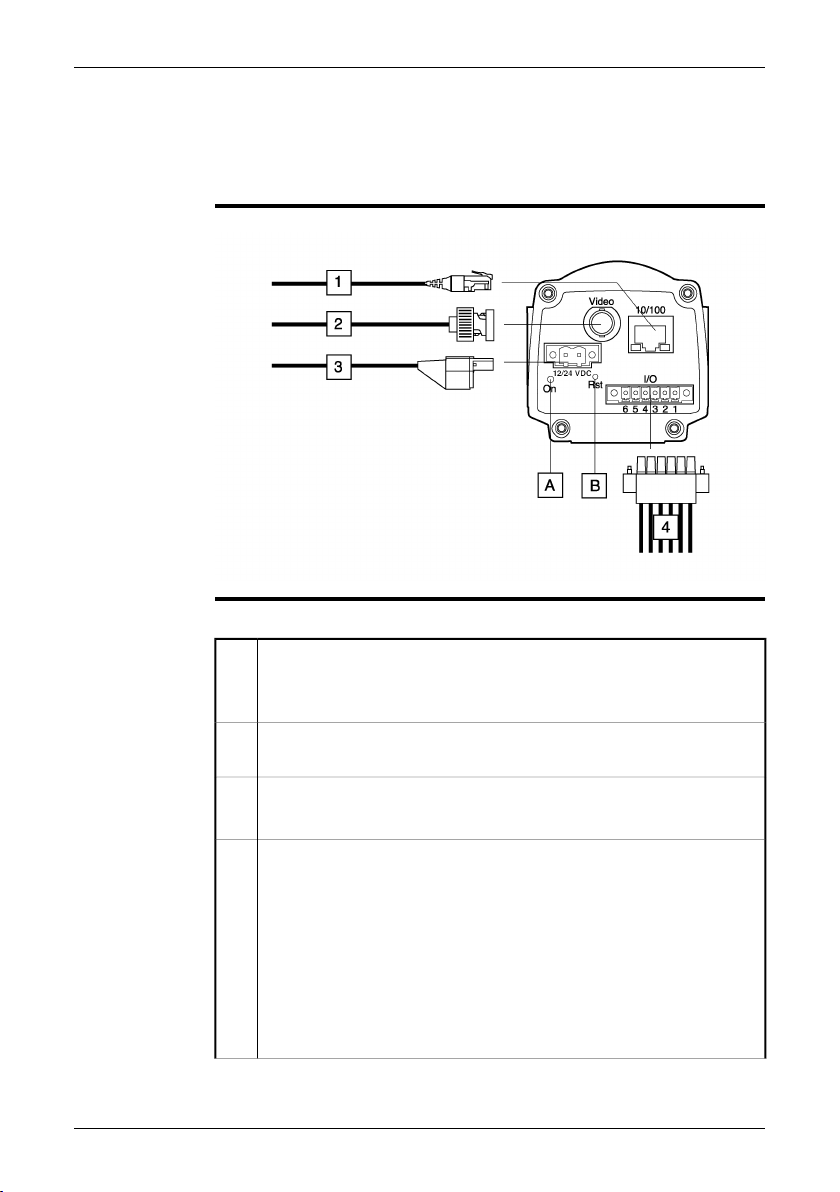
10 Connectors, controls, and
indicators
FLIR A3XX series
Explanation
10769803;a2
This table explains the figure above:
Network cablewith an RJ45connector for Ethernet™connectivity and PoE™
1
(dependent on the camera model)
Note: Only CAT-6 Ethernet™ cables should be used with this camera.
Video cable with a BNC connector for CVBS (composite video) output
2
(subject to camera model)
Power cable for 12–24 VDC power in
3
Note: The power connector on the camera is polarity protected.
Digital I/O ports, opto-isolated (six-pole screw terminal)
4
Pin configuration:
1 IN 1
2 IN 2
3 OUT 1
4 OUT 2
5 I/O +
6 I/O –
For a schematic overview of the digital I/O ports, see page 35.
22 Publ. No. T559498 Rev. a461 – ENGLISH (EN) – August 19, 2010
Page 29

Power indicator
A
Note: The LEDs indicate the following:
ange.
10 – Connectors, controls, and indicators
ExplanationType of signal
The camera is starting up.The LED glows continuously or-
NOTE
The LED glows continuously red.
An error has been detected. Contact service.
The camera has started.The LED glows continuously
green.
The LED flashes 10 times per second.
Hardware reset button (for a factory default reset)
B
An error has been detected. Contact service.
Use an unbent paper clip or a similartool to press the reset button through
the small hole on the back of the camera for 5 seconds, then release the
button.
Cables for digital I/O ports should be 100 m/328 ft. maximum.
Publ. No. T559498 Rev. a461 – ENGLISH (EN) – August 19, 2010 23
Page 30
10 – Connectors, controls, and indicators
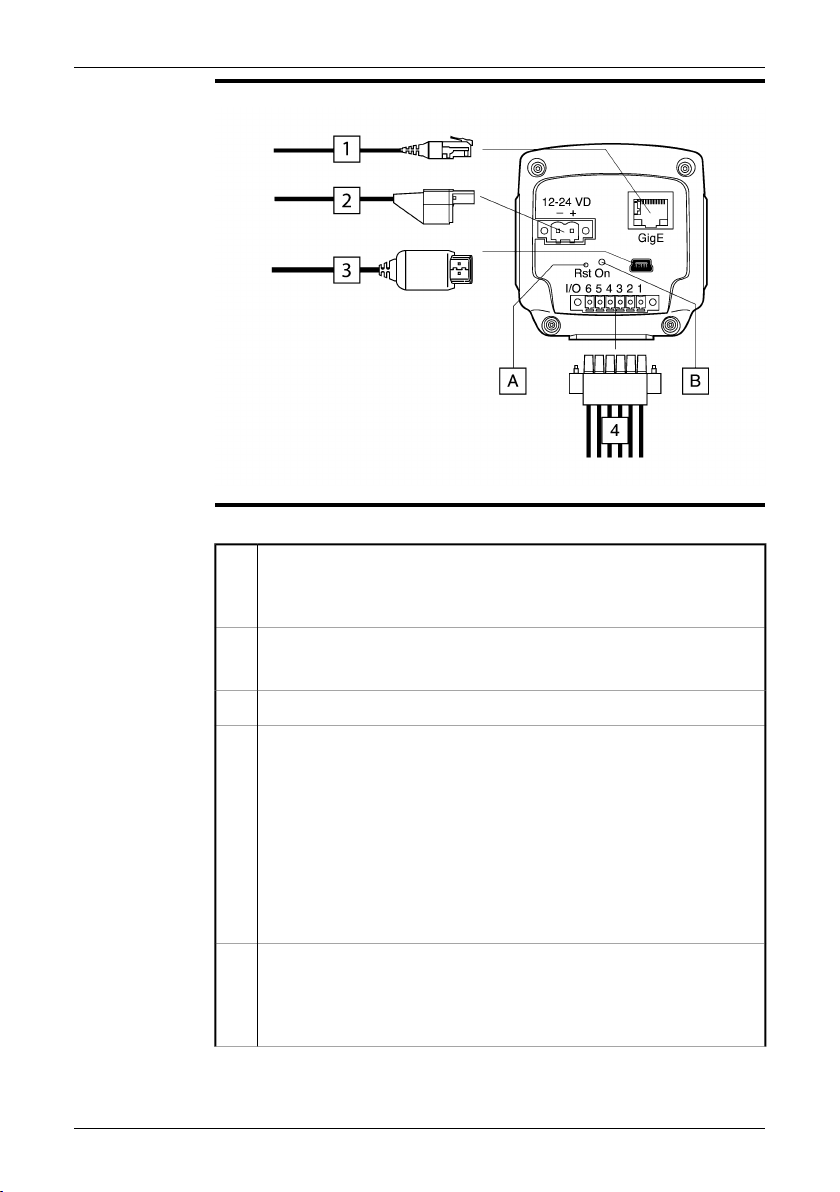
FLIR A6XX series
Explanation
T638542;a1
This table explains the figure above:
Network cablewith an RJ45connector for Ethernet™connectivity and PoE™
1
(dependent on the camera model)
Note: Only CAT-6 Ethernet™ cables should be used with this camera.
Power cable for 12–24 VDC power in
2
Note: The power connector on the camera is polarity protected.
USB cable with a USB mini-B connector for control and image transfer.3
Digital I/O ports, opto-isolated (six-pole screw terminal)
4
Pin configuration:
1 IN 1
2 IN 2
3 OUT 1
4 OUT 2
5 I/O +
6 I/O –
For a schematic overview of the digital I/O ports, see page 35.
Hardware reset button (for a factory default reset)
A
Use an unbent paper clip or a similartool to press the reset button through
the small hole on the back of the camera for 5 seconds, then release the
button.
24 Publ. No. T559498 Rev. a461 – ENGLISH (EN) – August 19, 2010
Page 31

Power indicator
B
Note: The LEDs indicate the following:
ange.
10 – Connectors, controls, and indicators
ExplanationType of signal
The camera is starting up.The LED glows continuously or-
NOTE
The LED glows continuously red.
An error has been detected. Contact service.
The camera has started.The LED glows continuously
green.
The LED flashes 10 times per second.
An error has been detected. Contact service.
Cables for digital I/O ports should be 100 m/328 ft. maximum.
Publ. No. T559498 Rev. a461 – ENGLISH (EN) – August 19, 2010 25
Page 32

11 Example system overviews
Figure
10777403;a3
Explanation
This table explains the figure:
Computer1
CAT-6 Ethernet™ cable with RJ45 connectors2
Industrial Ethernet™ switches with fiber optic ports3
Fiber optic cable4
FLIR A3XX/A6XX cameras5
Industrial process to be monitored, e.g., items on a conveyor belt6
26 Publ. No. T559498 Rev. a461 – ENGLISH (EN) – August 19, 2010
Page 33

11 – Example system overviews
Figure
10777503;a3
Explanation
This table explains the figure:
Computer1
CAT-6 Ethernet™ cable with RJ45 connectors2
Industrial Ethernet™ switch3
FLIR A3XX/A6XX cameras4
Industrial process to be monitored, e.g., a gasifier5
Publ. No. T559498 Rev. a461 – ENGLISH (EN) – August 19, 2010 27
Page 34

11 – Example system overviews
Figure
10777603;a4
Explanation
This table explains the figure:
Computer1
CAT-6 Ethernet™ cable with RJ45 connectors2
Industrial Ethernet™ switches with fiber optic ports3
Fiber optic cable4
Wireless access points5
CAT-6 Ethernet™ cablewith RJ45 connectors—poweringthe camera using
6
PoE (Power over Ethernet™, dependent on the camera model)
Industrial Ethernet™ switch7
FLIR A3XX/A6XX cameras8
28 Publ. No. T559498 Rev. a461 – ENGLISH (EN) – August 19, 2010
Page 35

12 Temperature screening
Applicability
Description of the
function
NOTE
Procedure
This section applies to the following camera models:
FLIR A320 (30 Hz) Temp screen
■
FLIR A320 (9 Hz) Temp screen
■
The screening function in allows you to screen a large number of persons for facial
temperatures that lie above a set reference temperature.
When an elevated temperature is detected, the camera will trigger a visible and/or
audible alarm.
You can change thetemperature 2°C/3.6°F (describedbelow) using theScreening
■
tab in FLIR IR Monitor (included on the ThermoVision™ System Tools & Utilities
1.5.1 HF2 (1.5.1.16)). HF2 can be downloaded from http://support.flir.com.
The camerashould run for at least 30 minutes beforecarrying out measurements.
■
The distance to the face should be adapted so that the face covers more than
■
75% of the image width.
Follow this procedure:
Connect the camera to a video monitor.1
Connect the camera to power.2
Connect the IN 1 port to +10–30 VDC, using cables and an NO (normally
3
open) electrical switch.
Now aim the camera at a face (at the inner corner of the eye) having a
4
supposedly normal temperature. Close the switch for a period of less than
2 seconds to acquire a temperature sample. Repeat this procedure on at
least 10 faces with supposedly normal temperatures. You have now set the
reference temperature. If you want to reset or restart the reference temperature, close the switch for a period of more than 2 seconds. See the
schematic drawing on the next page for setup details.
You can now begin the screening. Aim the camera at the faces of the per-
5
sons whose facial temperatures you want to screen (at the inner corner of
the eye). If a person’s facial temperature ismore than 2°C/3.6°F above the
set reference temperature, an alarm will be triggered.
Publ. No. T559498 Rev. a461 – ENGLISH (EN) – August 19, 2010 29
Page 36

+ 10 - 30 volts
Ground
focus near
focus far
both = autofocus
Acquire sample
Reset/restart reference temperature
Autofocus
Screening of elevated facial temperatures using
FLIR A320
12 – Temperature screening
T638569;a1
30 Publ. No. T559498 Rev. a461 – ENGLISH (EN) – August 19, 2010
Page 37

13 Cleaning the camera
13.1 Camera housing, cables, and other items
Liquids
Equipment
Procedure
CAUTION
Use one of these liquids:
Warm water
■
A weak detergent solution
■
A soft cloth
Follow this procedure:
Soak the cloth in the liquid.1
Twist the cloth to remove excess liquid.2
Clean the part with the cloth.3
Do not apply solvents or similar liquids to the camera, the cables, or other items.
This can cause damage.
Publ. No. T559498 Rev. a461 – ENGLISH (EN) – August 19, 2010 31
Page 38

13 – Cleaning the camera
13.2 Infrared lens
Liquids
Equipment
Procedure
WARNING
CAUTION
Use one of these liquids:
96% ethyl alcohol (C2H5OH).
■
DEE (= ‘ether’ = diethylether, C4H10O).
■
50% acetone (= dimethylketone, (CH3)2CO)) + 50% ethyl alcohol (by volume).
■
This liquid prevents drying marks on the lens.
Cotton wool
Follow this procedure:
Soak the cotton wool in the liquid.1
Twist the cotton wool to remove excess liquid.2
Clean the lens one time only and discard the cotton wool.3
Make sure that you read all applicable MSDS (Material Safety Data Sheets) and
warning labels on containers before you use a liquid: the liquids can be dangerous.
Be careful when you cleanthe infraredlens. The lens has a delicate anti-reflective
■
coating.
Do not clean the infrared lens too vigorously. This can damage the anti-reflective
■
coating.
32 Publ. No. T559498 Rev. a461 – ENGLISH (EN) – August 19, 2010
Page 39

13.3 Infrared detector
13 – Cleaning the camera
General
NOTE
CAUTION
Procedure
Even small amounts of dust on the infrared detector can result in major blemishes
in the image. To remove any dust from the detector, follow the procedure below.
This section only appliesto cameras whereremoving the lensexposes the infrared
■
detector.
In somecases thedustcannot be removedby following thisprocedure: the infrared
■
detector mustbe cleanedmechanically. Thismechanical cleaning mustbe carried
out by an authorized service partner.
In Step2 below,do not usepressurized air frompneumatic air circuits ina workshop,
etc., as this air usually contains oil mist to lubricate pneumatic tools.
Follow this procedure:
Remove the lens from the camera.1
Use pressurized air from a compressed air canister to blow off the dust.2
Publ. No. T559498 Rev. a461 – ENGLISH (EN) – August 19, 2010 33
Page 40

14 Technical data
For technical data, refer to the datasheets on the User Documentation CD-ROM that
comes with the camera.
Datasheets are also available at http://support.flir.com.
34 Publ. No. T559498 Rev. a461 – ENGLISH (EN) – August 19, 2010
Page 41

15 Pin configurations
Pin configuration
for I/O connector
ConfigurationPin
1 IN 1
IN 22
OUT 13
OUT 24
I/O +5
I/O –6
Publ. No. T559498 Rev. a461 – ENGLISH (EN) – August 19, 2010 35
Page 42

15 – Pin configurations
Schematic
overview of the
digital I/O ports
10771603;a1
36 Publ. No. T559498 Rev. a461 – ENGLISH (EN) – August 19, 2010
Page 43

16 Mechanical drawings
16.1 FLIR A3XX series
16.1.1 Camera dimensions (front)
Figure
10770303;a1
Publ. No. T559498 Rev. a461 – ENGLISH (EN) – August 19, 2010 37
Page 44

16 – Mechanical drawings
16.1.2 Camera dimensions (side)
Figure
NOTE
10770403;a1
The BNC connector on the rear panel is dependent on the camera model.
38 Publ. No. T559498 Rev. a461 – ENGLISH (EN) – August 19, 2010
Page 45

16.1.3 Camera dimensions (bottom)
16 – Mechanical drawings
Figure
NOTE
10770503;a1
The BNC connector on the rear panel is dependent on the camera model.
Publ. No. T559498 Rev. a461 – ENGLISH (EN) – August 19, 2010 39
Page 46

16 – Mechanical drawings
16.1.4 Camera dimensions (with 10 mm/45° lens)
Figure
NOTE
10770603;a1
The BNC connector on the rear panel is dependent on the camera model.
40 Publ. No. T559498 Rev. a461 – ENGLISH (EN) – August 19, 2010
Page 47

16.1.5 Camera dimensions (with 30 mm/15° lens)
16 – Mechanical drawings
Figure
NOTE
10770703;a1
The BNC connector on rthe ear panel is dependent on the camera model.
Publ. No. T559498 Rev. a461 – ENGLISH (EN) – August 19, 2010 41
Page 48

16 – Mechanical drawings
16.1.6 Infrared lens (10 mm/45°)
Figure
10762403;a1
42 Publ. No. T559498 Rev. a461 – ENGLISH (EN) – August 19, 2010
Page 49

16.1.7 Infrared lens (30 mm/15°)
16 – Mechanical drawings
Figure
10762503;a1
Publ. No. T559498 Rev. a461 – ENGLISH (EN) – August 19, 2010 43
Page 50

16 – Mechanical drawings
16.2 FLIR A6XX series
16.2.1 Camera dimensions (front view, without lens)
Figure
T638548;a1
44 Publ. No. T559498 Rev. a461 – ENGLISH (EN) – August 19, 2010
Page 51

16.2.2 Camera dimensions (side view, without lens)
16 – Mechanical drawings
Figure
T638546;a1
Publ. No. T559498 Rev. a461 – ENGLISH (EN) – August 19, 2010 45
Page 52

16 – Mechanical drawings
16.2.3 Camera dimensions (side view, with 24.5 mm/25° lens)
Figure
T638545;a1
46 Publ. No. T559498 Rev. a461 – ENGLISH (EN) – August 19, 2010
Page 53

16.2.4 Specification of mounting interfaces, #1
16 – Mechanical drawings
Figure
T638550;a1
Publ. No. T559498 Rev. a461 – ENGLISH (EN) – August 19, 2010 47
Page 54

16 – Mechanical drawings
16.2.5 Specification of mounting interfaces, #2
Figure
T638544;a1
48 Publ. No. T559498 Rev. a461 – ENGLISH (EN) – August 19, 2010
Page 55

16.2.6 Camera dimensions (rear view)
16 – Mechanical drawings
Figure
T638547;a1
Publ. No. T559498 Rev. a461 – ENGLISH (EN) – August 19, 2010 49
Page 56

16 – Mechanical drawings
16.2.7 Infrared lens (24.5 mm/25°)
Figure
T638549;a1
50 Publ. No. T559498 Rev. a461 – ENGLISH (EN) – August 19, 2010
Page 57

17 About FLIR Systems
FLIR Systemswas establishedin 1978to pioneerthe developmentof high-performance
infrared imaging systems, and is the world leader in the design, manufacture, and
marketing of thermal imaging systems for a wide variety of commercial, industrial,
and government applications. Today, FLIR Systems embraces five major companies
with outstanding achievements in infrared technology since 1958—the Swedish
AGEMA Infrared Systems (formerly AGA Infrared Systems), the three United States
companies Indigo Systems, FSI, and Inframetrics, and the French company Cedip.
In November 2007, Extech Instruments was acquired by FLIR Systems.
10722703;a2
Figure 17.1 LEFT: Thermovision® Model 661 from 1969. The camera weighed approximately 25 kg
(55 lb.), the oscilloscope20 kg (44 lb.), and the tripod 15 kg (33 lb.). The operatoralso needed a 220 VAC
generator set, and a 10 L (2.6 US gallon) jar with liquid nitrogen.To the left of the oscilloscope thePolaroid
attachment (6 kg/13 lb.) can be seen. RIGHT: FLIR i7 from 2009. Weight: 0.34 kg (0.75 lb.), including the
battery.
The companyhas soldmore than100,000 infraredcameras worldwidefor applications
such as predictive maintenance, R & D, non-destructive testing, process control and
automation, and machine vision, among many others.
FLIR Systems has three manufacturing plants in the United States (Portland, OR,
Boston, MA, Santa Barbara, CA) and one in Sweden (Stockholm). Since 2007 there
is alsoa manufacturingplant in Tallinn, Estonia. Direct sales officesin Belgium,Brazil,
China, France, Germany, Great Britain, Hong Kong, Italy, Japan, Korea, Sweden, and
the USA—togetherwith a worldwide network of agents and distributors—support our
international customer base.
Publ. No. T559498 Rev. a461 – ENGLISH (EN) – August 19, 2010 51
Page 58

17 – About FLIR Systems
FLIR Systems is at the forefront of innovation in the infrared camera industry. We anticipate marketdemand by constantly improving our existing cameras and developing
new ones.The companyhas set milestones in product design and development such
as the introduction of the first battery-operated portable camera for industrial inspections, and the first uncooled infrared camera, to mention just two innovations.
FLIR Systems manufactures all vital mechanical and electronic components of the
camera systemsitself. From detector design and manufacturing, to lenses and system
electronics, to final testing and calibration, all production steps are carried out and
supervised by our own engineers. The in-depth expertise of these infrared specialists
ensures the accuracy and reliability of all vital components that are assembled into
your infrared camera.
17.1 More than just an infrared camera
At FLIR Systems we recognize that our job is to go beyond just producing the best
infrared camera systems. We are committed to enabling all users of our infrared
camera systems to work more productively by providing them with the most powerful
camera–software combination.Especially tailoredsoftware forpredictive maintenance,
R & D, and process monitoring is developed in-house. Most software is available in
a wide variety of languages.
We support all our infrared cameras with a wide variety of accessories to adapt your
equipment to the most demanding infrared applications.
17.2 Sharing our knowledge
Although our cameras are designed to be very user-friendly, there is a lot more to
thermography than just knowing how to handle a camera. Therefore, FLIR Systems
has founded the Infrared Training Center (ITC), a separate business unit, that provides
certified training courses. Attending one of the ITC courses will give you a truly handson learning experience.
The staff of the ITC are also there to provide you with any application support you
may need in putting infrared theory into practice.
17.3 Supporting our customers
FLIR Systems operates a worldwide service network to keep your camera running at
all times. If you discover a problem with your camera, local service centers have all
the equipment and expertise to solve it within the shortest possible time. Therefore,
there is no need to send your camera to the other side of the world or to talk to
someone who does not speak your language.
52 Publ. No. T559498 Rev. a461 – ENGLISH (EN) – August 19, 2010
Page 59

17 – About FLIR Systems
17.4 A few images from our facilities
10401303;a1
Figure 17.2 LEFT: Development of system electronics; RIGHT: Testing of an FPA detector
10401403;a1
Figure 17.3 LEFT: Diamond turning machine; RIGHT: Lens polishing
Publ. No. T559498 Rev. a461 – ENGLISH (EN) – August 19, 2010 53
Page 60

17 – About FLIR Systems
10401503;a1
Figure 17.4 LEFT: Testing of infrared cameras in the climatic chamber; RIGHT: Robot used for camera
testing and calibration
54 Publ. No. T559498 Rev. a461 – ENGLISH (EN) – August 19, 2010
Page 61

18 Glossary
ExplanationTerm or expression
absorption (absorption factor)
atmosphere
autoadjust
autopalette
blackbody
blackbody radiator
calculated atmospherictransmission
cavity radiator
color temperature
continuous adjust
The amount of radiation absorbed by an object relative to the
received radiation. A number between 0 and 1.
The gasesbetween the objectbeing measured andthe camera,
normally air.
A function making a camera perform an internal image correction.
The IR image isshown with anuneven spread ofcolors, displaying cold objects as well as hot ones at the same time.
Totally non-reflective object. All its radiation is due to its own
temperature.
An IR radiating equipment with blackbody properties used to
calibrate IR cameras.
A transmissionvalue computed fromthe temperature, therelative
humidity of air and the distance to the object.
A bottle shaped radiator with an absorbing inside, viewed
through the bottleneck.
The temperature for which the color of a blackbody matches a
specific color.
The process that makes heat diffuse into a material.conduction
A function that adjusts the image. The function works all the
time, continuouslyadjusting brightness andcontrast according
to the image content.
convection
emissivity (emissivity factor)
emittance
environment
estimated atmospheric transmission
Publ. No. T559498 Rev. a461 – ENGLISH (EN) – August 19, 2010 55
Convection is a heat transfer mode where a fluid is brought into
motion, either by gravity or another force, thereby transferring
heat from one place to another.
An isotherm with two color bands, instead of one.dual isotherm
The amount of radiation coming from an object, compared to
that of a blackbody. A number between 0 and 1.
Amount of energy emitted from an object per unit of time and
area (W/m2)
Objects and gases that emit radiation towards the object being
measured.
A transmissionvalue, supplied bya user, replacing a calculated
one
Page 62

18 – Glossary
ExplanationTerm or expression
external optics
FOV
graybody
IFOV
image correction(internal or external)
isotherm
isothermal cavity
Laser LocatIR
Extra lenses, filters, heat shields etc. that can be put between
the camera and the object being measured.
A material transparent onlyto some ofthe infrared wavelengths.filter
Field of view: The horizontal angle that can be viewed through
an IR lens.
Focal plane array: A type of IR detector.FPA
An object that emits a fixed fraction of the amount of energy of
a blackbody for each wavelength.
Instantaneous field of view: A measureof the geometrical resolution of an IR camera.
A way of compensatingfor sensitivity differencesin various parts
of live images and also of stabilizing the camera.
Non-visible radiation,having a wavelengthfrom about2–13 μm.infrared
infraredIR
A function highlighting those parts of an image that fall above,
below or between one or more temperature intervals.
A bottle-shaped radiator with a uniform temperature viewed
through the bottleneck.
An electrically powered light source on the camera that emits
laser radiation in a thin, concentrated beam to point at certain
parts of the object in front of the camera.
laser pointer
level
manual adjust
NETD
object parameters
object signal
An electrically powered light source on the camera that emits
laser radiation in a thin, concentrated beam to point at certain
parts of the object in front of the camera.
The center value of the temperature scale, usually expressed
as a signal value.
A wayto adjust theimageby manually changingcertainparameters.
Noise equivalenttemperature difference. Ameasureof theimage
noise level of an IR camera.
Undesired small disturbance in the infrared imagenoise
A set of values describing the circumstances under which the
measurement ofan object was made, andthe object itself(such
as emissivity, reflected apparent temperature, distance etc.)
A non-calibrated value related to the amount of radiation received by the camera from the object.
56 Publ. No. T559498 Rev. a461 – ENGLISH (EN) – August 19, 2010
Page 63

18 – Glossary
ExplanationTerm or expression
The set of colors used to display an IR image.palette
Stands for picture element. One single spot in an image.pixel
radiance
radiation
range
reference temperature
reflection
relative humidity
saturation color
span
Amount of energy emitted from an object per unit of time, area
and angle (W/m2/sr)
Amount of energy emitted from an object per unit of time (W)radiant power
The process by which electromagnetic energy, isemitted byan
object or a gas.
A piece of IR radiating equipment.radiator
The current overall temperature measurement limitation of an
IR camera. Cameras can have several ranges. Expressed as
two blackbody temperatures that limit the current calibration.
A temperature which the ordinary measured values can be
compared with.
The amount of radiation reflected by an object relative to the
received radiation. A number between 0 and 1.
Relative humidity represents theratio between thecurrent water
vapour mass in the airand the maximum it may contain in saturation conditions.
The areas that contain temperatures outside the present level/span settings are colored with the saturation colors. The saturation colors contain an ‘overflow’ color and an ‘underflow’
color. There is also a thirdred saturation colorthat marks everything saturated by the detectorindicating that the range should
probably be changed.
The interval of the temperature scale, usually expressed as a
signal value.
spectral (radiant) emittance
Amount of energy emitted from an object per unit of time, area
and wavelength (W/m2/μm)
temperature difference,or difference
of temperature.
temperature range
A valuewhich is theresult of a subtraction between twotemperature values.
The current overall temperature measurement limitation of an
IR camera. Cameras can have several ranges. Expressed as
two blackbody temperatures that limit the current calibration.
temperature scale
The way in whichan IR imagecurrently is displayed.Expressed
as two temperature values limiting the colors.
infrared imagethermogram
Publ. No. T559498 Rev. a461 – ENGLISH (EN) – August 19, 2010 57
Page 64

18 – Glossary
ExplanationTerm or expression
transmission (ortransmittance) factor
transparent isotherm
visual
Gases and materials can be more orless transparent. Transmission is the amount of IR radiation passing through them. A
number between 0 and 1.
An isothermshowing a linearspread of colors,instead of covering the highlighted parts of the image.
Refers to the video mode of a IR camera, as opposed to the
normal, thermographicmode. When a camera isin video mode
it captures ordinary video images, while thermographic images
are captured when the camera is in IR mode.
58 Publ. No. T559498 Rev. a461 – ENGLISH (EN) – August 19, 2010
Page 65

19 Thermographic measurement
techniques
19.1 Introduction
An infraredcamera measuresand imagesthe emitted infrared radiation from an object.
The fact that radiation is a function of object surface temperature makes it possible
for the camera to calculate and display this temperature.
However, the radiation measured by the camera does not only depend on the temperature of the object but is also a function of the emissivity. Radiation also originates
from the surroundings and is reflected in the object. The radiation from the object
and the reflected radiation will also be influenced by the absorptionof the atmosphere.
To measure temperature accurately, it is therefore necessary to compensate for the
effects of a number of different radiation sources. This is done on-line automatically
by the camera. The following object parameters must, however, be supplied for the
camera:
■ The emissivity of the object
■ The reflected apparent temperature
■ The distance between the object and the camera
■ The relative humidity
■ Temperature of the atmosphere
19.2 Emissivity
The most important object parameter to set correctly is the emissivity which, in short,
is a measure of how much radiation is emitted from the object, compared to that from
a perfect blackbody of the same temperature.
Normally, object materials and surface treatments exhibit emissivity ranging from
approximately 0.1 to 0.95. A highly polished (mirror) surface falls below 0.1, while an
oxidized or painted surface has a higher emissivity. Oil-based paint, regardless of
color in the visible spectrum, has an emissivity over 0.9 in the infrared. Human skin
exhibits an emissivity 0.97 to 0.98.
Non-oxidized metals represent an extreme case of perfect opacity and highreflexivity,
which does not vary greatly with wavelength. Consequently, the emissivity of metals
is low– onlyincreasing with temperature. For non-metals, emissivity tendsto behigh,
and decreases with temperature.
Publ. No. T559498 Rev. a461 – ENGLISH (EN) – August 19, 2010 59
Page 66

19 – Thermographic measurement techniques
19.2.1 Finding the emissivity of a sample
19.2.1.1 Step 1: Determining reflected apparent temperature
Use one of the following two methods to determine reflected apparent temperature:
19.2.1.1.1 Method 1: Direct method
Look for possible reflection sources, considering that the incident angle = reflection angle (a
1
= b).
10588903;a1
Figure 19.1 1 = Reflection source
If the reflection source is a spot source, modify the source by obstructing it using a piece if
2
cardboard.
10589103;a2
Figure 19.2 1 = Reflection source
60 Publ. No. T559498 Rev. a461 – ENGLISH (EN) – August 19, 2010
Page 67

19 – Thermographic measurement techniques
Measure the radiation intensity (= apparent temperature) from the reflecting source using the
3
following settings:
Emissivity: 1.0
■
D
: 0
■
obj
You can measure the radiation intensity using one of the following two methods:
10589003;a2
Figure 19.3 1 = Reflection source
Note: Using a thermocouple to measure reflected apparent temperature is not recom-
mended for two important reasons:
■ A thermocouple does not measure radiation intensity
■ A thermocouple requires a very good thermal contact to the surface, usually by
gluing and covering the sensor by a thermal isolator.
19.2.1.1.2 Method 2: Reflector method
Crumble up a large piece of aluminum foil.1
Uncrumble the aluminum foil and attach it to a piece of cardboard of the same size.2
Put the piece of cardboard in front of the object you want to measure. Make sure that the side
3
with aluminum foil points to the camera.
Set the emissivity to 1.0.4
Publ. No. T559498 Rev. a461 – ENGLISH (EN) – August 19, 2010 61
Page 68

19 – Thermographic measurement techniques
Measure the apparent temperature of the aluminum foil and write it down.
5
10727003;a2
Figure 19.4 Measuring the apparent temperature of the aluminum foil
19.2.1.2 Step 2: Determining the emissivity
Select a place to put the sample.1
Determine and set reflected apparent temperature according to the previous procedure.2
Put a piece of electrical tape with known high emissivity on the sample.3
Heat the sample at least 20 K above room temperature. Heating must be reasonably even.4
Focus and auto-adjust the camera, and freeze the image.5
Adjust Level and Span for best image brightness and contrast.6
Set emissivity to that of the tape (usually 0.97).7
Measure the temperature of the tape using one of the following measurement functions:
8
Isotherm (helps you to determine both the temperature and how evenly you have heated
■
the sample)
Spot (simpler)
■
Box Avg (good for surfaces with varying emissivity).
■
Write down the temperature.9
Move your measurement function to the sample surface.10
Change the emissivity setting until you read the same temperature as your previous measure-
11
ment.
Write down the emissivity.12
Note:
62 Publ. No. T559498 Rev. a461 – ENGLISH (EN) – August 19, 2010
Page 69

19 – Thermographic measurement techniques
■ Avoid forced convection
■ Look for a thermally stable surrounding that will not generate spot reflections
■ Use high quality tape that you know is not transparent, and has a high emissivity
you are certain of
■ This method assumes that the temperature of your tape and the sample surface
are the same. If they are not, your emissivity measurement will be wrong.
19.3 Reflected apparent temperature
This parameter is used to compensate for the radiation reflected in the object. If the
emissivity is low and the object temperature relatively far from that of the reflected it
will be important to set and compensate for the reflected apparent temperature correctly.
19.4 Distance
The distance is the distance between the object and the front lens of the camera.This
parameter is used to compensate for the following two facts:
■ That radiation from the target is absorbed by the athmosphere between the object
and the camera.
■ That radiation from the atmosphere itself is detected by the camera.
19.5 Relative humidity
The camera can also compensate for the fact that the transmittance is also dependent
on the relative humidity of the atmosphere. To do this set the relative humidity to the
correct value. For short distances and normal humidity the relative humidity can normally be left at a default value of 50%.
19.6 Other parameters
In addition, some cameras and analysis programs from FLIR Systems allow you to
compensate for the following parameters:
■ Atmospheric temperature – i.e. the temperature of the atmosphere between the
camera and the target
■ External optics temperature – i.e. the temperature of any external lensesor windows
used in front of the camera
■ External optics transmittance – i.e. the transmission of any external lenses or win-
dows used in front of the camera
Publ. No. T559498 Rev. a461 – ENGLISH (EN) – August 19, 2010 63
Page 70

20 History of infrared technology
Before the year 1800, the existence of the infrared portion of the electromagnetic
spectrum wasn't even suspected. The original significance of the infrared spectrum,
or simply ‘the infrared’ as it is often called, as a form of heat radiation is perhaps less
obvious today than it was at the time of its discovery by Herschel in 1800.
10398703;a1
Figure 20.1 Sir William Herschel (1738–1822)
The discovery was made accidentally during the search for a new optical material.
Sir William Herschel – Royal Astronomer to King George III of England, and already
famous for his discovery of the planet Uranus – was searching for an optical filter
material to reduce the brightness of the sun’s image in telescopes during solar observations. While testing different samples of colored glass which gave similar reductions
in brightness he was intrigued to find that some of the samples passed very little of
the sun’s heat, while others passed so much heat that he risked eye damage after
only a few seconds’ observation.
Herschel was soon convinced of the necessity of setting up a systematic experiment,
with the objective of finding a single material that would give the desired reduction in
brightness as well as the maximum reduction in heat. He began the experiment by
actually repeating Newton’s prism experiment, but looking for the heating effect rather
than the visual distribution of intensity in the spectrum. He first blackened the bulb of
a sensitive mercury-in-glass thermometer with ink, and with this as his radiation detector he proceeded to test the heating effect of the various colors of the spectrum
formed on the top of a table by passing sunlight through a glass prism. Other thermometers, placed outside the sun’s rays, served as controls.
As the blackened thermometer was moved slowly along the colors of the spectrum,
the temperature readings showed a steady increase from the violet end to the red
end. This was not entirely unexpected, since the Italian researcher, Landriani, in a
similar experiment in 1777 had observed much the same effect. It was Herschel,
64 Publ. No. T559498 Rev. a461 – ENGLISH (EN) – August 19, 2010
Page 71

20 – History of infrared technology
however, who was the first to recognize that there must be a point where the heating
effect reaches a maximum, and that measurements confined to the visible portion of
the spectrum failed to locate this point.
10398903;a1
Figure 20.2 Marsilio Landriani (1746–1815)
Moving the thermometer into the dark region beyond the red end of the spectrum,
Herschel confirmedthat the heating continued to increase. The maximum point, when
he found it, lay well beyond the red end – in what is known today as the ‘infrared
wavelengths’.
When Herschel revealed his discovery, he referred to this new portion of the electromagnetic spectrumas the‘thermometrical spectrum’.The radiationitself hesometimes
referred to as ‘dark heat’, or simply ‘the invisible rays’. Ironically, and contrary to
popular opinion, it wasn't Herschel who originated the term ‘infrared’. The word only
began to appear in print around 75 years later, and it is still unclear who shouldreceive
credit as the originator.
Herschel’s use of glass in the prism of his original experiment led to some early
controversies with his contemporaries about the actual existence of the infrared
wavelengths. Different investigators, in attempting to confirm his work, used various
types of glass indiscriminately, having different transparencies in theinfrared. Through
his later experiments, Herschel was aware of the limited transparency of glass to the
newly-discovered thermal radiation, and he was forced to conclude that optics for
the infrared would probably be doomed to the use of reflective elements exclusively
(i.e. plane and curved mirrors). Fortunately, this proved to be true only until 1830,
when the Italian investigator, Melloni, made his great discovery that naturallyoccurring
rock salt (NaCl) – which was available in large enough natural crystals to be made
into lenses and prisms – is remarkably transparent to the infrared. The result was that
rock salt became the principal infrared optical material, and remained so for the next
hundred years, until the art of synthetic crystal growing was mastered in the 1930’s.
Publ. No. T559498 Rev. a461 – ENGLISH (EN) – August 19, 2010 65
Page 72

20 – History of infrared technology
10399103;a1
Figure 20.3 Macedonio Melloni (1798–1854)
Thermometers, as radiation detectors, remained unchallenged until 1829, the year
Nobili invented the thermocouple. (Herschel’s own thermometer could be read to
0.2 °C (0.036 °F), and later models were able to be read to 0.05 °C (0.09 °F)). Then
a breakthrough occurred; Melloni connected a number of thermocouples in series
to form the first thermopile. The new device was at least 40 times as sensitive as the
best thermometer of the day for detecting heat radiation – capable of detecting the
heat from a person standing three meters away.
The first so-called ‘heat-picture’ became possible in 1840, the result of work by Sir
John Herschel, son of the discoverer of the infrared and a famous astronomer in his
own right. Based upon the differential evaporation of a thin film of oil when exposed
to a heat pattern focused upon it, the thermal image could be seen by reflected light
where the interference effects of the oil film made the image visible to the eye. Sir
John also managed to obtain a primitive record of the thermal image on paper, which
he called a ‘thermograph’.
10399003;a2
Figure 20.4 Samuel P. Langley (1834–1906)
66 Publ. No. T559498 Rev. a461 – ENGLISH (EN) – August 19, 2010
Page 73

20 – History of infrared technology
The improvement of infrared-detector sensitivity progressed slowly. Another major
breakthrough, made by Langley in 1880, was the invention of the bolometer. This
consisted ofa thinblackened strip of platinumconnected in one arm of a Wheatstone
bridge circuit upon which the infrared radiation was focused and to which a sensitive
galvanometer responded. This instrument is said to have been able to detect the heat
from a cow at a distance of 400 meters.
An English scientist, Sir James Dewar, first introduced the use of liquefied gases as
cooling agents (such as liquid nitrogen with a temperature of -196 °C (-320.8 °F)) in
low temperature research. In 1892 he invented a unique vacuum insulating container
in which it is possible to store liquefied gases for entire days. The common ‘thermos
bottle’, used for storing hot and cold drinks, is based upon his invention.
Between the years 1900 and 1920, the inventors of the world‘discovered’ the infrared.
Many patents were issued for devices to detect personnel, artillery, aircraft, ships –
and even icebergs. The first operating systems, in the modern sense, began to be
developed duringthe 1914–18war, whenboth sideshad researchprograms devoted
to the military exploitation of the infrared. These programs included experimental
systems for enemy intrusion/detection, remote temperature sensing, secure communications, and ‘flying torpedo’ guidance. An infrared search system tested during this
period was able to detect an approaching airplane at a distanceof 1.5 km (0.94 miles),
or a person more than 300 meters (984 ft.) away.
The most sensitive systems up to this time were all based upon variations of the
bolometer idea, but the period between the two wars saw the development of two
revolutionary new infrared detectors: the image converter and the photon detector.
At first, the image converter received the greatest attention by the military, because
it enabled an observer for the first time in history to literally ‘see in the dark’. However,
the sensitivity of the image converter was limited to the near infrared wavelengths,
and the most interesting military targets (i.e. enemy soldiers) had to be illuminated
by infrared search beams. Since this involved the risk of giving away the observer’s
position to a similarly-equipped enemy observer, it is understandable that military
interest in the image converter eventually faded.
The tactical military disadvantages of so-called 'active’ (i.e. search beam-equipped)
thermal imaging systems provided impetus following the 1939–45 war for extensive
secret military infrared-research programs into the possibilities of developing ‘passive’
(no search beam) systems around the extremely sensitive photon detector. During
this period, military secrecy regulations completely prevented disclosure of the status
of infrared-imaging technology. This secrecy only began to be lifted in the middle of
the 1950’s, and from that time adequate thermal-imaging devices finally began to be
available to civilian science and industry.
Publ. No. T559498 Rev. a461 – ENGLISH (EN) – August 19, 2010 67
Page 74

21 Theory of thermography
21.1 Introduction
The subjects of infrared radiation and the related technique of thermography are still
new to many who will use an infrared camera. In this section the theory behind thermography will be given.
21.2 The electromagnetic spectrum
The electromagnetic spectrum is divided arbitrarily into a number of wavelength regions, called bands, distinguished by the methods used to produce and detect the
radiation. Thereis no fundamental difference between radiation in the different bands
of the electromagnetic spectrum. They are all governed by the same laws and the
only differences are those due to differences in wavelength.
10067803;a1
Figure 21.1 The electromagnetic spectrum.1: X-ray; 2: UV; 3: Visible; 4: IR; 5: Microwaves; 6: Radiowaves.
Thermography makes use of the infrared spectral band. At the short-wavelength end
the boundary lies at the limit of visual perception, in the deep red. At the long-wavelength end it merges with the microwave radio wavelengths, in the millimeter range.
The infrared band is often further subdivided into four smaller bands, the boundaries
of which are also arbitrarily chosen. They include: the near infrared (0.75–3 μm), the
middle infrared (3–6 μm), the far infrared (6–15 μm) and the extreme infrared (15–100
68 Publ. No. T559498 Rev. a461 – ENGLISH (EN) – August 19, 2010
Page 75

21 – Theory of thermography
μm). Although the wavelengths are given in μm (micrometers), other units are often
still used to measure wavelength in this spectral region, e.g. nanometer (nm) and
Ångström (Å).
The relationships between the different wavelength measurements is:
21.3 Blackbody radiation
A blackbody is defined as an object which absorbs all radiation that impinges on it
at any wavelength. The apparent misnomer black relating to an object emitting radiation isexplained by Kirchhoff’s Law (after Gustav Robert Kirchhoff, 1824–1887), which
states that a body capable of absorbing all radiation at any wavelength is equally
capable in the emission of radiation.
10398803;a1
Figure 21.2 Gustav Robert Kirchhoff (1824–1887)
The construction of a blackbody source is, in principle, very simple. The radiation
characteristics of an aperture in an isotherm cavity made of an opaque absorbing
material representsalmost exactly the properties of a blackbody. A practical application
of the principle to the construction of a perfect absorber of radiation consists of a box
that is light tight except for an aperture in one of the sides. Any radiation which then
enters the hole is scattered and absorbed by repeatedreflections so only an infinitesimal fraction can possibly escape. The blackness which is obtained at the aperture
is nearly equal to a blackbody and almost perfect for all wavelengths.
By providing such an isothermal cavity with a suitable heater it becomes what is
termed a cavity radiator. An isothermal cavity heated to a uniform temperature generates blackbody radiation, the characteristics of which are determined solely by the
temperature of the cavity. Such cavity radiators are commonly used as sources of
radiation in temperature reference standards in the laboratory for calibrating thermographic instruments, such as a FLIR Systems camera for example.
Publ. No. T559498 Rev. a461 – ENGLISH (EN) – August 19, 2010 69
Page 76

21 – Theory of thermography
If the temperature of blackbody radiation increases to more than 525°C (977°F), the
source begins to be visible so that it appears to the eye no longer black. This is the
incipient red heat temperature of the radiator, which then becomes orange or yellow
as the temperature increases further. In fact, the definition of the so-called color
temperature of an object is the temperature to which a blackbody would have to be
heated to have the same appearance.
Now consider three expressions that describe the radiation emitted from a blackbody.
21.3.1 Planck’s law
10399203;a1
Figure 21.3 Max Planck (1858–1947)
Max Planck (1858–1947) wasable todescribe the spectral distribution of the radiation
from a blackbody by means of the following formula:
where:
λb
Blackbody spectral radiant emittance at wavelength λ.W
Velocity of light = 3 × 10⁸m/sc
Planck’s constant = 6.6 × 10
Boltzmann’s constant = 1.4 × 10
Absolute temperature (K) of a blackbody.T
Wavelength (μm).λ
-34
Joule sec.h
-23
Joule/K.k
70 Publ. No. T559498 Rev. a461 – ENGLISH (EN) – August 19, 2010
Page 77

21 – Theory of thermography
➲ The factor 10-6is used since spectral emittance in the curves is expressed in
Watt/m2, μm.
Planck’s formula, when plotted graphically for various temperatures, produces a
family of curves. Following any particular Planck curve, the spectral emittance is zero
at λ = 0, then increases rapidly to amaximum at a wavelength λ
and after passing
max
it approaches zero again at very long wavelengths. The higher the temperature, the
shorter the wavelength at which maximum occurs.
10327103;a4
Figure 21.4 Blackbody spectral radiant emittance according to Planck’s law, plotted for various absolute
temperatures. 1: Spectral radiant emittance (W/cm2× 103(μm)); 2: Wavelength (μm)
21.3.2 Wien’s displacement law
By differentiating Planck’s formula with respect to λ, and finding the maximum, we
have:
This is Wien’s formula (after Wilhelm Wien, 1864–1928), which expresses mathematically the common observation that colors vary from red to orange or yellow as the
temperature of a thermal radiator increases. The wavelength of the color is the same
as the wavelength calculated for λ
. A good approximation of the value of λ
max
max
for
a given blackbody temperature is obtained by applying the rule-of-thumb 3 000/T
Publ. No. T559498 Rev. a461 – ENGLISH (EN) – August 19, 2010 71
Page 78

21 – Theory of thermography
μm. Thus, a very hot star such as Sirius (11 000 K), emitting bluish-white light, radiates
with the peak of spectral radiant emittance occurring within the invisible ultraviolet
spectrum, at wavelength 0.27 μm.
10399403;a1
Figure 21.5 Wilhelm Wien (1864–1928)
The sun (approx. 6 000 K) emits yellow light, peaking at about 0.5 μm in the middle
of the visible light spectrum.
At room temperature (300 K) the peak of radiant emittance lies at 9.7 μm, in the far
infrared, while at the temperature of liquid nitrogen (77 K) the maximum of the almost
insignificant amount of radiant emittance occurs at 38 μm, in the extreme infrared
wavelengths.
72 Publ. No. T559498 Rev. a461 – ENGLISH (EN) – August 19, 2010
Page 79

21 – Theory of thermography
10327203;a4
Figure 21.6 Planckian curves plotted on semi-logscales from 100 K to 1000 K. The dottedline represents
the locus of maximum radiant emittance at each temperature as described by Wien's displacement law.
1: Spectral radiant emittance (W/cm2(μm)); 2: Wavelength (μm).
21.3.3 Stefan-Boltzmann's law
By integrating Planck’s formula from λ = 0 to λ = ∞, we obtain the total radiant
emittance (Wb) of a blackbody:
This is the Stefan-Boltzmann formula (after Josef Stefan, 1835–1893, and Ludwig
Boltzmann, 1844–1906), which states that the total emissive power of a blackbody is
proportional tothe fourth power of its absolute temperature. Graphically, Wbrepresents
the area below the Planck curve for a particular temperature. It can be shown that the
radiant emittance in the interval λ = 0 to λ
is only 25% of the total, which represents
max
about the amount of the sun’s radiation which lies inside the visible light spectrum.
Publ. No. T559498 Rev. a461 – ENGLISH (EN) – August 19, 2010 73
Page 80

21 – Theory of thermography
10399303;a1
Figure 21.7 Josef Stefan (1835–1893), and Ludwig Boltzmann (1844–1906)
Using the Stefan-Boltzmann formula to calculate the power radiated by the human
body, at a temperature of 300 K and an external surface area of approx. 2 m2, we
obtain 1 kW.This power loss could not be sustained if it were notfor the compensating
absorption of radiation from surrounding surfaces, at room temperatures which do
not vary too drastically from the temperature of the body – or, of course, the addition
of clothing.
21.3.4 Non-blackbody emitters
So far, only blackbody radiators and blackbody radiation have been discussed.
However, real objects almost never comply with these laws over an extended wavelength region – although they may approach the blackbody behavior in certain
spectral intervals. For example, a certain type of white paint may appear perfectly
white in the visible light spectrum, but becomes distinctly gray at about 2 μm, and
beyond 3 μm it is almost black.
There are three processes which can occur that prevent a real object from acting like
a blackbody: a fraction of the incident radiation α may be absorbed, a fraction ρ may
be reflected, and a fraction τ may be transmitted. Since all of these factors are more
or less wavelength dependent, the subscript λ is used to imply the spectral dependence of their definitions. Thus:
■ The spectral absorptance α
= the ratio of the spectral radiant power absorbed by
λ
an object to that incident upon it.
■ The spectral reflectance ρ
= the ratio of the spectral radiant power reflected by
λ
an object to that incident upon it.
■ The spectral transmittance τ
= the ratio of the spectral radiant power transmitted
λ
through an object to that incident upon it.
The sum of these three factors must always add up to the whole at any wavelength,
so we have the relation:
74 Publ. No. T559498 Rev. a461 – ENGLISH (EN) – August 19, 2010
Page 81

21 – Theory of thermography
For opaque materials τλ= 0 and the relation simplifies to:
Another factor, called the emissivity, is required to describe the fraction ε of the radiant
emittance of a blackbody produced by an object at a specific temperature. Thus, we
have the definition:
The spectral emissivity ελ= the ratio of the spectral radiant power from an object to
that from a blackbody at the same temperature and wavelength.
Expressed mathematically, this can be written as the ratio of the spectral emittance
of the object to that of a blackbody as follows:
Generally speaking, there are three types of radiation source, distinguished by the
ways in which the spectral emittance of each varies with wavelength.
■ A blackbody, for which ε
■ A graybody, for which ε
■ A selective radiator, for which ε varies with wavelength
= ε = 1
λ
= ε = constant less than 1
λ
According to Kirchhoff’s law, for any material the spectral emissivity and spectral absorptance of a body are equal at any specified temperature and wavelength. That is:
From this we obtain, for an opaque material (since αλ+ ρλ= 1):
For highly polished materials ελapproaches zero, so that for a perfectly reflecting
material (i.e. a perfect mirror) we have:
For a graybody radiator, the Stefan-Boltzmann formula becomes:
This states that the total emissive power of a graybody is the same as a blackbody
at the same temperature reduced in proportion to the value of ε from the graybody.
Publ. No. T559498 Rev. a461 – ENGLISH (EN) – August 19, 2010 75
Page 82

21 – Theory of thermography
10401203;a2
Figure 21.8 Spectral radiant emittance of three types of radiators. 1: Spectral radiant emittance; 2:
Wavelength; 3: Blackbody; 4: Selective radiator; 5: Graybody.
10327303;a4
Figure 21.9 Spectral emissivity of three types of radiators. 1: Spectral emissivity; 2: Wavelength; 3:
Blackbody; 4: Graybody; 5: Selective radiator.
21.4 Infrared semi-transparent materials
Consider nowa non-metallic,semi-transparent body – let us say, in the form of a thick
flat plate of plastic material. When the plate is heated, radiation generated within its
volume must work its way toward the surfaces through the material in which it is
partially absorbed. Moreover, when it arrives at the surface, some of it is reflected
back into the interior. The back-reflected radiation is again partially absorbed, but
76 Publ. No. T559498 Rev. a461 – ENGLISH (EN) – August 19, 2010
Page 83

21 – Theory of thermography
some of it arrives at the other surface, through which most of it escapes; part of it is
reflected back again. Although the progressive reflections become weaker and
weaker they must all be added up when the total emittance of the plate is sought.
When the resulting geometrical series is summed, the effective emissivity of a semitransparent plate is obtained as:
When the plate becomes opaque this formula is reduced to the single formula:
This last relation is a particularly convenient one, because it is often easier to measure
reflectance than to measure emissivity directly.
Publ. No. T559498 Rev. a461 – ENGLISH (EN) – August 19, 2010 77
Page 84

22 The measurement formula
As already mentioned, when viewing an object, the camera receives radiation not
only from the object itself. It also collects radiation from the surroundings reflected
via theobject surface.Both these radiation contributions become attenuated to some
extent by the atmosphere in the measurement path. To this comes a third radiation
contribution from the atmosphere itself.
This description of the measurement situation, as illustrated in the figure below, is so
far a fairly true description of the real conditions. What has been neglected could for
instance be sun light scattering in the atmosphere or stray radiation from intense radiation sources outside the field of view. Such disturbances are difficult to quantify,
however, in most cases they are fortunately small enough to be neglected. In case
they are not negligible, the measurement configuration is likely to be such that the
risk for disturbance is obvious, at least to a trained operator. It is then his responsibility to modify the measurement situation to avoid the disturbance e.g. by changing
the viewing direction, shielding off intense radiation sources etc.
Accepting the description above, we can use the figure below to derive a formula for
the calculation of the object temperature from the calibrated camera output.
10400503;a1
Figure 22.1 A schematic representationof the generalthermographic measurement situation.1: Surroundings; 2: Object; 3: Atmosphere; 4: Camera
Assume thatthe received radiation power W from a blackbody source of temperature
T
on short distance generates a camera output signal U
source
that is proportional
source
to the power input (power linear camera). We can then write (Equation 1):
78 Publ. No. T559498 Rev. a461 – ENGLISH (EN) – August 19, 2010
Page 85

22 – The measurement formula
or, with simplified notation:
where C is a constant.
Should the source be a graybody with emittance ε, the received radiation would
consequently be εW
source
.
We are now ready to write the three collected radiation power terms:
1 – Emission from the object = ετW
is the transmittance of the atmosphere. The object temperature is T
2 – Reflected emission from ambient sources = (1 – ε)τW
flectance of the object. The ambient sources have the temperature T
It has here been assumed that the temperature T
, where ε is the emittance of the object and τ
obj
.
obj
, where (1 – ε) is the re-
refl
.
refl
is the same for all emitting surfaces
refl
within the halfsphere seen from a point on the object surface. This is of course
sometimes a simplification of the true situation. It is, however, anecessary simplification
in order to derive a workable formula, and T
can – at least theoretically – be given
refl
a value that represents an efficient temperature of a complex surrounding.
Note also that we have assumed that the emittance for the surroundings = 1. This is
correct inaccordance withKirchhoff’s law: All radiation impinging on the surrounding
surfaces will eventually be absorbed by the same surfaces. Thus the emittance = 1.
(Note thoughthat the latest discussion requires the complete sphere around the object
to be considered.)
3 – Emission from the atmosphere = (1 – τ)τW
the atmosphere. The temperature of the atmosphere is T
, where (1 – τ) is the emittance of
atm
.
atm
The total received radiation power can now be written (Equation 2):
We multiply each term by the constant C of Equation 1 and replace the CW products
by the corresponding U according to the same equation, and get (Equation 3):
Solve Equation 3 for U
Publ. No. T559498 Rev. a461 – ENGLISH (EN) – August 19, 2010 79
(Equation 4):
obj
Page 86

22 – The measurement formula
This is the general measurement formula used in all the FLIR Systems thermographic
equipment. The voltages of the formula are:
Figure 22.2 Voltages
U
obj
Calculated camera output voltage for a blackbody of temperature
T
i.e. a voltage that can be directly converted into true requested
obj
object temperature.
tot
U
refl
U
atm
Measured camera output voltage for the actual case.U
Theoretical camera output voltage for a blackbody of temperature
T
according to the calibration.
refl
Theoretical camera output voltage for a blackbody of temperature
T
according to the calibration.
atm
The operator has to supply a number of parameter values for the calculation:
■ the object emittance ε,
■ the relative humidity,
■ T
atm
■ object distance (D
■ the (effective) temperature of the object surroundings, or the reflected ambient
temperature T
■ the temperature of the atmosphere T
refl
obj
, and
)
atm
This task could sometimes be a heavy burden for the operator since there are normally
no easy ways to find accurate values of emittance and atmospheric transmittance for
the actual case. The two temperatures are normally less of a problem provided the
surroundings do not contain large and intense radiation sources.
A natural question in this connection is: How important is it to know the right values
of these parameters? It could though be of interest to get a feeling for this problem
already here by looking into some different measurement cases and compare the
relative magnitudes of the three radiation terms. This will give indications about when
it is important to use correct values of which parameters.
The figures below illustrates the relative magnitudes of the three radiation contributions
for three different object temperatures, two emittances, and two spectral ranges: SW
and LW. Remaining parameters have the following fixed values:
■ τ = 0.88
■ T
= +20°C (+68°F)
refl
■ T
= +20°C (+68°F)
atm
80 Publ. No. T559498 Rev. a461 – ENGLISH (EN) – August 19, 2010
Page 87

22 – The measurement formula
It is obvious that measurement of low object temperatures are more critical than
measuring high temperatures since the ‘disturbing’ radiation sources are relatively
much stronger in the first case. Should also the object emittance be low, the situation
would be still more difficult.
We have finally to answer a question about the importance of being allowed to use
the calibration curve above the highest calibration point, what we call extrapolation.
Imagine that we in a certain case measure U
= 4.5 volts. The highest calibration
tot
point for the camera was in the order of 4.1 volts, a value unknown to the operator.
Thus, even if the object happened to be a blackbody, i.e. U
obj
= U
, we are actually
tot
performing extrapolation of the calibration curve when converting 4.5 volts into temperature.
Let us now assume that the object is not black, it has an emittance of 0.75, and the
transmittance is0.92. We also assume that the two second terms of Equation 4 amount
to 0.5 volts together. Computation of U
by means of Equation 4 then results in U
obj
obj
= 4.5/ 0.75/ 0.92– 0.5= 6.0.This isa ratherextreme extrapolation,particularly when
considering that the video amplifier might limit the output to 5 volts! Note, though,
that the application of the calibration curve is a theoretical procedure where no electronic or other limitations exist. We trust that if there had been no signal limitations in
the camera, and if it had been calibrated far beyond 5 volts, the resulting curve would
have been very much the same as our real curve extrapolated beyond 4.1 volts, provided the calibration algorithm is based on radiation physics, like the FLIR Systems
algorithm. Of course there must be a limit to such extrapolations.
Publ. No. T559498 Rev. a461 – ENGLISH (EN) – August 19, 2010 81
Page 88

22 – The measurement formula
10400603;a2
Figure 22.3 Relative magnitudes of radiationsources under varyingmeasurement conditions (SWcamera).
1: Object temperature; 2: Emittance; Obj: Object radiation; Refl: Reflected radiation; Atm: atmosphere
radiation. Fixed parameters: τ = 0.88; T
= 20°C (+68°F); T
refl
= 20°C (+68°F).
atm
82 Publ. No. T559498 Rev. a461 – ENGLISH (EN) – August 19, 2010
Page 89

22 – The measurement formula
10400703;a2
Figure 22.4 Relative magnitudes of radiationsources under varyingmeasurement conditions (LW camera).
1: Object temperature; 2: Emittance; Obj: Object radiation; Refl: Reflected radiation; Atm: atmosphere
radiation. Fixed parameters: τ = 0.88; T
= 20°C (+68°F); T
refl
= 20°C (+68°F).
atm
Publ. No. T559498 Rev. a461 – ENGLISH (EN) – August 19, 2010 83
Page 90

23 Emissivity tables
This section presents a compilation of emissivity data from the infrared literature and
measurements made by FLIR Systems.
23.1 References
1
2
3
4
5
6
7
8
9
10
Mikaél A. Bramson: Infrared Radiation, A Handbook for Applications, Plenum press,
N.Y.
William L. Wolfe, George J. Zissis: The Infrared Handbook, Office of Naval Research,
Department of Navy, Washington, D.C.
Madding, R.P.: Thermographic Instruments and systems. Madison, Wisconsin:University of Wisconsin – Extension, Department of Engineering and Applied Science.
William L. Wolfe: Handbook of Military Infrared Technology, Office of Naval Research,
Department of Navy, Washington, D.C.
Jones, Smith, Probert: External thermography of buildings..., Proc. of the Society of
Photo-Optical Instrumentation Engineers, vol.110, Industrial and Civil Applications of
Infrared Technology, June 1977 London.
Paljak, Pettersson: Thermography of Buildings, Swedish Building Research Institute,
Stockholm 1972.
Vlcek, J: Determination of emissivity with imaging radiometers and some emissivities
at λ = 5 µm. Photogrammetric Engineering and Remote Sensing.
Kern: Evaluation of infrared emission of clouds and ground as measured by weather
satellites, Defence Documentation Center, AD 617 417.
Öhman, Claes:Emittansmätningar med AGEMA E-Box. Tekniskrapport,AGEMA 1999.
(Emittance measurements using AGEMA E-Box. Technical report, AGEMA 1999.)
Matteï, S., Tang-Kwor, E: Emissivity measurements for Nextel Velvet coating 811-21
between –36°C AND 82°C.
Lohrengel & Todtenhaupt (1996)11
ITC Technical publication 32.12
ITC Technical publication 29.13
23.2 Important note about the emissivity tables
The emissivity values in the table below are recorded using a shortwave (SW) camera.
The values should be regarded as recommendations only and used with caution.
84 Publ. No. T559498 Rev. a461 – ENGLISH (EN) – August 19, 2010
Page 91

23 – Emissivity tables
23.3 Tables
Figure 23.1 T: Total spectrum; SW: 2–5 µm; LW: 8–14 µm, LLW: 6.5–20 µm; 1: Material; 2: Specification;
3: Temperature in °C; 4: Spectrum; 5: Emissivity: 6: Reference
654321
3M type 35
3M type 88
3M type 88
3M type Super
33+
Aluminum
Aluminum
Aluminum
Aluminum
13Ca. 0.96LW< 80Vinyl electrical
tape (several colors)
13Ca. 0.96LW< 105Black vinyl electrical tape
13< 0.96MW< 105Black vinyl electrical tape
13Ca. 0.96LW< 80Black vinyl electrical tape
90.95LW70anodized, black,
dull
90.67SW70anodized, black,
dull
90.97LW70anodized, light
gray, dull
90.61SW70anodized, light
gray, dull
20.55T100anodized sheetAluminum
40.09T100as received, plateAluminum
20.09T100as received, sheetAluminum
90.46LW70cast, blast cleanedAluminum
90.47SW70cast, blast cleanedAluminum
Aluminum
plate
Publ. No. T559498 Rev. a461 – ENGLISH (EN) – August 19, 2010 85
40.05T100dipped in HNO3,
30.093 µm27foilAluminum
30.0410 µm27foilAluminum
10.2–0.3T50–500oxidized, stronglyAluminum
10.04–0.06T50–100polishedAluminum
20.05T100polished, sheetAluminum
40.05T100polished plateAluminum
Page 92

23 – Emissivity tables
654321
30.283 µm27roughenedAluminum
30.1810 µm27roughenedAluminum
10.06–0.07T20–50rough surfaceAluminum
Aluminum
Aluminum
ide
Aluminum oxide
90.03–0.06LW70sheet, 4 samples
differently
scratched
90.05–0.08SW70sheet, 4 samples
differently
scratched
20.04T20vacuum depositedAluminum
50.83–0.94SW17weathered, heavilyAluminum
10.60T20Aluminum bronze
10.28TpowderAluminum hydrox-
10.46Tactivated, powderAluminum oxide
10.16Tpure, powder(alumina)
10.96T20boardAsbestos
10.78TfabricAsbestos
70.94SW35floor tileAsbestos
10.93–0.95T40–400paperAsbestos
10.40–0.60TpowderAsbestos
10.96T20slateAsbestos
80.967LLW4Asphalt paving
10.22T20–350dull, tarnishedBrass
90.04–0.09SW70oxidizedBrass
90.03–0.07LW70oxidizedBrass
20.61T100oxidizedBrass
10.59–0.61T200–600oxidized at 600°CBrass
10.03T200polishedBrass
20.03T100polished, highlyBrass
86 Publ. No. T559498 Rev. a461 – ENGLISH (EN) – August 19, 2010
Page 93

23 – Emissivity tables
654321
Brass
Brass
Brick
Brick
Brick
Brick
20.20T20rubbed with 80grit emery
10.06T20sheet, rolledBrass
10.2T20sheet, worked with
emery
50.68SW17aluminaBrick
50.86–0.81SW17commonBrick
10.85T1100Dinas silica,
glazed, rough
10.66T1000Dinas silica, refractory
10.80T1000Dinas silica,
unglazed, rough
50.68SW17firebrickBrick
10.85T20fireclayBrick
10.75T1000fireclayBrick
10.59T1200fireclayBrick
70.94SW35masonryBrick
10.94T20masonry, plastered
20.93T20red, commonBrick
10.88–0.93T20red, roughBrick
Brick
10.46T1000refractory, corundum
Brick
10.38T1000–1300refractory, magnesite
Brick
10.8–0.9T500–1000refractory, strongly
radiating
Brick
10.65–0.75T500–1000refractory, weakly
radiating
Brick
2
Brick
SiO2, 64% Al2O
Publ. No. T559498 Rev. a461 – ENGLISH (EN) – August 19, 2010 87
3
10.66T1230silica, 95% SiO
10.29T1500sillimanite, 33%
Page 94

23 – Emissivity tables
654321
50.87SW17waterproofBrick
90.06LW70phosphor bronzeBronze
90.08SW70phosphor bronzeBronze
10.1T50polishedBronze
10.55T50–150porous, roughBronze
10.76–0.80TpowderBronze
20.95T20candle sootCarbon
10.96Tcharcoal powderCarbon
Carbon
Copper
Copper
Copper
20.98T20graphite, filed surface
10.97Tgraphite powderCarbon
10.95–0.97T20–400lampblackCarbon
60.90SW20untreatedChipboard
10.10T50polishedChromium
10.28–0.38T500–1000polishedChromium
10.91T70firedClay
10.98T20blackCloth
20.92T20Concrete
70.95SW36dryConcrete
50.97SW17roughConcrete
80.974LLW5walkwayConcrete
10.07T20commercial, burnished
10.018T80electrolytic, carefully polished
40.006T–34electrolytic, polished
10.13–0.15T1100–1300moltenCopper
10.6–0.7T50oxidizedCopper
40.78T27oxidized, blackCopper
88 Publ. No. T559498 Rev. a461 – ENGLISH (EN) – August 19, 2010
Page 95

23 – Emissivity tables
654321
20.78T20oxidized, heavilyCopper
Copper
Copper
Copper
Copper
10.88Toxidized to blackness
10.02T50–100polishedCopper
20.03T100polishedCopper
40.03T27polished, commercial
40.015T22polished, mechanical
40.008T22pure, carefully
prepared surface
40.07T27scrapedCopper
10.84TpowderCopper dioxide
10.70Tred, powderCopper oxide
10.89TEbonite
10.85T80coarseEmery
10.9T20Enamel
10.85–0.95T20lacquerEnamel
60.85SW20hard, untreatedFiber board
90.88LW70masoniteFiber board
90.75SW70masoniteFiber board
90.89LW70particle boardFiber board
90.77SW70particle boardFiber board
60.85SW20porous, untreatedFiber board
10.018T130polishedGold
10.02–0.03T200–600polished, carefullyGold
20.02T100polished, highlyGold
80.849LLW20polishedGranite
80.879LLW21roughGranite
Granite
90.77–0.87LW70rough, 4 different
samples
Publ. No. T559498 Rev. a461 – ENGLISH (EN) – August 19, 2010 89
Page 96

23 – Emissivity tables
654321
Granite
Ice: See Water
90.95–0.97SW70rough, 4 different
samples
10.8–0.9T20Gypsum
10.81T50castingIron, cast
10.95T1000ingotsIron, cast
10.28T1300liquidIron, cast
10.60–0.70T800–1000machinedIron, cast
40.63T38oxidizedIron, cast
20.64T100oxidizedIron, cast
40.66T260oxidizedIron, cast
40.76T538oxidizedIron, cast
10.64–0.78T200–600oxidized at 600°CIron, cast
40.21T38polishedIron, cast
20.21T40polishedIron, cast
10.21T200polishedIron, cast
10.87–0.95T900–1100unworkedIron, cast
90.09LW70cold rolledIron and steel
90.20SW70cold rolledIron and steel
Iron and steel
rust
Iron and steel
ly polished
Iron and steel
with emery
Iron and steel
sheet
10.61–0.85T20covered with red
40.05T22electrolyticIron and steel
40.05T100electrolyticIron and steel
40.07T260electrolyticIron and steel
10.05–0.06T175–225electrolytic, careful-
10.24T20freshly worked
10.55–0.61T950–1100ground sheetIron and steel
20.69T20heavily rusted
90 Publ. No. T559498 Rev. a461 – ENGLISH (EN) – August 19, 2010
Page 97

23 – Emissivity tables
654321
10.77T20hot rolledIron and steel
10.60T130hot rolledIron and steel
10.74T100oxidizedIron and steel
40.74T100oxidizedIron and steel
10.78–0.82T125–525oxidizedIron and steel
20.79T200oxidizedIron and steel
40.89T1227oxidizedIron and steel
10.80T200–600oxidizedIron and steel
10.88T50oxidized stronglyIron and steel
10.98T500oxidized stronglyIron and steel
20.07T100polishedIron and steel
10.14–0.38T400–1000polishedIron and steel
10.52–0.56T750–1050polished sheetIron and steel
10.24T20rolled, freshlyIron and steel
10.56T50rolled sheetIron and steel
Iron and steel
10.95–0.98T50rough, plane surface
50.96SW17rusted, heavilyIron and steel
40.69T22rusted red, sheetIron and steel
10.69T20rusty, redIron and steel
10.16T150shiny, etchedIron and steel
Iron and steel
10.82T20shiny oxide layer,
sheet,
Iron and steel
10.28T40–250wrought, carefully
polished
90.85LW70heavily oxidizedIron galvanized
90.64SW70heavily oxidizedIron galvanized
40.07T92sheetIron galvanized
10.23T30sheet, burnishedIron galvanized
10.28T20sheet, oxidizedIron galvanized
Publ. No. T559498 Rev. a461 – ENGLISH (EN) – August 19, 2010 91
Page 98

23 – Emissivity tables
654321
40.064T24sheetIron tinned
black 1602
black 1602
Lacquer
Lacquer
Lacquer
Lacquer
Flat blackKrylon Ultra-flat
Flat blackKrylon Ultra-flat
on Aluminum
on Aluminum
rough surface
sprayed on iron
12Ca. 0.96LWRoom temperature
up to 175
12Ca. 0.97MWRoom temperature
up to 175
90.92–0.94LW703 colors sprayed
90.50–0.53SW703 colors sprayed
10.4T20Aluminum on
10.83T80bakeliteLacquer
10.96–0.98T40–100black, dullLacquer
20.97T100black, matteLacquer
10.87T20black, shiny,
10.92T100heat–resistantLacquer
10.8–0.95T40–100whiteLacquer
20.92T100whiteLacquer
10.28T20oxidized, grayLead
40.28T22oxidized, grayLead
10.63T200oxidized at 200°CLead
10.08T250shinyLead
Lead
ished
40.05T100unoxidized, pol-
40.93T100Lead red
10.93T100Lead red, powder
10.75–0.80TtannedLeather
10.3–0.4TLime
40.07T22Magnesium
40.13T260Magnesium
92 Publ. No. T559498 Rev. a461 – ENGLISH (EN) – August 19, 2010
Page 99

der
23 – Emissivity tables
654321
40.18T538Magnesium
20.07T20polishedMagnesium
10.86TMagnesium pow-
10.08–0.13T600–1000Molybdenum
10.19–0.26T1500–2200Molybdenum
10.1–0.3T700–2500filamentMolybdenum
50.87SW17Mortar
70.94SW36dryMortar
21 Black
Nickel
Nickel
Nickel
Nickel
pure, polished
pure, polished
ished
iron, polished
> 0.97LW–60–150Flat blackNextel Velvet 811-
10 and
11
10.25T700rolledNichrome
10.70T700sandblastedNichrome
10.65T50wire, cleanNichrome
10.71–0.79T500–1000wire, cleanNichrome
10.95–0.98T50–500wire, oxidizedNichrome
40.041T122bright matteNickel
10.045T100commercially
10.07–0.09T200–400commercially
40.04T22electrolyticNickel
40.06T38electrolyticNickel
40.07T260electrolyticNickel
40.10T538electrolyticNickel
20.05T20electroplated, pol-
40.045T22electroplated on
Nickel
10.11–0.40T20electroplated on
iron, unpolished
Publ. No. T559498 Rev. a461 – ENGLISH (EN) – August 19, 2010 93
Page 100

23 – Emissivity tables
654321
Nickel
Oil, lubricating
Paint
Paint
40.11T22electroplated on
iron, unpolished
20.37T200oxidizedNickel
40.37T227oxidizedNickel
40.85T1227oxidizedNickel
10.37–0.48T200–600oxidized at 600°CNickel
40.045T122polishedNickel
10.1–0.2T200–1000wireNickel
10.52–0.59T500–650Nickel oxide
10.75–0.86T1000–1250Nickel oxide
20.27T200.025 mm filmOil, lubricating
20.46T200.050 mm filmOil, lubricating
20.72T200.125 mm filmOil, lubricating
20.05T20film on Ni base: Ni
base only
20.82T20thick coatingOil, lubricating
90.92–0.94LW708 different colors
and qualities
90.88–0.96SW708 different colors
and qualities
Paint
ages
10.27–0.67T50–100Aluminum, various
10.28–0.33Tcadmium yellowPaint
10.65–0.70Tchrome greenPaint
10.7–0.8Tcobalt bluePaint
50.87SW17oilPaint
60.94SW20oil, black flatPaint
60.92SW20oil, black glossPaint
60.97SW20oil, gray flatPaint
60.96SW20oil, gray glossPaint
10.92–0.96T100oil, various colorsPaint
94 Publ. No. T559498 Rev. a461 – ENGLISH (EN) – August 19, 2010
 Loading...