

Page 1

M570 series oscilloscope
Rollmode
User’s Guide
Version 1.02
Copyright © 2004-2006 ETC s.r.o.
Page 2

M570 series oscilloscope with rollmode User’s Guide
Thank you for choosing oscilloscope with rollmode from M570 series, a
product of ETC s.r.o. We believe it will fulfill your expectations. In order to assure
that we will be able to provide you with up-to-date information, please fill-out the
registration form at the ETC website.
For any further information or consultations, please contact us via mail, phone
or preferably e-mail on the following address:
Address:
ETC s.r.o.
Rosinská cesta 8
010 08, Žilina
Slovak Republic
Phone:
+421-41-5652687
Fax:
+421-41-5652687
Internet:
URL:
http://www.etcsk.com
e-mail: support@etcsk.com - technical support
sales@etcsk.com - sales
info@etcsk.com - other information
- 2 -
Page 3

M570 series oscilloscope with rollmode User’s Guide
Contents
Software License Agreement.........................................................................................6
Precautions.....................................................................................................................6
1. Installation..................................................................................................................7
1.1. Requirements ......................................................................................................7
1.2. Hardware installation..........................................................................................7
1.3 Software installation ............................................................................................7
2. Hardware....................................................................................................................8
2.1. Hardware description..........................................................................................8
3. Basic information.......................................................................................................9
3.1. Front panel layout...............................................................................................9
3.2. Basic terms..........................................................................................................9
3.3 Structure.............................................................................................................10
4. The data acquisition main window..........................................................................11
4.1. Oscilloscope screen...........................................................................................11
4.2. Grid controls .....................................................................................................12
4.3. Channel visibility controls................................................................................13
4.4. Display mode controls ......................................................................................13
4.5. Data save controls.............................................................................................13
4.6. Waveform display mode control.......................................................................14
4.7. Timebase controls.............................................................................................15
4.8. Data acquisition mode control..........................................................................15
4.9. Trigger controls.................................................................................................16
4.10. ARM-ing the data acquisition.........................................................................17
4.11. Vertical range controls....................................................................................18
4.12. Vertical shift controls......................................................................................18
4.13. Signal source controls.....................................................................................19
4.14. Channel information .......................................................................................19
4.15. Main menu......................................................................................................19
4.15.1. Demo setup window ................................................................................20
4.15.2. Color settings window .............................................................................20
5. Data viewer main window.......................................................................................22
5.1. Opening the data file.........................................................................................22
5.2. Waveform screens............................................................................................23
5.3. Cursors..............................................................................................................24
5.3.1. Using cursors .................................................................................................25
5.3.2. Measuring non-continuous data.....................................................................30
5.4. Channel visibility controls................................................................................31
5.5. Waveform display mode control.......................................................................31
5.6. Zoom control.....................................................................................................32
5.7. Progress indicator..............................................................................................32
5.8. Main menu........................................................................................................32
5.8.1. Print Support..............................................................................................33
5.8.2. Color settings window ...............................................................................36
6. Data file format........................................................................................................36
6.1. File contents......................................................................................................37
6.2. Data format .......................................................................................................37
6.3. The oscilloscope settings ..................................................................................37
- 3 -
Page 4

M570 series oscilloscope with rollmode User’s Guide
6.3.1. Setting codes..............................................................................................38
- 4 -
Page 5

M570 series oscilloscope with rollmode User’s Guide
Figures and tables
Fig. 3.1.1. – Front panel.................................................................................................9
Fig. 4.1. – Main window..............................................................................................11
Fig. 4.1.1. – Oscilloscope screen .................................................................................12
Fig. 4.2.1. – Grid controls............................................................................................12
Fig. 4.3.1. – Channel visibility controls.......................................................................13
Fig. 4.4.1. – Display mode controls.............................................................................13
Fig. 4.5.1. – Data save controls....................................................................................14
Fig. 4.6.1. – Waveform display mode controls............................................................14
Fig. 4.7.1. – Timebase controls....................................................................................15
Fig. 4.8.1 – Data acquisition mode controls ................................................................16
Fig. 4.9.1. – Trigger controls .......................................................................................16
Fig. 4.10.1. – ARM control elements...........................................................................17
Fig. 4.11.1. – Range controls.......................................................................................18
Fig. 4.12.1. – Vertical shift controls ............................................................................18
Fig. 4.13.1. – Signal source controls............................................................................19
Fig. 4.14.1. – Channel information..............................................................................19
Fig. 4.15.1.1. – Demo setup window...........................................................................20
Fig. 4.15.2.1. – Color settings window........................................................................21
Fig. 5.1. – The data viewer main window....................................................................22
Fig. 5.1.1. – Data file control elements........................................................................23
Fig. 5.2.1. – Waveform screens ...................................................................................23
Fig. 5.2.2. – File screen................................................................................................23
Fig. 5.2.3. – Buffer screen............................................................................................24
Fig. 5.2.4. – Main screen..............................................................................................24
Fig. 5.3.1.1. – Cursor manipulation menu ...................................................................25
Fig. 5.3.1.2. – Cursor selection menu..........................................................................26
Fig. 5.3.1.3. – Time periods table................................................................................26
Fig. 5.3.1.4. – Cursor modification menu....................................................................28
Fig. 5.3.1.5. Property modification window................................................................29
Fig. 5.3.1.6. – Time synchro mark modification window............................................29
Fig. 5.3.1.7. – Viewer screens with waveform cursors and time synchro mark..........30
Fig. 5.4.1. – Channel visibility controls.......................................................................31
Fig. 5.5.1. – Waveform display mode controls............................................................31
Fig. 5.6.1. Zoom controls.............................................................................................32
Fig. 5.7.1. Progress indicator.......................................................................................32
Fig. 5.8.1.1. - Print Manager Window.........................................................................33
Fig. 5.8.1.2. - Object Info.............................................................................................34
Fig. 5.8.1.3. - List of available objects.........................................................................34
Fig. 5.8.1.1.1. - Specify Layout Name Window..........................................................35
Fig. 5.8.1.2.1. - Layout Manager Window...................................................................36
Fig. 4.15.2.1. – Color settings window........................................................................36
- 5 -
Page 6

M570 series oscilloscope with rollmode User’s Guide
Software License Agreement
This legal document is an agreement between you, the end user, and ETC
s.r.o. By installing this product on your computer, you are agreeing to become bound
by the terms of this agreement and warranty conditions.
1. GRANT OF LICENSE. ETC s.r.o. as Licensor, grants you, the Licensee, a
nonexclusive right to use and display this copy of the M570 roll-mode software
(hereinafter the "SOFTWARE"), this EM570 device and accompanying written
materials, on a single COMPUTER at a single location and only together so long as
you comply with the terms of this License.
2. OWNERSHIP. As the LICENSEE, you own the magnetic or other physical
media on which the SOFTWARE is originally or subsequently recorded or fixed, but
an express condition of this License is that ETC s.r.o. retains title and ownership of
the SOFTWARE recorded on the original disk copy(ies) and all subsequent copies of
the software, regardless of the form or media in or on which the original and other
copies may exist. This License is not a sale of the original SOFTWARE or any copy.
3. COPY RESTRICTIONS. This SOFTWARE, EM570 device and
accompanying written materials are copyrighted. Unauthorized copying or copy
attempt of the EM570 device, including module which has been modified or included
with any other system, or of written materials is expressly forbidden. It is, however,
allowed to pass SOFTWARE on as the DEMO version. You may be held legally
responsible for any copyright infringement which is caused or encouraged by your
failure to abide by the terms of this License.
4. DISCLAIMER OF THE WARRANTY OF ANY KIND CONCERNING
SOFTWARE. This SOFTWARE and accompanying written materials are provided
"AS IS" without a warranty of any kind. Further, ETC s.r.o. does not warrant,
guarantee or make any representations regarding the use, or the results of use, of the
SOFTWARE, EM570 device or written materials in terms of correctness, accuracy,
reliability, currentness, or otherwise. The entire risk as to the results and performance
of the software is assumed by you.
Precautions
Please follow these recommendations to avoid any possible problems that
might occur while using the oscilloscope:
- read the User’s Guide
- always connect device using cable, which is the part of package. If it is not possible,
always use USB 2.0 cable.
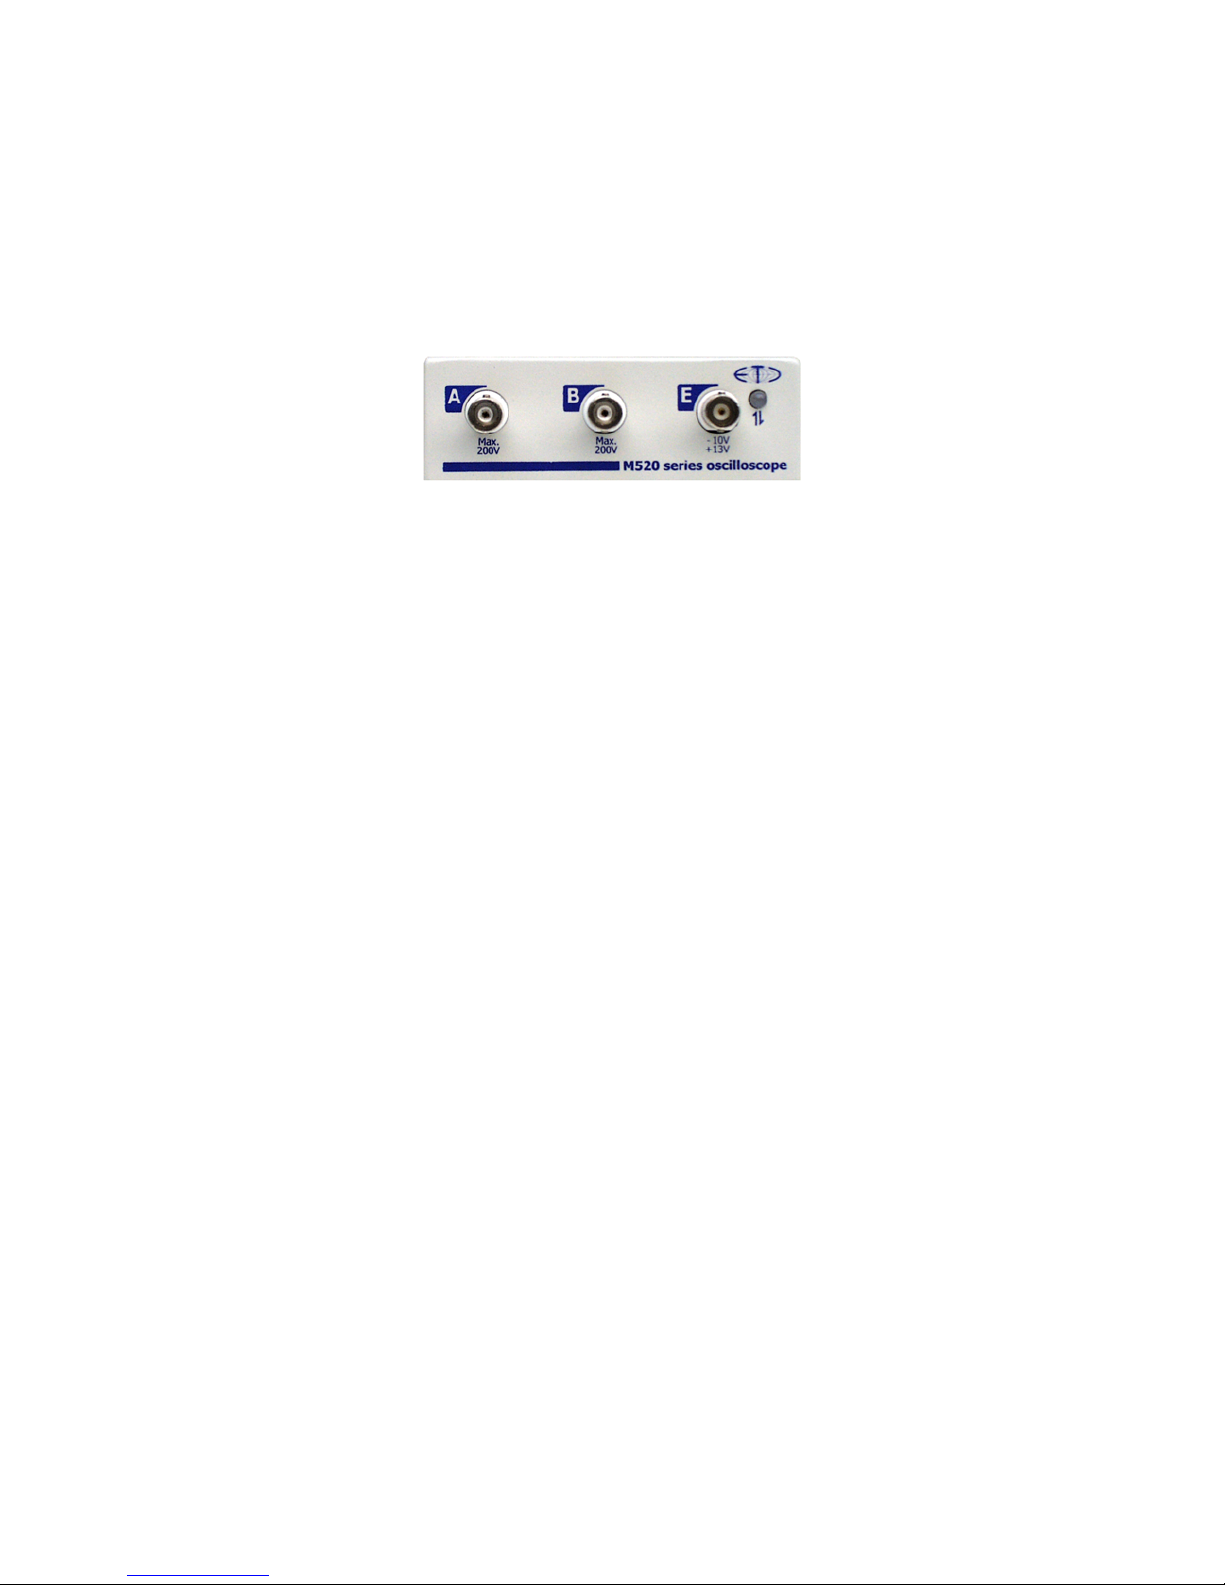
- never connect signal with absolute voltage higher than 200V to measuring inputs.
This value is valid for frequencies lower than 100kHz. Over this frequency, the
voltage lowers with raising frequency. For example frequency 200kHz of 100V,
400kHz of 50V is the limit.
- never connect voltage lower than –10V and higher than +13V to the external
triggering input (frequency lower than 20kHz). Over 20kHz, voltage lower than -0.5V
or higher than +4V is not recommended.
- never connect voltage to the oscilloscope ground, it may result in device or computer
damage
- never disassemble device, since there are no user serviceable parts inside
- 6 -
Page 7

M570 series oscilloscope with rollmode User’s Guide
1. Installation
1.1. Requirements
Minimum configuration:
- PC PENTIUM compatible computer with speed of at least 300MHz
- 64MB RAM
- CD-ROM
- VGA with resolution 800 x 600
- USB port
- mouse or other tracking device
- at least 20MB free space on the hard drive
- MS Windows 98 SE, ME, 2000 or XP
Recommended configuration:
- PC PENTIUM compatible computer with speed of at least 1.5GHz
- 128MB RAM
- CD-ROM
- VGA with resolution at least 1024x768
- USB port 2.0
- mouse or other tracking device
- at least 20MB free space on the hard drive
- MS Windows 98 SE, 2000 or XP
1.2. Hardware installation
Connect one side of the cable to the computer, other one to the device. Proceed
with the software installation.
WARNING: Always use cable, which is the part of the package. Usage of the
improper cable can disable communication with the computer.
1.3 Software installation
The software and the device drivers are located on the enclosed CD. Insert the CD
into the CD-ROM drive. Then follow the instructions of the setup program that should
launch automatically. If the CD autorun option is not enabled in your computer’s
settings, please run file autorun.exe from the CD.
- 7 -
Page 8

M570 series oscilloscope with rollmode User’s Guide
2. Hardware
The information contained in this chapter will help you to understand the
features of your oscilloscope.
2.1. Hardware description
The M570 series of dual channel digital storage USB oscilloscopes connect to
the computer via USB. They are compatible with both USB 2.0 and USB 1.1.
Measurement accuracy is achieved by the stability of the parts used together with the
computing power of the computer. Calibration data are part of the HW, which makes
it impossible to loose them (oppose to the calibration data located on the diskette).
Therefore, it is possible to simply connect the hardware to any computer (via USB 1.1
or USB 2.0 interface). All you have to do is just install the software.
The M570 series oscilloscopes allow user to measure waveforms using two
independent channels with resolution of 8 bits and sensitivity from 10mV/div to
5V/div (80mVfs to 40Vfs) in 9 steps. One division of the oscilloscope screen contains
32 dots. Input impedance matches the oscilloscope standards, therefore any regular
oscilloscope probe (with minimum compensation range of 32pF) can be connected to
the device. The software supports 1:1, 1:10, 1:100 and 1:1000 probes. AC or DC
coupling and type of probe can be independently selected for each vertical channel.
Any input can be grounded without disconnecting the probes from the measured
system. Vertical track position can be controlled with accuracy of 1 pixel of the
oscilloscope screen. Measurement can be triggered from the Channel A and Channel
B and/or blocked from Channel A, Channel B and/or External ARM input. Trigger
and ARM threshold can be set independently for each channel in the range of whole
oscilloscope screen with resolution of one pixel. Threshold of the External ARM input
is fixed to about 1.5V (TTL and CMOS compatible).
Each measuring channel of the M570 series oscilloscopes has its own AD
converter. No channel multiplexing is used for dual channel operation. Data are stored
in the internal dual port buffer of the device. The computer continuously reads data as
fast as possible (depending mainly on the operational system and other tasks opened).
If the computer interrupts reading for time longer then the time necessary to acquire
higher amount of data then the capacity of the internal buffer the buffer overflow
occurs. This situation is indicated by vertical red line. Probability of buffer overflow
is raising with higher sampling speed and higher amount of running applications.
During data acquisition it is recommended to close all applications, which are not
necessary for your current work.
- 8 -
Page 9
M570 series oscilloscope with rollmode User’s Guide
3. Basic information
3.1. Front panel layout
Channel A, channel B, external ARM input and LED are accessible on the
front panel.
Fig. 3.1.1. – Front panel
If the LED color is:
- green, the device is configured and there is no communication with a
computer in this moment
- orange, the device communicates with a computer
- red, device is powered, but not configured
3.2. Basic terms
This Chapter explains the basic terms used throughout the text.
Click – Position the mouse cursor over the chosen object. Then press and
release the left mouse button.
Double-Click – Two successive clicks.
Drag – Position the mouse cursor over the object you want to move. Then
press the left mouse button and hold it down. The chosen object moves with the
mouse cursor. After releasing the mouse button the object moves to the new location.
Enter the value into the edit box – Click the edit box. Use the keyboard to
enter the desired value and confirm by pressing “Enter”.
Insert the value into the edit box – Click the edit box. Use the keyboard to
enter the desired value.
Set the value using the scroll bar – It is possible to change a value by simply
dragging the scroll bar slider. Clicking the arrows of the scroll bar increases or
decreases the value by minimal steps. Clicking in between the slider and the arrows
changes the value by larger steps.
Select the value from the combo box – Open the list of all possible values of
the edit box by clicking it. Then set the desired value by clicking it.
- 9 -
Page 10

M570 series oscilloscope with rollmode User’s Guide
3.3 Structure
The “Roll mode” control software consists of two independent applications.
- The data acquisition application controls device, measures and stores the
measured data.
- The data viewer displays the previously measured data and allows simple
voltage and time relation measurements.
These applications are independent. The only relations between them are the
measured data.
- 10 -
Page 11
M570 series oscilloscope with rollmode User’s Guide
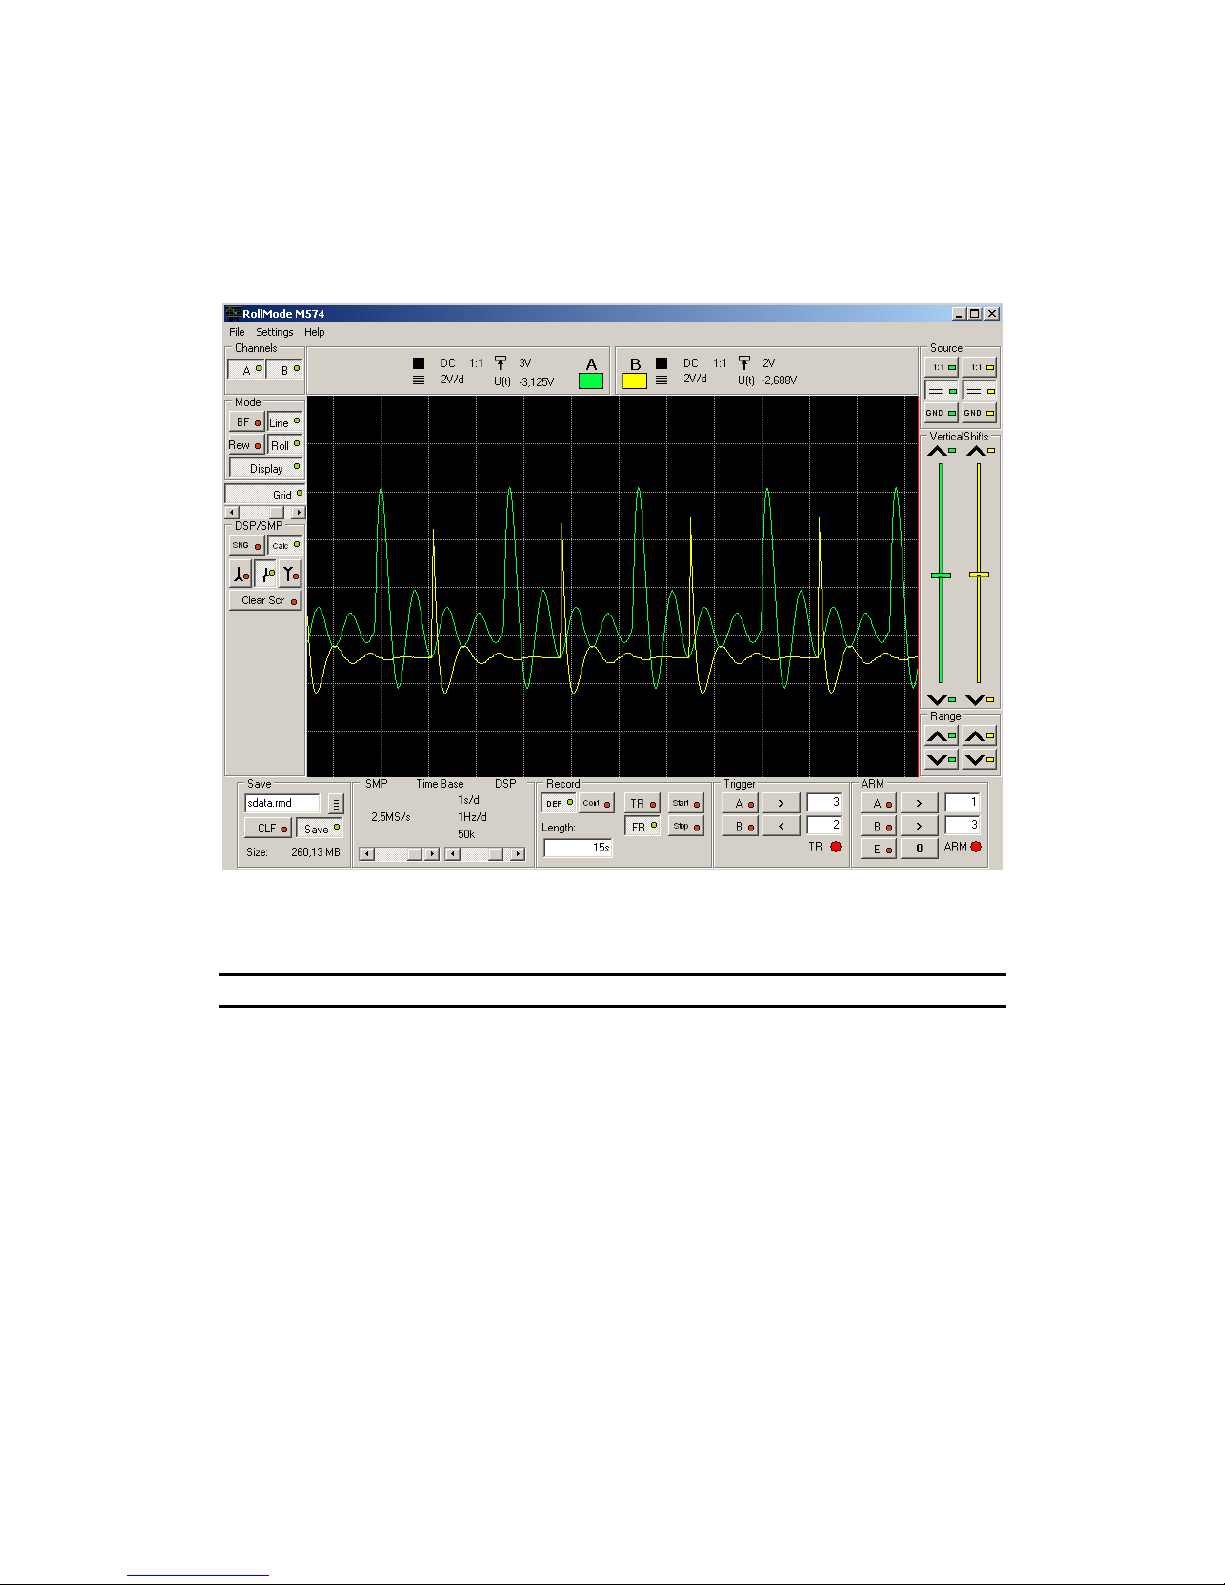
4. The data acquisition main window
The main window opens after the application starts. Most of the oscilloscope
functions are accessible via the controls located on this screen.
Fig. 4.1. – Main window
All controls connected to one of the channels have channel color.
TIP: The channel color can be changed in main menu.
4.1. Oscilloscope screen
The oscilloscope screen is located in the middle of the main window.
- 11 -
Page 12
M570 series oscilloscope with rollmode User’s Guide
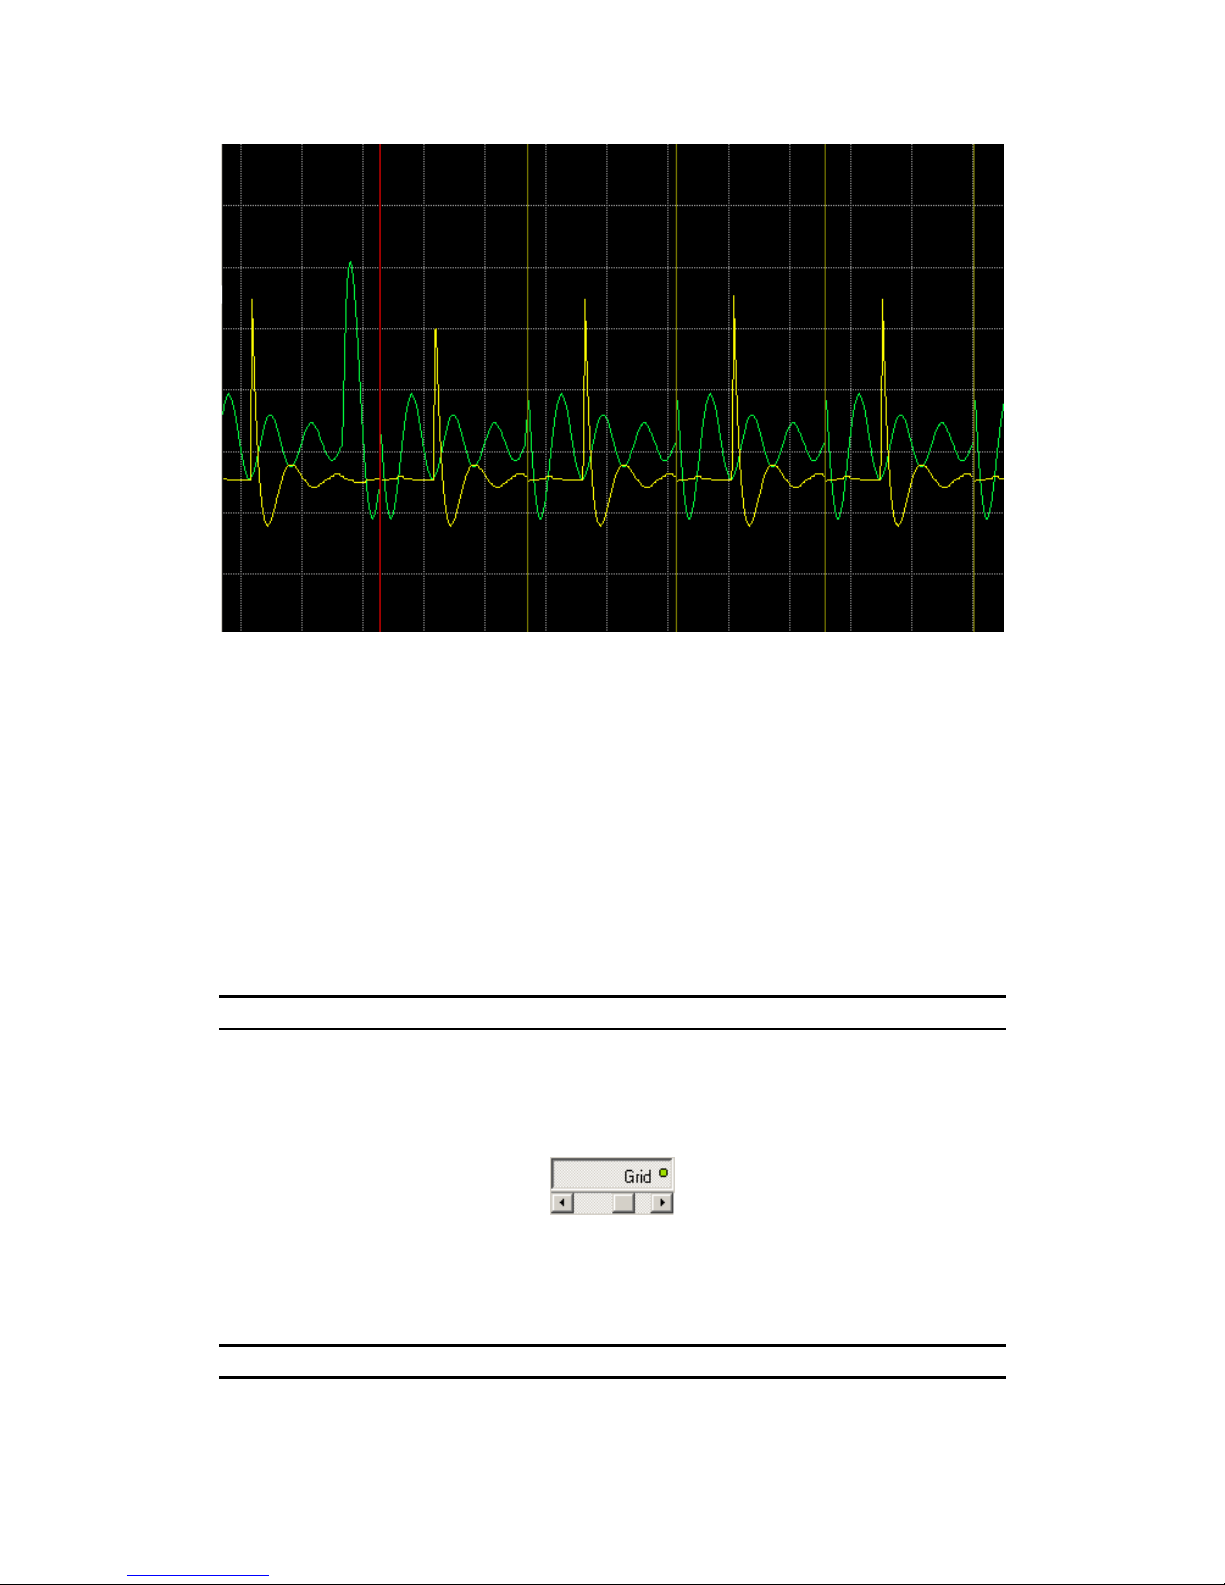
Fig. 4.1.1. – Oscilloscope screen
The oscilloscope screen is divided into 8 vertical divisions. The number of
horizontal divisions depends on the size of the application window and the screen
resolution.
There are three kinds of marks displayed on the screen.
- If the buffer overflow occurs, and some data are lost, data loss is marked by red
vertical line. This line marks the loose of data continuity.
- The device settings change is marked by read vertical line.
- If the data acquisition is blocked by ARM conditions, the data discontinuity is
marked by olive green vertical line.
The waveforms are displayed in the colors selected for each channel. The
default colors are: green for channel A and yellow for channel B.
TIP: The channel colors can be changed in main menu.
4.2. Grid controls
The cursors and grid controls are located in the left part of the main window.
Fig. 4.2.1. – Grid controls
“Grid” – switches the grid on/off
The scrollbar – adjusts grid brightness
TIP: The grid color can be changed in main menu.
- 12 -
Page 13

M570 series oscilloscope with rollmode User’s Guide
4.3. Channel visibility controls
The channel visibility controls are located in the left of the main window.
Fig. 4.3.1. – Channel visibility controls
“A“ – activates/deactivates channel A waveform
“B“ – activates/deactivates channel B waveform
4.4. Display mode controls
The display mode controls are located in the left of the main window.
Fig. 4.4.1. – Display mode controls
“BF“ – activates/deactivates „Beam finder“ mode. When activated, the
waveform exceeding vertical range is displayed as line on appropriate side of the
screen.
“Line“ – activates/deactivates mode, where the sample is connected with
adjacent one with line.
“Rew” (Rewrite) and “Roll” control the waveform drawing mode. When
“Rew” is selected, the waveform is always drawn from the left to right side of the
screen and the old waveform is continuously cleared off. When “Roll” is selected, the
waveform is drawn always on the right edge of the screen and rolls to left.
TIP: The “Roll” mode requires more processor time. If you display waveform
sampled with high sampling rate, choose the “Rew” mode.
“Display” – switches on/off the oscilloscope screen
TIP: Switching off the oscilloscope screen lowers the possibility of data loss.
4.5. Data save controls
The data save controls are located in the bottom of the main window.
- 13 -
Page 14

M570 series oscilloscope with rollmode User’s Guide
Fig. 4.5.1. – Data save controls
The name of target file has to be inserted into the upper edit box.
The
button opens standard operating system dialog, where you can select
target file.
Click „Save“ to enter the “data saving” mode. The data are continuously saved
to disk during acquisition. The length of the file is indicated on the right of the “Size”
label.
“CLF” – (Clear file) erases the file
WARNING: The “Data save” controls are inactive, when the data acquisition is
in progress.
If the selected file already exists on the disk, measured data will be appended
to it.
4.6. Waveform display mode control
The controls are located in the bottom of the main window.
Fig. 4.6.1. – Waveform display mode controls
If more than 1 sample is displayed to one dot of the waveform, it is necessary
to set the mode of creating the dot. There are two buttons to choose the basic mode.
If “SNG” is selected, only the first sample of time period represented by the
dot is displayed.
If “Calc” is selected, the dot is calculated out of all samples. The method of
calculation depends on the following controls:
If the
is activated, the displayed dot is calculated as average of the
measured samples.
If the
is activated, the displayed dot is calculated as a maximum of
measured samples.
If the
is activated, the displayed dot is calculated as a minimum of
measured samples.
- 14 -
Page 15

M570 series oscilloscope with rollmode User’s Guide
If both the
and are activated, the line between maximum and
minimum value of samples is displayed.
“Clear Scr” clears the oscilloscope screen.
4.7. Timebase controls
The timebase controls are located in the bottom of the main window.
Fig. 4.7.1. – Timebase controls
The scrollbar on the left side controls the sampling frequency. The actual
sampling frequency is shown above. Usable values are 50S/s to 5MS/s settable in 1-25 sequence.
WARNING: The fastest sampling frequency is usable only if the oscilloscope is
connected to computer via USB 2.0 interface. It is strongly recommended to close
any other application and choose the “Rew” display mode or switch the
oscilloscope display off (see chapter 4.4.). If the oscilloscope is connected to
computer via USB 1.1 interface the maximum usable sampling frequency is
250kS/s.
The scrollbar on the right side controls the display timebase. The following
information are displayed above this scrollbar:
- time of one grid division
- 1/time of one grid division
- number of samples aggregated to one screen point
TIP: For more information about display mode please see chapter 4.6.
If the change of one scrollbar results in lack of samples to create the dot, the
position of the second scrollbar will be adjusted to get one sample for each displayed
dot.
WARNING: If the scrollbar position is adjusted due to above mentioned reasons
automatically, it won’t be readjusted back, when the reasons are gone.
4.8. Data acquisition mode control
The data acquisition mode control elements are located in the bottom of the
main window.
- 15 -
Page 16

M570 series oscilloscope with rollmode User’s Guide
Fig. 4.8.1 – Data acquisition mode controls
These controls allow to set mode of data acquisition start and its length.
The controls located in the left side sets the length of data acquisition. When
the “Cont” button is pressed, the continuous mode of data acquisition is selected. In
this case, only way to stop the data acquisition is pressing the “Stop” button located
on the right side of this group.
Pressing the “DEF” button activates the “Length” edit box. Now it is possible
to enter the length of the data acquisition in hours, minutes and seconds. “h” means
hours, “m” minutes and “s” seconds. For example 2h35m25s means two hours, 35
minutes and 25 seconds.
Controls on the right side of the group define the conditions for the start of
data acquisition and start or stop it.
The “FR” button sets the free run mode. In this mode the data acquisition
starts after pressing the “Start” button immediately.
The “TR” button sets the triggered mode. To start the data acquisition it is
necessary to press the “Start button” and then to reach the trigger conditions selectable
by “trigger controls” (see. chapter 4.9.).
Pressing the “Start” button starts the data acquisition according to the
conditions mentioned above.
Pressing the “Stop” button stops the data acquisition immediately.
4.9. Trigger controls
These elements are located in the bottom side of the main window. They have
effect only if the triggered data acquisition mode is set (see chapter 4.8.)
Fig. 4.9.1. – Trigger controls
The first row of the control elements represent Channel A, the second one
channel B trigger condition settings. The left button (“A” and/or “B”) activates the
trigger condition for Channel A, or Channel B. The buttons located in the middle
column set the relations to value written in edit boxes located at the right side of the
group. The value written to these boxes represents voltage in volts or milivolts (m).
The button located in the bottom row of the group becomes active if both
trigger conditions for Channel A and Channel B are activated. It defines the influence
of each of the channels on the trigger event. It can be set to one of the following
states:
- “AND” the data acquisition starts if both conditions are met
- 16 -
Page 17

M570 series oscilloscope with rollmode User’s Guide
- “OR” the data acquisition starts if any condition is met.
The “TGD” indicator changes its color under the following conditions:
- it is red if the trigger condition did not occurred yet
- it is green if the trigger condition has already occurred.
WARNING: ARM-ing circuitry (see chapter 4.10.) have higher priority than the
triggering circuits. If the triggering circuits are set to the conditions under which
the data acquisition is blocked (by ARM-ing circuitry), the acquisition will never
start.
4.10. ARM-ing the data acquisition
Located in the bottom right side of the main window, these control elements
allow to set conditions under which the data acquisition is interrupted. The reason of
interruption can be the voltage measured by each channel and/or logic level on the
“E” input of the instrument.
Fig. 4.10.1. – ARM control elements
The first and second row of the control elements represents the Channel A and
Channel B ARM condition settings. The left button (“A” and/or “B”) activates the
ARM conditions for Channel A or Channel B. The buttons located in the middle set
the relations to value written in edit boxes located at the right side of the group. The
value written to these boxes represents voltage in volts, or milivolts (m). If the
condition set is FALSE the data acquisition is interrupted. It starts again when all
active conditions are met.
There are two buttons in the bottom row. When the “E” button is active the
data acquisition is controlled also by the “E” input of the device. This input is
LVCMOS 3.3V compatible with threshold of about 1.5V. The button located on the
right side defines the ARM condition for the “E” input. If it is set to “0” the data
acquisition will be interrupted if the “E” input is connected to log. 1. If it is set to 1,
log.0 interrupts the data acquisition.
If there are several ARM inputs set to active state, every active condition must
be met to allow data acquisition.
TIP: Internal 10 kOhm pull-up resistor is connected between “E” input and 3.3V
power supply of the oscilloscope. This sets log.1 to unconnected input. This
condition can be used for simple data acquisition control. If only the E arming
condition is active and set to 1, grounding the “E” input interrupts the data
acquisition. If the condition is set to 0, grounding the “E” input starts the data
acquisition.
The “ARM” indicator changes its color under following conditions:
- 17 -
Page 18

M570 series oscilloscope with rollmode User’s Guide
- it is red, if the data acquisition is not started (and triggered) yet
- it is yellow, if the data acquisition has started already, but it is interrupted by ARMing system
- it is green if the data acquisition is in progress.
4.11. Vertical range controls
The vertical range controls are located in the right of the main window.
Fig. 4.11.1. – Range controls
Channel A controls are located in left, channel B controls are located in the
right side.
- changes the range to less sensitive
- changes the range to more sensitive
4.12. Vertical shift controls
The vertical shift controls are located in the right side of the main window.
Fig. 4.12.1. – Vertical shift controls
Channel A controls are located in left, channel B controls are located in the
right.
- the waveform is shifted upwards by smallest possible value
- the waveform is shifted downwards by smallest possible value.
Click between slider and button to shift waveform by approx. 1 point.
The vertical shift can be set by dragging the slider as well.
- 18 -
Page 19

M570 series oscilloscope with rollmode User’s Guide
4.13. Signal source controls
The signal source controls are located in the right of the main window.
Fig. 4.13.1. – Signal source controls
Channel A controls are located in the left, channel B controls are located in the
right.
“1:1”, “1:10”, “1:100” or “1:1000” – probe attenuation ratio
WARNING: Selection of improper probe attenuation may result in wrong
information about voltages.
Click to select coupling. Click to ground input.
4.14. Channel information
The channel information are displayed in the top of the main window.
Channel A information are located in the left, channel B information in the
right.
Fig. 4.14.1. – Channel information
Following information are displayed:
- information about coupling and probe attenuation ratio
- range
WARNING: If the improper probe attenuation is set, the information will be
inaccurate.
„U(t)“ – the last measured value
- trigger threshold voltage
4.15. Main menu
The main menu is located in the top of the main window. Following menu
items are available:
File | Viewer – Opens the data viewer.
- 19 -
Page 20

M570 series oscilloscope with rollmode User’s Guide
File | Exit – Closes application.
Settings | Restore defaults – Reloads oscilloscope settings loaded on the
application start.
Settings | Load settings – Loads oscilloscope settings saved by selecting
“Settings | Save settings” menu item.
Settings | Save settings – Saves oscilloscope settings to hard disk (to other file
than default settings).
Settings | Demo setup – Opens window, where you can select signal
parameters in demonstration mode.
Settings | Color setup – Opens window for color selection.
Settings | Tool tip help – Activates/deactivates the tool tip help.
Settings | High priority - Sets high priority execution of oscilloscope
application.
Help | Index – Displays the Help index.
Help | ETC web – Starts the internet browser installed in the computer to
display the ETC’s web site. This feature works only if the computer is already
connected to internet.
Help | Support – Sends the e-mail message to the ETC’s customer support.
This feature works only if the computer has connection to internet.
Help | About – Displays information about product.
4.15.1. Demo setup window
The demo setup window is opened after click on the main menu item.
Fig. 4.15.1.1. – Demo setup window
Channel A controls are located in left, channel B controls are located in the
right.
“Amplitude” – amplitude of demo signal in mV
“Period” – period of demo signal in ms
“Noise” – noise level in mV
4.15.2. Color settings window
The color settings window is opened after click on the main menu item.
- 20 -
Page 21

M570 series oscilloscope with rollmode User’s Guide
Fig. 4.15.2.1. – Color settings window
Click “Set” button located by label to open standard operating system color
dialog to change color of:
“Channel A” – channel A waveform and controls
“Channel B” – channel B waveform and controls
“Grid” – grid
“Background” – background
- 21 -
Page 22

M570 series oscilloscope with rollmode User’s Guide
5. Data viewer main window
Figure 5.1. shows the main window of the data viewer.
Fig. 5.1. – The data viewer main window
The main window consists of the waveform screens, control elements, set of
measured data and the main menu. The first operation you have to perform is opening
the data file you want to view. If no file is opened, most of the control elements are
inactive.
5.1. Opening the data file
The viewer is designed to use data created by the “Roll mode” of M570 series
oscilloscopes. Every file is created with extension “rmd”. Structure of the data file is
designed for handling huge amount of data. To speed up operations with the data file
some data integrity checks are not performed. Please note that opening the file
containing data incompatible with the viewer data structure can lead to unpredicted
behaviour of the viewer.
WARNING: Opening the incompatible file can lead to unpredictable behaviour
of data viewer.
The control elements for opening the data file are located on the lower left side
of the screen.
- 22 -
Page 23

M570 series oscilloscope with rollmode User’s Guide
Fig. 5.1.1. – Data file control elements
The file name has to be inserted into the upper edit box.
The
button opens standard operating system dialog, where you can select
the target file.
Click „Open“ to load data.
The length of the file is indicated on the right of the “Size” label.
The “progress” bar located on the right bottom side of the screen indicates the
state of the load operation.
5.2. Waveform screens
The waveform screens are shown on the fig. 5.2.1. They are used to display
the whole data stored in the data file, part of data stored in internal buffer of the
computer and part of data used for detailed measurements.
Fig. 5.2.1. – Waveform screens
The “file screen” is located on the bottom side of the screens. It shows whole
data stored in the data file (Fig.5.2.2). The violet color bar marks the data area cached
in the internal waveform buffer of the computer. By moving this bar it is possible to
change the content of the internal buffer. To move this bar click on screen on left or
right side of it, click on arrows or simply drag it to desired position.
Fig. 5.2.2. – File screen
- 23 -
Page 24

M570 series oscilloscope with rollmode User’s Guide
WARNING: Moving data to internal buffer is the time consuming operation.
The reaction to bar movements can take several seconds.
The waveform stored in the internal buffer is displayed on the screen
positioned right above the file screen. Fig. 5.2.3. shows this “Buffer screen”.
Fig. 5.2.3. – Buffer screen
The brown color bar marks the area displayed on the screen called “Main
screen”. This screen shows detailed waveforms and allows cursor measurements. The
brown color bar can be moved over the buffer screen. Moving this bar changes the
content of the main screen.
The main screen occupies the largest part of the screen area (fig. 5.2.4.).
Fig. 5.2.4. – Main screen
Its vertical resolution is 256 points. It is able to display all details of the
waveform. There are auxiliary information displayed on the bottom of this screen.
From right to left: The real time of the left edge of the screen, horizontal grid size
(time) and time between the screen cursors (red and blue cross).
VARNING: Any place of the data can be marked by the time synchronization
mark. The real time of the marked place can be set to any value. The real time of
the left most edge of the screen is related to this mark. Sometimes it can be a
negative value.
In addition to the waveforms, three types of cursors can be displayed on the
main screen.
5.3. Cursors
There are three types of cursors to perform measurements on the waveforms.
- time synchronization mark
- waveform cursors
- 24 -
Page 25

M570 series oscilloscope with rollmode User’s Guide
- screen cursors
The first and the second one are usable for time relation measurements. The
screen cursors are usable for both time and voltage measurements.
The time synchronization mark can be set to any place of the whole waveform.
The time of this place can be set to any value. Any “real time” information will be
calculated using this time. If the time synchronization mark is not used or it is deleted,
the “real time” information are synchronized with the beginning of the measurement
with time 0.
It is possible to place 10 “waveform cursors” (including the time
synchronization mark) to whole waveform. The positions of these cursors are shown
on all screens. They have different colors and names (C0 – C9). They are usable to get
“real time” information of their positions, information of time periods between these
cursors and the time period between the position of any of these cursors and the red
screen cursor. It is also simple to change the position of the main screen for displaying
the waveforms around any of these cursors (see chapter 5.3.1.).
It is possible to activate two ”screen cursors” on the main screen. They are
displayed as the red and blue crosses. The information about the time period between
these cursors is displayed under the screen (i.e.
). The results
of voltage measurements using these cursors are displayed above the main screen.
5.3.1. Using cursors
Click right mouse button on the main screen to pop-up menu.
Fig. 5.3.1.1. – Cursor manipulation menu
Add waveform cursor – Adds waveform cursor. It is possible to drag it to any
place of the main screen. The image of this cursor is also added to the file and buffer
screens. The cursor is visible on main and buffer screen depending on their content.
Set time synchro – Creates time synchronization mark, if it is not already
created. The mark has real time value 0 and it is possible to drag it to any place of the
main screen.
Bring cursor – Moves selected waveform cursor to the main screen. After
activation of this function the cursor selection menu will be displayed.
- 25 -
Page 26

M570 series oscilloscope with rollmode User’s Guide
Fig. 5.3.1.2. – Cursor selection menu
Delete last cursor – Deletes the last added cursor
Delete all cursors – Deletes all waveform cursors
Display times – Displays time periods between cursors
Fig. 5.3.1.3. – Time periods table
Because the string of the displayed time could be too long to display, if you
locate the mouse over the time string, the full information will be displayed. The time
periods are displayed including information of the relation of the cursors. It is the
difference between position of the cursor from the upper row and the cursor from left
column. If the time period value is negative, the cursor from left column points to
later time than the cursor from upper row.
Click “Export to clipboard” to save the time periods information to the
clipboard. The data consists of the pair of cursor’s names followed by data period
information (from position of the second cursor is subtracted the position of the first
one). The example of the clipboard export follows:
TimeSynchro-C1 = 63ms 29us 999ns
TimeSynchro-C2 = 126ms 779us 999ns
TimeSynchro-C3 = 3s 433ms 909us 999ns
TimeSynchro-C4 = 3s 592ms 529us 999ns
TimeSynchro-C5 = 5s 548ms 519us 999ns
- 26 -
Page 27

M570 series oscilloscope with rollmode User’s Guide
TimeSynchro-C6 = 10s 2ms 339us 999ns
TimeSynchro-C7 = 10s 64ms 739us 999ns
TimeSynchro-C8 = 10s 128ms 419us 999ns
TimeSynchro-C9 = 13s 562ms 360us
C1-TimeSynchro = - 63ms 49us 999ns
C1-C2 = 63ms 740us
C1-C3 = 3s 370ms 869us 999ns
C1-C4 = 3s 529ms 490us
C1-C5 = 5s 485ms 479us 999ns
C1-C6 = 9s 939ms 299us 999ns
C1-C7 = 10s 1ms 699us 999ns
C1-C8 = 10s 65ms 379us 999ns
C1-C9 = 13s 499ms 320us
C2-TimeSynchro = - 126ms 800us
C2-C1 = - 63ms 760us
C2-C3 = 3s 307ms 119us 999ns
C2-C4 = 3s 465ms 739us 999ns
C2-C5 = 5s 421ms 729us 999ns
C2-C6 = 9s 875ms 549us 999ns
C2-C7 = 9s 937ms 949us 999ns
C2-C8 = 10s 1ms 629us 999ns
C2-C9 = 13s 435ms 569us 999ns
C3-TimeSynchro = - 3s 433ms 929us 999ns
C3-C1 = - 3s 370ms 889us 999ns
C3-C2 = - 3s 307ms 139us 999ns
C3-C4 = 158ms 610us
C3-C5 = 2s 114ms 600us
C3-C6 = 6s 568ms 420us
C3-C7 = 6s 630ms 820us
C3-C8 = 6s 694ms 500us
C3-C9 = 10s 128ms 440us
C4-TimeSynchro = - 3s 592ms 550us
C4-C1 = - 3s 529ms 510us
C4-C2 = - 3s 465ms 760us
C4-C3 = - 158ms 630us
C4-C5 = 1s 955ms 979us 999ns
C4-C6 = 6s 409ms 799us 999ns
C4-C7 = 6s 472ms 199us 999ns
C4-C8 = 6s 535ms 880us
C4-C9 = 9s 969ms 819us 999ns
C5-TimeSynchro = - 5s 548ms 539us 999ns
C5-C1 = - 5s 485ms 500us
C5-C2 = - 5s 421ms 750us
C5-C3 = - 2s 114ms 620us
C5-C4 = - 1s 956ms
C5-C6 = 4s 453ms 809us 999ns
C5-C7 = 4s 516ms 210us
C5-C8 = 4s 579ms 889us 999ns
C5-C9 = 8s 13ms 830us
C6-TimeSynchro = - 10s 2ms 359us 999ns
- 27 -
Page 28

M570 series oscilloscope with rollmode User’s Guide
C6-C1 = - 9s 939ms 319us 999ns
C6-C2 = - 9s 875ms 569us 999ns
C6-C3 = - 6s 568ms 439us 999ns
C6-C4 = - 6s 409ms 819us 999ns
C6-C5 = - 4s 453ms 829us 999ns
C6-C7 = 62ms 389us 999ns
C6-C8 = 126ms 69us 999ns
C6-C9 = 3s 560ms 9us 999ns
C7-TimeSynchro = - 10s 64ms 760us
C7-C1 = - 10s 1ms 720us
C7-C2 = - 9s 937ms 969us 999ns
C7-C3 = - 6s 630ms 840us
C7-C4 = - 6s 472ms 220us
C7-C5 = - 4s 516ms 230us
C7-C6 = - 62ms 409us 999ns
C7-C8 = 63ms 670us
C7-C9 = 3s 497ms 609us 999ns
C8-TimeSynchro = - 10s 128ms 439us 999ns
C8-C1 = - 10s 65ms 399us 999ns
C8-C2 = - 10s 1ms 649us 999ns
C8-C3 = - 6s 694ms 519us 999ns
C8-C4 = - 6s 535ms 899us 999ns
C8-C5 = - 4s 579ms 909us 999ns
C8-C6 = - 126ms 90us
C8-C7 = - 63ms 690us
C8-C9 = 3s 433ms 929us 999ns
C9-TimeSynchro = - 13s 562ms 379us 999ns
C9-C1 = - 13s 499ms 340us
C9-C2 = - 13s 435ms 590us
C9-C3 = - 10s 128ms 460us
C9-C4 = - 9s 969ms 840us
C9-C5 = - 8s 13ms 849us 999ns
C9-C6 = - 3s 560ms 29us 999ns
C9-C7 = - 3s 497ms 630us
C9-C8 = - 3s 433ms 949us 999ns
Delete time synchro – Deletes time synchronization mark
The cursor properties can be modified. After clicking on the cursor (positioned
on the main screen) the following menu appears.
Fig. 5.3.1.4. – Cursor modification menu
Edit cursor – Displays the property modification screen
- 28 -
Page 29

M570 series oscilloscope with rollmode User’s Guide
Fig. 5.3.1.5. Property modification window
Cursor color – Changes the cursor’s color
Cursor name – The name of the selected cursor
VARNING: No warning or error message is displayed when the entered name is
the same as the name of any other cursor.
The entered attributes become active after clicking on the “OK” button.
Clicking “Cancel” closes the window with no property changes.
Clicking on the time synchronization mark opens different window.
Fig. 5.3.1.6. – Time synchro mark modification window
Cursor color – Change the cursor’s color
Cursor name – The name of the selected cursor
Time – Sets the real time of the time synchronization mark position. All real time
information will be related to this time. The following format is usable to enter the
time: xxhyymzz.zzzs. Where xxh – time in hours, yym – time in minutes, zz.zzzs –
time in seconds. While entering the time information the color of the string is blue. It
changes to black after pressing the “ENTER” key. Then it is possible to click to
“OK”, or “Cancel” as it is described above.
Fig. 5.3.1.7. shows the viewer screens with screen cursors activated. The
screen cursors can be activated/deactivated using the “Cursors” button above the
screens. There are nine waveform cursors and the time synchronization mark
positioned over the waveform. If the screen cursor or the time synchronization mark is
- 29 -
Page 30

M570 series oscilloscope with rollmode User’s Guide
not visible on the main screen, its position is marked by left or right pointing triangle.
The color of the triangle is the same as the color of the cursor.
Fig. 5.3.1.7. – Viewer screens with waveform cursors and time synchro mark
The relative position (order) of these triangles is the same as the placement of
the cursors.
Positioning the mouse cursor to the triangle, the real time of the cursor
position and the time period between the red screen cursor and the selected waveform
cursor (or synchronization time mark) is displayed. If the waveform cursor is visible
on the main screen, positioning the mouse cursor to it has the same effect as the
positioning to the triangle. If the screen cursors are not active, the time period
between the waveform cursor and the red screen cursor is not displayed.
The triangles are also usable to change the main screen position in the
waveform. Clicking to triangle changes the position of the main screen to display
waveform around the selected cursor (or time synchronization mark).
The screen cursors are also usable to measure voltages. The voltage of the
vertical position of red cursor, blue cursor and voltage between red and blue cursors
(for channels A and B) are displayed above the screen.
5.3.2. Measuring non-continuous data
Two types of discontinuity can occur:
- Internal buffer overflow during data acquisition.
- Discontinuity caused by ARM-ing data acquisition.
The result of a time period measurement with time discontinuity caused by
internal buffer overflow is displayed in red color, or as a string followed by “!”
character. This indicates, that the displayed time is not correct.
If the time break is caused by ARM-ing the data acquisition, the time can be
reconstructed and there is no difference between displaying the result of
- 30 -
Page 31

M570 series oscilloscope with rollmode User’s Guide
measurements with no time discontinuities and with time discontinuities caused by
ARM-ing.
5.4. Channel visibility controls
The channel visibility controls are located in the left of the main window.
Fig. 5.4.1. – Channel visibility controls
“A“ – activates/deactivates channel A waveform
“B“ – activates/deactivates channel B waveform
The buttons on the bottom row are reserved for future use and have no effect.
5.5. Waveform display mode control
The controls are located in the bottom of the main window.
Fig. 5.5.1. – Waveform display mode controls
If more than 1 sample is displayed to one dot of the waveform, it is necessary
to set the mode of creating the dot. There are two buttons to choose the basic mode.
If “SNG” is selected, only the first sample of time period represented by the
dot is displayed.
If “Calc” is selected, the dot is calculated out of all samples. The method of
calculation depends on the following controls:
If the
is activated, the displayed dot is calculated as average of the
measured samples.
If the
is activated, the displayed dot is calculated as a maximum of
measured samples.
If the
is activated, the displayed dot is calculated as a minimum of
measured samples.
If both the
and are activated, the line between maximum and
minimum value of samples is displayed.
- 31 -
Page 32

M570 series oscilloscope with rollmode User’s Guide
5.6. Zoom control
The waveform displayed on the main screen can be zoomed. The zoom
controls are located below the screens.
Fig. 5.6.1. Zoom controls
The upper button switches zoom on/off. If it is switched off each sample is
displayed as the dot on the screen. If it is activated, each displayed dot represents
several samples. Number of samples (zoom ratio) is displayed on the button. The
display mode is described in chapter 5.5. of this manual. The zoom ratio is controlled
via buttons “-“ and “+”.
5.7. Progress indicator
Some operations with the long data files can take lot of time. The progress
indicator located in the lower left side of the main window informs you about the state
of the operation.
Fig. 5.7.1. Progress indicator
The type of operation is indicated below the progress indicator.
5.8. Main menu
The main menu is located in the top of the main window. Following menu
items are available:
File | Print – Opens the print manager .
File | Exit – Closes application.
Settings | Color setup – Opens window for color selection.
Settings | Show grid – Activates/deactivates the grid on the main screen.
Help | Index – Displays the Help index.
Help | ETC web – Starts the internet browser installed in the computer to
display the ETC’s web site. This feature works only if the computer is already
connected to internet.
Help | Support – Sends the e-mail message to the ETC’s customer support.
This feature works only if the computer has connection to internet.
- 32 -
Page 33

M570 series oscilloscope with rollmode User’s Guide
Help | About – Displays information about product.
5.8.1. Print Support
To open the print manager window, click the “Print” item of the main menu.
Fig. 5.8.1.1. - Print Manager Window
On the left side of the window the page is previewed as it will be printed.
Several important parts of the page are highlighted. The lines marking these parts will
not be printed. The red line outlines the printable area of the page. Selected object is
marked by black dashed outline.
To select an object, click it. You can move it into a desired position by
dragging it. To change the size of a chosen object, drag its outline.
In the lower right corner of the window the following information on the
properties of the selected object is shown:
“Name” – Name of the object
“Position” – Coordinates of the upper-left corner of the object on the page in
millimeters
“Size” – Size of the object in millimeters
“Rect” – Position of the upper-left corner and the lower-right corner on the
page in millimeters
- 33 -
Page 34

M570 series oscilloscope with rollmode User’s Guide
Fig. 5.8.1.2. - Object Info
In the upper-right corner of the window names of all the objects that can be
placed into the page are listed. To display/hide an object, click the box next to the
object name. To select an object, click the name of the object (if the object is
displayed).
Fig. 5.8.1.3. - List of available objects
TIP: Two objects with content that can be specified by the user are available
(objects “Free text 1” and “Free text 2”). Double-clicking any of these objects
opens a dialog window to insert the text to be displayed.
It is possible to select automatic layout and predefined schemes of object
display in the “Layout” combo-box. Choosing the “Custom” item does not affect the
current layout.
WARNING: In the “Layout” combo-box only the layouts available for the
current paper size are shown.
It is possible to save a modified layout under the current name choosing the
“Layout | Save layout” item of the main menu of this window. To save it under a
different name, choose “Layout | Save layout as”. A dialog box will appear to insert
the name for the new layout.
Following are the other items Layout menu consists of:
„Layout | Manage layouts” – Opens the Layout manager window.
„File | Printer setup“ – Opens the printer settings window
„File | Print“ – Prints the page
- 34 -
Page 35

M570 series oscilloscope with rollmode User’s Guide
„File | Close“ – Terminates the print manager
5.8.1.1. Setting the name of a new layout
To open the Specify layout name dialog window, select the “Layout | Save
layout as” item. Now you can enter the name of the new scheme.
Fig. 5.8.1.1.1. - Specify Layout Name Window
It is necessary to insert a name of the new layout into the “New layout” box.
This name has to differ from the names of the existing layouts. If the name would be
identical with the name of another layout, this layout would be replaced by the new
layout. At the same time the existing layout would be highlighted in the layout list. If
you click a name of a layout in the list, this name will appear in the “New layout”
box.
To save the layout, click the OK button.
5.8.1.2. Layout Manager
To open the Layout Manager window, select the “Layout | Manage layouts”
item in the main menu of the print manager window.
- 35 -
Page 36

M570 series oscilloscope with rollmode User’s Guide
Fig. 5.8.1.2.1. - Layout Manager Window
To select a layout, double-click its name in the list.
To erase the selected layout, click the “Delete” button.
To rename a layout, select it, insert the new name into the “Layout name” box
and then click the “Rename” button.
5.8.2. Color settings window
The color settings window is opened after click on the main menu item.
Fig. 4.15.2.1. – Color settings window
Click “Set” button located by label to open standard operating system color
dialog to change color of:
“Channel A” – channel A waveform and controls
“Channel B” – channel B waveform and controls
“Grid” – grid
“Background” – background
6. Data file format
The format of acquired data is described in this chapter. The name of the file
can be any Windows compatible string with extension „rmd“.
- 36 -
Page 37

M570 series oscilloscope with rollmode User’s Guide
6.1. File contents
The main part of the file contains data measured by the oscilloscope. Also the
following data defining the oscilloscope’s setup are present:
- Vertical shift of channel A
- Vertical shift of channel B
- Attenuation of the probe connected to input of channel A
- Attenuation of the probe connected to input of channel B
- AC/DC switch setting on channel A
- AC/DC switch setting on channel B
- Position of zero, channel A
- Position of zero, channel B
- Sampling frequency
- Sensitivity of channel A
- Sensitivity of channel B
In addition to these information, there are two special indicators to indicate the
ARM and OVERRUN conditions of data acquisition.
6.2. Data format
The samples are represented as the 8 bit values with valid data range from 1 to
255.
TIP: The value 0 for acquired data is invalid. It is used to indicate the field of
special information.
The samples are stored chronologically in order of sampling. Channel B is
first.
The special indicators are stored in the place of occurrence. There are two
special indicators, both are 16 bit wide:
ARM: 0x0002 (this indicator is stored in 16 bit word as 02 00, because the Big
Endian method is used.).
OVERRUN: 0x0001 (this indicator is stored in 16 bit word as 01 00, because
the Big Endian method is used.).
6.3. The oscilloscope settings
All oscilloscope settings are stored as the array of 16 bit words. The structure
of the array is as follows:
0x0000 – Beginning of the oscilloscope settings field.
LNG - Length of the structure including field indicator in 16-bit wide words.
CODE - Setting code
DATA - Data for described setting
- 37 -
Page 38

M570 series oscilloscope with rollmode User’s Guide
6.3.1. Setting codes
0x0001 – measurement start/stop
+ 16-bit word (1 – start of measurement , 0 – stop of measurement)
0x0002 – Vertical shift of channel A
+ 16-bit value of vertical position
+ 16-bit signed position of 0V
0x0003 – Vertical shift of channel B
+ 16-bit value of vertical position
+ 16-bit signed position of 0V
REMARK: Position of zero represents the position of 0V on the screen. In case
the waveform is shifted out of the scope screen, it can be <1 or >255.
0x0004 – Attenuation of probe connected to input of channel A
+ 16-bit attenuation value (1 – 1:1, 2 – 1:10, 3 – 1:100, 4 – 1:1000)
0x0005 - Attenuation of probe connected to input of channel B
+ 16-bit attenuation value (1 – 1:1, 2 – 1:10, 3 – 1:100, 4 – 1:1000)
0x0006 – AC/DC switch setting for channel A
+ 16-bit word (1 – AC, 0 – DC)
0x0007 - AC/DC switch setting for channel B
+ 16-bit word (1 – AC, 0 – DC)
0x0008 – Position of zero in for channel A
+ 16-bit signed position of 0V
0x0009 - Position of zero in for channel B
+ 16-bit signed position of 0V
0x000A – Sampling frequency
+ 32-bit sampling frequency (in Hz)
0x000B – Sensitivity of channel A
+ 32-bit sensitivity (in mV/div)
0x000C – Sensitivity of channel B
+ 32-bit sensitivity (in mV/div)
- 38 -
 Loading...