

Page 1
Instruction Manual
748213-S
April 2002
Model 755R
Oxygen Analyzer
http://www.processanalytic.com
Page 2

ESSENTIAL INSTRUCTIONS
READ THIS PAGE BEFORE PROCEEDING!
Rosemount Analytical designs, manufactures and tests its products to meet many national and
international standards. Because these instruments are sophisticated technical products, you
MUST properly install, use, and maintain them to ensure they continue to operate within their
normal specifications. The following instructions MUST be adhered to and integrated into your
safety program when installing, using, and maintaining Rosemount Analytical products. Failure to
follow the proper instructions may cause any one of the following situations to occur: Loss of life;
personal injury; property damage; damage to this instrument; and warranty invalidation.
•
Read all instructions prior to installing, operating, and servicing the product.
If you do not understand any of the instructions, contact your Rosemount Analytical representative
•
for clarification.
•
Follow all warnings, cautions, and instructions marked on and supplied with the product.
•
Inform and educate your personnel in the proper installation, operation, and maintenance of
the product.
•
Install your equipment as specified in the Installation Instructions of the appropriate
Instruction Manual and per applicable local and national codes. Connect all products to the
proper electrical and pressure sources.
To ensure proper performance, use qualified personnel to install, operate, update, program, and
•
maintain the product.
When replacement parts are required, ensure that qualified people use replacement parts specified by
•
Rosemount. Unauthorized parts and procedures can affect the product’s performance, place the safe
operation of your process at risk, and VOID YOUR WARRANTY. Look-alike substitutions may result
in fire, electrical hazards, or improper operation.
•
Ensure that all equipment doors are closed and protective covers are in place, except when
maintenance is being performed by qualified persons, to prevent electrical shock and personal
injury.
The information contained in this document is subject to change without notice.
Teflon and Viton are registered trademarks of E.I. duPont de Nemours and Co., Inc.
Paliney No.7 is a trademark of J.M. Ney Co., Hartford, CT
SNOOP is a registered trademark of NUPRO Co.
Emerson Process Management
Rosemount Analytical Inc.
Process Analytic Division
1201 N. Main St.
Orrville, OH 44667-0901
T (330) 682-9010
F (330) 684-4434
e-mail: gas.csc@EmersonProcess.com
http://www.processanalytic.com
Page 3

Model 755R
PREFACE...........................................................................................................................................P-1
Definitions ...........................................................................................................................................P-1
Intended Use Statement.....................................................................................................................P-2
Safety Summary .................................................................................................................................P-2
General Precautions For Handling And Storing High Pressure Gas Cylinders .................................P-4
Documentation....................................................................................................................................P-5
Compliances .......................................................................................................................................P-5
1-0 DESCRIPTION AND SPECIFICATIONS..............................................................................1-1
1-1 Description.............................................................................................................................1-1
1-2 Recorder Output Ranges.......................................................................................................1-1
1-3 Mounting................................................................................................................................1-1
1-4 Isolated Current Output Option .............................................................................................1-1
1-5 Alarm Option..........................................................................................................................1-2
1-6 Electrical Options...................................................................................................................1-2
1-7 Remote Range Change Option .............................................................................................1-2
1-8 Specifications ........................................................................................................................1-3
a. Performance....................................................................................................................1-3
b. Sample ............................................................................................................................1-3
c. Electrical..........................................................................................................................1-4
d. Physical...........................................................................................................................1-4
Instruction Manual
748213-S
April 2002
TABLE OF CONTENTS
2-0 INSTALLATION ....................................................................................................................2-1
2-1 Facility Preparation................................................................................................................2-1
a. Installation Drawings.......................................................................................................2-1
b. Electrical Interconnection Diagram ...............................................................................2-1
c. Flow Diagram ..................................................................................................................2-1
d. Location and Mounting....................................................................................................2-1
2-2 Calibration Gas Requirements ..............................................................................................2-2
a. Zero Standard Gas..........................................................................................................2-2
b. Span Standard Gas ........................................................................................................2-2
2-3 Sample...................................................................................................................................2-2
a. Temperature Requirements ............................................................................................2-2
b. Pressure Requirements - General ..................................................................................2-3
c. Normal Operation at Positive Gauge Pressures.............................................................2-3
d. Operation at Negative Gauge Pressures........................................................................2-4
e. Flow Rate ........................................................................................................................2-4
f. Materials in Contact with Sample...................................................................................2-4
g. Corrosive Gases .............................................................................................................2-4
2-4 Leak Test ...............................................................................................................................2-5
2-5 Electrical Connections ...........................................................................................................2-6
a. Line Power Connection...................................................................................................2-6
b. Recorder Output Selection and Cable Connections .......................................................2-6
c. Potentiometric Output .....................................................................................................2-7
d. Isolated Current Output (Optional)..................................................................................2-7
e. Output Connections and Initial Setup for Dual Alarm Option .........................................2-8
2-6 Remote Range Change Option .............................................................................................2-12
Rosemount Analytical Inc. A Division of Emerson Process Management Contents i
Page 4

Instruction Manual
748213-S
April 2002
3-0 OPERATION .........................................................................................................................3-1
3-1 Overview................................................................................................................................3-1
3-2 Operating Range Selection ...................................................................................................3-1
3-3 Startup Procedure .................................................................................................................3-1
3-4 Calibration..............................................................................................................................3-1
a. Calibration with Zero and Span Standard Gases ...........................................................3-1
3-5 Compensation For Composition Of Background Gas ...........................................................3-2
a. Oxygen Equivalent Value of Gases ................................................................................3-4
b. Computing Adjusted Settings for Zero and Span Controls.............................................3-4
3-6 Selection Of Setpoints And Deadband On Alarm Option......................................................3-7
3-7 Current Output Board (Option) ..............................................................................................3-7
3-8 Routine Operation .................................................................................................................3-8
3-9 Effect of Barometric Pressure Changes on Instrument Readout ..........................................3-8
3-10 Calibration Frequency ...........................................................................................................3-8
4-0 THEORY................................................................................................................................4-1
4-1 Principles of Operation ..........................................................................................................4-1
4-2 Variables Influencing Paramagnetic Oxygen Measurements ...............................................4-2
a. Pressure Effects..............................................................................................................4-2
4-3 Electronic Circuitry.................................................................................................................4-4
a. Detector/Magnet Assembly.............................................................................................4-4
b. Control Board and Associated Circuitry..........................................................................4-4
c. Power Supply Board Assembly.......................................................................................4-5
d. Isolated Current Output Board (Optional) .......................................................................4-6
Model 755R
5-0 CIRCUIT ANALYSIS.............................................................................................................5-1
5-1 Circuit Operation....................................................................................................................5-1
5-2 ±15 VDC Power Supply.........................................................................................................5-1
5-3 Case Heater Control Circuit...................................................................................................5-1
5-4 Detector Heater Control Circuit .............................................................................................5-6
5-5 Detector Light Source Control Circuit....................................................................................5-7
5-6 Detector with First Stage Amplifier ........................................................................................5-8
5-7 Buffer Amplifiers U8 and U10 with Associated Anticipation Function ...................................5-10
5-8 Digital Output Circuit..............................................................................................................5-10
5-9 Analog Output Circuits for Recorder and Alarms ..................................................................5-11
a. First Stage Amplifier........................................................................................................5-11
b. Second Stage Amplifier ..................................................................................................5-11
6-0 MAINTENANCE AND SERVICE ..........................................................................................6-1
6-1 Initial Checkout With Standard Gases...................................................................................6-1
a. Control Board Checkout..................................................................................................6-1
6-2 Heating Circuits .....................................................................................................................6-2
a. Case Heater Control Circuit ............................................................................................6-2
6-3 Detector/Magnet Heating Circuit ...........................................................................................6-2
6-4 Detector Check......................................................................................................................6-4
a. Source Lamp...................................................................................................................6-5
b. Photocell .........................................................................................................................6-5
c. Suspension .....................................................................................................................6-5
ii Contents Rosemount Analytical Inc. A Division of Emerson Process Management
Page 5

Model 755R
6-5 Replacement Of Detector/Magnet Components ...................................................................6-5
a. Source Lamp...................................................................................................................6-5
b. Photocell .........................................................................................................................6-5
c. Detector...........................................................................................................................6-7
6-6 Control Board Setup ..............................................................................................................6-7
a. Power Supply Test..........................................................................................................6-7
b. Detector zero...................................................................................................................6-7
c. U4 Zero ...........................................................................................................................6-8
d. U8 Zero ...........................................................................................................................6-8
e. U10 Zero .........................................................................................................................6-8
f. Fullscale ..........................................................................................................................6-8
g. Recorder Fullscale ..........................................................................................................6-8
7-0 REPLACEMENT PARTS ......................................................................................................7-1
7-1 Circuit Board Replacement Policy .........................................................................................7-1
7-2 Matrix – Model 755R Oxygen Analyzer.................................................................................7-2
7-3 Selected Replacement Parts.................................................................................................7-3
Instruction Manual
748213-S
April 2002
8-0 RETURN OF MATERIAL ......................................................................................................8-1
8-1 Return Of Material .................................................................................................................8-1
8-2 Customer Service ..................................................................................................................8-1
8-3 Training..................................................................................................................................8-1
LIST OF ILLUSTRATIONS
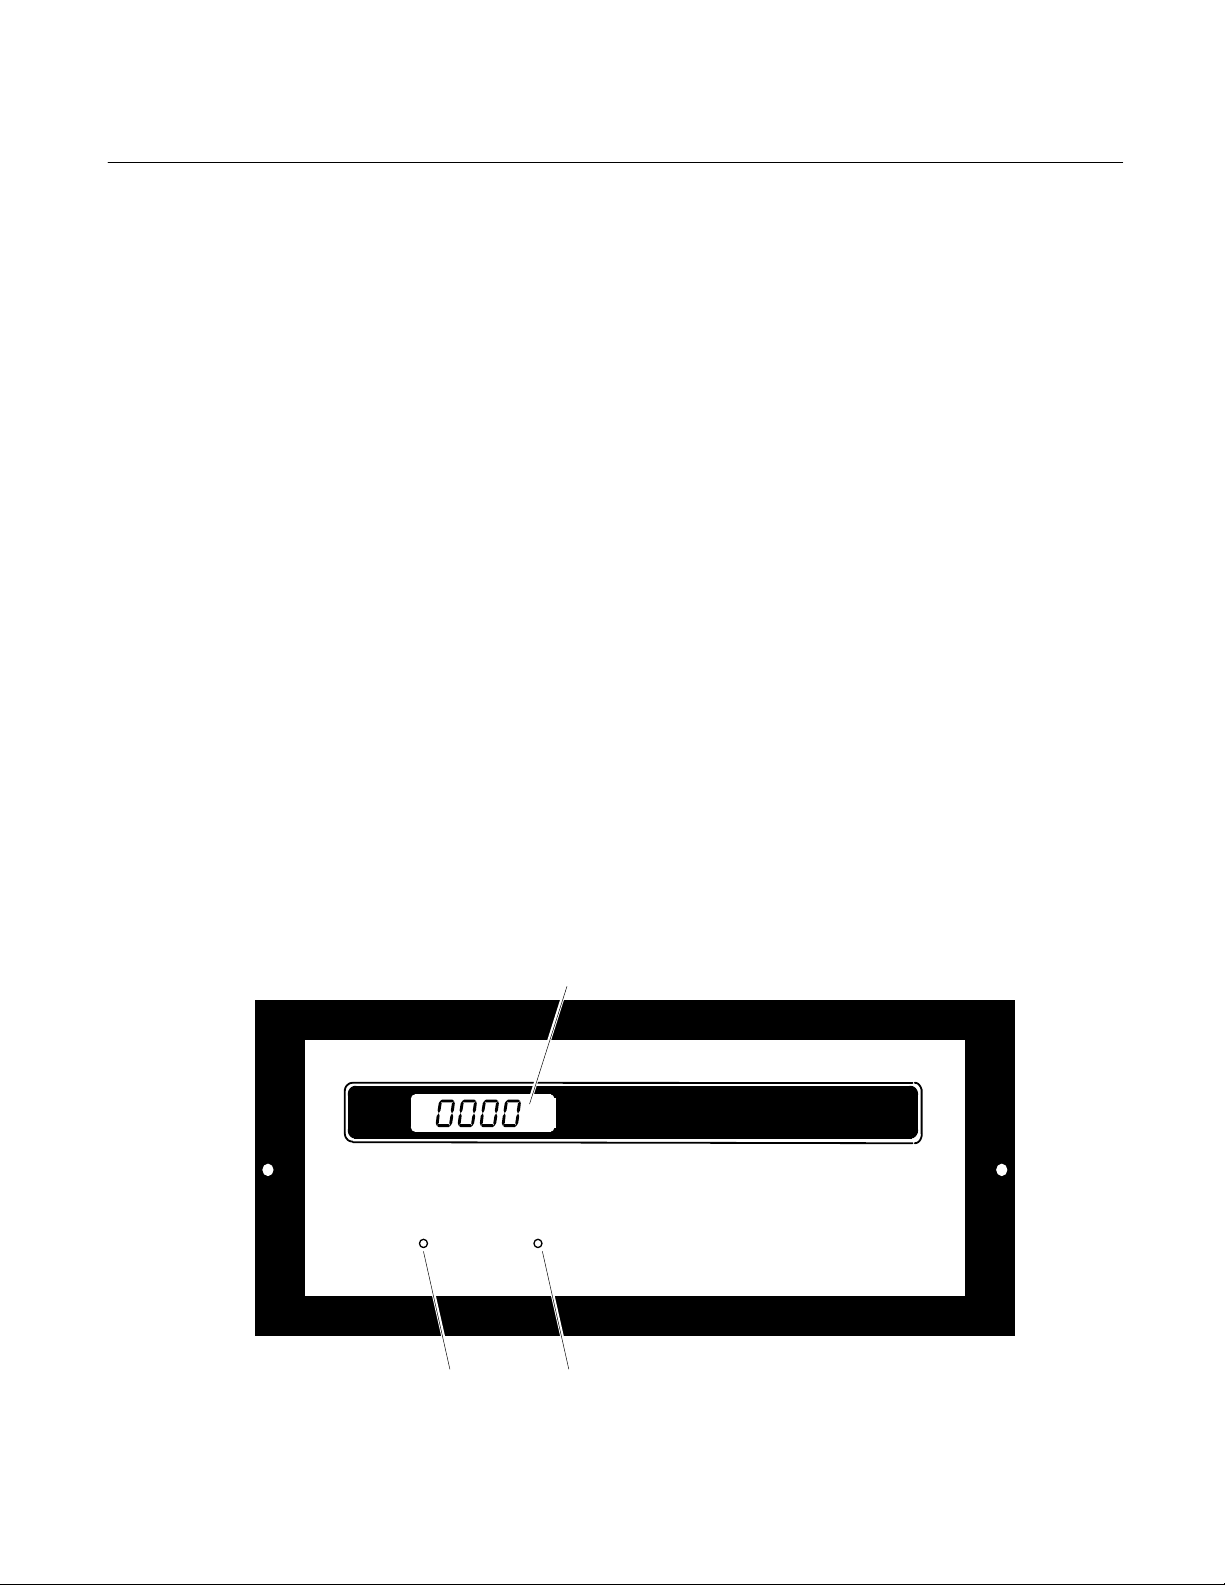
Figure 1-1. Model 755R Oxygen Analyzer – Front Panel ........................................................ 1-1
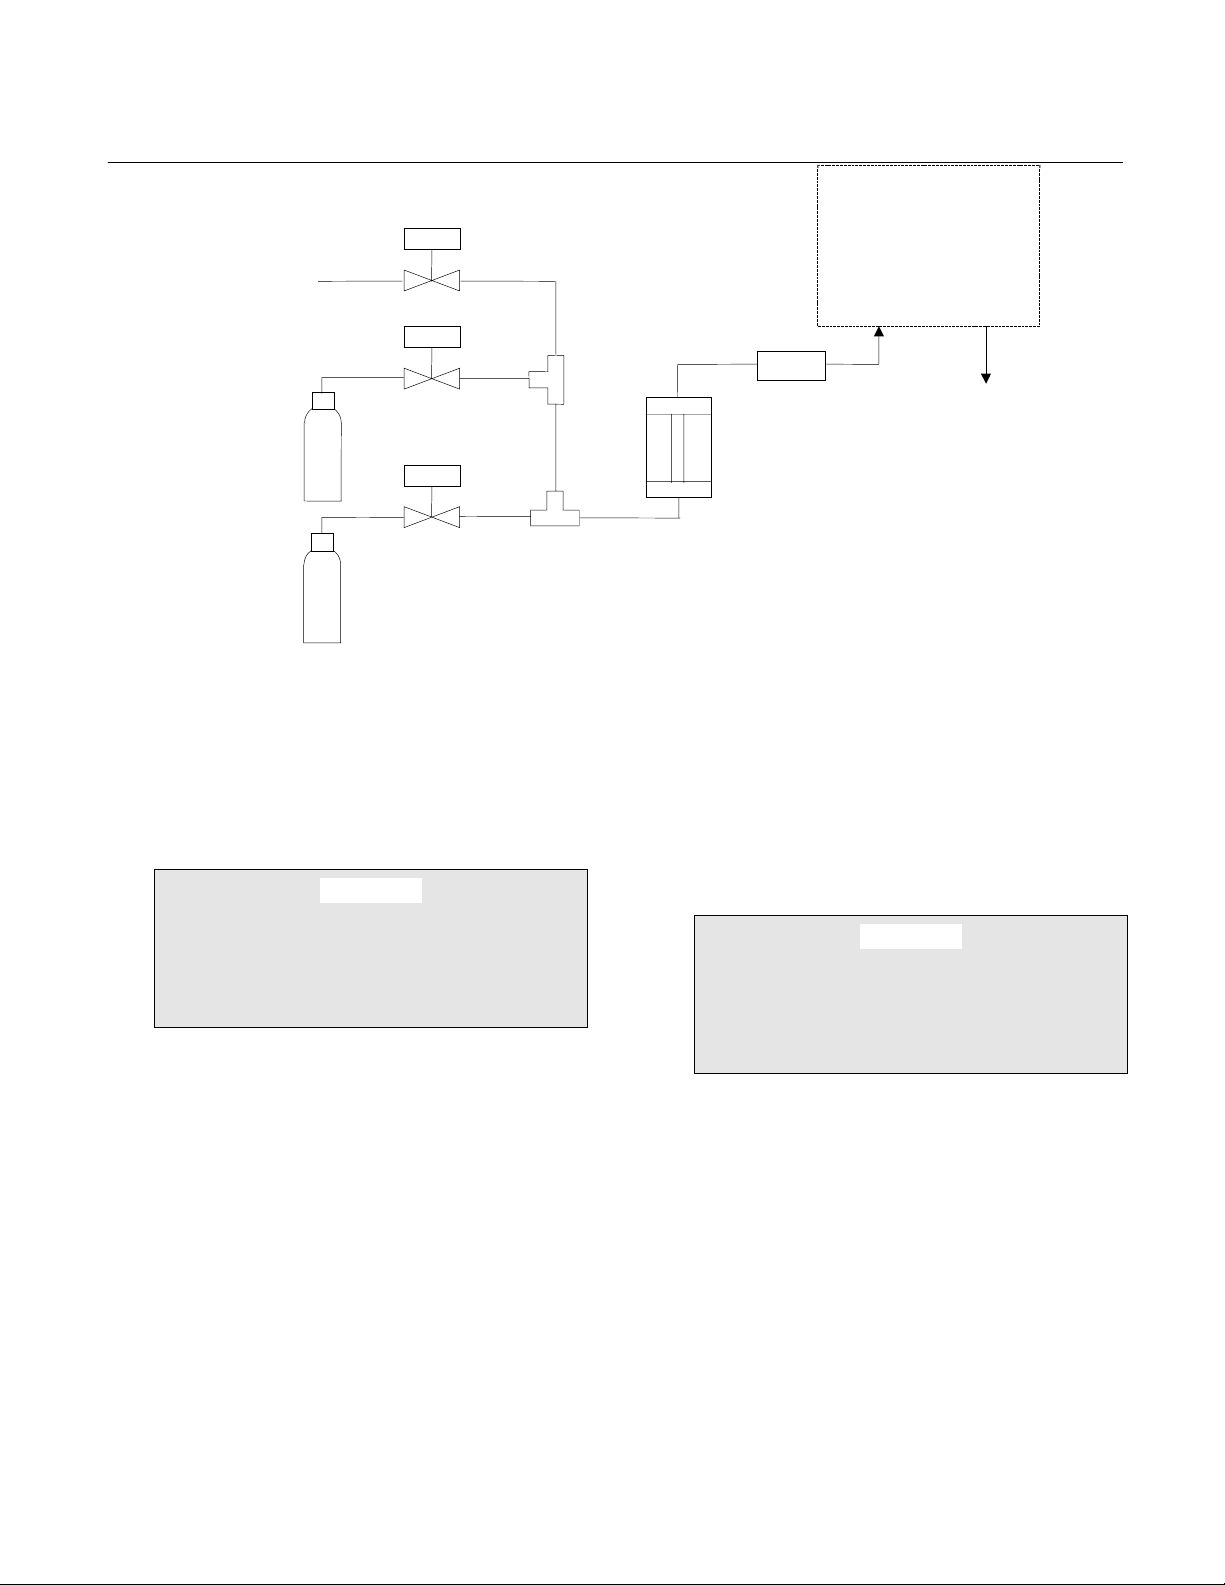
Figure 2-1. Interconnect of Typical Gas Manifold to Model 755R............................................ 2-3
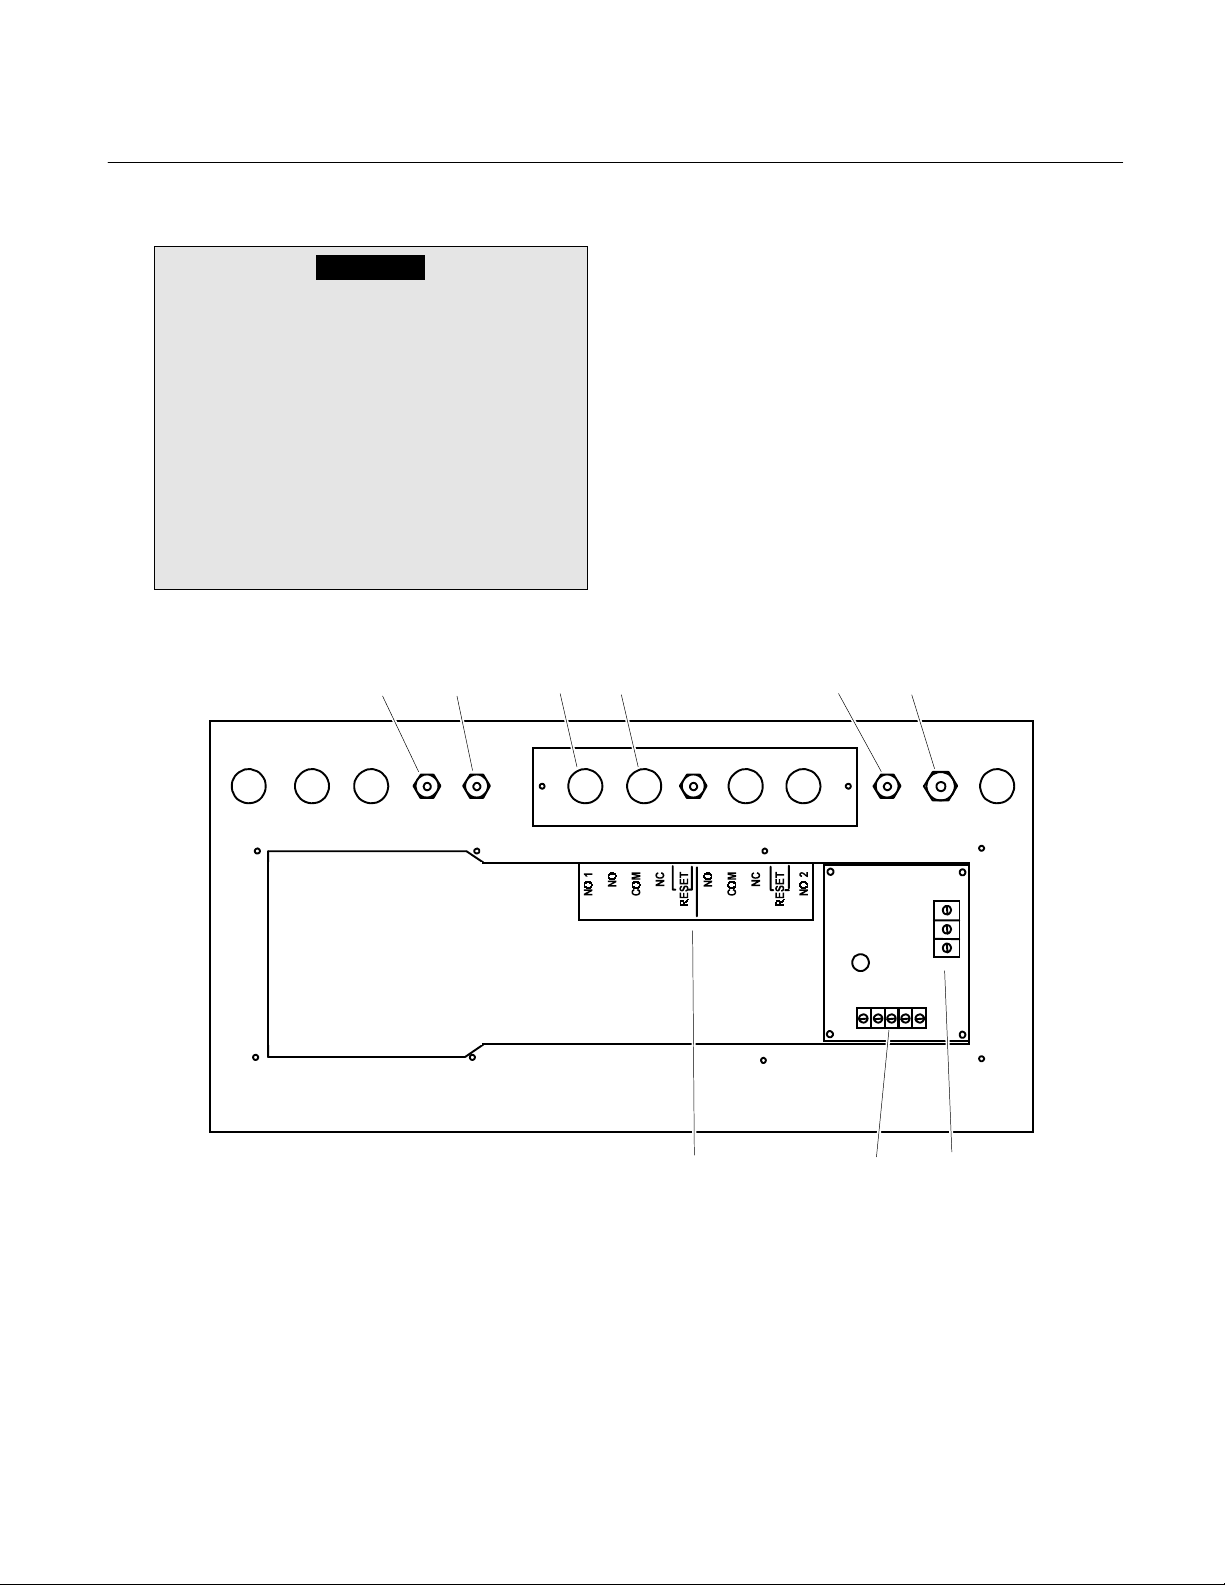
Figure 2-2. Model 755R Rear Panel ........................................................................................ 2-5
Figure 2-3. Connections for Potentiometric Recorder with Non-Standard Span ..................... 2-6
Figure 2-4. Model 755R Connected to Drive Several Current-Actuated Output Devices........ 2-7
Figure 2-5. Relay Terminal Connections for Typical Fail-Safe Applications............................ 2-8
Figure 2-6. Typical Alarm Settings ......................................................................................... 2-10
Figure 2-7. Alarm Relay Assembly Schematic Diagram ........................................................ 2-11
Figure 3-1. Control Board - Adjustment Locations................................................................... 3-3
Figure 3-2. Dial Settings for Alarm Setpoint Adjustments........................................................ 3-7
Figure 4-1. Functional Diagram of Paramagnetic Oxygen Measurement System................... 4-3
Figure 4-2. Spherical Body in Non-Uniform Magnetic Field..................................................... 4-4
Figure 4-3. Detector/Magnet Assembly.................................................................................... 4-7
Figure 5-1. Two-Comparator OR Circuit .................................................................................. 5-2
Figure 5-2. Case Heater Control Circuit................................................................................... 5-3
Figure 5-3. Ramp Generator Circuit......................................................................................... 5-3
Figure 5-4. Detector Heater Control Circuit.............................................................................. 5-6
Figure 5-5. Detector Light Source Control Circuit .................................................................... 5-7
Figure 5-6. Detector with First Stage Amplifier ........................................................................ 5-9
Figure 5-7. Buffer, Anticipation, and Digital Output Circuits................................................... 5-10
Figure 5-8. Simplified Analog Recorder Output Circuit .......................................................... 5-12
Figure 6-1. Detector/Magnet Assembly.................................................................................... 6-3
Figure 6-2. Pin/Lead Removal ................................................................................................. 6-4
Figure 6-3. Detector Optical Bench.......................................................................................... 6-4
Figure 6-4. Lamp Replacement................................................................................................ 6-6
Rosemount Analytical Inc. A Division of Emerson Process Management Contents iii
Page 6

Instruction Manual
748213-S
April 2002
Table 2-1. Remote Range Switching Truth Table................................................................. 2-12
Table 3-1. Calibration Range for Various Zero-Based Operating Ranges ............................. 3-4
Table 3-2. Oxygen Equivalent of Common Gases ................................................................. 3-6
Model 755R
LIST OF TABLES
DRAWINGS
617186 Schematic Diagram, Case Board
620434 Schematic Diagram, Isolated Current Output Board
646090 Schematic Diagram, Remote Range Board
652826 Schematic Diagram, Control Board
654014 Pictorial Wiring Diagram, Model 755R
654015 Installation Drawing, Model 755R
656081 Instructions, Remote Range Selection
(LOCATED IN REAR OF MANUAL)
iv Contents Rosemount Analytical Inc. A Division of Emerson Process Management
Page 7

Instruction Manual
Model 755R
PREFACE
The purpose of this manual is to provide information concerning the components,
functions, installation and maintenance of the 755R.
Some sections may describe equipment not used in your configuration. The user should
become thoroughly familiar with the operation of this module before operating it. Read
this instruction manual completely.
DEFINITIONS
The following definitions apply to DANGERS, WARNINGS, CAUTIONS and NOTES found throughout
this publication.
DANGER .
748213-S
April 2002
Highlights the presence of a hazard which will cause severe personal injury, death, or substantial
property damage if the warning is ignored.
WARNING .
Highlights an operation or maintenance procedure, practice, condition, statement, etc. If not
strictly observed, could result in injury, death, or long-term health hazards of personnel.
CAUTION.
Highlights an operation or maintenance procedure, practice, condition, statement, etc. If not
strictly observed, could result in damage to or destruction of equipment, or loss of effectiveness.
NOTE
Highlights an essential operating procedure,
condition or statement.
Rosemount Analytical Inc. A Division of Emerson Process Management Preface P-1
Page 8

Instruction Manual
748213-S
April 2002
Model 755R
INTENDED USE STATEMENT
The Model 755R is intended for use as an industrial process measurement device only. It is not intended
for use in medical, diagnostic, or life support applications, and no independent agency certifications or
approvals are to be implied as covering such application.
SAFETY SUMMARY
If this equipment is used in a manner not specified in these instructions, protective systems may be
impaired.
AUTHORIZED PERSONNEL
To avoid explosion, loss of life, personal injury and damage to this equipment and on-site
property, all personnel authorized to install, operate and service the this equipment should be
thoroughly familiar with and strictly follow the instructions in this manual. SAVE THESE
INSTRUCTIONS.
DANGER.
ELECTRICAL SHOCK HAZARD
Do not operate without doors and covers secure. Servicing requires access to live parts which can
cause death or serious injury. Refer servicing to qualified personnel.
For safety and proper performance this instrument must be connected to a properly grounded
three-wire source of power.
Optional alarm switching relay contacts wired to separate power sources must be disconnected
before servicing.
WARNING
POSSIBLE EXPLOSION HAZARD
This analyzer is of a type capable of analysis of sample gases which may be flammable. If used for
analysis of such gases, internal leakage of sample could result in an explosion causing death, personal injury, or property damage. Do not use this analyzer on flammable samples. Use explosionproof version instruments for analysis of flammable samples.
P-2 Preface Rosemount Analytical Inc. A Division of Emerson Process Management
Page 9

Instruction Manual
Model 755R
WARNING.
PARTS INTEGRITY
Tampering or unauthorized substitution of components may adversely affect safety of this product.
Use only factory documented components for repair.
CAUTION
PRESSURIZED GAS
This module requires periodic use of pressurized gas. See General Precautions for Handling and
Storing High Pressure Gas Cylinders, page P-4
CAUTION
TOPPLING HAZARD
This instrument’s internal pullout chassis is equipped with a safety stop latch located on the left
side of the chassis.
748213-S
April 2002
When extracting the chassis, verify that the safety latch is in its proper (counter-clockwise) orientation.
If access to the rear of the chassis is required, the safety stop may be overridden by lifting the
latch; however, further extraction must be done very carefully to insure the chassis does not fall
out of its enclosure.
If the instrument is located on top of a table or bench near the edge, and the chassis is extracted, it
must be supported to prevent toppling.
Rosemount Analytical Inc. A Division of Emerson Process Management Preface P-3
Page 10

Instruction Manual
748213-S
April 2002
Model 755R
GENERAL PRECAUTIONS FOR HANDLING AND STORING HIGH
PRESSURE GAS CYLINDERS
Edited from selected paragraphs of the Compressed Gas Association's "Handbook of Compressed
Gases" published in 1981
Compressed Gas Association
1235 Jefferson Davis Highway
Arlington, Virginia 22202
Used by Permission
1. Never drop cylinders or permit them to strike each other violently.
2. Cylinders may be stored in the open, but in such cases, should be protected against extremes of weather
and, to prevent rusting, from the dampness of the ground. Cylinders should be stored in the shade when
located in areas where extreme temperatures are prevalent.
3. The valve protection cap should be left on each cylinder until it has been secured against a wall or bench, or
placed in a cylinder stand, and is ready to be used.
4. Avoid dragging, rolling, or sliding cylinders, even for a short distance; they should be moved by using a
suitable hand-truck.
5. Never tamper with safety devices in valves or cylinders.
6. Do not store full and empty cylinders together. Serious suckback can occur when an empty cylinder is
attached to a pressurized system.
7. No part of cylinder should be subjected to a temperature higher than 125°F (52°C). A flame should never be
permitted to come in contact with any part of a compressed gas cylinder.
8. Do not place cylinders where they may become part of an electric circuit. When electric arc welding,
precautions must be taken to prevent striking an arc against the cylinder.
P-4 Preface Rosemount Analytical Inc. A Division of Emerson Process Management
Page 11

Instruction Manual
Model 755R
DOCUMENTATION
The following Model 755R instruction materials are available. Contact Customer Service Center or the
local representative to order.
748213 Instruction Manual (this document)
COMPLIANCES
This product satisfies all obligations of all relevant standards of the EMC framework in Australia and New
Zealand.
748213-S
April 2002
N
9
6
Rosemount Analytical Inc. A Division of Emerson Process Management Preface P-5
Page 12

Instruction Manual
748213-S
April 2002
Model 755R
P-6 Preface Rosemount Analytical Inc. A Division of Emerson Process Management
Page 13
Model 755R
y
Instruction Manual
748213-S
April 2002
SECTION 1
DESCRIPTION AND SPECIFICATIONS
1-1 DESCRIPTION
The Model 755R Oxygen Analyzer provides
continuous readout of the oxygen content of a
flowing gas sample. The determination is
based on measurement of the magnetic susceptibility of the sample gas. Oxygen is
strongly paramagnetic while most other common gases are weakly diamagnetic.
The instrument provides direct readout of 0 to
100% oxygen concentration on a front panel
digital display. In addition, a field-selectable
voltage output is provided as standard. An
isolated current output of 0 to 20 mA or 4 to
20 mA is obtainable through plug-in of an optional circuit board. Current and voltage outputs may be utilized simultaneously if desired.
An alarm option is also available by way of a
relay assembly that mounts at the rear of the
case with a cable that plugs into the Control
Board. Customer connections are available on
this assembly.
The basic electronic circuitry is incorporated
into two master boards designated the Control
Board assembly and the Power Supply Board
assembly. The Control Board has receptacles
that accept optional plug-in current output
board and alarm features.
1-2 RECORDER OUTPUT RANGES
Seven zero-based ranges are available with
the Model 755R: 0 to 1%, 0 to 2.5%, 0 to 5%, 0
to 10%, 0 to 25%, 0 to 50%, and 0 to 100%.
Each range is jumper selectable.
1-3 MOUNTING
The Model 755R is a rack-mounted instrument, standard for a 19-inch relay rack (Refer
to IEC Standard, Publication 297-1, 1986).
1-4 ISOLATED CURRENT OUTPUT OPTION
An isolated current output is obtainable by
using an optional current output board, either
during factory assembly or subsequently in
the field. The board provides ranges of 0 to 20
or 4 to 20 mA into a maximum resistive load
of 1000 ohms.
Digital Displa
O
%
2
SPANZERO
Rosemount Analytical
Zero Control Span Control
Model 755R
Figure 1-1. Model 755R Oxygen Analyzer – Front Panel
Rosemount Analytical Inc. A Division of Emerson Process Management Description and Specifications 1-1
Page 14

Instruction Manual
748213-S
April 2002
Model 755R
1-5 ALARM OPTION
The alarm option contains:
An alarm circuit incorporating two com-
•
parator amplifiers, one each for the
ALARM 1 and ALARM 2 functions. Each
amplifier has associated setpoint and
deadband adjustments. Setpoint is adjustable from 1% to 100% of fullscale.
Deadband is adjustable from 1% to 20%
of fullscale.
An alarm relay assembly, containing two
•
single-pole, double-throw relays (one
each for the ALARM 1 and ALARM 2
contacts). These relays may be used to
drive external, customer-supplied alarm
and/or control devices.
1-6 ELECTRICAL OPTIONS
The analyzer is supplied, as ordered, for operation on either 115 VAC, 50/60 Hz or 230
VAC, 50/60 Hz.
1-7 REMOTE RANGE CHANGE OPTION
This option allows the customer to remotely
control the recorder scaling. It disables the
internal recorder fullscale range select without
affecting the front panel display.
1-2 Description and Specifications Rosemount Analytical Inc. A Division of Emerson Process Management
Page 15

Model 755R
Instruction Manual
748213-S
April 2002
1-8 SPECIFICATIONS
a. Performance
Operating Range (Standard)......... 0 to 5, 0 to 10, 0 to 25, 0 to 50, and 0 to 100% oxygen
Operating Range (Optional) .......... 0 to 1, 0 to 2.5, 0 to 5, 0 to 10, 0 to 25, 0 to 50, and 0 to 100%
Response Time ............................. 90% of fullscale, 20 seconds
Reproducibility............................... 0.01% oxygen or ±1% of fullscale, whichever is greater
Ambient Temperature Limits ......... 32°F (0°C) to 113°F (45°C)
Zero Drift........................................ ±1% fullscale per 24 hours, provided that ambient temperature
Span Drift....................................... ±1% fullscale per 24 hours, provided that ambient temperature
b. Sample
Dryness ......................................... Sample dewpoint below 110°F (43°C), sample free of entrained
Temperature Limits ....................... 50°F (10°C) to 150°F (65°C)
Operating Pressure ....................... Maximum: 10 psig (68.9 kPa)
....................................................... Minimum: 5 psig vacuum (34.5 kPa vacuum)
Flow Rate ...................................... 50 cc/min. to 500 cc/min.
....................................................... Recommended 250 ±20 cc/min.
Materials in Contact with Sample.. Glass, 316 stainless steel, titanium, Paliney No. 7, epoxy resin,
1
oxygen
does not change by more than 20°F (11.1°C)
±2.5% of fullscale per 24 hours with ambient temperature change
over entire range
does not change by more than 20°F (11.1°C)
±2.5% of fullscale per 24 hours with ambient temperature change
over entire range
liquids.
Viton-A, platinum, nickel, and MgF2
1
Performance specifications are measured at recorder output and are based on constant sample pressure and deviation from
set flow held to within 10% or 20 cc/min., whichever is smaller.
Rosemount Analytical Inc. A Division of Emerson Process Management Description and Specifications 1-3
Page 16

Instruction Manual
748213-S
April 2002
c. Electrical
Supply Voltage and Frequency
(selectable when ordered)............ Standard: 115 VAC ±10 VAC, 50/60 Hz
Power Consumption ...................... Maximum: 300 watts
Outputs .......................................... Standard: Field selectable voltage output of 0 to 10mV, 0 to
Alarm Option.................................. High-Low Alarm
Contact Ratings ..................... 5 amperes, 240V AC, resistive 3 amperes, 120 VAC inductive
Setpoint ......................................... Adjustable from 1% to 100% of fullscale
Deadband ...................................... Adjustable from 1% to 20% of fullscale (Factory set at 10% of
Model 755R
Optional: 230 VAC ±10 VAC, 50/60 Hz
100mV, 0 to 1V, or 0 to 5VDC
Optional: Isolated current output of 0 to 20mA or 4 to 20mA (with
Current Output Board)
1 amperes, 24V DC, resistive 5 amperes, 30 VDC resistive
5 amperes, 120V AC, resistive 3 amperes, 30 VDC inductive
fullscale)
d. Physical
Mounting........................................ 19 inch rack (IEC 297-1, 1986)
Case Classification........................ General Purpose
Weight ........................................... 46 lbs. (21 kg)
Dimensions.................................... 19.0 x 8.7 x 19.2 inches (482.2 x 221 x 487 mm) W x H x D
1-4 Description and Specifications Rosemount Analytical Inc. A Division of Emerson Process Management
Page 17

Model 755R
Instruction Manual
748213-S
April 2002
SECTION 2
INSTALLATION
2-1 FACILITY PREPARATION
Observe all precautions given in this section
when installing the instrument.
a. Installation Drawings
For outline and mounting dimensions, gas
connections, and other installation information, refer to Installation Drawing
654015 at the back of this manual.
b. Electrical Interconnection Diagram
Electrical interconnection is also shown in
drawing 654015. Refer also to Section 25, page 2-6.
c. Flow Diagram
The flow diagram of Figure 2-1 (page 2-3)
shows connection of a typical gas selector
manifold to the Model 755R.
d. Location and Mounting
Install the Model 755R only in a
non-hazardous, weather-protected area.
Permissible ambient temperature range is
32°F to 113°F (0°C to 45°C). Avoid
mounting where ambient temperature
may exceed the allowable maximum.
Magnetic susceptibilities and partial pressures of gases vary with temperature. In
the Model 755R, temperature-induced
readout error is avoided by control of
temperatures in the following areas:
tector, the sample is preheated by
passage through a coil maintained at
approximately the same temperature
as the detector (See Figure 4-3A,
page 4-7).
3. The detector is maintained at a controlled temperature of 150°F (66°C).
Also, avoid excessive vibration. To minimize vibration effects, the detector/magnet assembly is contained in a
shock-mounted compartment.
WARNING
POSSIBLE EXPLOSION HAZARD
This analyzer is of a type capable of analysis of sample gases which may be flammable. If used for analysis of such gases,
internal leakage of sample could result in
an explosion causing death, personal injury, or property damage. Do not use this
analyzer on flammable samples. Use explosion-proof version instruments for
analysis of flammable samples.
Use reasonable precautions to avoid excessive vibration. In making electrical
connections, do not allow any cable to
touch the shock-mounted detector assembly or the associated internal sample
inlet and outlet tubing. This precaution
ensures against possible transmission of
mechanical vibration through the cable to
the detector, which could cause noisy
readout.
1. Interior of the analyzer is maintained
at 140°F (60°C) by an electrically
controlled heater and associated fan.
2. Immediately downstream from the
inlet port, prior to entry into the de-
Rosemount Analytical Inc. A Division of Emerson Process Management Installation 2-1
Page 18

Instruction Manual
748213-S
April 2002
Model 755R
2-2 CALIBRATION GAS REQUIREMENTS
WARNING
HIGH PRESSURE GAS CYLINDERS
Calibration gas cylinders are under pressure. Mishandling of gas cylinders could
result in death, injury, or property damage.
Handle and store cylinders with extreme
caution and in accordance with the manufacturer’s instructions. Refer to GENERAL
PRECAUTIONS FOR HANDLING & STORING HIGH PRESSURE CYLINDERS, page
P-4.
Analyzer calibration consists of establishing a
zero calibration point and a span calibration
point.
Zero calibration is performed on the range
that will be used during sample analysis. In
some applications, however, it may be desirable to perform span calibration on a range of
higher sensitivity (i.e., more narrow span) and
then jumper to the desired operating range.
For example, if the operating range is to be 0
to 50% oxygen, span calibration may be performed on the 0 to 25% range to permit use of
air as the span standard gas.
Recommendations on calibration gases for
various operating ranges are tabulated in Table 3-1 (page 3-4) and are explained in Sections 2-2a (page 2-2) and 2-2b (page 2-2).
a. Zero Standard Gas
In the preferred calibration method, described in Section 3-4a (page 3-1), a suitable zero standard gas is used to
establish a calibration point at or near the
lower range limit. Composition of the zero
standard normally requires an oxygen-free zero gas, typically nitrogen.
b. Span Standard Gas
A suitable span standard gas is required
to establish a calibration point at or near
the upper range limit. If this range limit is
21% or 25% oxygen, the usual span
standard gas is air (20.93% oxygen).
2-3 SAMPLE
Basic requirements for sample are:
1. A 2-micron particulate filter, inserted into
the sample line immediately upstream
from the analyzer inlet.
2. Provision for pressurizing the sample gas
to provide flow through the analyzer.
3. Provision for selecting sample, zero standard, or span standard gas for admission
to the analyzer, and for measuring the
flow of the selected gas.
a. Temperature Requirements
Each standard gas should be supplied from a
cylinder equipped with dual-stage, metal diaphragm type pressure regulator, with output
pressure adjustable from 0 to 50 psig (0 to
345 kPa).
Instrument response to most non-oxygen
sample components is comparatively slight,
but is not in all cases negligible. During initial
installation of an instrument in a given application, effects of the background gas should
be calculated to determine if any correction is
required (See Section 3-4, page 3-1).
2-2 Installation Rosemount Analytical Inc. A Division of Emerson Process Management
Sample temperature at the analyzer inlet
should be in the range of 50°F to 150°F
(10°C to 66°C).
Normally, however, a maximum entry
temperature of 110°F (43°C) is recommended so that the sample temperature
will rise during passage of the sample
through the analyzer. This precaution
prevents cooling of the sample and possible analyzer-damaging condensation.
With a thoroughly dry sample, entry temperature can be as high as 150°F (66°C)
without affecting readout accuracy.
Page 19
Model 755R
Instruction Manual
748213-S
April 2002
Needle
Valves
Sample In
Zero
Standard
Gas
Span
Standard
Gas
Figure 2-1. Interconnect of Typical Gas Manifold to Model 755R
b. Pressure Requirements - General
Operating pressure limits are as follows:
maximum, 10 psig (68.9 kPa); minimum,
5 psig vacuum (34.5 kPa vacuum).
CAUTION
Model 755R
Oxygen Analyzer
Two Micron
Flowmeter
Filter
To Vent
c. Normal Operation at Positive Gauge
Pressures
Normally, the sample is supplied to the
analyzer inlet at a positive gauge pressure in the range of 0 to 10 psig (0 to 68.9
kPa).
RANGE LIMITATIONS
Operation outside the specified pressure
limits may damage the detector, and will
void the warranty.
HIGH PRESSURE GAS CYLINDERS
Pressure surges in excess of 10 psig dur-
CAUTION
ing admission of sample or standard
The basic rule for pressure of sample and
gases can damage the detector.
standard gases supplied to the inlet is to
calibrate the analyzer at the same pressure that will be used during subsequent
operation, and to maintain this pressure
during operation. The arrangement required to obtain appropriate pressure
control will depend on the application.
When inputting sample or calibration
gases, use the same pressure that will be
used during subsequent operation. Refer
to Section 2-3c (page 2-3), Normal Op-
Maximum permissible operating pressure
is 10 psig (68.9 kPa). To ensure against
over-pressurization, insert a pressure relief valve into the sample inlet line. In addition, a check valve should be placed in
the vent line if the analyzer is connected
to a manifold associated with a flare or
other outlet that is not at atmospheric
pressure. If the detector is overpressurized, damage will result.
eration at Positive Gauge Pressures, or
Section 2-3d (page 2-4) Operation at
Negative Gauge Pressures.
The analyzer exhaust port is commonly
vented directly to the atmosphere. Any
change in barometric pressure results in a
Rosemount Analytical Inc. A Division of Emerson Process Management Installation 2-3
Page 20

Instruction Manual
748213-S
April 2002
Model 755R
directly proportional change in the indicated percentage of oxygen.
Example:
Range, 0% to 5% O
2.
Barometric pressure change after
calibration, 1%.
Instrument reading, 5% O2.
Readout error = 0.01 x 5% O2 =
0.05% O
Fullscale span is 5% O
2
.
2.
Therefore, the 0.05% O2 error is
equal to 1% of fullscale.
Thus, if the exhaust is vented to the atmosphere, the pressure effect must be
taken into consideration. This may be accomplished in various ways, including
manual computation and computer correction of data.
d. Operation at Negative Gauge Pres-
sures
Operation at negative gauge pressures is
not normally recommended, but may be
used in certain special applications. A
suction pump is connected to the analyzer
exhaust port to draw sample into the inlet
and through the analyzer. Such operation
necessitates special precautions to ensure accurate readout. First is the basic
consideration of supplying the standard
gases to the analyzer at the same pressure that will be used for the sample during subsequent operation. In addition, any
leakage in the sample handling system
will result in decreased readout accuracy
as compared with operation at atmospheric pressure.
mum, 500 cc/min. A flow rate of less than
50 cc/min is too weak to sweep out the
detector and associated flow system efficiently. Incoming sample may mix with
earlier sample, causing an averaging or
damping effect. Too rapid a flow will
cause back pressure that will affect the
readout accuracy. The optimum flow rate
is between 200 and 300 cc/min.
Deviation from the set flow should be held
to within 10% or 20 cc/min, whichever is
smaller. If deviation is held to within these
parameters and operating pressure remains constant, zero and span drift will
remain within specification limits.
The analyzer should be installed near the
sample source to minimize transport time.
Otherwise, time lag may be appreciable.
For example, assume that sample is supplied to the analyzer via a 100-foot
(30.5 m) length of 1/4-inch (6.35 mm)
tubing. With a flow rate of 100 cc/min,
sample transport time is approximately 6
minutes.
Sample transport time may be reduced by
piping a greater flow than is required to
the analyzer, and then routing only the
appropriate portion of the total flow
through the analyzer. The unused portion
of the sample may be returned to the
stream or discarded.
f. Materials in Contact with Sample
Within the Model 755R, the following
materials are exposed to the sample: 316
stainless steel, glass, titanium, Paliney
No.7, epoxy resin, Viton-A, platinum,
nickel and MgF
2
coating on mirror.
The minimum permissible operating pres-
g. Corrosive Gases
sure is 5 psig vacuum (34.5 kPa vacuum).
Operation of the analyzer below this limit
may damage the detector, and will void
the warranty.
In applications where the sample stream
contains corrosive gases, a complete
drying of the sample is desirable, as most
of these gases are practically inert when
e. Flow Rate
totally dry. For corrosive applications
consult the factory.
Operating limits for sample flow rate are
as follows: minimum, 50 cc/min; maxi-
2-4 Installation Rosemount Analytical Inc. A Division of Emerson Process Management
Page 21
Model 755R
Instruction Manual
748213-S
April 2002
2-4 LEAK TEST
WARNING
TOXIC OR CORROSIVE HAZARD
The sample containment system must be
carefully leak checked upon installation
and before initial start-up, during routine
maintenance and any time the integrity of
the sample containment system is broken,
to ensure the system is in leak proof condition.
Internal leaks resulting from failure to observe these precautions could result in
personal injury or property damage.
A B I C D E
For proper operation and safety, system leakage must be corrected, particularly before introduction of toxic or corrosive samples and/or
application of electrical power.
To check system for leaks, liberally cover all
fittings, seals, and other possible sources of
leakage with suitable leak test liquid such as
SNOOP (P/N 837801). Check for leak indicative bubbling or foaming. Leaks that are inaccessible to SNOOP application could evade
detection by this method.
L1/HOT
L2/NEUT
GND
CUR VOLT
OUTPUT OUTPUT
+ - G + -
(Rear terminal cover removed for clarity)
A. Sample outlet. 1/4” O.D. tube fitting.
B. Sample Inlet. 1/4” O.D. tube fitting.
C. 5/8” diameter hole for optional Dual Alarm Cable. Cable supplied by customer, minimum 24 AWG.
D. 5/8” diameter hole fitted with liquid-tight gland for Recorder Output Cable. Cable supplied by customer,
conductor, minimum 24 AWG.
E. 13/16” diameter hole for Power Cable. Cable supplied by customer, 3 conductor, minimum 18 AWG.
F. TB1: Customer hook-up for Power.
G. TB2: Customer hook-up for Recorder Output.
H. Optional Dual Alarm connections.
I. Connections for Optional Remote Range Change.
H G H
Figure 2-2. Model 755R Rear Panel
Rosemount Analytical Inc. A Division of Emerson Process Management Installation 2-5
Page 22
Instruction Manual
I
t
(Verif
748213-S
April 2002
Model 755R
2-5 ELECTRICAL CONNECTIONS
WARNING
ELECTRICAL SHOCK HAZARD
For safety and proper performance, this
instrument must be connected to a properly grounded three-wire source of supply.
Cable connections for AC power, recorder
output, and alarm output are shown in Installation Drawing, 654015, and are explained in the following sections.
a. Line Power Connection
The analyzer is supplied, as ordered, for
operation on 115 VAC or 230 VAC, 50/60
Hz. Ensure that the power source conforms to the requirements of the individual
instrument, as noted on the name-rating
plate.
Electrical power is supplied to the analyzer via a customer-supplied
three-conductor cable, type SJT, minimum wire size 18 AWG. Route power cable through conduit and into appropriate
opening in the instrument case. Connect
power leads to HOT, NEUT, and GND
terminals on the I/O board. Connect analyzer to power source via an external fuse
or breaker, in accordance with local
codes. Do not draw power for associated
equipment from the analyzer power cable
(Refer to Figure 2-3 below).
If the analyzer is mounted in a protected
rack or cabinet or on a bench, an accessory kit (P/N 654008) is available which
provides a 10-foot North American power
cord set and a liquid-tight feed through
gland for the power cable hole. The kit
also contains four enclosure support feet
for bench top use.
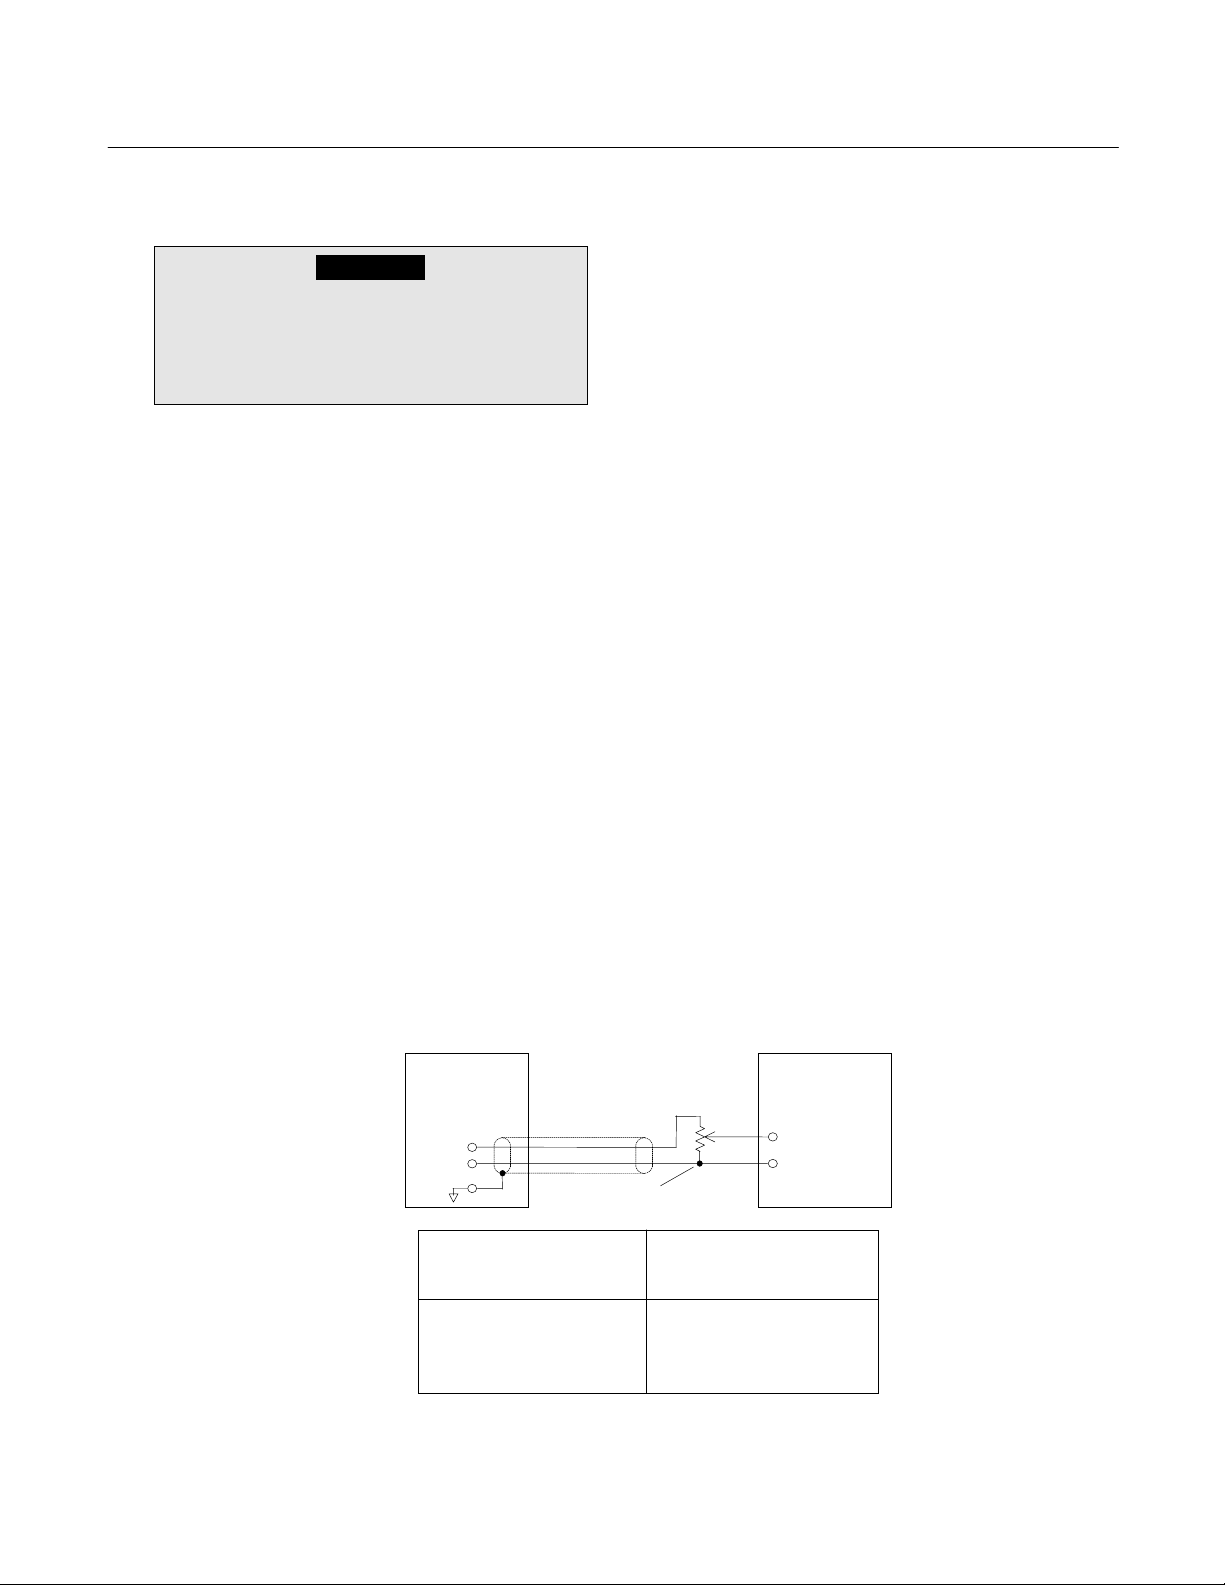
b. Recorder Output Selection and Cable
Connections
If a recorder, controller, or other output
device is used, connect it to the analyzer
via a number 22 or number 24 AWG
two-conductor shielded cable. Route the
cable into the case through the liquid-tight
feed through gland in the Recorder Output opening (See Installation Drawing,
654015). Connect the shield only at the
recorder end or the analyzer end, not to
both at the same time because a ground
loop may occur.
NOTE:
Route recorder cable through a separate
cable gland (P/N 899329) or conduit not
with power cable or alarm output cable.
Cable connections and output selection
for potentiometric and current-actuated
devices are explained below.
755R
Analyzer
(Customer Supplied)
Position of Recorder Output
Selector Plug
10 mV 1K
100 mV 10K
1 V 100K
5 V 2K
Minimum Permissible
Resistance for R1 + R2
Potentiometric
Recorder
npu
Terminals
y polarity
is correct)Voltage Divider
(ohms)
Figure 2-3. Connections for Potentiometric Recorder with Non-Standard Span
2-6 Installation Rosemount Analytical Inc. A Division of Emerson Process Management
Page 23
Model 755R
Not
1000 oh
R
Controll
R
Instruction Manual
748213-S
April 2002
c. Potentiometric Output
1. Insert RECORDER OUTPUT Selector
Plug (See Figure 3-1) in position appropriate to the desired output: 10
mV, 100 mV, 1V or 5V.
2. Connect leads of shielded recorder
cable to “REC OUT +” and “-” terminals on the I/O board.
3. Connect the output cable to the appropriate terminals of the recorder or
other potentiometric device:
a. For device with span of 0 to 10
mV, 0 to 100 mV, 0 to 1V, or 0 to
5V, connect cable directly to input
terminals of the device, ensuring
correct polarity and range selection.
b. For a device with intermediate
span (i.e., between the specified
values), connect the cable to the
device via a suitable external
voltage divider (See Figure 2-3,
page 2-6).
d. Isolated Current Output (Optional)
1. Verify that the optional current output
board appropriate to desired output is
properly in place in its connector. See
Figure 3-1, page 3-3. If originally ordered with the analyzer, the board is
factory installed.
2. On I/O board, connect leads of
shielded recorder cable to “CURRENT OUT+” and “-” terminals.
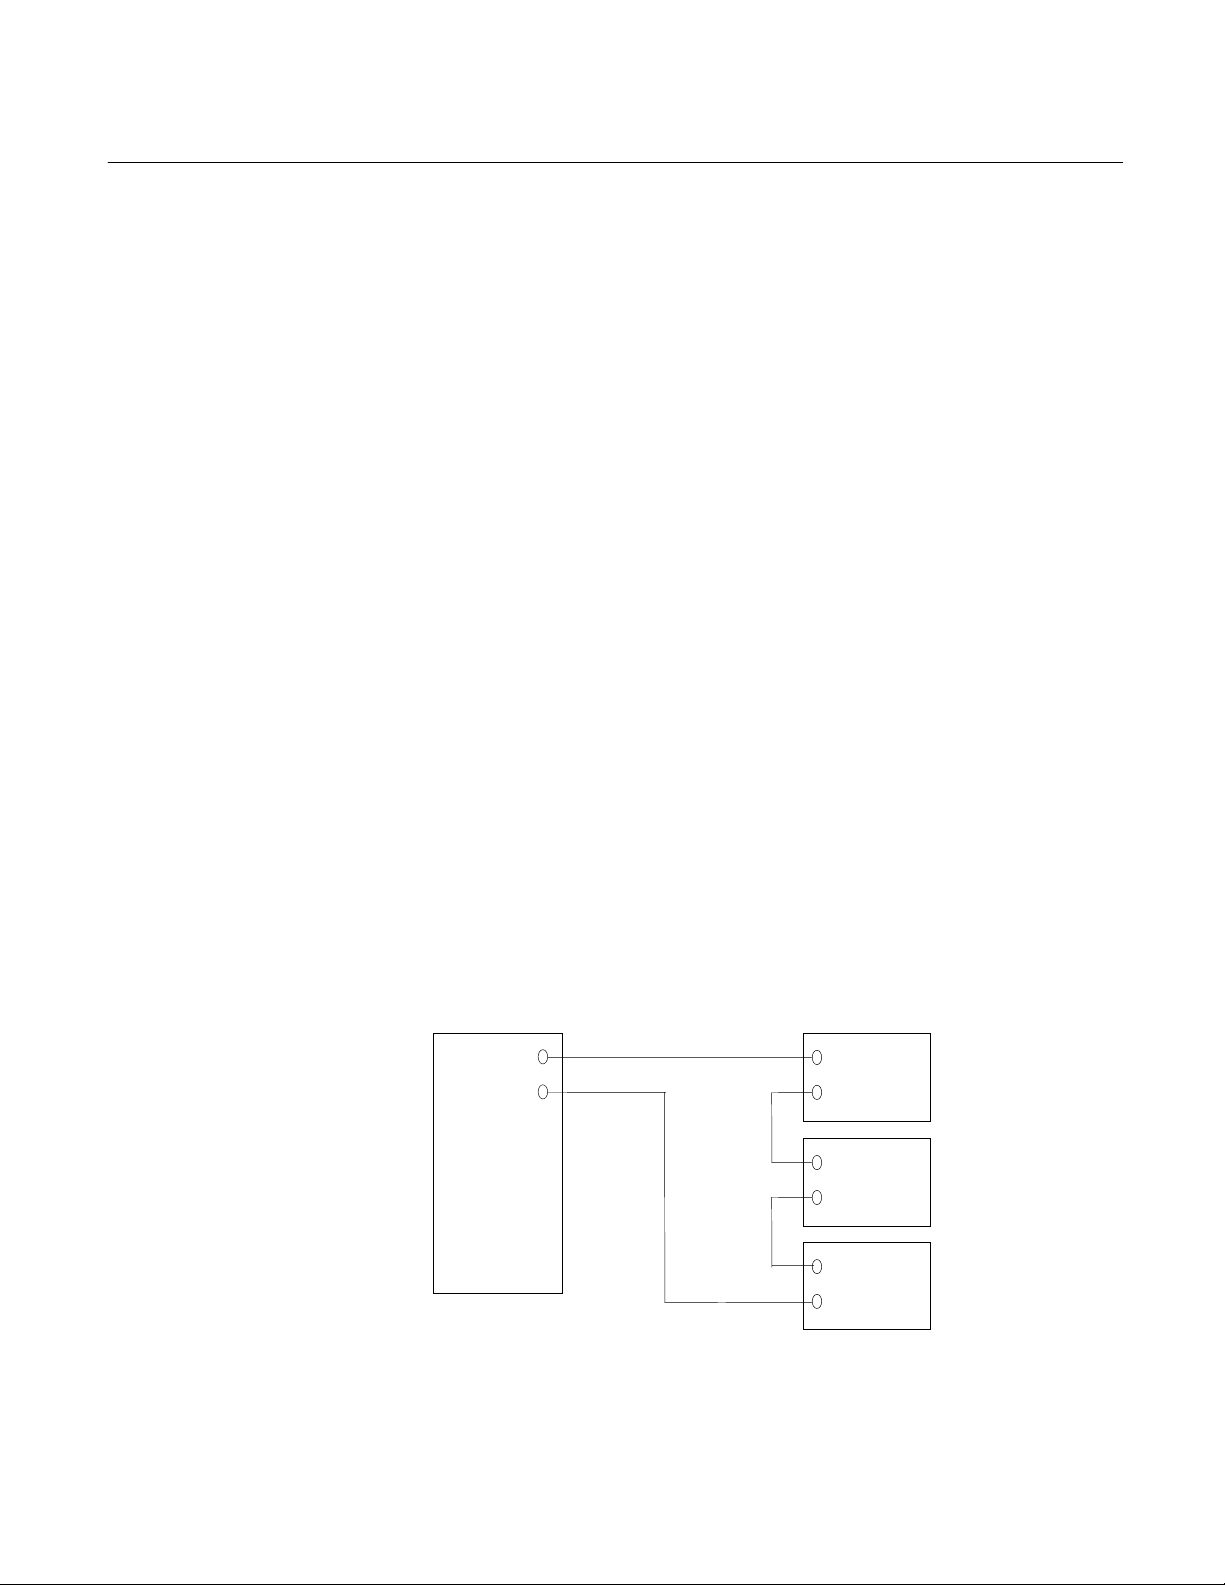
3. Connect free end of output cable to
input terminals of recorder or other
current-actuated device, making sure
that polarity is correct. If two or more
current-actuated devices are to be
used, they must be connected in series (See Figure 2-4 below). Do not
exceed the maximum load resistance
of 1000 ohms.
Current and voltage outputs may be utilized simultaneously if desired.
+
mA
-
755R
Analyzer
e: Total series resistance of all devices is not to exceed
ms.
+
-
+
-
+
Indicator
-
ecorder
er
emote
Figure 2-4. Model 755R Connected to Drive Several Current-Actuated Output Devices
Rosemount Analytical Inc. A Division of Emerson Process Management Installation 2-7
Page 24
Instruction Manual
748213-S
April 2002
Model 755R
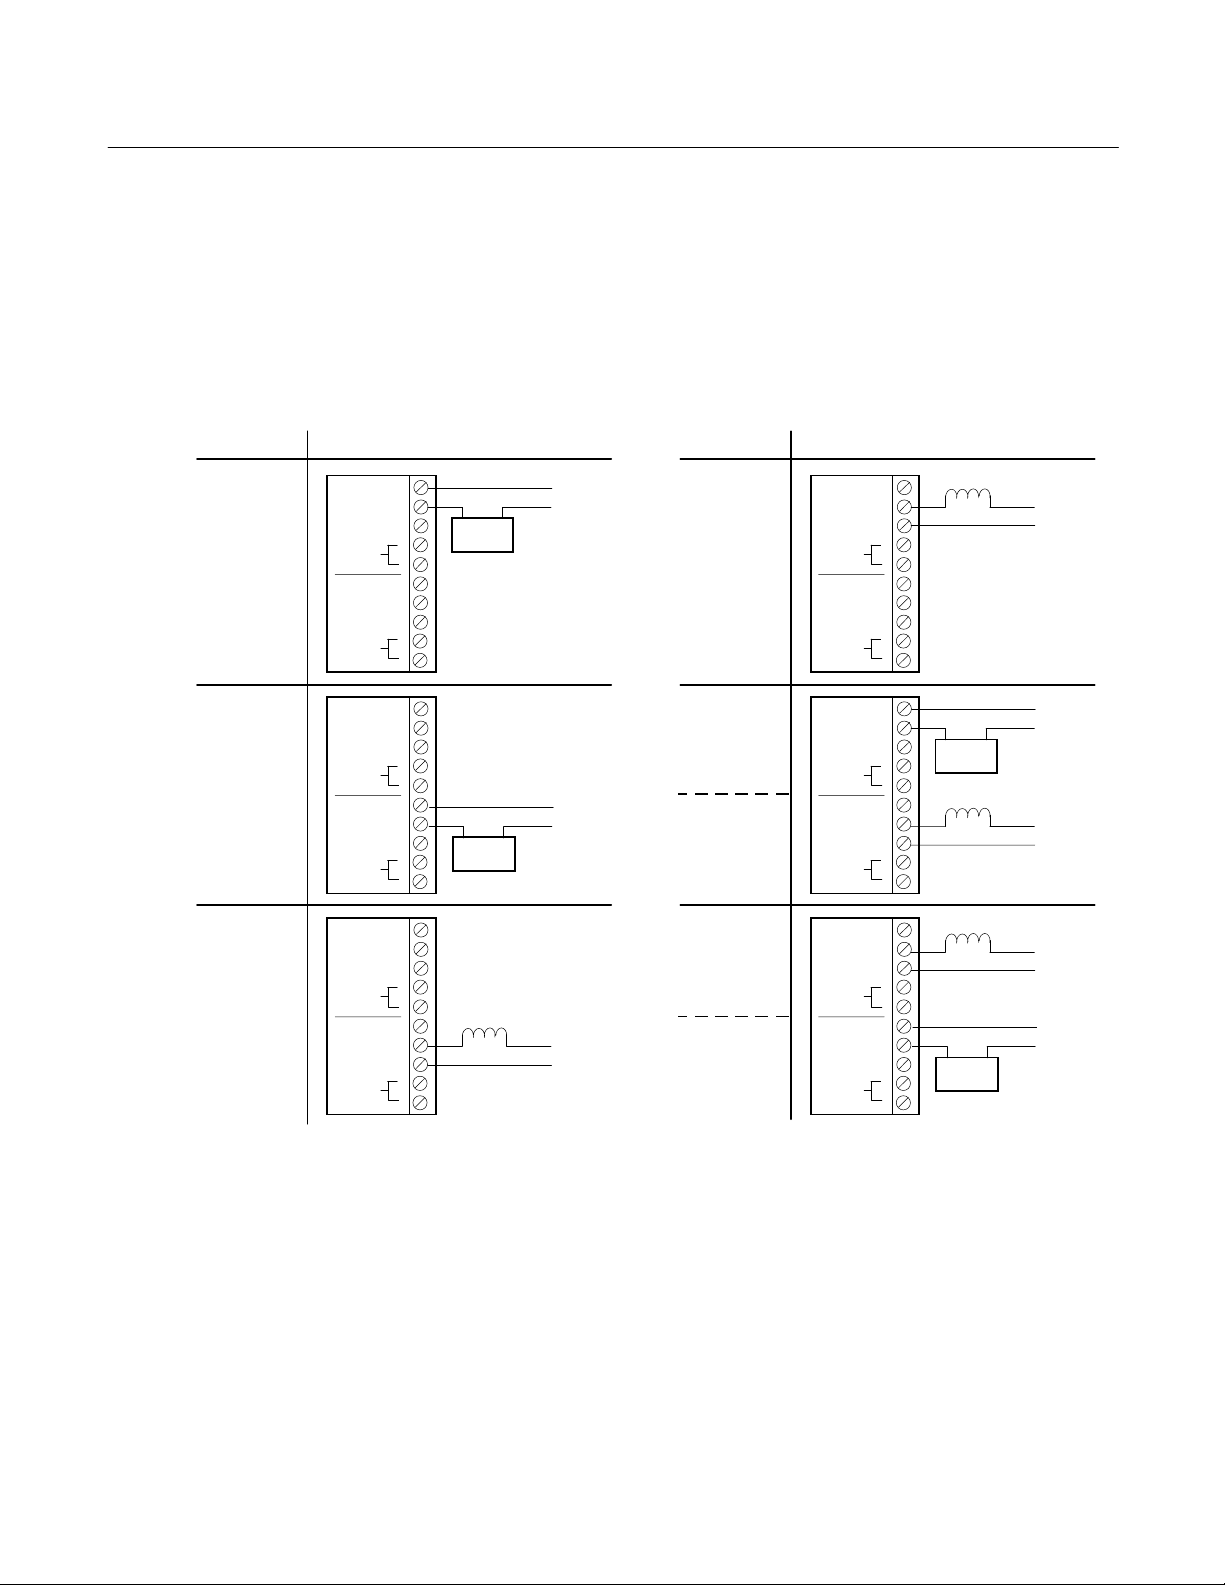
e. Output Connections and Initial Setup
for Dual Alarm Option
If so ordered, the analyzer is factory
equipped with alarm output. Alternatively,
the alarm feature is obtainable by subsequent installation of the 654019 Alarm Kit.
No. 1
NO
Low Alarm,
Fail-Safe
High Alarm,
Fail-Safe
Low Control
Limit,
Fail-Safe
RESET
RESET
No. 2
No. 1
RESET
RESET
No. 2
No. 1
RESET
RESET
No. 2
COM
NC
NO
COM
NC
NO
COM
NC
NO
COM
NC
NO
COM
NC
NO
COM
NC
Alarm Bell
or Lamp
Alarm Bell
or Lamp
Solenoid
Valve
115 VAC
115 VAC
115 VAC
The alarm output provides two sets of relay contacts for actuation of alarm and/or
process-control functions. Leads from the
customer-supplied external alarm system
connect to terminals on the 654019 Alarm
Assembly (See Figure 2-5 below and Interconnect Drawing 654014).
REQUIREMENT TYPICAL CONNECTIONSREQUIREMENT TYPICAL CONNECTIONS
Solenoid
No. 1
RESET
RESET
No. 2
No. 1
RESET
RESET
No. 2
No. 1
RESET
RESET
No. 2
NO
COM
NC
NO
COM
NC
NO
COM
NC
NO
COM
NC
NO
COM
NC
NO
COM
NC
N
H
Low Control
Limit,
Fail-Safe
Lower
Low Alarm
Indicator,
Fail-Safe
N
H
H
N
Low Control,
Fail-Safe
High Control,
Fail-Safe
Higher
High Alarm
Indicator,
Fail-Safe
Valve
Alarm Bell
or Lamp
Solenoid
Valve
Solenoid
Valve
Alarm Bell
or Lamp
115 VAC
115 VAC
115 VAC
115 VAC
115 VAC
H
N
N
H
H
N
H
N
N
H
Figure 2-5. Relay Terminal Connections for Typical Fail-Safe Applications
Note the following recommendations:
quency interference (RFI), it should
be arc suppressed. The 858728 Arc
•
A fuse should be inserted into the line
Suppressor is recommended.
between the customer-supplied power
supply and the alarm relay terminals
on the Alarm Relay Assembly.
•
If at all possible, the analyzer should
operate on a different AC power
source, to avoid RFI.
•
If the alarm contacts are connected to
any device that produces radio fre-
2-8 Installation Rosemount Analytical Inc. A Division of Emerson Process Management
Page 25

Model 755R
Instruction Manual
748213-S
April 2002
Alarm 1 and Alarm 2 output through the
654019 Alarm Relay Assembly is provided by two identical single-pole, double-throw relays. These relay contacts are
rated at the following values:
5 amperes 240 VAC resistive
1 ampere 240 VAC inductive
5 amperes 120 VAC resistive
3 amperes 120 VAC inductive
5 amperes 30 VDC resistive
3 amperes 30 VDC inductive
Removal of AC power from the analyzer
(such as power failure) de-energizes both
relays, placing them in alarm condition.
Switching characteristics of the Alarm 1
and Alarm 2 relays are as follows:
The Alarm 1 relay coil is de-energized
when the display moves downscale
through the value that corresponds to
setpoint minus deadband. This relay coil
is energized when the display moves upscale through the value that corresponds
to setpoint plus deadband.
The Alarm 2 relay coil is de-energized
when the display moves upscale through
the value that corresponds to the setpoint
plus deadband. This relay coil is energized when the display moves downscale
through the value that corresponds to
setpoint minus deadband.
Both the ALARM 1 and ALARM 2 functions generally incorporate automatic rest.
When the display goes beyond the preselected limits, the corresponding relay is
de-energized. When the display returns
within the acceptable range, the relay is
turned on.
The ALARM 1 and/or ALARM 2 alarm
functions may be converted to manual reset. The conversion requires the substitution of an external pushbutton or other
momentary contact switch for the jumper
that connects the RESET terminals on the
Alarm Relay Assembly. If the corresponding relay is now de-energized (i.e.,
in alarm condition), the relay remains
de-energized until the operator momentarily closes the switch.
By appropriate connection to the double-throw relay contacts, it is possible to
obtain either a contact closure or a contact opening for an energized relay. Also,
either a contact closure or a contact
opening may be obtained for a
de-energized relay. It is important, for
fail-safe applications, that the user understands what circuit conditions are desired
in event of power failure and the resultant
relay de-energization. Relay contacts
should then be connected accordingly
(See Figure 2-5, page 2-8).
The ALARM 1 and ALARM 2 circuits have
independent setpoint and deadband adjustments (See Figure 3-1, page 3-3). Initially, the ALARM 1 and ALARM 2
Setpoint Adjustments must be calibrated
by means of the ALARM 1 and ALARM 2
Calibration Adjustments by the following
procedure:
1. Set RANGE Select in a position ap-
propriate to the span standard gas.
2. Inject span standard gas through ana-
lyzer at 50 to 500 cc/min.
3. Verify that ALARM 1 and ALARM 2
Deadband Adjustments (See Figure
3-1, page 3-3) are set for minimum
value (turned fully counterclockwise).
These potentiometers should be factory-set for minimum deadband. Both
potentiometers MUST REMAIN at this
setting throughout calibration of the
alarm setpoint adjustments.
4. Adjust ALARM 1 control function as
follows:
a. With ALARM 1 Setpoint Adjust-
ment at 100% (i.e., position 10 on
dial), adjust front panel SPAN
Control so that the display or recorder reads exactly fullscale.
b. Set ALARM 1 Calibrate Adjust-
ment (R63) to its clockwise limit.
Rosemount Analytical Inc. A Division of Emerson Process Management Installation 2-9
Page 26

Instruction Manual
748213-S
April 2002
Model 755R
Carefully rotate R63 counterclockwise the minimum amount
required to obtain energization of
ALARM 1 Relay K1 (See Figure
2-6 below and Figure 3-1, page 3-
3). Energization may be verified
by connecting an ohmmeter to
relay terminals on 654019 Alarm
Relay Assembly.
c. To verify correct adjustment of
R63, adjust front panel SPAN
Control so that the display or recorder reads 99% of fullscale.
Relay K1 should now be
DE-ENERGIZED.
5. Adjust ALARM 2 control function as
follows:
a. With ALARM 2 Setpoint Adjust-
ment at 100% (i.e., Position 10 on
the dial), adjust front panel SPAN
Control so that
b. the display or recorder reads ex-
actly fullscale.
c. Set ALARM 2 Calibrate Adjust-
ment (R67) to its clockwise limit.
Carefully rotate R67 counterclockwise the minimum amount
required to obtain energization of
ALARM 2 Relay K2 (See Figure
2-5, page 2-8).
d. To verify correct adjustment of
R67, adjust front panel SPAN
Control so that the display or recorder reads 99% of fullscale.
Relay K2 should now be
DE-ENERGIZED.
The ALARM 1 and ALARM 2 Setpoint
Adjustments are now properly calibrated
and may be used to select the desired
alarm setpoints, as described in Section
3-6 (page 3-7).
A. Typical ALARM 1 Setting
DEADBAND SET FOR
20% OF FULLSCALE
B. Typical ALARM 2 Setting
DEADBAND SET FOR
10% OF FULLSCALE
40
INPUT SIGNAL
Percent of Fullscale
30
20
55
INPUT SIGNAL
Percent of Fullscale
50
45
Figure 2-6. Typical Alarm Settings
When input signal moves upscale through this point, the
coil of ALARM 1 relay (K1) is energized, providing
continuity between the common and normally-closed
contacts of the relay.
ALARM 1 Setpoint
When input signal moves downscale through this point, the
coil of ALARM 1 relay (K1) is de-energized, providing
continuity between the common and normally-open
contacts of the relay.
When input signal moves upscale through this point, the
coil of ALARM 2 relay (K2) is de-energized, providing
continuity between the common and normally-open
contacts of the relay.
ALARM 2 Setpoint
When input signal moves upscale through this point, the
coil of ALARM 2 relay (K2) is energized, providing
continuity between the common and normally-closed
contacts of the relay.
2-10 Installation Rosemount Analytical Inc. A Division of Emerson Process Management
Page 27

Model 755R
2. CR! AND CR2 ARE ANY 600V, 1 AMP DIODE.
1. RELAYS SHOWN IN ENERGIZED POSITION.
NOTES:
+15V
-15V
Alarm
No. 1
Command
Alarm
No. 2
Command
Instruction Manual
748213-S
April 2002
TB4
1
J5
1
2
4
6
CR1
14
K1
CR2
14 13
K2
5
13
12
1
5
12
9
8
9
8
NO
COM
NC
Reset
NO
COM
NC
Reset
Alarm
No. 1
Alarm
No. 2
Figure 2-7. Alarm Relay Assembly Schematic Diagram
Rosemount Analytical Inc. A Division of Emerson Process Management Installation 2-11
Page 28

Instruction Manual
748213-S
April 2002
Model 755R
2-6 REMOTE RANGE CHANGE OPTION
The power supply circuitry on the Remote
Range Board 646004 must be jumpered for
the correct line voltage, either 115 VAC or 230
VAC. See Drawings # 656081 (Table 2) and
646090 for correct jumper locations.
On the Remote Range Board, an additional
option exists: for using either the on-board 12
V to drive the range select relays or an external 12 V supply.
To use an external supply:
1. Remove the E to F jumper (DWG 646090).
2. Apply the external 12 V to J3-5.
3. Program the remote controller to pull the
range bits, J3-1 through J3-4, low. (See
Table 2-1 below.)
To use the internal 12 V supply:
1. Verify the E to F jumper is in place.
2. Connect the controller's common to J3-6
to reference the instrument's common to
the controller's common.
NOTE
DO NOT connect anything to J3-5.
3. Connect J3-1 to J3-4, as shown in the
truth table below, to switch ranges.
Remember that you are dealing with inverse
logic and not normal binary addresses. Also,
this process switches the recorder output
only, and does not affect the front panel display.
J3-4 J3-3 J3-2 J3-1 Hex
Range 1
Range 2
Range 3
Range 4
Note: 1 = 12 V, 0 << 1 V.
Table 2-1. Remote Range Switching Truth Table
1 1 1 0 E
1 1 0 1 D
1 0 1 1 B
0 1 1 1 7
2-12 Installation Rosemount Analytical Inc. A Division of Emerson Process Management
Page 29

Model 755R
Instruction Manual
748213-S
April 2002
SECTION 3
OPERATION
3-1 OVERVIEW
Preparatory to operation, a familiarization
with Figure 3-1 (page 3-3) is recommended. This figure gives locations and
summarized descriptions of operating adjustments of the Model 755R Oxygen Analyzer.
3-2 OPERATING RANGE SELECTION
The Model 755R is designed to operate on
a single, field-selectable range. A new
range may be selected any time the analyzer application changes or any time calibration may require a range change.
To select the operating range, reposition
the jumper shown in Figure 3-1 (page 3-3)
to the desired location. Each position is labeled as to its fullscale range. Only the
analog output (voltage and optional current)
is affected by range selection. The digital
display always reads 100% oxygen.
3-3 STARTUP PROCEDURE
Inject a suitable on-scale gas (not actual
sample) through the analyzer. Turn power
ON. If digital display gives overrange indication, the probable cause is the suspension in the detector is hung up. To correct
this condition, turn power OFF, tap detector
compartment with fingers, wait 30 seconds,
turn power ON.
proceed to Section 3-4 below. Otherwise,
refer to Section 6, Maintenance and Service.
3-4 CALIBRATION
Calibration consists of establishing a zero
calibration point and a span calibration
point (see Table 3-1, page 3-4). Zero and
span calibration should be performed on
the range that will be used during sample
analysis. In some applications, however, it
may be desirable to perform span calibration on a range of higher sensitivity (i.e.,
more narrow span) and then move the
jumper to the desired operating range. For
example, if the operating range is to be 0 to
50% oxygen, span calibration may be performed on the 0 to 25% range to permit use
of air as the span standard gas.
a. Calibration with Zero and Span
Standard Gases
NOTE:
The same flow rate must be maintained for zero, span, and sample to
avoid measure error. The exhaust is
vented to the atmosphere to avoid
back pressure. The following procedure is based on the standards in
Table 3-2 (page 3-6). Performance
specifications are based on recorder
output.
When on-scale reading is obtained, allow
analyzer to warm-up for a minimum of one
hour with gas flowing. This warm-up is
necessary because a reliable calibration is
obtainable only after the analyzer reaches
temperature stability. Moreover, the resultant elevated temperature will ensure
against condensation within, and possible
damage to the detector assembly. After
warm-up, the digital display or recorder
should give stable, drift-free readout. If so,
Rosemount Analytical Inc. A Division of Emerson Process Management Operation 3-1
Set Zero Calibration Point
Inject nitrogen zero standard gas
through analyzer at suitable flow rate,
preferably 250 cc/min. Allow gas to
purge analyzer for a minimum of three
minutes.
Adjust ZERO control so that the reading on the digital display or recorder is
zero
Page 30

Instruction Manual
748213-S
April 2002
Set Span Calibration Point
Inject span standard gas (see Table
3-1, page 3-4) through the analyzer at
the same flow rate as was used for
zero standard gas. Allow gas to purge
analyzer for a minimum of three minutes.
Adjust SPAN control so that reading on
display or recorder is appropriate to the
span standard gas.
3-5 COMPENSATION FOR COMPOSITION OF
BACKGROUND GAS
Any gas having a composition other than
100% oxygen contains background gas.
The background gas comprises all nonoxygen constituents. Although instrument
response to most gases other than oxygen
is comparatively slight, it is not in all cases
negligible. The contribution of these com-
Model 755R
ponents to instrument response is a function of the span and range used, and can
be computed for each individual case.
If the zero and span standard gases contain the same background gas as the sample, the routine standardization procedure
automatically compensates for the background components. Therefore, the zero
and span standard gases would introduce
no error.
If the background gas in the sample is different from that in the zero and/or span
standard gas(es), background effects must
be taken into consideration to ensure correct readout. During adjustment of the front
panel ZERO and SPAN controls (see Figure 1-1, page 1-1), the instrument is not set
to indicate the true oxygen content of the
zero and span standard gases. It is set to
indicate a slightly different value, relative to
background gas, calculated to provide correct readout during subsequent analysis of
the sample gas.
3-2 Operation Rosemount Analytical Inc. A Division of Emerson Process Management
Page 31

Model 755R
4
Instruction Manual
748213-S
April 2002
16
15
SPAN
E10
100% 50%
R8
R9
CR2
U6
I G O
1
2
3
4
I
G
O
U5
C5
I G O
U3
C4
U4
1
C59
E21 E1 E3 E5 E7
C60
C56
U18
C58
U16
E22 E2 E4 E6 E8
C49
C57
8
E11 E13 E15
E23E9
E12 E14 E16 E20
E24
10% 2.5%
25%
R3
R4
R2 R1
R5
R6
U2
C2
C3 CR1 C1
U1
J1
5V 1V .1V .01V
U13
R57
R58
R59
R60
7
E17
E19
TP5 TP6
TP7 TP 8 T P9 TP10 TP11 TP16 TP17 TP18
E18
1%
5%
C14
C61
R52
R87
R53
R82
U17
R47
R84
R85
R86
R102
C48
R43
CR5
R49
T1
R40
U12
C55
U15
C13
C12
U4
R21
R22R23R2
J2
R50
SPAN
SPAN
C65
C53
R20
CW
CW
S
S
CCW
CCW
U14
R56
R55
R42
CR4
C45
TP19
TP20
R89
R89
C68
+
T1
U11
U11
C51
C44
U21
C31
C31
5 4
3
2
R90
R90
R88 R30 R29 R100
R88 R30 R29 R100
C64
C64
R68
C17
C17
C39
C39
R25
R25
C29
C29
C26
C26
R13
R13
CW
CW
S
S
CCW
CCW
U20
U20
C38 C41
C38 C41
C16
C16
C18
C36
C36
R27
R27
C28 C27
C28 C27
R68
C8
C8
C1
C1
CR1
CR2R1R2R3R4R5R6
CR1
CR2R1R2R3R4R5R6
C30
C30
U8
U8
C63
C63
U19
U19
R11 R66 R77 R80 R82 R72 R70
R11 R66 R77 R80 R82 R72 R70
BL
CR3 R12 R76 R69 R81 R75 R71 R85
CR3 R12 R76 R69 R81 R75 R71 R85
R101
C50
C50
C37
C37
U10
U10
R54
R37
R37
R36
R31
R61
R39
R38
R28
R36
R31
R61
R39
R38
R28
ZERO
ZERO
6 10
R9
R9
R64
R64
Q1
Q1
E
E
R10 C6 6
R10 C6 6
R8
R8
R7
R7
C2
C2
C5
C5
J5
J5
13
R79 R74
R79 R74
Q2
Q2
U1
C4
C4
12
R63
R63
9
R67
R67
E
E
R73
R73
14
11
R78
R78
U2
U2
C9
C9
C6
C6
C10
C10
J4
J4
1
1
2
2
3
3
4
4
C67
C67
5
5
6
6
7
7
8
8
9
9
C7C3
C7C3
10
10
11
11
J6
J6
12
12
13
13
14
14
15
15
16
16
652830 SIGNAL CONTROL BOARD
652830 SIGNAL CONTROL BOARD
1. RECORDER OUTPUT selector plug Provides selectable output of 10 mV, 100 mV, 1 V or 5 V for a voltage recorder.
2. DIGITAL READOUT (R100) Calibration of digital readout.
3. AMPLIFIER U8 ZERO (R29) Initial factory zeroing of amplifier U8.
4. RESPONSE TIME (R30) Adjustment of electronic response time.
5. FULLSCALE OUTPUT (R88) Setting fullscale for 1 V, 0.1 V and 10 mV outputs.
6. DETECTOR COARSE ZERO (R9) Coarse adjustment of detector zero by shifting the position of the detector within the magnetic field. It is adjusted during factory checkout, and does not require readjustment except
if detector is replaced.
7. CURRENT OUTPUT ZERO (R1) Located on Current Output Board, adjustment for zero-level current output, i.e., 4mA or 0mA
8. CURRENT OUTPUT SPAN (R2) Located on Current Output Board, adjustment for fullscale current output: 20mA
9. ALARM 2 CALIBRATION (R67) Initial calibration of ALARM 2 circuit.
10. ALARM 2 SETPOINT (R68) Continuously variable adjustment of setpoint for ALARM 2 circuit, for actuation of external,
customer supplied control device(s). Adjustment range is 0 to 100% of fullscale span.
11. ALARM 2 DEADBAND (R78) Adjustment of ALARM 2 deadband circuit from 1% to 20% of fullscale. Deadband is essentially symmetrical with respect to setpoint.
12. ALARM 1 CALIBRATION (R63) Initial calibration of ALARM 1 circuit.
13. ALARM 1 SETPOINT (R64) Continuously variable adjustment of setpoint for ALARM 1 circuit, for actuation of external,
customer supplied control device(s). Adjustment range is 0 to 100% of fullscale span.
14. ALARM 1 DEADBAND (R73) Adjustment of ALARM 1 deadband circuit from 1% to 20% of fullscale. Deadband is essentially symmetrical with respect to setpoint.
15. OUTPUT RANGE selector plug Selectable fullscale output range.
16. DETECTOR ISOLATION plug For servicing and testing of the Control Board.
DIGITAL DISPLAY Display (viewed on front panel) indicates oxygen content of sample.
ZERO control (R13) Accessible on front panel, use to establish zero-calibration point.
SPAN control (R20) Accessible on front panel, use to establish span calibration point.
Figure 3-1. Control Board - Adjustment Locations
Rosemount Analytical Inc. A Division of Emerson Process Management Operation 3-3
Page 32

Instruction Manual
748213-S
April 2002
Model 755R
RANGE % OXYGEN
0 to 1 Nitrogen 0.9% O2, balance N2
0 to 2.5 Nitrogen 2.3% O2, balance N2
0 to 5 Nitrogen 4.5% O2, balance N2
0 to 10 Nitrogen 9% O2, balance N2
0 to 25 Nitrogen Air (20.93% O2)
0 to 50 Nitrogen 45% O2, balance N2
0 to 100 Nitrogen 100% O2
Table 3-1. Calibration Range for Various Zero-Based Operating Ranges
a. Oxygen Equivalent Value of Gases
For computation of background corrections, the analyzer response to each
component of the sample must be shown.
Table 3-2 (page 3-6) lists the percentage
oxygen equivalent values for many common gases.
The percentage oxygen equivalent of a
gas is the instrument response to the
given gas compared to the response to
oxygen, assuming that both gases are
supplied at the same pressure .
RECOMMENDED ZERO
STANDARD GAS
RECOMMENDED SPAN
STANDARD GAS
In equation form:
%O2 Equivalent of Gas =
Analyzer Response to Gas
Analyzer Response to O
To select a random example from Table
3-2, if analyzer response to oxygen is
+100%, the response to xenon would be
-1.34%.
The oxygen equivalent of a gas mixture is
the sum of the contribution of the individual gas components.
2
X 100%
Example: Zero Based Range
At lower range limit, i.e., 0% oxygen, composition of sample is 80% CO2, 20% N2.
From Table 3-1 (page 3-4), the % oxygen equivalents are CO2. -0.623 and N2, -0.358%.
% oxygen equivalent of mixture =
0.8 x (-0.623) + 0.2 x (-0.358) = (-0.4984) + (-0.0716) = -0.570% Oxygen
b. Computing Adjusted Settings for Zero and Span Controls
During instrument calibration, adjusted values may be required in setting the ZERO and SPAN controls
to correct for the magnetic susceptibility of the background gas.
The quantities are defined as follows:
BGGst = Oxygen equivalent of background gas in standard gas (see Table 3-2, page 3-6)
BGGs = Oxygen equivalent of background gas sample (see Table 3-2, page 3-6)
OP = operating pressure. Unless special pressure corrections are to be made, the zero standard, span standard and sample gases must all be admitted at the same pressure.
3-4 Operation Rosemount Analytical Inc. A Division of Emerson Process Management
Page 33

Model 755R
Use the following equation to compute the adjusted settings for the ZERO and SPAN controls:
Adjusted % O2 for standard gas =
(A)[100 + (B-C)] - 100 [B-C]
Where:
A = true % O2 of standard gas
B = BGGs
C = BGGst
Example:
Instruction Manual
748213-S
April 2002
100
Background gas in sample is CO2, oxygen equivalent = -0.623%
Zero gas is 100% N2
Span standard gas is air: 21% O2, 79% N2
Background gas in zero and span standard gases is N2, oxygen equivalent = -0.358%
With N2 zero standard gas flowing, ZERO control is adjusted so digital display reads:
0[100+(-0.623-(-0.358))] - 100[-0.623-(-0.358)]
100
With air flowing, SPAN control is adjusted so the digital display reads:
21[100 - 0.265) - 100 (-0.265)
= 21.209% O
100
In two limiting cases, the general equation is reduced to simpler forms.
1. If the span standard gas is 100% oxygen, the adjusted oxygen value for setting the SPAN control is
the same as the true value (i.e., 100% oxygen).
0.265% O
=
≅
2
2
21.21
2. If the zero standard is an oxygen-free zero gas, the adjusted value for setting the ZERO control =
BGGst - BGGs. (If the oxygen-free zero gas is more diamagnetic than the background gas in the
sample, this difference is negative. The negative value may be set on the digital display or the recorder if provided with below-zero capability.)
Rosemount Analytical Inc. A Division of Emerson Process Management Operation 3-5
Page 34

Instruction Manual
748213-S
April 2002
Model 755R
GAS
Acetylene, C2H
Allene, C3H
4
Ammonia, NH
2
3
EQUIV. % AS
-0.612
-0.744
-0.479
Argon, A -0.569
Bromine, Br
1,2-Butadiene C4H
1,3-Butadiene C4H
n-Butane, C4H
iso-Butane, C4H
Butene-1, C4H
cis Butene-2, C4H
iso-Butene, C4H
trans butene-2, C4H
Carbon Dioxide CO
2
6
6
10
10
8
8
8
8
2
-1.83
-1.047
-1.944
-1.481
-1.485
-1.205
-1.252
-1.201
-1.274
-0.623
Carbon Monoxide, CO -0.354
Ethane, C2H
Ethylene, C2H
Helium, H
n-Heptane, C7H
n-Hexane, C6H
cyclo-Hexane, C6H
Hydrogen, H
6
4
e
16
12
12
2
-0.789
-0.553
-0.059
-2.508
-2.175
-1.915
-0.117
Hydrogen Bromide, Hbr -0.968
Hydrogen Chloride, HC1 -0.651
Hydrogen Fluoride, HF -0.253
Hydrogen Iodide, HI -1.403
Hydrogen Sulphide, C2S -0.751
Kryton, Kr -0.853
Methane, CH
4
-0.512
Neon, Ne -0.205
Nitric Oxide, NO +44.2
Nitrogen, N
Nitrogen Dioxide, NO
n-Octane, C8H
Oxygen, O
n-Pentane, C5H
iso-Pentane, C5H
neo-Pentane, C5H
Propane, C3H
Propylene, C3H
2
2
18
2
12
12
12
8
6
-0.358
+28.7
-2.840
+100.0
-1.810
-1.853
-1.853
-1.135
-0.903
Water, H2O -0.381
Xenon, Xe -1.340
Table 3-2. Oxygen Equivalent of Common Gases
3-6 Operation Rosemount Analytical Inc. A Division of Emerson Process Management
Page 35

Model 755R
3-6 SELECTION OF SETPOINTS AND DEAD-
BAND ON ALARM OPTION
The ALARM 1 and ALARM 2 setpoint adjustments (see Figure 3-1, page 3-3) are adjustable for any desired value from 1% to 100% of
the fullscale analyzer span. The adjustment
screws are graduated from 0 to 10.
Required dial settings for both setpoint adjustments may be determined from either Figure 3-2 or the appropriate equation that
follows:
• Zero-based operating range
•
Required control setting =
(desired alarm setpoint)(10)
fullscale span
Figure 3-2 example:
Operating range, 0 to 5% oxygen
Desired ALARM 1 setpoint = 4% oxygen
Turn potentiometer R64 to 8
Desired ALARM 2 setpoint = 3% oxygen
Turn potentiometer R68 to 6
The desired deadband may be selected via
the appropriate trimming potentiometer, R73,
for ALARM 1 deadband adjustment and R78
for ALARM 2 deadband adjustment. For any
setpoint, deadband is adjustable from 1% of
fullscale (counterclockwise limit) to 20% of
fullscale (clockwise limit). Deadband is essentially symmetrical with respect to setpoint.
3-7 CURRENT OUTPUT BOARD (OPTION)
RANGE
%
OXYGEN
0 to 1
0 to 1
0 to 2.5
0 to 5
0 to 10
0 to 25
0 to 50
0 to 100
Instruction Manual
748213-S
April 2002
PERCENTAGE OXYGEN READOUT
versus
ALARM SETPOINT DIAL READING
Percentage Oxygen Readout
0.0 0.1 0.2 0.3 0.4 0.5 0.6 0.7 0.8 0.9 1.0
0 1 2 3 4 5 6 7 8 9 10
Setpoint Dial Reading
Percentage Oxygen Readout
0.0 0.1 0.2 0.3 0.4 0.5 0.6 0.7 0.8 0.9 1.0
0 1 2 3 4 5 6 7 8 9 10
Setpoint Dial Reading
Percentage Oxygen Readout
0.0 0.5 1.0 1.5 2.0 2.5 3.0 3.5 4.0 4.5 5.0
0 1 2 3 4 5 6 7 8 9 10
Setpoint Dial Reading
Percentage Oxygen Readout
0 1 2 3 4 5 6 7 8 9 10
0 1 2 3 4 5 6 7 8 9 10
Setpoint Dial Reading
Percentage Oxygen Readout
0 2.5 5 7.5 10 12.5 15 17.5 20 22.5 25
0 1 2 3 4 5 6 7 8 9 10
Setpoint Dial Reading
Percentage Oxygen Readout
0 5 10 15 20 25 30 35 40 45 50
0 1 2 3 4 5 6 7 8 9 10
Setpoint Dial Reading
Percentage Oxygen Readout
0 10 20 30 40 50 60 70 80 90 100
0 1 2 3 4 5 6 7 8 9 10
Setpoint Dial Reading
The Current Output is set at the factor for 4 to
20 mA. If a 0 to 20 mA output is required, readjust both the zero and span potentiometers
Figure 3-2. Dial Settings for Alarm Setpoint
Adjustments
(R1 and R2) on the Current Output Board.
Rosemount Analytical Inc. A Division of Emerson Process Management Operation 3-7
Page 36

Instruction Manual
748213-S
April 2002
3-8 ROUTINE OPERATION
After the calibration procedure of Section 3-4
(page 3-1), admit sample gas to the analyzer
at the same pressure and the same flow rates
used for the zero and span gases. The instrument will now continuously indicate the
oxygen content of the sample gas.
3-9 EFFECT OF BAROMETRIC PRESSURE
CHANGES ON INSTRUMENT READOUT
If the analyzer exhaust port is vented through
a suitable absolute backpressure regulator,
barometric pressure changes do not affect the
percent oxygen readout. However, if the analyzer exhaust port is vented directly to the atmosphere, any change in barometric pressure
after instrument standardization will result in a
directly proportional change in the indicated
percentage of oxygen. This effect may be
compensated in various ways. If desired, correction may be made by the following equation:
Model 755R
3-10 CALIBRATION FREQUENCY
The appropriate calibration interval will depend on the accuracy required in the particular application, and is best determined by
keeping a calibration log. If the analyzer exhaust port is vented directly to the atmosphere, the greatest source of error is normally
the variation in barometric pressure. If desired, effects of barometric pressure variation
can be minimized by calibrating immediately
before taking readings, for example, at the
beginning of each shift.
True % Oxygen = (Pst/Pan)(Indicated % Oxygen)
Where:
Pst = Operating pressure during standardization
Pan = Operating pressure sample analysis
Example: U.S. Units
Pst = 760 mm Hg
Pan = 740 mm Hg
Indicated % O2
True % O2 = (760/740)(40%) = 41.1% O2
Example: S.I. Units
Pst = 101 kPa
Pan = 98.2 kPa
Indicated % O2 = 40%
True % O2 = (101/98.2)(40%) = 41.1%
O2
3-8 Operation Rosemount Analytical Inc. A Division of Emerson Process Management
Page 37

Model 755R
Instruction Manual
748213-S
April 2002
SECTION 4
THEORY
4-1 PRINCIPLES OF OPERATION
Oxygen is strongly paramagnetic while most
other common gases are weakly diamagnetic.
The paramagnetism of oxygen may be regarded as the capability of an oxygen molecule to become a temporary magnet when
placed in a magnetic field. This is analogous
to the magnetization of a piece of soft iron.
Diamagnetic gases are analogous to
non-magnetic substances.
With the Model 755R, the volume magnetic
susceptibility of the flowing gas sample is
sensed in the detector/magnet assembly. As
shown in the functional diagram of Figure 5-1,
a dumbbell-shaped, nitrogen-filled, hollow
glass test body is suspended on a platinum/nickel alloy ribbon in a non-uniform magnetic field.
Because of the “magnetic buoyancy” effect,
the spheres of the test body are subjected to
displacement forces, resulting in a displacement torque that is proportional to the volume
magnetic susceptibility of the gas surrounding
the test body.
Measurement is accomplished by a
null-balance system, where the displacement
torque is opposed by an equal, but opposite,
restorative torque. The restorative torque is
due to electromagnetic forces on the spheres,
resulting from a feedback current routed
through a titanium wire conductor wound
lengthwise around the dumbbell.
In effect, each sphere is wound with a
one-turn circular loop. The current required to
restore the test body to null position is directly
proportional to the original displacement
torque, and is a linear function of the volume
magnetic susceptibility of the sample gas.
The restoring current is automatically maintained at the correct level by an electro-optical
feedback system. A beam of light from the
source lamp is reflected off the square mirror
attached to the test body, and onto the dual
photocell.
The output current from the dual photocell is
equal to the difference between the signals
developed by the two halves of the photocell.
This difference, which constitutes the error
signal, is applied to the input of an amplifier
circuit that provides the restoring current.
When the test body is in null position, both
halves of the photocell are equally illuminated,
the error signal is zero, and the amplifier is
unequal. This condition results in application
of an error signal to the input of the amplifier
circuit. The resultant amplifier output signal is
routed through the current loop, thus creating
the electromagnetic forces required to restore
the test body to null position.
Additionally, the output from the amplifier is
conditioned as required to drive the digital
display, and recorder if used. The electronic
circuitry involved is described briefly in Section 4-3 (page 4-4) and in greater detail in
Section 5.
Rosemount Analytical Inc. A Division of Emerson Process Management Theory 4-1
Page 38

Instruction Manual
748213-S
April 2002
4-2 VARIABLES INFLUENCING PARAMAG-
NETIC OXYGEN MEASUREMENTS
Variables that influence paramagnetic oxygen
measurements include: operating pressure
(See Section 4-3a, page 4-4), sample temperature, interfering sample components, and
vibration (See Section 2-1d, page 2-1).
a. Pressure Effects
Although normally calibrated for readout
in percent oxygen, the Model 755R actually responds to oxygen partial pressure.
The partial pressure of the oxygen component in a gas mixture is proportional to
the total pressure of the mixture. Thus
readout is affected by pressure variations.
For instance, assume that an instrument
is calibrated for correct readout with a
standard gas containing 5% oxygen, admitted at the normal sea level atmospheric pressure of 14.7 psia (101.3 kPa).
If the operating pressure now drops to
one-half the original value (i.e., to 7.35
psia {50.65 kPa}) and the calibration controls are left at the previously established
settings, the display reading for the standard gas will drop to 2.5%.
Model 755R
It is therefore necessary to calibrate the
instrument at the same pressure that will
be used during subsequent operation,
and to maintain this pressure during operation.
Typically, the sample gas is supplied to
the analyzer inlet at slightly above ambient pressure, and is discharged to ambient pressure from the analyzer outlet.
However, in some applications, it is necessary to insert an absolute back pressure regulator into the exhaust line to
prevent the readout error that would otherwise result from fluctuations in exhaust
pressure. The regulator must be mounted
in a temperature-controlled housing (See
Section 2-3c, page 2-3).
Operation at negative gauge pressure is
not normally recommended, but is used in
certain special applications (See Section
2-3d, page 2-4).
CAUTION
PRESSURE MINIMUM
Never subject the sensing unit to an absolute pressure of less than 500 mm Hg
(66.7 kPa).
4-2 Theory Rosemount Analytical Inc. A Division of Emerson Process Management
Page 39

Model 755R
A
Displacement
Torque
Instruction Manual
748213-S
April 2002
Balancing
Weight
Electromagnetic
xis
Platinum/Nickel Alloy
Suspension Ribbon
TEST BODY DETAIL
Displacement
Torque
Restoring
Torque
Restoring
Current
Mirror
Restoring
Torque
Titanium Wire Conductor
Restoring
Current
Electromagnetic
Axis
Balancing Weight
Nitrogen-Filled Hollow Glass
Test Body
Restoring
Magnet
Shaded Pole Pieces (4)
Dual Photocell
BT1, BT2
Test Body
Source Lamp
DS1
DETECTOR/MAGNET
Current
ASSEMBLY
Zero
CONTROL
ASSEMBLY
Span
% Oxygen
Readout
Figure 4-1. Functional Diagram of Paramagnetic Oxygen Measurement System
Rosemount Analytical Inc. A Division of Emerson Process Management Theory 4-3
Page 40

Instruction Manual
748213-S
April 2002
Shaded
Pole
Piece
Model 755R
Figure 4-2. Spherical Body in Non-Uniform Magnetic Field
4-3 ELECTRONIC CIRCUITRY
Electronic circuitry is shown in the Control
Board schematic diagram, Drawing 652826,
and is described briefly in the following sections. For detailed circuit analysis, refer to
Section 5 Circuit Analysis.
a. Detector/Magnet Assembly
A cross-sectional view of the optical
bench and detector assemblies is shown
in Figure 4-3B, page 4-7. Source lamp
DS1, powered by a supply section within
the Power Supply Board assembly (See
Section 4-3c, page 4-5) directs a light
beam onto the mirror attached to the test
body. The mirror reflects the beam onto
dual photocell BT1, BT2.
Sphere
(Magnetic Susceptibility = k
F
k
Sample Gas
(Magnetic Susceptibility = k )
As percentage of oxygen in sample gas increases,
displacement force (F
Note:
) increases.
k
in turn, supplies the restoring current to
the titanium wire loop on the test body
(See Section 4-1, page 4-1).
Detector temperature is sensed by thermistor RT1, an integral part of the detector assembly (See Figure 4-3B, page 4-7).
The thermistor provides the input signal to
the detector temperature control section
of the Power Supply Board assembly:
HR1, mounted on the top of the magnet,
and HR2, mounted permanently on the
rear of the detector assembly.
b. Control Board and Associated Cir-
cuitry
The Control Board consists of signal conditioning and control circuitry.
)
o
The difference between the signals de-
This circuitry includes the following:
veloped by the two halves of the photocell
constitutes the error signal supplied to the
input of amplifier U1 on the Control Board
assembly. Amplifier U1 drives U2 which,
4-4 Theory Rosemount Analytical Inc. A Division of Emerson Process Management
Page 41

Model 755R
Instruction Manual
748213-S
April 2002
Input Amplifier U1
This amplifier receives the error signal
from the dual photocell of the detector assembly and drives amplifier U2.
Amplifier U2 and Associated Zero Adjustment
Amplifier U2 supplies the restoring current
to the titanium wire loop of the test body
within the detector assembly. Front panel
ZERO Control R13 applies an adjustable
zero biasing signal to the input of U2 to
permit establishing a zero calibration point
on the display or recorder. With zero
standard gas flowing through the analyzer, the ZERO control is adjusted for the
appropriate reading.
Amplifier U4 and Associated Span Adjustment
Amplifier U4 and associated feed back
resistors provide a signal amplification of
X4. Front panel SPAN adjustment R20
modifies the value of the input resistance
and hence the signal amplification factor.
Adjustment range is approximately ±30%.
Amplifier U8
This unity gain amplifier provides zeroing
capability and a buffered output for the
anticipation circuit feeding U10.
Amplifier U10
U10 is an inverting buffer amplifier that incorporates an anticipation arrangement in
its input network, thus providing slightly
faster response on the readout device(s).
Potentiometer R30 provides a continuously variable adjustment of 5 to 25 seconds for the electronic anticipation time
and is factory-set for 20 seconds.
Since the anticipation network attenuates
the signal, a gain of 10 is provided in U10
to restore the signal to the desired fullscale range of 0 to 10 VDC.
The output signal from U10 is routed to
two output circuits: a digital and an ana-
log.
In the Digital Output Circuit, the signal
from U10 passes to an integrating ana-
log-to-digital converter. The resulting
digital signal drives the liquid crystal dis-
play.
In the Analog Output Circuit, the output
from U10 is provided as an input to the
recorder output amplifier. This circuitry
provides scale expansion, and amplifica-
tion preparatory to use for potentiometric
recorder, voltage-to-current conversion for
current recorder, and/or alarm functions.
Potentiometric output is strap-selectable
for 0 to 10 mV, 0 to 100 mV, 0 to 1 V, or 0
to 5VDC. Potentiometer R88 permits ad-
justment of recorder span on 0 to 1 V, 100
mV and 10 mV outputs.
c. Power Supply Board Assembly
The Power Supply Board assembly con-
tains power supply and temperature con-
trol circuitry. The assembly is mounted
within the analyzer case.
As shown in DWG 617186, the various
circuits operate on main power trans-
former T1. During instrument assembly,
the two primary windings of T1 are fac-
tory-connected for operation on either 115
VAC or 230 VAC, as noted on the name
rating plate.
The same circuit board contains the fol-
lowing:
Source Lamp Power Supply Section
This circuit provides a regulated output of
2.20 VDC to operate incandescent source
lamp DS1 within the optical bench as-
sembly. One secondary of main power
transformer T1 drives a fullwave rectifier
consisting of CR7 and CR8. The output of
DS1 is held constant by a voltage regu-
lator circuit utilizing U7, Q4 and Q5.
Rosemount Analytical Inc. A Division of Emerson Process Management Theory 4-5
Page 42

Instruction Manual
748213-S
April 2002
Model 755R
±15 V Power Supply Section
This section provides DC voltage required
for various amplifiers and other circuits.
Fullwave rectifier bridge CR5 provides
both positive and negative outputs. Each
is routed through an associated series
type integrated circuit, voltage regulator,
providing regulated outputs of +15 V and
-15 V.
Detector Temperature Control Section
This section maintains the detector at a
controlled temperature of 150°F (66°C).
Temperature is sensed by RT1, a resistance element permanently attached to
the detector assembly. The signal from
the sensor is applied to amplifier AR6,
which drives transistors Q2 and Q3, thus
controlling application of DC power from
full wave rectifier bridge CR6 to two heaters within the detector/magnet assembly:
HR1, mounted on the top of the magnet
and HR2, permanently mounted on the
rear of the detector assembly.
Detector Compartment Temperature
Control Section
This section maintains the interior of the
detector compartment at a controlled
temperature of 140°F (60°C). Tempera-
ture is sensed by a thermistor located in
the detector compartment and plugged
into the Control Board assembly.
The circuit provides an on-off control of
heater element HR3 via TRIAC element
Q7. Heater HR3 is a part of the heater/fan
assembly.
a. Isolated Current Output Board (Op-
tional)
An isolated current output is obtainable by
insertion of an optional plug-in circuit
board into receptacle J1 on the Control
Board (see Figure 3-1, page 3-3). The
current outputs available by this board are
0 to 20 mA or 4 to 20 mA.
4-6 Theory Rosemount Analytical Inc. A Division of Emerson Process Management
Page 43

Model 755R
t
Instruction Manual
748213-S
April 2002
Sample Pre-Heating Coil
Sample Inlet Tube
Sample Outlet Tube
Magnet Assembly
Detector Assembly
Optical Bench Assembly
Mounting Screws (2)
A. Exploded View of Detector/Magnet Assembly
Integral Heater (HR2)
Sample Ou
Sample In
Dual Photocell
Optical Bench Assembly
Detector Assembly
Sensor (RT1)
Integral 5-Micron
Diffusion Screen
Test Body
Mirror
Source Lamp
B. Sectional Top View of Optical Bench and
Detector Assemblies
Connector J12
Connector J12
Photocell
Lock S crews (2 )
Lamp Retaining
Set Screw
Lamp Viewing Hole
Source Lamp
Assembly
C. Exploded View of Optical Bench Assembly
Dual Photocell
Figure 4-3. Detector/Magnet Assembly
Rosemount Analytical Inc. A Division of Emerson Process Management Theory 4-7
Page 44

Instruction Manual
748213-S
April 2002
Model 755R
4-8 Theory Rosemount Analytical Inc. A Division of Emerson Process Management
Page 45

Model 755R
Instruction Manual
748213-S
April 2002
SECTION 5
CIRCUIT ANALYSIS
5-1 CIRCUIT OPERATION
The electronic circuitry of the Model 755R
Oxygen Analyzer consists of the following:
A detector compartment heater circuit.
•
A detector heater circuit.
•
A ±15 VDC power supply.
•
A voltage regulating circuit for a stable
•
light source.
A detector circuit with a first-stage am-
•
plifier to provide a feedback current for
mechanical feedback to the detector
and a scaling amplifier circuit to give an
output change of 0 to +2.5 V for a 0 to
100% change of the operating span.
A digital output circuit for the digital
•
read-out.
An analog output circuit for recorder,
•
optional alarms and current output.
±15 VDC POWER SUPPLY
5-2
Refer to Drawing 617186. The components
of the ±VDC power supply circuit are located
in the lower left-hand corner of the Power
Supply Board. 19 VAC should be measured
with respect to ground at CR5 (WO4). +15
VDC should be measured at the C27 (+)
lead and -15 VDC at the C28 (-) lead. If the
specified voltage measurements are obtained, the power supply is working correctly.
5-3 CASE HEATER CONTROL CIRCUIT
The case heater control circuit utilizes four
voltage-comparators (LM339 quad comparator). An understanding of how one of
these comparators functions is necessary
before any circuit analysis can be attempted.
In Figure 5-1 (page 5-2), comparators 1 and
2 are depicted having a comparator within
an overall comparator symbol. Also within
this symbol, the base of the NPN transistor
is connected to the output of the comparator. A -15 VDC is supplied to the emitter.
The collector is illustrated as the overall output for the comparator package.
When the non-inverting terminal of comparator 2 is more positive than the inverting
terminal, the transistor does not conduct and
the collector of the transistor or comparator
output is at whatever potential is then present on the collector.
When the non-inverting terminal of comparator 2 is less positive (more negative)
than the inverting terminal, the transistor
conducts and the output of the comparator is
-15 V. This value is the output of the OR circuit.
Comparator 2 is biased at 0 volts on the inverting terminal. Comparator 1 is biased at
about 159 mV on the non-inverting terminal.
Positive feedback or hysteresis is built into
each comparator circuit for stability or positive action. This is achieved by the 20 M resistances, R70 and R73.
An approximate 8 V peak-to-peak AC signal
is applied to comparators 1 and 2. As the
signal starts going positive, comparator 2
transistor ceases conducting and comparator 1 transistor is off.
When the signal exceeds the +159 mV on
the non-inverting terminal, it turns on comparator 1 and the output is -15 V. Comparator 1 stays on until the signal drops
below +159 mV, at which time the output will
be the value of the OR bus.
As the AC signal goes negative with respect
to ground, the transistor of comparator 2
conducts and the output is again -15 V. The
Rosemount Analytical Inc. A Division of Emerson Process Management Circuit Analysis 5-1
Page 46

Instruction Manual
748213-S
April 2002
Model 755R
output remains at -15 VDC until the incoming signal crosses zero value and the positive signal causes the comparator 2
transistor to cease to conduct.
Summing the effects of the two comparators
in the OR circuit results in no output from the
comparators for about 4° of the sine wave,
2° after the signal goes positive (0 to 2°) and
2° before the positive signal reaches 180°
(178° to 180°).
During the period that neither comparator is
conducting, the value on the OR bus is the
potential from the temperature-sensing
bridge plus the effect of the ramp generator,
probably -1.88 ±0.03 V.
The on-off effect of the comparators to the
OR circuit results in application of a positive-going pulse (from -15 V to -1.89 V) to
-1.7V
the temperature bridge at the rate of 120
pulses per second.
Capacitor C36 is added to the input circuit to
delay the incoming AC signal so that the
pulses will occur at or just after the line frequency crossover point.
Circuits for a ramp generator and a temperature-sensing bridge are part of the case
heater control circuit (See Figure 5-2, page
5-3 and Figure 5-3, page 5-3).
On initial application of power to comparator
of Figure 5-2 (page 5-3), no potential exists
on the inverting terminal because no charge
exists on capacitor, C37. If the transistor of
comparator 3 does not conduct, +15V is at
the output terminal. With +15V at the output,
the potential on the non-inverting terminals
will be about ±2.3 V because of the resistance divider, R75, R76.
100µ
-15V
159mV
360
°
°
0
°
-
+
INPUT
R69
R71
21.5K
4.75K
2M
R72
COMP 1
COMP 2
+15V
R68
3.3K
0
°
ON ONOFF
OFF OFFON
-
+
C38
0.18uF
1
180
+15V
-15V
R70
20M
Figure 5-1. Two-Comparator OR Circuit
2
+15V
-15V
R73
20M
180
-1.88 VDC
°
OUTPUT
Source
5-2 Circuit Analysis Rosemount Analytical Inc. A Division of Emerson Process Management
Page 47

Model 755R
Instruction Manual
748213-S
April 2002
120 V
RMS
T1
R72
4.75K
19 VAC
12
TO POWER
SUPPLY
19 VAC
R67
10K
C36
.18uF
+15V
C39
.01uF
-
1
+
R70
20M
-
2
+
R73
20M
9.07K
RT1
R82
R74
590K
1.0uF
R84
169K
C37
R83
63.4K
R85
11.0K
-15V
CR9
-15V
CR10
R69
2 M
R71
21.5K
R68
3.3K
Figure 5-2. Case Heater Control Circuit
-
+
R76
37.4K
-
+
R78
249K
3
R75
210K
R86
20M
4
C40
2200uF
R77
10K
R79
10K
R80
10K
CR11
Q6
R81
56.2
.18uF
R87
10K
T2
C38
-15V
INPUT FROM
MULTIVIBRATOR
OFF OFF
R82
9.09K
RT1
OFF
+2.3V
-2.3V
R78
249K
+15V
-15V to 1.88V ±0.3V
R83
63.4K
-15V
R84
169K
R74
590K
C37
1.0uF
TO
COMPARATOR
R76
37.4K
-
3
+
-15V
R75
210K
C40
2200uF
Figure 5-3. Ramp Generator Circuit
R77
10K
R79
10K
R80
10K
6 Hz
+15V
Q6
T2
R81
56.2
C38
.18uF
R87
10K
-15V
Rosemount Analytical Inc. A Division of Emerson Process Management Circuit Analysis 5-3
Page 48

Instruction Manual
748213-S
April 2002
Model 755R
Capacitor C37 will now start to charge positively through R78. When the positive potential across C37 and at the inverting terminal of
comparator 3 exceeds the potential on the
non-inverting terminals, the transistor conducts. The output is -15 V. A full 30 V drop
appears across R77.
The potential on the non-inverting terminal will
now be about -2.3 V. C37 will not discharge
through R78 until its potential exceeds that on
the non-inverting terminal. At that time, comparator 3 will switch polarity and start charging
C37 again. The result is that the potential
across C37 will vary almost linearly with time
and form a ramp signal of about 6 Hz.
As the potential across C37 increases and
decreases linearly, it affects the potential at
the top of the bridge circuit between R82 and
R83 through R74. Because of the ramp action
charging and discharging C37, the potential
between R82 and R83 varies approximately
from -1.85 V to -1.92 VDC.
The temperature sensing device, RT1, in the
bridge circuit is a thermistor. The bridge is designed to control the temperature in the case
at 135°F (57°C). When the temperature is
135°F (57°C), the resistance of the thermistor
RT1 will be at its lowest and the potential at
the junction of RT1 and R84 should be the
same as the junction of R82 and R83. Comparator 4 (See Figure 5-4, page 5-6) does not
allow pulses from the OR circuit (comparators
1 and 2) to operate Q6 or Triac Q7 in the case
heater (See Figure 5-5, page 5-7).
vary from 0mV to some absolute value. The
polarity of the error signal will depend on the
deviation from the desired temperature and
the ramp value at the function of R82 and
R83.
The input from the OR circuit comparator (See
Figure 5-1, page 5-2) is either -15 VDC or the
ramp effect on the bridge. When -15V, the
junction of R82 and R83 is also this value.
The error signal into comparator 4 is negatively large to the inverting terminal. Comparator 4 output transistor does not conduct.
The base of Q6 is positive; therefore, Q6 does
not conduct and a charge builds up on capacitor C38.
The input from the OR comparators 1 and 2
form multivibrator circuit, pulses 120 times a
second. For about 100 microseconds the
junction of R82 and R83 is some value between -1.85 V and -1.92 V, depending on the
ramp generator. For this brief period of time
(one pulse), comparator 4 compares the potential of junction R82, R83 with junction RT1,
R84 of the bridge circuit. If the temperature at
RT1 is low, the potential at the non-inverting
terminal of comparator 4 is more negative and
the output is -15 V.
The base of Q6 is zero, because of the voltage drops across R79 and R80. Therefore,
Q6 conducts. Energy, stored in C38, flows
through Q6 as current and capacitor C38 discharges to zero potential. No current flows
through the primary winding of transformer
T2.
Theoretically, at 135°F (57°C) the potential at
the junction of RTR1 and R84 is -1.85VDC.
This is equivalent to a resistance of 21.2 K. By
substituting a decade box for the thermistor
and placing 20.2 K into the bridge, the heater
should be off. With 22.7 K, the heater should
be full on.
Since the potential at the junction of R82 and
R83 can vary between 1.85V and 1.92V according to the 6 Hz ramp, and the potential at
the junction of RT1 and R84 may vary around
or within these limits, depending on temperature, the error signal to comparator 4 may
5-4 Circuit Analysis Rosemount Analytical Inc. A Division of Emerson Process Management
At the end of the 100 microsecond pulse, the
NPN transistor in the output of comparator 4
ceases to conduct, so the signal on the base
of Q6 is +15V. Q6 ceases to conduct. C38
starts to charge, driving electrons (current)
through the primary of T2. This induces a
pulse into the secondary of T2 and to the gate
of Triac Q7 turning it on.
At the beginning of the next 100 microsecond
pulse, comparator 4 output is again -15V, with
zero volts on the base of Q6. Q6 again conducts, discharging C38. At the end of the 100
microsecond pulse, Q6 ceases to conduct.
Page 49

Model 755R
Instruction Manual
748213-S
April 2002
C38 charges and a pulse appears at the gate
of Triac Q7, turning it on again.
The charging time for C38 is about one-half a
time constant (C38, R87) and ten time constants (R81, C38) are available for discharging C38.
The above action is repeated as long as the
temperature is low, causing an error between
R82, R83 junction and RT1, R84 junction. As
the temperature approaches the desired case
temperature of 135°F (57°C), differences between these two junctions will exist for only
part of each ramp and the number of pulses
operating Q7 will be proportional to the
amount of error sensed by the 6 Hz ramp.
The pulses arrive at Q7 just as the supply AC
line voltage is passing the zero-volt crossover
point. The purpose of C36 is to delay the timing pulse, relative to line frequency, so that a
pulse arrives at the gate of Triac Q7 as the
line potential just passes the zero-volt crossover point (0° and 180° of line phase).
Varistor, RV1 is a temperature sensitive resistance device. When case temperature is
low, such as ambient, the value of RV1 is low.
Applying power at that temperature might
cause a current surge to damage Triac Q7.
RV1 with its low initial value of resistance acts
as a bypass and most of the current is
shunted through it. As the temperature increases and approaches the desired case
temperature, the resistance of RV1 increases
to a large value. This limits the current
through it and gives fine control of the heater
to Triac Q7 and the temperature-sensing circuit.
Rosemount Analytical Inc. A Division of Emerson Process Management Circuit Analysis 5-5
Page 50

Instruction Manual
748213-S
April 2002
Model 755R
5-4 DETECTOR HEATER CONTROL CIRCUIT
Figure 5-4 below is a simplified heater control
circuit drawing for the detector. Heaters 1 and
2 are actually connected in parallel and have
a combined resistance of about 17 ohms.
The thermistor resistance (RT1) in the resistance bridge varies inversely with temperature. The bridge is designed to maintain the
temperature of the detector at 150°F (65.5°C).
The junction point between R55 and R56 is
maintained at a specific voltage since these
resistances maintain a definite ratio. The
thermistor resistance is 149 K at 150F
(65.5°C) and increases rapidly as the temperature decreases. R59 in this bridge circuit
represents the setpoint value for temperature.
Suppose that, at temperature, resistance of
the bridge (R55, R56, R59 and RT1) equals
149 K.
If the temperature goes down, RT1 increases
in resistance and causes the junction of RT1
and R59 to go positive in voltage value. Since
R55 and R56 are of equal resistance, their
junction is at zero volts. Therefore, terminal 3
of AR6 is more positive than terminal 2 and
the base of Q2 is positive. Q2 conducts, allowing alternating current to flow through
heaters 1 and 2. The voltage drop across the
heaters, when completely cold, would be
about 20 VAC and, when controlling, would be
AC of very low amplitude.
As the temperature increases, the resistance
of RT1 decreases and the junction point between RT1 and R59 becomes less positive.
Terminal 3 of AR6 becomes less positive with
respect to terminal 2. The output of AR
causes Q2 and Q3 to conduct less. When
terminal 3 equals terminal 2, or is less than
terminal 2, the output of AR6 is zero or less.
Q2 and Q3 do not conduct and the heater
would not be supplying heat energy to the
detector.
120 V
RMS
R59
700K
RT1
HR1 +2
C31
.01uF
2
3
R88
5M
R58
-
+
F1
25 VAC
+15V
R55
700K
R56
149K
-15V
Figure 5-4. Detector Heater Control Circuit
CR6
WO4
5M
U6
R60
100
R62
1K
6
CR12
Q3
Q2
R61
2.0
5-6 Circuit Analysis Rosemount Analytical Inc. A Division of Emerson Process Management
Page 51

Model 755R
Instruction Manual
748213-S
April 2002
5-5 DETECTOR LIGHT SOURCE CONTROL
CIRCUIT
Refer to Figure 5-5 below. The detector light
source control circuit maintains the light output from the bulb (DS1) as uniform as possible, regardless of voltage fluctuations or aging
of the bulb.
The power source for the light bulb is a center-tapped secondary of transformer T1. This
AC voltage is rectified by CR7 and CR8 and
filtered (C32), presenting an approximate +8.5
V bus to the current-limiting Darlington configuration of Q4.
Q4 controls the basic amount of current
through DS1.
Amplifier AR7 has a fixed value, approximately +2.2 VDC on terminal 3. The output of
AR7 is positive, causing Q4 to conduct. As Q4
conducts, electrons flow from the center-tap of
T1 to ground and from ground through DS1
for an input voltage to terminal 2 of AR7,
through R66 to develop a bias on the base of
Q5, through Q4 to the +8.5 V bus, and back to
the secondary. As Q5 conducts, some of the
current going through DS1 is shunted from the
main current path, and goes through Q5,
which acts as a variable feedback resistance,
goes to the positive output potential of AR7.
As DS1 ages, its light emission decreases
and its resistance increases. The current
through DS1 tends to decrease, causing a
decrease in the voltage drop across DS1 and
the input potential to terminal 2 of AR7. Now
the output AR7 will increase, causing Q4 to
conduct more current through R66. As the
potential across R66 increases, Q5 will conduct more current, causing a further increase
in current flow through DS1. The net result is
that the voltage across DS1 will remain uniform and the operation of Q4 and Q5 will adjust the gain of AR7 to maintain the light
emission from DS1 uniform for a long period
of time.
Voltage fluctuations in the 115 VAC supply
could cause some variation in the amount of
current flowing through the bulb DS1. However, the voltage drop across DS1 would
cause AR7 to adjust Q4 and the voltage drop
across R66 to adjust Q5. The net result would
still be uniform current flow through DS1 and
uniform light emission.
T1
6.1 VAC
120 V
RMS
6.1 VAC
CR7
CR8
2000uF
C31
VR3
9.0V
+
+15V
R63
7.5K
R64
14K
R65
4530
α
α
+8.5V BUS
2
-
+
3
2.2V
AR7
C34
.01uF
C35
.01uF
Q5
Q4
R66
1.0
DS1
Figure 5-5. Detector Light Source Control Circuit
Rosemount Analytical Inc. A Division of Emerson Process Management Circuit Analysis 5-7
Page 52

Instruction Manual
748213-S
April 2002
Model 755R
5-6 DETECTOR WITH FIRST STAGE AMPLIFIER
Refer to Figure 5-6, page 5-9. The detector
assembly consists of a test body suspended
on a platinum wire and located in a
non-uniform magnetic field.
The test body is constructed of two hollow
glass spheres forming a dumbbell shape.
They are filled and sealed with pure, dry nitrogen. Around the test body, a titanium wire is
chemically etched in order to form a feedback
loop that can create a counteracting magnetic
force to the test body displacement caused by
oxygen concentration in the test assembly
magnetic field.
Attached to the center arm of the test body
dumbbell is a diamond-shaped mirror. Attached to the mirror are two separate platinum
wires in tension with the supports for the test
body. The supports are isolated from ground
and are electrically connected to the feedback
loop and the electronics for that loop. The
platinum wires form a fulcrum around which
the test body pivots.
The detector operates in the following fashion.
If the sample gas contains oxygen, it collects
in the non-uniform magnetic field around the
test body. Oxygen, because of its paramagnetic qualities, gathers along the magnetic
lines of flux and forces the dumbbell of the
test body out of the magnetic field.
A light source is focused on the test body mirror. As the test body moves out of the magnetic field, the mirror distributes light unevenly
on two photocells (BT1 and BT2). The photocells create a current proportional to light. This
current is converted to a ± voltage by U1 and
U2 located on the connector board in the detector housing. This voltage is then presented
to comparator U1 on the controller board. The
output of U1 goes to U2. The output of U2
causes current to flow through the feedback
loop attached to the dumbbell.
This feedback current creates an electro-magnetic field that attracts the dumbbell
and mirror into the test assembly magnetic
field until the mirror reflects light almost uni-
formly on each photocell. A current proportional to the oxygen concentration in the magnetic field of the test assembly has to be
flowing through the feedback loop in order to
maintain balance and provide a reading of the
oxygen content of a sample.
Resistances R7, R8 and the resistance of the
wire in the feedback loop determine the gain
of amplifier U2. The mirror on the dumbbell is
positioned by the amount of current in the
feedback loop. The mirror reflects light from
the source (DS1) to the photocells (BT1,
BT2). This repositioning of the mirror is a form
of mechanical feedback to the input of the
amplifier U1.
The net result is that the output of U1 could
vary from 0 to -70 mV, or 0 to -7.0 V, depending on the range of the instrument. R4,
C3 and R5, C7 form damping circuits for the
input amplifier U1 and to smooth out noise
that might be introduced by the measurement
source.
Diode CR2 is a low-leakage device. Its purpose in the circuit is to ensure that the dumbbell and mirror are positioned correctly with
respect to the photocells on initial application
of power.
If the dumbbell was out of position on start-up,
the mirror might reflect light from the source
onto one of the photocells. If the photocell
output was positive, the current in the feedback loop would be in the wrong direction and
its electromagnetic field would cause the
dumbbell to be further repelled from the permanent magnetic field. The result would be
error, not balance.
On application of AC power, capacitor C1 has
no charge. The current will have to flow
through R2. Initially the full 30 V drop (the
difference between the +15 VDC and -15
VDC power) will appear cross R2. The cathode of CR2 will be initially at -15 VDC. The
anode of CR2 will be some value more positive than -15 VDC. CR2 will conduct. The input terminal of U1 will be negative and the
current through the feedback loop around U2
5-8 Circuit Analysis Rosemount Analytical Inc. A Division of Emerson Process Management
Page 53

Model 755R
p
Instruction Manual
748213-S
April 2002
will cause the dumbbell and mirror to be positioned correctly in the test body.
As the charge on C1 increases, the cathode
of CR2 becomes more positive. When it exceeds that on the anode, CR2 ceases to conduct and isolates the +15 VDC and -15 VDC
power supply from the input circuit.
The front panel zero potentiometer R13 and
detector coarse zero potentiometer add or
subtract current to the input of U2 to offset
any currents that may occur because of any
+15V
-15V
CONTROL
BOARD
C1
3.3uF
TP6
R3
110
TP7
1000
R1
10
R2
249K
C2
BT1
BT2
CURRENT
FEEDBACK
LOOP
DS1
DETECTOR
HOUSING
R1
1K
-
U2
+
R3
1K
-
U1
+
R2
1K
R2
1K
imbalance in the detector and the photocells
BT1 and BT2.
The output current that U2 must provide to restore the dumbbell is a measure of the displacing force and thus is a function of both (a)
the % oxygen concentration of the sample
and (b) the sample pressure.
The output from the U1 and U2 loop is further
amplified by U4 to provide a 0 to 10 VDC output that constitutes signal V.
R23
TP8
E21 E22
C4
.01uF
CR2
-
U1
+
C3
.47uF
R6
118K
R4
1.13K
f
R5
2M
C7
.47uF
R7
1.77K
R20
20K
TP20
R8
1.77K
R21
49.9K
R22
49.9K
R12
200K
R10
3.01K
C8
.0022uF
-
U2
+
150K
-
+
+15V
-15V
+15V
-15V
U4
R13
20K
R9
20K
TP10
SIG. Vx 0 -+ 10V
FRONT
PANEL
ZERO
DETECTOR
COARSE
ZERO
Figure 5-6. Detector with First Stage Amplifier
Rosemount Analytical Inc. A Division of Emerson Process Management Circuit Analysis 5-9
Page 54

Instruction Manual
748213-S
April 2002
Model 755R
5-7 BUFFER AMPLIFIERS U8 AND U10 WITH
ASSOCIATED ANTICIPATION FUNCTION
Refer to Figure 5-8, page 5-12. U8 is a unity
gain amplifier that provides zeroing capability
and a buffered output for the anticipation circuit feeding U10.
U10 is an inverting buffer amplifier that incorporates an anticipation arrangement in its input network, thus providing slightly faster
response on the readout device(s).
Potentiometer R30 provides a continuously
variable adjustment of 5 to 25 seconds for the
electronic response time (90% of fullscale)
and is factory-set for 20 seconds.
Since the anticipation network attenuates the
signal, a gain of 10 is provided by the feedback network associated with U10 to restore
the signal to the desired fullscale range of 0 to
10 VDC.
The output signal from U10 is routed to two
output circuits:
Analog output circuits for recorder, V/I
and alarms (See Section 5-9, page 5-11).
5-8 DIGITAL OUTPUT CIRCUIT
Refer to Figure 5-7 below. The output signal
from buffer amplifier U10 is routed through an
attenuator and filter network to an integrating
analog-to-digital converter. It converts the signal into an equivalent digital value in the
range of 0.00% to 99.99%. Any value above
99.99% will be preceded by an over-range bit,
for example, 1.1123.
The output of the ADC consists of binary-coded decimal characters that are input
to the liquid crystal controller and display chip
characters sequentially in time. The BCD
characters are converted into seven-line
codes to drive the bar segments of the liquid
crystal display.
A separate regulator circuit, which operates
from the +15 VDC supply, provides a regulated 5 VDC for the digital functions associated with the display.
Digital output circuit (See Section 5-8,
page 5-10).
R37
2M
C38
.22uF
-
U10
+
R30
20K
R31
2K
TP11
C31
1.0uF
R36
1M
R61
1M
.47uF
C36
Figure 5-7. Buffer, Anticipation, and Digital Output Circuits
R38
100K
R39
11K
To Analog Output Circuit
(Figure 6-8)
TP16
R49
20K
REF
C40
1.0uF
8052A
ADC
71C03
DRIVER AND
TP16
DISPLAY
CONTROL
5V
DIGITAL
DISPLAY
U18
5V
REGULATOR
+15V
5-10 Circuit Analysis Rosemount Analytical Inc. A Division of Emerson Process Management
Page 55

Model 755R
Instruction Manual
748213-S
April 2002
5-9 ANALOG OUTPUT CIRCUITS FOR RE-
CORDER AND ALARMS
Refer to Figure 5-8, page 5-12. The analog
output circuits utilize two amplifiers, first-stage
amplifier and second-stage amplifier.
a. First Stage Amplifier
Permits selection of the desired fullscale
oxygen range for the recorder via
jumper-selectable signal amplification for
scale expansion. This amplifier permits
selecting the desired fullscale oxygen
range for the recorder by an appropriate
jumper selection of one of seven recorder
spans. The following recorder spans are
available: 1, 2.5, 5, 10, 25, 50, and 100%.
b. Second Stage Amplifier
Provides (a) a jumper-selectable output
for a potentiometric recorder and (b) an
output to drive the voltage-to-current
and/or alarm option(s), if used. This amplifier is an inverting configuration that
provides a signal attenuation of 2X, thus
reducing the 10-volt fullscale input signal
to obtain a 5-volt fullscale output. This
output is routed to:
1. Recorder Output Resistor Network. It
provides a jumper-selectable output
of 0 to 10 mV, 0 to 100 mV, 0 to 1 V,
or 0 to 5 VDC for a potentiometric recorder.
2. Current Output Receptacle J1. This
connector accepts the optional plug-in
current-output board.
3. Dual Alarm Amplifier Circuit. This circuit drives the optional 654019 Alarm
Relay Assembly.
Oxygen is strongly paramagnetic while
most other common gases are weakly
diamagnetic. The paramagnetism of oxygen may be regarded as the capability of
an oxygen molecule to become a temporary magnet when placed in a magnetic
field. This is analogous to the magnetization of a piece of soft iron. Diamagnetic
gases are analogous to non-magnetic
substances.
With the Model 755R, the volume magnetic susceptibility of the flowing gas
sample is sensed in the detector/magnet
assembly. As shown in the functional diagram of Figure 5-1 (page 5-2), a dumbbell-shaped, nitrogen-filled, hollow glass
test body is suspended on a platinum/nickel alloy ribbon in a non-uniform
magnetic field.
Because of the “magnetic buoyancy” effect, the spheres of the test body are
subjected to displacement forces, resulting in a displacement torque that is proportional to the volume magnetic
susceptibility of the gas surrounding the
test body.
Rosemount Analytical Inc. A Division of Emerson Process Management Circuit Analysis 5-11
Page 56

Instruction Manual
+
+
748213-S
April 2002
Model 755R
FROM
U10
R84
20K
R85
2M
R102
40K
R86
80K
R52
200K
R87
400K
R53
800K
R82
2M
100
50
25
10
5
2.5
1
C46
.1uF
-
U13
Recorder Span
(Jumper Selectable)
TP18
R50A
20K
-
R50B
20K
R50C
20K
C55
.1uF
U16
R88
500
R57
3.83K
5V
E1 E2
1V
To Alarm and V/I
To Recorder
R58
909
R59
90.9
R60
E3 E4
100mV
E5 E6
10mV
E7 E8
10
Recorder Output
(Jumper Selectable)
Figure 5-8. Simplified Analog Recorder Output Circuit
5-12 Circuit Analysis Rosemount Analytical Inc. A Division of Emerson Process Management
Page 57

Model 755R
Instruction Manual
748213-S
April 2002
SECTION 6
MAINTENANCE AND SERVICE
The information provided in this section will
aid in isolation of a malfunction to a particular
assembly or circuit board. A few detailed
checks are included, to aide in locating the
defective assembly.
It is recommended that those familiar with circuit analysis, refer to Section 6 Circuit Analysis of this manual.
WARNING
ELECTRICAL SHOCK HAZARD
Do not operate without doors and covers
secure. Servicing requires access to live
parts which can cause death or serious
injury. Refer servicing to qualified personnel.
For safety and proper performance this instrument must be connected to a properly
grounded three-wire source of power.
Optional alarm switching relay contacts
wired to separate power sources must be
disconnected before servicing.
WARNING
PARTS INTEGRITY
Tampering or unauthorized substitution of
components may adversely affect safety of
this product. Use only factory documented components for repair
6-1 INITIAL CHECKOUT WITH STANDARD
GASES
If instrument readings do not meet specifications, the first step in troubleshooting is to
isolate the analyzer from the sample stream
and the sample handling system.
Admit zero and span standard gases to the
analyzer. Observe readout on digital display,
and on recorder, if used.
Digital display gives correct reading with standard gases, but not with sample gas
The sample and the sample handling system
are suspect. Check these areas.
Digital display gives correct readings with standard gases, but the alarm or output devices do not
Check these devices individually.
Digital display gives overrange readings with standard gases, as well as sample gas
The problem is likely with detector or the
electronic circuitry. Turn power OFF. Tap
detector compartment with fingers, wait 30
seconds, reapply power. If the suspension
within the detector assembly is hung up, this
may correct the problem. If not, proceed with
checks of the detector and electronic circuitry.
Digital display gives erratic readings with standard gases, as well as sample gas
If zero and span standard gases give noisy or
drifting readings, the problem is probably in
the detector or the temperature control circuits. Proceed with checks of the detector
and electronics. In general, before concluding
that the detector is defective and must be replaced, verify correct operation of all circuits
that could cause erratic readings.
a. Control Board Checkout
The Detector Isolation Plug located on the
Control Board (Figure 3-1, page 3-3), removes the detector signal, allowing the
input voltage to go to zero. The display
should register near zero or on scale, and
TP20 should read zero voltage. To test
the remainder of the measuring circuit, do
the following:
Voltage
1. Set RANGE Select to lowest range.
Rosemount Analytical Inc. A Division of Emerson Process Management Maintenance and Service 6-1
Page 58

Instruction Manual
748213-S
April 2002
Model 755R
2. Adjust R29 clockwise and counterclockwise. The display should follow
accordingly and remain steady within
the adjustment limits of R29. If this
condition is met, refer to Section 6-6a
(page 6-7) for Control Board setup.
Before replacing the Control Board,
test for -15V at the junction of C1/J4-
7. Use the junction of CR1/R2 for
+15V, or any source of ±15V on the
board for the respective voltages.
3. If adjustment of R29 is not possible,
replace the Control Board.
Alarms
Set RANGE Select to lowest range or use
zero and span gases.
Current Output
Set RANGE Select to lowest range or use
zero and span gases.
When checkout complete, re-install Detector Isolation Plug. Configure Control
Board to original setup.
If the Control Board functions correctly,
the problem is either located in the Detector/Magnet Assembly or related to
temperature control.
6-2 HEATING CIRCUITS
To ensure against damage from overheating
in the event of malfunction, the heating circuits receive power via thermal fuses F2 and
F3. If temperature of a heated area exceeds
the permissible maximum, the associated fuse
melts, opening the circuit.
NOTE:
The thermal fuses should be plugged in,
NOT SOLDERED, as the fuse element
might melt and open the circuit.
a. Case Heater Control Circuit
The case heater control circuit receives
power via thermal fuse F2 (setpoint
75°C). This fuse, accessible on the
Power Supply Board, may be checked for
continuity.
Detector compartment heater element
HR3, mounted on the heater/fan assembly, has a normal resistance of 20 ohms.
To verify heater operation, carefully place
a hand on top of detector compartment.
Heat should be felt. If not, check the case
heating circuit.
Temperature sensor RT1 has a cold resistance of 22.7K ohms and a normal operating resistance of 20.2K ohms,
indicating normal operating temperature.
As a further check, disconnect plug P6 on
the Control Board, thus disconnecting
temperature sensor RT1. Substitute a
decade resistor box to simulate the resistance of RT1. Also, connect an AC
voltmeter from the hot side of the line to
the neutral side of F2, located inside the
detector compartment.
Set the decade box for 20.2K ohms to
simulate RT1 at controlling temperature.
The voltmeter should show pulses of 1
VAC.
CAUTION
OVERHEATING
Avoid prolonged operation with the decade box set at 22.2K ohms, overheating
may result.
Set the decade box for 22.2K ohms to
simulate RT1 resistance at ambient temperature. The voltmeter should show
pulses of 120 VAC.
6-3 DETECTOR/MAGNET HEATING CIRCUIT
Heater HR1 is attached to the magnet.
Heater HR2 is attached to the rear of the detector. Combined resistance of these two
parallel-connected heaters, as measured at
6-2 Maintenance and Service Rosemount Analytical Inc. A Division of Emerson Process Management
Page 59

Model 755R
Instruction Manual
748213-S
April 2002
pins 15 and 16 of the detector connector J12,
should be approximately 89 ohms.
VDC when cold and will drop to approximately
0.4 VDC at control temperature. Temperature
sensor RT1 is mounted in the detector, with
If resistance is correct, and the combined resistance is incorrect, heater HR1 may be
open.
leads accessible at pins 10 and 11 of detector
connector J12. The sensor resistance should
be 1M ohms at 25°C and approximately 149K
ohms at operating temperature of 65°C.
To reach the leads of HR1, remove the circuit
board on the heater assembly. Resistance of
HR1 should be approximately 21 ohms.
To check operation of the heater circuit, connect a voltmeter across R61 on the Power
Supply Board. Normally, the voltage will be 4
A. Detector/Magnet Assembly - Exploded View B. Optical Bench - Exploded View
Sample Pre-Heating
Coil
Sample Inlet
Tube
Sample Outlet Tube
Mounting Screws (2)
Connector
Board
Detector Assembly
Optical Bench Assembly
Photocell
Lock Screws (2)
Lamp Retaining
Set Screw
Magnet
Assembly
Lamp Viewing
Hole
Figure 6-1. Detector/Magnet Assembly
Connector
J12
Dual
Photocell
Source Lamp
Assembly
Rosemount Analytical Inc. A Division of Emerson Process Management Maintenance and Service 6-3
Page 60

Instruction Manual
748213-S
April 2002
Model 755R
6-4 DETECTOR CHECK
To isolate the detector as the problem, it is
necessary to check the source lamp, photocells, and suspension (see Figure Figure
6-1B, page 6-3). These components are connected via J12 on the optical bench assembly.
Pin/leads may be removed from connector
J12 by use of an improvised pin removal tool,
such as a paper clip (see Figure 6-2 below).
Upper Slot
Side View
of Connector
Lower Slot
Connect J12 has slots at top and bottom. To
remove a connector pin/lead, insert the tool
into the upper or lower slot and push down on
the end to release the keeper on the pin.
When inserting a pin/lead, its keeper must
face toward the slot opening in the connector
in order to lock in. If inserted otherwise, the
pin/lead will be forced out when the two con-
nectors are joined.
Keeper
Connector Pin Removed
Connector Pin/
Leads in Place
Improvised Pin Removal Tool, Such as a Paper Clip
Figure 6-2. Pin/Lead Removal
When dual photocell is installed,
the gap between the two
photocells should be in position
indicated by this line.
Figure 6-3. Detector Optical Bench
10
J12
Optical Bench
18
WHT
WHT
BLK
BLK
PUR
GRN
1
Hole for Source Lamp
RT1
HR2
Suspension
Heater
Suspension
Terminals
6-4 Maintenance and Service Rosemount Analytical Inc. A Division of Emerson Process Management
Page 61

Model 755R
Instruction Manual
748213-S
April 2002
a. Source Lamp
The simplest check of the source lamp is
to verify that it is lit. Another check is
done by removing the housing cover and
viewing the lamp through the photocell
alignment hole (see Figure 6-3, page 6-4).
If the photocell is not illuminated, test the
voltage across TP2 to TP5 (ground). This
voltage should be 2.2 V ±0.2 VDC. If
reading is correct, the lamp may be
burned out; also inspect the cable for
continuity. If voltage reading is not 2.2 V
±0.2 VDC, the Power Supply Board must
be replaced.
b. Photocell
If the photocells are on, observe through
the photocell alignment hole. The image
should be steady. Disconnect the line
power and observe the image when you
reconnect the power. It should come up
from the side and seek a position that
equally illuminates the photocells.
c. Suspension
Turn electrical power to instrument OFF.
Remove optical bench assembly (see
Figure 6-1A, page 6-3). With 100% nitrogen flowing through the analyzer, note
position of the suspension. Then admit
air and note response of the suspension.
It should rotate clockwise as viewed from
the top, and to the right as viewed though
the window. Failure to rotate indicates
that the suspension has been damaged
and detector assembly must be replaced.
See Section 6-5c, page 6-7.
If the suspension has been changed, the
cause may be improper operating conditions.
6-5 REPLACEMENT OF DETECTOR/MAGNET
COMPONENTS
a. Source Lamp
Removal/Installation
The source lamp is held in the optical
bench assembly by a set screw (see Figure 6-1B, page 6-3). The two lamp leads
are connected to J12.
The red line on the lamp base must align
with the set screw (see Figure 6-4A). The
base of the lamp should extend from the
hole approximately 1/4 inch. Tighten set
screw when lamp is aligned.
Realign the photocell per Section 6-5b,
page 6-5.
b. Photocell
Removal/Installation
Refer to Figure 6-1B, page 6-3. Note location of photocell leads in connector J12.
Remove leads. Remove photocell lock
screws (2), slide photocell out.
Reverse the removal procedure for installation. Align photocell (see below).
Alignment
The adjustments in this procedure are
made on the Control Board. With zero
gas flowing:
1. Place a digital voltmeter between the
wiper of zero potentiometer (R13) and
TP7 (ground). Adjust for 0 VDC.
2. Remove the voltmeter from R13 and
place on R10 (see Figure 6-4B, page
6-6). Adjust R9 for 0 VDC.
3. Remove the voltmeter from R10 and
place on TP8. Move the photocell to
obtain a DC voltage as close to 0 mV
as possible, but no more than ±750
mV.
Rosemount Analytical Inc. A Division of Emerson Process Management Maintenance and Service 6-5
Page 62

Instruction Manual
Alig
748213-S
April 2002
Model 755R
4. Apply power to instrument and allow
to warm-up approximately one hour.
5. Set front panel ZERO at mid-range
(i.e., five turns from either end).
6. Connect digital voltmeter from slider
of R9 to chassis ground. With a
steady flow of 50 to 500 cc/min of nitrogen zero gas going through instrument, adjust R9 for 0 V.
DETAIL A
Set Screw
7. Connect the voltmeter between TP10
and circuit ground (TP7). Adjust front
panel ZERO for reading of exactly
zero on voltmeter.
All internal adjustments are now properly
set. The instrument may be calibrated
per Section 3-4, page 3-1.
1/4"
Red Mark for
nment
DETAIL B
C8
Voltmeter
Lead
C1
R10
R8
R7
Figure 6-4. Lamp Replacement
6-6 Maintenance and Service Rosemount Analytical Inc. A Division of Emerson Process Management
Page 63

Model 755R
Instruction Manual
748213-S
April 2002
c. Detector
Removal
Prior to removal of the detector, remove
power from instrument and stop flow of
sample gas.
1. Remove the four screws securing the
detector cover plate.
2. Disconnect cable from J12 on the
detector assembly.
NOTE:
Note how the rubber sample lines are
looped into a "long coil". When reinstalling the sample lines they must be
configured in the same way. This precaution isolates the detector from the
effects of mechanical vibration. Otherwise vibration waves could travel
upward along the tubing walls, resulting in noisy readout.
3. Refer to Figure 6-1, page 6-3. Using
needle-nose pliers, squeeze the hose
clamps to disconnect the rubber sample lines from the metal inlet and outlet tubes of the detector assembly.
4. Remove the two screws at the bottom
of the detector assembly, slide detector out.
Installation
1. Install replacement detector assembly
and connect cable to J12.
2. Seat the detector assembly firmly
against the magnet pole pieces and
tighten attaching screws.
Calibration
1. On the Control Board, set the front
panel ZERO control (R13) at midrange (i.e., five turns from either end).
2. Connect a digital voltmeter from the
slider of R9 to chassis ground. With a
steady flow of 50 to 500 cc/min. of nitrogen gas passing through the instrument, adjust R9 for zero volts.
3. Connect the voltmeter between TP10
and circuit ground (TP7). Adjust front
panel ZERO control (R13) for reading
of exactly zero on voltmeter.
4. With all internal adjustments now
properly set, the instrument may be
calibrated per Section 3-4, page 3-1.
6-6 CONTROL BOARD SETUP
a. Power Supply Test
1. TP7 (circuit ground) is ground point
for all voltage tests.
2. Counterclockwise end of front panel
ZERO potentiometer (R13 on Control
Board): -15 VDC ±0.5 VDC.
3. Clockwise end of ZERO potentiometer: +15 VDC ±5 VDC.
4. Set ZERO potentiometer to obtain a
reading of .0 VDC ±10 mV at slider.
5. Measure TP19: +5 VDC ±0.25 VDC.
3. Reconnect rubber sample lines to
metal inlet and outlet tubes on detector assembly.
4. Apply power to instrument and allow
to warm up approximately one hour.
Rosemount Analytical Inc. A Division of Emerson Process Management Maintenance and Service 6-7
b. Detector zero
1. Flow 250 cc/min nitrogen.
2. Monitor TP8, adjust R9 for 0 VDC
±2mV.
Page 64

Instruction Manual
748213-S
April 2002
Model 755R
c. U4 Zero
1. Monitor TP5, adjust R100 for 1 VDC
±2mV.
2. Monitor TP10, adjust R13 (ZERO) for
0.0 VDC ±5mV.
d. U8 Zero
Monitor TP11, adjust R29 for 0.0 VDC
±5mV.
e. U10 Zero
1. Monitor TP16, adjust R29 for 0.0 VDC
±5mV.
NOTE:
This adjustment requires a "long time"
constant. Allow adequate time.
2. Adjust R29 to obtain a reading of
00.00 ±5 counts on the display.
f. Fullscale
1. Monitor TP11. Flow 100% oxygen,
adjust SPAN potentiometer R20 for
10.00 V ±5mV.
2. Monitor TP16, adjust R20 for 10.00 V
±5mV. The display must read 100.00
±5 counts.
g. Recorder Fullscale
1. Flow nitrogen at 250 cc/min, monitor
TP16, and adjust front panel ZERO
potentiometer for .000 VDC.
2. Flow 100% oxygen for span gas. Recorder output for 1 V, 100 mV, or 10
mV should read 100% of span gas.
Adjust R88 if necessary.
6-8 Maintenance and Service Rosemount Analytical Inc. A Division of Emerson Process Management
Page 65

Model 755R
Instruction Manual
748213-S
April 2002
SECTION 7
REPLACEMENT PARTS
The following parts are recommended for routine maintenance and troubleshooting of the
Model 755R Oxygen Analyzer. If the troubleshooting procedures do not resolve the problem, contact Rosemount Analytical Customer
Service Center.
WARNING
PARTS INTEGRITY
Tampering or unauthorized substitution of
components may adversely affect safety of
this product. Use only factory-documented
components for repair.
7-1 CIRCUIT BOARD REPLACEMENT POLICY
In most situations involving a malfunction of a
circuit board, it is more practical to replace the
board than to attempt isolation and replacement of the individual component. The cost of
test and replacement will exceed the cost of a
rebuilt assembly. As standard policy, rebuilt
boards are available on an exchange basis.
Because of the exchange policy covering circuit boards the following list does not include
individual electronic components. If circumstances necessitate replacement of an individual component, which can be identified by
inspection or from the schematic diagrams,
obtain the replacement component from a local source of supply.
Rosemount Analytical Inc. A Division of Emerson Process Management Replacement Parts 7-1
Page 66

Instruction Manual
748213-S
April 2002
7-2 MATRIX – MODEL 755R OXYGEN ANALYZER
755R Model 755R Oxygen Analyzer
Code Ranges
01 0-5, 10, 25, 50, and 100% O2 (Standard)
02 0-1, 2.5, 5, 10, 25, 50, and 100% O2 (Extended)
99 Special
Code
Output
01 0-10 mV, 0-100 mV, 0-1 V or 0-5 VDC (Standard)
02 0, 4-20 mA (Current)
99 Special
Code Alarm Relays
00 No Alarm
01 Dual Alarm
99 Special
Model 755R
Code Case
01 Standard
02 Standard with Tropicalization
03 EMC Kit
04 EMC Kit with Tropicalization
99 Special
Code Operation
115 VAC, 50/60 Hz (Standard)
01
02 230 VAC, 50/60 Hz
99 Special
Code Remote Range
00 None
01 Standard ( 0-5, 10, 25, 50, 100%)
02 Extended ( 0-1, 2.5, 5, 10, 25%)
03 0-1, 2.5, 5, 10, 50%
04 0-1, 2.5, 5, 25, 50%
0-1, 2.5, 5, 25, 100%
05
0-1, 2.5, 10, 25, 100%
06
Special
99
Code Feature
Features as selected
00
Special
99
(1)
(1)
(1)
(1)
(1)
755R 01 01 01 01 01 00 00 Example
7-2 Replacement Parts Rosemount Analytical Inc. A Division of Emerson Process Management
Page 67

Model 755R
7-3 SELECTED REPLACEMENT PARTS
092114 Fuse, 1/2A (240VAC) (Package of 5)
777362 Fuse, Heater 3A (120VAC) (Package of 15)
777361 Fuse, Heater 1.5A (240VAC) (Package of 15)
861649 Thermal Fuse (F2,F3)
656189 Detector/Optical Bench Assembly (0 to 1%)
616418 Source Lamp Kit
622356 Photocell
621023 Current Output Board (0 to 20mA, 4 to 20mA)
622351 Connector Board
631773 Power Supply Board
652830 Control Board Kit
654004 Thermistor - Case Heater
654022 Display Assembly
654078 Viton Tubing (Sample In)
654079 Viton Tubing (Sample Out)
654080 Fan Assembly
654081 Case Heater
809374 Fuse, 3/4A (Power Transformer, 115VAC)
860371 Alarm Relay
645407 Shock Mount (Package of 4)
Instruction Manual
748213-S
April 2002
Rosemount Analytical Inc. A Division of Emerson Process Management Replacement Parts 7-3
Page 68

Instruction Manual
748213-S
April 2002
Model 755R
7-4 Replacement Parts Rosemount Analytical Inc. A Division of Emerson Process Management
Page 69

Model 755R
Instruction Manual
748213-S
April 2002
SECTION 8
RETURN OF MATERIAL
8-1 RETURN OF MATERIAL
If factory repair of defective equipment is
required, proceed as follows:
1. Secure a return authorization from a
Rosemount Analytical Inc. Sales Office or
Representative before returning the
equipment. Equipment must be returned
with complete identification in accordance
with Rosemount instructions or it will not
be accepted.
Rosemount CSC will provide the shipping
address for your instrument.
In no event will Rosemount be
responsible for equipment returned
without proper authorization and
identification.
2. Carefully pack the defective unit in a
sturdy box with sufficient shock absorbing
material to ensure no additional damage
occurs during shipping.
3. In a cover letter, describe completely:
The symptoms that determined the
•
equipment is faulty.
The environment in which the
•
equipment was operating (housing,
weather, vibration, dust, etc.).
Site from where the equipment was
•
removed.
Whether warranty or non-warranty
•
service is expected.
Complete shipping instructions for the
•
return of the equipment.
4. Enclose a cover letter and purchase order
and ship the defective equipment
according to instructions provided in the
Rosemount Return Authorization, prepaid,
to the address provided by Rosemount
CSC.
Rosemount Analytical Inc.
Process Analytical Division
Customer Service Center
1-800-433-6076
If warranty service is expected, the defective
unit will be carefully inspected and tested at
the factory. If the failure was due to the
conditions listed in the standard Rosemount
warranty, the defective unit will be repaired or
replaced at Rosemount’s option, and an
operating unit will be returned to the customer
in accordance with the shipping instructions
furnished in the cover letter.
For equipment no longer under warranty, the
equipment will be repaired at the factory and
returned as directed by the purchase order
and shipping instructions.
8-2 CUSTOMER SERVICE
For order administration, replacement Parts,
application assistance, on-site or factory
repair, service or maintenance contract
information, contact:
Rosemount Analytical Inc.
Process Analytical Division
Customer Service Center
1-800-433-6076
8-3 TRAINING
A comprehensive Factory Training Program of
operator and service classes is available. For
a copy of the
Training Schedule
Services Department at:
Rosemount Analytical Inc.
Customer Service Center
Current Operator and Service
contact the Technical
1-800-433-6076
Rosemount Analytical Inc. A Division of Emerson Process Management Return of Material 8-1
Page 70

Instruction Manual
748213-S
April 2002
Model 755R
8-2 Return of Material Rosemount Analytical Inc. A Division of Emerson Process Management
Page 71

WARRANTY
Goods and part(s) (excluding consumables) manufactured by Seller are warranted to be free from
defects in workmanship and material under normal use and service for a period of twelve (12)
months from the date of shipment by Seller. Consumables, glass electrodes, membranes, liquid
junctions, electrolyte, o-rings, etc., are warranted to be free from defects in workmanship and
material under normal use and service for a period of ninety (90) days from date of shipment by
Seller. Goods, part(s) and consumables proven by Seller to be defective in workmanship and/or
material shall be replaced or repaired, free of charge, F.O.B. Seller's factory provided that the
goods, part(s) or consumables are returned to Seller's designated factory, transportation charges
prepaid, within the twelve (12) month period of warranty in the case of goods and part(s), and in
the case of consumables, within the ninety (90) day period of warranty. This warranty shall be in
effect for replacement or repaired goods, part(s) and the remaining portion of the ninety (90) day
warranty in the case of consumables. A defect in goods, part(s) and consumables of the
commercial unit shall not operate to condemn such commercial unit when such goods, part(s)
and consumables are capable of being renewed, repaired or replaced.
The Seller shall not be liable to the Buyer, or to any other person, for the loss or damage directly
or indirectly, arising from the use of the equipment or goods, from breach of any warranty, or from
any other cause. All other warranties, expressed or implied are hereby excluded.
IN CONSIDERATION OF THE HEREIN STATED PURCHASE PRICE OF THE GOODS,
SELLER GRANTS ONLY THE ABOVE STATED EXPRESS WARRANTY. NO OTHER
WARRANTIES ARE GRANTED INCLUDING, BUT NOT LIMITED TO, EXPRESS AND IMPLIED
WARRANTIES OR MERCHANTABILITY AND FITNESS FOR A PARTICULAR PURPOSE.
Limitations of Remedy. SELLER SHALL NOT BE LIABLE FOR DAMAGES CAUSED BY
DELAY IN PERFORMANCE. THE SOLE AND EXCLUSIVE REMEDY FOR BREACH OF
WARRANTY SHALL BE LIMITED TO REPAIR OR REPLACEMENT UNDER THE STANDARD
WARRANTY CLAUSE. IN NO CASE, REGARDLESS OF THE FORM OF THE CAUSE OF
ACTION, SHALL SELLER'S LIABILITY EXCEED THE PRICE TO BUYER OF THE SPECIFIC
GOODS MANUFACTURED BY SELLER GIVING RISE TO THE CAUSE OF ACTION. BUYER
AGREES THAT IN NO EVENT SHALL SELLER'S LIABILITY EXTEND TO INCLUDE
INCIDENTAL OR CONSEQUENTIAL DAMAGES. CONSEQUENTIAL DAMAGES SHALL
INCLUDE, BUT ARE NOT LIMITED TO, LOSS OF ANTICIPATED PROFITS, LOSS OF USE,
LOSS OF REVENUE, COST OF CAPITAL AND DAMAGE OR LOSS OF OTHER PROPERTY
OR EQUIPMENT. IN NO EVENT SHALL SELLER BE OBLIGATED TO INDEMNIFY BUYER IN
ANY MANNER NOR SHALL SELLER BE LIABLE FOR PROPERTY DAMAGE AND/OR THIRD
PARTY CLAIMS COVERED BY UMBRELLA INSURANCE AND/OR INDEMNITY COVERAGE
PROVIDED TO BUYER, ITS ASSIGNS, AND EACH SUCCESSOR INTEREST TO THE GOODS
PROVIDED HEREUNDER.
Force Majeure. Seller shall not be liable for failure to perform due to labor strikes or acts beyond
Seller's direct control.
Page 72

Instruction Manual
748213-S
April 2002
Model 755R
Emerson Process Management
Rosemount Analytical Inc.
Process Analytic Division
1201 N. Main St.
Orrville, OH 44667-0901
T (330) 682-9010
F (330) 684-4434
E gas.csc@emersonprocess.com
ASIA - PACIFIC
Fisher-Rosemount
Singapore Private Ltd.
1 Pandan Crescent
Singapore 128461
Republic of Singapore
T 65-777-8211
F 65-777-0947
http://www.processanalytic.com
© Rosemount Analytical Inc. 2001
Fisher-Rosemount GmbH & Co.
Industriestrasse 1
63594 Hasselroth
Germany
T 49-6055-884 0
F 49-6055-884209
EUROPE, MIDDLE EAST, AFRICA
Fisher-Rosemount Ltd.
Heath Place
Bognor Regis
West Sussex PO22 9SH
England
T 44-1243-863121
F 44-1243-845354
LATIN AMERICA
Fisher - Rosemount
Av. das Americas
3333 sala 1004
Rio de Janeiro, RJ
Brazil 22631-003
T 55-21-2431-1882
Page 73

Page 74

Page 75

Page 76

Page 77

Page 78

Page 79

 Loading...