

Page 1
Model 54eA
Amperometric HART®Analyzer/Controller
Instruction Manual
51-54eA/rev.J
May 2006
Page 2
ESSENTIAL INSTRUCTIONS
READ THIS PAGE BEFORE PROCEEDING!
Rosemount Analytical designs, manufactures, and tests its products to
meet many national and international standards. Because these instruments are sophisticated technical products, you must properly install, use,
and maintain them to ensure they continue to operate within their normal
specifications. The following instructions must be adhered to and integrated into your safety program when installing, using, and maintaining
Rosemount Analytical products. Failure to follow the proper instructions
may cause any one of the following situations to occur: Loss of life; personal injury; property damage; damage to this instrument; and warranty
invalidation.
• Read all instructions prior to installing, operating, and servicing the product. If this Instruction Manual is not the correct manual, telephone 1800-654-7768 and the requested manual will be provided. Save this
Instruction Manual for future reference.
• If you do not understand any of the instructions, contact your
Rosemount representative for clarification.
• Follow all warnings, cautions, and instructions marked on and supplied
with the product.
• Inform and educate your personnel in the proper installation, operation,
and maintenance of the product.
• Install your equipment as specified in the Installation Instructions of the
appropriate Instruction Manual and per applicable local and national
codes. Connect all products to the proper electrical and pressure
sources.
• To ensure proper performance, use qualified personnel to install, operate, update, program, and maintain the product.
• When replacement parts are required, ensure that qualified people use
replacement parts specified by Rosemount. Unauthorized parts and
procedures can affect the product’s performance and place the safe
operation of your process at risk. Look alike substitutions may result in
fire, electrical hazards, or improper operation.
• Ensure that all equipment doors are closed and protective covers are in
place, except when maintenance is being performed by qualified persons, to prevent electrical shock and personal injury.
WARNING
ELECTRICAL SHOCK HAZARD
Making cable connections to and servicing this instrument require access to shock hazard level voltages
which can cause death or serious injury, therefore,
disconnect all hazardous voltage before accessing
the electronics.
Relay contacts made to separate power sources must
be disconnected before servicing.
Electrical installation must be in accordance with the
National Electrical Code (ANSI/NFPA-70) and/or any
other applicable national or local codes.
Unused cable conduit entries must be securely sealed
by non-flammable closures to provide enclosure
integrity in compliance with personal safety and environmental protection requirements. Use NEMA 4X or
IP65 conduit plugs supplied with the instrument to
maintain the ingress protection rating (IP65).
For safety and proper performance this instrument
must be connected to a properly grounded three-wire
power source.
Proper relay use and configuration is the responsibility of the user. No external connection to the instrument of more than 60VDC or 43V peak allowed with
the exception of power and relay terminals. Any violation will impair the safety protection provided.
Do not operate this instrument without front cover
secured. Refer installation, operation and servicing to
qualified personnel.
WARNING
This product is not intended for use in the residential, commercial or light industrial environment per certification to EN61326.
Emerson Process Management
Liquid Division
2400 Barranca Parkway
Irvine, CA 92606 USA
Tel: (949) 757-8500
Fax: (949) 474-7250
http://www.raihome.com
© Rosemount Analytical Inc. 2006
About This Document
This manual contains instructions for installation and operation of the Model 54eA Amperometric
HART Analyzer/Controller. The following list provides notes concerning all revisions of this document.
Rev. Level Date Notes
A 11/01 This is the initial release of the product manual. The manual has been reformatted to reflect the
Emerson documentation style and updated to reflect any changes in the product offering.
B 2/02 Revised wiring diagrams on pages 9, 11, & 13.
C 5/02 Added configuration note to page 10.
D 11/02 Change to intro verbiage in Section 5.3 on page 26.
E 11/02 Added note re 499A sensors to page 8.
F 4/03 Added monochloramine section and updated CE info.
G 8/03 Minor textual revisions on pages 48, 65, 67, 93.
H 12/03 Updated ISO & warranty info, and fixed minor typos throughout.
I 4/05 Added note re ordering replacement boards/integrated board stack on page 105.
J 5/06
Noted 0-20 mA limitation for HART versions on pp. 18, 25, & 31.
Page 3
Page 4

MODEL 54eA TABLE OF CONTENTS
MODEL 54eA ANALYZER/CONTROLLER
TABLE OF CONTENTS
Section Title Page
1.0 SPECIFICATIONS................................................................................................... 1
1.1 Features and Applications....................................................................................... 1
1.2 Specifications........................................................................................................... 2
1.3 Ordering Information................................................................................................ 4
2.0 INSTALLATION....................................................................................................... 5
2.1 Unpacking and Inspection ....................................................................................... 5
2.2 Installation ...............................................................................................................5
3.0 WIRING ................................................................................................................... 8
3.1 General.................................................................................................................... 8
3.2 Power, Alarm, and Output Wiring............................................................................ 8
3.3 Sensor Wiring.......................................................................................................... 10
4.0 DISPLAY AND OPERATION .................................................................................. 16
4.1 General Description................................................................................................. 16
4.2 Display..................................................................................................................... 16
4.3 Key Functions and Controls .................................................................................... 16
4.4 Alarm Status............................................................................................................ 16
5.0 SOFTWARE CONFIGURATION ............................................................................. 17
5.1 Changing Alarm Setpoints....................................................................................... 24
5.2 Ranging the Outputs ............................................................................................... 25
5.3 Changing Output Setpoints (PID only) .................................................................... 26
5.4 Testing Outputs and Alarms .................................................................................... 27
5.5 Choosing Display Options ....................................................................................... 28
5.6 Changing Output Parameters.................................................................................. 30
5.7 Changing Alarm Parameters ................................................................................... 33
5.8 Configuring the pH Measurement ........................................................................... 38
5.9 Temperature Compensation and Temperature Units............................................... 41
5.10 Noise Reduction ...................................................................................................... 42
5.11 Main Sensor Calibration Parameters ...................................................................... 43
5.12 Barometric Pressure................................................................................................ 44
5.13 Security.................................................................................................................... 45
5.14 Controller Mode Priority........................................................................................... 46
6.0 CALIBRATION - TEMPERATURE.......................................................................... 47
6.1 Introduction.............................................................................................................. 47
6.2 Temperature Calibration .......................................................................................... 48
7.0 CALIBRATION - DISSOLVED OXYGEN................................................................ 49
7.1 Introduction.............................................................................................................. 49
7.2 Zeroing the Sensor.................................................................................................. 50
7.3 Calibrating the Sensor in Air.................................................................................... 51
7.4 Calibrating the Sensor Against a Standard Instrument ........................................... 53
7.5 Calibrating Barometric Pressure ............................................................................. 54
8.0 CALIBRATION - FREE CHLORINE (499 ACL-01) ................................................ 55
8.1 Introduction.............................................................................................................. 55
8.2 Zeroing the Sensor.................................................................................................. 56
8.3 Full Scale Calibration............................................................................................... 57
8.4 Dual Slope Calibration............................................................................................. 58
i
Page 5

9.0 CALIBRATION - FREE CHLORINE (498 ACL-01) ................................................ 60
9.1 Introduction.............................................................................................................. 60
9.2 Zeroing the Sensor.................................................................................................. 61
9.3 Full Scale Calibration............................................................................................... 62
9.4 Dual Slope Calibration............................................................................................. 63
10.0 CALIBRATION - TOTAL CHLORINE ..................................................................... 65
11.0 CALIBRATION - MONOCHLORAMINE ................................................................. 67
11.1 Introduction.............................................................................................................. 67
11.2 Zeroing the Sensor.................................................................................................. 68
11.3 Full Scale Calibration............................................................................................... 69
12.0 CALIBRATION - OZONE........................................................................................ 70
12.1 Introduction.............................................................................................................. 70
12.2 Zeroing the Sensor.................................................................................................. 71
12.3 Full Scale Calibration............................................................................................... 72
13.0 CALIBRATION - pH................................................................................................ 73
13.1 Introduction.............................................................................................................. 73
13.2 Automatic Two-Point Calibration ............................................................................. 74
13.3 Manual Two-Point Calibration.................................................................................. 76
13.4 Standardization (One-Point Calibration).................................................................. 78
13.5 pH Slope Adjustment............................................................................................... 79
14.0 CALIBRATION - CURRENT OUTPUTS................................................................. 80
14.1 Introduction.............................................................................................................. 80
14.2 Trimming the Outputs.............................................................................................. 80
15.0 PID AND TPC CONTROL....................................................................................... 81
15.1 PID Control .............................................................................................................. 81
15.2 Time Proportional Control (TPC)............................................................................. 85
16.0 TROUBLESHOOTING ............................................................................................ 86
16.1 Overview.................................................................................................................. 86
16.2 Troubleshooting When a Fault Message is Showing.............................................. 86
16.3 Troubleshooting When No Fault Message is Showing - Temperature.................... 88
16.4 Troubleshooting When No Fault Message is Showing - Oxygen............................ 88
16.5 Troubleshooting When No Fault Message is Showing - Free Chlorine.................. 91
16.6 Troubleshooting When No Fault Message is Showing - Total Chlorine .................. 93
16.7 Troubleshooting When No Fault Message is Showing - Monochloramine ............. 94
16.8 Troubleshooting When No Fault Message is Showing - Ozone ............................. 97
16.9 Troubleshooting When No Fault Message is Showing - pH ................................... 99
16.10 Troubleshooting Not Related to Measurement Problems ....................................... 102
16.11 Simulating Inputs - Dissolved Oxygen .................................................................... 102
16.12 Simulating Inputs - Other Amperometric Measurements ........................................ 103
16.13 Simulating Inputs - pH............................................................................................. 104
16.14 Simulating Temperature........................................................................................... 105
16.15 Measuring Reference Voltage ................................................................................. 106
17.0 MAINTENANCE ...................................................................................................... 107
18.0 RETURN OF MATERIALS...................................................................................... 108
ii
MODEL 54eA TABLE OF CONTENTS
TABLE OF CONTENTS (CONTINUED)
Section Title Page
Page 6

iii
MODEL 54eA TABLE OF CONTENTS
LIST OF FIGURES
Section Title Page
2-1 Wall Mounting.......................................................................................................... 5
2-2 Pipe Mounting.......................................................................................................... 6
2-3 Pipe and Wall Mounting Dimensions....................................................................... 6
2-4 Panel Mounting........................................................................................................ 7
2-5 Panel Mounting Dimensions.................................................................................... 7
3-1 Power Input and Relay Output Wiring for Model 54eA........................................... 9
3-2 Wiring Label............................................................................................................. 10
3-3 Amperometric Sensors with Standard Cable........................................................... 10
3-4 Amperometric Sensors with Optimum EMI/RFI Cable or Variopol Cable ............... 10
3-5 Free Chlorine Sensor with Standard Cable and 399VP-09 pH Sensor without .....
Internal Preamplifier ................................................................................................ 11
3-6 Free Chlorine Sensor with Standard Cable and 399-14 pH Sensor Having Internal
Preamplifier.............................................................................................................. 12
3-7 Free Chlorine Sensor with Standard Cable and 399-09-62 pH sensor without .....
Internal Preamplifier ................................................................................................ 12
3-8 Free Chlorine Sensor with Optimum EMI/RFI Cable or Variopol Cable and .........
399VP-09 pH Sensor without Internal Preamplifier................................................. 13
3-9 Free Chlorine Sensor with Optimum EMI/RFI Cable or Variopol Cable and 399-14
pH Sensor Having Internal Preamplifier.................................................................. 13
3-10 Free Chlorine Sensor with Optimum EMI/RFI Cable or Variopol Cable and .........
399-09-62 pH Sensor without Internal Preamplifier ............................................... 14
3-11 Hx438 and Gx448 Sensors ..................................................................................... 15
4-1 Configuration of Inputs and Outputs for Free Chlorine ........................................... 16
4-2 Main Display Screen................................................................................................ 16
5-1 Menu Tree for the 54eA Controller .......................................................................... 21
5-2 Low Alarm................................................................................................................ 35
5-3 High Alarm............................................................................................................... 35
5-4 Interval Timer .......................................................................................................... 37
7-1 Sensor Current as a Function of Dissolved Oxygen Concentration ....................... 49
8-1 Sensor Current as a Function of Free Chlorine Concentration............................... 55
8-2 Dual Slope Calibration............................................................................................. 58
9-1 Determination of Total Chlorine ............................................................................... 60
9-2 Sensor Current as a Function of Total Chlorine Concentration............................... 60
9-3 Dual Slope Calibration............................................................................................. 63
10-1 Sensor Current as a Function of Monochloramine Concentration .......................... 65
11-1 Sensor Current as a Function of Ozone Concentration .......................................... 68
12-1 Calibration Slope and Offset ................................................................................... 71
14-1 The Process Reaction Curve .................................................................................. 81
14-2 Time Proportional Control........................................................................................ 83
15-1 Simulate Dissolved Oxygen..................................................................................... 100
15-2 Simulate Chlorine and Ozone ................................................................................. 101
15-3 Simulate pH ............................................................................................................. 102
15-4 Three-Wire RTD Configuration................................................................................ 103
15-5 Simulating RTD Inputs............................................................................................. 103
15-6 Checking for a Poisoned Reference Electrode ....................................................... 104
Page 7

1
MODEL 54eA SECTION 1.0
SPECIFICATIONS
SECTION 1.0
SPECIFICATIONS
1.1 FEATURES AND APPLICATIONS
The Model 54eA Analyzer/Controller with the appropriate sensor monitors and controls dissolved oxygen (ppm and ppb level), free chlorine, total
chlorine, and ozone in a variety of process liquids.
The analyzer is compatible with Rosemount
Analytical series 499A amperometric sensors for
oxygen, chlorine, and ozone; and with Hx438 and
Gx448 steam sterilizable oxygen sensors.
The amperometric sensors used with the Modeal
54eA produce a current directly proportional to the
concentration of the substance being determined.
Sensor currents are in the microampere to nanoampere range.
For oxygen measurements, an on-board pressure
sensor allows truly automatic air calibration. Simply
expose the sensor to water-saturated air. Wait until
readings are stable and press a button. The analyzer measures temperature and barometric pressure
and automatically completes the calibration.
For free chlorine measurements, both automatic and
manual pH correction are available. pH correction is
necessary because amperometric chlorine sensors
respond only to hypochlorous acid. To measure free
chlorine (hypochlorous acid plus hypochlorite ion)
most competing analyzers require an acidified sample. Acid lowers the pH and converts hypochlorite
ion to hypochlorous acid. The 54eA analyzer eliminates the need for messy and expensive reagents
by using the sample pH to correct the chlorine sensor signal. If the pH is relatively constant, a fixed pH
correction can be used. If the pH is greater than 7
and fluctuates more than about 0.2 units, continuous
measurement of pH and automatic pH correction is
necessary. Corrections are valid to pH 9.5.
The 54eA analyzer fully compensates oxygen,
ozone, free chlorine, and total chlorine readings for
changes in membrane permeability caused by temperature changes.
For pH measurements — pH is available with free
chlorine only — the 54eA features automatic buffer
recognition with stabilization check. Buffer pH and
temperature data for commonly used buffers are
stored in the analyzer. Glass impedance diagnostics
warn the user of an aging or failed pH sensor.
The analyzer has a rugged, weatherproof, corrosionresistant enclosure (NEMA 4X and IP65) of epoxypainted aluminum. It is suitable for panel, pipe, or wall
mounting. A hinged front cover provides convenient
access to wiring. Programming and calibration are
through the front membrane keypad, which has tactile feedback. The large back-lit dot-matrix display
shows the main measurement (oxygen, chlorine, or
ozone) in large numerals. The temperature and output current are shown in smaller numerals on the
second line. Two user-selectable variables can be
displayed on the third line. The pH measurement, if
used, appears on the third line.
Two independent, galvanically isolated outputs provide
4-20 mA or 0-20 mA signals for oxygen, chlorine,
ozone, pH, or temperature. Output 1 includes a HART
digital signal superimposed on the analog signal. The
controller option allows PID control on any measurement.
The Model 54eA has three programmable alarm
relays. Alarms can be assigned to the amperometric
measurement, pH, or temperature. Alarms have programmable high or low activation, independent setpoints, adjustable deadband, and time delay. Any
relay can be configured as a timer to control a spray
cleaner for the dissolved oxygen sensor. An overfeed timer feature is also available. The controller
option allows each alarm to be configured for time
proportional control (TPC). A fourth relay is a dedicated fault alarm.
The Model 54eA analyzer is a member of the
Rosemount SMART FAMILY®of instruments. The
analyzer communicates with the Model 275 HART
®
communicator or any other host, including AMS, that
supports the 275 HART communication protocol.
®
SMART FAMILY is a registered trademark of Rosemount Inc.
®
HART is a registered trademark of the HART Communication Foundation.
Page 8
MODEL 54eA SECTION 1.0
SPECIFICATIONS
2
1.2 SPECIFICATIONS - GENERAL
Enclosure: Epoxy-painted (light gray) cast aluminum,
NEMA4X (IP65). 144 x 144 x 132 mm
(5.7 x 5.7 x 5.2 in.), DIN size.
Front Panel: Membrane keypad with tactile feedback.
Three green LEDs indicate alarm status. Red
LED indicates fault condition.
Display: Three-line, back-lit, dot matrix LCD, 70 x 35 mm.
First line is oxygen, chlorine, or ozone reading.
Second line is temperature and current output.
Third line is user-selectable. pH reading appears
on third line. Character heights: 1st line - 16 mm
(0.6 in.), 2nd and 3rd lines - 7 mm (0.3 in.).
Hazardous Location Approvals:
Class I, Division 2, Groups A, B, C, & D.
T5 Ta=50°C. Dust ignition proof: Class II,
Division 1, Groups E, F, & G; Class III.
FM: Max. relay contact rating: 28 Vdc
resistive
150 mA - Groups A & B;
400 mA - Group C;
540 mA - Group D
CSA:
Max. relay contact rating:
28 Vdc; 110 Vac; 230 Vac;
6 amps resistive. Enclosure Type 4.
Power:
Code -01: 115 VAC ± 10%, 50/60 Hz ± 6%, 8 W
230 VAC ± 10%, 50/60 Hz ± 6%, 8 W
Code -02: 20 - 30 VDC, 6 W
RFI/EMI: EN-61326
LVD (Code -01 only): EN-61010-1
Repeatability (input): ± 1 nA
Stability (input): ± 1 nA/month at 25°C
Outputs: Two 4-20 mA or 0-20 mA isolated outputs.
Continuously adjustable. Outputs can be assigned
to oxygen, chlorine, ozone, pH, or temperature.
Output dampening is user-selectable. Maximum
load at 24 Vdc or 115/230 Vac is 500 ohms.
Maximum load at 100/200 Vac is 500 ohms.
Output 1 has superimposed HART signal (option
-09 only). Outputs can be programmed for PID
control (option -20 only).
Output Accuracy: ± 0.05 mA
Alarms:
Relay 1 - Process, Interval, or Time
Proportional Control (TPC requires code -20)
Relay 2 - Process, Interval, or Time Proportional
Control (TPC requires code -20)
Relay 3 - Process, Interval, or Time Proportional
Control (TPC requires code -20)
Relay 4 - Sensor/analyzer and process fault alarm
Each relay has a dedicated LED on the front panel.
Relay Contacts: Relays 1-3: Epoxy sealed form A
contacts, SPST, normally open
Relay 4: Epoxy sealed form C, SPDT
Resistive Inductive
28 Vdc 5.0 Amps 3.0 Amps
115 Vac 5.0 Amps 3.0 Amps
230 Vac 5.0 Amps 1.5 Amps
Temperature Sensors Accepted: Pt 100 RTD,
Pt 1000 RTD, 22K NTC thermistor.
Ambient Temperature: 0 to 50°C (32 to 122°F).
Analyzer can be operated between -20 and 60°C
(-4 to 140°F) with some degradation in display
quality.
Relative Humidity: 95% (maximum) non-condensing
Weight/Shipping Weight: 5 lb/6 lb (2 kg/2.5 kg)
Page 9

MODEL 54eA SECTION 1.0
SPECIFICATIONS
SPECIFICATIONS — OXYGEN
Measurement Range: 0-99 ppm (mg/L), 0-200% sat-
uration
Resolution: 0.01 ppm, 0.1 ppb for 499A TrDO sen-
sor
Temperature correction for membrane permeabili-
ty: automatic between 0 and 50°C (can be dis-
abled)
Calibration: automatic air calibration or calibration
against a standard instrument
Pressure sensor range: 113 to 862 mmHg (151 to
1149 mbar)
RECOMMENDED SENSORS —
OXYGEN:
Model 499A DO-54 for ppm level
Model 499A TrDO-54 for ppb level
Hx438 and Gx448 steam-sterilizable oxygen sensors
SPECIFICATIONS — FREE CHLORINE
Measurement Range: 0-20 ppm (mg/L) as Cl
2
Resolution: 0.001 ppm
Temperature correction for membrane permeabili-
ty: automatic between 0 and 50°C (can be dis-
abled)
pH Correction: Automatic between pH 6.0 and 9.5.
Manual pH correction is also available.
Calibration: against grab sample analyzed using
portable test kit.
RECOMMENDED SENSOR — FREE
CHLORINE:
Model 499A CL-01-54
SPECIFICATIONS — pH
Application: pH measurement available with free
chlorine only.
Measurement Range: 0-14 pH
Resolution: 0.01 pH
Sensor Diagnostics: Glass impedance (for broken or
aging electrode) and reference offset. Reference
impedance (for fouled reference junction) is not
available.
Repeatability: ±0.01 pH at 25°C
Stability: ±0.01 pH/month, non-cumulative at 25°C
RECOMMENDED pH SENSORS:
Model 399-09-62, 399-14, and 399VP-09
See pH sensor product data sheet for complete ordering
information.
SPECIFICATIONS — TOTAL CHLORINE
Measurement Range: 0-20 ppm (mg/L) as Cl
2
Resolution: 0.001 ppm
Temperature correction for membrane permeabili-
ty: automatic between 5 and 35°C (can be dis-
abled)
Calibration: against grab sample analyzed using
portable test kit.
RECOMMENDED SENSOR — TOTAL
CHLORINE:
Model 499A CL-02-54 (must be used with SCS 921)
SPECIFICATIONS — OZONE
Measurement Range: 0-10 ppm (mg/L)
Resolution: 0.001 ppm
Temperature correction for membrane permeabili-
ty: automatic between 5 and 35°C (can be dis-
abled)
Calibration: against grab sample analyzed using
portable test kit.
RECOMMENDED SENSOR — OZONE:
Model 499A OZ-54
3
Page 10
MODEL 54eA SECTION 1.0
SPECIFICATIONS
4
1.3 ORDERING INFORMATION
The Model 54eA Microprocessor Analyzer measures dissolved oxygen, free chlorine, total chlorine, ozone,
and pH. pH is available for free chlorine only. The analyzer has an on-board pressure sensor for automatic air
calibration of oxygen sensors. Amperometric measurements are fully compensated for changes in membrane
permeability with temperature. Free chlorine is corrected for pH. Standard features include a three-line back-lit
display, dual isolated outputs, and three programmable alarm relays. HART communications and PID and TPC
control are optional.
CODE OPTIONS
01 115/230 VAC, 50/60 Hz Power
02 24 VDC
MODEL
54eA MICROPROCESSOR ANALYZER
CODE OPTIONS
09 HART Communications Protocol
20 Controller Outputs - PID and TPC
ACCESSORIES
PART NO. DESCRIPTION
2002577 Wall and two inch pipe mounting kit
23545-00 Panel mounting kit
23554-00 Cable glands, kit (Qty 5 of PG 13.5)
9240048-00 Stainless steel tag (specify marking)
54eA
-01 -20 EXAMPLE
Page 11
5
MODEL 54eA SECTION 2.0
INSTALLATION
SECTION 2.0
INSTALLATION
2.1 UNPACKING AND INSPECTION
Inspect the shipping container. If it is damaged, contact the shipper immediately for instructions. Save the box. If
there is no apparent damage, unpack the container. Be sure all items shown on the packing list are present. If
items are missing, notify Rosemount Analytical immediately.
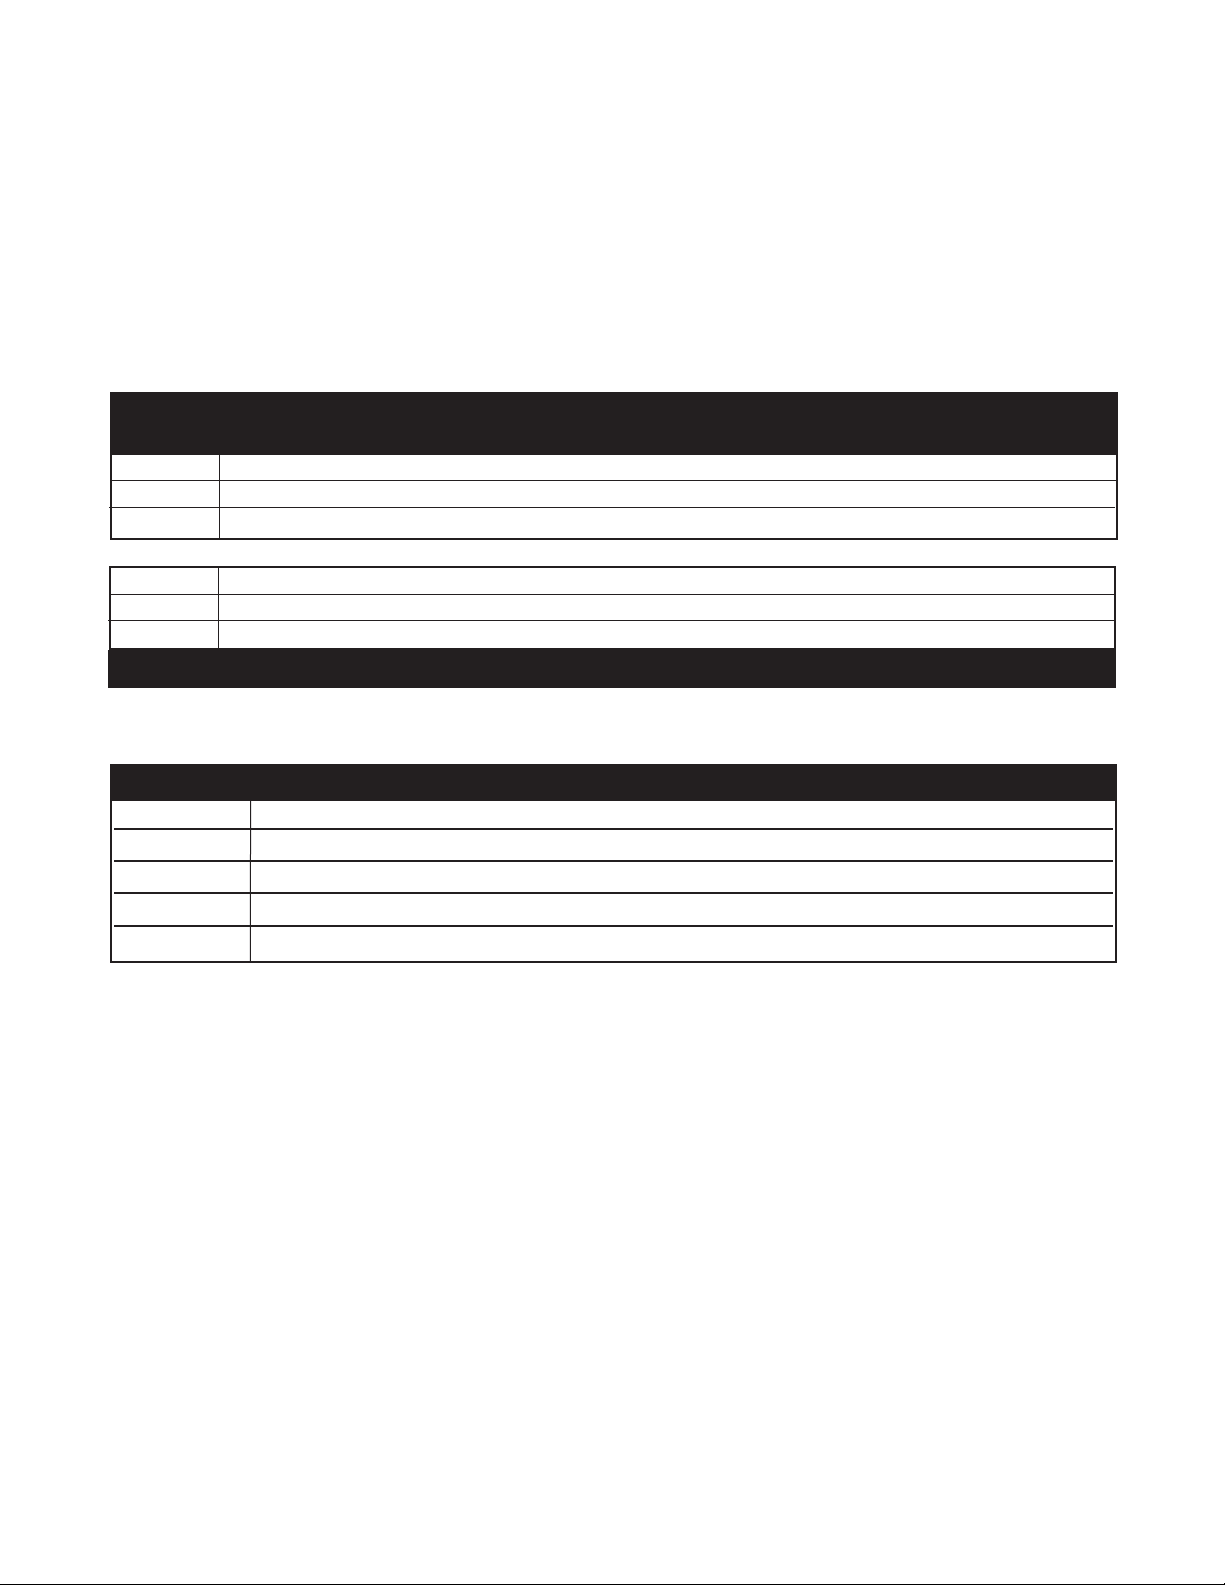
2.2 INSTALLATION
2.2.1 General information
1. Although the controller is suitable for outdoor use, do not install it in direct sunlight or in areas of extreme
temperatures.
2. Install the controller in an area where vibrations and electromagnetic and radio frequency interference are
minimized or absent.
3. Keep the controller and sensor wiring at least one foot from high voltage conductors. Be sure there is easy
access to the controller.
4. The controller is suitable for panel, pipe, or wall mounting. Refer to the table below.
2.2.2 Wall or surface mounting
FIGURE 2-1. Wall Mounting
Type of mounting Section
Wall 2.2.2
Pipe 2.2.3
Panel 2.2.4
Page 12
6
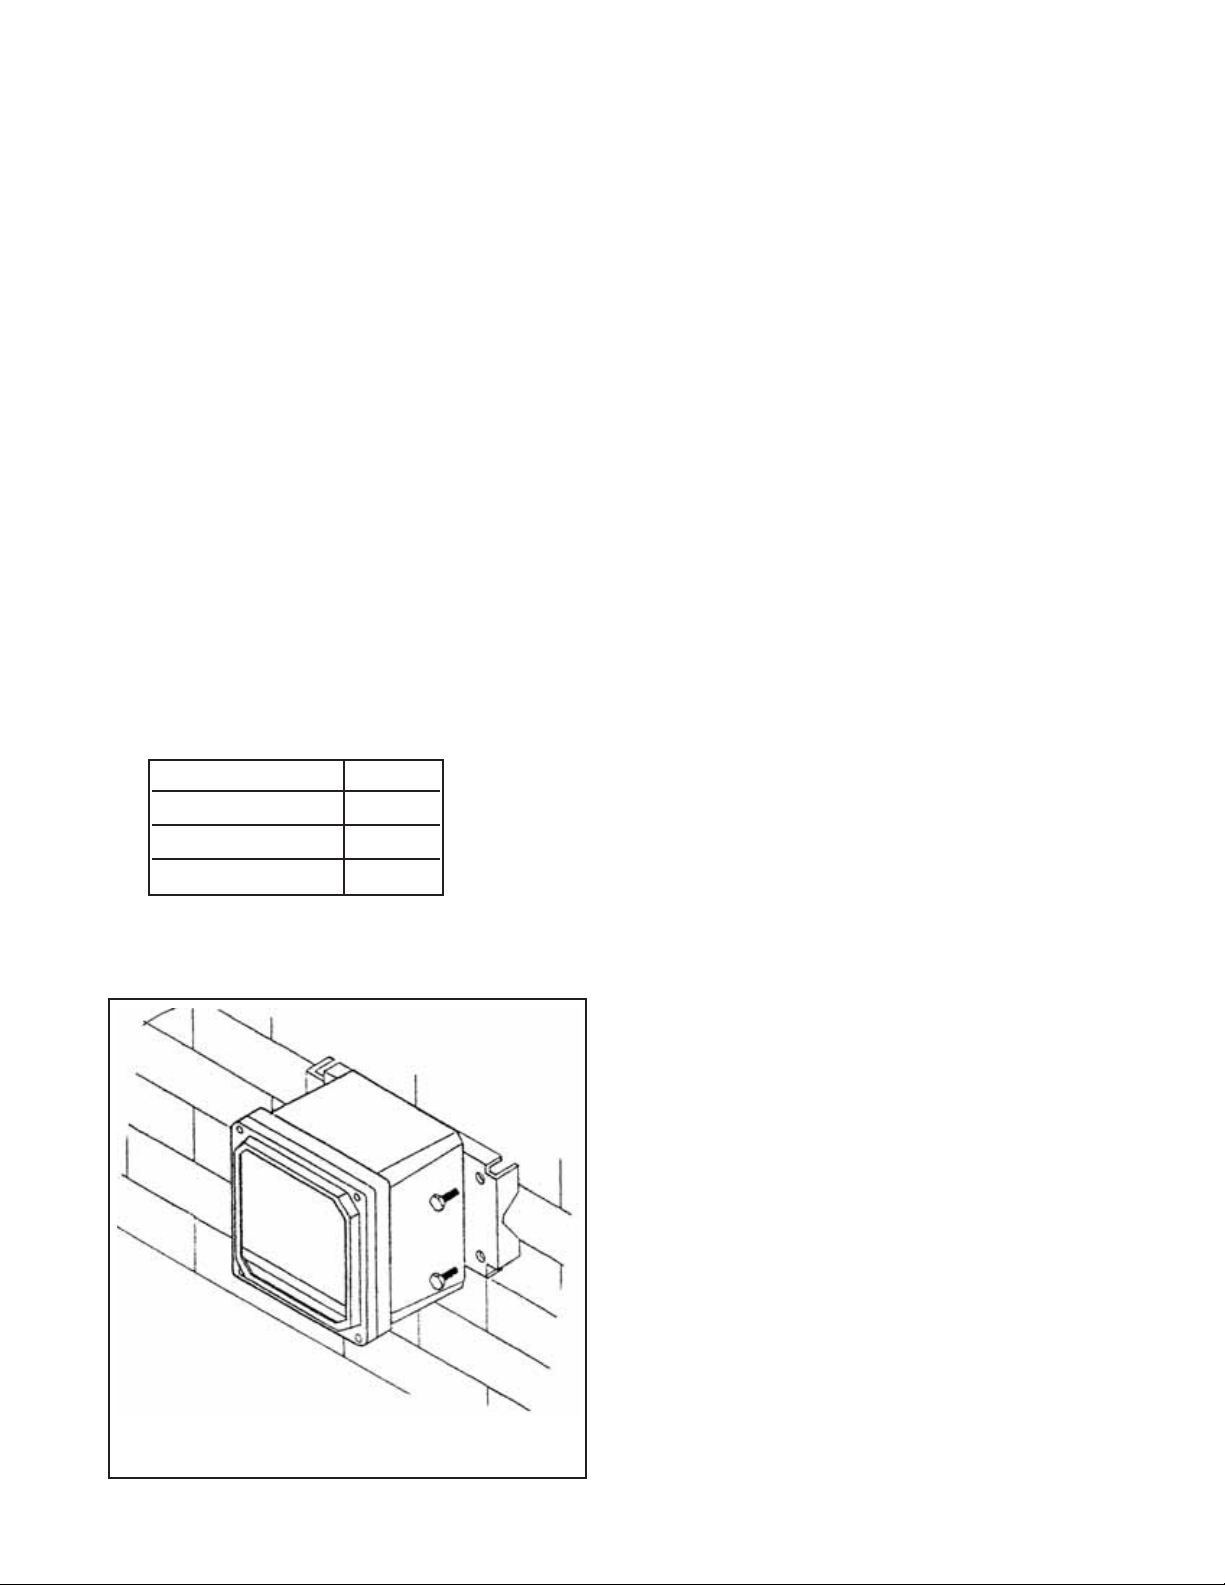
FIGURE 2-2. Pipe Mounting
MODEL 54eA SECTION 2.0
INSTALLATION
2.2.3 Pipe mounting
9.52
.375
SIDE VIEW
FRONT VIEW
4 MOUNTING
HOLES
WHEN INCH AND METRIC DIMS
ARE GIVEN
MILLIMETER
INCH
PIPE MOUNTING PN 2002577 WALL MOUNTING
FIGURE 2-3. Pipe and Wall Mounting Dimensions
DWG. NO. REV.
40005402 E
Page 13
MODEL 54eA SECTION 2.0
INSTALLATION
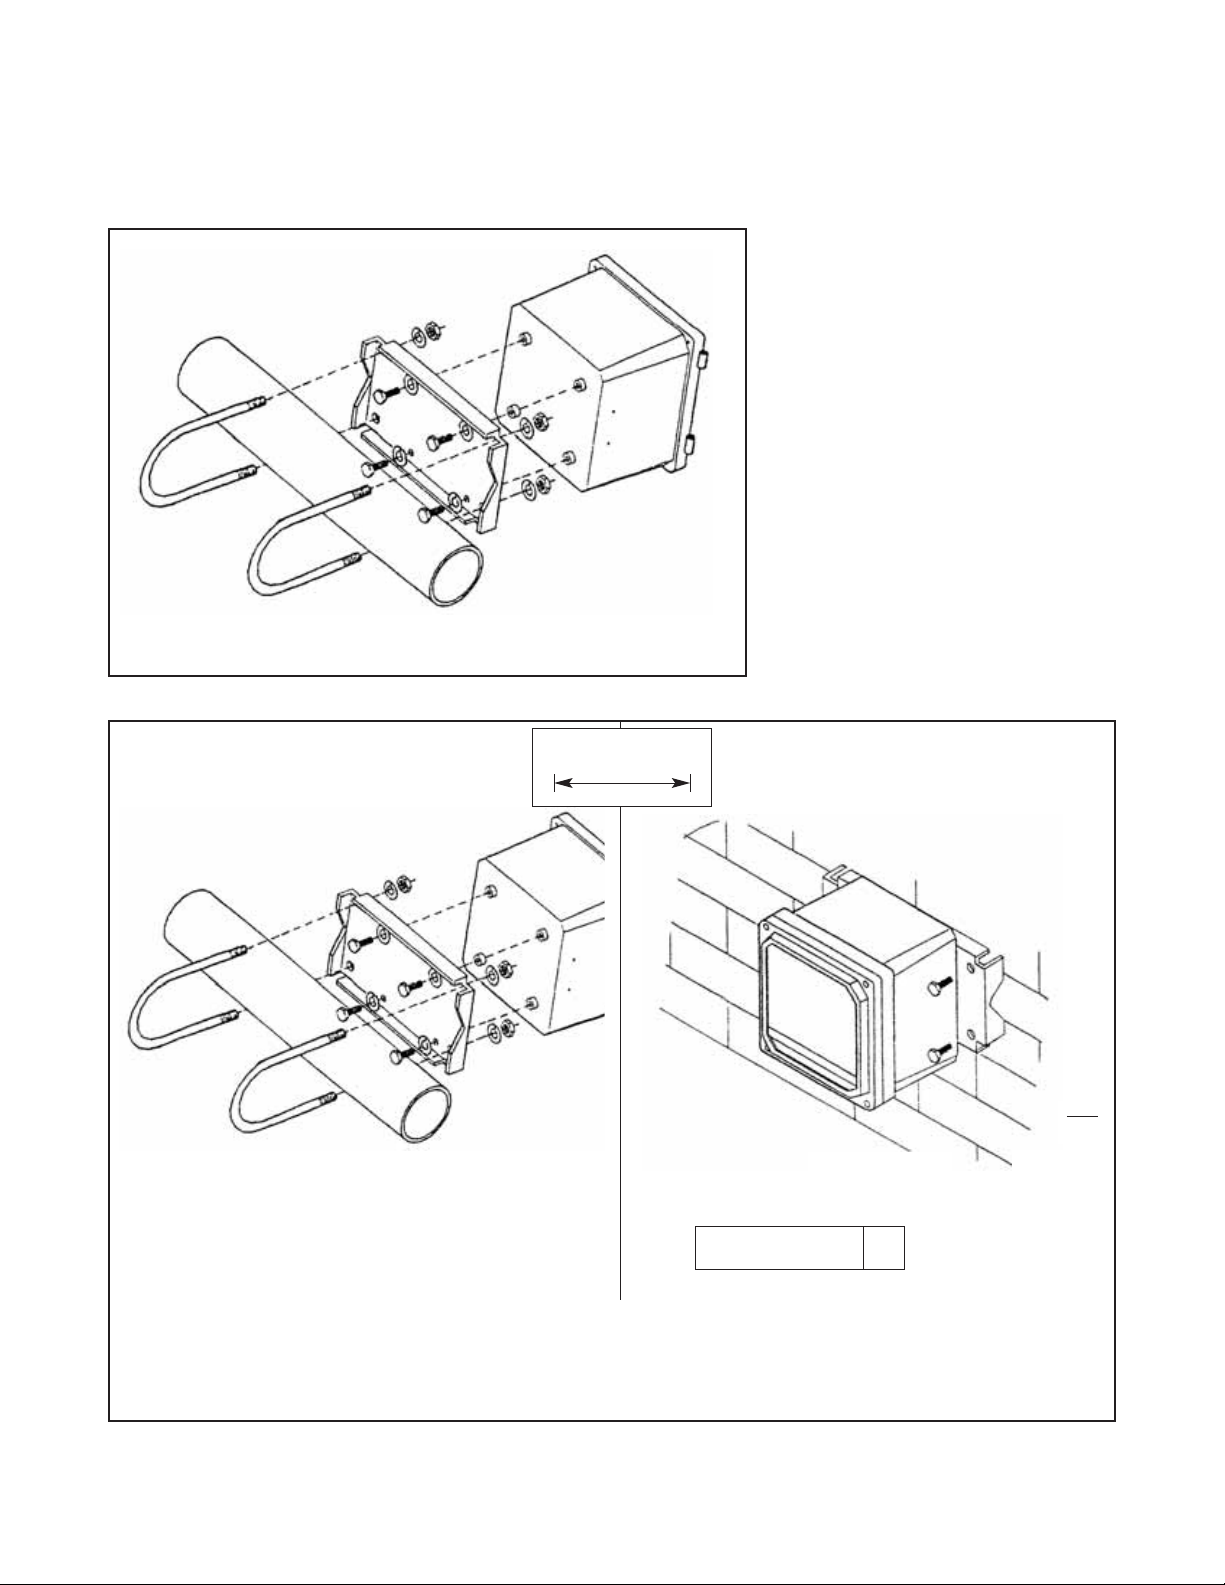
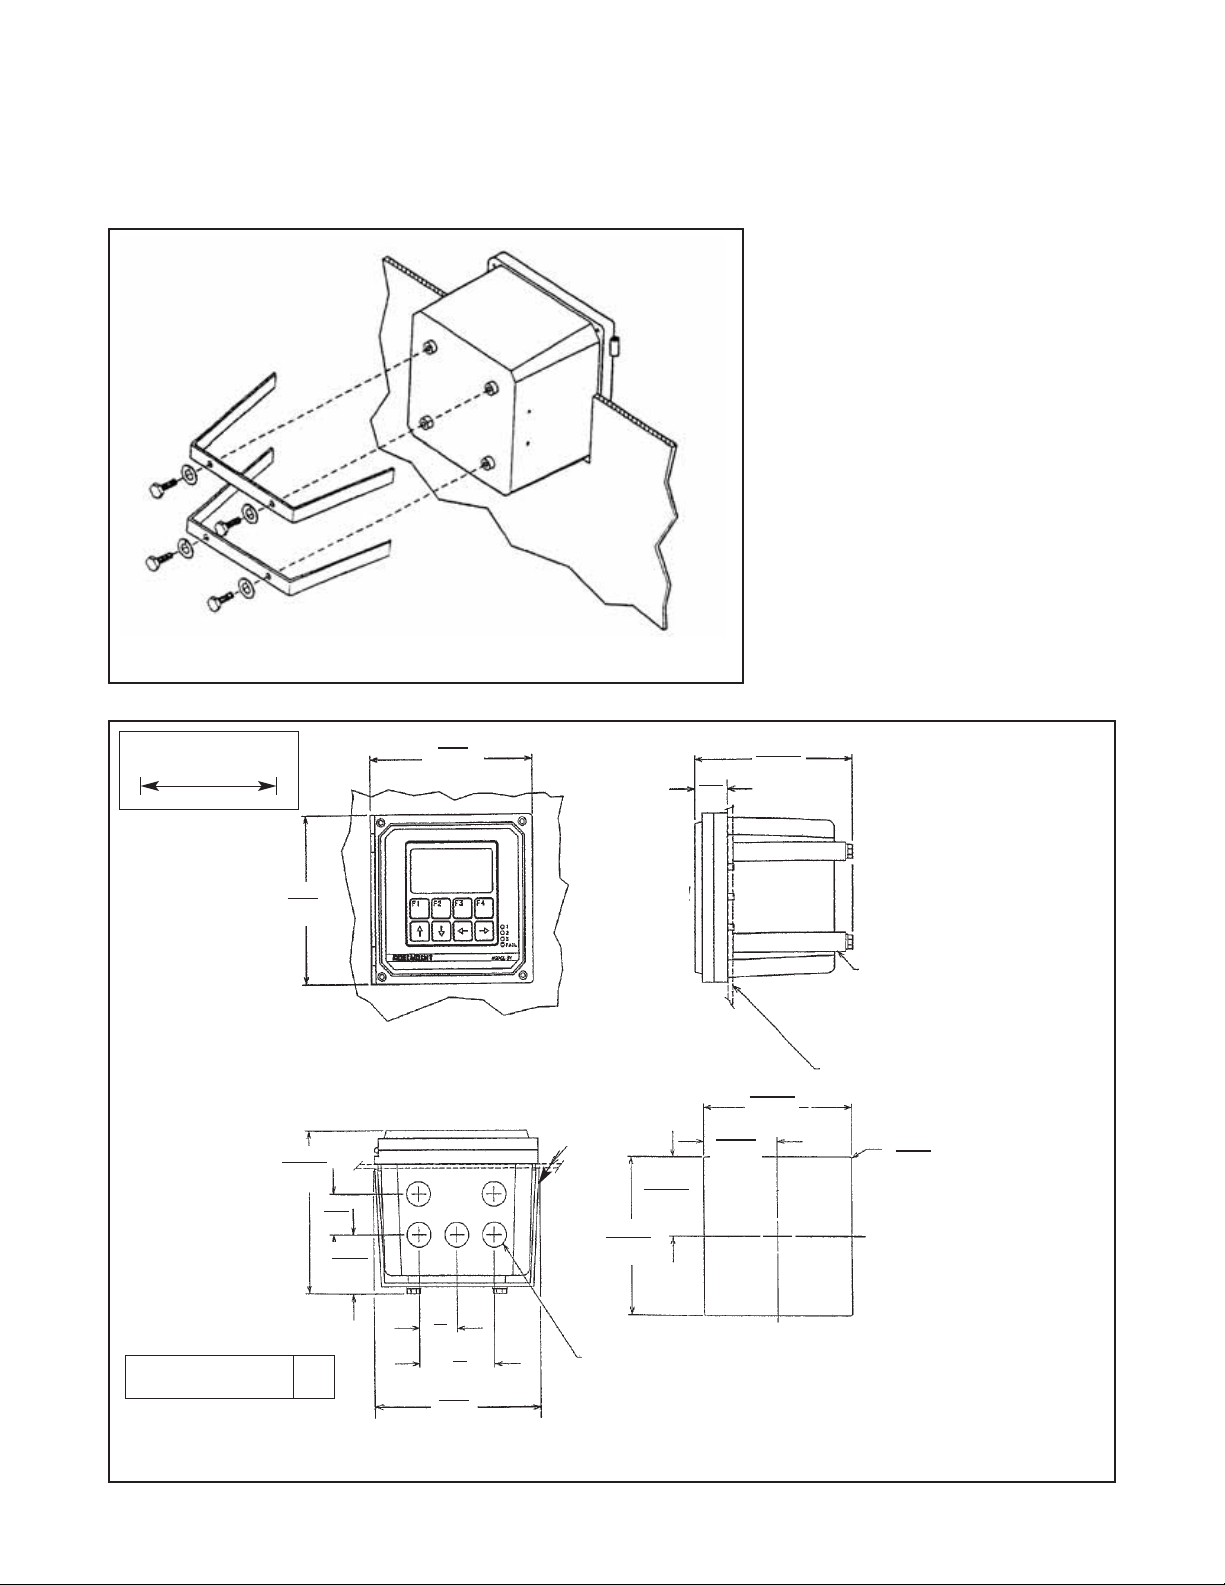
FIGURE 2-4. Panel Mounting
2.2.4 Panel mounting
WHEN INCH AND METRIC DIMS
ARE GIVEN
MILLIMETER
INCH
FIGURE 2-5. Panel Mounting Dimensions
144
5.7
35
1.38
50.8
2
1.52
.06
33
1.3
66
2.6
28.72
1.17
139.7
5.5
139.7
5.5
155.7
6.13
137.9
5.43
68.96
2.715
137.9
5.43
144
5.7
FRONT VIEW
BOTTOM VIEW
SIDE VIEW
PANEL SUPPLIED BY OTHERS
RADIUS MAX
4 PLACES
PANEL FLUSH
TO BEZEL
PANEL MOUNTING BRACKET WITH BOLTS, WASHERS
AND
SCREWS. 2 PLACES
.843 DIA
ELECTRICAL CONDUIT ENTRANCE 5 PLACES
(FOR PG 13.5 CABLE GLANDS OR 1/2 INCH CONDUIT
FITTINGS
68.96
2.715
PANEL CUT-OUT INFORMATION
7
DWG. NO. REV.
40005401 D
Page 14
8
MODEL 54eA SECTION 3.0
WIRING
SECTION 3.0
WIRING
3.1 GENERAL
WARNING
Electrical installation must conform to the National Electrical Code, all state and local codes, and all plant
codes and standards for electrical equipment. Electrical installation and wiring must be done by qualified
personnel.
The five holes in the bottom of the instrument case accept 1/2-in. strain relief connectors or conduit fittings. The
rear openings are for power and alarm relay wiring. The left front opening is for sensor wiring and the right front
opening is for analog output wiring. Seal unused openings with conduit plugs.
3.2 POWER, ALARM, AND OUTPUT WIRING
Refer to Figure 3-1. Make power and alarm connections on TB3. Make analog output wiring connections on TB2. For
access to power and alarm terminals, loosen the screw holding the protective cover in place and remove the cover.
DANGER
Live voltages may be present.
Will cause severe injury or death.
Alarm contacts are dry (i.e., not powered) and are normally open. Refer to Section 1.0 for relay specifications.
For best EMI/RFI protection, shield the output cable and enclose it in an earth-grounded, rigid, metal conduit.
Connect the outer shield of the output cable to the earth ground connection on TB2 (see Figure 3-1).
Keep sensor and output signal wiring separate from power wiring. Do no run sensor and power cables in the same
conduit or close together in a cable tray.
AC wiring must be 14 gauge or greater. Be sure to connect earth ground from the power cable to the nearby
ground lug. A good earth ground is necessary for proper operation of the controller. Provide a switch or breaker to
disconnect the analyzer from the main power supply. Install the switch or breaker near the analyzer and label it as
the disconnecting device.
WARNING: RISK OF ELECTRICAL SHOCK
AC connections and grounding must comply with UL 508 or local electrical code. DO NOT apply
power to the analyzer until all electrical connections are verified and secure.
NOTE
The Model 54eA analyzer leaves the factory configured for use with the Model 499ADO sensor
(ppm dissolved oxygen). If a 499ADO sensor is NOT being used, turn to Section 5.5 and configure the transmitter for the desired measurement (ppb oxygen, oxygen measured using a
steam-sterilizable sensor, free chlorine, total chlorine, monochloramine, or ozone) before wiring
the sensor to the analyzer. Operating the analyzer and sensor for longer than five minutes while
the analyzer is improperly configured will greatly increase the stabilization time for the sensor.
Be sure to turn off power to the analyzer before wiring the sensor.
Page 15
9
MODEL 54eA SECTION 3.0
WIRING
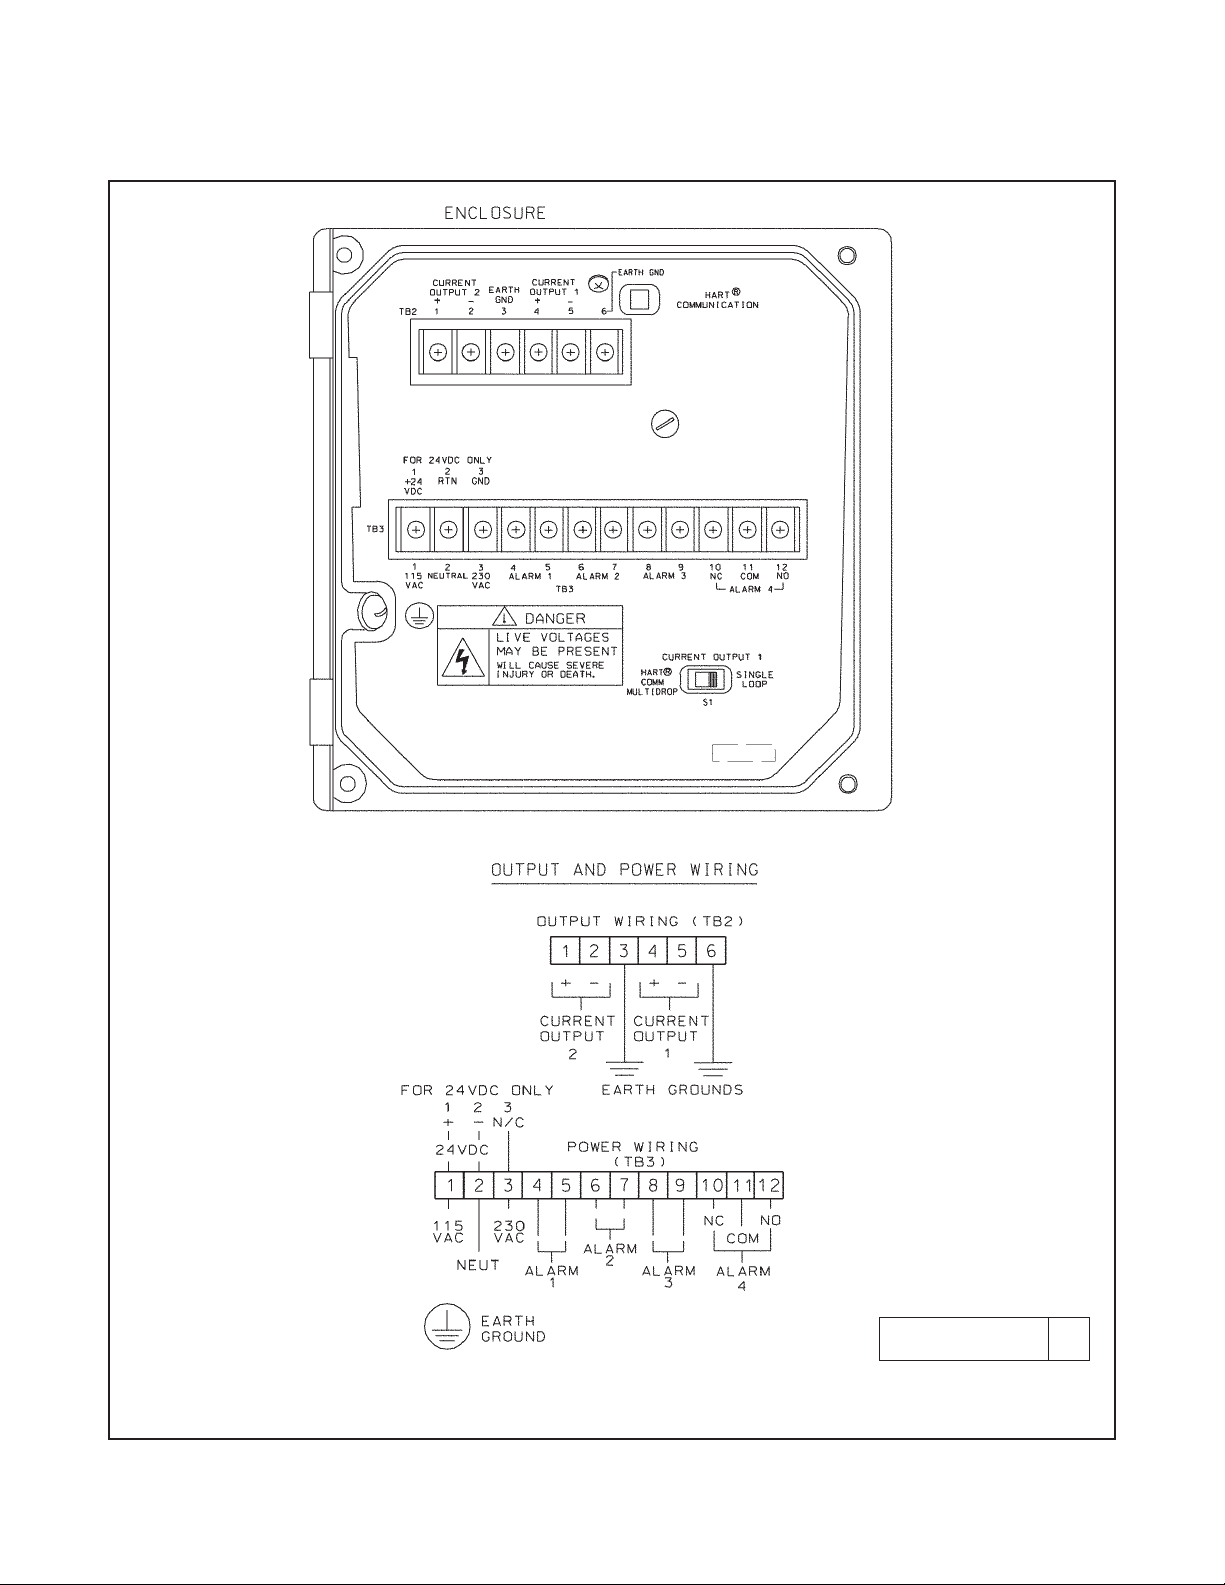
FIGURE 3-1. Power Input and Relay Output Wiring for Model 54eA
DWG. NO. REV.
454EPH02 D
Page 16
10
MODEL 54eA SECTION 3.0
WIRING
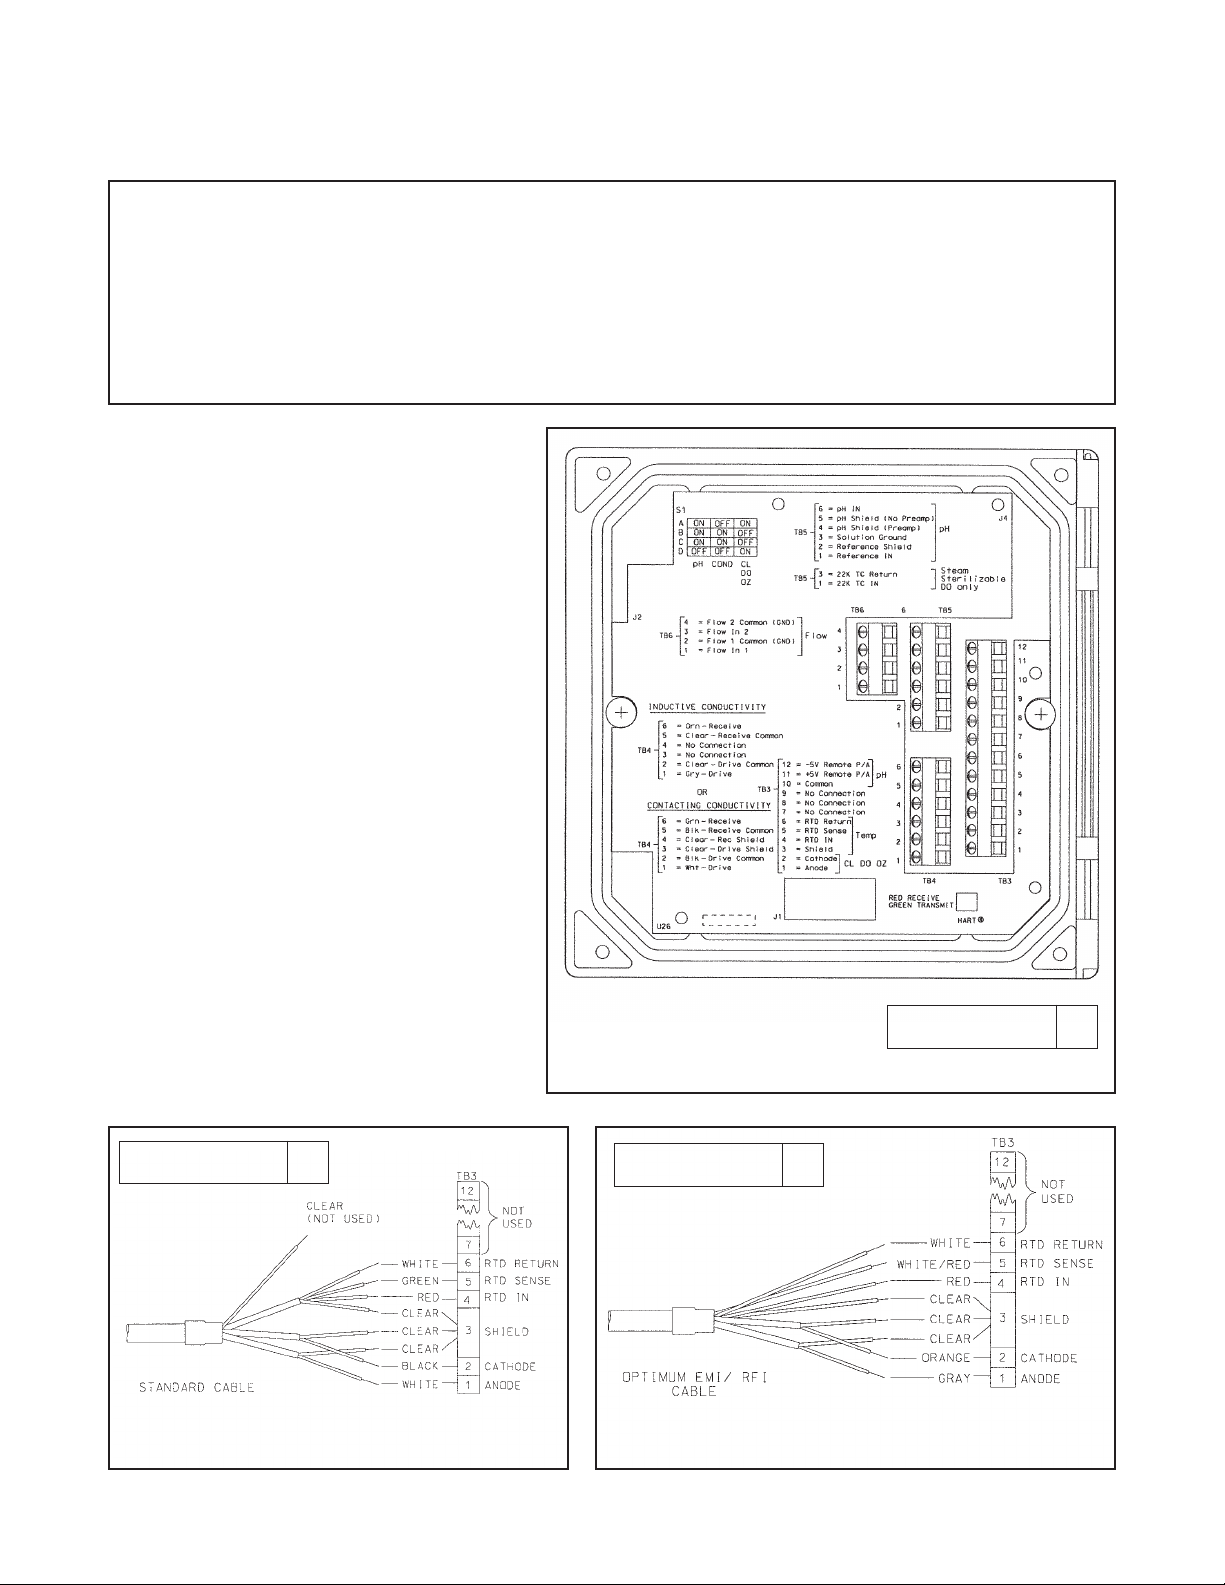
FIGURE 3-3. Amperometric sensors
with standard cable.
FIGURE 3-4. Amperometric sensors
with optimum EMI/RFI cable or Variopol cable.
FIGURE 3-2. Wiring Label
3.3 SENSOR WIRING
3.3.1 General
The wiring label, which is shown in Figure 3-2,
is a general purpose label. It has wiring information concerning other sensors, for example,
contacting and inductive conductivity sensors,
that can be used with the 54e instrument platform. For amperometric measurements, only
TB3 and TB5 are used. Wire the amperometric
sensor to TB3. Wire the pH sensor, if one is
being used, to TB5.
3.3.2 Wiring Model 499A oxygen, chlorine,
and ozone sensors
All 499A amperometric sensors (499ATrDO,
499ADO, 499ACL-01, 499ACL-02, 499ACL-03,
and 499AOZ) have identical wiring.
Use the pigtail wire and wire nuts provided with
the amperometric sensor when more than one
wire must be attached to a single terminal.
See Figures 3-3 and 3-4.
DWG. NO. REV.
40054e03 A
DWG. NO. REV.
40499A23 A
DWG. NO. REV.
40499A24 A
NOTE
The Model 54eA analyzer leaves the factory configured for use with the Model 499ADO sensor
(ppm dissolved oxygen). If a 499ADO sensor is not being used, turn to Section 5.5 and configure the analyzer for the desired measurement (ppb oxygen, oxygen measured using a steamsterilizable sensor, free chlorine, total chlorine, monochloramine, or ozone) before wiring the
sensor to the analyzer. Operating the analyzer and sensor for longer than five minutes while the
analyzer is improperly configured will greatly increase the stabilization time for the sensor.
Be sure to turn off power to the analyzer before wiring the sensor.
Page 17
11
MODEL 54eA SECTION 3.0
WIRING
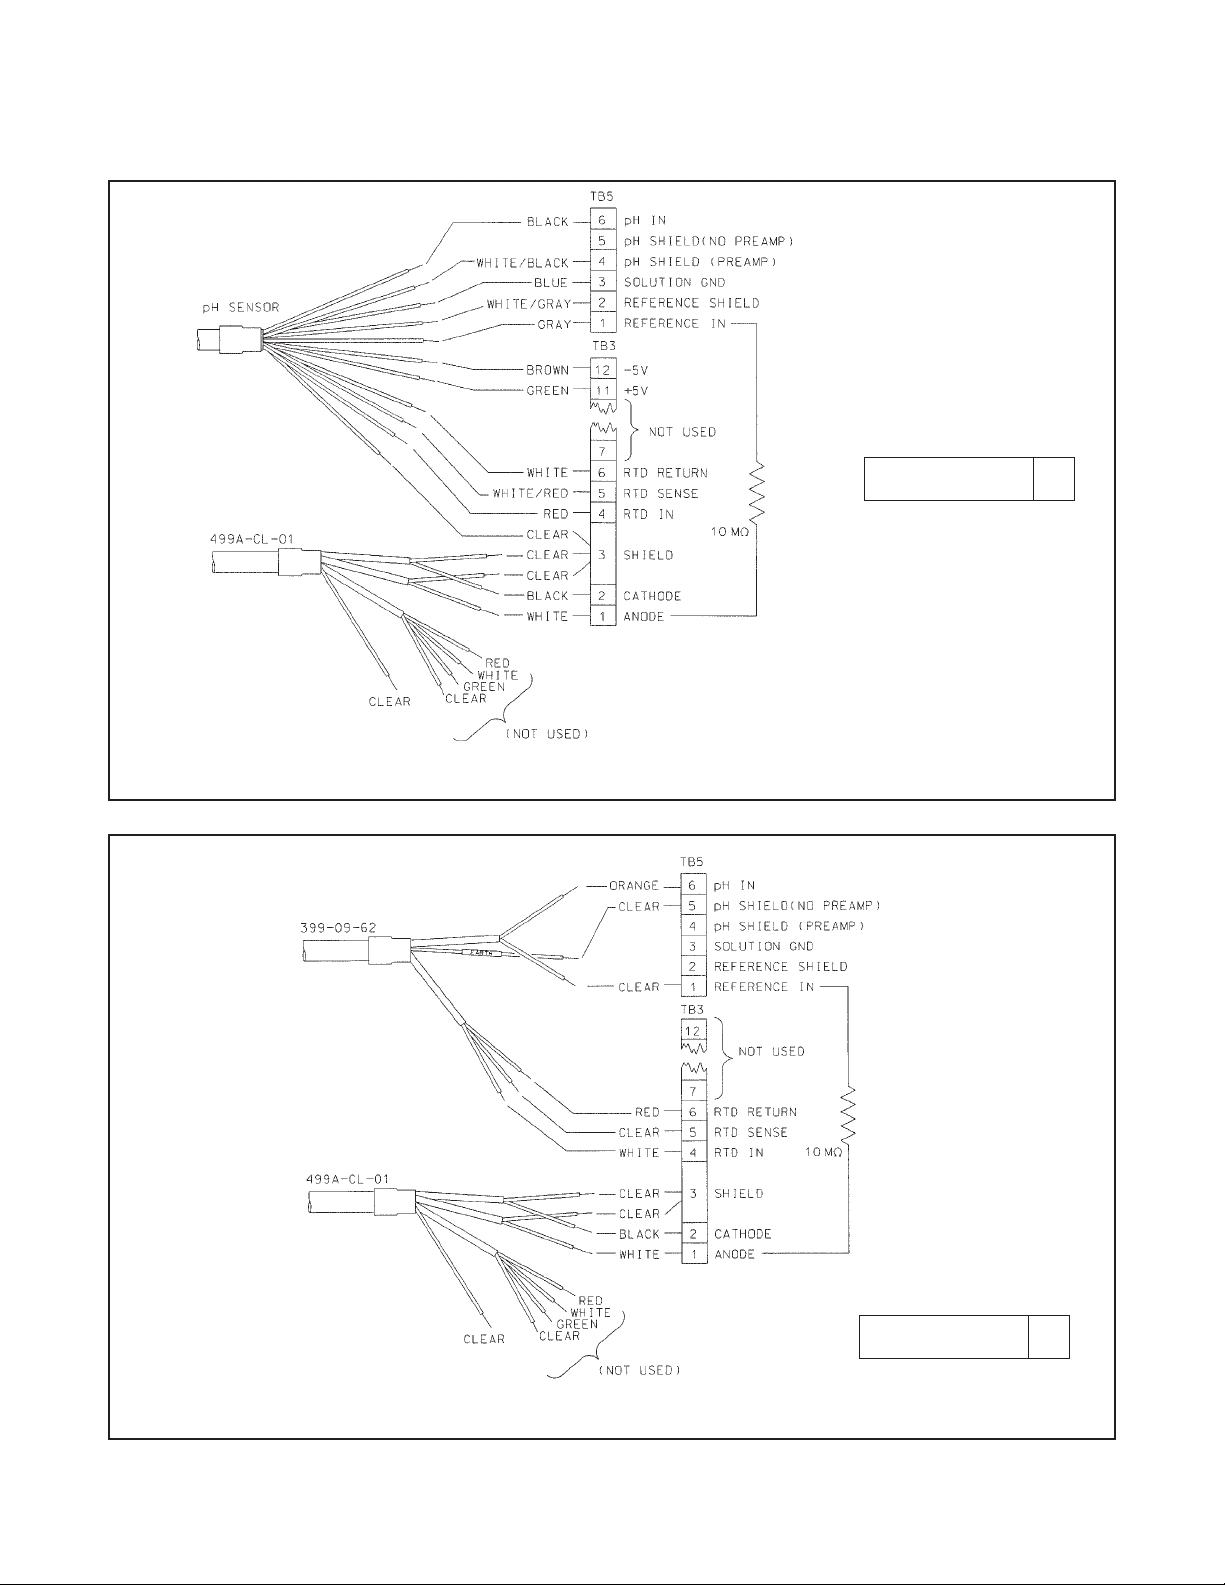
3.3.3 Wiring 499ACL-01 (free chlorine) sensors and pH sensors for automatic pH correction.
If free chlorine is being measured using the 499ACL-01 sensor and the pH of the liquid varies more than 0.2 pH
unit, a continuous correction for pH must be applied to the chlorine reading. Therefore, a pH sensor must also be
wired to the 54eA controller. This section gives wiring diagrams for the pH sensors typically used.
When using the 499ACL-01 sensor (free chlorine) with a pH sensor, use the RTD in the pH sensor for measuring temperature. DO NOT use the RTD in the free chlorine sensor.
The pH sensor RTD is needed for temperature measurement during buffer calibration. During normal operation,
the RTD in the pH sensor also provides the temperature measurement required for the free chlorine membrane
permeability correction.
NOTE
When wiring a pH and a 400ACL-01 amperometric sensor to the controller, connect the anode
and reference terminals (TB3-1 and TB5-1) with the 10MΩ jumper (PN 23980-00) provided with
the analyzer.
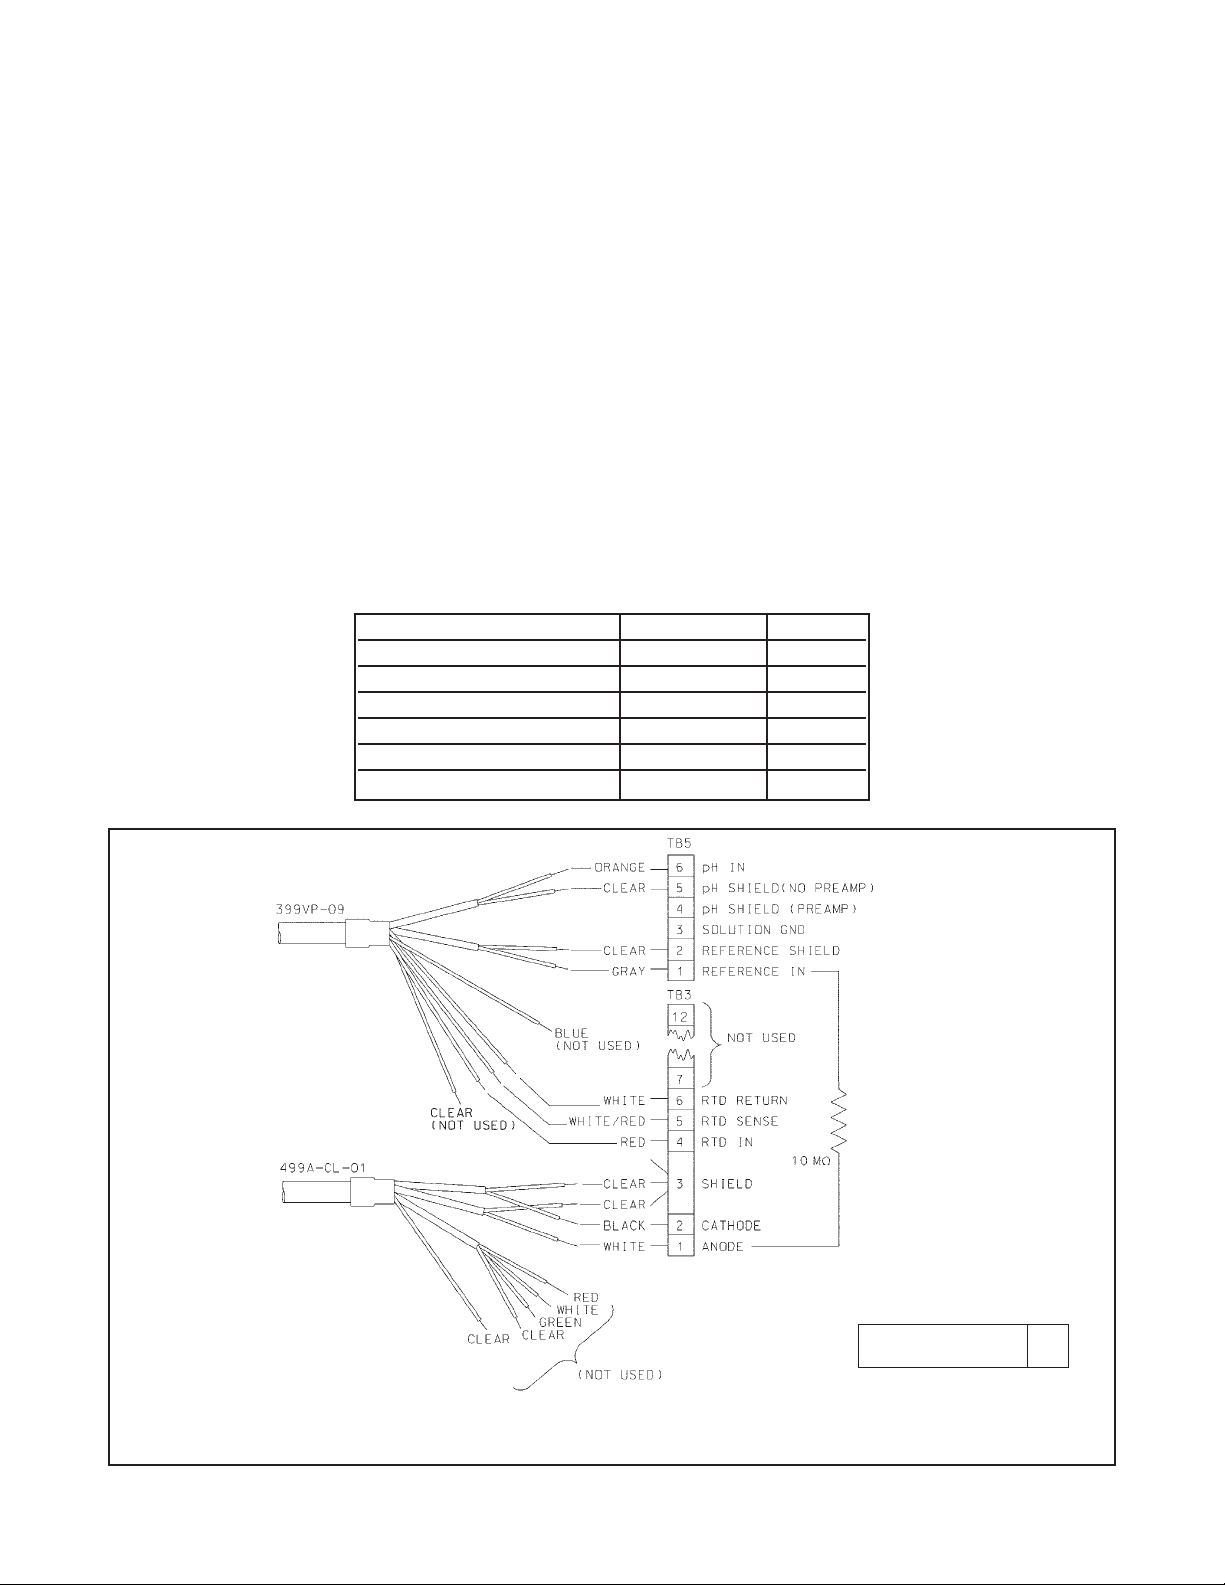
Refer to the table to select the appropriate wiring diagram. Most of the wiring diagrams require that two or more
shield wires be attached to a single terminal. Use the pigtail wire and wire nuts packed with the chlorine sensor to
make the connection.
Free chlorine sensor cable pH sensor Figure
Standard 399VP-09 3-5
Standard 399-14 3-6
Standard 399-09-62 3-7
EMI/RFI or Variopol 399VP-09 3-8
EMI/RFI or Variopol 399-14 3-9
EMI/RFI or Variopol 399-09-62 3-10
FIGURE 3-5. 499ACL-01 sensor with standard cable
and 399VP-09 pH sensor without internal preamplifier.
DWG. NO. REV.
4054eA01 B
Page 18
12
MODEL 54eA SECTION 3.0
WIRING
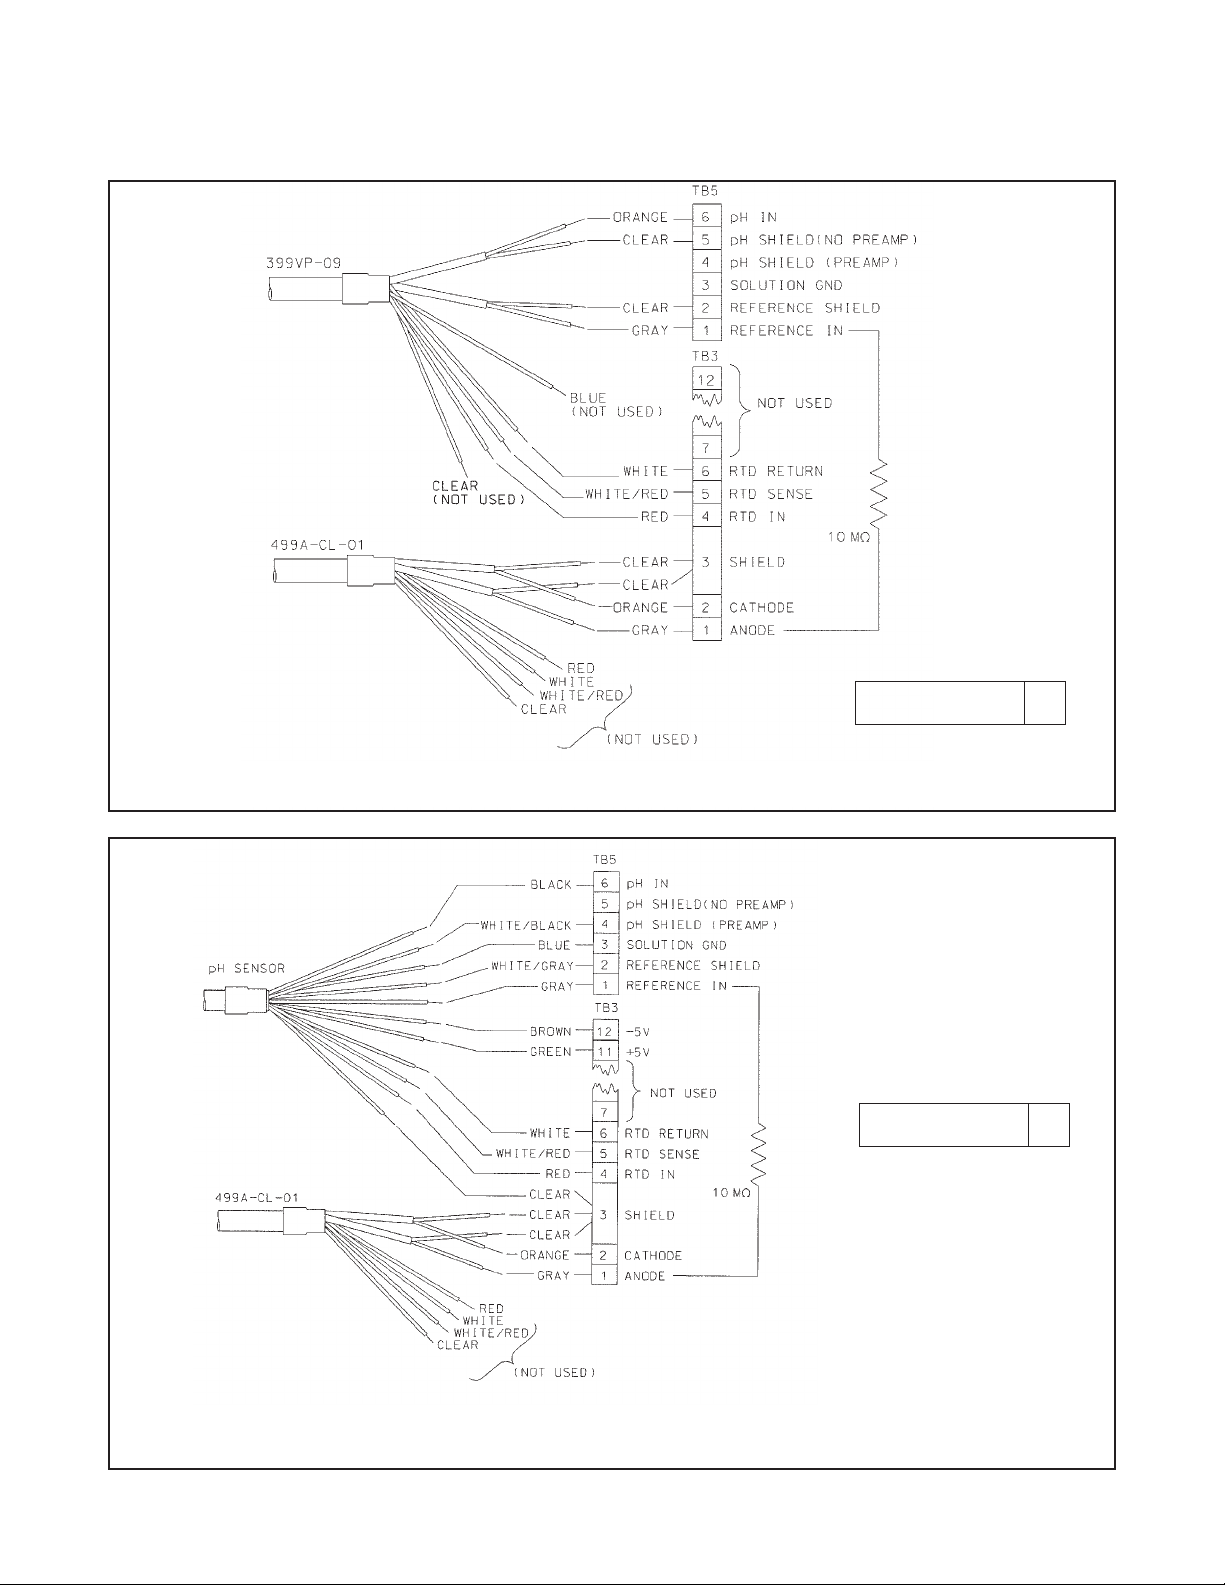
FIGURE 3-6. 499ACL-01 sensor with standard cable and 399-14 pH sensor having internal preamplifier.
FIGURE 3-7. 499ACL-01 sensor with standard cable and 399-09-62 pH without internal preamplifier.
Although the blue wire is connected to a terminal labeled solution
ground, the blue wire does not
connect to a solution ground in the
sensor. The 399-14 sensor has no
solution ground. The blue wire,
instead, ties the preamplifier in the
sensor to instrument common.
DWG. NO. REV.
4054eA05 A
DWG. NO. REV.
4054eA03 A
Page 19
MODEL 54eA SECTION 3.0
WIRING
FIGURE 3-9. 499ACL-01 sensor with optimum EMI/RFI cable or
Variopol cable and 399-14 pH sensor having internal preamplifier.
FIGURE 3-8. 499ACL-01 sensor with optimum EMI/RFI cable or Variopol cable
and 399VP-09 pH sensor without internal preamplifier.
13
Although the blue wire is connected to a terminal labeled solution
ground, the blue wire does not
connect to a solution ground in the
sensor. The 399-14 sensor has no
solution ground. The blue wire,
instead, ties the preamplifier in the
sensor to instrument common.
DWG. NO. REV.
4054eA02 B
DWG. NO. REV.
4054eA06 A
Page 20
14
MODEL 54eA SECTION 3.0
WIRING
FIGURE 3-10. 499CL-01 sensor with optimum EMI/RFI cable or
Variopol cable and 399-09-62 pH sensor without internal preamplifier.
DWG. NO. REV.
4054eA04 A
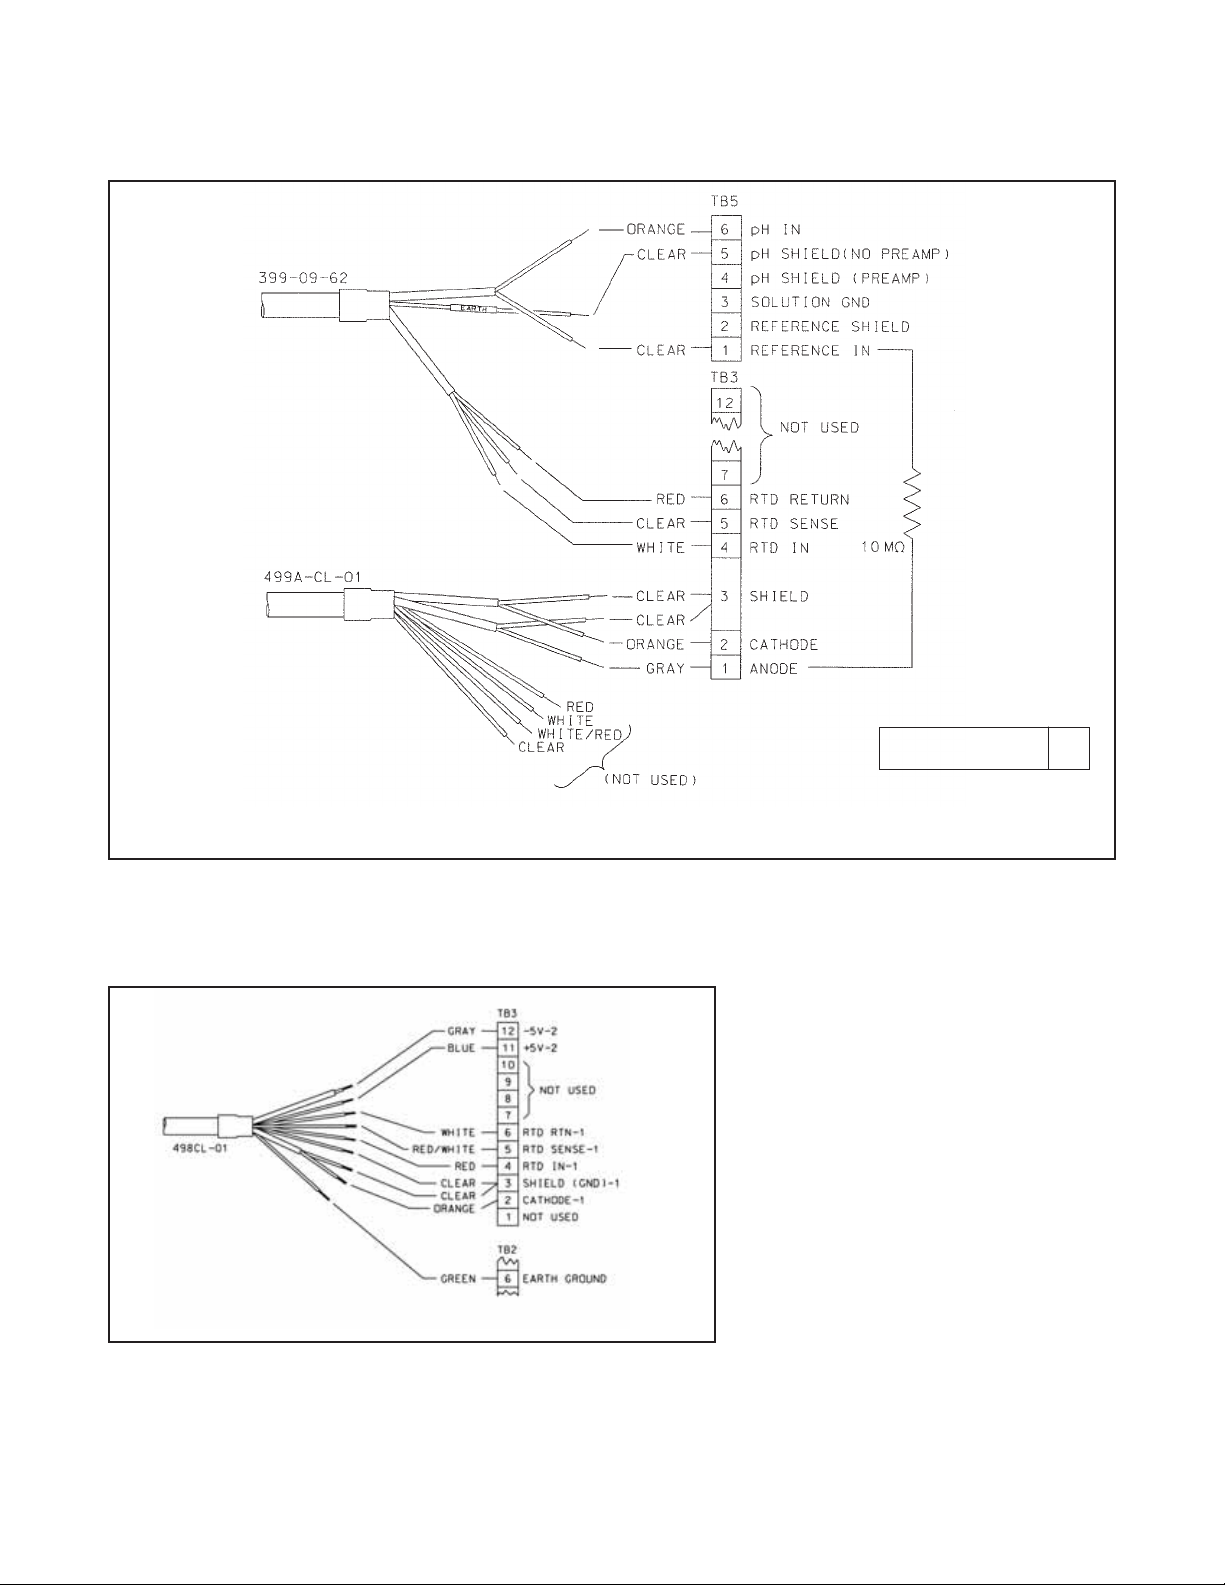
3.3.4 Wiring 438ACL-01 (pH independent free chlorine) sensors
FIGURE 3-11. 498CL-01 (pH-independent free chlorine) sensor
Page 21
Insulate and tape back unused wires.
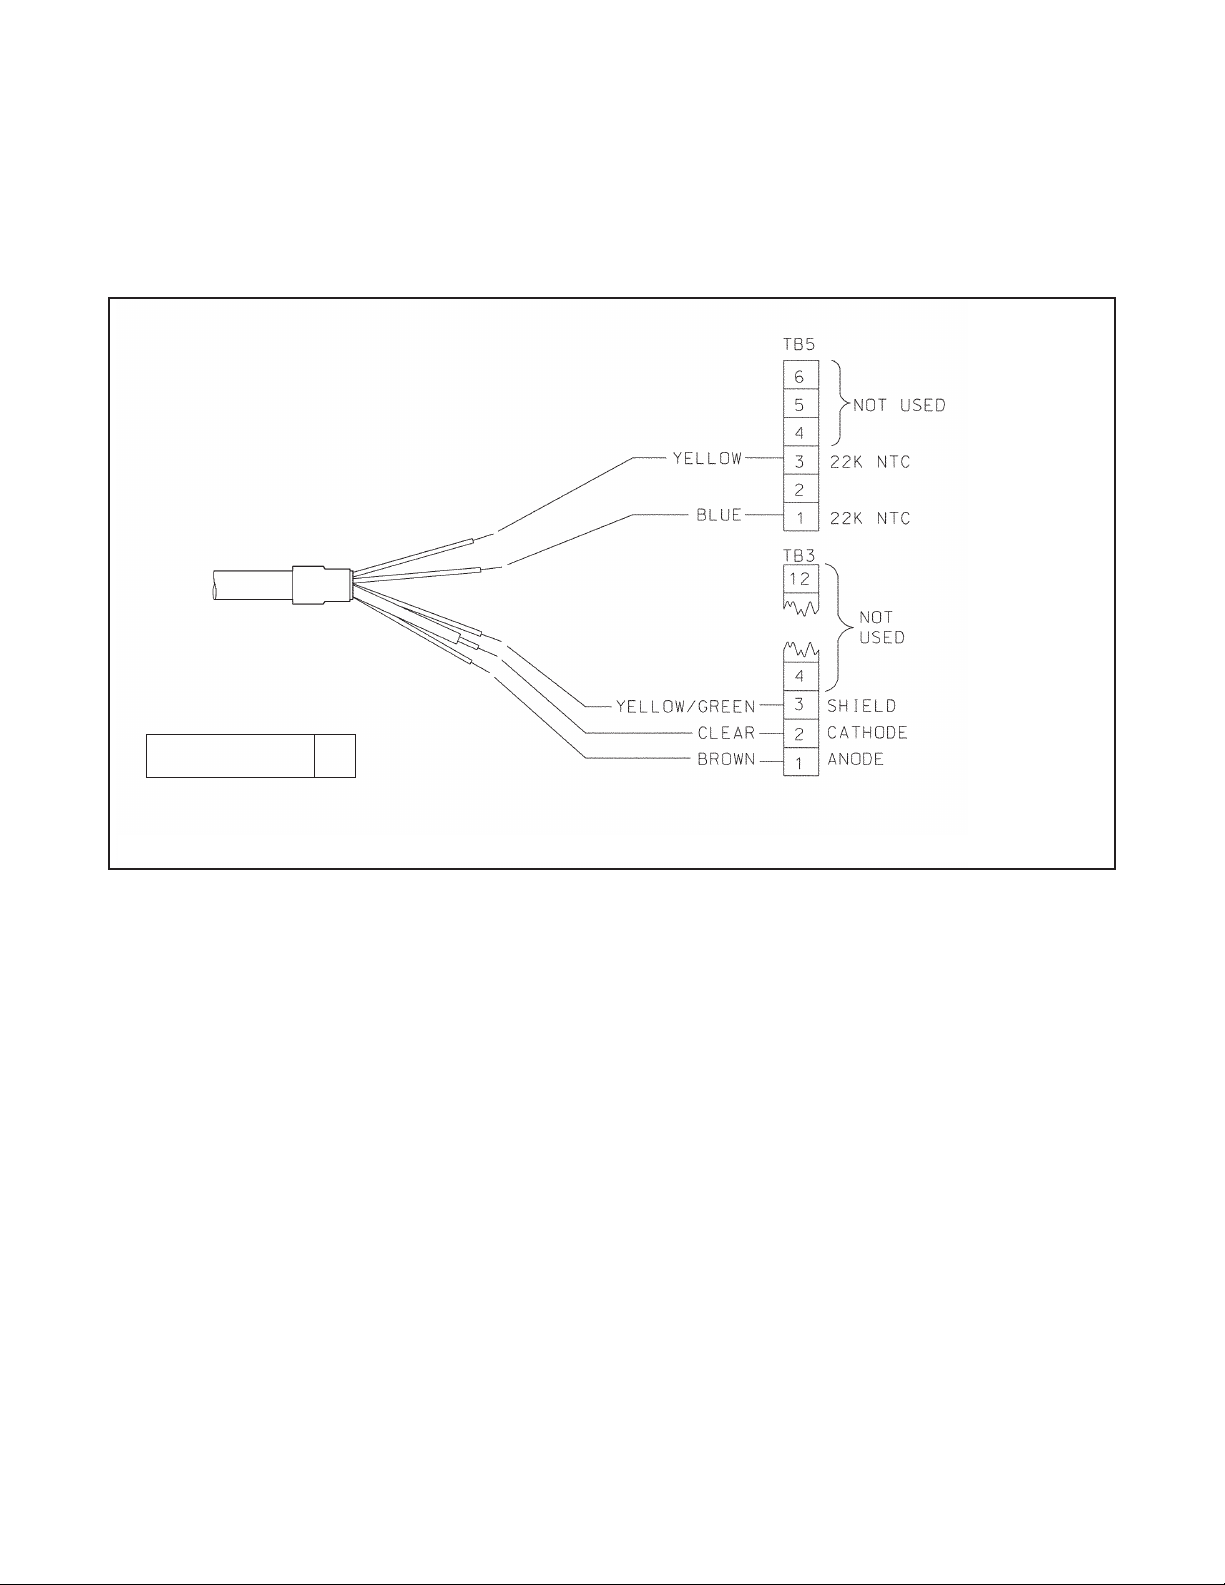
3.3.5 Wiring Hx438 and Gx448 sensors
Hx438 and Gx448 steam-sterilizable dissolved oxygen sensors use a 22k NTC thermistor. The thermistor is wired
to terminals 1 and 3 on TB5.
FIGURE 3-12. Hx438 and Gx448 sensors.
MODEL 54eA SECTION 3.0
WIRING
15
DWG. NO. REV.
4054eA07 A
Page 22
16
MODEL 54eA SECTION 4.0
DISPLAY AND OPERATION
SECTION 4.0
DISPLAY AND OPERATION
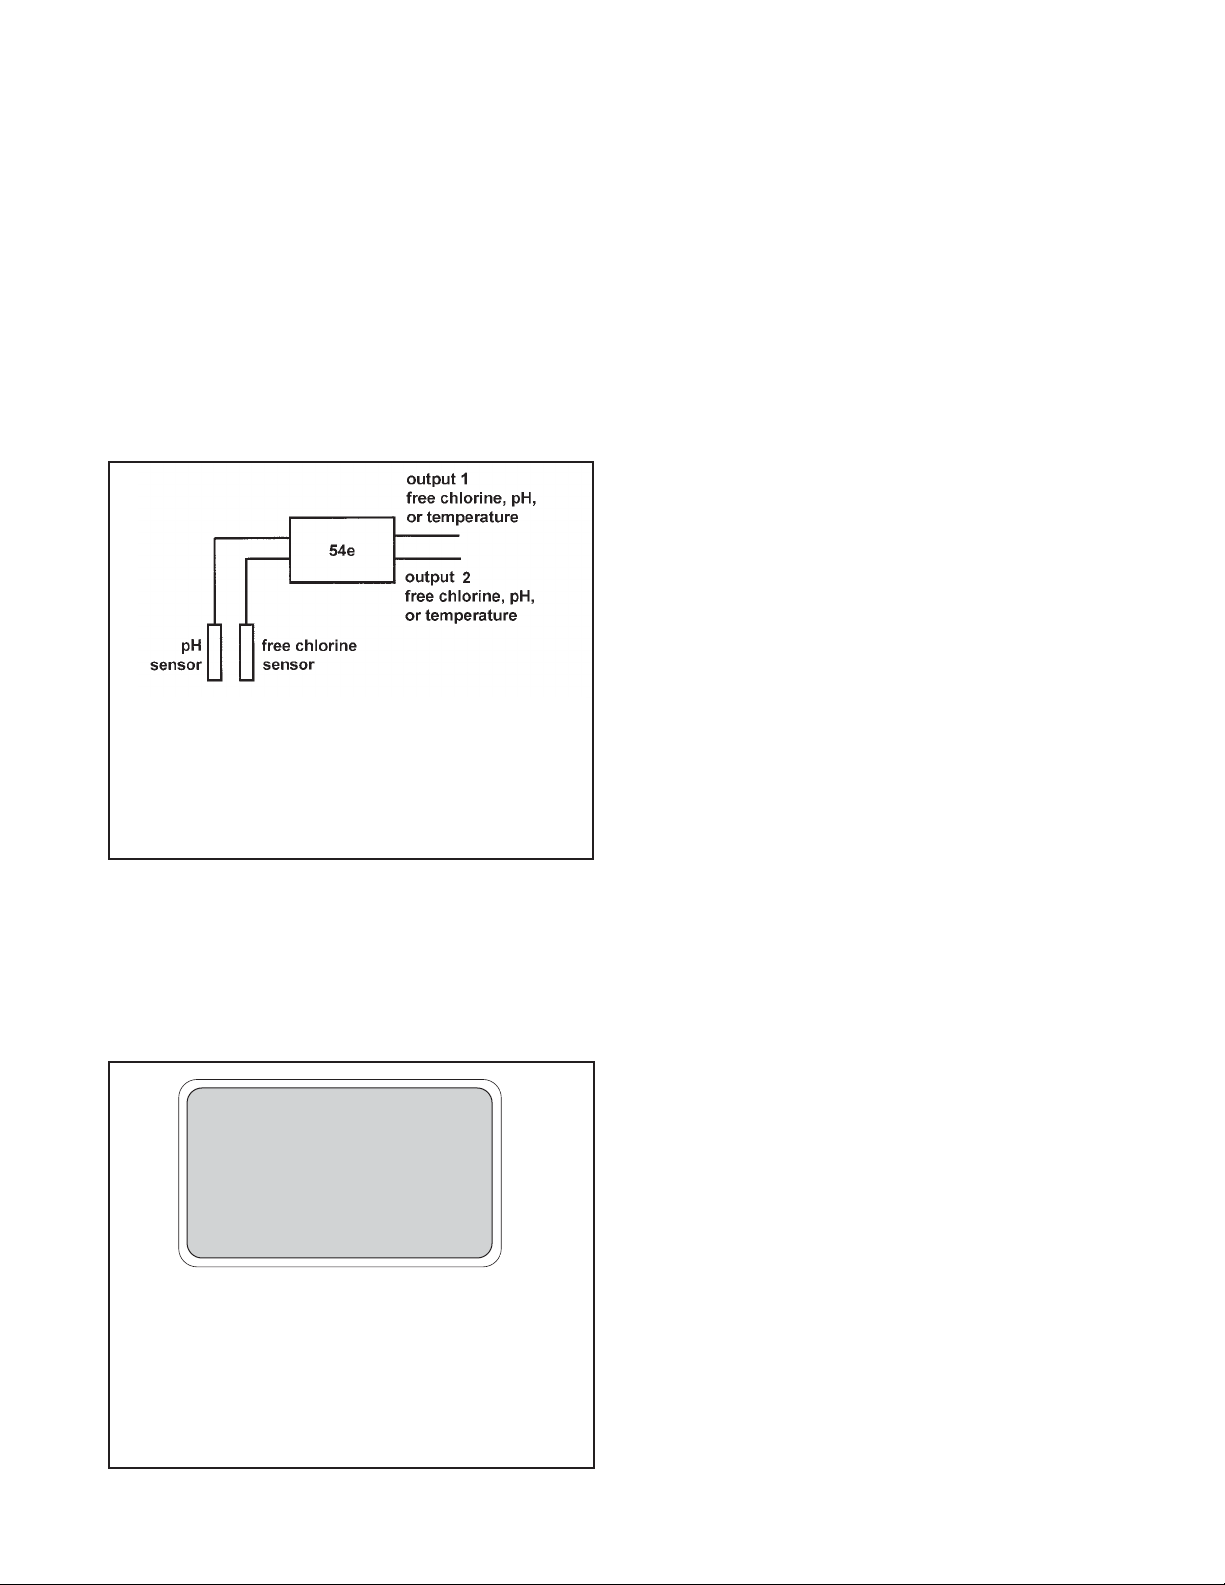
4.1 GENERAL DESCRIPTION
The 54eA analyzer/controller is a normally a single
input, dual output instrument. It does, however, accept
a second input for pH when the main measurement is
free chlorine. Figure 4-1 shows how the instrument
inputs and outputs can be configured for free chlorine.
In addition to PID control, the 54eA controller can be
used for time proportional control (TPC). TPC control
uses the alarm relays.
4.2 DISPLAY
Figure 4-2 shows the main display.
4.3 KEY FUNCTIONS AND CONTROLS
The keys labeled F1, F2, F3, and F4 are multi-function.
The function appears in the main display just above the
key. For example, F1 is usually labeled Exit and F4
may be labeled Edit, Save, or Enter.
1. To enter the main menu, press any key.
2. Use the é and ê keys to move the cursor to the
desired sub-menu. The position of the cursor is
shown in reverse video.
NOTE
When the last item of a menu has been
reached, the cursor will be on the third line
of the display. If the cursor is on the second
line of the display more items remain.
Continue pressing the ê key.
3. Press Enter (F4) to access a sub-menu or an item
in a sub-menu.
4. To change a number or a setting press Edit (F4).
The display will change to show the cursor on the
first digit or on a + or - sign. Use the é and ê keys
to increase or decrease a digit or to toggle the +
and - signs. Use the ç and è keys to move the
cursor left and right.
5. If an entire number or a word is highlighted, use the
é and ê keys to scroll through the list of choices.
6. To store a number or setting in memory, press
Save (F4).
7. To leave without storing changes, press Esc (F3).
8. To leave and return to the previous screen, press
Exit (F1).
9. To end a calibration step and leave the previous
calibration in place, press Abort (F1).
10. Occasionally, information screens will appear. To
leave the information screen and move to the next
screen press Cont (F3).
4.4 ALARM STATUS
Green LEDs (labeled 1, 2, and 3) indicate when alarm
relays 1, 2, and 3 are energized. The fourth relay indicates a fault condition. When a fault occurs, the red
LED (labeled FAIL) lights up, a descriptive error message appears, and the outputs and alarm relays act as
described in Section 5.6 and Section 5.7 under fault
value.
The red LED also indicates when the interval timer routine is activated and when the time limit has been
reached on a feed limit timer. For more information on
these subjects, see Section 5.7.
FIGURE 4-1. Configuration of Inputs and Outputs
for Free Chlorine
The main sensor is always the chlorine sensor and the secondary sensor is always the pH sensor. Outputs can be
assigned to free chlorine, to pH, or to temperature. The
outputs can be configured as either linear (4-20 mA) or PID
outputs.
FIGURE 4-2. Main Display Screen
The amperometric measurement (oxygen, ozone, free
chlorine, or total chlorine) is always displayed continuously
in large numerals. The temperature and output current are
always displayed on the second line of the main display.
The third line can be configured by the user. In the example, the third line shows the pH reading and the amperometric sensor current in nA.
1.00 ppm
26.2°C. 12.00 mA
pH: 8.00 I: 340 nA
Page 23

17
MODEL 54eA SECTION 5.0
SOFTWARE CONFIGURATION
SECTION 5.0
SOFTWARE CONFIGURATION
The instrument is configured at the factory to measure oxygen.
Figure 5-1 is an outline of the menu structure.
Table 5-1 lists the default settings and the range of choices available for each setting. To reduce the chance of
error when configuring the controller the first time, enter settings in the order shown in the table.
TABLE 5-1. Program Settings List
Continued on the following page
ITEM CHOICES FACTORY SETTINGS
SETPOINTS
A. Alarms (Section 5.1)
1. Alarm 1 (low action)
a. if oxygen (ppm) -99 to 99 ppm 0 ppm
b. if oxygen (ppb) -999 to 999 ppb 0 ppb
c. if oxygen (% saturation) 0 to 200% 0 %
d. if chlorine, monochloramine, or ozone -9999 to 9999 ppm 0 ppm
e. if pH -2.00 to 20.00 0.00
f. if temperature -5 to 130°C 0.1°C
2. Alarm 2 (high action)
a. if oxygen (ppm) -99 to 99 ppm 20 ppm
b. if oxygen (ppb) -999 to 999 ppb 900 ppb
c. if oxygen (% saturation) 0 to 200% 200 %
d. if chlorine, monochloramine, or ozone -9999 to 9999 ppm 20 ppm
e. if pH -2.00 to 20.00 14.00
f. if temperature -5 to 130°C 130°C
3. Alarm 3 See alarm 2 See alarm 2
B. Outputs (Section 5.2 and 5.3)
1. Output 1 or 2: 4 mA setting
a. if oxygen (ppm) -99 to 99 ppm 0 ppm
b. if oxygen (ppb) -999 to 999 ppb 0 ppb
c. if oxygen (% saturation) 0 to 200% 0 %
d. if chlorine, monochloramine, or ozone -9999 to 9999 ppm 0 ppm
e. if pH -2.00 to 20.00 0.0
f. if temperature -5 to 130°C 0.1°C
2. Output 1 or 2: 20 mA setting
a. if oxygen (ppm) -99 to 99 ppm 20 ppm
b. if oxygen (ppb) -999 to 999 ppb 900 ppb
c. if oxygen (% saturation) 0 to 200% 200%
d. if chlorine, monochloramine, or ozone -9999 to 9999 ppm 20 ppm
e. if pH -2.00 to 20.00 14.00
f. if temperature -5 to 130°C 130°C
3. Setpoint (PID)
a. if oxygen (ppm) -99 to 99 ppm 1.00 ppm
b. if oxygen (ppb) -999 to 999 ppb 100 ppb
c. if oxygen (% saturation) 0 to 200% 100%
d. if chlorine, monochloramine, or ozone -9999 to 9999 ppm 1.00 ppm
e. if pH -2.00 to 20.00 7.00
f. if temperature -5 to 130°C 25°C
Page 24

18
MODEL 54eA SECTION 5.0
SOFTWARE CONFIGURATION
Continued on the following page
ITEM CHOICES FACTORY SETTINGS
CONFIGURE
A. Display options (Section 5.5)
1. Measurement Oxygen, ozone, free chlorine, total chlorine, monochloramine Oxygen
2. Sensor (Oxygen only) Rosemount standard, Rosemount biopharm, or Rosemount standard
other steam sterilizable
3. Units (Oxygen only) ppm, ppb, % saturation ppm
4. Temperature units °C or °F °C
5. Output 1 mA or % of full scale mA
6. Output 2 mA or % of full scale mA
7. Language English, Français, Español, Deutsch, Italiano English
8. Main display left See section 5.5 Sensor current
9. Main display right See section 5.5 Output 1 current
10 Display contrast 00-99 (darkest) 50
11. Test timeout On or off On
12. Timeout value 1 to 60 min 10 min
B Outputs (Section 5.6)
1. Output 1 Control
a. Measurement Oxygen, chlorine, ozone, pH, or temperature Oxygen
b. Control Normal or PID Normal
2. Output 1 Setup (normal)
a. Current 4-20 mA or 0-20 mA* 4-20 mA
b. Dampening 0-299 sec 0 sec
c. Hold mode Hold last value or go to fixed value Hold last value
d. Fixed hold value 0-22 mA 21 mA
e. Fault value 0-22 mA 22 mA
3. Output 1 Setup (PID)
a. Proportional 0 to 299.9% 100 %
b. Integral 0 to 2999 sec 0 sec
c. Derivative 0 to 299.9% 0/0%
4. Output 2 Control
a. Measurement Oxygen, chlorine, ozone, pH, or temperature Temperature
b. Control Normal or PID Normal
5. Output 2 Setup (normal) See output 1 See output 1
6. Output 2 Setup (PID) See output 1 See output 1
7. Hold feature Enable, disable, or 20 min timeout Disable
C. Alarms (Section 5.7)
1. Alarm 1 Control
a. Activation method Oxygen, chlorine, ozone, temperature, pH Oxygen
b. Control mode Normal or TPC Normal
2. Alarm 1 setup (normal)
a. Configuration Low, high, or off High
b. Hysteresis
if oxygen (ppm) 0 to 20 ppm 0 ppm
if oxygen (ppb) 0 to 999 ppb 0 ppb
if oxygen (% saturation) 0 to 200% 0%
if chlorine, monochloramine, or ozone -9999 to 9999 ppm 0 ppm
if pH 0 to 14.00 0 pH
if temperature 0 to 10°C 0.1°C
c. Delay time 0-99 sec 0 sec
d. Relay fault none, open, closed None
TABLE 5-1. Program Settings List (continued)
* Option-09, HART-enabled version operates at 4-20 mA only on output 1.
Page 25

MODEL 54eA SECTION 5.0
SOFTWARE CONFIGURATION
ITEM CHOICES FACTORY SETTINGS
CONFIGURE (continued)
C. Alarms (Section 5.7) (continued)
3. Alarm 1 setup (TPC)
a. Setpoint
if oxygen (ppm) -20 to 20 ppm 1 ppm
if oxygen (ppb) -999 to 999 ppb 100 ppb
if oxygen (% saturation) 0 to 200% 100%
if chlorine, monochloramine, or ozone -9999 to 9999 ppm 1.0 ppm
if pH -2.0 to 20.00 7.00
if temperature -5 to 130°C 25°C
b. Proportional 0 to 299.9% 100 %
c. Integral 0 to 2999 sec 0 sec
d. Derivative 0 to 299.9% 0.0%
e. Time period 10 to 2999 sec 30 sec
f. LRV (100% on)
if oxygen (ppm) -20 to 20 ppm 0 ppm
if oxygen (ppb) -999 to 999 ppb 0 ppb
if oxygen (% saturation) 0 to 200% 0%
if chlorine, monochloramine, or ozone -9999 to 9999 ppm 0 ppm
if pH -2.0 to 20.00 0.00
if temperature -5 to 130°C 0°C
g. URV (100% off)
if oxygen (ppm) -20 to 20 ppm 2 ppm
if oxygen (ppb) -999 to 999 ppb 100 ppb
if oxygen (% saturation) 0 to 200% 200%
if chlorine, monochloramine, or ozone -9999 to 9999 ppm 2 ppm
if pH -2.0 to 20.00 2.00
if temperature -5 to 130°C 100°C
h. Relay fault None, open, or closed None
4. Alarm 2 Control
a. Activation method Oxygen, chlorine, monochloramine, ozone, temperature, pH Oxygen
b. Control mode Normal or TPC Normal
5. Alarm 2 setup (normal)
a. Configuration Low, high, or off Low
Rest of alarm 2 setup is the same as alarm 1
6. Alarm 3 control and setup is the same as alarm 1
7. Alarm 4 control
Alarm Fault or off Fault
8. Feed limit timer
a. Feed limit Disable, alarm 1, alarm 2, or alarm 3 Disable
b. Timeout value 0 to 10,800 sec 600 sec
9. Interval timer
a. Select alarm Disable, alarm 1, alarm 2, or alarm 3 Disable
b. Interval time 0 to 999.9 hr 24.0 hr
c. Repeats 1 to 60 1
d. On time 0 to 2999 sec 120 sec
e. Off time 0 to 2999 sec 1 sec
f. Recovery time 0 to 999 sec 600 sec
TABLE 5-1. Program Settings List (continued)
Continued on the following page
19
Page 26

20
MODEL 54eA SECTION 5.0
SOFTWARE CONFIGURATION
TABLE 5-1. Program Settings List (continued)
ITEM CHOICES FACTORY SETTINGS
CONFIGURE (continued)
D. pH measurement (Section 5.8)
1. pH sensor Enable or disable Enable
2. pH compensation (free chlorine only) Auto or manual Auto
3. pH value 0.00 - 14.00 7.00
4. pH diagnostic On or off Off
a. Glass impedance high 0-2000 MΩ (0 disables) 1000 MΩ
b. Glass impedance low 0-900 MΩ (0 disables) 20 MΩ
c. Reference impedance high 0-140 kΩ (0 disables) 140 kΩ
d. Zero offset 0-999 mV 60 mV
e. Impedance temp. compensation On or off On
5. pH calibration
a. Auto calibration (buffer list) Manual, Standard, Merck, Ingold, DIN 19267 Standard
b. Stabilize pH 0.01 - 0.50 0.1
c. Stabilization time 0-30 sec 10 sec
6. Solution temperature coefficient
a. Temperature coefficient -0.044 to 0.028 pH/°C 0.000
b. Operating isopotential -1.35 to 20.12 pH 7.00
c. Sensor isopotential 0 to 14 pH 7.00
E. Temperature compensation (Section 5.9)
1. Temperature compensation Auto or manual Auto
2. Manual temperature -15 to 130°C 25°C
F. Noise Reduction (section 5.10)
Noise rejection 50 or 60 Hz 60 Hz
G. Main sensor calibration (Section 5.11)
1. Stabilize reading
a. oxygen (ppm) 0 to 20 ppm 0.05 ppm
b. oxygen (ppb) 0 to 999 ppb 50 ppb
c. oxygen (% saturation) 0 to 200% 1%
d. chlorine, monochloramine, or ozone 0 to 9999 ppm 0.05 ppm
2. Stabilize time 0 - 30 sec 10 sec
3. Sensor zero stabilization value
4. Dual range calibration Enable or disable disable
5. Salinity (parts per thousand) 0.0 - 99.9
o
/oo 0.0 o/oo
H. Barometric Pressure (Section 5.12)
1. Barometric pressure (oxygen only) Auto or manual Auto
2. Barometric pressure manual 0.4 - 1.2 atm (or equivalent units) 1.00 atm
3. Barometric pressure units mm Hg, in Hg, bar, kPa mm Hg
I. Security (Section 5.13)
1. Lock all 000-999 (000 disables) 000
2. Lock program 000-999 (000 disables) 000
3. Lock configuration 000-999 (000 disables) 000
Page 27
MODEL 54eA SECTION 5.0
SOFTWARE CONFIGURATION
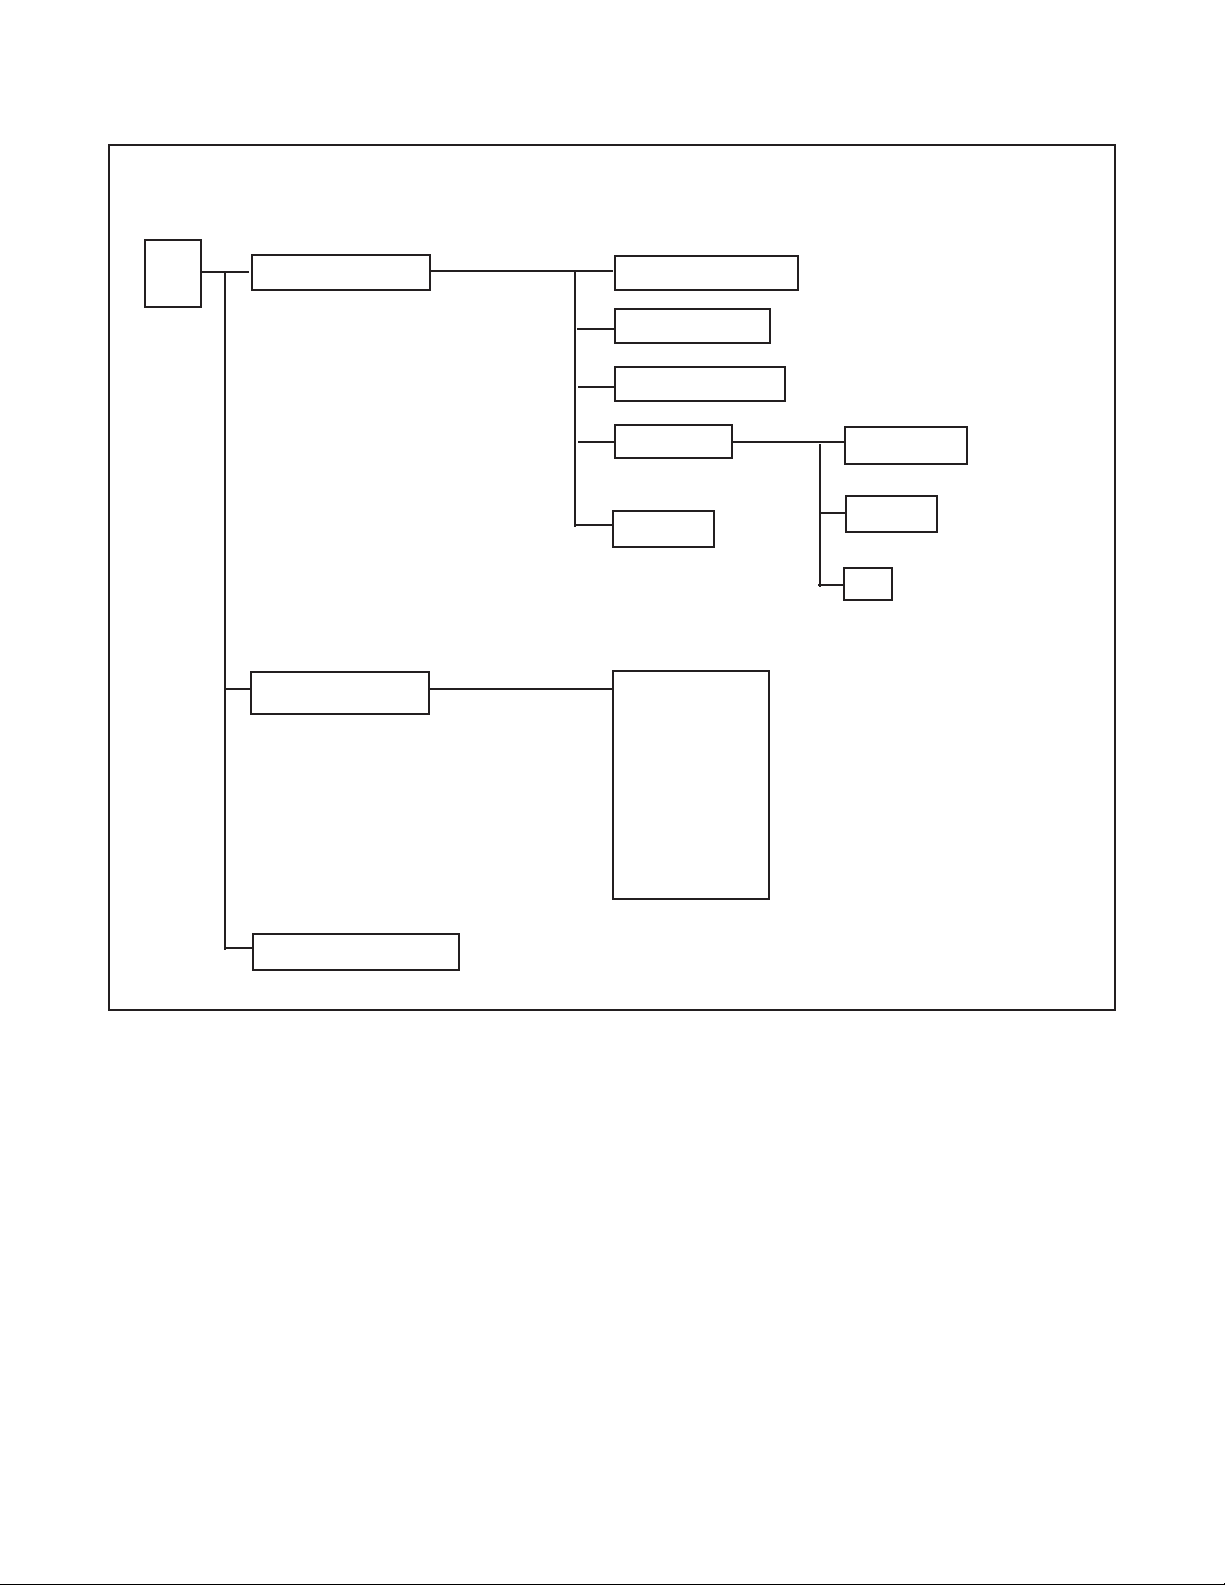
FIGURE 5-1. Menu Tree for the 54eA Controller
Calibrate
Program (see page 23)
Diagnostic Variables
Main
Menu
Calibrate main sensor
Zero main sensor
Adjust temperature
Calibrate pH
Slope
Buffer calibration
Standardize
Main measurement
Main sensor current
Sensitivity (µA/ppm)
Zero current
pH reading
pH mV reading
pH slope (mV/pH)
pH offset
Barometric pressure
Glass impedance
Noise rejection
Software version
Device ID
Output trim
21
Page 28
22
MODEL 54eA SECTION 5.0
SOFTWARE CONFIGURATION
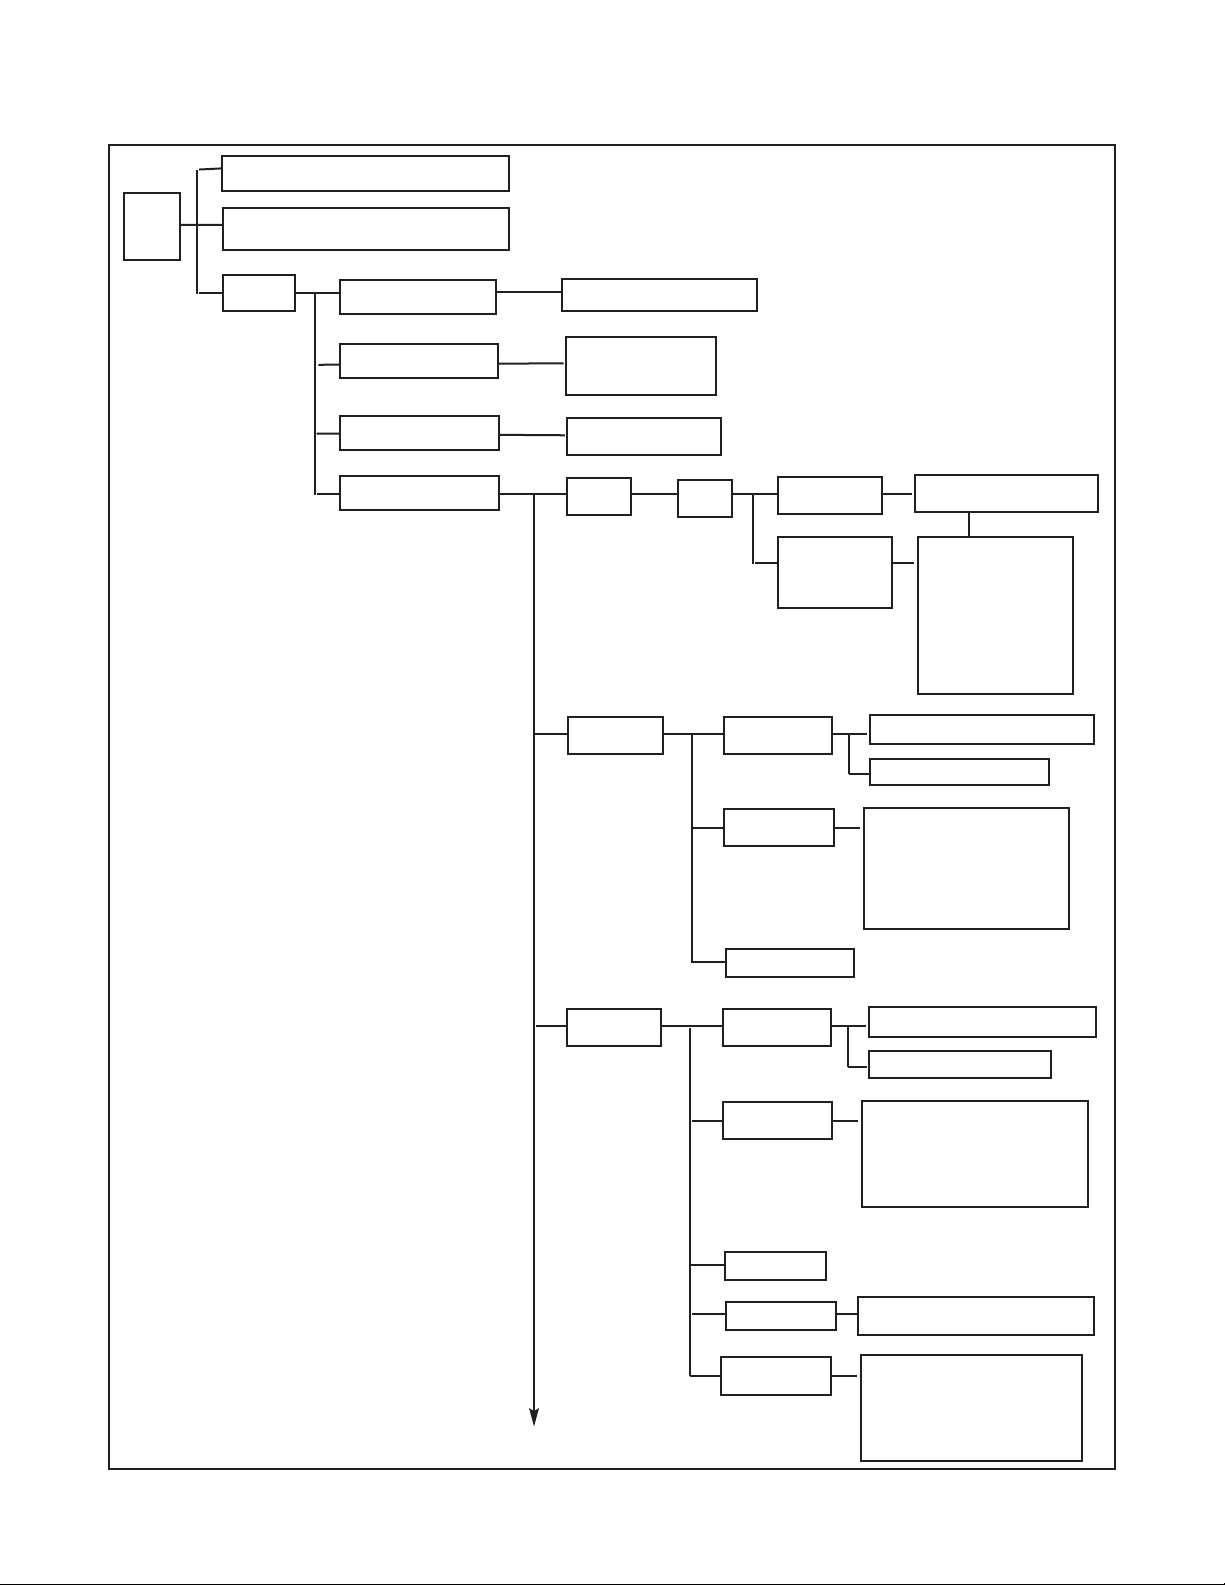
Program
Calibrate (see page 21)
Diagnostic Variable (see page 21)
Main
Menu
Alarms 1, 2, and 3 setpoints
4 mA or 0 mA
20 mA
Present output current
Alarm Setpoints
Output setpoints
Test output 1 or 2
Test alarm 1, 2, 3, or 4
Simulated tests
Configure
Display
Main
Sensor
Oxygen
Free Chlorine
Total Chlorine
Monochloramine
Ozone
Outputs
Output 1 and 2
control
Measurement: main snr, pH, temp.
Control mode: normal, PID
Output 1 and 2
setup
Range (0-20 or 4-20 mA)
Dampen*
Hold - keep last value
Hold - go to specified value
Fault
Setpoint, proportional, integral
Derivative**
Hold feature setup
*Normal only
**PID only
Alarms
Alarm 1, 2, & 3
control
Measurement: main snr, pH, temp.
Control mode: normal, TPC
Alarm 1, 2, & 3
setup
Alarm: High, low, or off*
Setpoint
Hysteresis*
Delay*
Time period, URV, LRV**
Relay default
Interval timer
Timer: Alarm 1, 2, or 3 or disable
Interval
Repeats
On time
Off time
Recovery time
Alarm 4 setup
Feed limit timer
Feed limit: Alarm 1, 2, or 3 or disable
Timeout
*Normal only **TPC only
Continued on page 23
FIGURE 5-1. Menu Tree for the 54eA Controller
(continued)
Sensor type and manufac.
Units: ppm, ppb, % sat
°C or °F
Output 1 (mA or %FS)
Output 2 (mA or %FS)
Language
Line 3 display
Display contrast
Timeout (on or off)
Timeout - limit
Polling address
Page 29
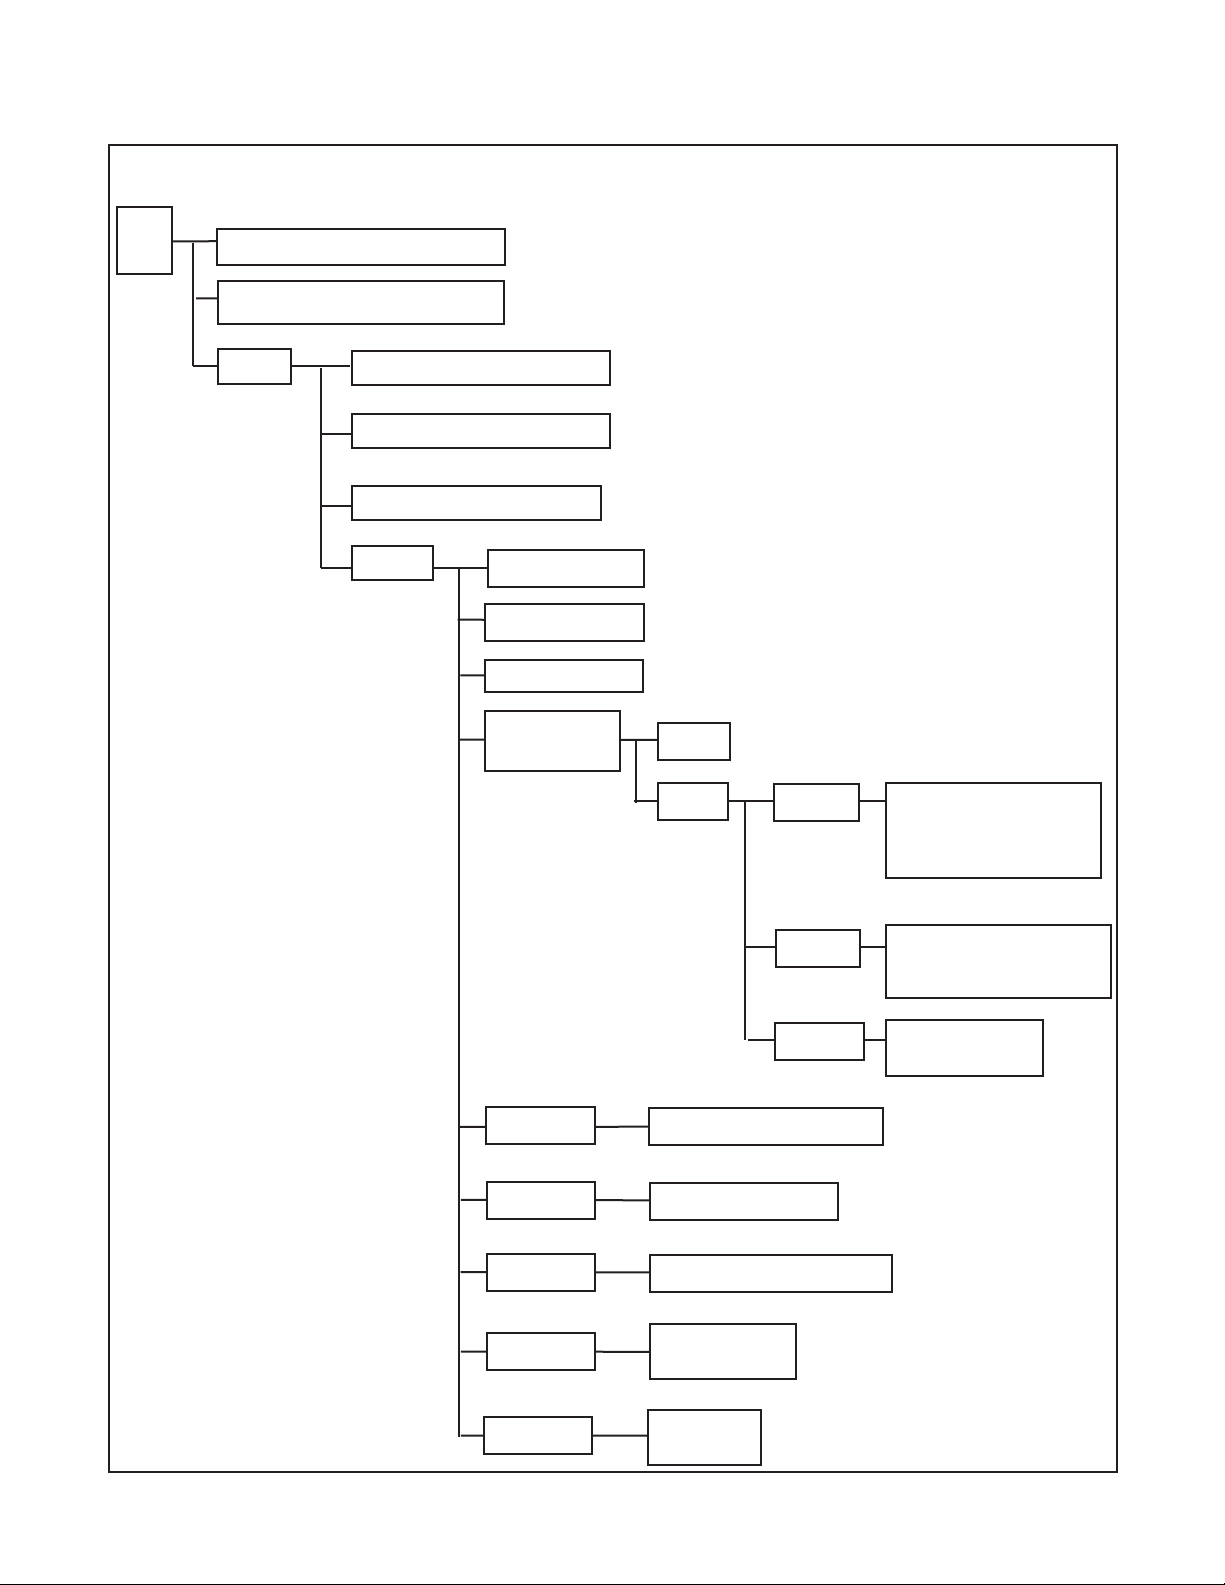
MODEL 54eA SECTION 5.0
SOFTWARE CONFIGURATION
FIGURE 5-1. Menu Tree for the 54eA Controller (continued)
Display (see page 22)
Outputs (see page 22)
Alarms (see page 22)
Program
Calibrate (see page 21)
Diagnostic Variable (see page 21)
Main
Menu
Alarm Setpoints (see page 22)
Output setpoints
(see page 22)
Simulated tests
(see page 22)
Configure
pH
(available with free
chlorine only)
Disable
Enable
pH
diagnostics
Diagnostics: on or off
Glass impedance high
Glass impedance low
Zero offset
Impedance temp comp: on or off
Temperature
Temperature comp: auto or manual
Units: °C or °F
Noise
Rejection
Noise rejection: 50 or 60 Hz
Barometric
Pressure
Measurement: Auto or manual
Units: mm Hg, kPa, atm, barg, in Hg
Main sensor cal
Stabilize conc’n
Stabilize time
Salinity (oxygen only)
Security
pH
calibration
Autocal: standard, manual,
Merck, Ingold, DIN 19267
Stabilize pH
Stabilize time
Temperature
coefficient
Temperature coeff
Operating isopotential
Sensor isopotential
Lock all
Lock program
Lock configure
(oxygen only)
23
Page 30

24
5.1 CHANGING ALARM SETPOINTS
2. Press any key to enter the main menu. Move the cursor to "Program"
and press Enter (F4).
3. Press Enter (F4).
4. Move the cursor to the desired alarm and press Enter (F4).
5. The screen appearing at this point depends on how the alarm was
configured.
6. If the alarm is a normal (i.e., not TPC) alarm, a screen like the one
shown will appear. The alarm is a low alarm and the setpoint is 0.00
ppm. Press Edit (F4). Use the arrow keys to change the setpoint.
Press Save (F4) to store the new value. Press Exit (F1) to return to
the screen in step 4. Choose a new alarm.
7. If the alarm is TPC, a screen like the one shown will appear. The setpoint is +1.000 ppm. Press Edit (F4). Use the arrow keys to change
the setpoint. Press Save (F4) to store the new value. Press Exit (F1)
to return to the screen in step 4. Choose a new alarm.
Alarm setpoints
Output setpoints
Simulate tests
Exit Enter
Alarm 1 setpoint
Alarm 2 setpoint
Alarm 3 setpoint
Exit Enter
Alarm Low : 0.000 ppm
Exit Edit
Setpoint : 1.000 ppm
Exit Edit
1. Before changing alarm setpoints, be sure that alarms are properly configured. See Section 5.7.
MODEL 54eA SECTION 5.0
SOFTWARE CONFIGURATION
Page 31

MODEL 54eA SECTION 5.0
SOFTWARE CONFIGURATION
5.2 RANGING THE OUTPUTS
2. Press any key to enter the main menu. Move the cursor to "Program"
and press Enter (F4).
3. Move the cursor to "Output setpoints" and press Enter (F4).
4. Move the cursor to the desired output and press Enter (F4).
5. This screen confirms that changes to output 1 are going to be made.
Use caution. Changes may degrade process control. Press Cont
(F3) to continue. Otherwise, press Abort (F1).
6. This screen shows the present settings for Output 1. If the output
was configured to be 0-20 mA, the first line will show "0mA" instead
of "4mA". The live current output is shown on the third line.
Move the cursor to the desired line and press Edit (F4). Use the
arrow keys to change the setpoint. Press Save (F4) to store the new
value.
Press Exit (F1) to return to the screen in step 4. Choose the other
output and continue.
Note: 0-20 mA output range is disabled on output 1 with HARTenabled version (-09 option).
Output 1 setpoints
Output 2 setpoints
Exit Enter
Alarm setpoints
Output setpoints
Simulated test
Exit Enter
CAUTION: Current
Output 1 will be
affected.
Abort Cont
1. Ranging the outputs means assigning values to the low (0 or 4 mA) and high (20 mA) outputs. Before rang-
ing the outputs, be sure the outputs are properly configured. See Section 5.6.
4 mA : 0.00 ppm
20 mA: 20.00 ppm
Output 1: 12.00 mA
Exit Edit
25
Page 32

26
MODEL 54eA SECTION 5.0
SOFTWARE CONFIGURATION
5.3 CHANGING OUTPUT SETPOINTS (PID ONLY)
2. Press any key to enter the main menu. Move the cursor to "Program"
and press Enter (F4).
3. Move the cursor to "Output setpoints" and press Enter (F4).
4. Move the cursor to the desired output and press Enter (F4).
5. This screen confirms that changes to output 1 are going to be made.
Use caution. Changes may degrade process control. Press Cont
(F3) to continue. Otherwise, press Abort (F1).
6. This screen shows the present settings for Output 1. If the output
was configured to be 0-20 mA, the second line will show "0mA"
instead of "4mA". The live current output is shown on the fourth line.
Press the ê key once to view the live output.
Move the cursor to the desired line and press Edit (F4). Use the
arrow keys to change the value. Press Save (F4) to store the new
value.
Press Exit (F1) to return to the screen in step 4. Choose the other
output and continue.
Setpoint : 1.000 ppm
4mA: 0.000 ppm
20mA: 10.00 ppm
Exit Edit
1. This section describes how to assign the setpoint and the upper and lower range values (URV and LRV) when
the 54eA is being used for PID control. Assign the LRV to 4 mA and the URV to 20 mA. The LRV is the deviation from the setpoint that will result in a 4 mA output. The URV is the deviation from the setpoint that will
result in a 20 mA output.
Example: The setpoint is 1.00 ppm. The URV is +0.50 and the LRV is 0.00. If the present reading is 1.20 ppm,
the output will be (1.20 - 1.00)/(0.50 - 0.00) or 40% of the range (10.40 mA). If the present reading is 1.50 ppm,
the output will be (1.50 - 1.00)/(0.50 - 0.00) or 100% of the range (20.00 mA). If the present reading is less
than the setpoint, the output will be 4 mA.
The control setpoint is usually the condition where the output current is a minimum. The P and I control calculations use the setpoint to adjust the output to the desired level based on the parameters established in
Section 5.6.
To configure the controller for PID control, see Section 5.6.
Alarm setpoints
Output setpoints
Simulated test
Exit Enter
CAUTION: Current
Output 1 will be
affected.
Abort Cont
Output 1 setpoints
Output 2 setpoints
Exit Enter
Page 33

MODEL 54eA SECTION 5.0
SOFTWARE CONFIGURATION
5.4 TESTING OUTPUTS AND ALARMS
2. Press any key to enter the main menu. Move the cursor to "Program"
and press Enter (F4).
3. Move the cursor to "Simulated tests" and press Enter (F4).
4. Move the cursor to the desired output or alarm. Both outputs and all
four alarms can be tested. Press Enter (F4).
A screen will appear warning that the output or alarm will change.
Press Cont (F3) to continue. Press Abort (F1) to cancel the simulation.
5. This screen appears when an output is being simulated. To change
the simulation current, press Edit (F4). Use the arrow keys to change
the current to the desired value. Press Test (F4), then Esc (F3).
The simulated current will be generated for 10 minutes, then the output returns to normal operation. To change the timeout to a different
value see Section 5.5.
To end the simulation at any time, press Exit (F1).
6. This screen appears when an alarm is being simulated. To change
the state of the relay, press Edit (F4). Use the é or ê keys to change
from open to closed. Press Test (F4), then Esc (F3).
The alarm will be simulated for 10 minutes, then the alarm returns to
normal operation. To change the timeout to a different value, see
Section 5.5.
To end the simulation at any time, press Exit (F1).
Output setpoints
Simulated tests
Configure
Exit Enter
Test output 1
Test output 2
Test alarm 1
Exit Enter
Test output 1: 10.00 mA
Simulating output1
Exit Edit
Test alarm 1: Open
Simulating alarm1
Exit Edit
1. For testing purposes, the controller can be programmed to generate simulated outputs and to activate and
deactivate alarms.
27
Page 34

28
Output setpoints
Simulated tests
Configure
Exit Enter
MODEL 54eA SECTION 5.0
SOFTWARE CONFIGURATION
5.5 CHOOSING DISPLAY OPTIONS
3. Press any key to enter the main menu. Move the cursor to "Program"
and press Enter (F4).
4. Move the cursor to "Configure" and press Enter (F4).
5. With the cursor on "Display", press Enter (F4).
6. A screen showing the present main measurement will appear. To
change the measurement, for example, from oxygen to ozone, press
Edit (F4), then use the é key to scroll through the choices. Press
Save (F4) to store the setting.
A screen will appear warning that if the measurement is changed, the
analyzer will return to factory default settings. Press Cont (F3) to continue. Press Abort (F1) to cancel the change.
7. If oxygen is being measured, the screen at left appears. Use the ê
key to move the cursor to "Sensor" and press Edit (F4). Use the é or
ê keys to scroll through the choices. Press Save (F4) to store the
selection.
Use the ê key to move the cursor to "Meas units" and press Edit (F4).
Use the é or êkeys to scroll through the choices. Press Save (F4)
to store the selection.
Display
Outputs
Alarms
Exit Enter
Measure : Oxygen
Sensor: RMT Standard
Meas units: ppm
Exit Edit
Measure : Oxygen
Sensor: RMT Standard
Meas units: ppm
Exit Enter
1. The 54eA controller can be used with most amperometric sensors manufactured by Rosemount Analytical. The
user must configure the analyzer to match the sensor being used.
2. The display menu also lets the user customize the third line in the display, change timeout values, choose a language other than English, and change the display contrast.
RMT Standard 499ADO or 499ATrDO
RMT Biopharm Hx438 or Gx448
SSDO Other Steam sterilizable sensor from other manufacturers
ppm (mg/L) use with any sensor except 499ATrDO
ppb (ug/L) use with 499ATrDO sensor
% sat (concentration as a percent of saturation value)
use with any sensor except 499ATrDO
Page 35

MODEL 54eA SECTION 5.0
SOFTWARE CONFIGURATION
5.5 CHOOSING DISPLAY OPTIONS (CONTINUED)
8. Set the remainder of the display parameters. Use the é and ê keys
to choose the desired parameter. Then press Edit (F4). Use the é
key to move the cursor to the desired selection. Press Save (F4) to
store.
SECURITY CAUTION
The controller uses the timeout value to activate security. Once
the controller is unlocked by entering a security code, security will
not re-activate until a display timeout occurs. If timeout has been
turned off, security will never reactivate.
Temp units: °C
Output 1: mA
Output 2: mA
Exit Edit
Language: English
Display left: I
Display right: Out 2
Exit Edit
Display contrast: 40
Timeout: On
Timeout value: 10 min
Exit Edit
Temp units °C or °F
Output 1 mA or % of full scale
Output 2 mA or % of full scale
Language English, Français, Español, Deutsch, Italiano
Display left sensor current (I), pH (appears only if free chlorine
is being measured and pH was enabled), alarm 1
setpoint (no units), alarm 3 setpoint (no units),
or blank
Display right sensor current (I), pH (appears only if free chlorine
is being measured and pH was enabled), alarm 2
setpoint (no units), alarm 3 setpoint (no units),
output 2, or blank
Display Contrast 00 (lightest)-99 (darkest); the display contrast
changes as the number changes
Timeout Timeout returns the display from any other screen
to the main display if no key is pressed before the
timeout value is exceeded.
Polling address Identifies controller in multi-drop HART applications.
Timeout value
29
Page 36

30
MODEL 54eA SECTION 5.0
SOFTWARE CONFIGURATION
5.6 CHANGING OUTPUT PARAMETERS
3. Press any key to enter the main menu. Move the cursor to "Program"
and press Enter (F4).
4. Move the cursor to "Configure" and press Enter (F4).
5. Move the cursor to "Outputs" and press Enter (F4).
6. Five menu headers relate to outputs. Each output has a control header and a setup header. The fifth header allows the output hold feature
to be configured.
Always configure the control parameters BEFORE making
changes in the output setup.
To access a header, move the cursor to the desired header and press
Enter (F4).
7. Output Control Settings:
a. Move the cursor to the desired output control header. Press Enter
(F4).
b. With the cursor on "Output Measurement" press Enter (F4).
c. Press Edit (F4).
d. Use the é key to scroll through the choices: "Process",
"Temperature", and “pH” (if free chlorine is being measured and
pH was enabled). "Process" means the measurement made by
the main sensor (oxygen, ozone, free chlorine, or total chlorine).
Press Save (F4) to store the selection.
Output 1 control
Output 1 setup
Output 2 control
Exit Enter
Output Measurement
Control Mode
Exit Enter
Output : Process
Exit Edit
Display
Outputs
Alarms
Exit Enter
1. This section describes how to configure the controller outputs. Outputs can be configured to represent the
main amperometric measurement (oxygen, ozone, free chlorine, or total chlorine), temperature, or pH (if free
chlorine is being measured and pH was enabled).
2. The output can be configured as either a normal or PID output. Normal means the output current is directly
proportional to the measurement assigned to the output. PID means the output is used for PID control.
Output setpoints
Simulated tests
Configure
Exit Enter
Page 37

MODEL 54eA SECTION 5.0
SOFTWARE CONFIGURATION
5.6 CHANGING OUTPUT PARAMETERS (continued)
e. The display returns to the “Output: Process” screen. Press Exit
(F1). The display returns to the “Output Measurement” screen.
Move the cursor to "Control mode" and press Enter (F4).
f. Press Edit (F4). Use the é key to toggle between "Normal" and
"PID". Press Save (F4) to store the selection.
8. Output setup for normal outputs:
a. Move the cursor to the desired output setup and press Enter (F4).
b. Use the é and ê arrow keys to move the cursor to the desired
parameter. Press Edit (F4). Use the arrow keys to change the setting to the desired value and press Save(F4) to store the value.
Range: Choose 4-20 mA or 0-20 mA.
Dampen: Dampening averages the output current, thus smooth-
ing out a noisy reading. Higher values provide more smoothing
but increase the response time of the output.
Hold and Fixed Hold: If the analyzer is placed in hold, the outputs will either remain at the last value or go to a fixed value
selected by the user. The fixed value must be between 0 and
22.00 mA.
Fault: If the analyzer detects a fault, the output will signal the fault
by going to a user-selected current between 0 and 22.00 mA.
For allowed values, see Table 5-1.
Note: 0-20 mA output range is disabled on output 1 with HARTenabled version (-09 option).
9. Output setup for PID outputs:
a. Move the cursor to the desired output setup and press Enter (F4).
b. Use the é and ê keys to move the cursor to the desired param-
eter. Press Edit (F4). Use the arrow keys to change the setting to
the desired value and press Save (F4) to store the value.
Setpoint: Setpoint is usually the value at which the process is
being controlled. Typically, the output will be 4 mA (or 0 mA) when
the value is near the setpoint.
Ctrl mode : Normal
Exit Edit
Range : 4-20 mA
Dampen: 0 sec
Hold: Last Value
Exit Edit
Output 1 Control
Output 1 Setup
Output 2 Control
Exit Enter
Output 1 Control
Output 1 Setup
Output 2 Control
Exit Enter
Setpoint : 1.000 ppm
Proportional: 100.0%
Integral: 0 sec
Exit Edit
31
Page 38

32
MODEL 54eA SECTION 5.0
SOFTWARE CONFIGURATION
Proportional: Proportional is the same as proportional band and
is the range over which control is being used. It is the opposite of
process gain. Smaller values provide tighter control.
Integral: Integral is the number of seconds over which deviations from the setpoint are integrated to remove continuing offsets. Smaller values provide higher response.
Derivative: Derivative is a form of control that resists all changes
in readings. Higher readings increase the derivative function. To
prevent process oscillation, use caution in setting the derivative
value.
Range: Choose 4-20 mA or 0-20 mA.
For an explanation of Hold, Fixed Hold, and Fault, see step 8b
above.
For allowed values, see Table 5-1.
For more information using PID control, see Section 13.0.
10. Hold setup.
a. Move the cursor to "Hold feature setup" and press Enter (F4).
b. Press Edit (F4). Use the é to scroll through the choices: "Disable
feature", "Enable feature", and "20 min timeout". If "20 min timeout" is selected, hold mode will automatically disengage after
being on for 20 minutes.
NOTE
Selecting "Enable hold" or "20-min timeout" does not put
the controller in hold. It only allows the user to put the
controller in hold when the controller is in calibrate mode.
11. Using hold.
If hold was enabled in step 10 above, the hold screen will appear as
soon as the user enters the Calibrate menu. To activate Hold, press
Edit (F4). Use the é key to change Off to On and press Save (F4).
"Hold Mode Activated" will be displayed. Outputs and relays will go to
the values programmed in step 8b.
"Hold Mode Activated" will continue to flash in the main display even
after the user has left the Calibrate menu. To deactivate hold, enter
the Calibrate menu and press Edit (F4). Use the é key to change On
to Off and press Save (F4). Press Exit (F1) twice to return to the main
display.
Output 2 control
Output 2 setup
Hold feature setup
Exit Enter
5.6 CHANGING OUTPUT PARAMETERS (continued)
Page 39

MODEL 54eA SECTION 5.0
SOFTWARE CONFIGURATION
5.7 CHANGING ALARM PARAMETERS
3. Press any key to enter the main menu. Move the cursor to "Program"
and press Enter (F4).
4. Move the cursor to "Configure" and press Enter (F4).
5. Move the cursor to "Alarms" and press Enter (F4).
6. Nine menu headers relate to alarms. Alarms 1, 2 and 3, each have a
control header and a setup header. Alarm 4 has only a setup header.
The eighth menu header is for configuring the feed limit timer, and the
ninth menu header is for configuring the interval timer.
Always configure the control parameters BEFORE making
changes in the alarm setup.
To access a header, move the cursor to the desired header and press
Enter (F4).
7. Alarm Control Settings:
a. Move the cursor to the desired output control header. Press Enter
(F4).
b. With the cursor on "Activation method" press Enter (F4).
Alarm 1 control
Alarm 1 setup
Alarm 2 control
Exit Enter
Outputs
Alarms
pH
Exit Enter
Output setpoints
Simulated tests
Configure
Exit Enter
1. This section describes how to configure the controller alarms. Alarms 1, 2, and 3 can be assigned to the main
amperometric measurement (oxygen, ozone, free chlorine, or total chlorine), temperature, or pH (if pH was
enabled). In addition, alarm 1, 2, or 3 can be configured as a feed limit timer or as an interval timer (see steps
10 and 11). Alarm 4 is always a fault alarm.
2. An alarms assigned to the main amperometric measurement, temperature, or pH can be configured as either
a simple on/off alarm or as TPC (time proportional control) alarm.
Activation method
Control mode
Exit Enter
33
Page 40

34
MODEL 54eA SECTION 5.0
SOFTWARE CONFIGURATION
5.7 CHANGING ALARM PARAMETERS (continued)
c. To change the activation method, press Edit (F4). Use the é key
to scroll through the choices: "Process", "Temperature", and “pH”
(if pH was enabled). "Process" means the measurement made
by the main sensor (oxygen, ozone, free chlorine, or total chlorine). Press Save (F4) to store the selection.
d. The display returns to the "Activate: Process" screen. Press Exit
(F1). The display returns to the "Activation method" screen.
Move the cursor to "Control mode" and press Enter (F4).
e. To change the control mode, press Edit (F4). Use the é key to
toggle between "Normal" and "TPC". Press Save (F4) to store
the selection.
8. Alarm setup for normal alarms:
a. Move the cursor to the desired alarm setup and press Enter (F4).
b. Use the é and ê keys to move the cursor to the desired param-
eter. Press Edit (F4). Use the arrow keys to change the setting to
the desired value and press Save (F4) to store the value. See the
Figures 5-2 and 5-3 for an explanation of terms: low alarm, high
alarm, hysteresis, and delay. See Table 5-1 for allowed values
and limits.
Relay default determines how the relay will operate if there is a
fault or the controller is in hold. Alarms can be forced on (Close),
off (Open), or remain unchanged (None).
Activate : Process
Exit Edit
Ctrl mode : Normal
Exit Edit
Alarm : Low
Setpoint: 0.000 ppm
Hysteresis: 0.000 ppm
Exit Edit
Activation method
Control mode
Exit Enter
Alarm 1 control
Alarm 1 setup
Alarm 2 control
Exit Enter
Page 41

MODEL 54eA SECTION 5.0
SOFTWARE CONFIGURATION
5.7 CHANGING ALARM PARAMETERS (continued)
9. Alarm setup for TPC alarms:
a. Move the cursor to the desired alarm setup and press Enter (F4).
b. Use the é and ê keys to move the cursor to the desired param-
eter. Press Edit (F4). Use the arrow keys to change the setting to
the desired value and press Save (F4) to store the value
Setpoint: Setpoint is the usually the value to which the process
is to be controlled. The alarm will not be on much when the
process is at the setpoint value.
Proportional: Proportional is the same as proportional band and
is the range over which control is being used. It is the opposite of
process gain. Smaller values provide tighter control.
Integral: Integral is the number of seconds over which deviations
from the setpoint are integrated to remove continuing offsets.
Smaller values provide higher response.
Derivative: Derivative is a form of control that resists all changes
in readings. Higher readings increase the derivative function. To
prevent process oscillation, use caution in setting the derivative
value.
Time period: Time period is the cycle time for TPC control. One
cycle consists of an energized (relay on) time and a deenergized
(relay off) time.
URV: URV is the deviation from the setpoint that results in the
alarm being on all the time.
LRV: LRV is the deviation from the setpoint that results in the
alarm being off all the time. The LRV should be set to 0.00.
Setpoint : 1.000 ppm
Proportional: 100.0%
Integral: 0 sec
Exit Edit
Alarm 1 control
Alarm 1 setup
Alarm 2 control
Exit Enter
FIGURE 5-2. Low Alarm FIGURE 5-3. High Alarm
35
Page 42

36
Feed limit : Disable
Timeout: 3600 sec
Exit Edit
1.000 ppm
26.2°C 12.0mA
Feed limit alarm 1
MODEL 54eA SECTION 5.0
SOFTWARE CONFIGURATION
5.7 CHANGING ALARM PARAMETERS (continued)
Example: The setpoint is 3.00 ppm. The URV is +5.00 ppm and
the LRV is 0.00 ppm. The time period is 30 seconds. When the
concentration is 4.00 ppm, the relay will be on (4-3)/(5-0) = 20%
of the time or 6 seconds.
Relay default: Relay default determines how the relay will act if
there is a fault or hold condition. The choices are on (relay
closed), off (relay open), or none (relay remains unchanged).
USE OF TPC
Setting TPC parameters is not trivial. Substantial trial
and error is often needed before results are acceptable. For non-linear measurements, like pH, applying
PID algorithms can result in unintended effects.
9. Alarm 4 setup:
Alarm 4 is a dedicated fault alarm. When a fault condition exists, the
red LED on the front display will light.
a. From the menu header screen (step 6) move the cursor to "Alarm
4 setup."
b. To disable the alarm, press Edit (F4) and use the é key to
change the "Fault" to "Off"
10. Feed limit timer setup:
Alarm 1, 2, or 3 can be configured as a feed limit timer. The feed limit
timer prevents overfeeding of treatment chemicals by automatically
turning off the relay after a timeout period.
a. From the menu header screen (step 6) move the cursor to "Feed
limit timer." Press Enter (F4).
b. With the cursor on "Feed limit" press Edit. Use the é key to scroll
through the choices: disable, AL 1, AL 2, and AL 3. Press Save
(F4) to store the selection.
c. Move the cursor to "Timeout". Press Edit (F4) and use the arrow
keys to change the timeout to the desired value. Press Save (F4)
to store the setting.
Operation of the feed limit timer. When a feed limit alarm has
timed out, "Feed limit alarm 1" (if alarm 1 was chosen) appears in
the display. At the same time the red FAIL LED will light and alarm
4 will close (if not turned off), and the selected feed limit relay (alarm
1) will open (de-energize). All other alarms and current outputs will
remain unchanged. The relays remain in the state described until
the Ack (F2) key is pressed, at which time the controller returns to
normal operation and the feed limit clock starts again.
NOTE
Pressing Ack (F2) acknowledges all conditions that turn
on the red LED. If another event occurs after F2 is
pressed, F2 must be pressed again to acknowledge the
new event.
Alarm : Fault
Exit Edit
Page 43

MODEL 54eA SECTION 5.0
SOFTWARE CONFIGURATION
5.7 CHANGING ALARM PARAMETERS (continued)
11. Interval timer setup:
Alarm 1, 2, or 3 can be used as an interval timer. The selected relay will
open and close at time intervals programmed by the user. The interval
timer is useful for automatic cleaning of sensors.
NOTE
The alarm relay used for the interval timer cannot be
used for other purposes. When a timer sequence is
occurring, both current outputs are placed in hold (even
if hold was not enabled) and the other two alarms will be
placed in their default states.
a. From the menu header screen (step 6) move the cursor to
"Interval timer."
b. With the cursor on "Interval timer", press Enter (F4). Use the ê
key to scroll through the selections. Use the arrow keys to
change settings. Press Save (F4) to store.
Refer to the diagram for definition of terms: interval, repeats, on
time, off time, and recovery.
Timer : Disable
Timer: Time activated
Interval: 24.0 hr
Exit Edit
Alarm 4 setup
Feed limit timer
Interval timer
Exit Enter
FIGURE 5-4. Interval Timer
37
Page 44

38
MODEL 54eA SECTION 5.0
SOFTWARE CONFIGURATION
5.8 CONFIGURING THE pH MEASUREMENT
1. Press any key to enter the main menu. Move the cursor to "Program"
and press Enter (F4).
2. Move the cursor to "Configure" and press Enter (F4).
3. Move the cursor to “pH” and press Enter (F4).
4. The default settings are “pH sensor: Enable” and “pH comp: Auto.”
Keeping these settings permits the controller to continuously correct
raw chlorine readings for pH changes. Go to step 6.
If continuous pH correction is not required, the controller must be
configured for manual pH correction. Go to step 5.
5. For manual pH correction, press Edit (F4).
a. Use the é key to change "Enable" to "Disable" and press Save
(F4).
b. The screen at left appears. Use the ê key to move the cursor
to “pH value.” Press Edit (F4). Use the arrow keys to change the
pH value to the desired number. The controller will use the value
entered in ALL pH correction calculations no matter what the true
pH is.
6. This screen appears if automatic pH correction for chlorine readings
is being used. To enable diagnostic fault alarms and warning messages and to change pH diagnostic warning limits…
a. Move the cursor to "pH diagnostics" and press Enter (F4).
b. Move the cursor to "Diagnostics". Press Edit (F4) and use the é
pH sensor : Enable
pH comp: Auto
pH diagnostics
Exit Edit
pH sensor : Disable
pH comp: Manual
pH value: 7.00 pH
Exit Edit
Alarms
pH
Temperature
Exit Enter
pH comp: Auto
pH diagnostics
pH calibration
Exit Enter
NOTE
pH is available only if the Model 54eA controller was configured to measure free chlorine
using the 499ACL-01 sensor.
Page 45

MODEL 54eA SECTION 5.0
SOFTWARE CONFIGURATION
5.8 CONFIGURING THE pH MEASUREMENT (continued)
key to change "Off" to "On". Press Save (F4).
NOTE
Choosing "On" means the controller will display pH diagnostic warning messages and fault alarms. Choosing "Off"
means the messages and fault alarms will not be displayed.
Diagnostic variables will still be measured and can be viewed
under the Diagnostics menu.
c. Use the é and ê keys to move through the list of diagnostic
measurements. To change a warning limit, press Edit (F4). Use
the arrow keys to change the setting and press Save (F4) to store
the change. For allowed ranges, see Table 5-1. Setting the limit
to 0 disables the warning limit.
Glass imp hi: High glass impedance implies that the sensor may
be nearing the end of its useful life. Set the warning limit about
two times higher than the impedance of a new electrode. A typical glass electrode has an impedance of about 150 MΩ at 25°C.
Glass imp lo: Low glass impedance warns of a broken electrode.
A good setting is 20 MΩ.
Zero offset: pH measuring cells are designed to have a potential
of 0 mV in pH 7 buffer. Zero offset is a measure of how far the
true value is from 0.0 mV. Zero offset is calculated every time the
sensor is calibrated. A good limit is 60 mV.
Imped comp: The impedance of a glass electrode is a strong
function of temperature. For accurate comparison of impedances,
readings must be temperature corrected. For best results, leave
"Imped comp" on.
d. Press Exit (F4) to return to the screen in step 6a.
7. To change calibration parameters…
a. Move the cursor to pH calibration and press Enter (F4).
b. Use the é and ê keys to move through the list of items. To make
a change press Edit (F4). Use the arrow keys to the setting to the
desired value and press Save (F4). For allowed ranges see Table
5-1.
Autocal: To disable automatic calibration, choose "Manual". The
other choices in the list ("Standard", "Merck", "Ingold", and "DIN
19267") refer to standard and technical buffers. Refer to the table
in Section 11.0 for a list of the standard buffers. Merck buffers are
pH 2.00, 7.00, 9.00 and 12.00. Ingold buffers are 2.00, 4.01, 7.00,
and 9.21. DIN 19267 are 1.09, 3.06, 4.65, 6.79, 9.23, and 12.75.
Diagnostics : Off
Glass imp hi: 1000 MΩ
Glass imp lo: 20 MΩ
Exit Edit
Autocal : Standard
Stabilize pH: 0.01 pH
Stabilize time: 10 sec
Exit Edit
pH diagnostics
pH calibration
Temperature coeff
Exit Enter
39
Page 46

40
MODEL 54eA SECTION 5.0
SOFTWARE CONFIGURATION
5.8 CONFIGURING THE pH MEASUREMENT (continued)
Temp coeff : 0.000
Operate iso: 7.00 pH
Sensor iso: 7.00 pH
Exit Enter
Stabilize pH and Stabilize time: For the controller to accept calibration data, the pH must remain within a specified range for a
specified period of time. The default values are 0.01 pH for 10 seconds. Using a small pH value and a large time provides the best
protection against calibration while the reading is still changing.
8. In many industries pH is used and reported at a reference temperature of 25°C. Correcting a pH reading to 25°C is often referred to as
a solution temperature correction. To perform the correction, the solution temperature coefficient must be known.
a. With the cursor on "Temperature coeff", press Enter (F4).
b. Use the é and ê keys to move through the list of items. To make
a change press Edit (F4). Use the arrow keys to change the setting to the desired value and press Save (F4). For allowed ranges
see Table 5-1.
Temp coeff: Enter the temperature coefficient in units of ΔpH/°C.
If the pH decreases as temperature increases, the temperature
coefficient is negative. The temperature coefficient must usually
be determined empirically.
APPLICATION WARNING
If pH is being measured for the purposes of correcting a free chlorine reading, do NOT use solution temperature correction. Keep the temperature coefficient at 0.000 pH/°C.
Operate iso: Entering a temperature coefficient ALWAYS causes
the operating isopotential to change from the normal value of
7.00. When programming the controller to perform solution temperature compensation, ALWAYS enter the solution temperature
coefficient and allow the transmitter to calculate the operating
isopotential pH.
Sensor iso: The isopotential pH is the pH at which the cell voltage is independent of temperature. Most sensors have an isopotential pH fairly close to 7.0, so the default value is 7.00. Certain
specialized pH electrodes have isopotential pH significantly different from 7.0.
NOTE
Do NOT change the isopotential pH of the controller unless you are thoroughly familiar with the
role of isopotential points in pH measurements OR
the sensor operating instructions specifically state
the isopotential pH is a value other than pH 7.
pH diagnostics
pH calibration
Temperature coeff
Exit Enter
Page 47

Temp comp : Auto
Temp units: °C
Exit Edit
Temp comp: Manual
Temp units: °C
Temperature : 25.0°C
Exit Edit
MODEL 54eA SECTION 5.0
SOFTWARE CONFIGURATION
5.9 TEMPERATURE COMPENSATION AND TEMPERATURE UNITS
1. Refer to Section 6.1 for a discussion of the ways in which temperature affects amperometric and pH measurements.
pH
Temperature
Noise rejection
Exit Enter
2. Press any key to enter the main menu. Move the cursor to "Program"
and press Enter (F4).
3. Move the cursor to "Configure" and press Enter (F4).
4. Move the cursor to "Temperature" and press Enter (F4).
5. Use the é and ê keys to move through the list of items. To make a
change press Edit (F4). Use the arrow keys to change settings to the
desired value. Press Save (F4) to store changes.
Auto: In automatic temperature compensation, the controller measures the temperature using an RTD (resistance temperature device)
or 22kNTC thermistor in the sensor. The controller then uses the
measured temperature to calculate membrane permeability corrections, solubility factors (for oxygen only), and the millivolt to pH conversion factor (for pH-corrected free chlorine only).
Manual: In manual temperature compensation, the controller uses
the temperature entered by the user to calculate membrane permeability corrections, solubility factors (for oxygen only), and the millivolt
to pH conversion factor. It does NOT use the actual process temperature. Do NOT use manual temperature compensation unless the difference between the calibration and measurement temperatures is
less than 2°C.
Manual temperature compensation is useful if the sensor RTD
has failed and a replacement sensor is not available.
If Manual temperature compensation is selected, be sure to enter the
desired temperature.
41
Page 48

42
Noise rejection : 60 Hz
Exit Edit
MODEL 54eA SECTION 5.0
SOFTWARE CONFIGURATION
5.10 NOISE REDUCTION
1. For maximum noise reduction the frequency of the ac power must be entered into the analyzer.
Temperature
Noise rejection
Main sensor cal
Exit Enter
2. Press any key to enter the main menu. Move the cursor to "Program"
and press Enter (F4).
3. Move the cursor to "Configure" and press Enter (F4).
4. Move the cursor to "Noise rejection" and press Enter (F4).
5. To change the frequency setting, press Edit (F4). Use the é key to
toggle between 50 and 60 Hz. Press Save (F4) to store the change.
Page 49

Stabilize : 0.050 ppm
Stabilize time: 10 sec
Exit Edit
Stabilize: 0.050 ppm
Stabilize time: 10 sec
Dual range cal : Disable
Exit Edit
Stabilize: 0.050 ppm
Stabilize time: 10 sec
Salinity : 0.0 o/oo
Exit Edit
MODEL 54eA SECTION 5.0
SOFTWARE CONFIGURATION
5.11 MAIN SENSOR CALIBRATION PARAMETERS
1. Main sensor refers to the amperometric sensor.
Noise rejection
Main sensor cal
Security
Exit Enter
2. Press any key to enter the main menu. Move the cursor to "Program"
and press Enter (F4).
3. Move the cursor to "Configure" and press Enter (F4).
4. Move the cursor to "Main sensor cal" and press Enter (F4).
5. Use the é and ê keys to move through the list of items. To make a
change press Edit (F4). Use the arrow keys to change settings to the
desired value and press Save (F4). For allowed ranges, see Table 5-1.
The choices depend on the measurement being made.
Stabilize and Stabilize time: For the controller to accept calibration
data, the concentration must remain within a specified range for a
specified period of time. The default values are 0.05 ppm (50 ppb)
and 10 seconds. Using a small stabilize value and a long stabilize
time is the best protection against calibration while a reading is still
changing.
Dual range cal: Free and total chlorine sensors from Rosemount
Analytical (Model 499ACL-01 and 499ACL-02, respectively) become
non-linear at high concentrations of chlorine. Dual range calibration
allows the analyzer to correct for the non-linearity of the sensor. For
more information see Sections 8.0 and 9.0.
Salinity: Salinity is used with oxygen measurements only. The solubility of oxygen in water depends on the concentration of dissolved
salts in the water. Increasing the concentration decreases the solubility. If the salt concentration is greater than about 1000 ppm, the
accuracy of the measurement can be improved by applying a salinity correction. Enter the salinity as parts per thousand (o/oo). One percent is ten parts per thousand.
43
Page 50

44
Bar meas : Auto
Bar units: mm Hg
Exit Edit
MODEL 54eA SECTION 5.0
SOFTWARE CONFIGURATION
5.12 BAROMETRIC PRESSURE
1. The barometric pressure menu header appears only if an oxygen sensor (ppm or ppb level) is being used.
Barometric pressure is used during air calibration.
Noise rejection
Barometric pressure
Main sensor cal
Exit Enter
2. Press any key to enter the main menu. Move the cursor to "Program"
and press Enter (F4).
3. Move the cursor to "Configure" and press Enter (F4).
4. Move the cursor to "Barometric pressure" and press Enter (F4).
5. Use the é and ê keys to move through the list of items. To make a
change, press Edit (F4). Use the arrow keys to change settings to the
desired value and press Save (F4).
Bar meas: The controller has an on-board sensor that automatically
measures barometric pressure. To bypass the pressure sensor,
select "Manual'. Be sure to enter the desired pressure in the third line.
During air calibration, the controller will use the barometric pressure
entered in this step no matter what the true pressure is.
Bar units: Select the units in which barometric pressure will be displayed.
Page 51

MODEL 54eA SECTION 5.0
SOFTWARE CONFIGURATION
5.13 SECURITY
1. The controller can be programmed to require a password for access to menus. There are three levels:
Level 1: A level 1 user can
1. Zero and calibrate the main (amperometric) sensor
2. Calibrate the barometric pressure sensor
3. Calibrate the pH sensor
4. Enter a temperature slope for a pH sensor
5. Change temperature compensation from automatic to manual and enter a manual compensation temperature
6. View diagnostic variables.
Level 2: A level 2 user can
1. Do everything a level 1 user can do
2. Change control setpoints for PID current outputs
3. Change alarm setpoints for normal and TPC alarms
4. Rerange the 4-20 mA outputs
5. Manually test both outputs and all four alarm relays.
Level 3: A level 3 user has access to every menu item. Only a level 3 user can change passwords.
A person with no password can only view the main display.
2. Press any key to enter the main menu. Move the cursor to "Program" and
press Enter (F4).
3. Move the cursor to "Configure" and press Enter (F4).
4. Move the cursor to "Security" and press Enter (F4).
5. Use the é and ê keys to move through the list of items. To enter a password,
press Edit (F4). Use the arrow keys to enter a three-digit password. Press
Save (F4) to store the value.
Lock all: Until the user enters the "lock all" password, all he can do is view
the main display. Entering the "lock all" password allows the user access to
all Level 1 functions.
Lock program: Entering the "lock program" password allows the user
access to all Level 2 functions.
Lock config: Entering the "lock config" password allows the user access to
all Level 3 functions.
The controller will accept a higher level security code at a lower level security gate. For example, the controller will accept a level 2 password at a level
1 gate.
NOTES:
a. A code of 000 disables security for that level.
b. The security feature will not activate until after the timeout period has
passed with no key presses.
c. A hold condition will indefinitely prolong the timeout period.
d. Security will activate immediately if power is removed and then restored.
e. To recall a forgotten code, press and hold F4 for five seconds when the
security screen appears. The code for that level will appear.
Lock all : 0
Lock program: 0
Lock config: 0
Exit Edit
Noise rejection
Main sensor cal
Security
Exit Enter
45
Page 52

46
MODEL 54eA SECTION 5.0
SOFTWARE CONFIGURATION
5.14 CONTROLLER MODE PRIORITY
The Model 54eA controller can function in different
modes depending on both how it is configured, what
process conditions exist, and actions an operator may
have made. To reconcile these possible modes, there is
a set priority that determines exactly what will happen to
the two (2) current outputs and the four (4) alarm relays
in the event of multiple modes occurring at the same
time. See Table 5-2 below.
Priority is in the following order (from lowest to highest):
normal, fault, timer, hold, feed limit, test. Each output or
relay acts as if it is only in the state of highest priority.
NOTE
Some of these features may not be in use in the controller.
TABLE 5-2. Controller Mode Priority Chart
1
Indicates the state IF that item has been configured or selected (i.e. if it is an interval timer or a feed limit
timer or it is the one being tested). Unconfigured or unselected items are not affected by that mode.
Condition Definitions:
1. Normal refers to conditions when no other mode is present.
2. Fault means the instrument has diagnosed a fault condition. A fault message is displayed and the red LED
is on.
3. Interval Timer means the timer sequence is occurring.
4. Hold Mode occurs when hold is activated by the operator (i.e. during calibration).
5. Feed Limit occurs when a feed limit timer has reached its limit and is turned off after being on for too long.
6. Simulate tests are described in Section 5.4.
Action Definitions:
1. Normal is determined by process conditions or how the item has been configured (Section 5.6)
2. Open is a deenergized alarm relay (alarm off).
3. Default is the setting configured for each item if there is a fault. (Section 5.6)
4. Closed is an energized alarm relay (alarm on).
5. Hold is the setting for the current output configured in Section 5.5 (fixed mA value or the last normal value).
6. Prior is the state the alarm had before that mode occurred.
7. Test is the value input by the operator (mA for current, on or off for a relay).
Condition Priority Current Current Alarm Alarm Alarm Alarm
Output 1 Output 2 Relay 1 Relay 2 Relay 3 Relay 4
Normal 1 Normal Normal Normal Normal Normal Open
Fault 2 Default Default Default Default Default Closed
Interval Timer 3 Hold Hold Default/ Default/ Default/ Prior
Normal
1
Normal
1
Normal
1
Hold Mode 4 Hold Hold
Default Default Default Prior
Feed Limit 5 Normal Normal Open
1
Open
1
Open
1
Closed
Simulate tests 6 Test
1
Test
1
Test
1
Test
1
Test
1
Test
1
Page 53

47
MODEL 54eA SECTION 6.0
CALIBRATION - TEMPERATURE
SECTION 6.0
CALIBRATION - TEMPERATURE
6.1 INTRODUCTION
All four amperometric sensors (oxygen, ozone, free chlorine, total chlorine, and monochloramine) are membranecovered sensors. As the sensor operates, the analyte (the substance to be determined) diffuses through the membrane and is consumed at an electrode immediately behind the membrane. The reaction produces a current that
depends on the rate at which the analyte diffuses through the membrane. The diffusion rate, in turn, depends on the
concentration of the analyte and how easily it passes through the membrane (the membrane permeability). Because
the membrane permeability is a function of temperature, the sensor current will change if the temperature changes.
To correct for changes in sensor current caused by temperature, the controller automatically applies a membrane
permeability correction. Although the membrane permeability is different for each sensor, the change is about 3%/°C
at 25°C, so a 1°C error in temperature produces about a 3% error in the reading.
Temperature plays an additional role in oxygen measurements. Oxygen sensors are calibrated by exposing them
to water-saturated air, which, from the point of view of the sensor, is equivalent to water saturated with atmospheric
oxygen (see Section 7.0 for more information). During calibration, the controller calculates the solubility of atmospheric oxygen in water using the following steps. First, the controller measures the temperature. From the temperature, the controller calculates the vapor pressure of water and, using the barometric pressure, calculates the
partial pressure of atmospheric oxygen. Once the controller knows the partial pressure, it calculates the equilibrium solubility of oxygen in water using a temperature-dependent factor called the Bunsen coefficient. Overall, a 1°C
error in the temperature measurement produces about a 2% error in the solubility calculated during calibration and
about the same error in subsequent measurements.
Temperature is also important in the pH measurement required to correct free chlorine readings.
1. The controller uses a temperature dependent factor to convert measured cell voltage to pH. Normally, a slight
inaccuracy in the temperature reading is unimportant unless the pH reading is significantly different from 7.00.
Even then, the error is small. For example, at pH 12 and 25°C, a 1°C error produces a pH error less than ±0.02.
2. During auto calibration, the controller recognizes the buffer being used and calculates the actual pH of the
buffer at the measured temperature. Because the pH of most buffers changes only slightly with temperature,
reasonable errors in temperature do not produce large errors in the buffer pH. For example, a 1°C error causes at most an error of ±0.03 in the calculated buffer pH.
Without calibration the accuracy of the temperature measurement is about ±0.4°C. Calibrate the controller if
1. ±0.4°C accuracy is not acceptable
2. the temperature measurement is suspected of being in error. Calibrate temperature by making the controller
reading match the temperature measured with a standard thermometer.
Page 54

48
6.2 TEMPERATURE CALIBRATION
MODEL 54eA SECTION 6.0
CALIBRATION - TEMPERATURE
2. From the main display, press any key. With the cursor on “Calibrate,”
press Enter (F4).
NOTE
If Hold was enabled in Section 5.6, the hold screen will appear.
To activate hold, refer to Section 5.6, step 11.
3. Press the ê key twice to move the cursor to “Adjust temperature,”
then press Enter (F4).
4. Press Edit (F4) to adjust the temperature. The screen below will then
appear. Using the arrow keys, enter the correct temperature and
press Save (F4). The controller will enter the value in memory. To
abort the change, press Esc (F3). Press Exit (F1) three times for the
main display.
NOTE
If Hold was activated during calibration, “Hold Mode Activated”
will continue to flash in the main display. Return the sensor to
normal and deactivate Hold. Refer to Section 5.6, step 11.
25.1 °C
Adjust temp : + 025.1 °C
Esc Save
Zero main sensor
Adjust temperature
Output trim
Exit Enter
Place the sensor and a standard thermometer in the process liquid.
1. Check the controller temperature reading (main display) to make sure the sensor has stabilized. Compare the
controller temperature with the standard thermometer. The readings should differ by at most 1°C. If the readings differ by a greater amount, refer to Section 15.3. Go to the next step if the reading requires adjustment.
25.1 °C
Adjust temp : 25.1 °C
Exit Edit
Page 55

MODEL 54eA SECTION 7.0
CALIBRATION - DISSOLVED OXYGEN
SECTION 7.0
CALIBRATION - DISSOLVED OXYGEN
7.1 INTRODUCTION
As Figure 7-1 shows, oxygen sensors generate a current directly proportional to the concentration of dissolved
oxygen in the sample. Calibrating the sensor requires exposing it to a solution containing no oxygen (zero standard) and to a solution containing a known amount of oxygen (full-scale standard).
The zero standard is necessary because oxygen sensors, even when no oxygen is present in the sample, generate a small current called the residual current. The analyzer compensates for the residual current by subtracting it
from the measured current before converting the result to a dissolved oxygen value. New sensors require zeroing
before being placed in service, and sensors should be zeroed whenever the electrolyte solution is replaced. The
recommended zero standard is 5% sodium sulfite in water, although oxygen-free nitrogen can also be used.
The Model 499A TrDO sensor, used for the determination of trace (ppb) oxygen levels, has very low residual current and does not normally require zeroing. The residual current in the 499A TrDO sensor is equivalent
to less than 0.5 ppb oxygen.
The purpose of the full-scale standard is to establish the slope of the calibration curve. Because the solubility of
atmospheric oxygen in water as a function of temperature and barometric pressure is well known, the natural
choice for a full-scale standard is air-saturated water. However, air-saturated water is difficult to prepare and use,
so the universal practice is to use air for calibration. From the point of view of the oxygen sensor, air and air-saturated water are identical. The equivalence comes about because the sensor really measures the chemical potential of oxygen. Chemical potential is the force that causes oxygen molecules to diffuse from the sample into the
sensor where they can be measured. It is also the force that causes oxygen molecules in air to dissolve in water
and to continue to dissolve until the water is saturated with oxygen. Once the water is saturated, the chemical
potential of oxygen in the two phases (air and water) is the same.
Oxygen sensors generate a current directly proportional to the rate at which oxygen molecules diffuse through a
membrane stretched over the end of the sensor. The diffusion rate depends on the difference in chemical potential between oxygen in the sensor and oxygen in the sample. An electrochemical reaction, which destroys any oxygen molecules entering the sensor, keeps the concentration (and the chemical potential) of oxygen inside the sensor equal to zero. Therefore, the chemical potential of oxygen in the sample alone determines the diffusion rate
and the sensor current.
When the sensor is calibrated, the chemical potential of oxygen in the standard determines the sensor current.
Whether the sensor is calibrated in air or air-saturated water is immaterial. The chemical potential of oxygen is the
same in either phase. Normally, to make the calculation of solubility in common units (like ppm DO) simpler, it is
convenient to use water-saturated air for calibration.
Automatic air calibration is standard. The user simply exposes the sensor to water-saturated air. The controller
monitors the sensor current. When the current is stable, the controller stores the current and measures the barometric pressure and temperature. The temperature element is part of the dissolved oxygen sensor. The pressure
sensor is inside theanalyzer. From the temperature, the
controller calculates the saturation vapor pressure of
water. Next, it calculates the pressure of dry air by subtracting the vapor pressure from the barometric pressure.
Using the fact that dry air always contains 20.95% oxygen, the analyzer calculates the partial pressure of oxygen. Once the analyzer knows the partial pressure of oxygen, it uses the Bunsen coefficient to calculate the equilibrium solubility of atmospheric oxygen in water at the
prevailing temperature. At 25°C and 760 mm Hg, the
equilibrium solubility is 8.24 ppm.
Often it is too difficult or messy to remove the sensor from
the process liquid for calibration. In this case, the sensor
can be calibrated against a measurement made with a
portable laboratory instrument. The laboratory instrument
typically uses a membrane-covered amperometric sensor
that has been calibrated against water-saturated air.
FIGURE 7-1. Sensor Current as a Function of
Dissolved Oxygen Concentration
49
Page 56

50
1. Place the sensor in a fresh solution of 5% sodium sulfite (Na2SO3) in water. Be sure air bubbles are not
trapped against the membrane. The current will drop rapidly at first and then gradually reach a stable zero
value. To monitor the sensor current, go to the main display. Press any key to obtain the main menu. Press
the ê key once to highlight “Diagnostic variables.” Press Enter (F4). The sensor current is the second item in
the display. Note the units: nA is nanoamps, μA is microamps. To return to the main display, press exit (F1)
twice.The table gives typical zero currents for Rosemount Analytical sensors.
A new sensor or a sensor in which the electrolyte solution has been replaced may require several hours (occasionally as long as overnight) to reach a minimum current. DO NOT START THE ZERO ROUTINE UNTIL THE
SENSOR HAS BEEN IN ZERO SOLUTION FOR AT LEAST TWO HOURS.
Sensor Zero current (nA)
499ADO <50 nA
499A TrDO <5 nA
Hx438 and Gx448 <1 nA
The Model 499A TrDO does not normally require zeroing.
7.2 ZEROING THE SENSOR
MODEL 54eA SECTION 7.0
CALIBRATION - DISSOLVED OXYGEN
Calibrate main sensor
Zero main sensor
Adjust temperature
Exit Enter
0.0 ppm
Sensor must be in zero
solution
Abort Cont
2. From the main display, press any key to obtain the main menu.
With the cursor on “Calibrate,” press Enter (F4).
NOTE
If Hold was enabled in Section 5.6, the hold screen will appear.
To activate hold, refer to Section 5.6, step 11.
3. Press the ê key once to move the cursor to “Zero main sensor.”
Press Enter (F4).
4. The screen at left appears. Press Cont (F3). “Wait” flashes until the
sensor is stabilized. Once the zero step is complete, the message
“Sensor zero done” appears.
5. Press Exit (F1) three times to return to the main display.
NOTE
If Hold was activated during calibration, “Hold Mode Activated”
will continue to flash in the main display. Return the sensor to
normal and deactivate Hold. Refer to Section 5.6, step 11.
NOTE
During calibration, ERROR and WARNING messages may appear. If an ERROR message appears, press
Exit (F1) to leave and return to the previous screen. If a WARNING message appears, press Cont (F3) to
continue the calibration or press Abort (F1) to leave. Continuing the calibration after a warning message
appears may cause substantial errors in the subsequent measurement. Refer to Section 15.4 for assistance.
Page 57

1. Remove the sensor from the process liquid. Use a soft tissue and a stream of water from a wash bottle to clean
the membrane. Blot dry. The membrane must be dry during air calibration.
2. Pour some water in a beaker and suspend the sensor with the membrane about 0.5 inch (1 cm) above the
water surface. To avoid drift caused by temperature changes, keep the sensor out of the direct sun.
3. Monitor the dissolved oxygen reading and the temperature. Once readings have stopped drifting, begin the
calibration. It may take 5 - 10 minutes for the sensor reading in air to stabilize. Stabilization time may be even
longer if the process temperature is appreciably different from the air temperature. For an accurate calibration,
temperature measured by the sensor must be stable.
7.3 CALIBRATING THE SENSOR IN AIR
MODEL 54eA SECTION 7.0
CALIBRATION - DISSOLVED OXYGEN
4. From the main display, press any key to obtain the main menu. With the
cursor on “Calibrate,” press Enter (F4).
NOTE
If Hold was enabled in Section 5.6, the hold screen will appear. To
activate hold, refer to Section 5.6, step 11.
Press Enter (F4). The screen shown in step 5 appears.
5. Press Enter (F4) to select “Calibrate in air.”
6. This screen shows the barometric pressure and temperature that will
be used for the calibration. If the barometric pressure or temperature is
incorrect, press Abort (F1). Refer to Section 7.5 for the pressure calibration procedure. Refer to Section 6.2 for the temperature calibration
procedure.
NOTE
The barometric pressure sensor is inside the controller enclosure.
When cable glands are in place and the front panel is tightly closed,
the enclosure is moderately airtight. Therefore, as the controller
heats or cools, the pressure of the air trapped inside the enclosure
may be different from ambient. Opening the front panel will equalize the pressure.
7. Press Cont (F3). “Wait” flashes until the sensor is stabilized. Once air
calibration is complete, the message “Air calibration done” appears.
The display will show the equilibrium solubility of atmospheric oxygen
in water at the prevailing temperature and pressure.
procedure continued on next page . . .
Calibrate main sensor
Zero main sensor
Adjust temperature
Exit Enter
Calibrate in air
Calibrate in process
Barometric pressure
Exit Enter
Bar press : 760 mmHg
Temperature: 25.0°C
Press F3 to air cal
Abort Cont
8.20 ppm
Stabilizing . . . Wait
Abort Cont
51
Page 58

52
MODEL 54eA SECTION 7.0
CALIBRATION - DISSOLVED OXYGEN
9. During calibration, the analyzer stores the measured current and calculates the sensitivity. Sensitivity is the sensor current in nA divided by
the saturation concentration of oxygen in ppm. The table gives typical
sensitivity for Rosemount Analytical dissolved oxygen sensors.
To view the sensitivity from the main display, press any key to enter the
main menu. Press the ê key once. Then press Enter (F4) to display the
diagnostic variables. The sensitivity is the third line on the screen. Note
the units: nA is nanoamps, μA is microamps.
Sensor Current in air at 25°C Sensitivity (nA/ppm)
499ADO 15-25 μA 1,800-3,100
499A Tr DO 30-50 μA 3,600-6,100
Hx438 and Gx448 40-80 nA 4.8-9.8
NOTE
During calibration, ERROR and WARNING messages may appear. If an ERROR message appears, press
Exit (F1) to leave and return to the previous screen. If a WARNING message appears, press Cont (F3) to
continue the calibration or press Abort (F1) to leave. Continuing the calibration after a warning message
appears may cause substantial errors in the subsequent measurement. Refer to Section 15.4 for assistance.
8. Press Exit (F1) four times to return to the main display.
NOTE
If Hold was activated during calibration, “Hold Mode Activated” will
continue to flash in the main display. Return the sensor to normal
and deactivate Hold. Refer to Section 5.6, step 11.
Page 59

The analyzer and sensor can be calibrated against a standard instrument. For oxygen sensors installed in aeration basins in waste treatment plants, calibration against a second instrument is often preferred. For an accurate
calibration be sure that…
1. The standard instrument has been zeroed and calibrated against water-saturated air following the manufacturer's instructions.
2. The standard sensor is immersed in the liquid as close to the process sensor as possible.
3. Adequate time is allowed for the standard sensor to stabilize before calibrating the process instrument.
7.4 CALIBRATING THE SENSOR AGAINST A STANDARD INSTRUMENT
MODEL 54eA SECTION 7.0
CALIBRATION - DISSOLVED OXYGEN
4. From the main display, press any key to obtain the main menu. With
the cursor on “Calibrate,” press Enter (F4).
NOTE
If Hold was enabled in Section 5.6, the hold screen will appear.
To activate hold, refer to Section 5.6, step 11.
Press Enter (F4).
5. The screen at left appears. Press the ê key once to move the cursor
to “Calibrate in process.” Then, press Enter (F4).
6. Press Cont (F3). “Wait” flashes until the sensor is stabilized.
If the controller appears locked, the reading is not stable enough.
Increase the amount the concentration is permitted to vary or
decrease the stabilization time. See Section 5.11. Repeat the calibration. To proceed with the calibration as is, press Cont (F3).
7. Once the reading is stable, the screen at left appears. Press Edit
(F4). Use the arrow keys to change the concentration in the second
line of the display to the desired value. Press Save (F4) to store the
value.
8. Press Exit (F1) four times to return to the main display.
NOTE
If Hold was activated during calibration, “Hold Mode Activated”
will continue to flash in the main display. Return the sensor to
normal and deactivate Hold. Refer to Section 5.6, step 11.
Calibrate main sensor
Zero main sensor
Adjust temperature
Exit Enter
Calibrate in air
Calibrate in process
Barometric pressure
Exit Enter
8.32 ppm
Stabilizing . . . Wait
Abort Cont
8.32 ppm
Calibrate : 8.32 ppm
Exit Edit
53
Page 60

54
1. If the barometric pressure measured by the controller does not agree with the local barometric pressure, calibrate the pressure sensor. A pressure error of 3 mm Hg introduces an error of about 0.5% in the final measurement. When calibrating the pressure reading, be sure to use the actual barometric pressure. Weather forecasters and airports usually report barometric pressure corrected to sea level; they do not report the acutal
pressure. It is good practice to open the enclosure door before starting a barometric pressure calibration.
When gland fittings are used, the controller enclosure is moderately airtight. As the controller enclosure heats
or cools, the pressure of the air trapped inside the enclosure may be as much as 5% different from ambient
pressure.
7.5 CALIBRATING BAROMETRIC PRESSURE
MODEL 54eA SECTION 7.0
CALIBRATION - DISSOLVED OXYGEN
2. From the main display, press any key. With the cursor on “Calibrate,”
press Enter (F4).
3. Press Enter (F4) to select “Calibrate main sensor.”
4. Press the ê key twice to move the cursor to “Barometric pressure.”
Press Enter (F4).
5. Press Edit (F4). Use the arrow keys to change the pressure reading
to the desired value. Press Save (F4) to store the value.
6. Press Exit (F1) four times to return to the main display.
Calibrate main sensor
Zero main sensor
Adjust temperature
Exit Enter
Calibrate in air
Calibrate in process
Barometric pressure
Exit Enter
763 mm Hg
Standardize : 760
Exit Edit
Page 61

MODEL 54eA SECTION 8.0
CALIBRATION - FREE CHLORINE (499ACL-01)
SECTION 8.0
CALIBRATION - FREE CHLORINE (499ACL-01)
8.1 INTRODUCTION
This section covers the calibration of the 499ACL-01 free chlorine sensor. See section 9.0 for calibration of the
498CL-01 pH-independent free chlorine sensor.
As Figure 8-1 shows, a free chlorine sensor generates a current directly proportional to the concentration of free
chlorine in the sample. Calibrating the sensor requires exposing it to a solution containing no chlorine (zero standard) and to a solution containing a known amount of chlorine (full-scale standard).
The zero standard is necessary because chlorine sensors, even when no chlorine is in the sample, generate a
small current called the residual current. The controller compensates for the residual current by subtracting it from
the measured current before converting the result to a chlorine value. New sensors require zeroing before being
placed in service, and sensors should be zeroed whenever the electrolyte solution is replaced. Either of the following makes a good zero standard:
• Deionized water containing about 500 ppm sodium chloride. Dissolve 0.5 grams (1/8 teaspoonful) of table
salt in 1 liter of water. DO NOT USE DEIONIZED WATER ALONE FOR ZEROING THE SENSOR. THE
CONDUCTIVITY OF THE ZERO WATER MUST BE GREATER THAN 50 μS/cm.
• Tap water known to contain no chlorine. Expose tap water to bright sunlight for at least 24 hours.
The purpose of the full-scale standard is to establish the slope of the calibration curve. Because stable chlorine
standards do not exist, the sensor must be calibrated against a test run on a grab sample of the process liq-
uid. Several manufacturers offer portable test kits for this purpose. Observe the following precautions when taking and testing the grab sample.
• Take the grab sample from a point as close to the sensor as possible. Be sure that taking the sample does
not alter the flow of the sample to the sensor. It is best to install the sample tap just downstream from the
sensor.
• Chlorine solutions are unstable. Run the test immediately after taking the sample. Try to calibrate the sensor when the chlorine concentration is at the upper end of the normal operating range.
Free chlorine measurements made with the 499ACL-01 sensor also require a pH correction. Free chlorine is the sum of
hypochlorous acid (HOCl) and hyprochlorite ion (OCl-). The relative amount of each depends on the pH. As pH increases, the concentration of HOCl decreases and the concentration of OCl-increases. Because the sensor responds only
to HOCl, a pH correction is necessary to properly convert the sensor current into a free chlorine reading.
The controller uses both automatic and manual pH correction. In automatic pH correction, the controller continuously monitors the pH of the solution and corrects the free chlorine reading for changes in pH. In manual pH correction, the controller uses a fixed pH value entered by the user to make the correction. Generally, if the pH
changes more than about 0.2 units over short periods of time, automatic pH correction is best. If the pH is relatively steady or subject only to seasonal changes, manual pH correction is adequate.
During calibration, the controller must know the pH of the sample. If the controller is using automatic pH correc-
tion, the pH sensor (properly calibrated) must be in the process liq-
uid before starting the calibration.
If the controller is using manual pH
correction, be sure to enter the pH
value before starting the calibration.
The Model 499ACL-01 free chlorine
sensor loses sensitivity at high concentrations of chlorine. The 54eA
controller has a dual slope feature
that allows the user to compensate
for the non-linearity of the sensor.
However, for the vast majority of
applications, dual slope calibration
is unnecessary.
FIGURE 8-1. Sensor Current as a Function of Free Chlorine Concentration
55
Page 62

56
1. Place the sensor in the zero standard (see Section 8.1). Be sure no air bubbles are trapped against the membrane. The sensor current will drop rapidly at first and then gradually reach a stable zero value. To monitor the
sensor current, go to the main display. Press any key to obtain the main menu. Press the ê key once to highlight “Diagnostic variables.” Press Enter (F4). The sensor current is the second item in the display. Note the
units: nA is nanoamps, μA is microamps. To return to the main display, press exit (F1) twice. Typical zero current for a free chlorine sensor is -10 to +10 nA.
A new sensor or a sensor in which the electrolyte solution has been replaced may require several hours (occasionally as long as overnight) to reach a minimum zero current. DO NOT START THE ZERO ROUTINE UNTIL
THE SENSOR HAS BEEN IN ZERO SOLUTION FOR AT LEAST TWO HOURS.
8.2 ZEROING THE SENSOR
MODEL 54eA SECTION 8.0
CALIBRATION - FREE CHLORINE (499ACL-01)
Calibrate main sensor
Zero main sensor
Adjust temperature
Exit Enter
0.0 ppm
Sensor must be in zero
solution
Abort Cont
2. From the main display, press any key to obtain the main menu.
With the cursor on “Calibrate,” press Enter (F4).
NOTE
If Hold was enabled in Section 5.6, the hold screen will appear.
To activate hold, refer to Section 5.6, step 11.
Press the ê key once to move the cursor to “Zero main sensor.”
Press Enter (F4).
3. The screen at left appears. Press Cont (F3). “Wait” flashes until the
sensor is stabilized. Once the zero step is complete, the message
“Sensor zero done” appears.
4. Press Exit (F1) three times to return to the main display.
NOTE
If Hold was activated during calibration, “Hold Mode Activated”
will continue to flash in the main display. Return the sensor to
normal and deactivate Hold. Refer to Section 5.6, step 11.
NOTE
During calibration, ERROR and WARNING messages may appear. If an ERROR message appears, press
Exit (F1) to leave and return to the previous screen. If a WARNING message appears, press Cont (F3) to
continue the calibration or press Abort (F1) to leave. Continuing the calibration after a warning message
appears may cause substantial errors in the subsequent measurement. Refer to Section 15.5 for assistance.
Page 63

1. Place the sensor in the process liquid. If automatic pH correction is being used, calibrate the pH sensor (see Section 11.0)
and place it in the process liquid. If manual pH correction is being used, measure the pH of the process liquid and enter
the value. See Section 5.8. Adjust the sample flow until it is within the range recommended for the chlorine sensor. Refer
to the sensor instruction sheet.
2. Adjust the chlorine concentration until it is near the upper end of the control range. Wait until the controller reading is stable before starting the calibration.
8.3 FULL SCALE CALIBRATION
MODEL 54eA SECTION 8.0
CALIBRATION - FREE CHLORINE (499ACL-01)
1.100 ppm
Stabilizing . . . Wait
Abort Cont
1.100 ppm
Calibrate : 1.100 ppm
Exit Edit
Calibrate main sensor
Zero main sensor
Adjust temperature
Exit Enter
3. From the main display, press any key to obtain the main menu. With the
cursor on “Calibrate,” press Enter (F4).
NOTE
If Hold was enabled in Section 5.6, the hold screen will appear. To activate hold, refer to Section 5.6, step 11.
Press Enter (F4).
4. Press Cont (F3). “Wait” flashes until the sensor is stabilized.
If the controller appears locked, the reading is not stable enough. Wait until
the process readings are stable before starting the calibration.
Alternatively, increase the stability concentration or reduce the stability
time. See Section 5.11. Calibrating while readings are unstable may substantially reduce accuracy.
5. Once the reading is stable, the screen at left appears. Sample the process
liquid. Make a note of the reading before taking the sample. Immediately
determine free chlorine. Note the controller reading again. If the present
reading (X) differs from the reading when the sample was taken (Y), calculate the value to enter (C) from the following formula:
C = (X/Y) (A)
where A is the concentration of chlorine measured in the grab sample.
Press Edit (F4). Use the arrow keys to change the concentration in the sec-
ond line of the display to the desired value. Press Save (F4) to store the value.
6. Press Exit (F1) four times to return to the main display.
NOTE
If Hold was activated during calibration, “Hold Mode Activated” will
continue to flash in the main display. Return the sensor to normal and
deactivate Hold. Refer to Section 5.6, step 11.
7. During the calibration, the analyzer stores the measured current and calculates the sensitivity. Sensitivity is the sensor current in nA divided by the
measured concentration. The sensitivity of the 499ACL-01 (free chlorine)
sensor is 250-350 nA/ppm at 25°C and pH 7.
To view the sensitivity from the main display, press any key to enter the
main menu. Press the ê key once. Then press Enter (F4) to display the
diagnostic variables. The sensitivity is the third line on the screen. Note the
units: nA is nanoamps, μA is microamps.
NOTE
During calibration, ERROR and WARNING messages may appear. If an ERROR message appears, press Exit (F1)
to leave and return to the previous screen. If a WARNING message appears, press Cont (F3) to continue the calibration or press Abort (F1) to leave. Continuing the calibration after a warning message appears may cause substantial errors in the subsequent measurement. Refer to Section 15.5 for assistance.
57
Page 64

58
MODEL 54eA SECTION 8.0
CALIBRATION - FREE CHLORINE (499ACL-01)
Figure 8-2 shows the principle of dual slope calibration. Between zero and concentration C1, the
sensor response is linear. When the concentration
of chlorine becomes greater than C1, the response
is non-linear. In spite of the non-linearity, the
response can be approximated by a straight line
between point 1 and point 2.
Dual slope calibration is rarely needed. It is probably useful in fewer than 5% of applications.
1. Be sure the analyzer has been configured for
dual slope calibration. See Section 5.11.
2. Zero the sensor. See Section 8.2.
3. Place the sensor in the process liquid. If automatic pH correction is being used, calibrate the
pH sensor (see Section 12.0) and place it in
the process liquid. If manual pH correction is
being used, measure the pH of the process liquid and enter the value. See Section 5.8. Adjust the sample flow
until it is within the range recommended for the chlorine sensor. Refer to the sensor instruction sheet.
8.4 DUAL SLOPE CALIBRATION
FIGURE 8-2. Dual Slope Calibration
Adjust temperature
Dual range cal
Output trim
Exit Enter
4. From the main display, press any key to obtain the main menu.
With the cursor on “Calibrate,” press Enter (F4).
NOTE
If Hold was enabled in Section 5.6, the hold screen will appear.
To activate hold, refer to Section 5.6, step 11.
Press the ê key three times to move the cursor to “Dual range cal.”
Press Enter (F4).
5. Adjust the concentration of chlorine in the process until it is near the
upper end of the linear response range of the sensor, i.e., concentration near C1 as shown in Figure 8-2.
6. Press Cont (F3). “Wait” flashes until the sensor is stabilized.
If the controller appears locked, the reading is not stable enough.
Wait until the process readings are stable before starting the calibration.
2.000 ppm
Calibrate low point
Abort Cont
2.000 ppm
Stabilizing . . . Wait
Abort Cont
Page 65

MODEL 54eA SECTION 8.0
CALIBRATION - FREE CHLORINE (499 ACL-01+3.)
7. Once the reading is stable, the screen at left appears.
Sample the process liquid. Make a note of the reading before taking
the sample. Immediately determine free chlorine. Note the controller
reading again. If the present reading (X) differs from the reading
when the sample was taken (Y), calculate the value to enter (C) from
the following formula:
C = (X/Y) (A)
where A is the concentration of chlorine measured in the grab sample.
Press Edit (F4). Use the arrow keys to change the concentration in
the second line of the display to the desired value. Press Save (F4)
to store the value.
8. Press High (F3). Adjust the concentration of chlorine in the process
until it is near the top end of the range, i.e., concentration near C2
as shown in Figure 6-2.
9. Press Cont (F3). “Wait” flashes until the sensor is stabilized.
10. Once the reading is stable, the screen at left appears. Following the
procedure in step 7, determine chlorine in a sample of the process
liquid.
Press Edit (F4). Use the arrow keys to change the concentration in
the second line of the display to the desired value. Press Save (F4)
to store the value.
11. Press Exit (F1) three times to return to the main display.
NOTE
If Hold was activated during calibration, “Hold Mode Activated”
will continue to flash in the main display. Return the sensor to
normal and deactivate Hold. Refer to Section 5.6, step 11.
6.000 ppm
Stabilizing . . . Wait
Abort Cont
2.000 ppm
Low point : 2.000 ppm
Exit High Edit
2.000 ppm
Calibrate high point
Abort Cont
6.000 ppm
High point : 6.000 ppm
Exit High Edit
NOTE
During calibration, ERROR and WARNING messages may appear. If an ERROR message appears, press
Exit (F1) to leave and return to the previous screen. If a WARNING message appears, press Cont (F3) to
continue the calibration or press Abort (F1) to leave. Continuing the calibration after a warning message
appears may cause substantial errors in the subsequent measurement. Refer to Section 15.5 for assistance.
59
Page 66

60
MODEL 54eA SECTION 9.0
CALIBRATION - FREE CHLORINE (498CL-01)
SECTION 9.0
CALIBRATION - FREE CHLORINE (498CL-01)
9.1 INTRODUCTION
This section covers the calibration of the 498CL-01 pH-independent free chlorine sensor only. See section 8.0 for
calibration of the 499ACL-01 sensor.
As Figure 9-1 shows, a free chlorine sensor generates a current directly proportional to the concentration of free
chlorine in the sample. Calibrating the sensor requires exposing it to a solution containing no chlorine (zero standard) and to a solution containing a known amount of chlorine (full-scale standard).
The zero standard is necessary because chlorine sensors, even when no chlorine is in the sample, generate a
small current called the residual current. The controller compensates for the residual current by subtracting it from
the measured current before converting the result to a chlorine value. New sensors require zeroing before being
placed in service, and sensors should be zeroed whenever the electrolyte solution is replaced. Either of the following makes a good zero standard:
• Deionized water.
• Tap water known to contain no chlorine. Expose tap water to bright sunlight for at least 24 hours.
The purpose of the full-scale standard is to establish the slope of the calibration curve. Because stable chlorine
standards do not exist, the sensor must be calibrated against a test run on a grab sample of the process liq-
uid. Several manufacturers offer portable test kits for this purpose. Observe the following precautions when taking and testing the grab sample.
• Take the grab sample from a point as close to the sensor as possible. Be sure that taking the sample does
not alter the flow of the sample to the sensor. It is best to install the sample tap just downstream from the
sensor.
• Chlorine solutions are unstable. Run the test immediately after taking the sample. Try to calibrate the sensor when the chlorine concentration is at the upper end of the normal operating range.
The Model 498CL-01 free chlorine sensor loses sensitivity at high concentrations of chlorine. The 54eA controller
has a dual slope feature that allows the user to compensate for the non-linearity of the sensor. However, for the
vast majority of applications, dual slope calibration is unnecessary.
FIGURE 9-1. Sensor Current as a Function of Free Chlorine Concentration
Page 67

MODEL 54eA SECTION 9.0
CALIBRATION - FREE CHLORINE (498CL-01)
61
1. BEFORE ZEROING THE SENSOR, PLACE IT IN THE FLOW CELL AND ALLOW THE SENSOR TO OPER-
ATE IN A FLOWING CHLORINATED SAMPLE FOR AT LEAST TWO HOURS.
2. After two hours, remove the sensor from the flow cell and place it in the zero standard. See Section 9.1 for
suggested zero standards. Be sure no air bubbles are trapped against the membrane. The sensor current will
drop rapidly at first and then gradually reach a stable zero value. To monitor the sensor current go to the main
display and press any key to obtain the main menu. Press the ê key once to highlight “Diagnostic variables.’
Press Enter (F4). The sensor current is the second item in the display. Note the units: nA is nanoamps, uA is
microamps. To return to the main display, press exit (F1) twice. Typical zero current for the 498CL-01 sensor
is between 30 and 80 nA. DO NOT ALLOW THE SENSOR TO STAND IN THE ZERO SOLUTION FOR MORE
THAN 45 MINUTES. IF THE SENSOR SITS IN A NON-FLOWING SENSOR FOR TOO LONG, COPPER
IONS FROM THE CORROSION OF THE COPPER ELECTRODE MAY DAMAGE THE SENSOR.
9.2 ZEROING THE SENSOR
Calibrate main sensor
Zero main sensor
Adjust temperature
Exit Enter
0.0 ppm
Sensor must be in zero
solution
Abort Cont
3. From the main display, press any key to obtain the main menu.
With the cursor on “Calibrate,” press Enter (F4).
NOTE
If Hold was enabled in Section 5.6, the hold screen will appear.
To activate hold, refer to Section 5.6, step 11.
Press the ê key once to move the cursor to “Zero main sensor.”
Press Enter (F4).
4. The screen at left appears. Press Cont (F3). “Wait” flashes until the
sensor is stabilized. Once the zero step is complete, the message
“Sensor zero done” appears.
5. Press Exit (F1) three times to return to the main display.
NOTE
If Hold was activated during calibration, “Hold Mode Activated”
will continue to flash in the main display. Return the sensor to
normal and deactivate Hold. Refer to Section 5.6, step 11.
NOTE
During calibration, ERROR and WARNING messages may appear. If an ERROR message appears, press
Exit (F1) to leave and return to the previous screen. If a WARNING message appears, press Cont (F3) to
continue the calibration or press Abort (F1) to leave. Continuing the calibration after a warning message
appears may cause substantial errors in the subsequent measurement. Refer to Section 16.5 for assistance.
Page 68

MODEL 54eA SECTION 9.0
CALIBRATION - FREE CHLORINE (498CL-01)
1. Place the sensor in the process liquid. Be sure the controller has been programmed for manual pH correction and the pH
is 7.00. Adjust the sample flow until it is in the range recommended for the sensor. Refer to the sensor instructions sheet.
2. Adjust the chlorine concentration until it is near the upper end of the control range. Wait until the controller reading is stable before starting the calibration.
9.3 FULL SCALE CALIBRATION
1.100 ppm
Stabilizing . . . Wait
Abort Cont
1.100 ppm
Calibrate : 1.100 ppm
Exit Edit
Calibrate main sensor
Zero main sensor
Adjust temperature
Exit Enter
3. From the main display, press any key to obtain the main menu. With the
cursor on “Calibrate,” press Enter (F4).
NOTE
If Hold was enabled in Section 5.6, the hold screen will appear. To activate hold, refer to Section 5.6, step 11.
Press Enter (F4).
4. Press Cont (F3). “Wait” flashes until the sensor is stabilized.
If the controller appears locked, the reading is not stable enough. Wait until
the process readings are stable before starting the calibration.
Alternatively, increase the stability concentration or reduce the stability
time. See Section 5.11. Calibrating while readings are unstable may substantially reduce accuracy.
5. Once the reading is stable, the screen at left appears. Sample the process
liquid. Make a note of the reading before taking the sample. Immediately
determine free chlorine. Note the controller reading again. If the present
reading (X) differs from the reading when the sample was taken (Y), calculate the value to enter (C) from the following formula:
C = (X/Y) (A)
where A is the concentration of chlorine measured in the grab sample.
Press Edit (F4). Use the arrow keys to change the concentration in the sec-
ond line of the display to the desired value. Press Save (F4) to store the value.
6. Press Exit (F1) four times to return to the main display.
NOTE
If Hold was activated during calibration, “Hold Mode Activated” will
continue to flash in the main display. Return the sensor to normal and
deactivate Hold. Refer to Section 5.6, step 11.
7. During the calibration, the analyzer stores the measured current and calculates the sensitivity. Sensitivity is the sensor current in nA divided by the
measured concentration. The sensitivity of the 498CL-01 (free chlorine)
sensor is 400-1000 nA/ppm.
To view the sensitivity from the main display, press any key to enter the
main menu. Press the ê key once. Then press Enter (F4) to display the
diagnostic variables. The sensitivity is the third line on the screen. Note the
units: nA is nanoamps, μA is microamps.
NOTE
During calibration, ERROR and WARNING messages may appear. If an ERROR message appears, press Exit (F1)
to leave and return to the previous screen. If a WARNING message appears, press Cont (F3) to continue the calibration or press Abort (F1) to leave. Continuing the calibration after a warning message appears may cause substantial errors in the subsequent measurement. Refer to Section 16.5 for assistance.
62
Page 69

MODEL 54eA SECTION 9.0
CALIBRATION - FREE CHLORINE (498CL-01)
63
Figure 9-2 shows the principle of dual slope calibration. Between zero and concentration C1, the
sensor response is linear. When the concentration
of chlorine becomes greater than C1, the response
is non-linear. In spite of the non-linearity, the
response can be approximated by a straight line
between point 1 and point 2.
Dual slope calibration is rarely needed. It is probably useful in fewer than 5% of applications.
1. Be sure the analyzer has been configured for
dual slope calibration. See Section 5.11.
2. Zero the sensor. See Section 9.2.
3. Place the sensor in the process liquid. Be
sure the pH compensation is set to manual
and the pH value is 7.00. See Secton 5.8.
Adjust the sample flow until it is within the
range recommended for the sensor. Refer to the sensor instruction sheet.
9.4 DUAL SLOPE CALIBRATION
FIGURE 8-2. Dual Slope Calibration
Adjust temperature
Dual range cal
Output trim
Exit Enter
4. From the main display, press any key to obtain the main menu.
With the cursor on “Calibrate,” press Enter (F4).
NOTE
If Hold was enabled in Section 5.6, the hold screen will appear.
To activate hold, refer to Section 5.6, step 11.
Press the ê key three times to move the cursor to “Dual range cal.”
Press Enter (F4).
5. Adjust the concentration of chlorine in the process until it is near the
upper end of the linear response range of the sensor, i.e., concentration near C1 as shown in Figure 9-2.
6. Press Cont (F3). “Wait” flashes until the sensor is stabilized.
If the controller appears locked, the reading is not stable enough.
Wait until the process readings are stable before starting the calibration.
2.000 ppm
Calibrate low point
Abort Cont
2.000 ppm
Stabilizing . . . Wait
Abort Cont
Page 70

64
MODEL 54eA SECTION 9.0
CALIBRATION - FREE CHLORINE (498CL-01)
7. Once the reading is stable, the screen at left appears.
Sample the process liquid. Make a note of the reading before taking
the sample. Immediately determine free chlorine. Note the controller
reading again. If the present reading (X) differs from the reading
when the sample was taken (Y), calculate the value to enter (C) from
the following formula:
C = (X/Y) (A)
where A is the concentration of chlorine measured in the grab sample.
Press Edit (F4). Use the arrow keys to change the concentration in
the second line of the display to the desired value. Press Save (F4)
to store the value.
8. Press High (F3). Adjust the concentration of chlorine in the process
until it is near the top end of the range, i.e., concentration near C2
as shown in Figure 9-2.
9. Press Cont (F3). “Wait” flashes until the sensor is stabilized.
10. Once the reading is stable, the screen at left appears. Following the
procedure in step 7, determine chlorine in a sample of the process
liquid.
Press Edit (F4). Use the arrow keys to change the concentration in
the second line of the display to the desired value. Press Save (F4)
to store the value.
11. Press Exit (F1) three times to return to the main display.
NOTE
If Hold was activated during calibration, “Hold Mode Activated”
will continue to flash in the main display. Return the sensor to
normal and deactivate Hold. Refer to Section 5.6, step 11.
6.000 ppm
Stabilizing . . . Wait
Abort Cont
2.000 ppm
Low point : 2.000 ppm
Exit High Edit
2.000 ppm
Calibrate high point
Abort Cont
6.000 ppm
High point : 6.000 ppm
Exit High Edit
NOTE
During calibration, ERROR and WARNING messages may appear. If an ERROR message appears, press
Exit (F1) to leave and return to the previous screen. If a WARNING message appears, press Cont (F3) to
continue the calibration or press Abort (F1) to leave. Continuing the calibration after a warning message
appears may cause substantial errors in the subsequent measurement. Refer to Section 16.5 for assistance.
Page 71

MODEL 54eA SECTION 10.0
CALIBRATION - TOTAL CHLORINE
SECTION 10.0
CALIBRATION - TOTAL CHLORINE
See TCL manual for calibration procedure.
65
Page 72

This page intentionally left blank.
66
Page 73

MODEL 54eA SECTION 11.0
CALIBRATION - MONOCHLORAMINE
SECTION 11.0
CALIBRATION - MONOCHLORAMINE
67
11.1 INTRODUCTION
As Figure 11-1 shows, a monochloramine sensor generates a current directly proportional to the concentration of
monochloramine in the sample. Calibrating the sensor requires exposing it to a solution containing no monochloramine (zero standard) and to a solution containing a known amount of monochloramine (full-scale standard).
The zero standard is necessary because monochloramine sensors, even when no monochloramine is in the
sample, generate a small current called the residual or zero current. The analyzer compensates for the residual current by subtracting it from the measured current before converting the result to a monochloramine value.
New sensors require zeroing before being placed in service, and sensors should be zeroed whenever the electrolyte solution is replaced. The best zero standard is deionized water.
The purpose of the full-scale standard is to establish the slope of the calibration curve. Because stable monochloramine standards do not exist, the sensor must be calibrated against a test run on a grab sample of the
process liquid. Several manufacturers offer portable test kits for this purpose. Observe the following precautions
when taking and testing the grab sample.
• Take the grab sample from a point as close to the sensor as possible. Be sure that taking the sample does not
alter the flow of the sample to the sensor. It is best to install the sample tap just downstream from the sensor.
• Monochloramine solutions are unstable. Run the test immediately after taking the sample. Try to calibrate
the sensor when the monochloramine concentration is at the upper end of the normal operating range.
FIGURE 11-1. Sensor Current as a Function of Monochloramine Concentration
Page 74

68
MODEL 54eA SECTION 11.0
CALIBRATION - MONOCHLORAMINE
1. Place the sensor in the zero standard. Be sure no air bubbles are trapped against the membrane. The sensor
current will drop rapidly at first and then gradually reach a stable zero value. To monitor the sensor current, go
to the main display. Press any key to obtain the main menu. Press the ê key once to highlight “Diagnostic variables.” Press Enter (F4). The sensor current is the second item in the display. Note the units: nA is nanoamps,
μA is microamps. To return to the main display, press exit (F1) twice. Typical zero current for a monochloramine
sensor is 0 to +20 nA.
A new sensor or a sensor in which the electrolyte solution has been replaced may require several hours (occasionally as long as overnight) to reach a minimum zero current. DO NOT START THE ZERO ROUTINE UNTIL
THE SENSOR HAS BEEN IN ZERO SOLUTION FOR AT LEAST TWO HOURS.
11.2 ZEROING THE SENSOR
Calibrate main sensor
Zero main sensor
Adjust temperature
Exit Enter
0.0 ppm
Sensor must be in zero
solution
Abort Cont
2. From the main display, press any key to obtain the main menu.
With the cursor on “Calibrate,” press Enter (F4).
NOTE
If Hold was enabled in Section 5.6, the hold screen will appear.
To activate hold, refer to Section 5.6, step 11.
Press the ê key once to move the cursor to “Zero main sensor.”
Press Enter (F4).
3. The screen at left appears. Press Cont (F3). “Wait” flashes until the
sensor is stabilized. Once the zero step is complete, the message
“Sensor zero done” appears.
4. Press Exit (F1) three times to return to the main display.
NOTE
If Hold was activated during calibration, “Hold Mode Activated”
will continue to flash in the main display. Return the sensor to
normal and deactivate Hold. Refer to Section 5.6, step 11.
NOTE
During calibration, ERROR and WARNING messages may appear. If an ERROR message appears, press
Exit (F1) to leave and return to the previous screen. If a WARNING message appears, press Cont (F3) to
continue the calibration or press Abort (F1) to leave. Continuing the calibration after a warning message
appears may cause substantial errors in the subsequent measurement. Refer to Section 16.7 for assistance.
Page 75

MODEL 54eA SECTION 11.0
CALIBRATION - MONOCHLORAMINE
1. Place the sensor in the process liquid. Adjust the sample flow until it is within the range recommended for the
sensor. Refer to the sensor instruction sheet.
2. Adjust the monochloramine concentration until it is near the upper end of the control range. Wait until the controller reading is stable before starting the calibration.
11.3 FULL SCALE CALIBRATION
1.100 ppm
Stabilizing . . . Wait
Abort Cont
1.100 ppm
Calibrate : 1.100 ppm
Exit Edit
Calibrate main sensor
Zero main sensor
Adjust temperature
Exit Enter
3. From the main display, press any key to obtain the main menu.
With the cursor on “Calibrate,” press Enter (F4).
NOTE
If Hold was enabled in Section 5.6, the hold screen will appear.
To activate hold, refer to Section 5.6, step 11.
Press Enter (F4).
4. Press Cont (F3). “Wait” flashes until the sensor is stabilized.
If the controller appears locked, the reading is not stable enough.
Wait until the process readings are stable before starting the calibration.
Alternatively, increase the stability concentration or reduce the stability time. See Section 5.11. Calibrating while readings are unstable may substantially reduce accuracy.
5. Once the reading is stable, the screen at left appears. Sample the
process liquid. Make a note of the reading before taking the sample. Immediately determine ozone. Note the controller reading
again. If the present reading (X) differs from the reading when the
sample was taken (Y), calculate the value to enter (C) from the following formula:
C = (X/Y) (A)
where A is the concentration of ozone measured in the grab sample.
Press Edit (F4). Use the arrow keys to change the concentration in
the second line of the display to the desired value. Press Save (F4)
to store the value.
6. Press Exit (F1) four times to return to the main display.
NOTE
If Hold was activated during calibration, “Hold Mode Activated”
will continue to flash in the main display. Return the sensor to
normal and deactivate Hold. Refer to Section 5.6, step 11.
7. During the calibration, the analyzer stores the measured current
and calculates the sensitivity. Sensitivity is the sensor current in nA
divided by the measured concentration. The sensitivity of the
499ACL-03 (monochloramine) sensor is 250-450 nA/ppm at 25°C.
To view the sensitivity from the main display, press any key to enter
the main menu. Press the ê key once. Then press Enter (F4) to
display the diagnostic variables. The sensitivity is the third line on
the screen. Note the units: nA is nanoamps, μA is microamps.
NOTE
During calibration, ERROR and WARNING messages may appear. If an ERROR message appears,
press Exit (F1) to leave and return to the previous screen. If a WARNING message appears, press Cont
(F3) to continue the calibration or press Abort (F1) to leave. Continuing the calibration after a warning
message appears may cause substantial errors in the subsequent measurement. Refer to Section 16.7
for assistance.
69
Page 76

70
MODEL 54eA SECTION 12.0
CALIBRATION - OZONE
SECTION 12.0
CALIBRATION - OZONE
12.1 INTRODUCTION
As Figure 12-1 shows, an ozone sensor generates a current directly proportional to the concentration of ozone in
the sample. Calibrating the sensor requires exposing it to a solution containing no ozone (zero standard) and to a
solution containing a known amount of ozone (full-scale standard).
The zero standard is necessary because ozone sensors, even when no ozone is in the sample, generate a small
current called the residual current. The analyzer compensates for the residual current by subtracting it from the
measured current before converting the result to an ozone value. New sensors require zeroing before being
placed in service, and sensors should be zeroed whenever the electrolyte solution is replaced. Either of the following makes a good zero standard:
• Deionized water.
• Tap water known to contain no ozone. Expose tap water to ozone-free air for several hours.
The purpose of the full-scale standard is to establish the slope of the calibration curve. Because stable ozone standards do not exist, the sensor must be calibrated against a test run on a grab sample of the process liquid.
Several manufacturers offer portable test kits for this purpose. Observe the following precautions when taking and
testing the grab sample.
• Take the grab sample from a point as close to the sensor as possible. Be sure that taking the sample does not
alter the flow of the sample to the sensor. It is best to install the sample tap just downstream from the sensor.
• Ozone solutions are unstable. Run the test immediately after taking the sample. Try to calibrate the sensor
when the ozone concentration is at the upper end of the normal operating range.
FIGURE 12-1. Sensor Current as a Function of Ozone Concentration
Page 77

1. Place the sensor in the zero standard. Be sure no air bubbles are trapped against the membrane. The sensor
current will drop rapidly at first and then gradually reach a stable zero value. To monitor the sensor current, go
to the main display. Press any key to obtain the main menu. Press the ê key once to highlight “Diagnostic variables.” Press Enter (F4). The sensor current is the second item in the display. Note the units: nA is nanoamps,
μA is microamps. To return to the main display, press exit (F1) twice. Typical zero current for an ozone sensor
is -10 to +10 nA.
A new sensor or a sensor in which the electrolyte solution has been replaced may require several hours (occasionally as long as overnight) to reach a minimum zero current. DO NOT START THE ZERO ROUTINE UNTIL
THE SENSOR HAS BEEN IN ZERO SOLUTION FOR AT LEAST TWO HOURS.
12.2 ZEROING THE SENSOR
MODEL 54eA SECTION 12.0
CALIBRATION - OZONE
Calibrate main sensor
Zero main sensor
Adjust temperature
Exit Enter
0.0 ppm
Sensor must be in zero
solution
Abort Cont
2. From the main display, press any key to obtain the main menu.
With the cursor on “Calibrate,” press Enter (F4).
NOTE
If Hold was enabled in Section 5.6, the hold screen will appear.
To activate hold, refer to Section 5.6, step 11.
Press the ê key once to move the cursor to “Zero main sensor.”
Press Enter (F4).
3. The screen at left appears. Press Cont (F3). “Wait” flashes until the
sensor is stabilized. Once the zero step is complete, the message
“Sensor zero done” appears.
4. Press Exit (F1) three times to return to the main display.
NOTE
If Hold was activated during calibration, “Hold Mode Activated”
will continue to flash in the main display. Return the sensor to
normal and deactivate Hold. Refer to Section 5.6, step 11.
NOTE
During calibration, ERROR and WARNING messages may appear. If an ERROR message appears, press
Exit (F1) to leave and return to the previous screen. If a WARNING message appears, press Cont (F3) to
continue the calibration or press Abort (F1) to leave. Continuing the calibration after a warning message
appears may cause substantial errors in the subsequent measurement. Refer to Section 16.8 for assistance.
71
Page 78

72
1. Place the sensor in the process liquid. Adjust the sample flow until it is within the range recommended for the
sensor. Refer to the sensor instruction sheet.
2. Adjust the ozone concentration until it is near the upper end of the control range. Wait until the controller reading is stable before starting the calibration.
12.3 FULL SCALE CALIBRATION
MODEL 54eA SECTION 12.0
CALIBRATION - OZONE
1.100 ppm
Stabilizing . . . Wait
Abort Cont
1.100 ppm
Calibrate : 1.100 ppm
Exit Edit
Calibrate main sensor
Zero main sensor
Adjust temperature
Exit Enter
3. From the main display, press any key to obtain the main menu.
With the cursor on “Calibrate,” press Enter (F4).
NOTE
If Hold was enabled in Section 5.6, the hold screen will appear.
To activate hold, refer to Section 5.6, step 11.
Press Enter (F4).
4. Press Cont (F3). “Wait” flashes until the sensor is stabilized.
If the controller appears locked, the reading is not stable enough.
Wait until the process readings are stable before starting the calibration.
Alternatively, increase the stability concentration or reduce the stability time. See Section 5.11. Calibrating while readings are unstable may substantially reduce accuracy.
5. Once the reading is stable, the screen at left appears. Sample the
process liquid. Make a note of the reading before taking the sample. Immediately determine ozone. Note the controller reading
again. If the present reading (X) differs from the reading when the
sample was taken (Y), calculate the value to enter (C) from the following formula:
C = (X/Y) (A)
where A is the concentration of ozone measured in the grab sample.
Press Edit (F4). Use the arrow keys to change the concentration in
the second line of the display to the desired value. Press Save (F4)
to store the value.
6. Press Exit (F1) four times to return to the main display.
NOTE
If Hold was activated during calibration, “Hold Mode Activated”
will continue to flash in the main display. Return the sensor to
normal and deactivate Hold. Refer to Section 5.6, step 11.
7. During the calibration, the analyzer stores the measured current
and calculates the sensitivity. Sensitivity is the sensor current in nA
divided by the measured concentration. The sensitivity of the
499AOZ (ozone) sensor is about 350 nA/ppm at 25°C.
To view the sensitivity from the main display, press any key to enter
the main menu. Press the ê key once. Then press Enter (F4) to
display the diagnostic variables. The sensitivity is the third line on
the screen. Note the units: nA is nanoamps, μA is microamps.
NOTE
During calibration, ERROR and WARNING messages may appear. If an ERROR message
appears, press Exit (F1) to leave and return to the previous screen. If a WARNING message
appears, press Cont (F3) to continue the calibration or press Abort (F1) to leave. Continuing the
calibration after a warning message appears may cause substantial errors in the subsequent
measurement. Refer to Section 16.8 for assistance.
Page 79

MODEL 54eA SECTION 13.0
CALIBRATION - pH
SECTION 13.0
CALIBRATION - pH
13.1 INTRODUCTION
A new pH sensor must be calibrated before use. Regular recalibration is also necessary.
A pH measurement cell (pH sensor and the solution to be measured) can be pictured as a battery with an extremely high internal resistance. The voltage of the battery depends on the pH of the solution. The pH meter, which is
basically a voltmeter with a very high input impedance, measures the cell voltage and calculates pH using a conversion factor. The actual value of the voltage-to-pH conversion factor depends on the sensitivity of the pH sensing element (and the temperature). The sensing element is a thin, glass membrane at the end of the sensor. As
the glass membrane ages, the sensitivity drops. Regular recalibration corrects for the loss of sensitivity. pH calibration standards, also called buffers, are readily available.
Two-point calibration is standard. Both automatic calibration and manual calibration are available. Auto calibration
avoids common pitfalls and reduces errors. Its use is recommended.
In automatic calibration the controller recognizes the buffer and uses temperature-corrected pH values in the calibration. The table below lists the standard buffers the controller recognizes. The controller also recognizes several technical buffers: Merck, Ingold, and DIN 19267. Temperature-pH data stored in the controller are valid between
at least 0 and 60°C.
pH at 25°C Standard(s)
(nominal pH)
1.68 NIST, DIN 19266, JSI 8802, BSI (see note 1)
3.56 NIST, BSI
3.78 NIST
4.01 NIST, DIN 19266, JSI 8802, BSI
6.86 NIST, DIN 19266, JSI 8802, BSI
7.00 (see note 2)
7.41 NIST
9.18 NIST, DIN 19266, JSI 8802, BSI
10.01 NIST, JSI 8802, BSI
12.45 NIST, DIN 19266
FIGURE 13-1. Calibration Slope and Offset
Note 1: NIST is National Institute of Standards,
DIN is Deutsche Institute für Normung, JSI is
Japan Standards Institute, and BSI is British
Standards Institute.
Note 2: pH 7 buffer is not a standard buffer. It is
a popular commercial buffer in the United
States.
During automatic calibration, the controller also measures
noise and drift and does not accept calibration data until
readings are stable. Calibration data will be accepted as soon
as the pH reading is constant to within the factory-set limits of
0.02 pH units for 10 seconds. The stability settings can be
changed. See Section 5.11.
In manual calibration, the controller still monitors readings for
stability; however, the buffer pH lookup feature is missing.
The user has to enter the correct pH at the temperature the
buffer is being used.
Once the controller completes the calibration, it calculates
the calibration slope and offset. The slope is reported as the
slope at 25°C. Figure 13-1 defines the terms.
The controller can also be standardized. Standardization is
the process of forcing the controller reading to match the
reading from a second pH instrument. Standardization is
sometimes called a one-point calibration.
73
Page 80

74
4.02 pH
Buf1done: 4.00 @25°C
Abort Cont
4.02 pH
Autocal buffer 1
Abort Cont
Adjust temperature
Calibrate pH
Output trim
Exit Enter
Buffer calibration
Standardize pH
pH slope
Exit Enter
1. Be sure the pH feature has been enabled. See Section 5.8.
2. Obtain two buffer solutions. Ideally the buffer pH values should bracket the range of pH values to be measured.
3. Remove the sensor from the process liquid. If the process and buffer temperatures are appreciably different,
place the sensor in a container of tap water at the buffer temperature. Do not start the calibration until the sensor has reached the buffer temperature. Thirty minutes is usually adequate.
13.2 AUTOMATIC TWO-POINT CALIBRATION
MODEL 54eA SECTION 13.0
CALIBRATION - pH
4. From the main display, press any key to obtain the main menu.
With the cursor on "Calibrate" press Enter (F4).
NOTE
If Hold was enabled in Section 5.6, the hold screen will appear.
To activate hold, refer to Section 5.6, step 11.
5. Press the ê key three times to move the cursor to "Calibrate pH".
Press Enter (F4).
6. Press Enter (F4).
7. Rinse the sensor with water and place it in buffer 1. Be sure the
glass bulb and reference junction are completely submerged. Swirl
the sensor. Press Cont (F3). "Wait" flashes until the reading stabilizes.
If the controller appears locked, the reading is not stable enough.
Investigate and correct the cause of the noise or drift (see Section
14.8). Alternatively, change the stability limits (see Section 5.8) and
repeat the calibration.
8. The screen at left appears once the reading is stable. Use the é or
ê key to change the reading to the nominal pH of the buffer. The
nominal pH is the pH of the buffer at 25°C. Press Cont (F3).
Page 81

MODEL 54eA SECTION 13.0
CALIBRATION - pH
9. Remove the sensor from buffer 1, rinse it with water, and place it in
buffer 2. Swirl the sensor. Press Cont (F3). "Wait" flashes until the
reading is stable.
10. The screen at left appears once the reading is stable. Use the é or
ê key to change the reading to the nominal pH of the buffer. The
nominal pH is the pH of the buffer at 25°C. Press Cont (F3).
11. Press Exit (F1) four times to return to the main display.
NOTE
If Hold was activated during calibration, “Hold Mode Activated”
will continue to flash in the main display. Return the sensor to
normal and deactivate Hold. Refer to Section 5.6, step 11.
12. To view the slope and offset press any key to enter the main menu.
Press the ê key once to move the cursor to "Diagnostic variables".
Press Enter (F4). Press the ê key six times to scroll through the list
of diagnostic variables. Note that the pH slope is at 25°C.
10.02 pH
Buf2 done: 10.01 @25°C
Abort Cont
10.02 pH
Autocal buffer 2
Abort Cont
NOTE
During calibration, ERROR and WARNING messages may appear. If an ERROR message appears, press
Exit (F1) to leave and return to the previous screen. If a WARNING message appears, press Cont (F3) to
continue the calibration or press Abort (F1) to leave. Continuing the calibration after a warning message
appears may cause substantial errors in the subsequent measurement. Refer to Section 16.9 for assistance.
75
Page 82

76
1. Be sure the pH feature has been enabled. See Section 5.8.
2. The controller comes from the factory set for automatic pH calibration. To do a manual calibration, the factory
default setting must be changed. Refer to Section 5.8.
3. Obtain two buffer solutions. Ideally the buffer pH values should bracket the range of pH values to be measured. Also obtain a thermometer. The pH of most buffer solutions is a function of temperature. To calibrate the
sensor properly, the pH of the buffer at the measurement temperature must be entered in the analyzer.
4. Remove the sensor from the process liquid. If the process and buffer temperatures are appreciably different,
place the sensor in a container of tap water at the buffer temperature. Do not start the calibration until the sensor has reached the buffer temperature. Thirty minutes is usually adequate.
13.3 MANUAL TWO-POINT CALIBRATION
MODEL 54eA SECTION 13.0
CALIBRATION - pH
5. From the main display, press any key to obtain the main menu. With
the cursor on "Calibrate" press Enter (F4).
NOTE
If Hold was enabled in Section 5.6, the hold screen will appear.
To activate hold, refer to Section 5.6, step 11.
6. Press the ê arrow key three times to move the cursor to "Calibrate
pH". Press Enter (F4).
7. With the cursor on "2-pt calibration" press Enter (F4).
8. Rinse the sensor and thermometer with water and place them in
buffer 1. Be sure the glass bulb and junction are completely submerged. Swirl the sensor. Press Cont (F3). "Wait" flashes until the
reading stabilizes. The large number on the first line is the measured
pH based on the previous calibration.
If the controller appears locked, the reading is not stable enough.
Investigate and correct the cause of the noise or drift (see Section
14.8). Alternatively, change the stability limits (see Section 5.8) and
repeat the calibration.
9. The screen at left appears once the reading is stable. Press Edit (F4)
and use the arrow keys to change the reading to the pH of the buffer
at the measured temperature. Most commercial buffers have a table
of pH values as a function of temperature on the label. Press Save
(F4) to store the value. If the pH value on the first line is correct, press
Pt 2 (F3) and go to step 11.
Adjust temperature
Calibrate pH
Output trim
Exit Enter
2-pt calibration
Standardize pH
pH slope
Exit Enter
4.01 pH
Pt. 1 : 04.00pH 25°C
Exit Pt 2 Edit
4.01 pH
Calibrate point 1
Abort Cont
Page 83

MODEL 54eA SECTION 13.0
CALIBRATION - pH
10. The screen at left appears if the pH reading in step 9 was changed.
Press Pt2 (F3). Go to step 11.
11. Rinse the sensor and thermometer with water and place them in
buffer 2. Be sure the glass bulb and junction are completely submerged. Swirl the sensor. Press Cont (F3). "Wait" flashes until the
reading stabilizes.
12. The screen at left appears once the reading is stable. Press Edit (F4)
and use the arrow keys to change the reading to the pH of the buffer
at the measured temperature. Press Save (F4) to store the value.
Press Exit (F1) four times to return to the main display.
NOTE
If Hold was activated during calibration, “Hold Mode Activated”
will continue to flash in the main display. Return the sensor to
normal and deactivate Hold. Refer to Section 5.6, step 11.
13. To view the slope and offset press any key to enter the main menu.
Press the ê key once to move the cursor to "Diagnostic variables".
Press Enter (F4). Press the ê key six times to scroll through the list
of diagnostic variables. Note that the pH slope is at 25°C.
4.00 pH
Pt. 1 : 4.00pH 25.0°C
Exit Pt 2 Edit
10.01 pH
Pt. 2 : 10.01pH 25.0°C
Exit Edit
NOTE
During calibration, ERROR and WARNING messages may appear. If an ERROR message appears, press
Exit (F1) to leave and return to the previous screen. If a WARNING message appears, press Cont (F3) to
continue the calibration or press Abort (F1) to leave. Continuing the calibration after a warning message
appears may cause substantial errors in the subsequent measurement. Refer to Section 16.9 for assistance.
10.01 pH
Calibrate point 2
Abort Cont
77
Page 84

78
1. The pH measured by the controller can be changed to match the reading from a second or referee instrument.
The process of making the two reading agree is called standardization, or one-point calibration.
2. During standardization, the difference between the two pH values is converted to the equivalent voltage. The
voltage, called the reference offset, is added to all subsequent measured cell voltages before they are converted to pH. If a sensor that has been calibrated with buffers is then standardized and placed back in a buffer,
the measured pH will differ from the buffer pH by an amount equivalent to the standardization offset.
3. Install the sensor in the process liquid. Once readings are stable, measure the pH of the liquid using a referee instrument. Normally, it is acceptable to test a grab sample. Because the pH of the process liquid may
change if the temperature changes, measure the pH immediately after taking the grab sample. For poorly
buffered samples, it is best to determine the pH of a continuously flowing sample from a point as close as possible to the process sensor.
13.4 STANDARDIZATION (ONE-POINT CALIBRATION)
MODEL 54eA SECTION 13.0
CALIBRATION - pH
Adjust temperature
Calibrate pH
Output trim
Exit Enter
4. From the main display, press any key to obtain the main menu. With
the cursor on "Calibrate" press Enter (F4).
NOTE
If Hold was enabled in Section 5.6, the hold screen will appear.
To activate hold, refer to Section 5.6, step 11.
5. Press the ê key three times to move the cursor to "Calibrate pH".
Press Enter (F4).
6. Press the ê key once to move the cursor to "Standardize pH". Press
Enter (F4).
7. The pH reading in large numbers is the current process reading.
Press Edit (F4). Use the arrow keys to change the reading in the second line to match the referee instrument. Press Save (F4).
8. Press Exit (F1) four times to return to the main display.
NOTE
If Hold was activated during calibration, “Hold Mode Activated”
will continue to flash in the main display. Return the sensor to
normal and deactivate Hold. Refer to Section 5.6, step 11.
2-pt calibration
Standardize pH
pH slope
Exit Enter
NOTE
During calibration, ERROR and WARNING messages may appear. If an ERROR message appears,
press Exit (F1) to leave and return to the previous screen. If a WARNING message appears, press
Cont (F3) to continue the calibration or press Abort (F1) to leave. Continuing the calibration after a
warning message appears may cause substantial errors in the subsequent measurement. Refer to
Section 16.9 for assistance.
7.00 pH
Standardize : 7.00 pH
Exit Edit
Page 85

1. If the electrode slope is known from other measurements, it can be entered directly into the controller. The
slope must be entered as the slope at 25°C. To calculate the slope at 25°C from the slope at temperature t°C,
use the equation:
slope at 25°C = (slope at t°C)
Changing the slope overrides the slope determined from the previous buffer calibration.
13.5 pH SLOPE ADJUSTMENT
MODEL 54eA SECTION 13.0
CALIBRATION - pH
Adjust temperature
Calibrate pH
Output trim
Exit Enter
Buffer calibration
Standardize pH
pH slope
Exit Enter
2. From the main display, press any key to obtain the main menu. With
the cursor on "Calibrate" press Enter (F4).
NOTE
If Hold was enabled in Section 5.6, the hold screen will appear.
To activate hold, refer to Section 5.6, step 11.
3. Press the ê key three times to move the cursor to "Calibrate pH".
Press Enter (F4).
4. Press the ê key twice to move the cursor to “pH slope.” Press Enter
(F4).
5. Press Edit (F4). Use the arrow keys to change the slope to the
desired value. The slope msut be between 45 and 60 mV/pH. Press
Save (F4).
6. Press Exit (F1) four times to return to the main display.
NOTE
If Hold was activated during calibration, “Hold Mode Activated”
will continue to flash in the main display. Return the sensor to
normal and deactivate Hold. Refer to Section 5.6, step 11.
pH slope: 60.00 mV/pH
Exit Edit
298
t°C + 273
NOTE
During calibration, ERROR and WARNING messages may appear. If an ERROR message appears, press
Exit (F1) to leave and return to the previous screen. If a WARNING message appears, press Cont (F3) to
continue the calibration or press Abort (F1) to leave. Continuing the calibration after a warning message
appears may cause substantial errors in the subsequent measurement. Refer to Section 16.9 for assistance.
79
Page 86

80
MODEL 54eA SECTION 14.0
CALIBRATION - CURRENT OUTPUTS
SECTION 14.0
CALIBRATION - CURRENT OUTPUTS
14.1 INTRODUCTION
Although the controller outputs are calibrated at the factory, they can be trimmed in the field to match the reading
from a standard current meter. Both the low output (0 or 4 mA) and the high output (20 mA) can be trimmed.
14.2 TRIMMING THE OUTPUTS
Adjust temperature
Calibrate pH
Output trim
Exit Enter
1. From the main display, press any key to obtain the main menu. With
the cursor on "Calibrate" press Enter (F4).
NOTE
If Hold was enabled in Section 5.6, the hold screen will appear.
To activate hold, refer to Section 5.6, step 11.
2. Move the cursor to "Output trim” and press Enter (F4).
3. The warning screen reminds the user that the output currents will be
affected. Pres Cont (F3) to continue.
4. Use the é or ê keys to move the cursor to the desired output and
press Enter (F4).
5. Select “Cal point 1” (0 or 4 mA) or “Cal point 2” (20 mA).
6. Move the cursor to “Meter” and press Enter (F4). Measure the output
current with a calibrated ammeter. Use the é or ê keys to change
the display to match the ammeter reading and press Save (F4).
7. Move the cursor to the other “Cal point” and select it. Repeat step 6.
NOTE
If Hold was activated during calibration, “Hold Mode Activated”
will continue to flash in the main display. Return the sensor to
normal and deactivate Hold. Refer to Section 5.6, step 11.
CAUTION:
Current outputs
may be affected
Abort Cont
Trim output 1
Trim output 2
Exit Enter
Cal point : 1
Meter: 4.00 mA
Expected: 4.00 mA
Simulating output1
Exit Edit
Page 87

81
MODEL 54eA SECTION 15.0
PID AND TPC CONTROL
SECTION 15.0
PID AND TPC CONTROL
15.1 PID CONTROL (CODE -20)
PID Control
The Model 54eA current outputs can be programmed
for PID control. PID control is used with a control
device that is capable of varying its output from 0 to
100 percent in response to a changing signal in milliamps. Automated control valves or variable volume
pumps are commonly used. These devices are referred
to as modulating control devices because of their 0 to
100% adjustability. PID control is typically used where
greater accuracy than is achievable with an on/off
device is required, or where it is desirable to have the
pump or valve "on" continuously, or where the existing
or preferred pump or valve is of the modulating type.
Any process control system must manually or automatically hold the controlled variable (pH, concentration, temperature) in a steady condition at selected set
point values. For manual control, the operator looks at
the value of the process variable, decides whether or
not it is correct, and makes necessary adjustments. He
decides the amount, direction, rate of change and
duration of the adjustment. With automatic control, the
controller does all of this. The operator only adjusts the
set point of the controller to the selected value of the
measured variable. Automatic process control such as
PID is usually feedback control; it eliminates the deviation between measurement and set point based on
continuous updates (feedback) from the process itself.
Measurement and Set Point (Feedback Control)
The Model 54eA controller is given two items of information: measurement and set point. The controller
reacts to the difference in value of these two signals
and produces an analog output signal to eliminate that
difference. As long as the difference exists, the controller will try to eliminate it with the output signal. When
measurement and set point are equal, the condition of
the controller is static and its output is unchanged. Any
deviation of measurement from set point will cause the
controller to react by changing its output signal.
PID Control Mode Combinations
All PID controllers have several control modes which
can be used in various combinations: proportional plus
integral (reset), proportional plus derivative (rate) and a
combination of proportional (P), integral (I) and derivative (D). Each control mode produces a response to the
deviation of measurement from set point that is the
result of a specific characteristic of the deviation, and
each control mode is separately adjustable. D, the
derivative, or rate mode, is seldom used in water treatment and is beyond the scope of this manual.
Proportional Mode (Gain)
The simplest control is proportional. Proportional may
also be referred to as sensitivity or gain. Although these
terms may refer to a different version of proportional,
the control function is still fundamentally the same - the
error from set point is multiplied by this factor to produce the output.
In the Model 54eA controller, proportional mode is
referred to as proportional "band" which is configurable from 0 to 299%. For good control of a specific
process, the proportional band must be properly
adjusted. The proportional band is the percent of the
analog output span (the difference between the 4 (or 0)
mA and 20 mA settings) through which the measured
variable must move to change the output from minimum to maximum. The larger the proportional band,
the less the controller reacts to changes in the
measured variable. As the proportional band is
made smaller, the reaction of the controller
increases. At 0 proportional band, the proportional-
only controller behaves like an on/off controller (an
alarm set at 20 mA).
Most processes require that the measured variable be
held at the set point. The proportional mode alone will
not automatically do this. Proportional alone will only
stabilize the measured variable at some offset to the
actual control point. To control at an exact setpoint,
proportional plus integral mode is used.
Page 88

82
MODEL 54eA SECTION 15.0
CALIBRATION - CONTROL
Proportional (Gain) Plus Integral (Reset)
For the automatic elimination of deviation, I (Integral
mode), also referred to as Reset, is used. The proportional function is modified by the addition of automatic
reset. With the reset mode, the controller continues to
change its output until the deviation between measurement and set point is eliminated.
The action of the reset mode depends on the proportional band. The rate at which it changes the controller
output is based on the proportional band size and the
reset adjustment. The reset time is the time required
for the reset mode to repeat the proportional action
once. It is expressed as seconds per repeat,
adjustable from 0-2999 seconds.
The reset mode repeats the proportional action as long
as an offset from the set point exists. Reset action is
cumulative. The longer the offset exists, the more the
output signal is increased.
The controller configured with reset continues to
change until there is no offset. If the offset persists, the
reset action eventually drives the controller output to
its 100% limit - a condition known as "reset windup".
To prevent reset windup, a controller with reset mode
should never be used to control a measured variable
influenced by uncorrectable conditions. Once the controller is "wound up", the deviation must be eliminated
or redirected before the controller can unwind and
resume control of the measured variable. The integral
time can be cleared and the "windup" condition quickly eliminated by manually overriding the analog out-
put using the simulate tests feature (detailed in
Section 5.4).
Control Loop Adjustment and Tuning
There are several methods for tuning PID loops including: Ziegler-Nichols frequency response, open loop
step response, closed loop step response, and trial and
error. Described in this section is a form of the open
loop response method called the process reaction
curve method. The reaction times and control characteristics of installed equipment and real processes are
difficult to predict. The process reaction curve method
of tuning works well because it is based on the
response of the installed system. This procedure, outlined in the following paragraphs, can be used as a
starting point for the P and I settings. Experience has
shown that PID controllers will do a fair job of controlling most processes with many combinations of reasonable control mode settings.
Process Reaction Curve Method
A PID loop can be tuned using the process reaction
curve method. This method involves making a step
change in the chemical feedrate (usually about 50% of
the pump or valve range) and graphing the response of
the Model 54eA controller reading versus time.
The process reaction curve graphically shows the reaction of the process to step change in the input signal.
Figure 14-1 shows an example of a tuning process for
a pH controller. Similar results can be obtained for the
oxygen, ozone, or chlorine controller.
To use this procedure with a Model 54eA controller and
a control valve or metering pump, follow the steps outlined below.
Wire the controller to the control valve or metering
pump. Introduce a step change to the process by using
the simulate test function to make the step change in
the output signal.
Graph the change in the measured variable (concentration or pH) as shown in Figure 15-1. Observe the
reading on the Model 54eA controller and note values
at intervals timed with a stop watch. A strip chart
recorder can be used for slower reacting processes. To
collect the data, perform the following steps:
1. Let the system come to a steady state where the
measured variable (pH, concentration or temperature) is relatively stable.
2. Observe the output current on the main display of
the controller.
3. Using the simulate test, manually set the controller
output signal at the value which represented the
stable process measurement observed in step 1,
then observe the process reading to ensure steady
state conditions (a stable process measurement).
4. Using the simulate test, cause a step change in the
output signal. This change should be large enough
to produce a significant change in the measured
variable in a reasonable amount of time, but not
too large to drive the process out of desired limits.
5. The reaction of the system, when graphed, will
resemble Figure 15-1, showing a change in the
measured variable over the change in time. After a
period of time (the process delay time), the measured variable will start to increase (or decrease)
rapidly. At some further time the process will begin
to change less rapidly as the process begins to stabilize from the imposed step change. It is important
to collect data for a long enough period of time to
see the process begin to level off to establish a tangent to the process reaction curve.
Page 89

MODEL 54eA SECTION 15.0
CALIBRATION - CONTROL
6. When sufficient data have been collected, return
the output signal to its original value using the simulate test function. Maintain the controller in this
manual mode until you are ready to initiate automatic PID control, after you have calculated the
tuning constants.
Once these steps are completed, the resulting process
reaction curve is used to obtain information about the
overall dynamics of the system. It will be used to calculate the needed tuning parameters of the Model
54eA controller.
NOTE
The tuning procedure outlined below is
adapted from "Instrumentation and
Process Measurement and Control",
by Norman A. Anderson, Chilton Co.,
Radnor, Pennsylvania, ©1980.
Information derived from the process reaction curve
will be used with the following empirical formulas to
predict the optimum settings for proportional and integral tuning parameters.
Four quantities are determined from the process reaction curve for use in the formulas: time delay (D), time
period (L), a ratio of these two (R), and plant gain (C).
A line is drawn on the process reaction curve tangent
to the curve at point of maximum rise (slope) as shown
in Figure 15-1. The Time Delay (D), or lag time,
extends from "zero time" on the horizontal axis to the
point where the tangent line intersects the time axis.
The Response Time period (L), extends from the end
of delay period to the time at which the tangent line
intersects the 100% reaction completion line representing the process stabilization value. The ratio (R) of
the Response Time period to the Time Delay describes
the dynamic behavior of the system.
In the example, the process Delay Time (D) was four
seconds and the Response Time period (L) was 12
seconds, so:
R = = 3
The last parameter used in the equations is a plant
gain (C). The plant gain is defined as a percent
change in the controlled variable divided by the percent change in manipulated variable; in other words,
the change in the measured variable (pH, conductivity, temperature) divided by the percent change in the
analog output signal.
The percent change in the controlled variable is
defined as the change in the measured variable (pH,
FIGURE 15-1. The Process Reaction Curve
12 seconds
4 seconds
L
D
83
Page 90

84
MODEL 54eA SECTION 15.0
CALIBRATION - CONTROL
concentration, temperature) compared to the measurement range, the difference between the 20 mA (Hi) and 4
(or 0) mA (Lo) setpoints, which you determined when configuring the analog output.
In the example shown in Figure 15-1:
The percent change in pH was:
x 100% = = 33.3%
The change in the output signal was:
x 100% = 12.5%
So the Plant Gain is:
C = = 2.66
Once R and C are calculated, the proportional and integral bands can be determined as follows:
Proportional band (%) = P = 286
Integral Time (seconds per repeat) = I = 3.33 x D x C
So for the example:
P = = 254%
I = 3.33 (4 sec.) 2.66 = 36 seconds
To enter these parameters, use the procedure detailed in Section 5.6.
pH2 - pH1
pH “Hi” - pH “Lo”
8.2 - 7.2 pH
9.0 - 6.0 pH
6 - 4 milliamps
20 - 4
33.3
12.5
C
R
286 (2.66)
3
Page 91

MODEL 54eA SECTION 15.0
CALIBRATION - CONTROL
15.2 TIME PROPORTIONAL CONTROL
(TPC) MODE (Code -20)
In the TPC mode, you must establish the following
parameters which will determine how the Model
54eA controller responds to your system (see
Section 5.7):
• Setpoint
• Time period
• URV point (or 100% on)
• LRV point (or 0% on)
• Proportional
• Integral
• Derivative
The following describes how TPC works. In the example, pH is to be controlled.
The setpoint is the pH you want to control the process
to. Time period is programmed in seconds and defines
the interval during which the controller compares the
pH input from the sensor with the setpoint. In the TPC
mode the controller divides the period up into pump ontime (feed time) and pump off-time (blend time).
The URV setting determines how far the pH must deviate from the setpoint to get the pump to be on for the
entire period. The LRV setting determines how close
the pH must be to the setpoint for the pump to be off for
the entire period. The LRV setting should always be set
at zero. When the error (the pH minus the setpoint) is
between the URV and LRV values, the relay will be
energized for some portion of the time period. As the
pH value approaches the setpoint, the pump will be
feeding for shorter and shorter intervals, and the chemicals will be allowed to mix for longer and longer intervals of the period. This relationship is illustrated in
Figure 15-3.
The exact amount of on time and off time per period is
determined by the settings for proportional, integral,
and derivative bands. The proportional band (P) in %
is a separate adjustment that narrows (or widens) the
range of the TPC 0-100% action. Smaller values are
used for more control response. For a setpoint of 7 pH,
a URV of 2 pH, and P=100%, a pH reading of 8 would
result in a relay on (8-7)/((2-0)*(100%)) or 50% of the
time. If P was changed to 50%, the same relay would
be on (8-7)/((2-0)*50%) or 100% of the time.
The integral band is set in seconds and acts to
increase the controller output as more time is spent
away from the setpoint. A smaller value in seconds will
result in faster integration response. Too low a value
will result in excess oscillation.
The derivative band is set in % and acts to prevent
changes in the reading. This setting should generally
be set to zero for pH applications.
TPC offers precise control by forcing the pump to feed
chemical for shorter periods of time as you approach
the desired setpoint. If the process faces a large upset,
TPC mode forces the pump to feed chemical for longer
periods of time as the process deviates further from the
setpoint. This action continues until the pump is feeding all the time, providing a speedy recovery from large
up-sets.
The controller can be programmed to be direct or
reverse acting, depending on the pH (or temperature)
value selected for URV. For example, if the controller is
direct acting based on pH, such as in caustic chemical
addition control, the pH will rise as chemical is added,
so the URV value will be below the LRV (i.e. below
zero). As the pH rises toward the control point value,
the pump will be on for gradually less time. Conversely,
if the controller is reverse-acting based on pH, such as
in acid addition for control, the pH will drop as acid is
added, and the URV value will be positive. The pH will
fall toward the control point value, and the pump will be
on for gradually less time.
Complete TPC configuration is explained and typical
settings for these parameters are listed in Section 5.0.
After startup, the operator needs to adjust only the 0%
On to maintain the desired chemical concentration.
FIGURE 15-3. Time Proportional Control
85
Page 92

86
MODEL 54eA SECTION 16.0
TROUBLESHOOTING
SECTION 16.0
TROUBLESHOOTING
16.1 OVERVIEW
The 54eA controller continuously monitors itself and the sensor for faults. When the controller detects a fault in the
amperometric or pH sensor or in the instrument itself it displays a fault message. If alarm 4 was enabled, the red
FAIL LED will also light and relay 4 will activate. The outputs will go to 22.00 mA or to the value programmed in
Section 5.6.
Special rules apply to pH sensor diagnostics (high and low glass impedance). Alarm 4, the FAIL LED, and the output current failure mode will operate only if pH sensor diagnostics have been enabled. See Section 5.8.
See Section 16.2 for an explanation of fault messages and suggested corrective actions.
The controller also displays error and warning messages if a calibration is seriously in error. Refer to the section
below for assistance. Each section also contains hints for correcting other measurement and calibration problems.
For troubleshooting not related to measurement problems, see Section 16.10.
To view diagnostic variables, go to the main display and press any key. Move the cursor to “Diagnostic variables”
and press Enter (F4). Use the é or ê key to move up or down the list.
Measurement Section
Temperature 15.3
Dissolved oxygen 15.4
Free chlorine 15.5
Total chlorine 15.6
Monochloramine 15.7
Ozone 15.8
pH 15.9
16.2 TROUBLESHOOTING WHEN A FAULT MESSAGE IS SHOWING
Fault message Explanation See Section
High input current input current exceeds 210 uA 16.2.1
Check sensor zero sensor current was too high when sensor was zeroed 16.2.2
pH low input voltage input voltage is less than -1400 mV 16.2.3
pH high input voltage input voltage exceeds 1400 mV 16.2.3
pH low reference voltage input voltage is less than -1600 mV 16.2.4
pH high reference voltage input voltage exceeds 1600 mV 16.2.4
Old glass warning glass impedance exceeds high limit 16.2.5
Cracked glass failure glass impedance is less than low limit 16.2.6
Temp error low temperature less than -15°C 16.2.7
Temp error high temperature greater than 130°C 16.2.7
Sense line open RTD sense line is open 16.2.8
Failure factory instrument needs factory calibration 16.2.9
Failure eeprom write verify error has occurred 16.2.9
Page 93

MODEL 54eA SECTION 16.0
TROUBLESHOOTING
16.2.1 High input current
Excessive sensor current implies that the amperometric sensor is miswired or the sensor has failed. Verify that
wiring is correct, including connections through a junction box. See Section 3.3. If wiring is correct, try replacing
the sensor.
16.2.2 Check sensor zero
The sensor current was extremely high when the sensor was zeroed. Refer to the calibration section for the analyte being determined for typical zero currents. Zeroing the sensor before the zero current has reached a stable
minimum value will lead to low results. Allow adequate time, possibly as long as overnight, for the sensor to stabilize before starting the zero routine. Also refer to the troubleshooting section specific for the sensor. See the table
in Section 16.1.
16.2.3 pH low or high input voltage
The input voltage fault message usually means there is an open connection somewhere in the wiring between the
pH sensor and controller. Check wiring connections. See Section 3.3. If a junction box is being used, check the
connections at the junction box, too. If wiring is correct, try replacing the sensor.
16.2.4 pH low or high reference voltage
The reference voltage fault message can mean several things: the pH sensor is no longer submerged in the
process, the sensor is coated or fouled, or there is an open connection between the sensor and the controller. First,
verify all electrical connections. If a junction box is being used, check the connections at the junction box, too.
Verify that the pH sensor is completely submerged in the process liquid. Also, verify that the sensor is not coated
with solids or oil. If the sensor looks dirty, clean it. Refer to the sensor instruction manual for details. If cleaning the
sensor fails to solve the problem, replace the sensor.
16.2.5 Old glass warning
Old glass warning means the pH sensor is no longer submerged in the process or the sensor is possibly nearing
the end of its useful life. First, verify that the sensor is clean and submerged in the process liquid. Also verify that
the sensor can still be calibrated in buffers. Make a note of the sensor slope. If the slope is between 54 and 60
mV/ unit pH, the sensor is good. If the slope is between 48 and 50 mV/unit pH, the sensor is near the end of its
life. To make the warning message disappear, increase the warning limit (see Section 5.8).
16.2.6 Cracked glass failure
This fault message almost always means the pH sensor has failed and must be replaced. Before discarding the
sensor, try calibrating it in buffers. If the buffer calibration is successful, the sensor is okay, but the diagnostic limit
is set too high. To make the fault message disappear, lower the glass failure limit (see Section 5.8, step 6). Do not
lower the impedance below 10 MΩ.
16.2.7 Temperature error low or high
Temperature error usually means the RTD (or the thermistor in the case of the Hx438 and Gx448 sensors) is open
or shorted or there is an open or short in the connecting wiring. First, verify all wiring connections, including wiring
connections in the junction box if one is being used. Next, disconnect the RTD IN, SENSE, and RETURN leads or
the thermistor leads at the controller. Be sure to note the color of the wire and where it was attached. Measure the
resistance between the RTD IN and RETURN leads. For the thermistor, measure the resistance between the two
leads. The resistance should be close to the value in the table in Section 16.14.2. If the temperature element is
open or shorted, the sensor should be replaced. In the meantime use manual temperature compensation.
For oxygen measurements using the Hx438, the Gx448, or other steam sterilizable sensor using a 22kNTC, temperature error high will appear if the controller was not properly configured to recognize the sensor. Verify that
either “RMT Biopharm” or “SSDO other” was selected in Section 5.5.
87
Page 94

88
MODEL 54eA SECTION 16.0
TROUBLESHOOTING
16.2.8 Sense line open
Most Rosemount Analytical sensors use a Pt100 or a Pt1000 in a three-wire configuration (see Figure 16-4). The
in and return leads connect the RTD to the measuring circuit in the analyzer. A third wire, called the sense line, is
connected to the return lead. The sense line allows the analyzer to correct for the resistance of the in and return
leads and to correct for changes in lead wire resistance with changes in ambient temperature. If the sense line is
open, check all wiring connections, including connections at a junction box. Next, verify that the sense line is open.
Disconnect the sense and return leads and measure the resistance between them. It should be less than 5Ω. If
the sense line is open, replace the sensor as soon as possible.
The analyzer can be operated with the sense line open. The measurement will be less accurate because the analyzer can no longer compensate for lead wire resistance. However, if the sensor is to be used at approximately
constant ambient temperature, the lead wire resistance error can be eliminated by calibrating the sensor at the
measurement temperature. Errors caused by changes in resistance with changes in ambient temperature cannot
be eliminated. To make the error message disappear, connect the RTD sense and return terminal with a jumper.
16.2.9 Failure factory and Failure eeprom
Turn the power off, wait about 30 sec, then turn the power back on. If the error message does not clear, call the
factory. In the United States, call (800) 854-8257. Outside the United States, call (949) 757-8500.
16.3 TROUBLESHOOTING WHEN NO FAULT MESSAGE IS SHOWING - TEMPERATURE
16.3.1 Temperature measured by standard was more than 1°C different from controller.
A. Is the standard thermometer, RTD, or thermistor accurate? General purpose liquid-in-glass thermometers, par-
ticularly ones that have been mistreated, can have surprisingly large errors.
B. Is the temperature element in the sensor completely submerged in the liquid?
C. Is the standard temperature sensor submerged to the correct level?
16.4 TROUBLESHOOTING WHEN NO FAULT MESSAGE IS SHOWING - OXYGEN
Problem See Section
Zero current was accepted, but current is greater than the value in the table in Section 7.2 16.4.1
Error or warning message while zeroing the sensor (zero current is too high) 16.4.1
Zero reading is unstable 16.4.2
Sensor can be calibrated, but current is outside the range in the table in Section 7.3 16.4.3
Possible error warning during air calibration 16.4.3
Possible error warning during in-process calibration 16.4.4
Barometric pressure reading is too high or too low 16.4.5
Process readings are erratic 16.4.6
Readings drift 16.4.7
Page 95

MODEL 54eA SECTION 16.0
TROUBLESHOOTING
16.4.1 Zero current is too high
A. Is the sensor properly wired to the analyzer? See Section 3.3.
B. Is the membrane completely covered with zero solution and are air bubbles not trapped against the mem-
brane? Swirl and tap the sensor to release air bubbles.
C. Is the zero solution fresh and properly made? Zero the sensor in a solution of 5% sodium sulfite in water.
Prepare the solution immediately before use. It has a shelf life of only a few days.
D. If the sensor is being zeroed with nitrogen gas, verify that the nitrogen is oxygen-free and the flow is adequate
to prevent back-diffusion of air into the chamber.
E. The major contributor to the zero current is dissolved oxygen in the electrolyte solution inside the sensor. A
long zeroing period usually means that an air bubble is trapped in the electrolyte. To ensure the 499ADO or
499A TrDO sensor contains no air bubbles, carefully follow the procedure in the sensor manual for filling the
sensor. If the electrolyte solution has just been replaced, allow several hours for the zero current to stabilize.
On rare occasions, the sensor may require as long as overnight to zero.
F. Check the membrane for damage and replace the membrane if necessary
.
16.4.2 Zero reading Is unstable.
A. Is the sensor properly wired to the analyzer? See Section 3.3. Verify that all wiring connections are tight.
B. Readings are often erratic when a new or rebuilt sensor is first placed in service. Readings usually stabilize
after an hour.
C. Is the space between the membrane and cathode filled with electrolyte solution and is the flow path between
the electrolyte reservoir and the membrane clear? Often the flow of electrolyte can be started by simply holding the sensor with the membrane end pointing down and sharply shaking the sensor a few times as though
shaking down a clinical thermometer. If shaking does not work, perform the checks below. Refer to the sensor
instruction manuals for additional information.
For 499ADO and 499A TrDO sensors, verify that the holes at the base of the cathode stem are open (use a
straightened paperclip to clear the holes). Also verify that air bubbles are not blocking the holes. Fill the reservoir
and establish electrolyte flow to the cathode. Refer to the sensor instruction manual for the detailed procedure.
For Gx438 and Hx438 sensors, the best way to ensure that there is an adequate supply of electrolyte solution
is to simply add fresh electrolyte solution to the sensor. Refer to the sensor instruction manual for details.
16.4.3 Sensor can be calibrated, but current in air is too high or too low
A. Is the sensor properly wired to the analyzer? See Section 3.3. Verify that all connections are tight.
B. Is the membrane dry? The membrane must be dry during air calibration. A droplet of water on the membrane
during air calibration will lower the sensor current and cause an inaccurate calibration.
C. If the sensor current in air is very low and the sensor is new, either the electrolyte flow has stopped or the mem-
brane is torn or loose. For instructions on how to restart electrolyte flow see Section 16.4.2 or refer to the sensor instruction manual. To replace a torn membrane, refer to the sensor instruction manual.
D. Is the temperature low? Sensor current is a strong function of temperature. The sensor current decreases
about 3% for every °C drop in temperature.
E. Is the membrane fouled or coated? A dirty membrane inhibits diffusion of oxygen through the membrane,
reducing the sensor current. Clean the membrane by rinsing it with a stream of water from a wash bottle or by
gently wiping the membrane with a soft tissue. If cleaning the membrane does not improve the sensor
response, replace the membrane and electrolyte solution. If necessary, polish the cathode. See the sensor
instruction sheet for more information.
16.4.4 Possible error warning during in-process calibration
This error warning appears if the current process reading and the reading it is being changed to, ie, the reading
from the standard instrument, are appreciably different.
A. Is the standard instrument properly zeroed and calibrated?
B. Are the standard and process sensor measuring the same sample? Place the sensors as close together as
possible.
C. Is the process sensor working properly? Check the response of the process sensor in air and in sodium sul-
fite solution.
89
Page 96

MODEL 54eA SECTION 16.0
TROUBLESHOOTING
16.4.5 Barometric pressure reading is too high or too low.
A. Is the pressure inside the enclosure equal to ambient pressure? The pressure sensor is inside the controller enclo-
sure. When cable glands are in place and the front panel is tightly closed, the enclosure is moderately airtight.
Therefore, as the air trapped in the enclosure heats or cools, the pressure inside the enclosure may be different from
ambient. Open the front door to equalize the pressure.
B. If equalizing the pressure does not solve the problem, the pressure sensor is out of calibration. Calibrate the sensor
against the local barometric pressure. Be sure to use the actual barometric pressure. Pressure, sometimes called
altimeter, from a local airport or pressure from a weather forecasting service is usually corrected to sea level. It is
not the actual barometric pressure.
16.4.6 Process readings are erratic.
A. Readings are often erratic when a new sensor or a rebuilt sensor is first placed in service. The current usually sta-
bilizes after a few hours.
B. Is the sample flow within the recommended range? High sample flow may cause erratic readings. Refer to the sen-
sor instruction manual for recommended flow rates.
C. Gas bubbles impinging on the membrane may cause erratic readings. Orienting the sensor at an angle away from
vertical may reduce the noise.
D. The holes between the membrane and electrolyte reservoir might be plugged (applies to Models 499A DO and 499A
TrDO sensors only). Refer to Section 16.4.2.
E. Verify that wiring is correct. Pay particular attention to shield and ground connections.
F. Is the membrane in good condition and is the sensor filled with electrolyte solution? Replace the fill solution and
electrolyte. Refer to the sensor instruction manual for details.
16.4.7 Readings drift.
A. Is the sample temperature changing? Membrane permeability is a function of temperature. For the 499ADO and
499ATrDO sensors, the time constant for response to a temperature change is about 5 minutes. Therefore, the reading may drift for a while after a sudden temperature change. The time constant for the Gx438 and Hx448 sensors is
much shorter; these sensors respond fairly rapidly to temperature changes.
B. Is the membrane clean? For the sensor to work properly oxygen must diffuse freely through the membrane. A coat-
ing on the membrane will interfere with the passage of oxygen, resulting in slow response.
C. Is the sensor in direct sunlight? If the sensor is in direct sunlight during air calibration, readings will drift as the sen-
sor warms up. Because the temperature reading lags the true temperature of the membrane, calibrating the sensor
in direct sunlight may introduce an error.
D. Is the sample flow within the recommended range? Gradual loss of sample flow will cause downward drift.
E. Is the sensor new or has it been recently serviced? New or rebuilt sensors may require several hours to stabilize.
16.4.8 Sensor does not respond to changes in oxygen level.
A. If readings are being compared with a portable laboratory instrument, verify that the laboratory instrument is work-
ing.
B. Is the membrane clean? Clean the membrane and replace it if necessary. Check that the holes at the base of the
cathode stem are open. Use a straightened paper clip to clear blockages. Replace the electrolyte solution.
C. Replace the sensor.
16.4.9 Oxygen readings are too low.
A. Low readings can be caused by zeroing the sensor before the residual current has reached a stable minimum value.
Residual current is the current the sensor generates even when no oxygen is in the sample. Because the residual current is subtracted from subsequent measured currents, zeroing before the current is a minimum can lead to low results.
Example: the true residual (zero) current for a 499ADO sensor is 0.05 μA, and the sensitivity based on calibration in water-saturated air is 2.35 μA/ppm. Assume the measured current is 2.00 μA. The true concentration is
(2.00 - 0.05)/2.35 or 0.83 ppm. If the sensor was zeroed prematurely when the current was 0.2 μA, the measured
concentration will be (2.00 - 0.2)/2.35 or 0.77 ppm. The error is 7.2%. Suppose the measured current is 5.00 μA.
The true concentration is 2.11 ppm, and the measured concentration is 2.05 ppm. The error is now 3.3%. The
absolute difference between the readings remains the same, 0.06 ppm.
B. Sensor response depends on flow. If the flow is too low, readings will be low and flow sensitive. Verify that the flow
past the sensor equals or exceeds the minimum value. See the sensor instruction manual for recommended flows.
If the sensor is in an aeration basin, move the sensor to an area where the flow or agitation is greater.
90
Page 97

MODEL 54eA SECTION 16.0
TROUBLESHOOTING
16.5 TROUBLESHOOTING WHEN NO FAULT MESSAGE IS SHOWING - FREE CHLORINE
16.5.1 Zero current is too high
A. Is the sensor properly wired to the controller. See Section 3.3.
B. Is the zero solution chlorine-free? Take a sample of the solution and test it for free chlorine level. The con-
centration should be less than 0.02 ppm.
C. Has adequate time been allowed for the sensor to reach a minimum stable residual current? It may take sev-
eral hours, sometimes as long as overnight, for a new sensor to stabilize.
D. Check the membrane for damage and replace it if necessary.
E. Is the cathode coated with copper? (Applies to 498CL-01 sensor only.) If the 498CL-01 sensor is allowed to
operate in a non-flowing sample for more than about an hour, copper from the corrosion of the copper auxiliary electrode can diffuse into the sensor a plate out on the cathode. The cathode will appear tarnished and
the zero current will be high. Clean the cathode by soaking in dilute nitric acid. See the sensor instruction manual for details.
16.5.2 Zero current is unstable
A. Is the sensor properly wired to the analyzer? See Section 3.3. Verify that all wiring connections are tight.
B. Readings are often erratic when a new or rebuilt sensor is first placed in service. Readings usually stabilize
after about an hour.
C. Is the conductivity of the zero solution correct for the sensor being used? For a 499ACL-01 free chlorine sen-
sor the zero solution should be deionized water containing a small amount of sodium chloride to give a conductivity greater than 50 uS/cm. DO NOT USED DEIONIZED WATER WITH THE 499ACL-01 SENSOR. For
a 498CL-01 pH-independent free chlorine sensor, deionized water is appropriate for zeroing.
D. Is the space between the membrane and cathode filled with electrolyte solution and is the flow path between
the electrolyte reservoir and membrane clear? Often the flow of electrolyte and be started by simply holding
the sensor with the membrane end pointing down and sharply shaking the sensor a few times as though shaking down a clinical thermometer.
If you are using a 499ACL-01 sensor and shaking does not work, try clearing the holes around the cathode
stem. Hold the sensor with the membrane end pointing up. Unscrew the membrane retainer and remove the
membrane assembly. Be sure the wood ring remains with the membrane assembly. Use the end of a straightened paper clip to clear the holes at the base of the cathode stem. Replace the membrane.
The 498CL-01 pH-independent free chlorine sensor has a mesh cathode that allows the fill solution to completely bathe the cathode. There are no small holes to become plugged. Do not attempt to clean the mesh
cathode
Verify that the sensor is filled with electrolyte solution (499ACL-01) or electrolyte slurry (498CL-01). Refer to
the sensor instruction manual for details.
Problem See Section
Zero current was accepted, but the current is out of range 16.5.1
Error or warning message appears while zeroing the sensor (zero current is too high) 16.5.1
Zero current is unstable 16.5.2
Sensor can be calibrated, but sensitivity is out of range 16.5.3
Process readings are erratic 16.5.4
Readings drift 16.5.5
Sensor does not respond to changes in chlorine level 16.5.6
Chlorine reading spikes following rapid change in pH 16.5.7
91
Page 98

92
MODEL 54eA SECTION 16.0
TROUBLESHOOTING
16.5.3 Sensor can be calibrated, but the current is too low
A. Is the temperature low? For both the 499ACL-01 and 498CL-01 sensors, sensor current is a strong function
of temperature. The current decreases about 3% for every ºC drop in temperature.
B. Is the pH high? The 499ACL-01 sensor current is a strong function of pH. Sensor current decreases as pH
increases. Above pH 7, a 0.1 unit increase in pH lowers the current by about 5%. The 498CL-01 sensor current is practically independent of pH.
C. Sensor current depends on the rate of sample flow past the sensor tip. If the flow is too low, chlorine readings
will be low. Refer to the sensor instruction sheet for recommended sample flows.
D. Low current can be caused by lack of electrolyte flow to the cathode and membrane. See step D in Section
16.5.2.
E. Is the membrane fouled or coated? A dirty membrane inhibits diffusion of free chlorine through the membrane,
reducing the sensor current and increasing the response time. Clean the membrane by rinsing it with a stream
of water from a wash bottle. DO NOT use a membrane or tissue to wipe the membrane.
F. If cleaning the membrane does not improve the sensor response, replace the membrane and electrolyte solu-
tion. If necessary, polish the cathode. See the sensor instruction sheet for details.
16.5.4 Process readings are erratic
A. Readings are often erratic when a new sensor or a rebuilt sensor is first placed in service. The current usual-
ly stabilizes after a few hours.
B. Is the sample flow within the recommended range? High sample flow may cause erratic readings. Refer to the
sensor instruction sheet for recommended flow rates.
C. Are the holes between the membrane and the electrolyte reservoir open. Refer to Section 16.5.2.
D. Verify that wiring is correct. Pay particular attention to shield and ground connections.
E. If automatic pH correction is being used, check the pH reading. If the pH reading is noisy, the chlorine read-
ing will also be noisy. If the pH sensor is the cause of the noise, use manual pH correction until the problem
with the pH sensor can be corrected.
F. Is the membrane in good condition and is the sensor filled with electrolyte solution? Replace the fill solution
(499ACL-01) or electrolyte slurry (498CL-01). Refer to the sensor instruction manual for details.
16.5.5 Readings drift
A. Is the sample temperature changing? Membrane permeability is a function of temperature. The time constant
for the 499ACL-01 and 498CL-01 sensors is about five minutes. Therefore, the reading may drift for a while
after a sudden temperature change.
B. Is the membrane clean? For the sensor to work properly, chlorine must diffuse freely through the membrane.
A coating on the membrane will interfere with the passage of chlorine, resulting in slow response. Clean the
membrane by rinsing it with a stream of water from a wash bottle. DO NOT use a membrane or tissue to wipe
the membrane.
C. Is the sample flow within the recommended range? Gradual loss of sample flow will cause a downward drift.
D. Is the sensor new or has it been recently serviced? New or rebuilt sensors may require several hours to sta-
bilize.
E. Is the pH of the process changing? (Applies only to the 499ACL-01 sensor.) If manual pH correction is being
used, a gradual change in pH will cause a gradual change in the chlorine reading. As pH increases, chlorine
readings will decrease, even though the free chlorine level (as determined by a grab sample test) remained
constant. If the pH change is no more than about 0.2, the change in the chlorine reading will be no more than
about 10% of reading. If the pH changes are more than 0.2, use automatic pH correction.
Page 99

MODEL 54eA SECTION 16.0
TROUBLESHOOTING
16.5.6 Sensor does not respond to changes in chlorine level.
A. Is the grab sample test accurate? Is the grab sample representative of the sample flowing to the sensor?
B. Is the pH compensation correct? (Applies only to the 499ACL-01 sensor.) If the controller is using manual pH
correction, verify that the pH value in the controller equals the actual pH to within ±0.1 pH. If the controller is
using automatic pH correction, check the calibration of the pH sensor.
C. Is the membrane clean? Clean the membrane and replace it if necessary. Check that the holes at the base of
the cathode stem are open. Use a straightened paper clip to clear blockages. Replace the electrolyte solution.
D. Replace the sensor.
16.5.7 Chlorine readings spike following sudden changes in pH (499ACL-01 only).
Changes in pH alter the relative amounts of hypochlorous acid (HOCl) and hypochlorite ion (OCl-) in the sample. Because the sensor responds only to HOCl, an increase in pH causes the sensor current (and the apparent chlorine level) to drop even though the actual free chlorine concentration remained constant. To correct for
the pH effect, the controller automatically applies a correction. Generally, the pH sensor responds faster than
the chlorine sensor. After a sudden pH change, the controller will temporarily over-compensate and gradually
return to the correct value. The time constant for return to normal is about 5 minutes.
16.5.8 Chlorine readings are too low.
A. Was the sample tested as soon as it was taken? Chlorine solutions are unstable. Test the sample immediate-
ly after collecting it. Avoid exposing the sample to sunlight.
B. Low readings can be caused by zeroing the sensor before the residual current has reached a stable minimum
value. Residual current is the current the sensor generates even when no chlorine is in the sample. Because
the residual current is subtracted from subsequent measured currents, zeroing before the current is a minimum can lead to low results.
Example: The true residual current for a free chlorine sensor is 4 nA, and the sensitivity is 350 nA/ppm.
Assume the measured current is 200 nA. The true concentration is (200-4)/350 or 0.56 ppm. If the sensor was
zeroed prematurely when the current was 10 nA, the measured concentration will be (200-10)/350 or 0.54
ppm. The error is 3.6%. Suppose the measured current is 400 nA. The true concentration is 1.13 ppm, and
the measured concentration is 1.11 ppm. The error is now 1.8%. The absolute difference between the reading
remains the same, 0.02 ppm.
C. Sensor response depends on flow. If the flow is too low, readings will be low and flow sensitive. Verify that the
flow past the sensor equals or exceeds the minimum value. See the sensor instruction manual for recommended flows.
16.6 TROUBLESHOOTING WHEN NO FAULT MESSAGE IS SHOWING - TOTAL CHLORINE
Refer to the instruction manual for the TCL for a complete troubleshooting guide.
93
Page 100

MODEL 54eA SECTION 16.0
TROUBLESHOOTING
16.7 TROUBLESHOOTING WHEN NO ERROR MESSAGE IS SHOWING —
MONOCHLORAMINE
16.7.1 Zero current is too high
A. Is the sensor properly wired to the analyzer? See Section 3.3.
B. Is the zero solution monochloramine-free? Take a sample of the solution and test it for monochloramine level.
The concentration should be less than 0.02 ppm.
C. Has adequate time been allowed for the sensor to reach a minimum stable residual current? It may take sev-
eral hours, sometimes as long as overnight, for a new sensor to stabilize.
D. Check the membrane for damage and replace it if necessary. Be careful not to touch the membrane or cath-
ode. Touching the cathode mesh may damage it.
16.7.2 Zero current is unstable
A. Is the sensor properly wired to the analyzer? See Section 3.3. Verify that all wiring connections are tight.
B. Readings are often erratic when a new or rebuilt sensor is first placed in service. Readings usually stabilize
after about an hour.
C. Is the conductivity of the zero solution greater than 50 uS/cm? DO NOT USE DEIONIZED OR DISTILLED
WATER TO ZERO THE SENSOR. The zero solution should contain at least 0.5 grams of sodium chloride per
liter.
D. Is the space between the membrane and cathode mesh filled with electrolyte solution? Often the flow of elec-
trolyte and be started by simply holding the sensor with the membrane end pointing down and sharply shaking the sensor a few times as though shaking down a clinical thermometer.
Verify that the sensor is filled with electrolyte solution. Refer to the sensor instruction manual for details.
Problem See Section
Zero current was accepted, but the current is outside the range -10 to 50 nA 16.7.1
Error or warning message appears while zeroing the sensor (zero current is too high) 16.7.1
Zero current is unstable 16.7.2
Sensor can be calibrated, but the current is less than about 350 nA/ppm at 25°C 16.7.3
Process readings are erratic 16.7.4
Readings drift 16.7.5
Sensor does not respond to changes in monochloramine level 16.7.6
94
 Loading...