

Page 1

Configuration and Use Manual
P/N 20000327, Rev. FB
June 2011
Micro Motion
®
Model 2700 Transmitter
with PROFIBUS-PA
Configuration and Use Manual
Page 2

© 2011 Micro Motion, Inc. All rights reserved.
The Emerson logo is a trademark and service mark of Emerson Electric Co. Micro Motion, ELITE, ProLink, MVD and MVD Direct
Connect are marks of one of the Emerson Process Management family of companies. All other trademarks are property of their
respective owners.
Page 3

Contents
Chapter 1 Before You Begin . . . . . . . . . . . . . . . . . . . . . . . . . . . . . . . . . . . . . 1
1.1 Overview . . . . . . . . . . . . . . . . . . . . . . . . . . . . . . . . . . . . . . . . . . . . . . . . . . . . . . . . . . . 1
1.2 Safety . . . . . . . . . . . . . . . . . . . . . . . . . . . . . . . . . . . . . . . . . . . . . . . . . . . . . . . . . . . . . 1
1.3 Determining transmitter information . . . . . . . . . . . . . . . . . . . . . . . . . . . . . . . . . . . . . . 1
1.4 PROFIBUS-PA functionality . . . . . . . . . . . . . . . . . . . . . . . . . . . . . . . . . . . . . . . . . . . . 2
1.5 Determining version information . . . . . . . . . . . . . . . . . . . . . . . . . . . . . . . . . . . . . . . . . 2
1.6 Communication tools. . . . . . . . . . . . . . . . . . . . . . . . . . . . . . . . . . . . . . . . . . . . . . . . . . 3
1.7 Planning the configuration. . . . . . . . . . . . . . . . . . . . . . . . . . . . . . . . . . . . . . . . . . . . . . 4
1.8 Pre-configuration worksheet . . . . . . . . . . . . . . . . . . . . . . . . . . . . . . . . . . . . . . . . . . . . 5
1.9 Flowmeter documentation . . . . . . . . . . . . . . . . . . . . . . . . . . . . . . . . . . . . . . . . . . . . . . 6
1.10 Micro Motion customer service . . . . . . . . . . . . . . . . . . . . . . . . . . . . . . . . . . . . . . . . . . 6
Chapter 2 Startup . . . . . . . . . . . . . . . . . . . . . . . . . . . . . . . . . . . . . . . . . . . . 7
2.1 Overview . . . . . . . . . . . . . . . . . . . . . . . . . . . . . . . . . . . . . . . . . . . . . . . . . . . . . . . . . . . 7
2.2 Applying power . . . . . . . . . . . . . . . . . . . . . . . . . . . . . . . . . . . . . . . . . . . . . . . . . . . . . . 7
2.3 Setting the node address . . . . . . . . . . . . . . . . . . . . . . . . . . . . . . . . . . . . . . . . . . . . . . 8
2.4 Configuring the analog input function block channels. . . . . . . . . . . . . . . . . . . . . . . . . 8
2.5 Setting the I/O mode . . . . . . . . . . . . . . . . . . . . . . . . . . . . . . . . . . . . . . . . . . . . . . . . . 10
2.5.1 Overriding the status byte format . . . . . . . . . . . . . . . . . . . . . . . . . . . . . . . 11
2.6 Configuring the totalizer block mode . . . . . . . . . . . . . . . . . . . . . . . . . . . . . . . . . . . . . 11
2.7 Configuring pressure compensation . . . . . . . . . . . . . . . . . . . . . . . . . . . . . . . . . . . . . 13
2.7.1 Pressure compensation values . . . . . . . . . . . . . . . . . . . . . . . . . . . . . . . . 13
2.7.2 Enabling pressure compensation. . . . . . . . . . . . . . . . . . . . . . . . . . . . . . . 14
2.7.3 Configuring a pressure source. . . . . . . . . . . . . . . . . . . . . . . . . . . . . . . . . 15
2.8 Configuring temperature compensation . . . . . . . . . . . . . . . . . . . . . . . . . . . . . . . . . . 16
2.8.1 Enabling external temperature compensation . . . . . . . . . . . . . . . . . . . . . 16
2.8.2 Configuring a temperature source . . . . . . . . . . . . . . . . . . . . . . . . . . . . . . 17
Chapter 3 Calibration . . . . . . . . . . . . . . . . . . . . . . . . . . . . . . . . . . . . . . . . 19
3.1 Overview . . . . . . . . . . . . . . . . . . . . . . . . . . . . . . . . . . . . . . . . . . . . . . . . . . . . . . . . . . 19
3.2 Characterization, Smart Meter Verification, meter validation, and calibration . . . . . . 19
3.2.1 Characterization. . . . . . . . . . . . . . . . . . . . . . . . . . . . . . . . . . . . . . . . . . . . 20
3.2.2 Smart Meter Verification . . . . . . . . . . . . . . . . . . . . . . . . . . . . . . . . . . . . . 20
3.2.3 Meter validation and meter factors. . . . . . . . . . . . . . . . . . . . . . . . . . . . . . 20
3.2.4 Calibration . . . . . . . . . . . . . . . . . . . . . . . . . . . . . . . . . . . . . . . . . . . . . . . . 20
3.2.5 Comparison and recommendations. . . . . . . . . . . . . . . . . . . . . . . . . . . . . 21
3.3 Performing a characterization . . . . . . . . . . . . . . . . . . . . . . . . . . . . . . . . . . . . . . . . . . 22
3.3.1 Characterization parameters . . . . . . . . . . . . . . . . . . . . . . . . . . . . . . . . . . 22
3.3.2 How to characterize . . . . . . . . . . . . . . . . . . . . . . . . . . . . . . . . . . . . . . . . . 24
3.4 Performing Smart Meter Verification . . . . . . . . . . . . . . . . . . . . . . . . . . . . . . . . . . . . . 26
3.4.1 Preparing for the Smart Meter Verification test . . . . . . . . . . . . . . . . . . . . 26
3.4.2 Running the Smart Meter Verification test . . . . . . . . . . . . . . . . . . . . . . . . 26
3.4.3 Reading and interpreting Smart Meter Verification test results . . . . . . . . 31
3.4.4 Setting up automatic or remote execution of the
Smart Meter Verification test . . . . . . . . . . . . . . . . . . . . . . . . . . . . . . . . . . 34
Configuration and Use Manual iii
Page 4

Contents
3.5 Performing meter validation . . . . . . . . . . . . . . . . . . . . . . . . . . . . . . . . . . . . . . . . . . . 35
3.6 Performing zero calibration . . . . . . . . . . . . . . . . . . . . . . . . . . . . . . . . . . . . . . . . . . . . 37
3.6.1 Preparing for the zeroing procedure . . . . . . . . . . . . . . . . . . . . . . . . . . . . 37
3.6.2 Zeroing procedure . . . . . . . . . . . . . . . . . . . . . . . . . . . . . . . . . . . . . . . . . . 37
3.7 Performing density calibration. . . . . . . . . . . . . . . . . . . . . . . . . . . . . . . . . . . . . . . . . . 39
3.7.1 Preparing for density calibration . . . . . . . . . . . . . . . . . . . . . . . . . . . . . . . 40
3.7.2 Density calibration procedure . . . . . . . . . . . . . . . . . . . . . . . . . . . . . . . . . 40
3.8 Performing temperature calibration. . . . . . . . . . . . . . . . . . . . . . . . . . . . . . . . . . . . . . 44
Chapter 4 Configuration. . . . . . . . . . . . . . . . . . . . . . . . . . . . . . . . . . . . . . . 47
4.1 Overview . . . . . . . . . . . . . . . . . . . . . . . . . . . . . . . . . . . . . . . . . . . . . . . . . . . . . . . . . . 47
4.2 Default target mode . . . . . . . . . . . . . . . . . . . . . . . . . . . . . . . . . . . . . . . . . . . . . . . . . 47
4.3 Configuration map. . . . . . . . . . . . . . . . . . . . . . . . . . . . . . . . . . . . . . . . . . . . . . . . . . . 47
4.4 Configuring standard volume flow measurement for gas . . . . . . . . . . . . . . . . . . . . . 48
4.5 Changing the measurement units. . . . . . . . . . . . . . . . . . . . . . . . . . . . . . . . . . . . . . . 51
4.6 Configuring the petroleum measurement application . . . . . . . . . . . . . . . . . . . . . . . . 55
4.6.1 About the petroleum measurement application . . . . . . . . . . . . . . . . . . . . 55
4.6.2 Configuration procedure . . . . . . . . . . . . . . . . . . . . . . . . . . . . . . . . . . . . . 57
4.7 Configuring the concentration measurement application . . . . . . . . . . . . . . . . . . . . . 59
4.7.1 About the concentration measurement application . . . . . . . . . . . . . . . . . 59
4.7.2 Configuration procedure . . . . . . . . . . . . . . . . . . . . . . . . . . . . . . . . . . . . . 61
4.8 Changing the output scale . . . . . . . . . . . . . . . . . . . . . . . . . . . . . . . . . . . . . . . . . . . . 62
4.9 Changing process alarms. . . . . . . . . . . . . . . . . . . . . . . . . . . . . . . . . . . . . . . . . . . . . 63
4.9.1 Alarm values . . . . . . . . . . . . . . . . . . . . . . . . . . . . . . . . . . . . . . . . . . . . . . 63
4.9.2 Alarm hysteresis . . . . . . . . . . . . . . . . . . . . . . . . . . . . . . . . . . . . . . . . . . . 65
4.10 Configuring status alarm severity . . . . . . . . . . . . . . . . . . . . . . . . . . . . . . . . . . . . . . . 66
4.11 Changing the damping values . . . . . . . . . . . . . . . . . . . . . . . . . . . . . . . . . . . . . . . . . 68
4.11.1 Damping and volume measurement . . . . . . . . . . . . . . . . . . . . . . . . . . . . 70
4.12 Changing slug flow limits and duration . . . . . . . . . . . . . . . . . . . . . . . . . . . . . . . . . . . 70
4.13 Configuring cutoffs . . . . . . . . . . . . . . . . . . . . . . . . . . . . . . . . . . . . . . . . . . . . . . . . . . 71
4.14 Changing the measurement mode parameter . . . . . . . . . . . . . . . . . . . . . . . . . . . . . 73
4.15 Configuring sensor parameters. . . . . . . . . . . . . . . . . . . . . . . . . . . . . . . . . . . . . . . . . 74
4.16 Configuring the display . . . . . . . . . . . . . . . . . . . . . . . . . . . . . . . . . . . . . . . . . . . . . . 75
4.16.1 Enabling and disabling display functions . . . . . . . . . . . . . . . . . . . . . . . . . 75
4.16.2 Changing the scroll rate. . . . . . . . . . . . . . . . . . . . . . . . . . . . . . . . . . . . . . 77
4.16.3 Changing the update period . . . . . . . . . . . . . . . . . . . . . . . . . . . . . . . . . . 77
4.16.4 Changing the off-line password . . . . . . . . . . . . . . . . . . . . . . . . . . . . . . . 77
4.16.5 Changing the display language . . . . . . . . . . . . . . . . . . . . . . . . . . . . . . . . 77
4.16.6 Changing the display variables and precision . . . . . . . . . . . . . . . . . . . . . 78
4.17 Enabling LD Optimization . . . . . . . . . . . . . . . . . . . . . . . . . . . . . . . . . . . . . . . . . . . . . 80
Chapter 5 Operation . . . . . . . . . . . . . . . . . . . . . . . . . . . . . . . . . . . . . . . . . 83
5.1 Overview . . . . . . . . . . . . . . . . . . . . . . . . . . . . . . . . . . . . . . . . . . . . . . . . . . . . . . . . . . 83
5.2 Using the I&M functions . . . . . . . . . . . . . . . . . . . . . . . . . . . . . . . . . . . . . . . . . . . . . . 83
5.3 Recording process variables. . . . . . . . . . . . . . . . . . . . . . . . . . . . . . . . . . . . . . . . . . . 83
5.4 Viewing process variables. . . . . . . . . . . . . . . . . . . . . . . . . . . . . . . . . . . . . . . . . . . . . 84
5.4.1 With the display . . . . . . . . . . . . . . . . . . . . . . . . . . . . . . . . . . . . . . . . . . . . 84
5.4.2 With ProLink II . . . . . . . . . . . . . . . . . . . . . . . . . . . . . . . . . . . . . . . . . . . . . 85
5.4.3 With PROFIBUS EDD . . . . . . . . . . . . . . . . . . . . . . . . . . . . . . . . . . . . . . . 85
5.4.4 With bus parameters . . . . . . . . . . . . . . . . . . . . . . . . . . . . . . . . . . . . . . . . 85
5.5 Using sensor simulation mode . . . . . . . . . . . . . . . . . . . . . . . . . . . . . . . . . . . . . . . . . 85
5.6 Accessing diagnostic information with a PROFIBUS host . . . . . . . . . . . . . . . . . . . . 86
iv Model 2700 Transmitter with PROFIBUS-PA
Page 5

Contents
5.7 Viewing transmitter status and alarms . . . . . . . . . . . . . . . . . . . . . . . . . . . . . . . . . . . 86
5.7.1 With the display . . . . . . . . . . . . . . . . . . . . . . . . . . . . . . . . . . . . . . . . . . . . 86
5.7.2 With ProLink II . . . . . . . . . . . . . . . . . . . . . . . . . . . . . . . . . . . . . . . . . . . . . 87
5.7.3 With EDD . . . . . . . . . . . . . . . . . . . . . . . . . . . . . . . . . . . . . . . . . . . . . . . . . 88
5.7.4 With bus parameters . . . . . . . . . . . . . . . . . . . . . . . . . . . . . . . . . . . . . . . . 88
5.8 Using the totalizers and inventories . . . . . . . . . . . . . . . . . . . . . . . . . . . . . . . . . . . . . 88
5.8.1 Viewing current values for totalizers and inventories . . . . . . . . . . . . . . . . 88
5.8.2 Controlling the totalizers and inventories . . . . . . . . . . . . . . . . . . . . . . . . . 90
Chapter 6 Troubleshooting . . . . . . . . . . . . . . . . . . . . . . . . . . . . . . . . . . . . . 93
6.1 Overview . . . . . . . . . . . . . . . . . . . . . . . . . . . . . . . . . . . . . . . . . . . . . . . . . . . . . . . . . . 93
6.2 Guide to troubleshooting topics. . . . . . . . . . . . . . . . . . . . . . . . . . . . . . . . . . . . . . . . . 93
6.3 Transmitter does not operate. . . . . . . . . . . . . . . . . . . . . . . . . . . . . . . . . . . . . . . . . . . 93
6.4 Transmitter does not communicate . . . . . . . . . . . . . . . . . . . . . . . . . . . . . . . . . . . . . . 94
6.5 Function blocks in Out-of-Service mode . . . . . . . . . . . . . . . . . . . . . . . . . . . . . . . . . . 94
6.6 Zero or calibration failure. . . . . . . . . . . . . . . . . . . . . . . . . . . . . . . . . . . . . . . . . . . . . . 94
6.7 Output problems . . . . . . . . . . . . . . . . . . . . . . . . . . . . . . . . . . . . . . . . . . . . . . . . . . . . 95
6.7.1 Damping. . . . . . . . . . . . . . . . . . . . . . . . . . . . . . . . . . . . . . . . . . . . . . . . . . 98
6.7.2 Low-flow cutoff . . . . . . . . . . . . . . . . . . . . . . . . . . . . . . . . . . . . . . . . . . . . . 98
6.7.3 Output scale. . . . . . . . . . . . . . . . . . . . . . . . . . . . . . . . . . . . . . . . . . . . . . . 98
6.7.4 Characterization. . . . . . . . . . . . . . . . . . . . . . . . . . . . . . . . . . . . . . . . . . . . 98
6.7.5 Calibration . . . . . . . . . . . . . . . . . . . . . . . . . . . . . . . . . . . . . . . . . . . . . . . . 98
6.8 Status alarms . . . . . . . . . . . . . . . . . . . . . . . . . . . . . . . . . . . . . . . . . . . . . . . . . . . . . . 99
6.9 Diagnosing wiring problems . . . . . . . . . . . . . . . . . . . . . . . . . . . . . . . . . . . . . . . . . . 102
6.9.1 Checking the power-supply wiring . . . . . . . . . . . . . . . . . . . . . . . . . . . . . 102
6.9.2 Checking the sensor-to-transmitter wiring . . . . . . . . . . . . . . . . . . . . . . . 102
6.9.3 Checking the grounding . . . . . . . . . . . . . . . . . . . . . . . . . . . . . . . . . . . . . 103
6.9.4 Checking the communication wiring . . . . . . . . . . . . . . . . . . . . . . . . . . . 103
6.10 Checking slug flow . . . . . . . . . . . . . . . . . . . . . . . . . . . . . . . . . . . . . . . . . . . . . . . . . 103
6.11 Restoring a working configuration. . . . . . . . . . . . . . . . . . . . . . . . . . . . . . . . . . . . . . 103
6.12 Checking the test points . . . . . . . . . . . . . . . . . . . . . . . . . . . . . . . . . . . . . . . . . . . . . 104
6.12.1 Obtaining the test points . . . . . . . . . . . . . . . . . . . . . . . . . . . . . . . . . . . . 104
6.12.2 Evaluating the test points . . . . . . . . . . . . . . . . . . . . . . . . . . . . . . . . . . . . 104
6.12.3 Excessive drive gain . . . . . . . . . . . . . . . . . . . . . . . . . . . . . . . . . . . . . . . 105
6.12.4 Erratic drive gain . . . . . . . . . . . . . . . . . . . . . . . . . . . . . . . . . . . . . . . . . . 105
6.12.5 Low pickoff voltage. . . . . . . . . . . . . . . . . . . . . . . . . . . . . . . . . . . . . . . . . 106
6.13 Checking the core processor . . . . . . . . . . . . . . . . . . . . . . . . . . . . . . . . . . . . . . . . . 107
6.13.1 Exposing the core processor . . . . . . . . . . . . . . . . . . . . . . . . . . . . . . . . . 107
6.13.2 Checking the core processor LED . . . . . . . . . . . . . . . . . . . . . . . . . . . . . 108
6.13.3 Core processor resistance test . . . . . . . . . . . . . . . . . . . . . . . . . . . . . . . 109
6.14 Checking sensor coils and RTD . . . . . . . . . . . . . . . . . . . . . . . . . . . . . . . . . . . . . . . 110
6.14.1 9-wire remote or remote core processor with
remote transmitter installation . . . . . . . . . . . . . . . . . . . . . . . . . . . . . . . . 110
6.14.2 4-wire remote or integral installation . . . . . . . . . . . . . . . . . . . . . . . . . . . 111
Appendix A Flowmeter Installation Types and Components . . . . . . . . . . . . . . . 115
A.1 Overview . . . . . . . . . . . . . . . . . . . . . . . . . . . . . . . . . . . . . . . . . . . . . . . . . . . . . . . . . 115
A.2 Installation diagrams . . . . . . . . . . . . . . . . . . . . . . . . . . . . . . . . . . . . . . . . . . . . . . . . 115
A.3 Component diagrams . . . . . . . . . . . . . . . . . . . . . . . . . . . . . . . . . . . . . . . . . . . . . . . 115
A.4 Wiring and terminal diagrams . . . . . . . . . . . . . . . . . . . . . . . . . . . . . . . . . . . . . . . . . 115
Configuration and Use Manual v
Page 6

Contents
Appendix B Using the Display. . . . . . . . . . . . . . . . . . . . . . . . . . . . . . . . . . . 121
B.1 Overview . . . . . . . . . . . . . . . . . . . . . . . . . . . . . . . . . . . . . . . . . . . . . . . . . . . . . . . . . 121
B.2 Components . . . . . . . . . . . . . . . . . . . . . . . . . . . . . . . . . . . . . . . . . . . . . . . . . . . . . . 121
B.3 Using the optical switches. . . . . . . . . . . . . . . . . . . . . . . . . . . . . . . . . . . . . . . . . . . . 122
B.4 Using the display. . . . . . . . . . . . . . . . . . . . . . . . . . . . . . . . . . . . . . . . . . . . . . . . . . . 122
B.4.1 Display language . . . . . . . . . . . . . . . . . . . . . . . . . . . . . . . . . . . . . . . . . . 122
B.4.2 Viewing process variables . . . . . . . . . . . . . . . . . . . . . . . . . . . . . . . . . . . 122
B.4.3 Using display menus . . . . . . . . . . . . . . . . . . . . . . . . . . . . . . . . . . . . . . . 123
B.4.4 Display password. . . . . . . . . . . . . . . . . . . . . . . . . . . . . . . . . . . . . . . . . . 123
B.4.5 Entering floating-point values with the display. . . . . . . . . . . . . . . . . . . . 124
B.5 Abbreviations . . . . . . . . . . . . . . . . . . . . . . . . . . . . . . . . . . . . . . . . . . . . . . . . . . . . . 126
B.6 Display menus . . . . . . . . . . . . . . . . . . . . . . . . . . . . . . . . . . . . . . . . . . . . . . . . . . . . 127
Appendix C Connecting with ProLink II. . . . . . . . . . . . . . . . . . . . . . . . . . . . . 135
C.1 Overview . . . . . . . . . . . . . . . . . . . . . . . . . . . . . . . . . . . . . . . . . . . . . . . . . . . . . . . . . 135
C.2 Connecting to a personal computer . . . . . . . . . . . . . . . . . . . . . . . . . . . . . . . . . . . . 135
C.2.1 Connecting to the service port. . . . . . . . . . . . . . . . . . . . . . . . . . . . . . . . 136
Appendix D PROFIBUS-PA Status Byte . . . . . . . . . . . . . . . . . . . . . . . . . . . . . 137
D.1 Overview . . . . . . . . . . . . . . . . . . . . . . . . . . . . . . . . . . . . . . . . . . . . . . . . . . . . . . . . . 137
D.2 Classic-mode status byte format. . . . . . . . . . . . . . . . . . . . . . . . . . . . . . . . . . . . . . . 137
D.3 Condensed-mode status byte format . . . . . . . . . . . . . . . . . . . . . . . . . . . . . . . . . . . 139
Appendix E Slave Diagnostic Response Bytes. . . . . . . . . . . . . . . . . . . . . . . . 141
E.1 Overview . . . . . . . . . . . . . . . . . . . . . . . . . . . . . . . . . . . . . . . . . . . . . . . . . . . . . . . . . 141
E.2 PROFIBUS specification diagnostic bytes . . . . . . . . . . . . . . . . . . . . . . . . . . . . . . . 141
Appendix F Model 2700 PROFIBUS Block Parameters . . . . . . . . . . . . . . . . . . 151
F.1 Overview . . . . . . . . . . . . . . . . . . . . . . . . . . . . . . . . . . . . . . . . . . . . . . . . . . . . . . . . . 151
F.2 Slot identification. . . . . . . . . . . . . . . . . . . . . . . . . . . . . . . . . . . . . . . . . . . . . . . . . . . 151
F.3 Physical block . . . . . . . . . . . . . . . . . . . . . . . . . . . . . . . . . . . . . . . . . . . . . . . . . . . . . 151
F.3.1 Physical block object . . . . . . . . . . . . . . . . . . . . . . . . . . . . . . . . . . . . . . . 153
F.3.2 Physical block views . . . . . . . . . . . . . . . . . . . . . . . . . . . . . . . . . . . . . . . 154
F.4 Transducer block 1 (measurement, calibration, and diagnosis) . . . . . . . . . . . . . . . 154
F.4.1 Transducer block 1 object . . . . . . . . . . . . . . . . . . . . . . . . . . . . . . . . . . . 170
F.4.2 Transducer block 1 (measurement, calibration,
and diagnosis) views . . . . . . . . . . . . . . . . . . . . . . . . . . . . . . . . . . . . . . . 171
F.4.3 Transducer block 2 (device information, API, CM) parameters . . . . . . . 172
F.4.4 Transducer block 2 object . . . . . . . . . . . . . . . . . . . . . . . . . . . . . . . . . . . 176
F.4.5 Transducer block 2 (device information, API, CM) views . . . . . . . . . . . . 177
F.4.6 I & M functions . . . . . . . . . . . . . . . . . . . . . . . . . . . . . . . . . . . . . . . . . . . . 177
F.4.7 AI function block parameters . . . . . . . . . . . . . . . . . . . . . . . . . . . . . . . . . 179
F.4.8 Analog input block objects . . . . . . . . . . . . . . . . . . . . . . . . . . . . . . . . . . . 181
F.4.9 AI function block views . . . . . . . . . . . . . . . . . . . . . . . . . . . . . . . . . . . . . 181
F.4.10 AO function block parameters . . . . . . . . . . . . . . . . . . . . . . . . . . . . . . . . 182
F.4.11 Analog output block objects . . . . . . . . . . . . . . . . . . . . . . . . . . . . . . . . . . 184
F.4.12 AO function block views. . . . . . . . . . . . . . . . . . . . . . . . . . . . . . . . . . . . . 184
F.4.13 Totalizer block parameters . . . . . . . . . . . . . . . . . . . . . . . . . . . . . . . . . . . 185
F.4.14 Totalizer block objects . . . . . . . . . . . . . . . . . . . . . . . . . . . . . . . . . . . . . . 187
F.4.15 Totalizer function block views. . . . . . . . . . . . . . . . . . . . . . . . . . . . . . . . . 187
vi Model 2700 Transmitter with PROFIBUS-PA
Page 7

Contents
Appendix G NE53 History . . . . . . . . . . . . . . . . . . . . . . . . . . . . . . . . . . . . . . 189
G.1 Overview . . . . . . . . . . . . . . . . . . . . . . . . . . . . . . . . . . . . . . . . . . . . . . . . . . . . . . . . . 189
G.2 Software change history . . . . . . . . . . . . . . . . . . . . . . . . . . . . . . . . . . . . . . . . . . . . . 189
Index . . . . . . . . . . . . . . . . . . . . . . . . . . . . . . . . . . . . . . . . . . . . . . . . . . . . 191
Configuration and Use Manual vii
Page 8

viii Model 2700 Transmitter with PROFIBUS-PA
Page 9

Chapter 1
2700 * 1 * G * * * * * *
Mounting code:
• R = 4-wire remote mount
• I = Integral mount
• B = 4-wire remote mount to 9-wire remote core processor
• C = 9-wire remote mount
Display code
• 1 = Display with glass lens
• 2 = Backlit display with glass lens
• 3 = No display
• 5 = Backlit display with IIC approval, glass lens
• 7 = Backlit display with non-glass lens
Output option code
• G = PROFIBUS-PA
Software code 1:
G = Concentration measurement application
A = Petroleum measurement (API) application
Software code 2:
C = Smart Meter Verification
Before You Begin
1.1 Overview
This chapter provides an orientation to the use of this manual, and includes a configuration overview
flowchart and a pre-configuration worksheet. This manual describes the procedures required to start,
configure, use, maintain, and troubleshoot Micro Motion
PROFIBUS-PA.
®
Model 2700 transmitters with
1.2 Safety
Safety messages are provided throughout this manual to protect personnel and equipment. Read each
safety message carefully before proceeding to the next step.
1.3 Determining transmitter information
Transmitter options are indicated by the model number located on the transmitter tag. The model
number is a string of the following form:
Startup ConfigurationCalibrationBefore You Begin
Configuration and Use Manual 1
Page 10

Before You Begin
1.4 PROFIBUS-PA functionality
The transmitter supports the following methods of configuration and operation:
• Configuration methods:
- Device description (EDD) for use with a PROFIBUS configuration tool such as Siemens
Simatic
®
Process Device Manager (PDM). In this manual, the term “EDD” is used to refer
to this type of configuration.
- Direct read and write of PROFIBUS-PA bus parameters.
• Operation methods:
- GSD file with a PROFIBUS host. The transmitter supports two GSD options—
Profile-specific, which is created by PNO, and Manufacturer-specific, which is created by
by Micro Motion in order to implement a larger set of function blocks. See Section 2.5 for
more information about the two GSD options.
In this manual, the term “host” or “PROFIBUS host” is used to refer to this type of
operation.
- Device description (EDD) with PROFIBUS configuration tool (e.g., Simatic PDM). The
EDD provides a superset of the operational functionality of the GSD, plus configuration
capability.
• Identification and maintenance (I&M) functions:
®
-I&M 0
-I&M 1
-I&M 2
-PA I&M 0
The transmitter supports both classic and condensed status byte formats.
• Classic mode conforms to the PROFIBUS-PA Profile v3.01, Section 3.7.3.6.
• Condensed mode conforms to the PROFIBUS-PA Specification June 2005 Amendment 2 to
the PROFIBUS Profile v3.01, Condensed Status and Diagnostic Messages v1.0.
1.5 Determining version information
Table 1-1 lists the version information you may need to know and describes how to obtain the
information. This manual assumes transmitter firmware v3.2 or a later version and ProLink v2.92
with the Build 9827 patch or a later version.
Note: The hardware for transmitters with v2.0 and lower firmware is incompatible with the hardware
needed to support v3.0 and later firmware. To upgrade from an earlier firmware version to v3.0 or
higher firmware requires hardware replacement.
Table 1-1 Obtaining version information
Component Tool Method
Transmitter software With ProLink II View > Installed Options > Software Revision
With EDD MMI Coriolis Flow > Transducer Block > Device
Information > Software Rev
With display OFF-LINE MAINT > VER
2 Model 2700 Transmitter with PROFIBUS-PA
Page 11

Before You Begin
Table 1-1 Obtaining version information (continued)
Component Tool Method
Core processor software With ProLink II Not available
ProLink II With ProLink II Help > About ProLink II
GSD version
EDD version Text editor Open file MMIcorflow.DDL and check parameter
(1) There are two GSD options available: Manufacturer-specific and Profile-specific. See Section 2.5 for more information.
(1)
1.6 Communication tools
Most of the procedures described in this manual require the use of a communication tool. Table 1-2
lists the communication tools that can be used, with their functionality and requirements.
Note: You can use ProLink II, the EDD, or PROFIBUS bus parameters for transmitter setup and
maintenance. It is not necessary to have more than one of these methods available.
With EDD Not available
With display OFF-LINE MAINT > VER
Text editor Open file V3x_057A.gsd or PA139742.GSD and
check parameter GSD_Revision
DD_REVISION
Startup ConfigurationCalibrationBefore You Begin
Table 1-2 Communication tools for Model 2700 transmitter with PROFIBUS-PA
Functionality
Tool
Transmitter display Partial Partial Transmitter with display
ProLink II Full Full ProLink II v2.92 or later
(1)
Host
EDD Full Full PDM file set
Bus parameters Full Full None
(1) There are two GSD options available: Manufacturer-specific and Profile-specific. See Section 2.5 for more information.
Partial None GSD file V3x_057A.gsd or
RequirementsView/operation Setup/maintenance
PA139742.GSD
The PDM and GSD files can be downloaded from the following address:
http://www.emersonprocess.com/micromotion/softwaredownloads
Also available at this address is a document titled Commissioning MVD Profibus PA Documentation
®
Supplement. This supplement will assist you with connecting to the transmitter with Siemens
Simatic
®
Process Device Manager (PDM). If you are using Simatic PDM, download the PDM file set
and follow the EDD instructions in this manual.
Basic information on using the display is provided in Appendix B.
Basic information on ProLink II is provided in Appendix C. For more information, refer to the
ProLink II manual, which is available on the Micro Motion web site (www.micromotion.com).
Although some functions of the Model 2700 transmitter with PROFIBUS-PA may be available
through earlier versions of ProLink II, version 2.92 with the Build 9827 patch or a later version is
required for full configuration, maintenance, and operation.
Configuration and Use Manual 3
Page 12
Before You Begin
Chapter 2
Flowmeter Startup
Chapter 1
Before You Begin
Fill out pre-configuration
worksheet
Apply power
Set node address
Chapter 3
Calibration
OPTIONAL
Characterize the flowmeter
Zero the flowmeter
Verify meter performance
Validate against a standard
Calibrate for density
Calibrate for temperature
Chapter 4
Configuration
Configure AI function block
channels
Set I/O mode
Measurement units
Output scale
Process alarms
Damping
Slug flow
Alarm severity
Gas standard volume
Petroleum measurement
Concentration measurement
Cutoffs
Measurement mode
Device settings
Sensor parameters
Display functionality
Optional:
Configure pressure
compensation
Optional:
Configure temperature
compensation
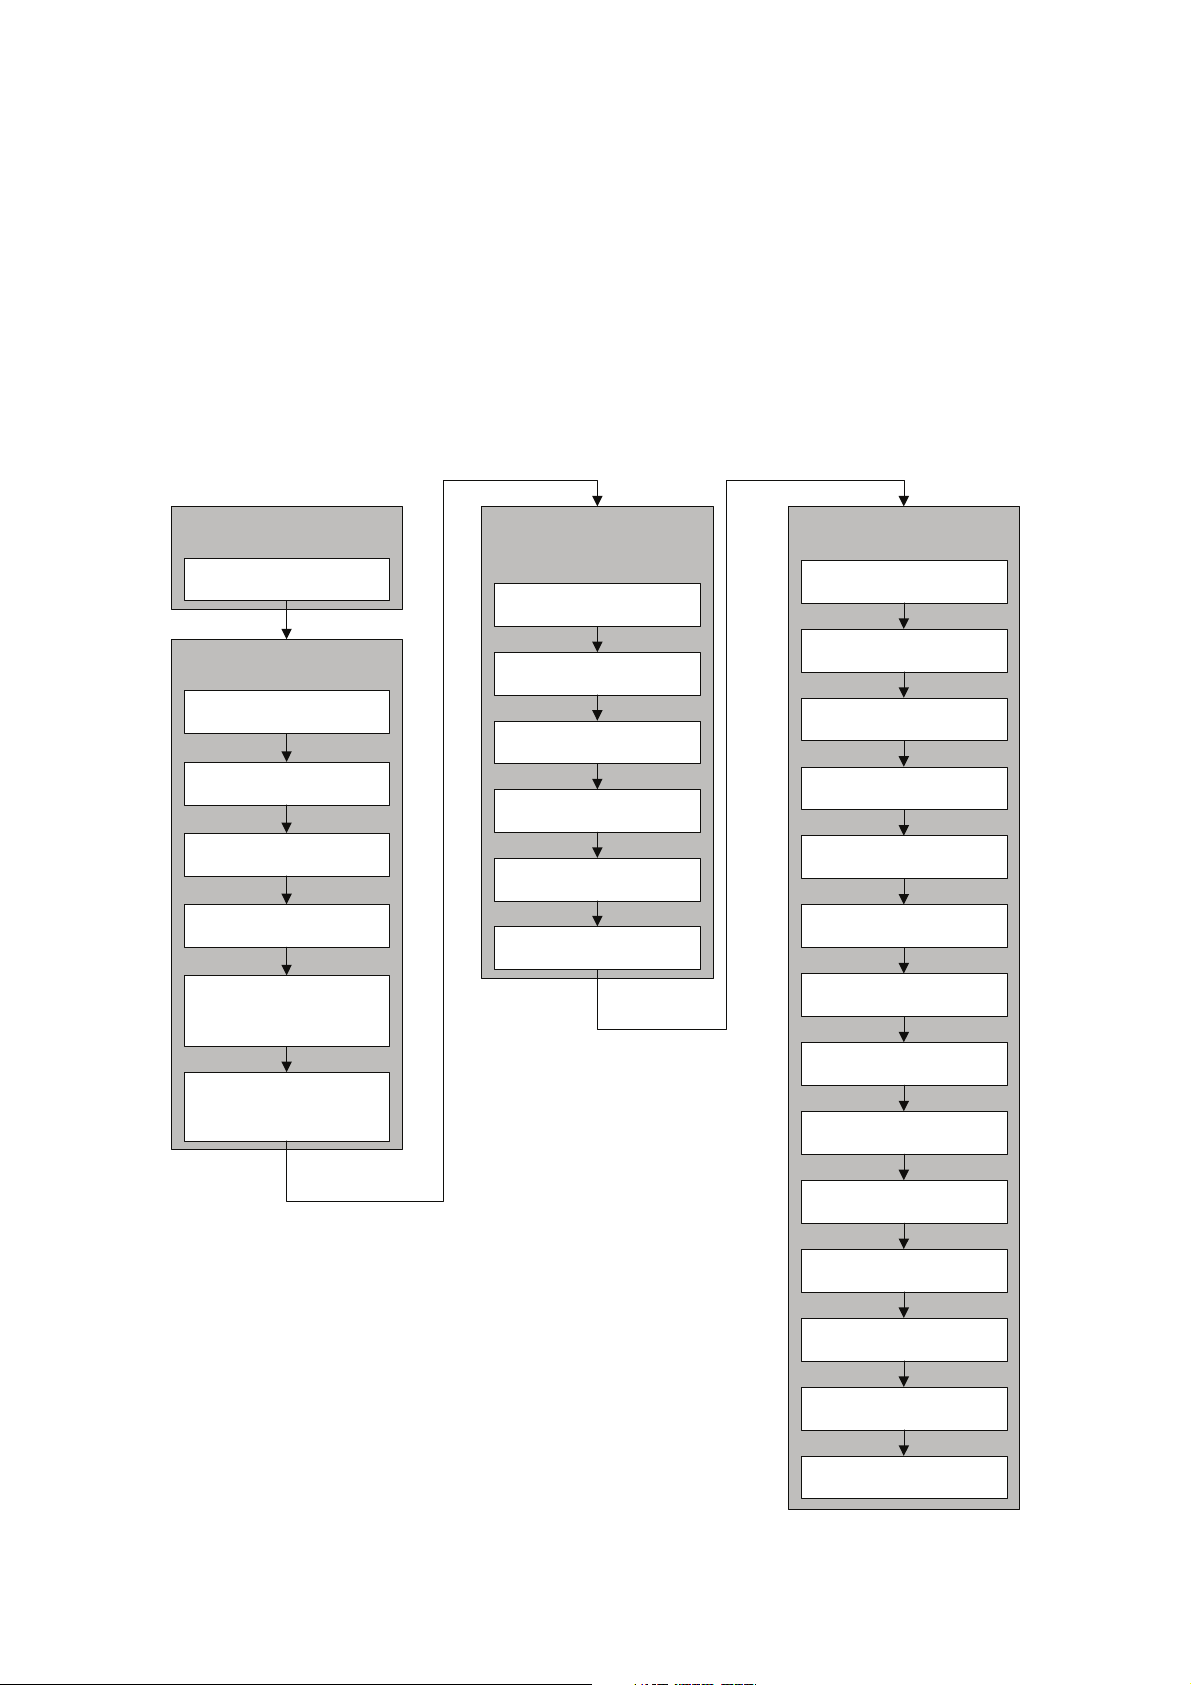
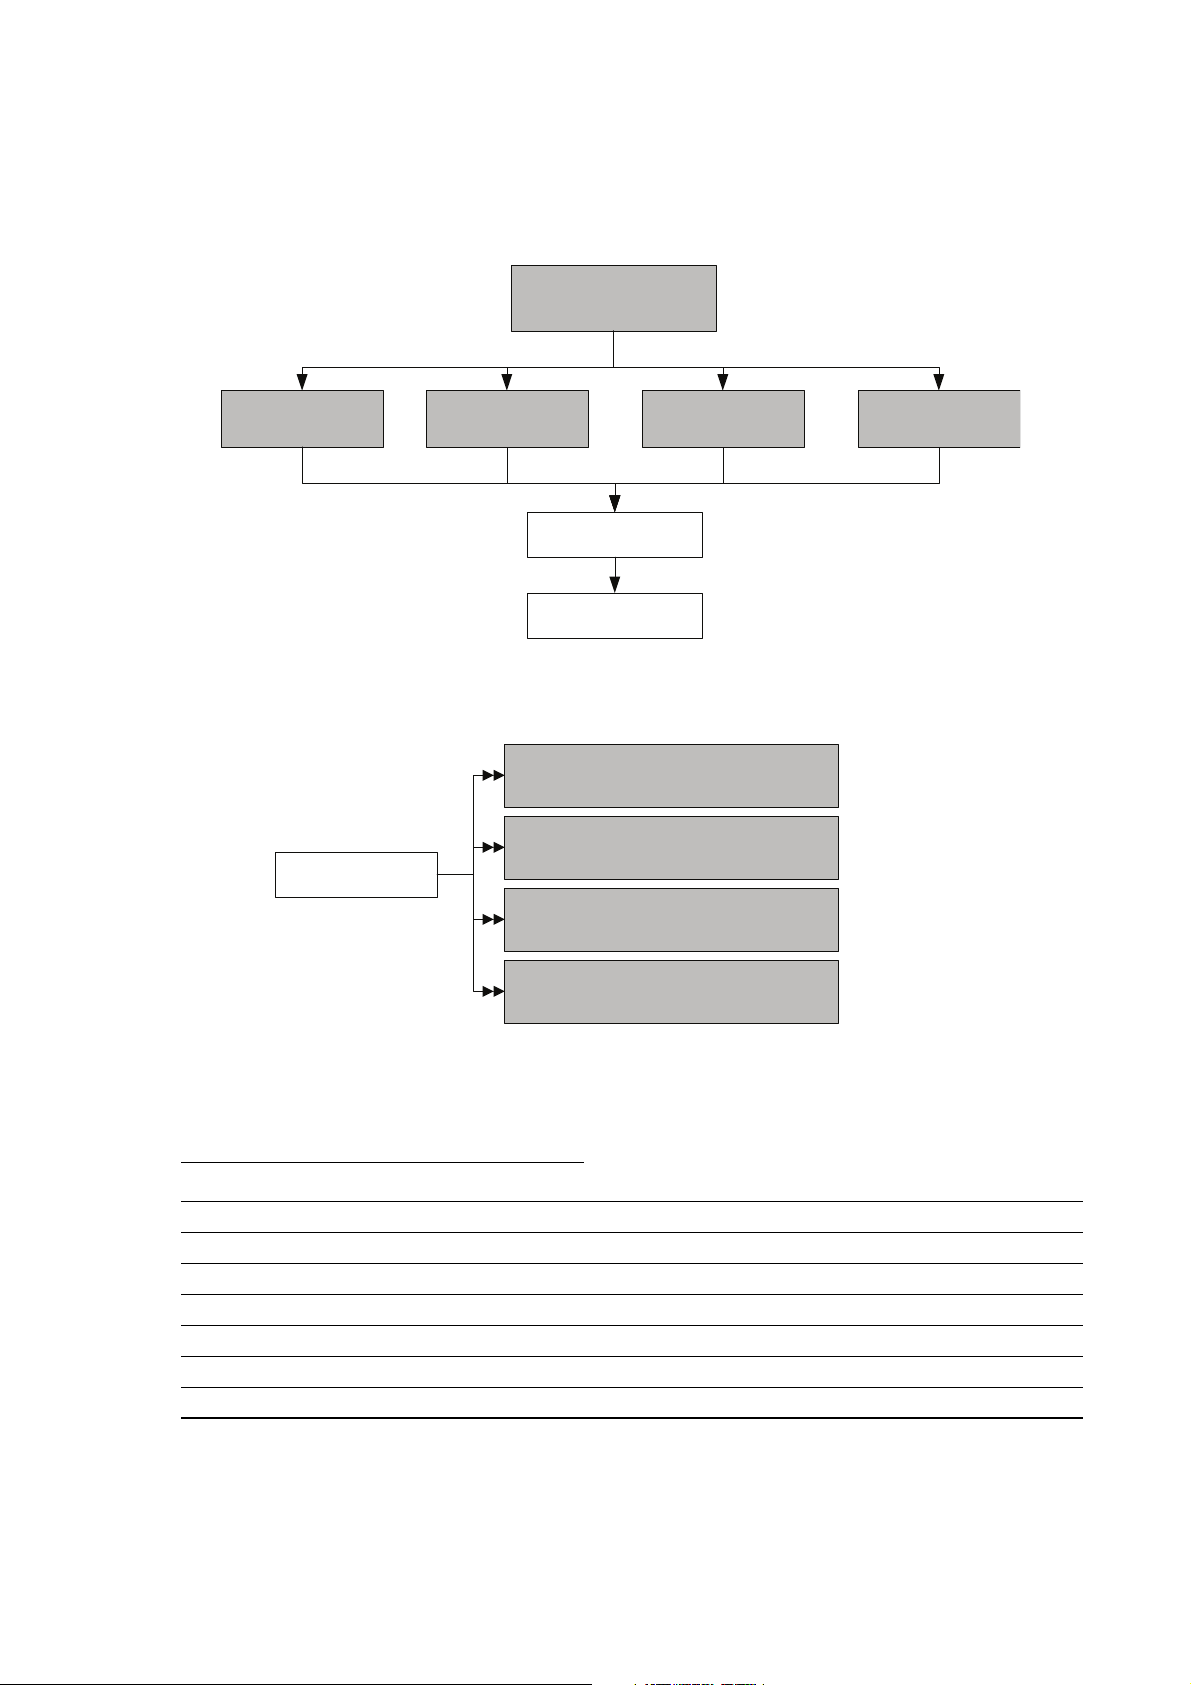
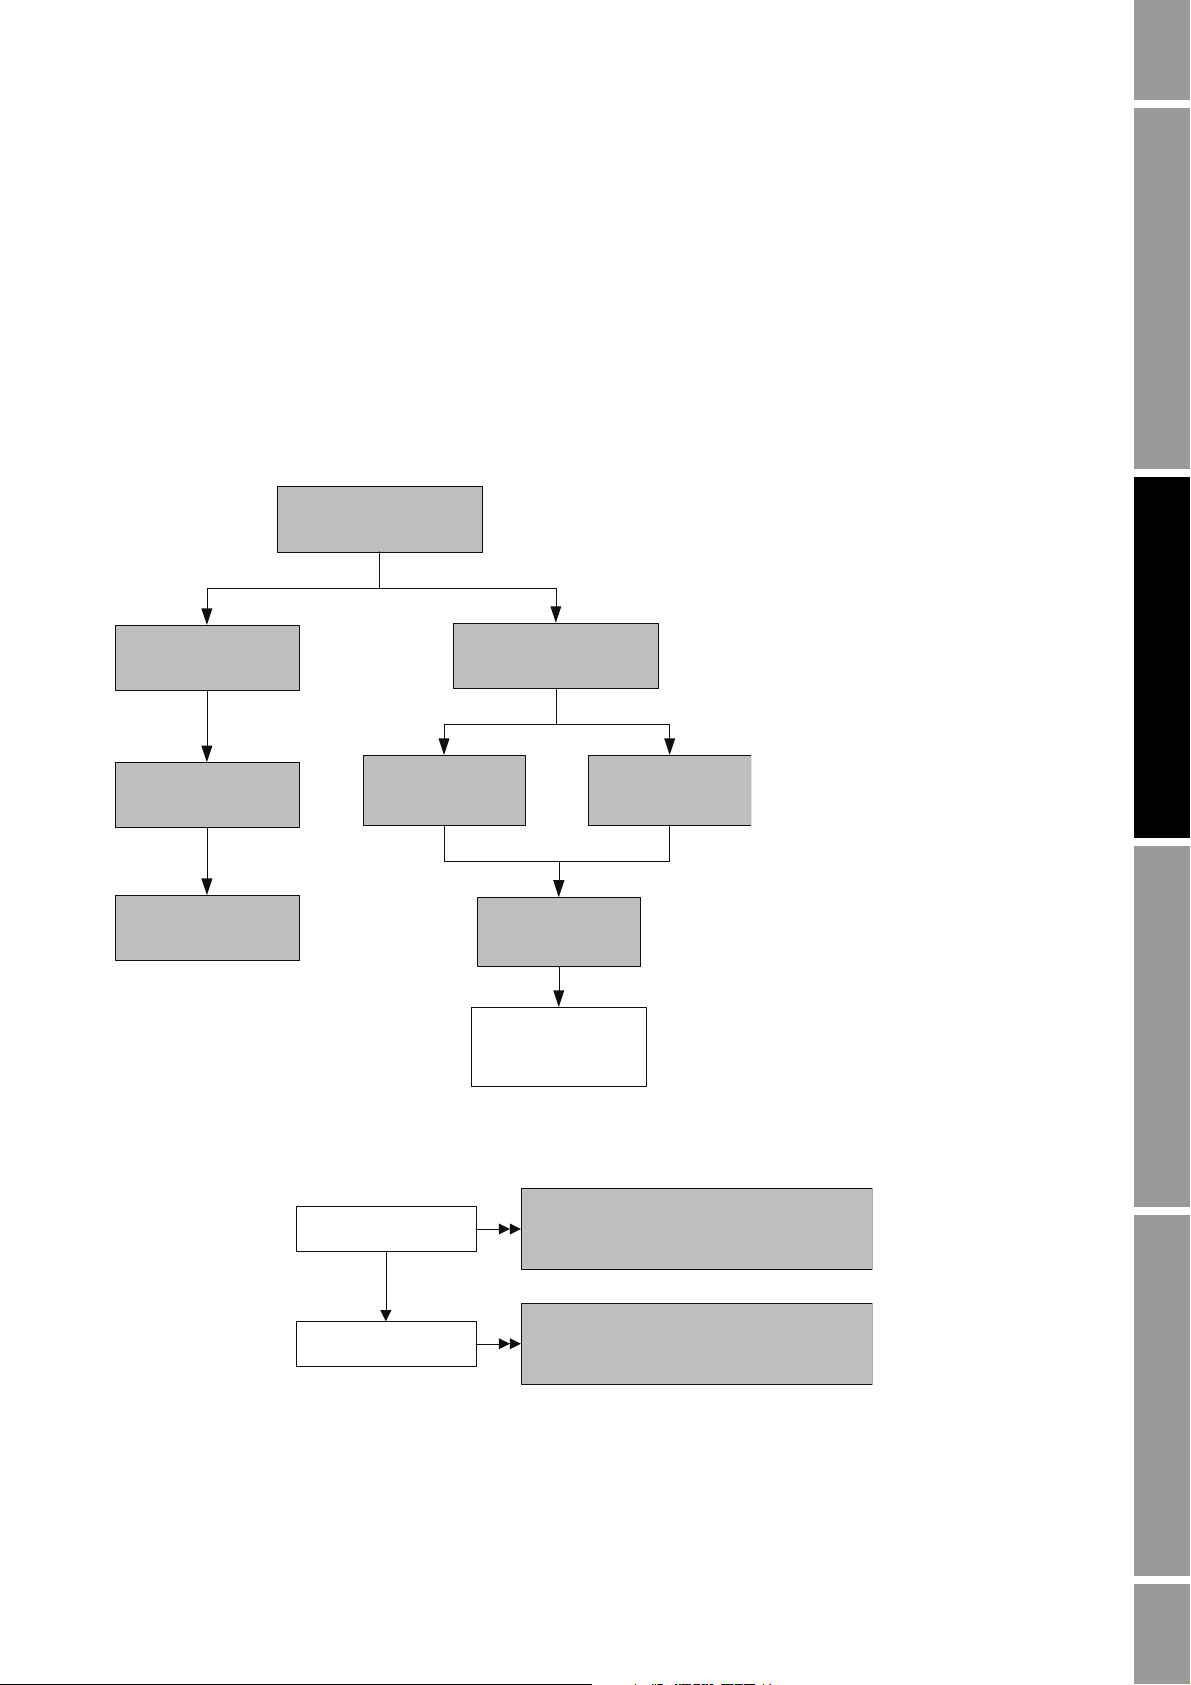
1.7 Planning the configuration
Refer to the configuration overview flowchart in Figure 1-1 to plan transmitter configuration. In
general, perform configuration steps in the order shown here.
Note: Depending on your installation and application, some configuration tasks may be optional.
Note: This manual provides information on topics that are not included in the configuration overview
flowchart, e.g., using the transmitter, troubleshooting, and calibration procedures. Be sure to review
these topics as required.
Figure 1-1 Configuration overview
4 Model 2700 Transmitter with PROFIBUS-PA
Page 13
Before You Begin
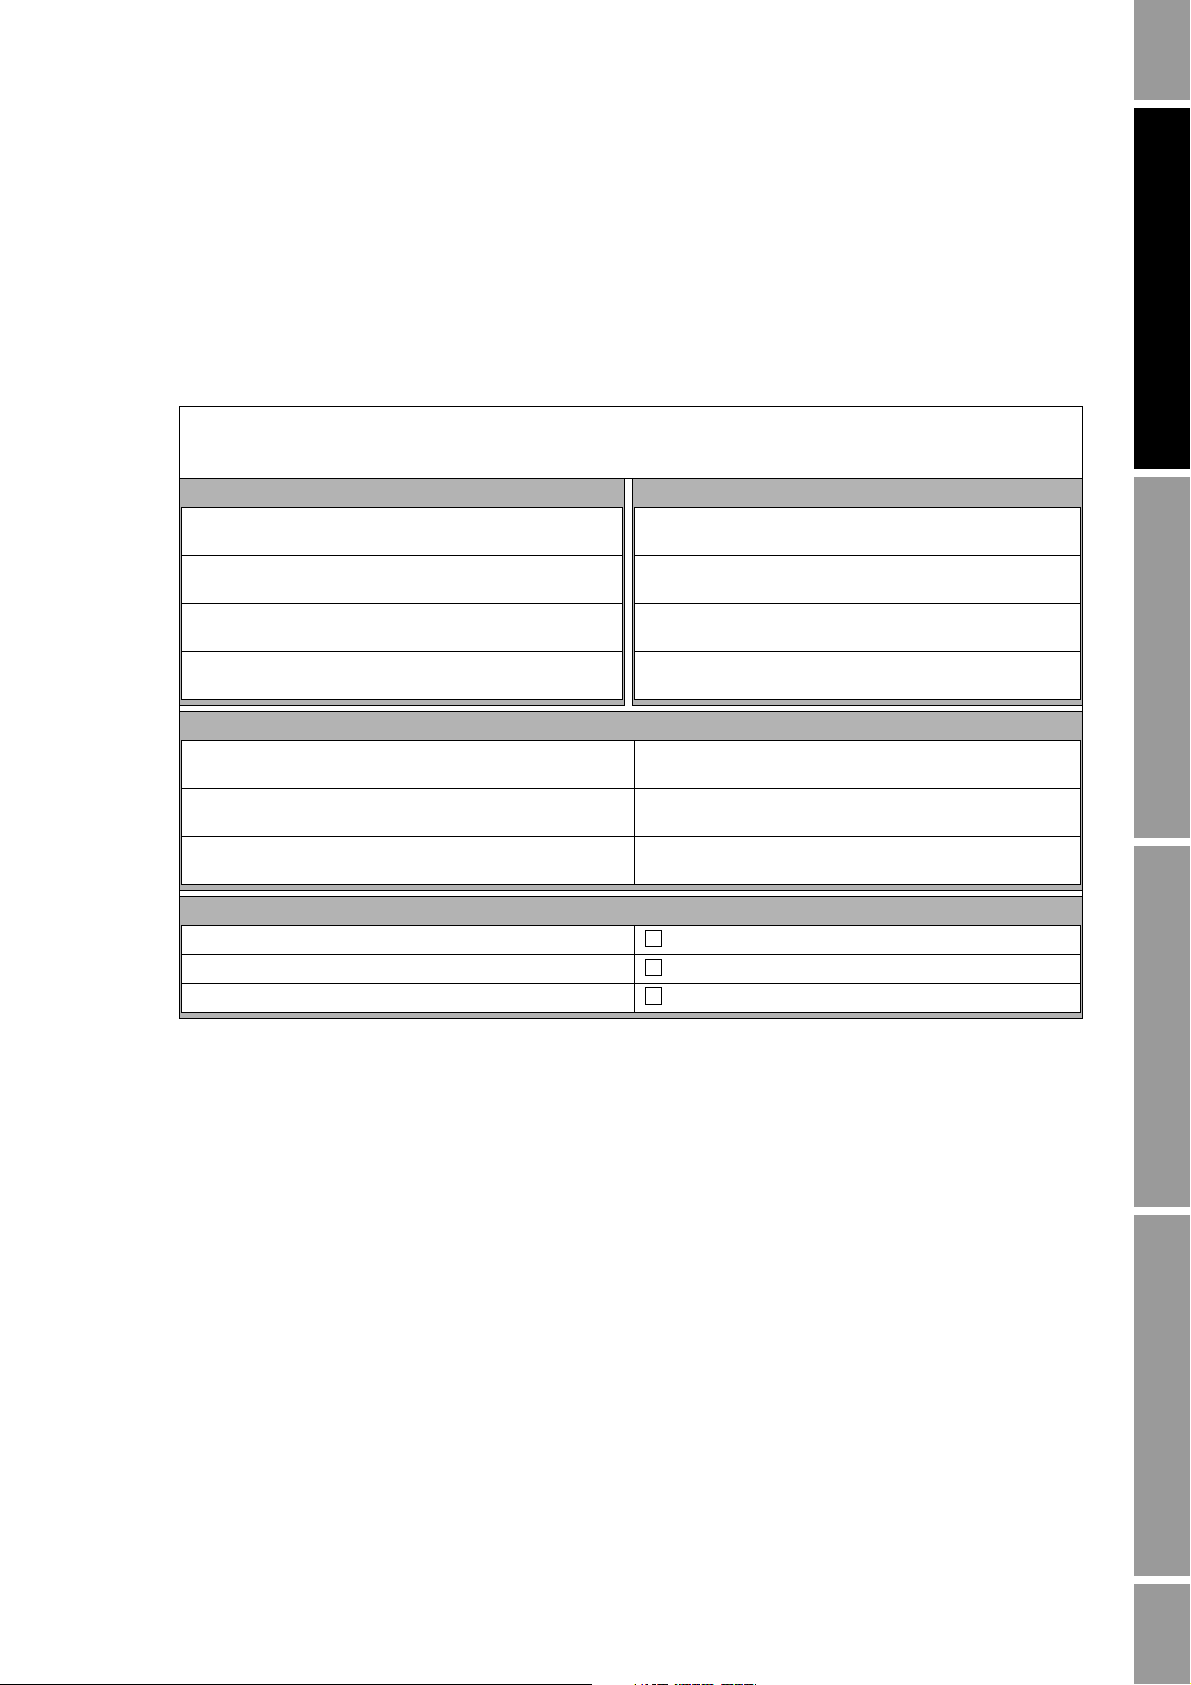
1.8 Pre-configuration worksheet
The pre-configuration worksheet provides a place to record information about your flowmeter and
your application. This information will affect your configuration options as you work through this
manual. You may need to consult with transmitter installation or application process personnel to
obtain the required information.
If you are configuring multiple transmitters, make copies of this worksheet and fill one out for each
individual transmitter.
PRE-CONFIGURATION WORKSHEET FOR TRANSMITTER:
TRANSMITTER SENSOR
MODEL NUMBER MODEL NUMBER
SERIAL NUMBER SERIAL NUMBER
SOFTWARE VERSION
NODE ADDRESS
MEASUREMENT UNITS
MASS FLOW VOLUME FLOW
DENSITY PRESSURE
TEMPERATURE
INSTALLED APPLICATIONS
METER VERIFICATION SOFTWARE
PETROLEUM MEASUREMENT APPLICATION
CONCENTRATION MEASUREMENT APPLICATION
Startup ConfigurationCalibrationBefore You Begin
Configuration and Use Manual 5
Page 14

Before You Begin
1.9 Flowmeter documentation
Table 1-3 lists documentation sources for additional information.
Table 1-3 Flowmeter documentation resources
Topic Document
Sensor installation Sensor documentation
Transmitter installation Micro Motion® Model 1700 and Model 2700
Connecting the transmitter to Simatic PDM Commissioning MVD Profibus PA Documentation
Hazardous area installation See the approval documentation shipped with the
1.10 Micro Motion customer service
For customer service, phone the support center nearest you:
• In the U.S.A., phone
800-522-MASS (800-522-6277) (toll-free)
• In Canada and Latin America, phone +1 303-527-5200 (U.S.A.)
Transmitters: Installation Manual
Supplement
transmitter, or download the appropriate documentation
from the Micro Motion web site (www.micromotion.com)
•In Asia:
- In Japan, phone 3 5769-6803
- In other locations, phone +65 6777-8211 (Singapore)
•In Europe:
- In the U.K., phone 0870 240 1978 (toll-free)
- In other locations, phone +31 (0) 318 495 555 (The Netherlands)
Customers outside the U.S.A. can also email Micro Motion customer service at:
flow.support@emerson.com.
6 Model 2700 Transmitter with PROFIBUS-PA
Page 15

Chapter 2
Startup
2.1 Overview
This chapter describes the procedures you should perform the first time you start the flowmeter. You
do not need to use these procedures every time you cycle power to the flowmeter.
The procedures in this section will enable you to:
• Apply power to the flowmeter (Section 2.2)
• Set the node address (Section 2.3)
• Configure the AI block channels (Section 2.4)
• Set the I/O mode of the transmitter (Section 2.5)
• Configure the totalizer block mode (Section 2.6)
• Optional: Configure pressure compensation (Section 2.7)
• Optional: Configure temperature compensation (Section 2.8)
Note: All procedures provided in this chapter assume that you have established communication with
the transmitter and that you are complying with all applicable safety requirements. See Appendix C or
the documentation for your PROFIBUS host or configuration tool.
2.2 Applying power
Before you apply power to the flowmeter, close and tighten all housing covers.
Operating the flowmeter without covers in place creates electrical hazards that can cause death, injury,
or property damage. Make sure all covers are in place before applying power to the transmitter.
Turn on the electrical power at the power supply. The flowmeter will automatically perform
diagnostic routines. If the transmitter has a display, the status LED will turn green and begin to flash
when the transmitter has finished its startup diagnostics.
Note: If this is the initial startup, or if power has been off long enough to allow components to reach
ambient temperature, the flowmeter is ready to receive process fluid approximately one minute after
power-up. However, it may take up to ten minutes for the electronics in the flowmeter to reach thermal
equilibrium. During this warm-up period, you may observe minor measurement instability or
inaccuracy.
Startup ConfigurationCalibrationBefore You Begin
Configuration and Use Manual 7
Page 16

Startup
2.3 Setting the node address
The factory default setting for the node address is 126. To set the node address:
• With the display, choose
OFF-LINE MAINT > CONFG > ADDRESS PBUS.
• With ProLink II, choose
ProLink > Configuration > Device (Profibus) > Profibus Address.
• With a PROFIBUS host, use the change address function of the host.
2.4 Configuring the analog input function block channels
You can set each of the transmitter’s AI function blocks to measure one transducer block channel. The
AI blocks are set at the factory to a default setting that is adequate for most applications, but you can
change the assignment of the AI blocks to meet special needs.
The default channel configuration for each block is shown in Table 2-1.
Table 2-1 Default channel configuration
Block Default channel Default units
AI 1 Mass flow kg/s
AI 2 Temperature K
AI 3 Density kg/l
AI 4 Volume flow m
The available transducer block channels are shown in Table 2-2.
3
/h
Table 2-2 Process variables by transducer block channel
Channel value
Process variableSlot Index Value
11 (0x0B) 17 (0x11) 0x0B11 Volume flow
11 (0x0B) 21 (0x15) 0x0B15 Mass flow
11 (0x0B) 25 (0x19) 0x0B19 Density
11 (0x0B) 29 (0x1D) 0x0B1D Temperature
11 (0x0B) 64 (0x40) 0x0B40 Gas standard volume flow
11 (0x0B) 114 (0x72) 0x0B72 Pressure
11 (0x0B) 160 (0xA0) 0x0BA0 Drive gain
12 (0x0C) 29 (0x1D) 0x0C1D Petroluem measurement – corrected density
12 (0x0C) 30 (0x1E) 0x0C1E Petroluem measurement – corrected volume flow
12 (0x0C) 31 (0x1F) 0x0C1F Petroluem measurement – average corrected density
12 (0x0C) 32 (0x20) 0x0C20 Petroluem measurement – average corrected temp
12 (0x0C) 33 (0x21) 0x0C21 Petroluem measurement – CTL
12 (0x0C) 47 (0x2F) 0x0C2F Concentration measurement – reference density
12 (0x0C) 48 (0x30) 0x0C30 Concentration measurement – specific gravity
12 (0x0C) 49 (0x31) 0x0C31 Concentration measurement – standard volume flow
12 (0x0C) 50 (0x32) 0x0C32 Concentration measurement – net mass flow
8 Model 2700 Transmitter with PROFIBUS-PA
Page 17
Startup
ProLink II
Function blocks tab
Apply
ProLink >
Configuration
Select a channel for each
AI function block
Select units for each AI
and AO function block
EDD
Bus parameters
Block: Analog Input Block (Slots 1, 2, 3, and 5)
Index: 30 (transducer block channel)
Channel
Block: Analog Input Block (Slots 1, 2, 3, and 5)
Index 28, Parameter 3 (units index)
AI Block units
Block: Analog Output Block (Slots 9 and 10)
Index 27, Parameter 3 (units index)
AO Block
units
Table 2-2 Process variables by transducer block channel (continued)
12 (0x0C) 51 (0x33) 0x0C33 Concentration measurement – net volume flow
12 (0x0C) 52 (0x34) 0x0C34 Concentration measurement – concentration
12 (0x0C) 53 (0x35) 0x0C35 Concentration measurement – Baume
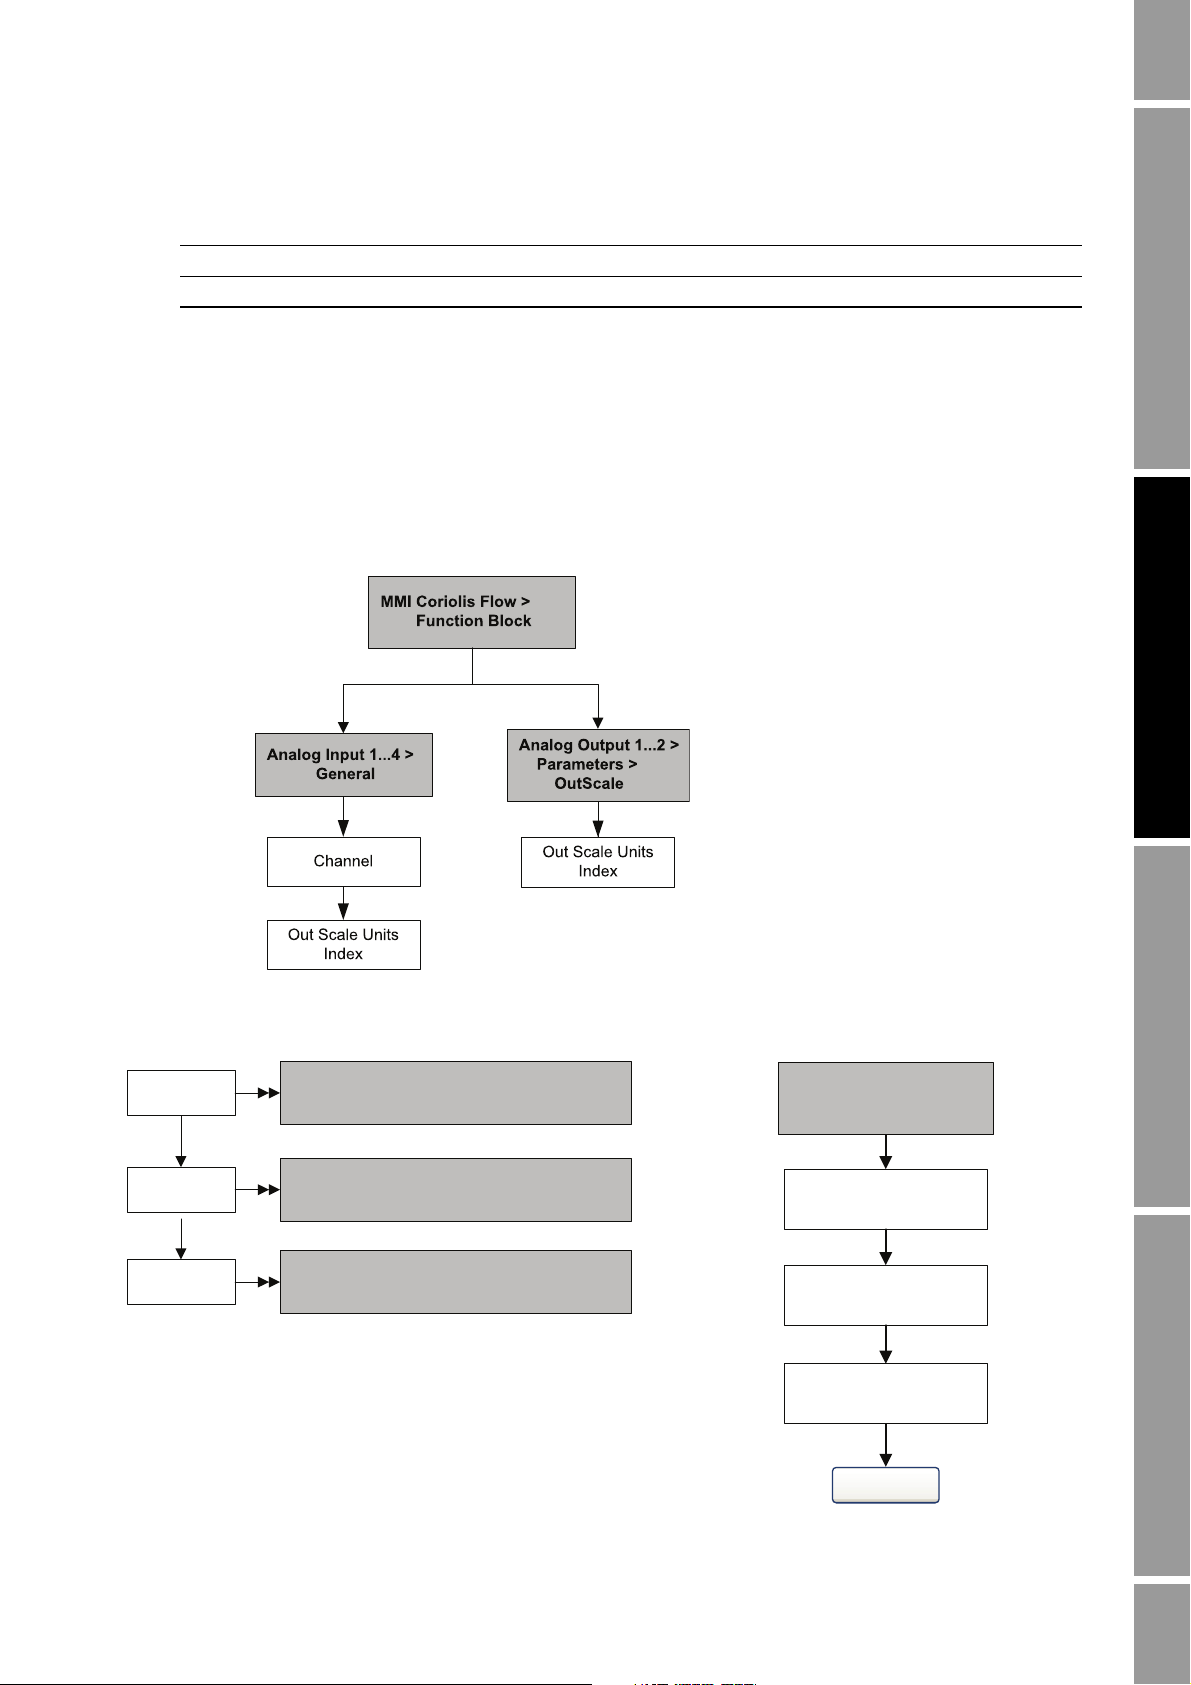
To configure the AI function block channels:
• With the EDD, bus parameters, or ProLink II, see the menu flowcharts in Figure 2-1.
• With the display, see the menu flowchart in Figure B-14.
Figure 2-1 Configuring channels and units – EDD, bus parameters, and ProLink II
Startup ConfigurationCalibrationBefore You Begin
Configuration and Use Manual 9
Page 18

Startup
EDD Bus parameters
2.5 Setting the I/O mode
The transmitter can function in two different I/O modes: Profile-specific and Manufacturer-specific.
The factory default is Manufacturer-specific. The two modes control which function blocks are
available for use, and whether the format of the status byte is “classic” or “condensed.” (See
Appendix D for more information on the format of the status byte.)
• In Profile-specific mode, the transmitter has the use of three AI blocks and one totalizer block.
The status byte output format defaults to classic mode.
• In Manufacturer-specific mode, the transmitter has the use of four AI blocks, four totalizer
blocks, and two AO blocks. The status byte output format defaults to condensed mode.
Refer to Table 2-3 for the slot identifications and blocks permitted by each mode. You must select
modules exactly as described in Table 2-3, or select an empty module for slots that you do not intend
to use. If any modules are left unconfigured, the transmitter will not send data.
Table 2-3 I/O mode slot configurations
Slot Profile-specific mode Manufacturer-specific mode
1 AI 1 AI 1
2 AI 2 AI 2
3 AI 3 AI 3
4 Totalizer 1 Totalizer 1
5AI 4
6 Totalizer 2
7 Totalizer 3
8 Totalizer 4
9AO 1
10 AO 2
To set the I/O mode of the transmitter:
• With the EDD or bus parameters, see the menu flowcharts in Figure 2-2.
• With the display, choose
Figure 2-2 Setting the I/O mode
There are two GSD files that correspond to the two I/O modes. If you are using a PROFIBUS host
with GSD files to operate the transmitter, you must use the GSD that corresponds to the I/O mode you
have chosen. Table 2-4 lists the GSD file names. Load the correct GSD file into your PROFIBUS host
or configuration tool.
OFFLINE_MAINT > CONFG > IDENT SEL.
10 Model 2700 Transmitter with PROFIBUS-PA
Page 19
Startup
Block: Physical Block 1 (Slot 0)
Index 43 (Condensed status diagnostics)
Status byte format
EDD Bus parameters
Note: Set the I/O mode in the Physical Block before loading the GSD file.
Table 2-4 PROFIBUS GSD file names
Identification number GSD file name
Profile specific PA139742.GSD
Manufacturer specific V3x_057A.gsd
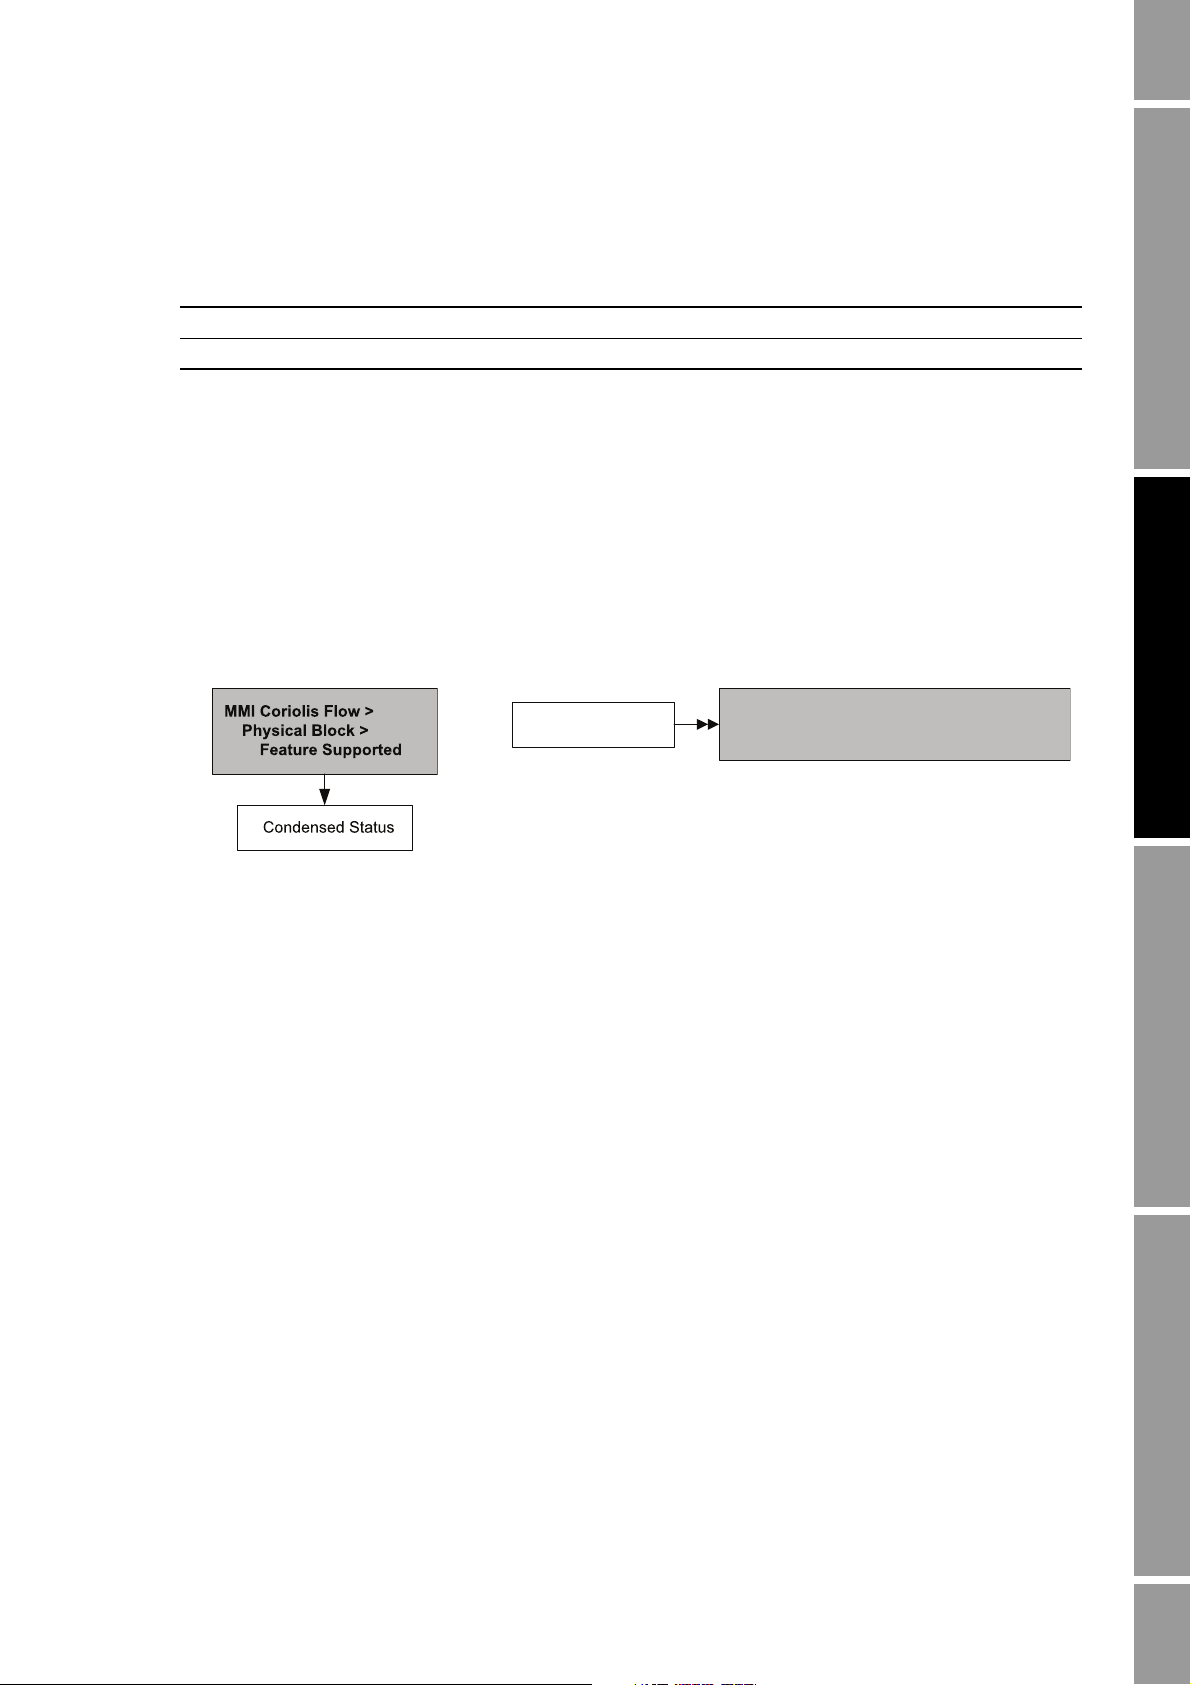
2.5.1 Overriding the status byte format
Each I/O mode has a default status byte format – classic or condensed. To override this default:
• With the GSD, set the Condensed Status parameterization bit to either 1 (for condensed status)
or 0 (for classic status).
• With the EDD or bus parameters, use the menu flowcharts in Figure 2-3.
Figure 2-3 Status byte format
2.6 Configuring the totalizer block mode
The behavior of the four totalizer function blocks can be configured in two ways:
• Standard, which provides standard PROFIBUS totalizer function block behavior.
In this mode, the totalizer block will integrate whatever data it receives. The Out value of a
totalizer in this mode has no relationship to the totalizer data reported by the transducer block,
ProLink II, or the display.
• Any of the values in Table 2-5, which cause the totalizer function block to pass through the
specified totalizer value from the transducer block.
Micro Motion recommends using one of these modes, because the totalizer block output will
be more accurate and will match readings taken with ProLink II and the display.
To configure the totalizer block mode:
Startup ConfigurationCalibrationBefore You Begin
Configuration and Use Manual 11
• With the EDD or bus parameters, refer to the menu flowcharts in Figure 2-4.
• With the display, refer to the menu flowcharts in Figure B-16.
Page 20
Startup
EDD
Block: Totalizer 1 (Slot 4)
Index 52 (set to Mode value from table)
Mode
Block: Totalizer 1 (Slot 4)
Index 52 (set to Mode value from table)
Block: Totalizer 1 (Slot 4)
Index 52 (set to Mode value from table)
Block: Totalizer 1 (Slot 4)
Index 52 (set to Mode value from table)
Bus parameters
MMI Coriolis Flow >
Function Block
Totalizer 1 >
Parameter
Integrator Function
Block
Totalizer 2 >
Parameter
Totalizer 3 >
Parameter
Totalizer 4 >
Parameter
Selection
Figure 2-4 Configuring totalizer function block mode
Table 2-5 Process variables by transducer block channel
Channel value
Process variableSlot Index Value
11(0x0B) 17(0x11) 0x0B11 Volume flow
11(0x0B) 21(0x15) 0x0B15 Mass flow
11(0x0B) 64(0x40) 0x0B40 Gas standard volume flow
12(0x0C) 30(0x1E) 0x0C1E Petroleum measurement – corrected volume flow
12(0x0C) 49(0x31) 0x0C31 Concentration measurement – standard volume flow
12(0x0C) 50(0x32) 0x0C32 Concentration measurement – net mass flow
12(0x0C) 51(0x33) 0x0C33 Concentration measurement – net volume flow
12 Model 2700 Transmitter with PROFIBUS-PA
Page 21

Startup
2.7 Configuring pressure compensation
Due to process pressure change away from calibration pressure, there can be a change in sensor flow
and density sensitivity. This change is called pressure effect. Pressure compensation corrects for these
changes.
Not all sensors and applications require pressure compensation. Contact Micro Motion Customer
Service before you configure pressure compensation.
Configuring pressure compensation requires three steps:
1. Determining pressure compensation values (Section 2.7.1)
2. Enabling pressure compensation (Section 2.7.2)
3. Selecting a pressure source (Section 2.7.3)
2.7.1 Pressure compensation values
There are three values involved in pressure compensation:
• Flow factor – The flow factor is the percent change in flow rate per psi. Consult the product
data sheet for your sensor for this value. You will need to reverse the sign of the flow factor.
For example, if the flow factor in the product data sheet is –0.001% per psi, the pressure
compensation flow factor would be +0.001% per psi.
• Density factor – The density factor is the change in fluid density, in g/cm
product data sheet for your sensor for this value. You will need to reverse the sign of the
density factor. For example, if the density factor in the product data sheet is –0.00004 g/cm
per psi, the pressure compensation flow factor would be +0.00004 g/cm
• Flow calibration pressure – The pressure at which the flowmeter was calibrated. Refer to the
calibration document shipped with your sensor. If the data is unavailable, use 20 psi (1,4 bar).
3
per psi. Consult the
3
per psi.
Startup ConfigurationCalibrationBefore You Begin
3
Configuration and Use Manual 13
Page 22
Startup
Block: Transducer Block 1 (Slot 11)
Index 112 (enable pressure compensation)
Enable pressure
comp.
Block: Transducer Block 1 (Slot 11)
Index 116 (flow factor)
Index 117 (density factor)
Index 118 (flow calibration pressure)
Pressure correction
values
Block: Transducer Block 1 (Slot 11)
Index 115 (pressure units)
Pressure units
Block: Transducer Block 1 (Slot 11)
Index 113 (pressure value)
Optional: Fixed
pressure value
View >
Preferences
Select Enable External
Pressure Compensation
Apply
ProLink >
Configuration
Enter values:
Flow factor in Flow factor
box
Density factor in Dens
factor box
Flow calibration pressure in
Cal pressure box
Apply
Pressure tab
Set pressure units to
match source
Optional: Enter a fixed
pressure value in the
External Pressure box
EDD Bus parameters
ProLink II
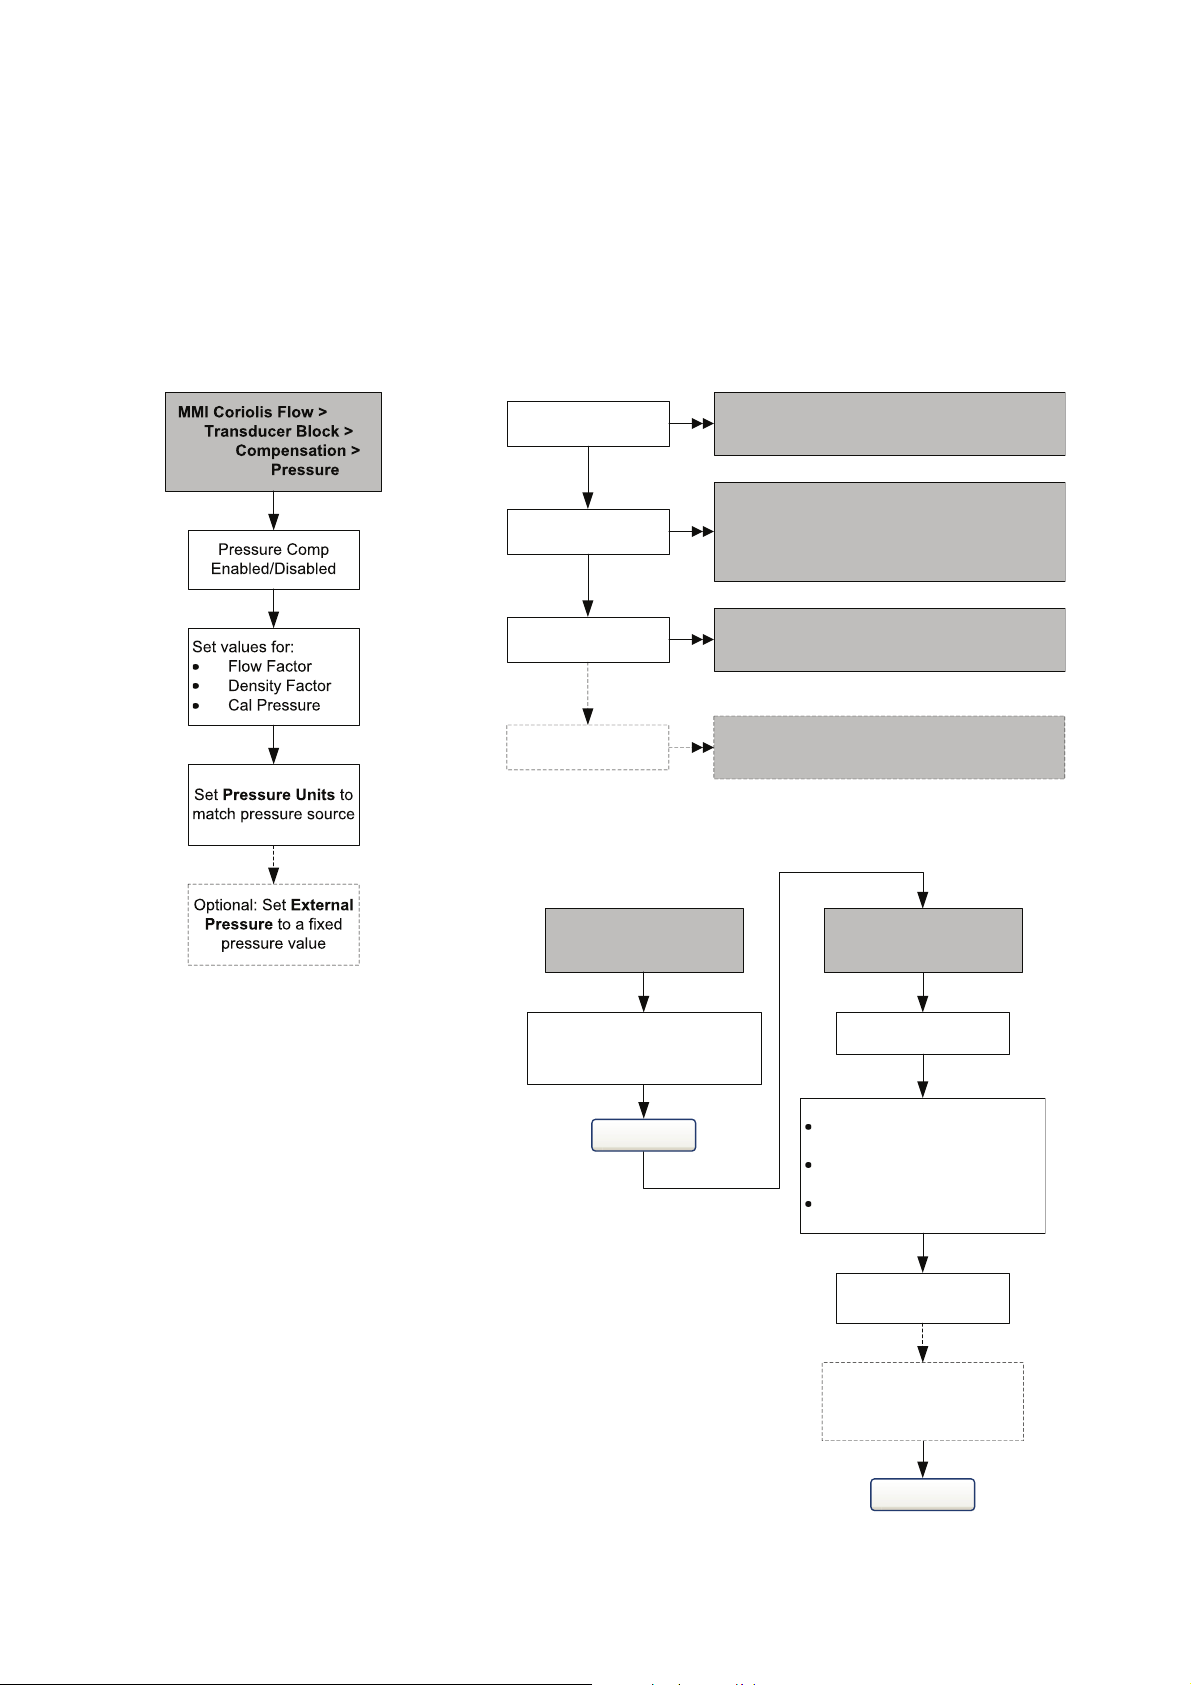
2.7.2 Enabling pressure compensation
To enable pressure compensation, see the menu flowcharts in Figure 2-5. You will need the three
pressure compensation values from Section 2.7.1.
Figure 2-5 Enabling pressure compensation
14 Model 2700 Transmitter with PROFIBUS-PA
Page 23
Startup
Function Block
Analog Output 1
Set IN Channel to
Pressure
Parameters >
General
Analog Output 2
MMI Coriolis Flow
Transducer Block
Compensation
AO Compensation
Note: When setting the IN channel
to Pressure via the EDD, the OUT
channel will be automatically set
to Pressure as well. Setting the IN
channel via bus parameters does
not automatically change the OUT
channel. You must manually set the
OUT channel to Pressure or the
block will go into Out of Service
mode.
2.7.3 Configuring a pressure source
You will need to choose one of two sources for pressure data:
• Analog Output function block – This option allows you to poll for pressure data from an
external pressure source.
• Fixed pressure data – This option uses a known, constant pressure value.
Note: If you configure a fixed pressure value, ensure that it is accurate. If you configure polling for
pressure, ensure that the external pressure measurement device is accurate and reliable.
If you configure pressure compensation to use an AO block for pressure compensation, the other AO
block remains available for temperature compensation. However, only one of the AO blocks can be
set up for external pressure.
To configure fixed pressure data, refer to the menu flowcharts in Figure 2-5.
To configure an AO function block for pressure compensation:
• With the EDD, refer to the flowchart in Figure 2-6.
• With bus parameters, refer to the flowchart in Figure 2-7.
• With the display, refer to the menu flowcharts in Figure B-15.
Startup ConfigurationCalibrationBefore You Begin
Figure 2-6 Configuring an AO function block for pressure compensation – EDD
Configuration and Use Manual 15
Page 24
Startup
Block: Analog Output Block (Slots 9 and 10)
Index 37 (IN channel), value = 0x0b72
Index 38 (OUT channel), value = 0x0b72
Configure channel
Block: Transducer Block 1 (Slots 11)
Index 121 (AO Compensation), value = 1
Configure channel
MMI Coriolis Flow >
Transducer Block >
Compensation >
Temperature
Enable Disable Ext
Temp
EDD
Block: Transducer Block 1 (Slot 11)
Index 110 (enable temperature compensation)
Enable temperature
comp.
Bus parameters
View >
Preferences
Select Use External
Temperature
Apply
ProLink II
Figure 2-7 Configuring an AO function block for pressure compensation – Bus parameters
2.8 Configuring temperature compensation
External temperature compensation can be used with the petroleum measurement application or the
enhanced density application:
• If external temperature compensation is enabled, an external temperature value (or a fixed
temperature value), rather than the temperature value from the Coriolis sensor, is used in
petroleum measurement or enhanced density calculations only. The temperature value from
the Coriolis sensor is used for all other calculations.
• If external temperature compensation is disabled, the temperature value from the Coriolis
sensor is used in all calculations.
Configuring temperature compensation requires two steps:
1. Enabling external temperature compensation (Section 2.8.1)
2. Configuring a temperature source (Section 2.8.2)
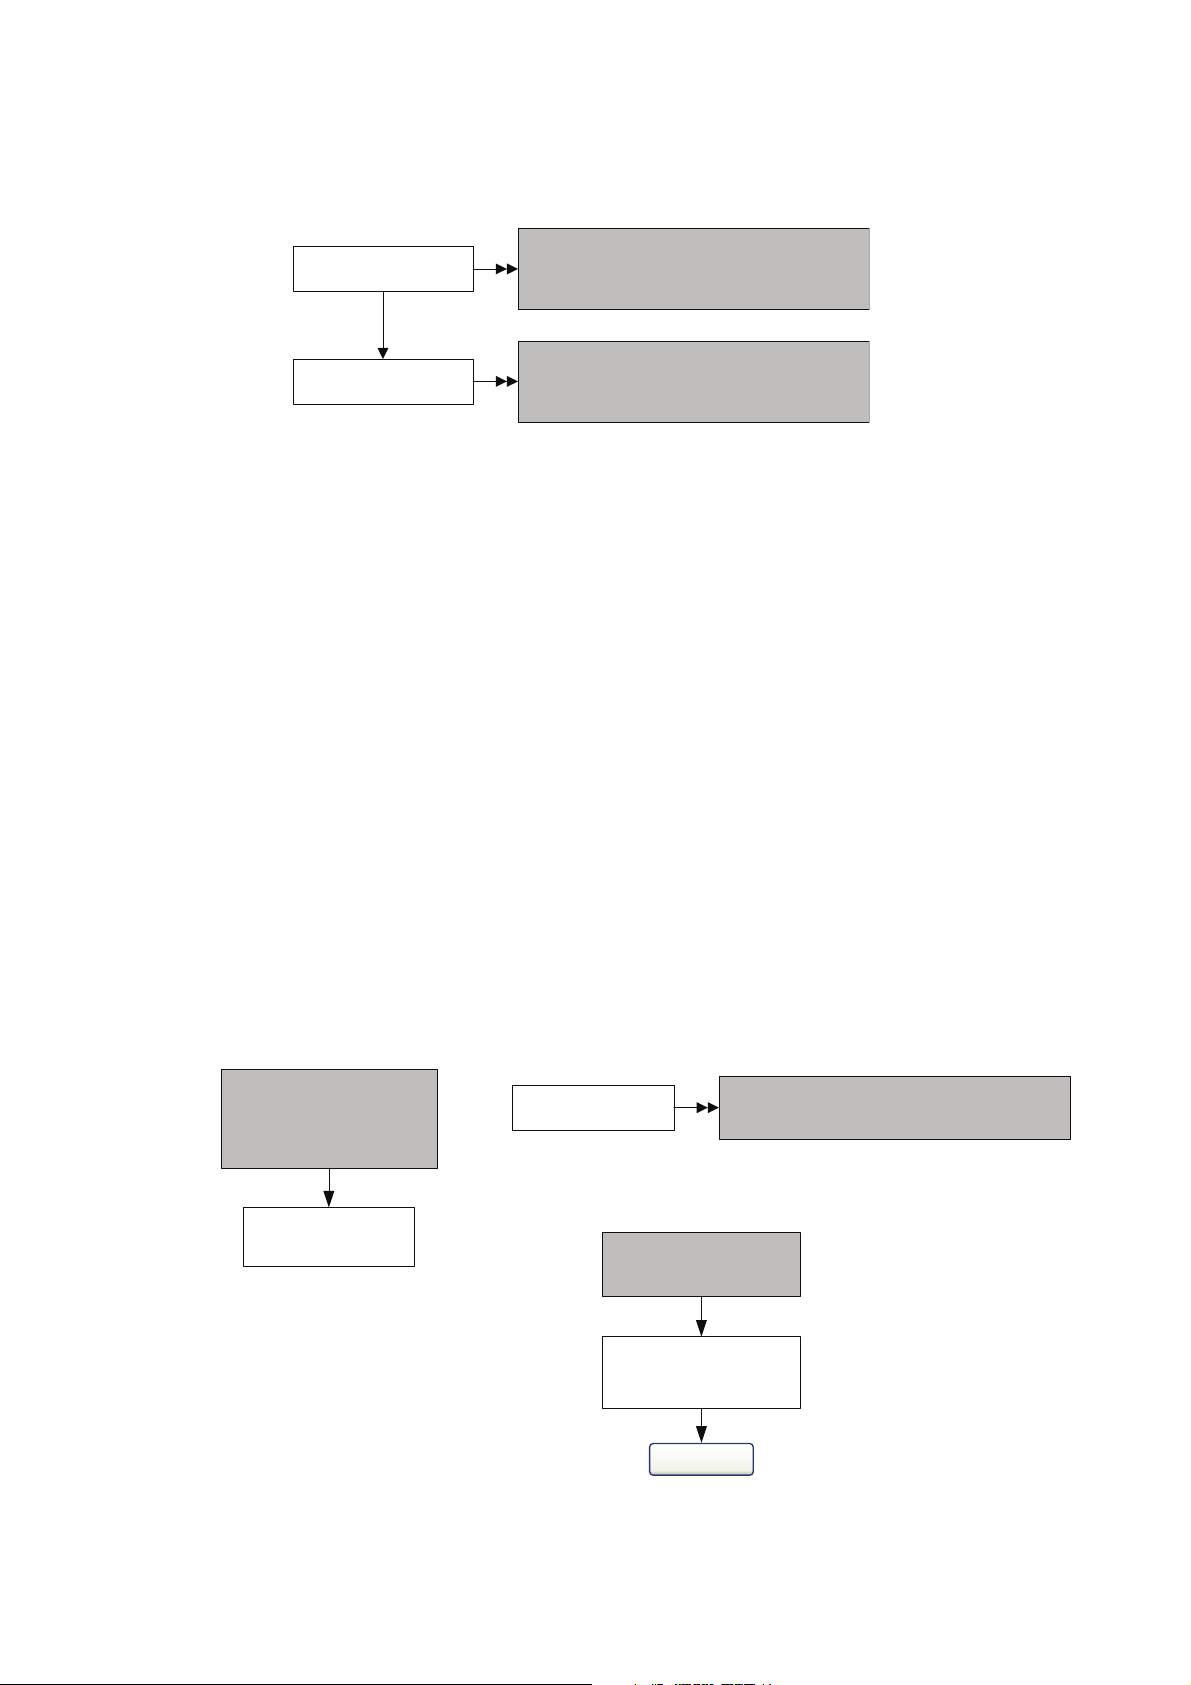
2.8.1 Enabling external temperature compensation
To enable temperature compensation, refer to the flowcharts in Figure 2-8.
Figure 2-8 Enabling external temperature compensation
16 Model 2700 Transmitter with PROFIBUS-PA
Page 25
Startup
Function Block
Analog Output 1
Set IN Channel to
Temperature
Parameters >
General
Analog Output 2
MMI Coriolis Flow
Transducer Block
Compensation
AO Compensation
Note: When setting the IN
channel to Temperature via the
EDD, the OUT channel will be
automatically set to
Temperature as well. Setting
the IN channel via bus
parameters does not
automatically change the OUT
channel. You must manually set
the OUT channel to
Temperature or the block will
go into Out of Service mode.
Block: Analog Output Block (Slots 9 and 10)
Index 37 (IN channel), value = 0x0b1D
Index 38 (OUT channel), value = 0x0b6F
Configure channel
Block: Transducer Block 1 (Slots 11)
Index 121 (AO Compensation), value = 1
Configure channel
2.8.2 Configuring a temperature source
External temperature data is reported through an analog output (AO) function block. The transmitter
has two AO blocks, each of which can be assigned to a compensation variable channel.
To configure an AO function block for temperature compensation:
• With the EDD, refer to the flowchart in Figure 2-9.
• With bus parameters, refer to the flowchart in Figure 2-10.
• With the display, refer to the flowcharts in Figure B-15.
Figure 2-9 Configuring an AO function block for temperature compensation – EDD
Startup ConfigurationCalibrationBefore You Begin
Configuration and Use Manual 17
Figure 2-10 Configuring an AO function block for temperature compensation – Bus parameters
Page 26

18 Model 2700 Transmitter with PROFIBUS-PA
Page 27

Chapter 3
Calibration
3.1 Overview
This chapter describes the following procedures:
• Characterization (Section 3.3)
• Smart Meter Verification (Section 3.4)
• Meter validation and adjusting meter factors (Section 3.5)
• Zero calibration (Section 3.6)
• Density calibration (Section 3.7)
• Temperature calibration (Section 3.8)
Note: All procedures provided in this chapter assume that you have established communication with
the transmitter and that you are complying with all applicable safety requirements. See Appendix C or
the documentation for your PROFIBUS host or configuration tool.
Startup ConfigurationCalibrationBefore You Begin
3.2 Characterization, Smart Meter Verification, meter validation, and calibration
There are four procedures:
• Characterization – adjusts the transmitter to compensate for the unique traits of the sensor
with which it is paired
• Smart Meter Verification – establishing confidence in the sensor’s performance by analyzing
secondary variables that are highly correlated with flow and density calibration factors
• Meter validation – confirming performance by comparing the sensor’s measurements to a
primary standard
• Calibration – establishing the relationship between a process variable (flow, density, or
temperature) and the signal produced by the sensor, or establishing the transmitter’s response
to a zero-flow condition.
Meter validation, characterization, and calibration are available on all Model 2700 transmitters. Smart
Meter Verification is available only if the Smart Meter Verification option was ordered with the
transmitter.
These four procedures are discussed and compared in Sections 3.2.1 through 3.2.4. Before performing
any of these procedures, review these sections to ensure that you will be performing the appropriate
procedure for your purposes.
Configuration and Use Manual 19
Page 28

Calibration
3.2.1 Characterization
Characterizing the flowmeter adjusts the transmitter to compensate for the unique traits of the sensor
it is paired with. Characterization parameters (sometimes called “calibration factors”) describe the
sensor’s sensitivity to flow, density, and temperature.
If the transmitter and the sensor were ordered together as a Coriolis flowmeter, then the flowmeter has
already been characterized. Under some circumstances (typically when pairing a sensor and
transmitter together for the first time), you may need to re-enter characterization data. If you are
unsure about whether you should characterize your flowmeter, contact Micro Motion Customer
Service.
3.2.2 Smart Meter Verification
Smart Meter Verification evaluates the structural integrity of the sensor tubes by comparing current
tube stiffness to the stiffness measured at the factory. Stiffness is defined as the load per unit
deflection, or force divided by displacement. Because a change in structural integrity changes the
sensor’s response to mass and density, this value can be used as an indicator of measurement
performance. Changes in tube stiffness are typically caused by erosion, corrosion, or tube damage.
Smart Meter Verification does not affect measurement in any way. Micro Motion recommends
performing Smart Meter Verification at regular intervals.
3.2.3 Meter validation and meter factors
Meter validation compares a measurement value reported by the transmitter with an external
measurement standard. Meter validation requires one data point.
Note: For meter validation to be useful, the external measurement standard must be more accurate
than the sensor. See the sensor’s product data sheet for its accuracy specification.
If the transmitter’s mass flow, volume flow, or density measurement is significantly different from the
external measurement standard, you may want to adjust the corresponding meter factor. A meter
factor is the value by which the transmitter multiplies the process variable value. The default meter
factors are
1.0, resulting in no difference between the data retrieved from the sensor and the data
reported externally.
Meter factors are typically used for proving the flowmeter against a Weights & Measures standard.
You may need to calculate and adjust meter factors periodically to comply with regulations.
3.2.4 Calibration
The flowmeter measures process variables based on fixed points of reference. Calibration adjusts
those points of reference. Three types of calibration can be performed:
•Zero
• Density calibration
• Temperature calibration
Density and temperature calibration require two data points (low and high) and an external
measurement for each. The density and temperature calibration procedure changes the offset and/or
the slope of the line that represents the relationship between process density and the reported density
value, or the relationship between process temperature and the reported temperature value.
Note: For density or temperature calibration to be useful, the external measurements must be
accurate.
20 Model 2700 Transmitter with PROFIBUS-PA
Page 29

Calibration
Zero calibration requires only that flow through the sensor is stopped.
Flowmeters are calibrated at the factory, and normally do not need to be calibrated in the field.
Calibrate the flowmeter only if you must do so to meet regulatory requirements. Contact
Micro Motion before calibrating your flowmeter.
Note: Micro Motion recommends using meter validation and meter factors, rather than calibration, to
prove the meter against a regulatory standard or to correct measurement error.
3.2.5 Comparison and recommendations
When choosing among Smart Meter Verification, meter validation, and calibration, consider the
following factors:
• Process and measurement interruption
- Smart Meter Verification provides an option that allows process measurement to continue
during the test.
- Meter validation for density does not interrupt the process. However, meter validation for
mass flow or volume flow requires process down-time for the length of the test.
- Calibration requires process down-time. In addition, density and temperature calibration
require replacing the process fluid with low-density and high density fluids, or
low-temperature and high-temperature fluids. Zero calibration requires stopping flow
through the sensor.
Startup ConfigurationCalibrationBefore You Begin
• External measurement requirements
- Smart Meter Verification does not require external measurements.
- Zero calibration does not require external measurements.
- Density calibration, temperature calibration, and meter validation require external
measurements. For good results, the external measurement must be highly accurate.
• Measurement adjustment
- Smart Meter Verification is an indicator of sensor condition, but does not change
flowmeter internal measurement in any way.
- Meter validation does not change flowmeter internal measurement in any way. If you
decide to adjust a meter factor as a result of a meter validation procedure, only the reported
measurement is changed—the base measurement is not changed. You can always reverse
the change by returning the meter factor to its previous value.
- Calibration changes the transmitter’s interpretation of process data, and accordingly
changes the base measurement. If you perform a zero calibration, you can return to the
factory zero (or, if using ProLink II, the previous zero). However, if you perform a density
calibration or a temperature calibration, you cannot return to the previous calibration
factors unless you have manually recorded them.
Micro Motion recommends obtaining the Smart Meter Verification transmitter option and performing
Smart Meter Verification on a regular basis.
Configuration and Use Manual 21
Page 30

Calibration
3.3 Performing a characterization
Characterizing a flowmeter involves entering parameters that are printed on the sensor tag.
3.3.1 Characterization parameters
The characterization parameters that must be entered depend on the sensor type: “T-Series” or
“Other,” as listed in Table 3-1. The “Other” category includes all Micro Motion sensors except
T-Ser ies .
The characterization parameters are provided on the sensor tag. The format of the sensor tag varies
depending on your sensor’s date of purchase. See Figures 3-1 and 3-2 for illustrations of newer and
older sensor tags.
Table 3-1 Sensor characterization parameters
Bus parameter
Characterization data EDD label
(1)
K1
(1)
K2
(1)
FD
(1)
D1
(1)
D2
DT or TC
Flow cal
FCF
FT
(1)
(2)
(2)
(2)
FTG FTG 103 ✓
FFQ FFQ 104 ✓
DTG DTG 105 ✓
DFQ1 DFQ1 106 ✓
DFQ2 DFQ2 107 ✓
(1) See the section entitled “Density calibration factors.”
(2) See the section entitled “Flow calibration values.”
K1 92 ✓✓
K2 93 ✓✓
FD 94 ✓✓
D1 97 ✓✓
D2 98 ✓✓
Density Temp Coeff (DT) 102 ✓✓
FD Value 99 ✓
FD Value 99 ✓
FD Value 99 ✓
index
Sensor type
T- Ser i e s O t her
22 Model 2700 Transmitter with PROFIBUS-PA
Page 31

Calibration
Newer tag Older tag
19.0005.13
19.0005.13
0.0010
0.9980
12502.000
14282.000
4.44000
310
12502142824.44
12500142864.44
Newer tag Older tag
Figure 3-1 Sample calibration tags – All sensors except T-Series
Figure 3-2 Sample calibration tags – T-Series sensors
Density calibration factors
If your sensor tag does not show a D1 or D2 value:
• For D1, enter the Dens A or D1 value from the calibration certificate. This value is the
line-condition density of the low-density calibration fluid. Micro Motion uses air.
• For D2, enter the Dens B or D2 value from the calibration certificate. This value is the
line-condition density of the high-density calibration fluid. Micro Motion uses water.
If your sensor tag does not show a K1 or K2 value:
• For K1, enter the first 5 digits of the density calibration factor. In the sample tag in Figure 3-1,
this value is shown as 12500.
• For K2, enter the second 5 digits of the density calibration factor. In the sample tag in
Figure 3-1, this value is shown as 14286.
If your sensor does not show an FD value, contact Micro Motion customer service. If your sensor tag
does not show a DT or TC value, enter the last 3 digits of the density calibration factor. In the sample
tag in Figure 3-1, this value is shown as 4.44.
Startup ConfigurationCalibrationBefore You Begin
Configuration and Use Manual 23
Page 32

Calibration
Flow FCF X.XXXX FT X.XX
Flow calibration values
Two separate values are used to describe flow calibration: a 6-character FCF value (including one
decimal point) and a 4-character FT value (including one decimal point). During characterization,
these are entered as a single 10-character string that includes two decimal points. In ProLink II, this
value is called the Flowcal parameter.
To obtain the required value:
• For older T-Series sensors, concatenate the FCF value and the FT value from the sensor tag, as
shown below.
• For newer T-Series sensors, the 10-character string is represented on the sensor tag as the FCF
value. The value should be entered exactly as shown, including the decimal points. No
concatenation is required.
• For all other sensors, the 10-character string is represented on the sensor tag as the Flow Cal
value. The value should be entered exactly as shown, including the decimal points. No
concatenation is required.
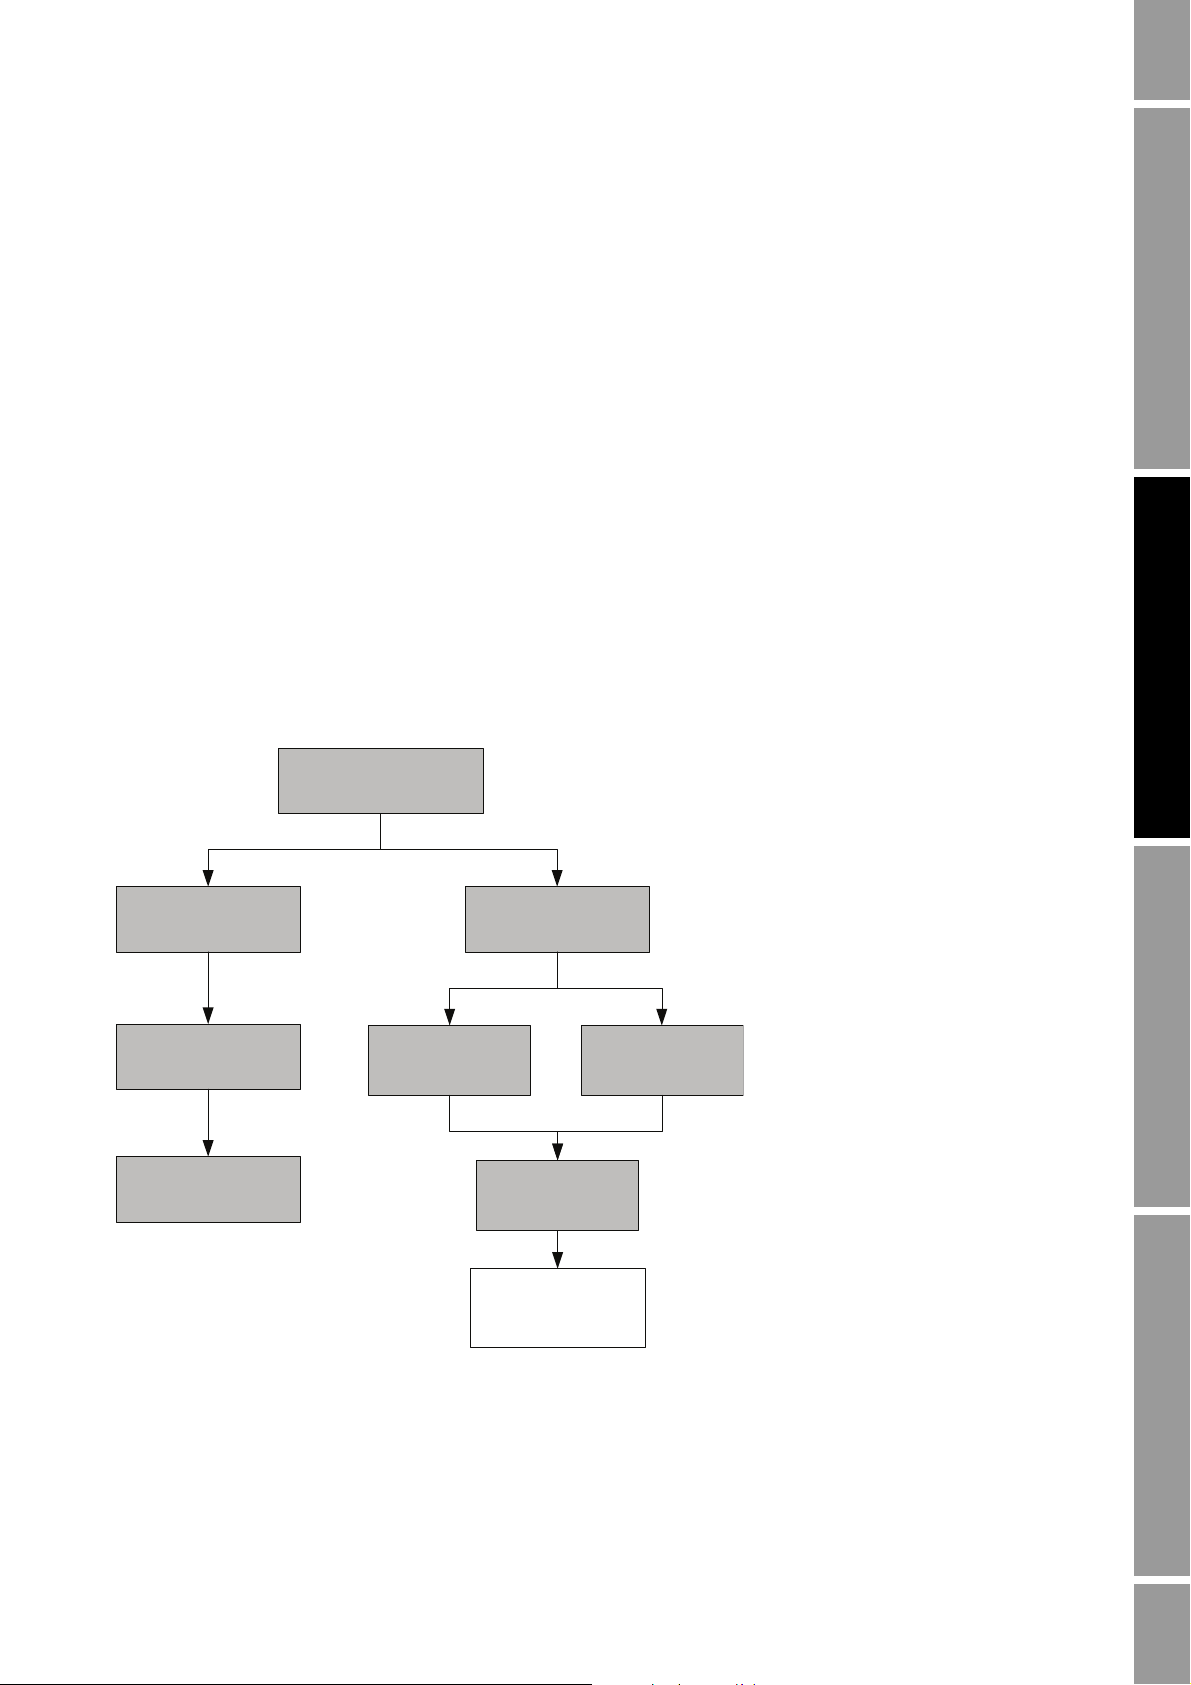
3.3.2 How to characterize
To characterize the flowmeter, refer to Table 3-1 and the menu flowcharts in Figure 3-3.
24 Model 2700 Transmitter with PROFIBUS-PA
Page 33

Calibration
EDD
Bus parameters
ProLink II
Calibration >
Density
Enter values from
sensor tag
MMI Coriolis Flow >
Transducer Block
Sensor Type Code
• Curved Tube
• Straight Tube
Device Information
ProLink >
Configuration
Device tab
Sensor Type
Flow tab
Enter values from
sensor tag
Density tab
Enter values from
sensor tag
(1) Refer to Table 3-1 for bus
parameter indices.
Block: Transducer Block 2 (Slot 12)
Index 12 (sensor type code)
Sensor type
Block: Transducer Block 1 (Slot 11)
See note (1)
Flow values
Block: Transducer Block 1 (Slot 11)
See note (1)
Density values
Figure 3-3 Characterizing the flowmeter
Startup ConfigurationCalibrationBefore You Begin
Configuration and Use Manual 25
Page 34

Calibration
3.4 Performing Smart Meter Verification
Note: To use Smart Meter Verification, the transmitter must be paired with an enhanced core
processor, and the Smart Meter Verification option must be purchased for the transmitter.
3.4.1 Preparing for the Smart Meter Verification test
The Smart Meter Verification procedure can be performed on any process fluid. It is not necessary to
match factory conditions.
During the test, process conditions must be stable. To maximize stability:
• Maintain a constant temperature and pressure.
• Avoid changes to fluid composition (e.g., two-phase flow, settling, etc.).
• Maintain a constant flow. For higher test certainty, stop flow.
If stability varies outside test limits, the Smart Meter Verification procedure will be aborted. Verify
the stability of the process and retry the test.
Transmitter configuration
Smart Meter Verification is not affected by any parameters configured for flow, density, or
temperature. It is not necessary to change the transmitter configuration.
Control loops and process measurement
If the transmitter outputs will be set to Last Measured Value or Fault during the test, the outputs will
be fixed for two minutes. Disable all control loops for the duration of the test, and ensure that any data
reported during this period is handled appropriately.
3.4.2 Running the Smart Meter Verification test
To run a Smart Meter Verification test:
• With the EDD, refer to Figure 3-4.
• With bus parameters, refer to Figure 3-5 and to Table 3-2.
• With ProLink II, refer to Figure 3-6.
• With the display, refer to Figure B-6.
26 Model 2700 Transmitter with PROFIBUS-PA
Page 35

Calibration
Device >
Meter Verification
Start/Abort Meter
Verification
Start Meter Verification
Enable MV
Select Alarm
Last Value
Fault Mode
Continue
measurement
Meter Verification in
Progress
Meter verification
PASSED
Meter verification
FAILED
Abort Meter Verification
Manual Abort by
End User
Meter verification
error
Start Meter Verification
Figure 3-4 Smart Meter Verification – EDD
Startup ConfigurationCalibrationBefore You Begin
Configuration and Use Manual 27
Page 36

Calibration
Step 2
Start/abort procedure
Step 1
Set output state (optional)
Able to
complete?
Step 8
Check abort code
Yes (>0)
Step 3
Check current algorithm state
Running?
Step 4
Read percent complete
Yes (=16)
Step 6
Check inlet stiffness
Within limits?No (>0)
Yes (=0)
Step 7
Check outlet stiffness
Within limits?No (>0)
Yes (=0)
CAUTION PASS
No (<16)
No (=0)
Manual abort (optional)
Step 5
Check algorithm abort state
Figure 3-5 Smart Meter Verification – bus parameters
28 Model 2700 Transmitter with PROFIBUS-PA
Page 37

Calibration
Table 3-2 PROFIBUS parameters for Smart Meter Verification
Step number Step description Parameters
1 Set output state Block: Transducer block 1
Index: 182
Value:
• 0: Last measured value (default)
• 1: Fault
2 Start/abort procedure Block: Transducer block 1
Index: 72 (Start/Stop Meter Verification)
•0x00: No effect
• 0x01: Start On-Line Meter Verification
3 Check current algorithm state Block: Transducer block 1
Index: 75
Value:
• Bits 4–6: State
4 Read percent complete Block: Transducer block 1
Index: 189 (Progress)
5 Check algorithm abort state Block: Transducer block 1
Index: 75
Value:
• Bits 0–3: Abort code
6 Check inlet stiffness Block: Transducer block 1
Index: 77
• 0: Within uncertainty limit
• 1: Outside uncertainty limit
7 Check outlet stiffness Block: Transducer block 1
Index: 78
• 0: Within uncertainty limit
• 1: Outside uncertainty limit
8 Read abort code Block: Transducer block 1
Index: 185
Codes: See Table 3-3
Startup ConfigurationCalibrationBefore You Begin
Configuration and Use Manual 29
Page 38

Calibration
Verify configuration
parameters
Tools >
Meter Verification >
Run Meter Verification
Enter descriptive data
(optional)
Select output behavior
Rerun
test?
Test result chart
Configuration Changed
or Zero Changed?
View details (optional)
Yes
Next
View Previous Results
Next
Report
Test resultFail Pass
Yes No
Back
Next
Next
Finish
Start Meter Verification
---------------------
No
Abort
Figure 3-6 Smart Meter Verification – ProLink II
30 Model 2700 Transmitter with PROFIBUS-PA
Page 39

Calibration
3.4.3 Reading and interpreting Smart Meter Verification test results
Pass/Fail/Abort
When the Smart Meter Verification test is completed, the result will be reported as Pass, Fail/Caution
(depending on the tool you are using), or Abort:
• Pass – The test result is within the specification uncertainty limit. In other words, the stiffness
of the left and right pickoffs match the factory values plus or minus the specification
uncertainty limit. If transmitter zero and configuration match factory values, the sensor will
meet factory specifications for flow and density measurement. It is expected that meters will
pass Smart Meter Verification every time the test is run.
• Fail/Caution – The test result is not within the specification uncertainty limit. Micro Motion
recommends that you immediately repeat the Smart Meter Verification test. If you previously
set outputs to Continue Measurement, change the setting to Last Measured Value or Fault.
- If the meter passes the second test, the first Fail/Caution result can be ignored.
- If the meter fails the second test, the flow tubes may be damaged. Use your process
knowledge to determine the possibilities for damage and the appropriate actions for each.
These actions might include removing the meter from service and physically inspecting
the tubes. At minimum, you should perform a flow validation and a density calibration.
• Abort – A problem occurred with the Smart Meter Verification test (e.g., process instability).
Abort codes are listed in Table 3-3, and suggested actions are provided for each code.
Startup ConfigurationCalibrationBefore You Begin
Table 3-3 Smart Meter Verification abort codes
Abort code Description Suggested action
1 User-initiated abort None required. Wait for 15 seconds before starting
another test.
3 Frequency drift Ensure that temperature, flow, and density are stable,
and rerun the test.
5 High drive gain Ensure that flow is stable, minimize entrained gas, and
rerun the test.
8 Unstable flow Review the suggestions for stable flow in Section 3.4.1
and rerun the test.
13 No factory reference data for Smart
Meter Verification test performed on air
14 No factory reference data for Smart
Meter Verification test performed on
water
15 No configuration data for Smart Meter
Verification
Other General abort Repeat the test. If the test aborts again, contact
Contact Micro Motion customer service and provide the
abort code.
Contact Micro Motion customer service and provide the
abort code.
Contact Micro Motion customer service and provide the
abort code.
Micro Motion customer service and provide the abort
code.
Configuration and Use Manual 31
Page 40

Calibration
Detailed test data with ProLink II
For each test, the following data is stored on the transmitter:
ProLink II stores additional descriptive information for each test in a database on the local PC,
including:
If you run a Smart Meter Verification test from ProLink II, ProLink II first checks for new test results
on the transmitter and synchronizes the local database if required. During this step, ProLink II
displays the following message:
• Powered-on seconds at the time of the test
• Test result
• Stiffness of the left and right pickoffs, shown as percentage variation from the factory value. If
the test aborted, 0 is stored for these values.
• Abort code, if applicable
• Timestamp from the PC clock
• Current flowmeter identification data
• Current flow and density configuration parameters
• Current zero values
• Current process values for mass flow rate, volume flow rate, density, temperature, and external
pressure
• (Optional) User-entered customer and test descriptions
Synchronizing x out of y
Please wait
Note: If you request an action while synchronization is in process, ProLink II displays a message
asking whether or not you want to complete synchronization. If you choose No, the ProLink II
database may not include the latest test results from the transmitter.
Test results are available at the end of each test, in the following forms:
• A test result chart (see Figure 3-7).
• A test report that includes the descriptive information for the current test, the test result chart,
and background information about Smart Meter Verification. You can export this report to an
HTML file or print it to the default printer.
Note: To view the chart and the report for previous tests without running a test, click View Previous
Test Results and Print Report from the first Smart Meter Verification panel. See Figure 3-7. Test
reports are available only for tests initiated from ProLink II.
32 Model 2700 Transmitter with PROFIBUS-PA
Page 41

Calibration
Initiated from ProLink II
Initiated from the display or other tool
Figure 3-7 Test result chart
Startup ConfigurationCalibrationBefore You Begin
The test result chart shows the results for all tests in the ProLink II database, plotted against the
specification uncertainty limit. The inlet stiffness and the outlet stiffness are plotted separately. This
helps to distinguish between local and uniform changes to the sensor tubes.
This chart supports trend analysis, which can be helpful in detecting meter problems before they
become severe.
Configuration and Use Manual 33
Page 42

Calibration
Note the following:
Detailed test data with the display
For each Smart Meter Verification test, the following data is stored on the transmitter:
• The test result chart may not show all test results, and test counters may not be continuous.
ProLink II stores information about all tests initiated from ProLink II and all tests available on
the transmitter when the test database is synchronized. However, the transmitter stores only the
twenty most recent test results. To ensure a complete result set, always use ProLink II to
initiate the tests, or synchronize the ProLink II database before overwriting occurs.
• The chart uses different symbols to differentiate between tests initiated from ProLink II and
tests initiated using a different tool. A test report is available only for tests that were initiated
from ProLink II.
• You can double-click the chart to manipulate the presentation in a variety of ways (change
titles, change fonts, colors, borders and gridlines, etc.), and to export the data to additional
formats (including “to printer”).
• You can export this chart to a CSV file for use in external applications.
• Powered-on seconds at the time of the test
• Test result
• Stiffness of the left and right pickoffs, shown as percentage variation from the factory value. If
the test aborted, 0 is stored for these values.
• Abort code, if applicable
To view this data, refer to the menu flowchart in Figure B-7.
3.4.4 Setting up automatic or remote execution of the Smart Meter Verification test
There are two ways to execute a Smart Meter Verification test automatically:
• Set up a one-time automatic execution
• Set up a recurring execution
To set up a one-time automatic execution, set up a recurring execution, view the number of hours until
the next scheduled test, or delete a schedule:
- With ProLink II, choose
- With the EDD, choose
Tools > Meter Verification > Schedule Meter Verification.
Device > Meter Verification.
- With the display, see Figure B-8.
Note the following:
• If you are setting up a one-time automatic execution, specify the start time as a number of
hours from the present time. For example, if the present time is 2:00 and you specify 3.5 hours,
the test will be initiated at 5:30.
• If you are setting up a recurring execution, specify the number of hours to elapse between
executions. The first test will be initiated when the specified number of hours has elapsed, and
testing will be repeated at the same interval until the schedule is deleted. For example, if the
present time is 2:00 and you specify 2 hours, the first test will be initiated at 4:00, the next at
6:00, and so on.
• If you delete the schedule, both the one-time execution and the recurring execution settings are
deleted.
34 Model 2700 Transmitter with PROFIBUS-PA
Page 43

Calibration
NewMeterFactor ConfiguredMeterFactor
ExternalStandard
ActualFlowmeterMeasurement
---------------------------------------------------------------------------------
×=
MeterFactor
Volume
1
MeterFactor
Density
-----------------------------------------------=
MeterFactor
Volume
ConfiguredMeterFactor
Density
Density
Flowmeter
Density
ExternalStandard
-------------------------------------------------------
×=
3.5 Performing meter validation
To perform meter validation:
1. Determine the meter factor(s) to use. You may set any combination of the mass flow, volume
flow, and density meter factors.
Note that all three meter factors are independent:
• The mass flow meter factor affects only the value reported for mass flow.
• The density meter factor affects only the value reported for density.
• The volume flow meter factor affects only the value reported for volume flow.
Therefore, to adjust volume flow, you must set the meter factor for volume flow. Setting a
meter factor for mass flow and a meter factor for density will not produce the desired result.
The volume flow calculations are based on original mass flow and density values, before the
corresponding meter factors have been applied.
2. Calculate the meter factor as follows:
a. Sample the process fluid and record the process variable value reported by the flowmeter.
b. Measure the sample using an external standard.
c. Calculate the new meter factor using the following formula:
Startup ConfigurationCalibrationBefore You Begin
If you are calculating the volume flow meter factor, note that proving volume in the field may
be expensive, and the procedure may be hazardous for some process fluids. Therefore, because
volume is inversely proportional to density, an alternative to direct sampling and measurement
is to calculate the volume flow meter factor from the density meter factor. This method
provides partial correction by adjusting for any portion of the total offset that is caused by
density measurement offset. Use this method only when a volume flow reference is not
available, but a density reference is available. To use this method:
a. Calculate the meter factor for density, using the preceding formula.
b. Calculate the volume flow meter factor from the density meter factor, as shown below:
Note: This equation is mathematically equivalent to the equation shown below. You may use
whichever equation you prefer.
3. Ensure that the meter factor is between
0.8 and 1.2, inclusive. If the calculated meter factor is
outside these limits, contact Micro Motion customer service.
Configuration and Use Manual 35
Page 44

Calibration
MeterFactor
MassFlow
1
250
250.27
------------------
× 0.9989==
MeterFactor
MassFlow
0.9989
250.25
250.07
------------------
× 0.9996==
EDD
Block: Transducer Block 1 (Slot 11)
Index 36 (Mass factor)
Index 37 (Density factor)
Index 38 (Volume factor)
Meter Factors
Bus parameters
ProLink II
MMI Coriolis Flow >
Transducer Block
Mass Factor
Measurement >
Process Variable
Mass Flow
Density Factor
Density
Volume Factor
Volume Flow
Example
To adjust meter factors:
• With the EDD, bus parameters, or ProLink II, refer to the menu flowcharts in Figure 3-8.
• With the display, refer to the menu flowchart in Figure B-12.
Figure 3-8 Adjusting meter factors
The flowmeter is installed and proved for the first time. The flowmeter
mass measurement is 250.27 lb; the reference device measurement is
250 lb. A mass flow meter factor is determined as follows:
The first mass flow meter factor is 0.9989.
One year later, the flowmeter is proved again. The flowmeter mass
measurement is 250.07 lb; the reference device measurement is
250.25 lb. A new mass flow meter factor is determined as follows:
The new mass flow meter factor is 0.9996.
36 Model 2700 Transmitter with PROFIBUS-PA
Page 45

Calibration
3.6 Performing zero calibration
Zeroing the flowmeter establishes the flowmeter’s point of reference when there is no flow. The meter
was zeroed at the factory, and should not require a field zero. However, you may wish to perform a
field zero to meet local requirements or to confirm the factory zero.
When you zero the flowmeter, you may need to adjust the zero time parameter. Zero time is the length
of time the transmitter takes to determine its zero-flow reference point. The default zero time is
20 seconds.
•A long zero time may produce a more accurate zero reference but is more likely to result in
zero failure. This is due to the increased possibility of noisy flow, which causes incorrect
calibration.
•A short zero time is less likely to result in a zero failure but may produce a less accurate zero
reference.
For most applications, the default zero time is appropriate.
Note: Do not zero the flowmeter if a high severity alarm is active. Correct the problem, then zero the
flowmeter. You may zero the flowmeter if a low severity alarm is active.
If the transmitter is connected to an enhanced core processor, there are two recovery functions that
may be used if the zero procedure fails:
• Restore prior zero – Available only from ProLink II and only during the current zero
procedure. Once you have closed the Calibration dialog box or disconnected from the
transmitter, you can no longer restore the prior zero.
• Restore factory zero – Always available via all configuration tools.
Startup ConfigurationCalibrationBefore You Begin
Note: If the flowmeter fails the zeroing procedure twice, refer to Section 6.6.
3.6.1 Preparing for the zeroing procedure
To prepare for the zeroing procedure:
1. Apply power to the flowmeter. Allow the flowmeter to warm up for approximately 20 minutes.
2. Run the process fluid through the sensor until the sensor temperature reaches the normal
process operating temperature.
3. Close the shutoff valve downstream from the sensor.
4. Ensure that the sensor is completely filled with fluid and the flow through the sensor has
completely stopped.
If fluid is flowing through the sensor, the sensor zero calibration may be inaccurate, resulting in
inaccurate process measurement. To improve the sensor zero calibration and measurement accuracy,
ensure that process flow through the sensor has completely stopped.
3.6.2 Zeroing procedure
To zero the flowmeter:
• With the EDD, refer to the menu flowchart in Figure 3-9.
• With bus parameters, refer to the menu flowchart in Figure 3-10.
• With ProLink II, refer to the menu flowchart in Figure 3-11.
• With the display, refer to the menu flowchart in Figure B-17.
Configuration and Use Manual 37
Page 46

Calibration
Calibration >
Zero Cal
Modify zero time if
desired
Start Zero Cal
Stop flow through
sensor
Execute
Zero in progress
OK
Zeroing success Troubleshoot
Block: Transducer Block 1 (Slot 11)
Index 13 (zero calibration)
Initiate zero
Block: Transducer Block 1 (Slot 11)
Index 83 (zero time)
Modify zero time
(if desired)
Block: Transducer Block 1 (Slot 11)
Index 12 (zero point)
Check zero value
Block: Transducer Block 1 (Slot 11)
Index 143, Bit 0x8000
Check status
Block: Transducer Block 1 (Slot 11)
Index 141, Bits 0x0100, 0x0200,
0x0400, and 0x0800
Check for failure
alarms
Figure 3-9 Zeroing procedure – EDD
Figure 3-10 Zeroing procedure – Bus parameters
38 Model 2700 Transmitter with PROFIBUS-PA
Page 47

Calibration
Modify zero time
if required
Calibration
Failure LED
Calibration in Progress LED
turns red
Green
Troubleshoot
Red
Perform Auto Zero
Done
ProLink >
Calibration >
Zero Calibration
Wait until Calibration in
Progress LED turns green
Figure 3-11 Zeroing procedure – ProLink II
Startup ConfigurationCalibrationBefore You Begin
3.7 Performing density calibration
Density calibration includes the following calibration points:
• All sensors:
- D1 calibration (low-density)
- D2 calibration (high-density)
• T-Series sensors only:
- D3 calibration (optional)
- D4 calibration (optional)
For T-Series sensors, the optional D3 and D4 calibrations could improve the accuracy of the density
measurement. If you choose to perform the D3 and D4 calibrations:
• Do not perform the D1 or D2 calibrations.
• Perform the D3 calibration if you have one calibrated fluid.
• Perform both the D3 and D4 calibrations if you have two calibrated fluids (other than air
and water).
The calibrations that you choose must be performed without interruption, in the order listed here.
Configuration and Use Manual 39
Page 48

Calibration
Note: Before performing the calibration, record your current calibration parameters. If you are using
ProLink II, you can do this by saving the current configuration to a file on the PC. If the calibration
fails, restore the known values.
3.7.1 Preparing for density calibration
Before beginning density calibration, review the requirements in this section.
Sensor requirements
During density calibration, the sensor must be completely filled with the calibration fluid, and flow
through the sensor must be at the lowest rate allowed by your application. This is usually
accomplished by closing the shutoff valve downstream from the sensor, then filling the sensor with
the appropriate fluid.
Density calibration fluids
D1 and D2 density calibration require a D1 (low density) fluid and a D2 (high density) fluid. You may
use air and water. If you are calibrating a T-Series sensor, the D1 fluid must be air and the D2 fluid
must be water.
For T-Series sensors, the D1 calibration must be performed on air and the D2 calibration must be
performed on water.
For D3 density calibration, the D3 fluid must meet the following requirements:
• Minimum density of 0.6 g/cm
• Minimum difference of 0.1 g/cm
3
3
between the density of the D3 fluid and the density of water.
The density of the D3 fluid may be either greater or less than the density of water.
For D4 density calibration, the D4 fluid must meet the following requirements:
• Minimum density of 0.6 g/cm
• Minimum difference of 0.1 g/cm
3
3
between the density of the D4 fluid and the density of the D3
fluid. The density of the D4 fluid must be greater than the density of the D3 fluid.
• Minimum difference of 0.1 g/cm
3
between the density of the D4 fluid and the density of water.
The density of the D4 fluid may be either greater or less than the density of water
3.7.2 Density calibration procedure
To perform a D1 and D2 density calibration, refer to the menu flowcharts Figures 3-12, 3-13, and
3-14.
To perform a D3 or a D3-and-D4 density calibration, refer to the menu flowcharts in Figures 3-15,
3-16, and 3-17.
40 Model 2700 Transmitter with PROFIBUS-PA
Page 49

Calibration
D2 calibrationD1 calibration
Calibration >
Density Cal
Fill sensor with D1
fluid
Start Lo Density Cal
Low Density Cal in
progress
Execute
Fill sensor with D2
fluid
Start Hi Density Cal
High Density Cal in
progress
Execute
Done
D1 = density of D1
fluid
D2 = density of D2
fluid
D2 CalibrationD1 Calibration
Block: Transducer Block 1 (Slot 11)
Index 87 (low density cal)
Initiate D1 calibration
Fill sensor with D1
fluid
Block: Transducer Block 1 (Slot 11)
Index 92 (K1)
Check K1 value
Block: Transducer Block 1 (Slot 11)
Index 143, Bit 0x4000
Check status
Block: Transducer Block 1 (Slot 11)
Index 141, Bits 0x0100, 0x0200,
and 0x0400
Check for failure
alarms
Block: Transducer Block 1 (Slot 11)
Index 97 (D1)
Enter density of D1
fluid
Block: Transducer Block 1 (Slot 11)
Index 88 (high density cal)
Initiate D2 calibration
Fill sensor with D2
fluid
Block: Transducer Block 1 (Slot 11)
Index 93 (K2)
Check K2 value
Block: Transducer Block 1 (Slot 11)
Index 143, Bit 0x2000
Check status
Block: Transducer Block 1 (Slot 11)
Index 141, Bits 0x0100, 0x0200,
and 0x0400
Check for failure
alarms
Block: Transducer Block 1 (Slot 11)
Index 98 (D2)
Enter density of D2
fluid
Done
Figure 3-12 D1 and D2 density calibration – EDD
Startup ConfigurationCalibrationBefore You Begin
Figure 3-13 D1 and D2 density calibration – Bus parameters
Configuration and Use Manual 41
Page 50

Calibration
D2 CalibrationD1 Calibration
Enter density of D1 fluid
Calibration in Progress light
turns green
Calibration in Progress light
turns red
Close shutoff valve
downstream from sensor
Fill sensor with D1 fluid Fill sensor with D2 fluid
Close
Enter density of D2 fluid
Calibration in Progress light
turns green
Calibration in Progress light
turns red
Close
Done
Do Cal Do Cal
ProLink Menu >
Calibration >
Density cal – Point 1
ProLink Menu >
Calibration >
Density cal – Point 2
Figure 3-14 D1 and D2 density calibration – ProLink II
42 Model 2700 Transmitter with PROFIBUS-PA
Page 51

Calibration
D4 calibrationD3 calibration
Calibration >
T-Series Density Cal
Fill sensor with D3
fluid
Start D3 Density Cal
D3 Cal in progress
Execute
Fill sensor with D4
fluid
Start D4 Density Cal
D4 Cal in progress
Execute
Done
Done
D3 = density of D3
fluid
D4 = density of D4
fluid
D4 CalibrationD3 Calibration
Block: Transducer Block 1 (Slot 11)
Index 90 (D3 cal)
Initiate D3 calibration
Fill sensor with D3
fluid
Block: Transducer Block 1 (Slot 11)
Index 95 (K3)
Check K3 value
Block: Transducer Block 1 (Slot 11)
Index 143, Bit 0x0040
Check status
Block: Transducer Block 1 (Slot 11)
Index 141, Bits 0x0100, 0x0200,
and 0x0400
Check for failure
alarms
Block: Transducer Block 1 (Slot 11)
Index 100 (D3)
Enter density of D3
fluid
Block: Transducer Block 1 (Slot 11)
Index 91 (D4 cal)
Initiate D4 calibration
Fill sensor with D4
fluid
Block: Transducer Block 1 (Slot 11)
Index 96 (K4)
Check K4 value
Block: Transducer Block 1 (Slot 11)
Index 143, Bit 0x0080
Check status
Block: Transducer Block 1 (Slot 11)
Index 141, Bits 0x0100, 0x0200,
and 0x0400
Check for failure
alarms
Block: Transducer Block 1 (Slot 11)
Index 101 (D4)
Enter density of D4
fluid
Done
Done
Figure 3-15 D3 or D3-and-D4 density calibration – EDD
Startup ConfigurationCalibrationBefore You Begin
Figure 3-16 D3 or D3-and-D4 density calibration – Bus parameters
Configuration and Use Manual 43
Page 52

Calibration
D4 CalibrationD3 Calibration
Enter density of D3 fluid
Calibration in Progress light
turns green
Calibration in Progress light
turns red
Close shutoff valve
downstream from sensor
Fill sensor with D3 fluid Fill sensor with D4 fluid
Close
Enter density of D4 fluid
Calibration in Progress light
turns green
Calibration in Progress light
turns red
Close
Done
Do Cal Do Cal
ProLink Menu >
Calibration >
Density cal – Point 3
ProLink Menu >
Calibration >
Density cal – Point 4
Done
Figure 3-17 D3 or D3-and-D4 density calibration – ProLink II
3.8 Performing temperature calibration
Temperature calibration is a two-point procedure: temperature offset calibration and temperature
slope calibration. The entire procedure must be completed without interruption.
To perform a temperature calibration, you must use ProLink II. Refer to the menu flowchart in
Figure 3-18.
44 Model 2700 Transmitter with PROFIBUS-PA
Page 53

Calibration
Enter temperature of high-temperature
fluid
Temperature Slope calibration
Do Cal
Wait until sensor achieves thermal
equilibrium
Fill sensor with high-temperature fluid
Calibration in Progress light turns
green
Calibration in Progress light turns red
Close
ProLink Menu >
Calibration >
Temp slope cal
Enter temperature of low-temperature
fluid
Temperature Offset calibration
Do Cal
Wait until sensor achieves thermal
equilibrium
Fill sensor with low-temperature fluid
Calibration in Progress light turns
green
Calibration in Progress light turns red
Close
Done
ProLink Menu >
Calibration >
Temp offset cal
Figure 3-18 Temperature calibration – ProLink II
Startup ConfigurationCalibrationBefore You Begin
Configuration and Use Manual 45
Page 54

46 Model 2700 Transmitter with PROFIBUS-PA
Page 55

Chapter 4
Configuration
4.1 Overview
This section describes how to change the operating settings of the transmitter.
Note: All procedures provided in this chapter assume that you have established communication with
the transmitter and that you are complying with all applicable safety requirements. See Appendix C or
the documentation for your PROFIBUS host or configuration tool.
4.2 Default target mode
The default target mode for all blocks is Auto. It is not necessary to set blocks to OOS mode before
changing the parameters described in this chapter.
4.3 Configuration map
Startup ConfigurationCalibrationBefore You Begin
Use the map in Table 4-1 to guide you through a complete or partial configuration of the transmitter.
Table 4-1 Configuration map
Method
Topic
Gas standard volume ✔✔ 4.4
Measurement units ✔✔✔4.5
Petroleum measurement application ✔✔ 4.6
Concentration measurement application ✔✔ 4.7
Output scale ✔ 4.8
Process alarms ✔ 4.9
Alarm severity ✔✔ 4.10
Damping ✔✔ 4.11
Slug flow ✔✔ 4.12
Cutoffs ✔✔ 4.13
Measurement mode ✔✔ 4.14
Sensor parameters ✔✔ 4.15
Display functionality ✔✔✔4.16
SectionEDD ProLink II Display
Configuration and Use Manual 47
Page 56

Configuration
4.4 Configuring standard volume flow measurement for gas
Two types of volume flow measurement are available:
• Liquid volume (the default)
•Gas standard volume
Only one type of volume flow measurement can be performed at a time (i.e., if liquid volume flow
measurement is enabled, gas standard volume flow measurement is disabled, and vice versa).
Different sets of volume flow measurement units are available, depending on which type of volume
flow measurement is enabled. If you want to use a gas volume flow unit, additional configuration is
required.
Note: If you will use the petroleum measurement application or the concentration measurement
application, liquid volume flow measurement is required.
To configure gas standard volume flow you must:
• Enable gas standard volume flow
• Specify the standard density (density at reference conditions) of your gas
• Select the measurement unit to use
• Set the low flow cutoff value
Note: The display will allow you to select a volume measurement unit from the set available for the
configured volume flow type, but it will not allow you to configure gas standard volume flow.
48 Model 2700 Transmitter with PROFIBUS-PA
Page 57

Configuration
Configuring GSVEnabling GSV
MMI Coriolis Flow >
Transducer Block >
Measurement >
Process Variable >
Volume Flow Type
Set Volume Flow Type to
STD Gas Volume
MMI Coriolis Flow >
Transducer Block >
Measurement >
Process Variable >
Volume Flow
Gas Std Density
Gas Std Vol Flow Units
Gas Std Vol Flow Cutoff
Block: Transducer Block 1 (Slot 11)
Index 62 (Enable GSV)
Enabling GSV
Block: Transducer Block 1 (Slot 11)
Index 63 (Gas density)
Index 67 (GSV flow units)
Index 69 (GSV flow cutoff)
Configuring GSV
Figure 4-1 Enabling and configuring gas standard volume – EDD
Startup ConfigurationCalibrationBefore You Begin Startup ConfigurationCalibrationBefore You Begin Startup ConfigurationCalibrationBefore You Begin Startup ConfigurationCalibrationBefore You Begin
Figure 4-2 Enabling and configuring gas standard volume – Bus parameters
Configuration and Use Manual 49
Page 58

Configuration
Flow tab
Set Vol Flow Type to
Std Gas Volume
Apply
ProLink >
Configuration
Select units from the
Std Gas Vol Flow
Units list
Configure Std Gas Vol
Flow Cutoff
Known gas
density?
Yes
Enter density in Std
Gas Density box
No
Gas in
Choose Gas
list?
Select gas from
Choose Gas list
Yes
Change Reference Conditions
Enter Other Gas
Property
Select method:
Molecular Weight
Specific Gravity
Compared to Air
Density
(1)
Provide required
information
No
Verify reference
temperature and
pressure
Correct?
Enter new reference
information
Gas Wizard
No
Next
Next
Finish
Yes
Notes:
(1) If you select Density, you must enter the
value in the configured density units
and you must provide the temperature
and pressure at which the density value
was determined.
Figure 4-3 Enabling and configuring gas standard volume – ProLink II
50 Model 2700 Transmitter with PROFIBUS-PA
Page 59

Configuration
4.5 Changing the measurement units
The transmitter is able to store measurement units in two different places: in the transducer block and
in the AI blocks. These two units locations are independent and can be set to different values. This
affects configuration in the following ways:
• If you are using a PROFIBUS configuration tool or the display, units will be set to match in
both the relevant AI block and the transducer block.
• If you are using ProLink II, use the
Function Block tab to configure units. Although units can
be configured on some of the other tabs, doing so may produce unintended results.
Note: Changing the measurement units for a process variable automatically changes the associated
totalizer units as well. For example, setting the mass flow units to g/s will automatically set the mass
totalizer unit to grams.
Note: Configure the AI block channel before configuring the AI block units. The AI blocks will
produce an error if the measurement units are set to a value that is impossible for the configured
channel.
To configure measurement units, refer to Tables 4-2 through 4-7 and the flowcharts in Figures 2-1
and 2-3.
Table 4-2 Mass flow measurement units
Mass flow unit
Unit descriptionEDD ProLink II Display
g/s g/s G/S Grams per second
g/min g/min G/MIN Grams per minute
g/h g/hr G/H Grams per hour
kg/s kg/s KG/S Kilograms per second
kg/min kg/min KG/MIN Kilograms per minute
kg/h kg/hr KG/H Kilograms per hour
kg/d kg/day KG/D Kilograms per day
t/min mTon/min T/MIN Metric tons per minute
t/h mTon/hr T/H Metric tons per hour
t/d mTon/day T/D Metric tons per day
lb/s lbs/s LB/S Pounds per second
lb/min lbs/min LB/MIN Pounds per minute
lb/h lbs/hr LB/H Pounds per hour
lb/d lbs/day LB/D Pounds per day
STon/min sTon/min ST/MIN Short tons (2000 pounds) per minute
STon/h sTon/hr ST/H Short tons (2000 pounds) per hour
STon/d sTon/day ST/D Short tons (2000 pounds) per day
LTon/h lTon/hr LT/H Long tons (2240 pounds) per hour
LTon/d lTon/day LT/D Long tons (2240 pounds) per day
Startup ConfigurationCalibrationBefore You Begin Startup ConfigurationCalibrationBefore You Begin Startup ConfigurationCalibrationBefore You Begin Startup ConfigurationCalibrationBefore You Begin
Configuration and Use Manual 51
Page 60

Configuration
Table 4-3 Volume flow measurement units – Liquid
EDD ProLink II Display Unit description
CFS ft3/sec CUFT/S Cubic feet per second
CFM ft3/min CUF/MN Cubic feet per minute
CFH ft3/hr CUFT/H Cubic feet per hour
3
ft
m3/s m3/sec M3/S Cubic meters per second
m
m3/h m3/hr M3/H Cubic meters per hour
m3/d m3/day M3/D Cubic meters per day
gal/s US gal/sec USGPS U.S. gallons per second
GPM US gal/min USGPM U.S. gallons per minute
gal/h US gal/hr USGPH U.S. gallons per hour
gal/d US gal/d USGPD U.S. gallons per day
Mgal/d mil US gal/day MILG/D Million U.S. gallons per day
L/s l/sec L/S Liters per second
L/min l/min L/MIN Liters per minute
L/h l/hr L/H Liters per hour
ML/d mil l/day MILL/D Million liters per day
ImpGal/s Imp gal/sec UKGPS Imperial gallons per second
ImpGal/min Imp gal/min UKGPM Imperial gallons per minute
ImpGal/h Imp gal/hr UKGPH Imperial gallons per hour
ImpGal/d Imp gal/day UKGPD Imperial gallons per day
bbl/s barrels/sec BBL/S Barrels per second
bbl/min barrels/min BBL/MN Barrels per minute
bbl/h barrels/hr BBL/H Barrels per hour
bbl/d barrels/day BBL/D Barrels per day
— Beer barrels/sec BBBL/S Beer barrels per second
— Beer barrels/min BBBL/MN Beer barrels per minute
— Beer barrels/hr BBBL/H Beer barrels per hour
— Beer barrels/day BBBL/D Beer barrels per day
Volume flow unit
/d ft3/day CUFT/D Cubic feet per day
3
/min m3/min M3/MIN Cubic meters per minute
(1)
(1)
(1)
(1)
(2)
(2)
(2)
(2)
(1) Unit based on oil barrels (42 U.S. gallons).
(2) Unit based on U.S. beer barrels (31 U.S. gallons).
Table 4-4 Volume flow measurement units – Gas
Volume flow unit
EDD ProLink II Display Unit description
Nm3/s Nm3/sec NM3/S Normal cubic meters per second
3
/m Nm3/min NM3/MN Normal cubic meters per minute
Nm
Nm3/h Nm3/hr NM3/H Normal cubic meters per hour
52 Model 2700 Transmitter with PROFIBUS-PA
Page 61

Configuration
Table 4-4 Volume flow measurement units – Gas (continued)
EDD ProLink II Display Unit description
Nm3/d Nm3/day NM3/D Normal cubic meters per day
NL/s NLPS NLPS Normal liter per second
NL/m NLPM NLPM Normal liter per minute
NL/h NLPH NLPH Normal liter per hour
NL/d NLPD NLPD Normal liter per day
SCFS SCFS SCFS Standard cubic feet per second
SCFM SCFM SCFM Standard cubic feet per minute
SCFH SCFH SCFH Standard cubic feet per hour
SCFD SCFD SCFD Standard cubic feet per day
Sm
Sm3/m Sm3/min SM3/MN Standard cubic meters per minute
Sm3/h Sm3/hr SM3/H Standard cubic meters per hour
Sm
SL/s SLPS SLPS Standard liter per second
SL/m SLPM SLPM Standard liter per minute
SL/h SLPH SLPH Standard liter per hour
SL/d SLPD SLPD Standard liter per day
Volume flow unit
3
/s Sm3/S SM3/S Standard cubic meters per second
3
/d Sm3/day SM3/D Standard cubic meters per day
Startup ConfigurationCalibrationBefore You Begin Startup ConfigurationCalibrationBefore You Begin Startup ConfigurationCalibrationBefore You Begin Startup ConfigurationCalibrationBefore You Begin
Table 4-5 Density measurement units
Density unit
Unit descriptionEDD ProLink II Display
g/cm3 g/cm3 G/CM3 Grams per cubic centimeter
g/L g/l G/L Grams per liter
g/ml g/ml G/ML Grams per milliliter
kg/L kg/l KG/L Kilograms per liter
3
kg/m3 KG/M3 Kilograms per cubic meter
kg/m
lb/gal lbs/Usgal LB/GAL Pounds per U.S. gallon
lb/ft3 lbs/ft3 LB/CUF Pounds per cubic foot
3
lbs/in3 LB/CUI Pounds per cubic inch
lb/in
STon/yd3 sT/yd3 ST/CUY Short ton per cubic yard
degAPI degAPI D API Degrees API
SGU SGU SGU Specific gravity unit (not temperature
corrected)
Configuration and Use Manual 53
Page 62

Configuration
Table 4-6 Temperature measurement units
°C °C °C Degrees Celsius
°F °F °F Degrees Fahrenheit
°R °R °R Degrees Rankine
K °K °K Kelvin
Although pressure units are listed in Table 4-7, the transmitter does not measure pressure. These units
are for configuring external pressure compensation. Refer to Section 2.7.
Table 4-7 Pressure measurement units
ft H20 @68 DegF Ft Water @ 68°F FTH2O Feet water @ 68 °F
inch H2O @4 DegC In Water @ 4°C INW4C Inches water @ 4 °C
inch H20 @
mm H2O @4 DegC mm Water @ 4°C mmW4C Millimeters water @ 4 °C
mm H20 @68 DegF mm Water @ 68°F mmH2O Millimeters water @ 68 °F
inch Hg @
mm Hg @0 DegC mm Mercury @ 0°C mmHG Millimeters mercury @ 0 °C
psi PSI PSI Pounds per square inch
bar bar BAR Bar
millibar millibar mBAR Millibar
g_per_cm2 g/cm2 G/SCM Grams per square centimeter
kg_per_cm2 kg/cm2 KG/SCM Kilograms per square centimeter
Pa pascals PA Pascals
MegaPa megapascals MPA Megapascals
KiloPa Kilopascals KPA Kilopascals
torr @0 DegC Torr
atm atms ATM Atmospheres
Temperature unit
Unit descriptionPROFIBUS-PA ProLink II Display
Pressure unit
Unit descriptionEDD ProLink II Display
68 DegF In Water @ 68°F INH2O Inches water @ 68 °F
0 DegC In Mercury @ 0°C INHG Inches mercury @ 0 °C
@ 0C TORR Torr @ 0 °C
54 Model 2700 Transmitter with PROFIBUS-PA
Page 63

Configuration
4.6 Configuring the petroleum measurement application
The petroleum measurement parameters determine the values that will be used in petroleum
measurement-related calculations. The petroleum measurement parameters are available only if the
petroleum measurement application is enabled on your transmitter.
Note: The petroleum measurement application requires liquid volume measurement units. If you plan
to use petroleum measurement process variables, ensure that liquid volume flow measurement is
specified. See Section 4.4.
4.6.1 About the petroleum measurement application
Some applications that measure liquid volume flow or liquid density are particularly sensitive to
temperature factors, and must comply with American Petroleum Institute (API) standards for
measurement. The petroleum measurement application enables Correction of Temperature on volume
of Liquids, or CTL.
Terms and definitions
The following terms and definitions are relevant to the petroleum measurement application:
• API – American Petroleum Institute
• CTL – Correction of Temperature on volume of Liquids. The CTL value is used to calculate
the VCF value
• TEC – Thermal Expansion Coefficient
• VCF – Volume Correction Factor. The correction factor to be applied to volume process
variables. VCF can be calculated after CTL is derived
CTL derivation methods
There are two derivation methods for CTL:
• Method 1 is based on observed density and observed temperature.
• Method 2 is based on a user-supplied reference density (or thermal expansion coefficient, in
some cases) and observed temperature.
Startup ConfigurationCalibrationBefore You Begin Startup ConfigurationCalibrationBefore You Begin Startup ConfigurationCalibrationBefore You Begin Startup ConfigurationCalibrationBefore You Begin
Configuration and Use Manual 55
Page 64

Configuration
Petroleum measurement reference tables
Reference tables are organized by reference temperature, CTL derivation method, liquid type, and
density unit. The table selected here controls all the remaining options.
• Reference temperature:
- If you specify a 5x, 6x, 23x, or 24x table, the default reference temperature is 60 °F, and
cannot be changed.
- If you specify a 53x or 54x table, the default reference temperature is 15 °C. However, you
can change the reference temperature, as recommended in some locations (for example, to
14.0 or 14.5 °C).
• CTL derivation method:
- If you specify an odd-numbered table (5, 23, or 53), CTL will be derived using method 1
described above.
- If you specify an even-numbered table (6, 24, or 54), CTL will be derived using method 2
described above.
• The letters A, B, C, or D that are used to terminate table names define the type of liquid that the
table is designed for:
- A tables are used with generalized crude and JP4 applications.
- B tables are used with generalized products.
- C tables are used with liquids with a constant base density or known thermal expansion
coefficient.
- D tables are used with lubricating oils.
• Different tables use different density units:
-Degrees API
- Relative density (SG)
- Base density (kg/m
3
)
Table 4-8 summarizes these options.
56 Model 2700 Transmitter with PROFIBUS-PA
Page 65

Configuration
Table 4-8 Petroleum measurement reference temperature tables
CTL
Density unit and range
derivation
Table
5A Method 1 60 °F, non-configurable 0 to +100
5B Method 1 60 °F, non-configurable 0 to +85
5D Method 1 60 °F, non-configurable –10 to +40
23A Method 1 60 °F, non-configurable 0.6110 to 1.0760
23B Method 1 60 °F, non-configurable 0.6535 to 1.0760
23D Method 1 60 °F, non-configurable 0.8520 to 1.1640
53A Method 1 15 °C, configurable 610 to 1075 kg/m
53B Method 1 15 °C, configurable 653 to 1075 kg/m
53D Method 1 15 °C, configurable 825 to 1164 kg/m
method Base temperature
Degrees API Base density Relative density
3
3
3
Reference temperature Supports
6C Method 2 60 °F, non-configurable 60 °F Degrees API
24C Method 2 60 °F, non-configurable 60 °F Relative density
54C Method 2 15 °C, configurable 15 °C Base density in kg/m
4.6.2 Configuration procedure
The petroleum measurement configuration parameters are listed and defined in Table 4-9.
Startup ConfigurationCalibrationBefore You Begin Startup ConfigurationCalibrationBefore You Begin Startup ConfigurationCalibrationBefore You Begin Startup ConfigurationCalibrationBefore You Begin
3
Table 4-9 Petroleum measurement parameters
Variable Description
Table type Specifies the table that will be used for reference temperature and reference density unit. Select
the table that matches your requirements. See Petroleum measurement reference tables.
User defined TEC
Temperature units
Density units Read-only. Displays the unit used for reference density in the reference table.
Reference
temperature
(1) Configurable if Table Type is set to 6C, 24C, or 54C.
(2) In most cases, the temperature unit used by the petroleum measurement reference table should also be the temperature unit configured
for the transmitter to use in general processing. To configure the temperature unit, see Section 4.5.
(1)
Thermal expansion coefficient. Enter the value to be used in CTL calculation.
(2)
Read-only. Displays the unit used for reference temperature in the reference table.
Read-only unless Table Type is set to 53x or 54x. If configurable:
• Specify the reference temperature to be used in CTL calculation.
• Enter reference temperature in °C.
Setting the table type
To set the petroleum measurement table type, refer to the flowcharts in Figure 4-4.
Configuration and Use Manual 57
Page 66

Configuration
MMI Coriolis Flow >
Transducer Block >
API
API2540 CTL Table Type
Block: Transducer Block 2 (Slot 12)
Index 40 (API2540 CTL table type)
Table type
API Setup tab
Apply
ProLink >
Configuration
Select table type from the
API Table Type
list
EDD Bus parameters
ProLink II
EDD Bus parameters
ProLink II
MMI Coriolis Flow >
Transducer Block >
API
API Thermal Expansion
Coeff
Block: Transducer Block 2 (Slot 12)
Index 39 (API thermal expansion coeff.)
TEC
API Setup tab
Apply
ProLink >
Configuration
Enter a coefficient in the
User defined TEC box
Figure 4-4 Setting the petroleum measurement table type
Setting the reference temperature
For the temperature value to be used in CTL calculation, you can use the temperature data from the
sensor, or you can configure external temperature compensation to use temperature data from an
external temperature device.
• To use temperature data from the sensor, no action is required.
• To configure external temperature compensation, see Section 2.8.
Setting the thermal expansion coefficient
If the CTL derivation method for the petroleum measurement table type is method 2, you need to set
the thermal expansion coefficient (TEC). To set a user-defined TEC, refer to the flowcharts in
Figure 4-5.
Figure 4-5 Setting a user-defined TEC
58 Model 2700 Transmitter with PROFIBUS-PA
Page 67

Configuration
4.7 Configuring the concentration measurement application
Micro Motion sensors provide direct measurements of density, but not of concentration. The
concentration measurement application calculates process variables such as concentration or density
at reference temperature, using density process data appropriately corrected for temperature.
Note: For a detailed description of the concentration measurement application, see the manual
entitled Micro Motion Enhanced Density Application: Theory, Configuration, and Use.
Note: The concentration measurement application requires liquid volume measurement units. If you
plan to use concentration measurement process variables, ensure that liquid volume flow
measurement is specified. See Section 4.4.
4.7.1 About the concentration measurement application
The concentration measurement calculation requires a concentration measurement curve, which
specifies the relationship between temperature, concentration, and density for the process fluid being
measured. Micro Motion supplies a set of six standard concentration measurement curves (see
Table 4-10). If none of these curves is appropriate for your process fluid, you can configure a custom
curve or purchase a custom curve from Micro Motion.
The derived variable, specified during configuration, controls the type of concentration measurement
that will be produced. Each derived variable allows the calculation of a subset of concentration
measurement process variables (see Table 4-11). The available concentration measurement process
variables can be used in process control, just as mass flow rate, volume flow rate, and other process
variables are used. For example, an event can be defined on a concentration measurement process
variable.
Startup ConfigurationCalibrationBefore You Begin Startup ConfigurationCalibrationBefore You Begin Startup ConfigurationCalibrationBefore You Begin Startup ConfigurationCalibrationBefore You Begin
• For all standard curves, the derived variable is Mass Conc (Dens).
• For custom curves, the derived variable may be any of the variables listed in Table 4-11.
The transmitter can hold up to six curves at any given time, but only one curve can be active (used for
measurement) at a time. All curves that are in transmitter memory must use the same derived variable.
Table 4-10 Standard curves and associated measurement units
Name Description Density unit Temperature unit
Deg Balling Curve represents percent extract, by mass, in
solution, based on °Balling. For example, if a wort
is 10 °Balling and the extract in solution is 100%
sucrose, the extract is 10% of the total mass.
Deg Brix Curve represents a hydrometer scale for sucrose
solutions that indicates the percent by mass of
sucrose in solution at a given temperature. For
example, 40 kg of sucrose mixed with 60 kg of
water results in a 40 °Brix solution.
Deg Plato Curve represents percent extract, by mass, in
solution, based on °Plato. For example, if a wort is
10 °Plato and the extract in solution is 100%
sucrose, the extract is 10% of the total mass.
g/cm3 °F
3
g/cm
°C
3
°F
g/cm
Configuration and Use Manual 59
Page 68

Configuration
Table 4-10 Standard curves and associated measurement units (continued)
Name Description Density unit Temperature unit
HFCS 42 Curve represents a hydrometer scale for HFCS 42
(high fructose corn syrup) solutions that indicates
the percent by mass of HFCS in solution.
HFCS 55 Curve represents a hydrometer scale for HFCS 55
(high fructose corn syrup) solutions that indicates
the percent by mass of HFCS in solution.
HFCS 90 Curve represents a hydrometer scale for HFCS 90
(high fructose corn syrup) solutions that indicates
the percent by mass of HFCS in solution.
g/cm3 °C
3
g/cm
°C
3
°C
g/cm
Table 4-11 Derived variables and available process variables
Available process variables
Derived variable – ProLink II label
and definition
Density @ Ref
Density at reference temperature
Mass/unit volume, corrected to a given
reference temperature
SG
Specific gravity
The ratio of the density of a process fluid at
a given temperature to the density of water
at a given temperature. The two given
temperature conditions do not need to be
the same.
Mass Conc (Dens)
Mass concentration derived from reference
density
The percent mass of solute or of material
in suspension in the total solution, derived
from reference density
Mass Conc (SG)
Mass concentration derived from specific
gravity
The percent mass of solute or of material
in suspension in the total solution, derived
from specific gravity
Volume Conc (Dens)
Volume concentration derived from
reference density
The percent volume of solute or of material
in suspension in the total solution, derived
from reference density
Density at
reference
temperature
✓✓
✓✓✓
✓✓ ✓ ✓
✓✓✓✓ ✓
✓✓ ✓ ✓
Standard
volume
flow rate
Specific
gravity
Concentration Net
mass
flow rate
Net
volume
flow rate
60 Model 2700 Transmitter with PROFIBUS-PA
Page 69

Configuration
Table 4-11 Derived variables and available process variables (continued)
Available process variables
Derived variable – ProLink II label
and definition
Volume Conc (SG)
Volume concentration derived from specific
gravity
The percent volume of solute or of material
in suspension in the total solution, derived
from specific gravity
Conc (Dens)
Concentration derived from reference
density
The mass, volume, weight, or number of
moles of solute or of material in
suspension in proportion to the total
solution, derived from reference density
Conc (SG)
Concentration derived from specific gravity
The mass, volume, weight, or number of
moles of solute or of material in
suspension in proportion to the total
solution, derived from specific gravity
Density at
reference
temperature
✓✓✓✓ ✓
✓✓ ✓
✓✓✓✓
Standard
volume
flow rate
Specific
gravity
Concentration Net
mass
flow rate
Net
volume
flow rate
Startup ConfigurationCalibrationBefore You Begin Startup ConfigurationCalibrationBefore You Begin Startup ConfigurationCalibrationBefore You Begin Startup ConfigurationCalibrationBefore You Begin
4.7.2 Configuration procedure
Complete configuration instructions for the concentration measurement application are provided in
the manual entitled Micro Motion Enhanced Density Application: Theory, Configuration, and Use.
Note: The concentration measurement manual uses ProLink II as the standard configuration tool for
the concentration measurement application. Because the PROFIBUS parameters are very similar to
the ProLink II labels, you can follow the instructions for ProLink II and adapt them to your host. All
of the parameters related to the concentration measurement application can be found in Transducer
Block 2 (Slot 12).
The typical configuration procedure simply sets up the concentration measurement application to use
a standard curve. The following steps are required:
1. Set the transmitter’s density measurement unit to match the unit used by the curve (as listed in
Table 4-10).
2. Set the transmitter’s temperature measurement unit to match the unit used by the curve (as
listed in Table 4-10).
3. Set the derived variable to Mass Conc (Dens).
4. Specify the active curve.
Configuration and Use Manual 61
Page 70

Configuration
EDD
Block: Analog Input Block (Slots 1, 2, 3, and 5)
Index 28, Parameter1 (EU100)
Index 28, Parameter 2 (EU0)
Output Scale
Bus parameters
4.8 Changing the output scale
The AI function blocks can be configured to scale their output. The output scale is established by
defining a process variable value at 0% of scale and at 100% of scale. The output of the AI block will
be translated to a value between these two limits.
If you choose to use output scaling, note that it has no effect on the process values found in the
transducer block. This results in the following behaviors:
• ProLink II and the display use the process values in the transducer block. Therefore, the output
of a scaled AI block may differ from the value reported by other communication tools.
• Slug flow and flow cutoffs are configured in the transducer block. Therefore, output scaling
has no effect on the behavior of the transmitter with regard to slug flow or flow cutoffs.
To change the output scale, refer to the flowcharts in Figure 4-6.
Figure 4-6 Changing the output scale
62 Model 2700 Transmitter with PROFIBUS-PA
Page 71

Configuration
Process variable
High alarm
High-high alarm
Low alarm
Low-low alarm
Normal process range
4.9 Changing process alarms
The transmitter uses process alarms to indicate that a process value has exceeded its user-defined
limits. The transmitter maintains four alarm values for each process variable. In addition, the
transmitter has an alarm hysteresis function to prevent erratic alarm reports.
Note: Process alarms are only posted through the AI function blocks and totalizer blocks and are not
shown on the display or in ProLink II.
4.9.1 Alarm values
The process alarm values are the limits for process variables. Whenever a process variable exceeds a
process alarm value, the alarm will be reflected in the “Alarm Summary” parameters in each block.
Each AI function block and totalizer block has four process alarm limits: high alarm, high-high alarm,
low alarm, and low-low alarm. See Figure 4-7. The high and low process alarm values represent
normal process limits. The high-high and low-low process alarm values are used for more complex
alarm signals (e.g., to indicate a more severe problem than a regular process alarm indicates).
Figure 4-7 Alarm values
Startup ConfigurationCalibrationBefore You Begin Startup ConfigurationCalibrationBefore You Begin Startup ConfigurationCalibrationBefore You Begin Startup ConfigurationCalibrationBefore You Begin
To change the alarm values, refer to the flowcharts in Figure 4-8.
Configuration and Use Manual 63
Page 72

Configuration
EDD
Bus parameters
Figure 4-8 Changing alarm values
64 Model 2700 Transmitter with PROFIBUS-PA
Page 73

Configuration
Process variable
Alarm created
Hysteresis value
New alarms
not created
LOW ALARM
HIGH ALARM
New alarm
created here
EDD Bus parameters
4.9.2 Alarm hysteresis
The alarm hysteresis value is a percentage of the output scale. After a process alarm is created, the
transmitter will not create new alarms unless the process first returns to a value within the range of the
alarm hysteresis percentage. Figure 4-9 shows the transmitter’s alarm behavior with an alarm
hysteresis value of 50%.
Note the following about hysteresis:
Figure 4-9 High versus low alarm hysteresis values
• A low hysteresis value allows the transmitter to broadcast a new alarm every time or nearly
every time the process variable crosses over the alarm limit.
• A high hysteresis value prevents the transmitter from broadcasting new alarms unless the
process variable first returns to a value sufficiently below the high alarm limit or above the low
alarm limit.
Startup ConfigurationCalibrationBefore You Begin Startup ConfigurationCalibrationBefore You Begin Startup ConfigurationCalibrationBefore You Begin Startup ConfigurationCalibrationBefore You Begin
To change the alarm hysteresis value, refer to the flowcharts in Figure 4-10.
Figure 4-10 Changing the alarm hysteresis
Configuration and Use Manual 65
Page 74

Configuration
4.10 Configuring status alarm severity
The severity level of some status alarms can be reclassified. For example:
• The default severity level for Alarm A020 (calibration factors unentered) is Fault, but you can
reconfigure it to either Informational or Ignore.
• The default severity level for Alarm A102 (drive over-range) is Informational, but you can
reconfigure it to either Ignore or Fault.
A list of all status alarms and default severity levels is shown in Table 4-12. (For more information on
status alarms, including possible causes and troubleshooting suggestions, see Section 6.8.)
Table 4-12 Status alarms and severity levels
Default
Alarm code Index
A001 1 EEPROM checksum Fault No
A002 2 RAM error Fault No
A003 3 Sensor failure Fault Yes
A004 4 Temperature sensor failure Fault No
A005 5 Input overrange Fault Yes
A006 6 Transmitter not configured Fault Yes
A008 8 Density overrange Fault Yes
A009 9 Transmitter initializing/warming up Ignore Yes
A010 10 Calibration failure Fault No
A011 11 Calibration too low Fault Yes
A012 12 Calibration too high Fault Yes
A013 13 Zero too noisy Fault Yes
A014 14 Transmitter failed Fault No
A016 16 Line temperature out-of-range Fault Yes
A017 17 Meter RTD temperature out-of-range Fault Yes
A020 20 Calibration factors unentered Fault Yes
A021 21 Incorrect sensor type Fault No
A022 22 Configuration corrupt Fault Yes
A023 23 Totals corrupt Fault Yes
A024 24 CP program corrupt Fault Yes
A025 25 Boot sector fault Fault Yes
A026 26 Sensor/transmitter communication failure Fault No
A028 28 Sensor/transmitter write failure Fault No
A029 29 Internal communication failure Fault Yes
A030 30 Hardware/software incompatible Fault Yes
A031 31 Low power Fault No
A032 32 Smart Meter Verification in progress and
A033 33 Tube Not Full Fault Yes
A034 34 Smart Meter Verification failed Informational Yes
A035 35 Smart Meter Verification aborted Informational Yes
A102 42 Drive overrange Informational Yes
Description
outputs fixed
severity Configurable
Informational Yes
66 Model 2700 Transmitter with PROFIBUS-PA
Page 75

Configuration
Block: Transducer Block 1 (Slot 11)
Index 149 (Alarm index)
Select alarm
Block: Transducer Block 1 (Slot 11)
Index 150 (Alarm severity)
Set severity
EDD
Bus parameters
ProLink II
Alarm tab
Select an alarm from
the Alarm list
Apply
ProLink >
Configuration
Select a severity from
the Severity list
Table 4-12 Status alarms and severity levels (continued)
Default
Alarm code Index
Description
A103 43 Data loss possible Informational Yes
A104 44 Calibration in progress Informational
A105 45 Slug flow Informational Yes
A107 47 Power reset occurred Informational Yes
A116 56 API temperature outside standard range Informational Yes
A117 57 API density out of limits Informational Yes
A120 60 Concentration measurement: unable to
fit curve data
A121 61 Concentration measurement: extrapolation alarm Informational Yes
A131 71 Smart Meter Verification in progress Informational Yes
A132 72 Simulation mode active Informational
(1) Can be set to either Informational or Ignore, but cannot be set to Fault.
severity Configurable
(1)
Informational No
(1)
To configure status alarm severity, refer to the flowcharts in Figure 4-11. Some configurable alarms
can be set to either Informational or Ignore, but not to Fault.
Ye s
Ye s
Startup ConfigurationCalibrationBefore You Begin Startup ConfigurationCalibrationBefore You Begin Startup ConfigurationCalibrationBefore You Begin Startup ConfigurationCalibrationBefore You Begin
Figure 4-11 Configuring status alarm severity
Configuration and Use Manual 67
Page 76

Configuration
4.11 Changing the damping values
A damping value is a period of time, in seconds, over which the process variable value will change to
reflect 63% of the change in the actual process. Damping helps the transmitter smooth out small,
rapid measurement fluctuations.
• A high damping value makes the output appear to be smoother because the output must change
slowly.
• A low damping value makes the output appear to be more erratic because the output changes
more quickly.
To configure damping, refer to the flowcharts in Figure 4-12.
Note: There is also a “damping” parameter in each AI block called AI PV Filter Time (index 32). In
order to avoid having two (potentially conflicting) damping values, you should set damping values
only in the transducer block. The AI PV Filter Time parameter for each AI block should be set to 0.
68 Model 2700 Transmitter with PROFIBUS-PA
Page 77

Configuration
Flow tab
Enter a damping value in the
Flow Damp box
Apply
ProLink >
Configuration
Density tab
Enter a damping value in the
Dens Damping box
Apply
Temperature tab
Enter a damping value in the
Temp Damping box
Apply
Block: Transducer Block 1 (Slot 11)
Index 33 (flow damping)
Index 34 (temperature damping)
Index 35 (density damping)
Damping
EDD
ProLink II
Bus parameters
Figure 4-12 Changing the damping values
Startup ConfigurationCalibrationBefore You Begin Startup ConfigurationCalibrationBefore You Begin Startup ConfigurationCalibrationBefore You Begin Startup ConfigurationCalibrationBefore You Begin
Configuration and Use Manual 69
Page 78

Configuration
When you specify a new damping value, it is automatically rounded down to the nearest valid
damping value. Valid damping values are listed in Table 4-13.
Table 4-13 Valid damping values
Process variable Valid damping values
Flow (mass and volume) 0, 0.04, 0.08, 0.16, ... 40.96
Density 0, 0.04, 0.08, 0.16, ... 40.96
Temperature 0, 0.6, 1.2, 2.4, 4.8, ... 76.8
4.11.1 Damping and volume measurement
When configuring damping values, note the following:
Be sure to set damping values accordingly.
• Liquid volume flow is derived from mass and density measurements. Therefore, any damping
applied to mass flow and density will affect liquid volume measurement.
• Gas standard volume flow is derived from mass flow measurement, but not from density
measurement. Therefore, only damping applied to mass flow will affect gas standard volume
measurement.
4.12 Changing slug flow limits and duration
Slugs—gas in a liquid process or liquid in a gas process—occasionally appear in some applications.
The presence of slugs can significantly affect the process density reading. The slug flow parameters
can help the transmitter suppress extreme changes in process variables, and can also be used to
identify process conditions that require correction.
Slug flow parameters are as follows:
• Low slug flow limit — the point below which a condition of slug flow will exist. Typically, this
is the lowest density you expect to observe for your process. The default value is 0.0 g/cm
The valid range is 0.0–10.0 g/cm
• High slug flow limit — the point above which a condition of slug flow will exist. Typically,
this is the highest density you expect to observe for your process. The default value is
5.0 g/cm
3
. The valid range is 0.0–10.0 g/cm3.
• Slug flow duration — the number of seconds the transmitter waits for a slug flow condition to
clear. If the transmitter detects slug flow, it will post a slug flow alarm and hold its last
“pre-slug” flow rate until the end of the slug flow duration and the measurement quality will
be marked “uncertain.” If slugs are still present after the slug flow duration has expired, the
transmitter will report a flow rate of zero (the measurement quality will remain at “uncertain”).
The default value for slug flow duration is 0.0 seconds. The valid range is 0.0–60.0 seconds.
Note: The slug flow limits must be entered in g/cm
density. Slug flow duration is entered in seconds. Raising the low slug flow limit or lowering the high
slug flow limit will increase the possibility of slug flow conditions. Conversely, lowering the low slug
flow limit or raising the high slug flow limit will decrease the possibility of slug flow conditions. If
slug flow duration is set to 0, the mass flow rate will be forced to 0 as soon as slug flow is detected.
3
3
.
3
, even if another unit has been configured for
.
To configure slug flow limits and duration, refer to the flowcharts in Figure 4-13.
70 Model 2700 Transmitter with PROFIBUS-PA
Page 79

Configuration
Block: Transducer Block 1 (Slot 11)
Index 130 (duration)
Index 131 (low limit)
Index 132 (high limit)
Slug flow
Density tab
Set the density limits:
• Slug Low Limit
• Slug High Limit
Apply
ProLink >
Configuration
Set the slug flow duration in
the Slug Duration box
Bus parameters
EDD ProLink II
MMI Coriolis Flow >
Transducer Block
Calibration
Slug Limit
Slug Duration Slug Low Limit Slug High Limit
Figure 4-13 Configuring slug flow limits and duration
Startup ConfigurationCalibrationBefore You Begin Startup ConfigurationCalibrationBefore You Begin Startup ConfigurationCalibrationBefore You Begin Startup ConfigurationCalibrationBefore You Begin
4.13 Configuring cutoffs
Cutoffs are user-defined values below which the transmitter reports a value of zero for the specified
process variable. Cutoffs can be configured for either mass flow, volume flow, or density.
Table 4-14 lists the default values and relevant comments for each cutoff. Note that the mass flow
cutoff is not applied to the volume flow calculation. Even if the mass flow drops below the cutoff, and
therefore the mass flow indicators go to zero, the volume flow rate will be calculated from the actual
mass flow process variable.
Table 4-14 Cutoff default values and comments
Cutoff Default value Comments
Mass 0.0 g/s Micro Motion recommends a mass flow cutoff value of 0.2% of the
Liquid volume 0.0 L/s The lower limit for volume flow cutoff is 0. The upper limit for volume flow
Density 0.2 g/cm
3
The range for density cutoff is 0.0–0.5 g/cm3
sensor’s maximum flow rate for standard operation, and 2.5% of the
sensor’s maximum flow rate for empty-full-empty batching.
cutoff is the sensor’s flow calibration factor, in L/s, multiplied by 0.2.
To configure cutoffs, refer to the flowcharts in Figure 4-14.
Configuration and Use Manual 71
Page 80

Configuration
MMI Coriolis Flow >
Transducer Block >
Measurement >
Process Variable
Mass Flow
Mass Flow Low Cutoff
Volume Flow
Volume Flow Low
Cutoff
(1)
Density
Density Cutoff
Flow tab
Enter values in the
Mass Flow
Cutoff or Volume Flow Cutoff
(2)
boxes
Apply
ProLink >
Configuration
Density tab
Enter a value in the Density
Cutoff box
Apply
EDD
ProLink II
Bus parameters
Block: Transducer Block 1 (Slot 11)
Index 9 (Mass flow cutoff)
Index 39 (Liquid volume flow cutoff)
Index 40 (Density cutoff)
Index 69 (Gas standard volume flow cutoff)
Cutoffs
Notes:
(1) When Gas Standard Volume is
configured, this option will be
displayed as Gas Std Vol Flow
Cutoff.
(2) When Gas Standard Volume is
configured, this box will be labeled
Std gas vol flow cutoff.
Figure 4-14 Configuring cutoffs
72 Model 2700 Transmitter with PROFIBUS-PA
Page 81

Configuration
MMI Coriolis Flow >
Transducer Block >
Measurement >
Process Variable >
Mass Flow
Measurement Mode
Block: Transducer Block 1 (Slot 11)
Index 10 (measurement mode)
Measurement Mode
EDD Bus parameters
Flow tab
Select a value from
the Flow Direction
list
Apply
ProLink >
Configuration
ProLink II
4.14 Changing the measurement mode parameter
The measurement mode parameter defines how the flow is added to or subtracted from the totalizers.
• Forward flow moves in the direction of the arrow on the sensor.
• Reverse flow moves in the direction opposite from the arrow on the sensor.
Table 4-15 shows the possible values for the measurement mode parameter and the transmitter’s
behavior when the flow is positive or negative. Only the unidirectional and bidirectional values are
recognized by the PROFIBUS specification, so other values will be unrecognized by a PROFIBUS
host or configuration tool. However, the transmitter will operate correctly in any of the modes listed in
Table 4-15.
Table 4-15 Totalizer behavior for each measurement mode value
Measurement mode value Bus index Forward flow Reverse flow
Unidirectional (forward only) 0 Increase No change
Reverse only 1 No change Increase
Bidirectional 2 Increase Decrease
Absolute value 3 Increase Increase
Negate/forward only 4 No change Increase
Negate/bidirectional 5 Decrease Increase
Startup ConfigurationCalibrationBefore You Begin Startup ConfigurationCalibrationBefore You Begin Startup ConfigurationCalibrationBefore You Begin Startup ConfigurationCalibrationBefore You Begin
Figure 4-15 Changing the measurement mode parameter
To change the measurement mode parameter, refer to the flowcharts in Figure 4-15.
Configuration and Use Manual 73
Page 82

Configuration
MMI Coriolis Flow >
Transducer Block >
Device Information
Sensor Serial Number
Sensor Material
Liner Material
Flange Type
Block: Transducer Block 2 (Slot 12)
Index 10 (sensor serial number)
Index 13 (sensor material)
Index 14 (liner material)
Index 15 (flange type)
Sensor parameters
Sensor tab
Enter the sensor serial
number in the
Sensor s/n
box
Apply
ProLink >
Configuration
Select the sensor serial
material from the Sensor
Matl list
Select the liner material
from the Liner Matl list
Select the flange from the
Flange list
EDD Bus parameters
ProLink II
4.15 Configuring sensor parameters
The sensor parameters are used to describe the sensor component of your flowmeter. These sensor
parameters are not used in transmitter processing, and are not required:
• Serial number
• Sensor material
• Liner material
•Flange
To configure the sensor parameters, refer to the flowcharts in Figure 4-16.
Figure 4-16 Configuring sensor parameters
74 Model 2700 Transmitter with PROFIBUS-PA
Page 83

Configuration
4.16 Configuring the display
You can restrict the display functionality or change the variables that are shown on the display.
4.16.1 Enabling and disabling display functions
Each display function and its associated parameter are listed in Table 4-16.
Table 4-16 Display functions and parameters
Display
Display function EDD name
Totalizer reset Totalizer Reset TOTALS
Start/stop totalizers Start/Stop Totalizer TOTALS
Auto scroll
Off-line menu Offline Menu DISPLAY
Off-line password
Alarm menu Alarm Menu DISPLAY
Acknowledge all
alarms
Display backlight Backlight DISPLAY
(1)
(2)
Auto Scroll AUTO
Offline Password OFFLINE
ACK All Alarms DISPLAY
code Enabled Disabled
RESET
STOP
SCRLL
OFFLN
PASSW
ALARM
ACK
BKLT
Resetting mass and
volume totalizers is
permitted.
Operator can start and
stop totalizers from the
display.
The display automatically
scrolls through each
process variable.
Operators have access to
the off-line menu.
Password required for
offline menu. See
Section 4.16.4.
Operator has access to
alarm menu.
Operator can
acknowledge all current
alarms at once.
Display backlight is ON. Display backlight is OFF.
Resetting mass and
volume totalizers is not
possible.
Operator cannot start or
stop totalizers from the
display.
Operators must Scroll to
view process variables.
No access to the offline
menu.
Offline menu accessible
without a password.
No access to the alarm
menu.
Alarms must be
acknowledged individually.
Startup ConfigurationCalibrationBefore You Begin Startup ConfigurationCalibrationBefore You Begin Startup ConfigurationCalibrationBefore You Begin Startup ConfigurationCalibrationBefore You Begin
(1) If enabled, you may want to configure Scroll Rate. See Section 4.16.2.
(2) If enabled, the display offline password must also be configured. See Section 4.16.4.
Note the following:
• If you use the display to disable access to the off-line menu, the off-line menu will disappear
as soon as you exit the menu system. If you want to re-enable access, you must use a different
method (e.g., ProLink II).
• If you are using the display to configure the display:
- You must enable Auto Scroll before you can configure Scroll Rate.
- You must enable the off-line password before you can configure the password.
To enable or disable display functions:
• With the EDD, refer to Figure 4-17.
• With bus parameters, refer to Figure 4-18.
• With ProLink II, refer to Figure 4-19.
• With the display, refer to Figure B-13.
Configuration and Use Manual 75
Page 84

Configuration
Block: Transducer Block 1 (Slot 11)
Index 220 (Totalizer reset)
Index 221 (Totalizer start/stop)
Index 222 (Auto scroll enabled/disabled)
Index 223 (Offline menu enabled/disabled)
Index 224 (Offline password enabled/disabled)
Index 225 (Alarm menu enabled/disabled)
Index 226 (Acknowledge all alarms)
Index 227 (Set offline password)
Index 228 (Auto scroll period)
Index 229 (Display backlight)
Index 247 (Update period)
Display options
Display tab
ProLink >
Configuration
Display option checkboxes
• Start/stop totalizers
• Totalizer reset
•Auto scroll
• Offline menu
• Offline password
•Alarm menu
• Ack all alarms
• Backlight on/off
Auto Scroll Rate Display Offline Password Update Period Display Language
Figure 4-17 Configuring the display – EDD menus
Figure 4-18 Configuring the display – bus parameters
Figure 4-19 Configuring the display – ProLink II
76 Model 2700 Transmitter with PROFIBUS-PA
Page 85

Configuration
4.16.2 Changing the scroll rate
The scroll rate is used to control the speed of scrolling when auto scroll is enabled. Scroll rate defines
how long each display variable will be shown on the display. The time period is defined in seconds
(e.g., if scroll rate is set to 10, each display variable will be shown on the display for 10 seconds). The
valid range is from 0 to 10 seconds.
To change the scroll rate:
4.16.3 Changing the update period
The update period (or display rate) parameter controls how often the display is refreshed with current
data. The default is 200 milliseconds. The range is 100 to 10,000 milliseconds. The update period
value applies to all displayed process variables.
To change the update period:
• With the EDD, refer to Figure 4-17.
• With bus parameters, refer to Figure 4-18.
• With ProLink II, refer to Figure 4-19.
• With the display, refer to Figure B-13.
Startup ConfigurationCalibrationBefore You Begin Startup ConfigurationCalibrationBefore You Begin Startup ConfigurationCalibrationBefore You Begin Startup ConfigurationCalibrationBefore You Begin
• With the EDD, refer to Figure 4-17.
• With bus parameters, refer to Figure 4-18.
• With ProLink II, refer to Figure 4-19.
• With the display, refer to Figure B-13.
4.16.4 Changing the off-line password
The off-line password prevents unauthorized users from gaining access to the off-line menu.
To change the off-line password:
• With the EDD, refer to Figure 4-17.
• With bus parameters, refer to Figure 4-18.
• With ProLink II, refer to Figure 4-19.
• With the display, refer to Figure B-13.
4.16.5 Changing the display language
The display can be configured to use any of the following languages for data and menus:
• English
•French
•German
• Spanish
To change the display language:
• With the EDD, refer to Figure 4-17.
• With bus parameters, refer to Figure 4-18.
• With ProLink II, refer to Figure 4-19.
• With the display, refer to Figure B-13.
Configuration and Use Manual 77
Page 86

Configuration
4.16.6 Changing the display variables and precision
The display can scroll through up to 15 process variables in any order. You can select the process
variables you wish to see and the order in which they should appear.
Additionally, you can configure display precision for each display variable. Display precision controls
the number of digits to the right of the decimal place. The range of the display precision is 0 to 5.
Table 4-17 shows an example of a display variable configuration. Notice that you can repeat variables
and you can choose a value of “None.” The actual appearance of each process variable on the display
is described in Appendix B.
Table 4-17 Example of a display variable configuration
Display variable Process variable
Display variable 1 Mass flow
Display variable 2 Volume flow
Display variable 3 Density
Display variable 4 Mass flow
Display variable 5 Volume flow
Display variable 6 Mass totalizer
Display variable 7 Mass flow
Display variable 8 Temperature
Display variable 9 Volume flow
Display variable 10 Volume totalizer
Display variable 11 Density
Display variable 12 Temperature
Display variable 13 None
Display variable 14 None
Display variable 15 None
To change the display variables, refer to the flowcharts in Figure 4-20.
78 Model 2700 Transmitter with PROFIBUS-PA
Page 87

Configuration
EDD
Block: Transducer Block 1 (Slot 11)
Indices 232 through 246
Display variables
Block: Transducer Block 1 (Slot 11)
Index 231 (Number of decimals)
Display precision
Bus parameters
Display tab
Apply
ProLink >
Configuration
For each display variable,
select a process variable
from the list
Enter a precision in the
Number of Decimals box
ProLink II
Figure 4-20 Changing the display variables and precision
Startup ConfigurationCalibrationBefore You Begin Startup ConfigurationCalibrationBefore You Begin Startup ConfigurationCalibrationBefore You Begin Startup ConfigurationCalibrationBefore You Begin
Configuration and Use Manual 79
Page 88

Configuration
4.17 Enabling LD Optimization
LD Optimization is a special compensation is that is specifically for hydrocarbon liquids. LD
Optimization should not be used with any other process fluids. LD Optimization is available only with
certain large sensor sizes. If your sensor can benefit from LD Optimization, the enable/disable option
will appear in ProLink II or on the display.
If you send the transmitter to a calibration facility to perform a water calibration, either during startup or
any time thereafter, LD Optimization must be disabled. When you have completed the calibration,
re-enable LD Optimization.
To enable LD Optimization, see Figures 4-21 and 4-22.
Figure 4-21 LD Optimization – ProLink II
80 Model 2700 Transmitter with PROFIBUS-PA
Page 89

Configuration
OFF-LINE MAINT
Scroll and Select simultaneously
for 4 seconds
Scroll
Select
Select
Scroll
CONFG
Select
Scroll
MTR F
FACTOR LD
Scroll
LD OPT
Select
Figure 4-22 LD Optimization – Display
Startup ConfigurationCalibrationBefore You Begin Startup ConfigurationCalibrationBefore You Begin Startup ConfigurationCalibrationBefore You Begin Startup ConfigurationCalibrationBefore You Begin
Configuration and Use Manual 81
Page 90

82 Model 2700 Transmitter with PROFIBUS-PA
Page 91

Chapter 5
Operation
5.1 Overview
This chapter describes how to use the transmitter in everyday operation. The following topics and
procedures are discussed:
• Using the I&M functions (Section 5.2)
• Recording process variables (Section 5.3)
• Viewing process variables (Section 5.4)
• Using sensor simulation mode (Section 5.5)
• Accessing diagnostic information with a PROFIBUS host (Section 5.6)
• Viewing transmitter status and alarms (Section 5.7)
• Viewing and using the totalizers and inventories (Section 5.8)
Note: All procedures provided in this chapter assume that you have established communication with
the transmitter and that you are complying with all applicable safety requirements. See Appendix C or
the documentation for your PROFIBUS host or configuration tool.
Troubleshooting DisplayDiagramsOperation
5.2 Using the I&M functions
The transmitter implements the following PROFIBUS identification and maintenance (I&M)
functions:
•I&M 0
•I&M 1
•I & M 2
•PA I & M 0
Refer to Amendment 3 to the PROFIBUS Profile for Process Control Devices V 3.01: Identification
and Maintenance Functions Version 1.0, December 2004 Order No. 3.042.
The I&M functions contain a variety of device and manufacturer information, all of which is
hard-coded (read only). The I&M functions are not accessible via ProLink II or the display. If you are
using Siemens Simatic PDM, v6.0 SP2 or higher is required. Earlier versions do not support I&M
functions.
Refer to Appendix F for the bus parameters associated with the I&M functions.
5.3 Recording process variables
Micro Motion suggests that you make a record of the process variables listed below, under normal
operating conditions. This will help you recognize when the process variables are unusually high or
low, and may help in fine-tuning transmitter configuration.
Configuration and Use Manual 83
Page 92

Operation
Record the following process variables:
• Flow rate
• Density
•Temperature
• Tube frequency
• Pickoff voltage
•Drive gain
To view these values, refer to Section 5.4.
5.4 Viewing process variables
Process variables include measurements such as mass flow rate, volume flow rate, temperature, and
density. You can view process variables with the display (if your transmitter has a display),
ProLink II, a PROFIBUS configuration tool (e.g., Simatic PDM) using the EDD, or from a Class 2
PROFIBUS host using bus parameters.
5.4.1 With the display
By default, the display shows the mass flow rate, mass total, volume flow rate, volume total,
temperature, density, and drive gain. If desired, you can configure the display to show other process
variables. See Section 4.16.5.
The LCD panel reports the abbreviated name of the process variable (e.g.,
current value of that process variable, and the associated unit of measure (e.g.,
Appendix B for information on the codes and abbreviations used for display variables.
DENS for density), the
G/CM3). See
To view a process variable with the display:
• If Auto Scroll is enabled, wait until the desired process variable appears on the LCD panel.
• If Auto Scroll is not enabled,
Scroll until the name of the desired process variable either:
- Appears on the process variable line, or
- Begins to alternate with the units of measure
The precision of variables shown on the display is configurable. See Section 4.16.5. The display
precision affects only the value shown on the display, and does not affect the actual process value
stored in the transmitter.
Process variable values are displayed using either standard decimal notation or exponential notation:
• Values < 100,000,000 are displayed in decimal notation (e.g.,
•Values ≥ 100,000,000 are displayed using exponential notation (e.g.,
1234567.8).
1.000E08).
- If the value is less than the precision configured for that process variable, the value is
displayed as
0 (i.e., there is no exponential notation for fractional numbers).
- If the value is too large to be displayed with the configured precision, the displayed
precision is reduced (i.e., the decimal point is shifted to the right) as required so that the
value can be displayed.
84 Model 2700 Transmitter with PROFIBUS-PA
Page 93

Operation
5.4.2 With ProLink II
The Process Variables window opens automatically when you first connect to the transmitter. This
window displays current values for the standard process variables (mass, volume, density,
temperature, external pressure, and external temperature). If you have closed the Process Variables
window, select
ProLink > Process Variables.
To view petroleum measurement process variables (if the petroleum measurement application is
enabled), select
ProLink > API Process Variables.
To view concentration measurement process variables (if the concentration measurement application
is enabled), select
ProLink > CM Process Variables. The concentration measurement process
variables that are displayed depend on the configuration of the concentration measurement
application.
5.4.3 With PROFIBUS EDD
Select
View > Process Variables to view standard process variables. petroleum measurement and
concentration measurement variables are not displayed on this screen.
Select
Device > API to view petroleum measurement variables. Select Device > CM Process
Variables
to view concentration measurement variables.
Troubleshooting DisplayDiagramsOperation
5.4.4 With bus parameters
To view standard process variables, examine index 26 (AI Out) of the appropriate AI function block.
Refer to Section 2.5 for information about how slots correspond to AI function blocks.
5.5 Using sensor simulation mode
Sensor simulation mode causes simulated values to be substituted for actual process data from the
sensor. Sensor simulation mode can be enabled only with ProLink II (Figure 5-1).
Configuration and Use Manual 85
Page 94

Operation
Sensor Simulation tab
Select Enable
Simulation Mode
Apply
ProLink >
Configuration
Select a wave form
for mass flow,
density, and
temperature from the
Wave Form lists
Fixed wave
Triangular or
sine wave
Enter a value in the
Fixed Value box
Enter period in the
Period box
Enter minimum and
maximum amplitude
in the Minimum and
Maximum boxes
Figure 5-1 Sensor simulation mode – ProLink II
5.6 Accessing diagnostic information with a PROFIBUS host
The transmitter sends diagnostic information to a PROFIBUS host in the form of slave diagnostic
response bytes. The number of bytes sent depends on whether the transmitter is configured for
Manufacturer-specific or Profile-specific mode. See Section 2.5 for information about the mode, and
Appendix E for information on interpreting the diagnostic bytes.
5.7 Viewing transmitter status and alarms
You can view transmitter status using the display, ProLink II, EDD, or bus parameters. Depending on
the method chosen, different information is displayed.
5.7.1 With the display
The display reports alarms in two ways:
• With a status LED, which reports only that one or more alarms has occurred
• Through the alarm queue, which reports each specific alarm
Note: If access to the alarm menu from the display has been disabled (see Section 4.16), then the
display will not list alarm codes in an alarm queue and the status LED will not flash. The status LED
will indicate status using solid green, yellow, or red.
86 Model 2700 Transmitter with PROFIBUS-PA
Page 95

Operation
Status LED
The status LED is located at the top of the display (Figure 5-2). The status LED can be in one of six
possible states, as listed in Table 5-1. The procedure for responding to alarms is shown in Figure B-5.
Figure 5-2 Status LED
Troubleshooting DisplayDiagramsOperation
Table 5-1 Status LED states
Status LED state Alarm priority
Green No alarm—normal operating mode
Flashing green
Yellow Acknowledged low severity alarm
Flashing yellow
Red Acknowledged high severity alarm
Flashing red
(1) If the display alarm menu has been disabled, alarms cannot be acknowledged. In this case, the status LED will
never flash to indicate an unacknowledged alarm.
(1)
(1)
(1)
Unacknowledged corrected condition
Unacknowledged low severity alarm
Unacknowledged high severity alarm
5.7.2 With ProLink II
ProLink II provides two ways to view alarm information:
• Choose
ProLink > Status. This window shows the current status of all possible alarms,
independent of configured alarm severity. The alarms are divided into three categories:
Critical, Informational, and Operational. To view the indicators in a category, click on the
associated tab. A tab is red if one or more status indicators in that category is active. On each
tab, currently active alarms are shown by red indicators.
• Choose
ProLink > Alarm Log. This window lists all active alarms, and all inactive but
unacknowledged Fault and Informational alarms. (The transmitter automatically filters out
Ignore alarms.) A green indicator means “inactive but unacknowledged” and a red indicator
means “active.” Alarms are organized into two categories: High Priority and Low Priority.
Configuration and Use Manual 87
Page 96

Operation
Note: The location of alarms in the Status and Alarm Log windows is not affected by the configured
alarm severity (see Section 4.10). Alarms in the Status window are predefined as Critical,
Informational, or Operational. Alarms in the Alarm Log window are predefined as High Priority or
Low Priority.
5.7.3 With EDD
The transmitter sets its PROFIBUS output status to bad or uncertain whenever an alarm condition
occurs. You can view the current alarms by selecting
Critical, Informational, or Operational. All possible alarms are shown, independent of configured
View > Device Status and then selecting
alarm severity. Currently active alarms are shown by a check mark.
5.7.4 With bus parameters
The transmitter sets its PROFIBUS output status to bad or uncertain whenever an alarm condition
occurs. You can view alarms by reading the status words of the block where the alarm originated. The
status words are one or more parameters whose bits indicate alarm conditions:
• Index 23 (Alarm summary) of each AI function block (Slot 1, 2, 3, and 5).
• Indices 139–146 of transducer block 1 (Slot 11).
You must view all of the status words to get a comprehensive list of current alarms.
5.8 Using the totalizers and inventories
The totalizers keep track of the total amount of mass or volume measured by the transmitter over a
period of time. The totalizers can be started and stopped, and the totals can be viewed and reset.
The inventories track the same values as the totalizers. Whenever totalizers are started or stopped, all
inventories (including the petroleum measurement volume inventory and concentration measurement
inventories) are started or stopped automatically. However, when totalizers are reset, inventories are
not reset automatically—you must reset inventories separately. This allows you to use the inventories
to keep running totals across multiple totalizer resets.
You can view all totalizer and inventory values using any of the communication tools: the display,
ProLink II, the EDD, or bus parameters. Specific starting, stopping, and resetting functionality
depends on the tool you are using.
5.8.1 Viewing current values for totalizers and inventories
You can view current totals for the totalizers and inventories with the display (if your transmitter has a
display), ProLink II, PROFIBUS EDD, or PROFIBUS bus parameters.
With the display
You cannot view current totals with the display unless the display has been configured to show them.
See Section 4.16.1.
To view a totalizer or inventory value,
lower left and the desired units in the lower right. Refer to Table 5-2 and Figure 5-3.
Scroll until the LCD panel shows the word TOTAL in the
88 Model 2700 Transmitter with PROFIBUS-PA
Page 97

Operation
Current value
Units of
measure
TOTAL
Scroll optical
switch
Table 5-2 Totalizer and inventory display unit names
Totalizer/inventory Unit name on display
Mass total Mass unit
Mass inventory Mass unit alternating with MASSI
Volume total (liquid) Volume unit
Volume inventory (liquid) Volume unit alternating with
Gas standard volume total Volume unit
Gas standard volume inventory Volume unit alternating with
Petroleum measurement corrected volume
total
Petroleum measurement corrected volume
inventory
ED net mass total Mass unit alternating with
ED net volume total Mass unit alternating with NETMI
ED net volume inventory Mass unit alternating with
ED standard volume total Mass unit alternating with STD V
ED standard volume inventory Mass unit alternating with STDVI
Volume unit alternating with TCORR
Volume unit alternating with
LVO L I
GSV I
TCORI
NET M
NET V
Troubleshooting DisplayDiagramsOperation
Figure 5-3 Totalizer and inventory values on display
With ProLink II
To view the current value of the totalizers and inventories with ProLink II, select
or
ProLink > API Totalizer, or ProLink > CM Totalizer.
ProLink > Totalizer
Configuration and Use Manual 89
Page 98

Operation
RESET
(3)
Select
Scroll STOP/START
(4)
RESET YES?
Process variable display
STOP/START YES?
Scroll
Mass total display
(1)
Volume total display
(1)
Scroll
Yes No
Select Scroll
EXIT
Select
Yes No
Select Scroll
Scroll
API total
(1)(2)
ED total
(1)(2)
Select
(1) Displayed only if configured as a display variable (see Section 4.16.6).
(2) The petroleum measurement application or concentration measurement application must be enabled.
(3) The display must be configured to allow totalizer resetting (see Section 4.16).
(4) The display must be configured to allow stopping and starting (see Section 4.16).
With EDD
To view the current value of the totalizers and inventories:
• For standard mass, liquid standard volume, and gas standard volume, select
Variables > Totalizer
gas standard volume, then
and then select Mass or Volu me. (If the transmitter is configured to use
Volu me will be replaced by Gas Standard Volume.) Totals and
inventories are displayed together.
View > Process
• For petroleum measurement, select
• For concentration measurement, select
Device > Device > API Totalizer.
Device > Device > CM Totalizer.
With bus parameters
To view the current value of the totalizers and inventories, examine index 26 (TOT Total) of each
totalizer function block (Slots 4, 6, 7, and 8).
5.8.2 Controlling the totalizers and inventories
Specific starting, stopping, and resetting functionality depends on the tool you are using.
With the display
If the required value is shown on the display, you can use the display to start and stop all totalizers
and inventories simultaneously, or to reset individual totalizers. See the flowchart in Figure 5-4. You
cannot reset any inventories with the display.
Figure 5-4 Controlling totalizers and inventories with the display
90 Model 2700 Transmitter with PROFIBUS-PA
Page 99

Operation
With Prolink II
To control concentration measurement totalizers and inventories, choose
Control
. To control all other totalizer and inventory functions, choose ProLink > Totalizer Control.
ProLink > CM Totalizer
To reset inventories using ProLink II, you must first enable this capability. To enable inventory reset
using ProLink II:
1. Choose
2. Select the
View > Preferences.
Enable Inventory Totals Reset checkbox.
3. Click
Apply.
With PROFIBUS EDD
To start and stop totals and inventories, to reset all totals and inventories simultaneously, or to reset
individual mass or volume totals and inventories, select
To reset petroleum measurement totals and inventories alone, select
To reset concentration measurement totals and inventories alone, select
Tota liz er
.
Device > Device > Totalizer.
Device > Device > API Totalizer.
Device > Device > CM
With PROFIBUS bus parameters
If the totalizer blocks are configured to report the status of one of the internal totalizers (i.e., not
Standard mode) (see Section 2.6), you can reset that total or inventory by setting index 29 of the
appropriate totalizer function block to 1.
You can also control the internal totalizers directly with the transducer block parameters shown in
Table 5-3. Except where specified, enabling each function means setting its value to 0x0001.
Table 5-3 Stopping, starting, and resetting totalizers and inventories
Use this transducer block parameter:
To accomplish this:
Stop all totalizers and inventories 11 49 (value = 0x0000)
Start all totalizers and inventories 11 49 (value = 0x0001)
Reset all totals 11 50
Reset all inventories 11 51
Reset mass total 11 52
Reset mass inventory 11 60
Reset liquid volume total 11 53
Reset liquid volume inventory 11 61
Reset gas standard volume total 11 70
Reset gas standard volume inventory 11 71
Reset petroleum measurement volume totalizer 12 36
Reset petroleum measurement volume inventory 12 37
Reset ED standard volume total 12 60
Reset ED standard volume inventory 12 63
Reset ED net mass total 12 61
Reset ED net mass inventory 12 64
Reset ED net volume total 12 62
Reset ED net volume inventory 12 65
Slot Index
Troubleshooting DisplayDiagramsOperation
Configuration and Use Manual 91
Page 100

92 Model 2700 Transmitter with PROFIBUS-PA
 Loading...