

Page 1

Instruction Manual
P/N MMI-20011276, Rev. A
March 2008
Micro Motion
®
Series 3000 MVD Transmitters
Net Oil Computer Supplement
Page 2

©2008, Micro Motion, Inc. All rights reserved. ELITE and ProLink are registered trademarks, and MVD and MVD Direct Connect
are trademarks of Micro Motion, Inc., Boulder, Colorado. Micro Motion is a registered trade name of Micro Motion, Inc., Boulder,
Colorado. The Micro Motion and Emerson logos are trademarks and service marks of Emerson Electric Co. All other trademarks
are property of their respective owners.
Page 3

Contents
Chapter 1 Before You Begin . . . . . . . . . . . . . . . . . . . . . . . . . . . . . . . . . . . . . 1
1.1 About this manual . . . . . . . . . . . . . . . . . . . . . . . . . . . . . . . . . . . . . . . . . . . . . . . . . . . . 1
1.2 Communication tools. . . . . . . . . . . . . . . . . . . . . . . . . . . . . . . . . . . . . . . . . . . . . . . . . . 1
1.3 Manuals and manual use . . . . . . . . . . . . . . . . . . . . . . . . . . . . . . . . . . . . . . . . . . . . . . 1
1.4 Micro Motion customer service . . . . . . . . . . . . . . . . . . . . . . . . . . . . . . . . . . . . . . . . . . 2
Chapter 2 NOC Overview . . . . . . . . . . . . . . . . . . . . . . . . . . . . . . . . . . . . . . . 3
2.1 Overview . . . . . . . . . . . . . . . . . . . . . . . . . . . . . . . . . . . . . . . . . . . . . . . . . . . . . . . . . . . 3
2.2 Introduction to the NOC system . . . . . . . . . . . . . . . . . . . . . . . . . . . . . . . . . . . . . . . . . 3
2.2.1 NOC system components . . . . . . . . . . . . . . . . . . . . . . . . . . . . . . . . . . . . . 4
2.2.2 Installation architecture . . . . . . . . . . . . . . . . . . . . . . . . . . . . . . . . . . . . . . . 4
2.2.3 Operation modes . . . . . . . . . . . . . . . . . . . . . . . . . . . . . . . . . . . . . . . . . . . . 8
2.2.4 Required well data . . . . . . . . . . . . . . . . . . . . . . . . . . . . . . . . . . . . . . . . . . . 9
2.2.5 Water cut determination. . . . . . . . . . . . . . . . . . . . . . . . . . . . . . . . . . . . . . . 9
2.3 NOC application features and options. . . . . . . . . . . . . . . . . . . . . . . . . . . . . . . . . . . . 10
2.3.1 Temperature correction . . . . . . . . . . . . . . . . . . . . . . . . . . . . . . . . . . . . . . 10
2.3.2 Pressure compensation . . . . . . . . . . . . . . . . . . . . . . . . . . . . . . . . . . . . . . 10
2.3.3 Shrinkage factors . . . . . . . . . . . . . . . . . . . . . . . . . . . . . . . . . . . . . . . . . . . 11
2.3.4 Gas carry-under – Transient Bubble Remediation (TBR) . . . . . . . . . . . . 11
2.3.5 Gas measurement . . . . . . . . . . . . . . . . . . . . . . . . . . . . . . . . . . . . . . . . . . 13
2.3.6 Gas measurement with liquid carry-over – Transient Mist
Remediation. . . . . . . . . . . . . . . . . . . . . . . . . . . . . . . . . . . . . . . . . . . . . . . 13
2.3.7 Recalculation . . . . . . . . . . . . . . . . . . . . . . . . . . . . . . . . . . . . . . . . . . . . . . 14
2.4 Planning the configuration. . . . . . . . . . . . . . . . . . . . . . . . . . . . . . . . . . . . . . . . . . . . . 15
2.5 NOC measurement terminology . . . . . . . . . . . . . . . . . . . . . . . . . . . . . . . . . . . . . . . . 16
Chapter 3 Using the Display and Menu System . . . . . . . . . . . . . . . . . . . . . . . 17
3.1 About this chapter . . . . . . . . . . . . . . . . . . . . . . . . . . . . . . . . . . . . . . . . . . . . . . . . . . . 17
3.2 Startup and Well Performance Measurement screen . . . . . . . . . . . . . . . . . . . . . . . . 17
3.3 Menu systems . . . . . . . . . . . . . . . . . . . . . . . . . . . . . . . . . . . . . . . . . . . . . . . . . . . . . . 18
3.3.1 Accessing management functions . . . . . . . . . . . . . . . . . . . . . . . . . . . . . . 19
3.3.2 Shortcuts . . . . . . . . . . . . . . . . . . . . . . . . . . . . . . . . . . . . . . . . . . . . . . . . . 19
3.4 Using the function buttons. . . . . . . . . . . . . . . . . . . . . . . . . . . . . . . . . . . . . . . . . . . . . 19
3.5 Using the cursor control buttons . . . . . . . . . . . . . . . . . . . . . . . . . . . . . . . . . . . . . . . . 21
3.5.1 Selecting from a list . . . . . . . . . . . . . . . . . . . . . . . . . . . . . . . . . . . . . . . . . 21
3.5.2 Changing a variable value . . . . . . . . . . . . . . . . . . . . . . . . . . . . . . . . . . . . 21
3.5.3 Cursor control example . . . . . . . . . . . . . . . . . . . . . . . . . . . . . . . . . . . . . . 21
3.6 Scientific notation . . . . . . . . . . . . . . . . . . . . . . . . . . . . . . . . . . . . . . . . . . . . . . . . . . . 21
Net Oil Computer Supplement i
Page 4

Contents
Chapter 4 Configuring the NOC Application . . . . . . . . . . . . . . . . . . . . . . . . . 23
4.1 About this chapter . . . . . . . . . . . . . . . . . . . . . . . . . . . . . . . . . . . . . . . . . . . . . . . . . . . 23
4.2 Well Performance Measurement menu. . . . . . . . . . . . . . . . . . . . . . . . . . . . . . . . . . . 23
4.3 Basic configuration procedure . . . . . . . . . . . . . . . . . . . . . . . . . . . . . . . . . . . . . . . . . 24
4.4 Setting up a water cut monitor . . . . . . . . . . . . . . . . . . . . . . . . . . . . . . . . . . . . . . . . . 29
4.5 Setting up pressure compensation . . . . . . . . . . . . . . . . . . . . . . . . . . . . . . . . . . . . . . 29
4.5.1 Obtaining the external pressure value . . . . . . . . . . . . . . . . . . . . . . . . . . . 29
4.5.2 Setting up pressure compensation for oil density and water density . . . . 30
4.5.3 Setting up pressure compensation for pressure effect . . . . . . . . . . . . . . 30
4.6 Setting up Transient Bubble Remediation . . . . . . . . . . . . . . . . . . . . . . . . . . . . . . . . . 30
4.7 Setting up gas measurement . . . . . . . . . . . . . . . . . . . . . . . . . . . . . . . . . . . . . . . . . . 30
4.8 Setting up Transient Mist Remediation . . . . . . . . . . . . . . . . . . . . . . . . . . . . . . . . . . . 31
4.9 Performing density determination procedures . . . . . . . . . . . . . . . . . . . . . . . . . . . . . 31
4.9.1 Performing a density determination for water . . . . . . . . . . . . . . . . . . . . . 32
4.9.2 Performing a density determination for oil . . . . . . . . . . . . . . . . . . . . . . . . 36
Chapter 5 Operation Mode – NOC . . . . . . . . . . . . . . . . . . . . . . . . . . . . . . . . 41
5.1 About this chapter . . . . . . . . . . . . . . . . . . . . . . . . . . . . . . . . . . . . . . . . . . . . . . . . . . . 41
5.2 Well testing overview . . . . . . . . . . . . . . . . . . . . . . . . . . . . . . . . . . . . . . . . . . . . . . . . 41
5.2.1 Running a well test . . . . . . . . . . . . . . . . . . . . . . . . . . . . . . . . . . . . . . . . . 44
5.2.2 Viewing well test data . . . . . . . . . . . . . . . . . . . . . . . . . . . . . . . . . . . . . . . 45
5.2.3 Time periods for average, minimum, maximum, and total values . . . . . . 47
5.2.4 Other activity during a well test . . . . . . . . . . . . . . . . . . . . . . . . . . . . . . . . 47
5.2.5 Recalculating well test data . . . . . . . . . . . . . . . . . . . . . . . . . . . . . . . . . . . 48
5.3 Continuous mode measurement overview . . . . . . . . . . . . . . . . . . . . . . . . . . . . . . . . 49
5.3.1 Viewing Continuous mode measurement data . . . . . . . . . . . . . . . . . . . . 51
5.3.2 Pausing and resuming Continuous mode measurement. . . . . . . . . . . . . 52
5.3.3 Resetting, saving, and managing Continuous mode time periods. . . . . . 53
5.3.4 Other activity during Continuous mode measurement . . . . . . . . . . . . . . 54
5.3.5 Viewing archive records. . . . . . . . . . . . . . . . . . . . . . . . . . . . . . . . . . . . . . 54
5.3.6 Recalculating Continuous mode data . . . . . . . . . . . . . . . . . . . . . . . . . . . 56
5.4 Changing modes. . . . . . . . . . . . . . . . . . . . . . . . . . . . . . . . . . . . . . . . . . . . . . . . . . . . 57
Chapter 6 Diagnostics and Troubleshooting . . . . . . . . . . . . . . . . . . . . . . . . . 59
6.1 About this chapter . . . . . . . . . . . . . . . . . . . . . . . . . . . . . . . . . . . . . . . . . . . . . . . . . . . 59
6.2 NOC status alarms . . . . . . . . . . . . . . . . . . . . . . . . . . . . . . . . . . . . . . . . . . . . . . . . . . 59
Appendix A Series 3000 Menu Flowcharts . . . . . . . . . . . . . . . . . . . . . . . . . . . 61
A.1 Overview . . . . . . . . . . . . . . . . . . . . . . . . . . . . . . . . . . . . . . . . . . . . . . . . . . . . . . . . . . 61
A.2 Startup display and menu access . . . . . . . . . . . . . . . . . . . . . . . . . . . . . . . . . . . . . . . 61
A.3 View menu . . . . . . . . . . . . . . . . . . . . . . . . . . . . . . . . . . . . . . . . . . . . . . . . . . . . . . . . 62
A.4 Management menus . . . . . . . . . . . . . . . . . . . . . . . . . . . . . . . . . . . . . . . . . . . . . . . . . 63
Index . . . . . . . . . . . . . . . . . . . . . . . . . . . . . . . . . . . . . . . . . . . . . . . . . . . . . 69
ii Micro Motion® Series 3000 MVD Transmitters
Page 5

Chapter 1
Before You Begin
1.1 About this manual
This manual explains how to configure and use the Net Oil Computer application on the
Micro Motion
This manual does not provide information on basic installation, configuration, and use of the
Model 3500 or Model 3700 transmitter. For basic platform information and instructions, see the
manual entitled Micro Motion
Use Manual.
1.2 Communication tools
You can communicate with a Series 3000 device using any of the following communication tools:
• The local display
®
Series 3000 MVD platform (a Model 3500 or Model 3700 MVD transmitter).
®
Series 3000 MVD Transmitters and Controllers: Configuration and
NOC Overview NOC ConfigurationUsing the DisplayBefore You Begin
• ProLink II v2.5 and higher (ProLink II v2.7 recommended)
• 375 Field Communicator with the appropriate DD:
To configure or use the NOC application, you must use either the local display or ProLink II v2.7.
This manual focuses on the use of the local display. Detailed menu flowcharts for the local display are
provided throughout this manual and in Appendix A.
For general information on installing ProLink II and connecting to the Series 3000 platform, see the
manual entitled Micro Motion
Use Manual.
1.3 Manuals and manual use
Table 1-1 lists the basic steps required to install, set up, configure, and use the Series 3000 device with
the NOC application. Table 1-1 also identifies the manual in which the associated information is
provided. Note that for some tasks you will need to use both manuals.
Micro Motion 3000 Mass flo v7 DD v2
®
Series 3000 MVD Transmitters and Controllers: Configuration and
Net Oil Computer Supplement 1
Page 6

Before You Begin
Table 1-1 Tasks and manual location
Manual
Series 3000 MVD Transmitters:
Step
1 Install the Series 3000 device ✓
2 Wire the Series 3000 device to the
sensor
3Wire I/O ✓
4 Set up digital communications ✓
5 Start up the system ✓
6 Learn to use the display and menu
system
7 Configure security and language ✓
8 Configure system data ✓
9 Configure inputs ✓
10 Configure digital communications ✓
11 Configure the NOC application ✓
12 Configure outputs ✓✓
13 Configure NOC status alarm severity ✓✓
14 Perform optional configuration ✓
15 Operate the NOC application ✓
16 Perform calibrations and meter
verification
17 Troubleshoot ✓✓
Net Oil Computer Supplement
(this manual)
✓
Series 3000 MVD Transmitters and
Controllers:
Configuration and Use Manual
✓
✓
1.4 Micro Motion customer service
For customer service, phone the support center nearest you:
• In the U.S.A., phone
800-522-MASS (800-522-6277) (toll-free)
• In Canada and Latin America, phone +1 303-527-5200
•In Asia:
- In Japan, phone 3 5769-6803
- In other locations, phone +65 6777-8211 (Singapore)
•In Europe:
- In the U.K., phone 0870 240 1978 (toll-free)
- In other locations, phone +31 (0) 318 495 555 (The Netherlands)
Customers outside the U.S.A. can also email Micro Motion customer service at
International.MMISupport@EmersonProcess.com.
2 Micro Motion® Series 3000 MVD Transmitters
Page 7

Chapter 2
NOC Overview
2.1 Overview
This chapter discusses various topics that should be reviewed and considered before beginning
configuration of the Series 3000 platform with the NOC application. Topics include:
• Introduction to the NOC system – see Section 2.2
- NOC system components – see Section 2.2.1
- Installation architecture – see Section 2.2.2
- Operation modes – see Section 2.2.3
- Water cut determination and required well data – see Section 2.2.5
• NOC application features and options – see Section 2.3
- Temperature correction – see Section 2.3.1
- Pressure compensation – see Section 2.3.2
NOC Overview NOC ConfigurationUsing the DisplayBefore You Begin
- Shrinkage factors – see Section 2.3.3
- Transient Bubble Remediation – see Section 2.3.4
- Gas measurement – see Section 2.3.5
- Transient Mist Remediation – see Section 2.3.6
- Recalculation – see Section 2.3.7
This chapter also includes:
• A list of questions that should be answered before beginning configuration – see Section 2.4.
• A list of NOC measurement terms and definitions – see Section 2.5.
2.2 Introduction to the NOC system
“NOC” is an abbreviation of “Net Oil Computer.” In the present context, NOC is a software option
that can be purchased for three members of the Series 3000 family: the Model 3500 panel-mount
transmitter, the Model 3500 rack-mount transmitter, and the Model 3700 field-mount transmitter.
When paired with a Micro Motion sensor installed on the oil/water leg of a two-phase separator or the
oil leg of a three-phase separator, the NOC application can provide real-time measurements of water
cut. Alternatively, the NOC application can receive water cut data from an external water cut monitor
(see Section 2.2.5 for information on water cut options). When the water cut value is known, net oil
volume flow and net water volume flow can be calculated.
If desired, real-time gas measurement may be implemented by installing a meter on the gas leg. The
Series 3000 platform then receives gas flow data via its frequency input.
Net Oil Computer Supplement 3
Page 8

NOC Overview
2.2.1 NOC system components
The Series 3000 MVD NOC system requires:
Optional components include:
2.2.2 Installation architecture
The Series 3000 MVD NOC system is designed for installation with a three-phase separator, a
two-phase separator, or a variety of compact separators. See Figures 2-1 through 2-3.
• One Series 3000 MVD transmitter with the Net Oil Computer software option
• One Micro Motion sensor installed on the oil/water or oil leg
• A meter on the gas leg. This meter can be used for gas measurement with or without Transient
Mist Remediation:
- If only gas measurement will be implemented, either a third-party meter or a
Micro Motion meter may be used. Gas measurement must be based on mass flow.
- If Transient Mist Remediation will be implemented, a Micro Motion meter must be used.
• A water cut monitor on the oil/water or oil leg.
• A pressure sensor on the oil/water or oil leg. Data from the pressure sensor enables pressure
compensation (see Section 2.3.2).
Note: These figures do not illustrate all possible combinations.
4 Micro Motion® Series 3000 MVD Transmitters
Page 9
NOC Overview
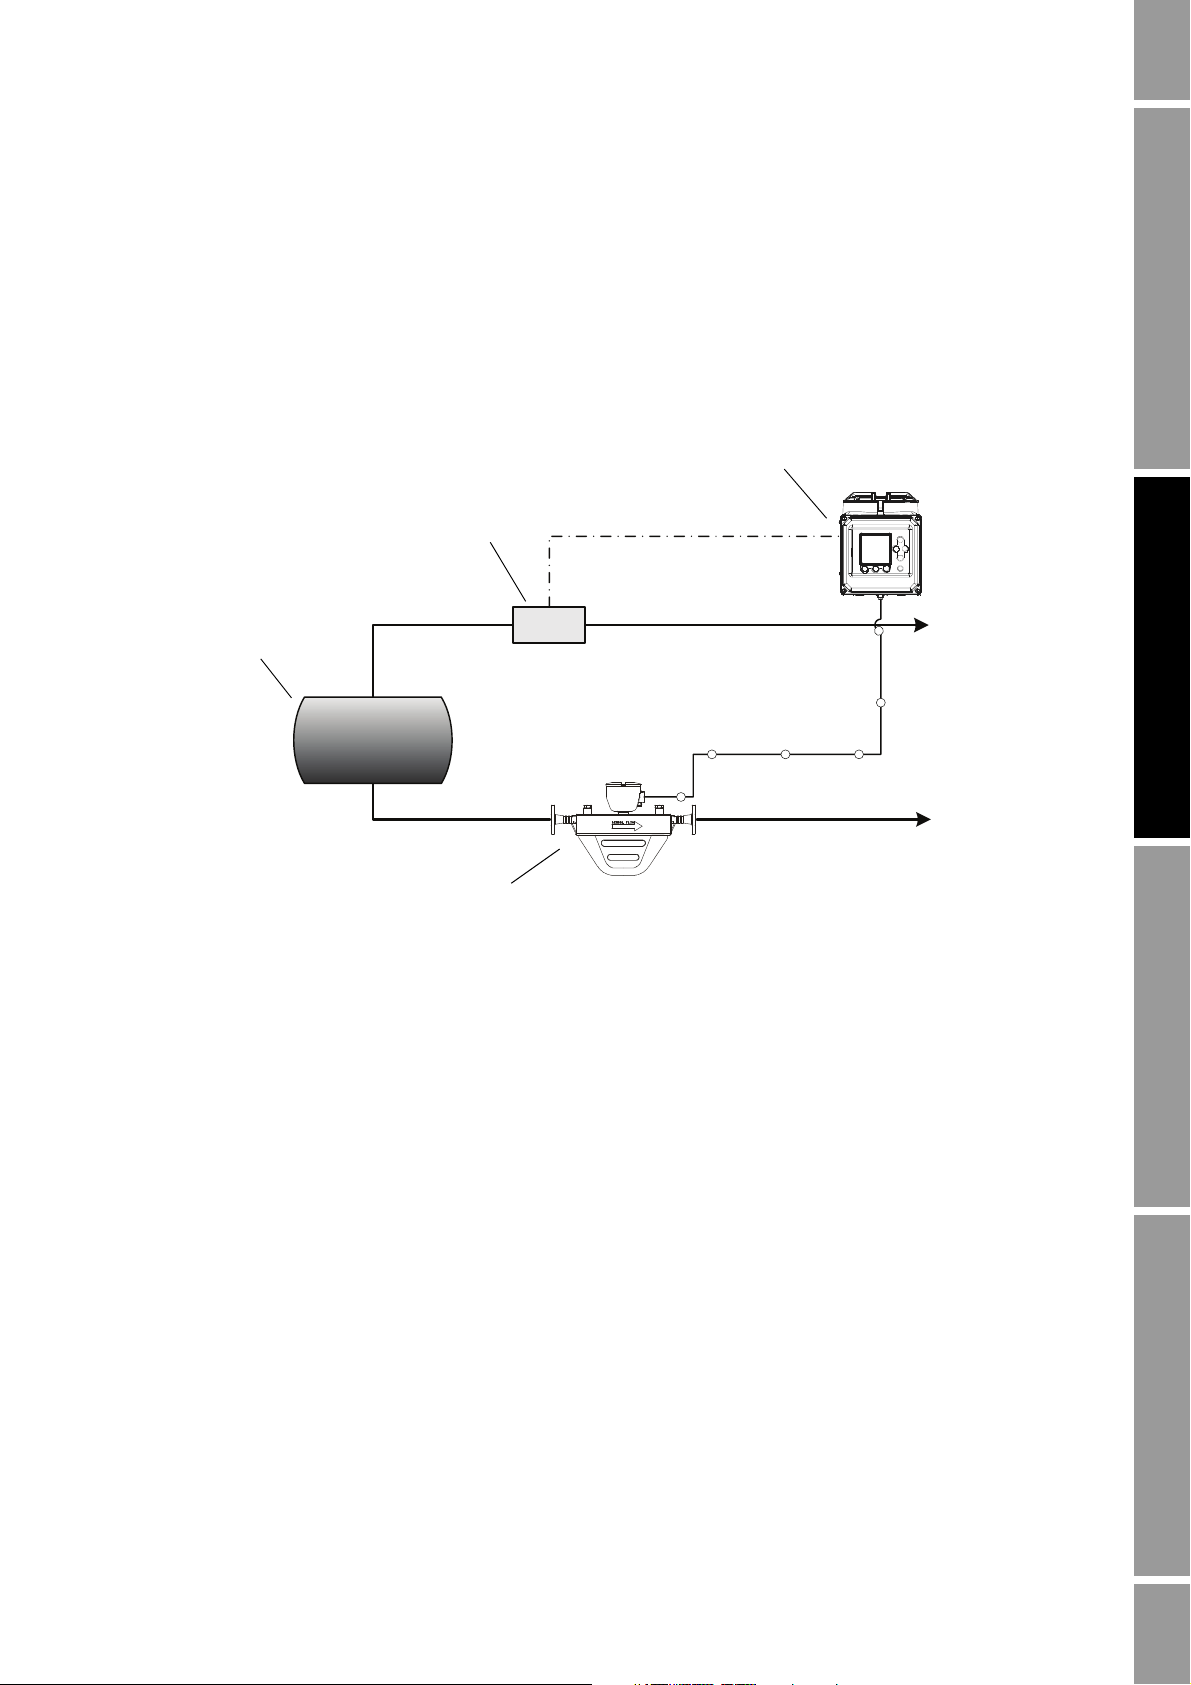
F
Separator
Series 3000 platform
Flowmeter (gas)
Micro Motion sensor
Oil/water leg
Gas leg
Gas flow rate (Frequency input)
In Figure 2-1:
Figure 2-1 NOC system with two-phase separator
• The NOC system is implemented with a two-phase separator.
• An optional gas meter is installed, and gas data is sent to the Series 3000 device via the
frequency input.
• Density-based water cut data is used.
• Because there is no pressure sensor, pressure compensation is not applied.
NOC Overview NOC ConfigurationUsing the DisplayBefore You Begin
Net Oil Computer Supplement 5
Page 10
NOC Overview
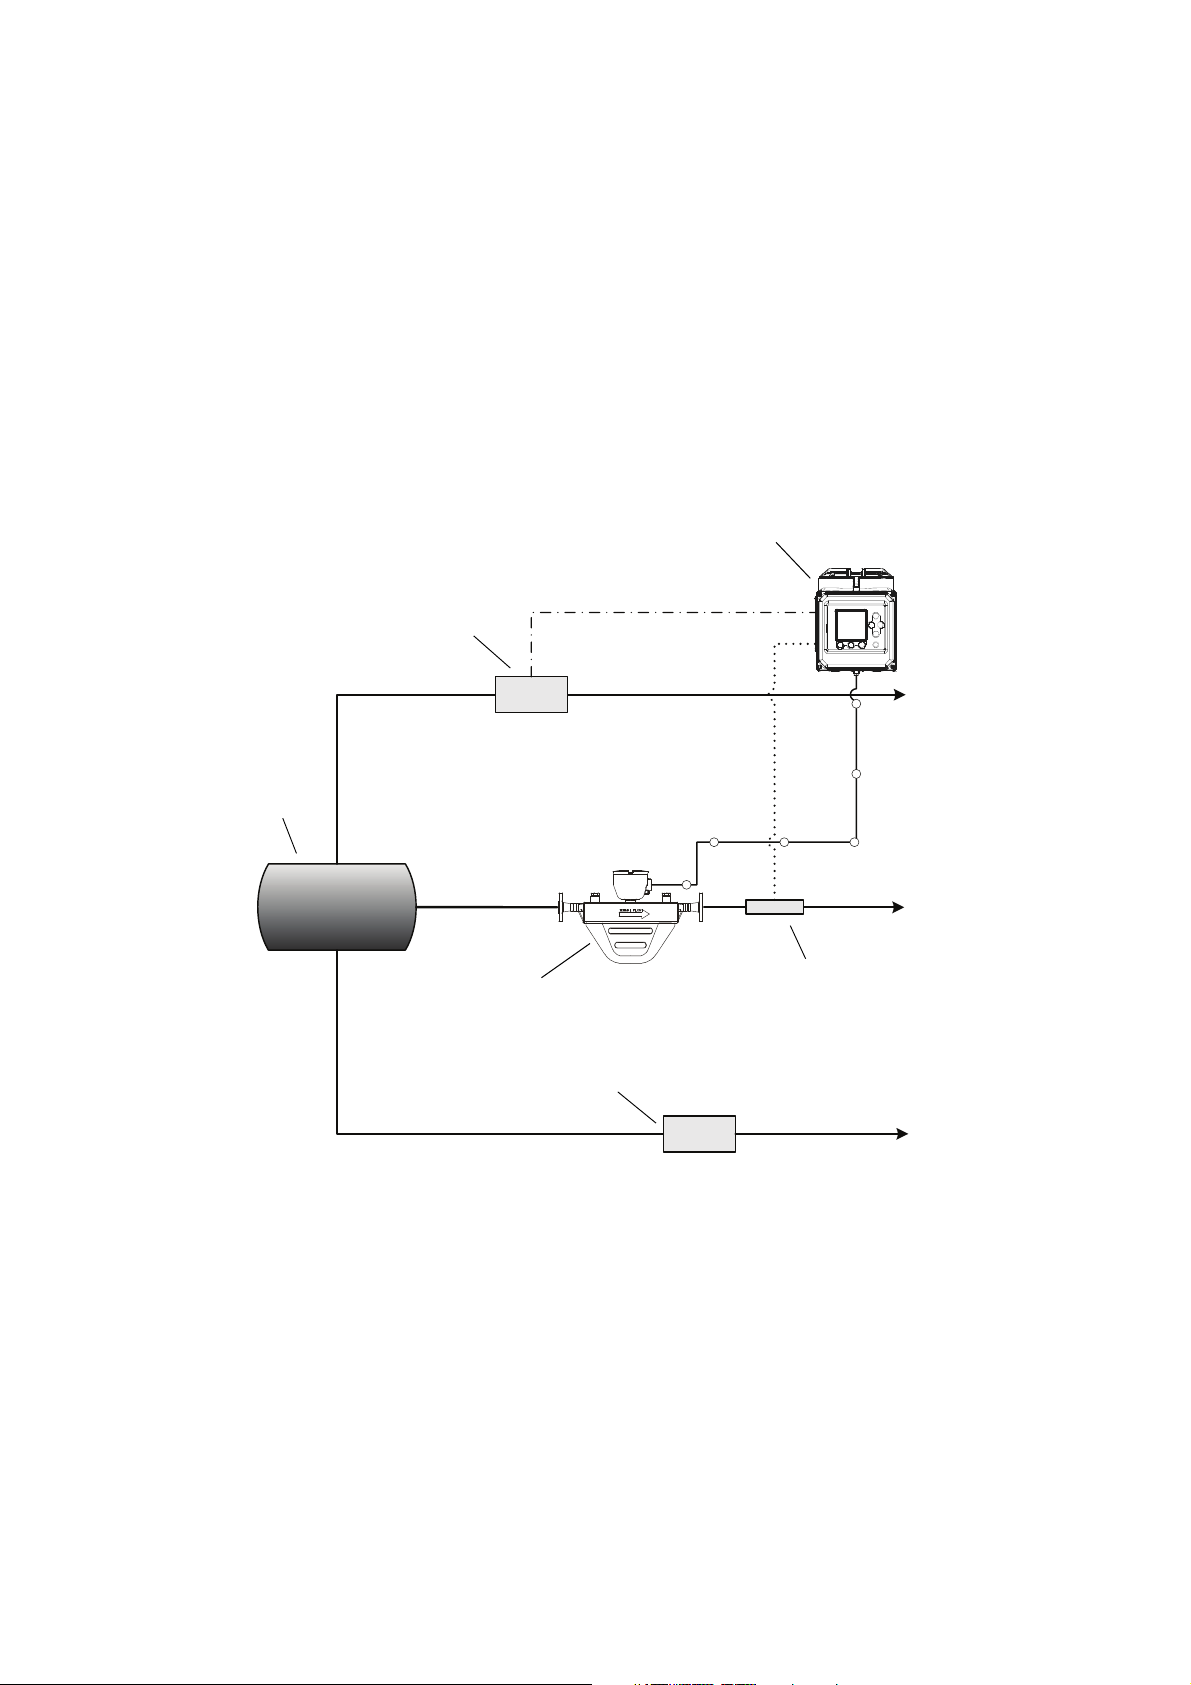
F
F
Series 3000 platform
Separator
Micro Motion sensor
Oil leg
Gas leg
Water leg
Gas flow rate (Frequency input)
Flowmeter (water)
Water cut monitor
Flowmeter (gas)
Water cut data
(HART)
In Figure 2-2:
Figure 2-2 NOC system with three-phase separator
• The NOC system is implemented with a three-phase separator.
• An optional gas meter is installed, and gas flow rate data is sent to the Series 3000 device via
the frequency input.
• A meter is installed on the water leg, but the Series 3000 device does not monitor or record
flow data from this source.
• A water cut monitor is installed on the oil leg. The NOC system can be configured to use either
density-based water cut data or data from the water cut monitor.
• Because there is no pressure sensor, pressure compensation is not applied.
6 Micro Motion® Series 3000 MVD Transmitters
Page 11
NOC Overview
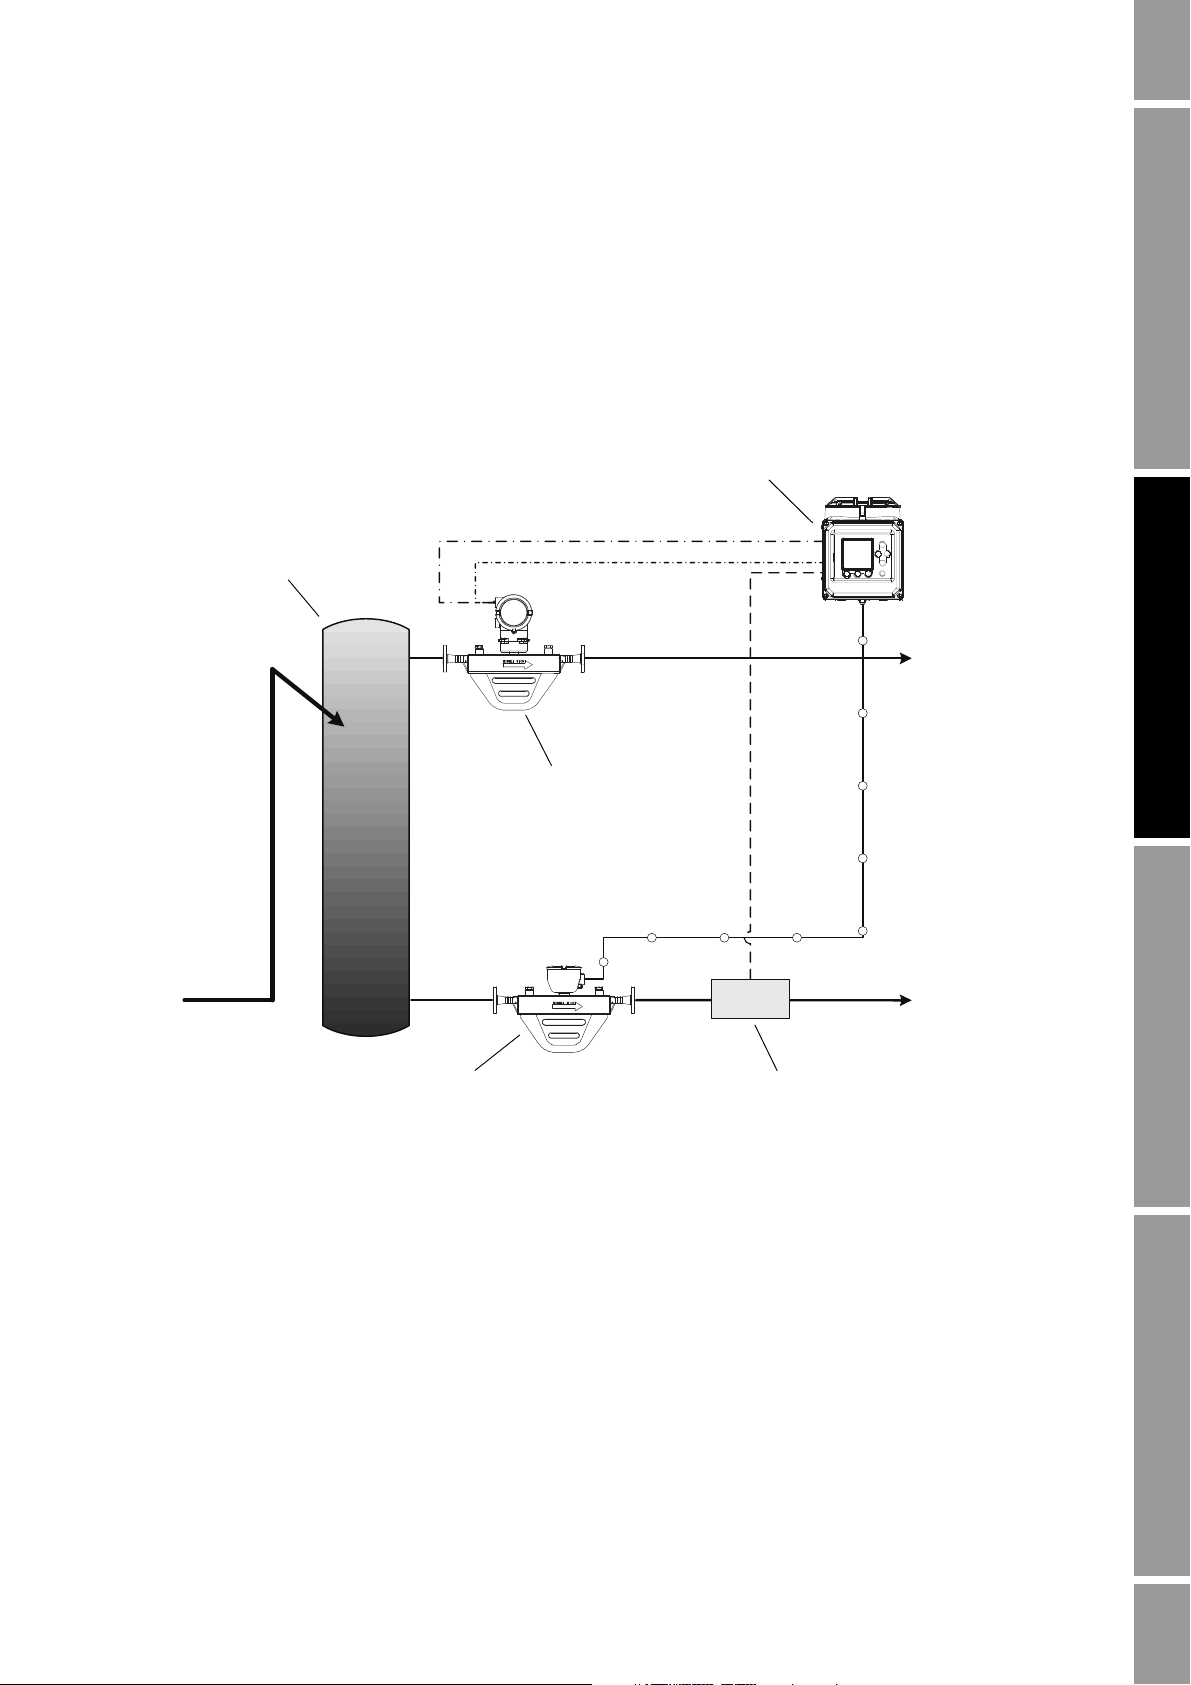
P
GLCC
Micro Motion sensor
Gas leg
Oil/water leg
Micro Motion
TMR gas meter
Pressure sensor
Series 3000 platform
Pressure data
(HART)
Gas flow rate data (Frequency input)
TMR drive gain data (HART)
In Figure 2-3:
Figure 2-3 NOC system with GLCC
• The NOC system is implemented with a Gas-Liquid Cylindrical Cyclone™ (GLCC).
• A gas meter is installed on the gas leg. In this example, a Micro Motion meter is used, and it
provides gas flow rate data for gas measurement, and drive gain data for Transient Mist
Remediation via a HART connection.
• Density-based water cut data is used.
• A pressure sensor is installed on the oil/water leg. This enables pressure compensation.
NOC Overview NOC ConfigurationUsing the DisplayBefore You Begin
Net Oil Computer Supplement 7
Page 12
NOC Overview
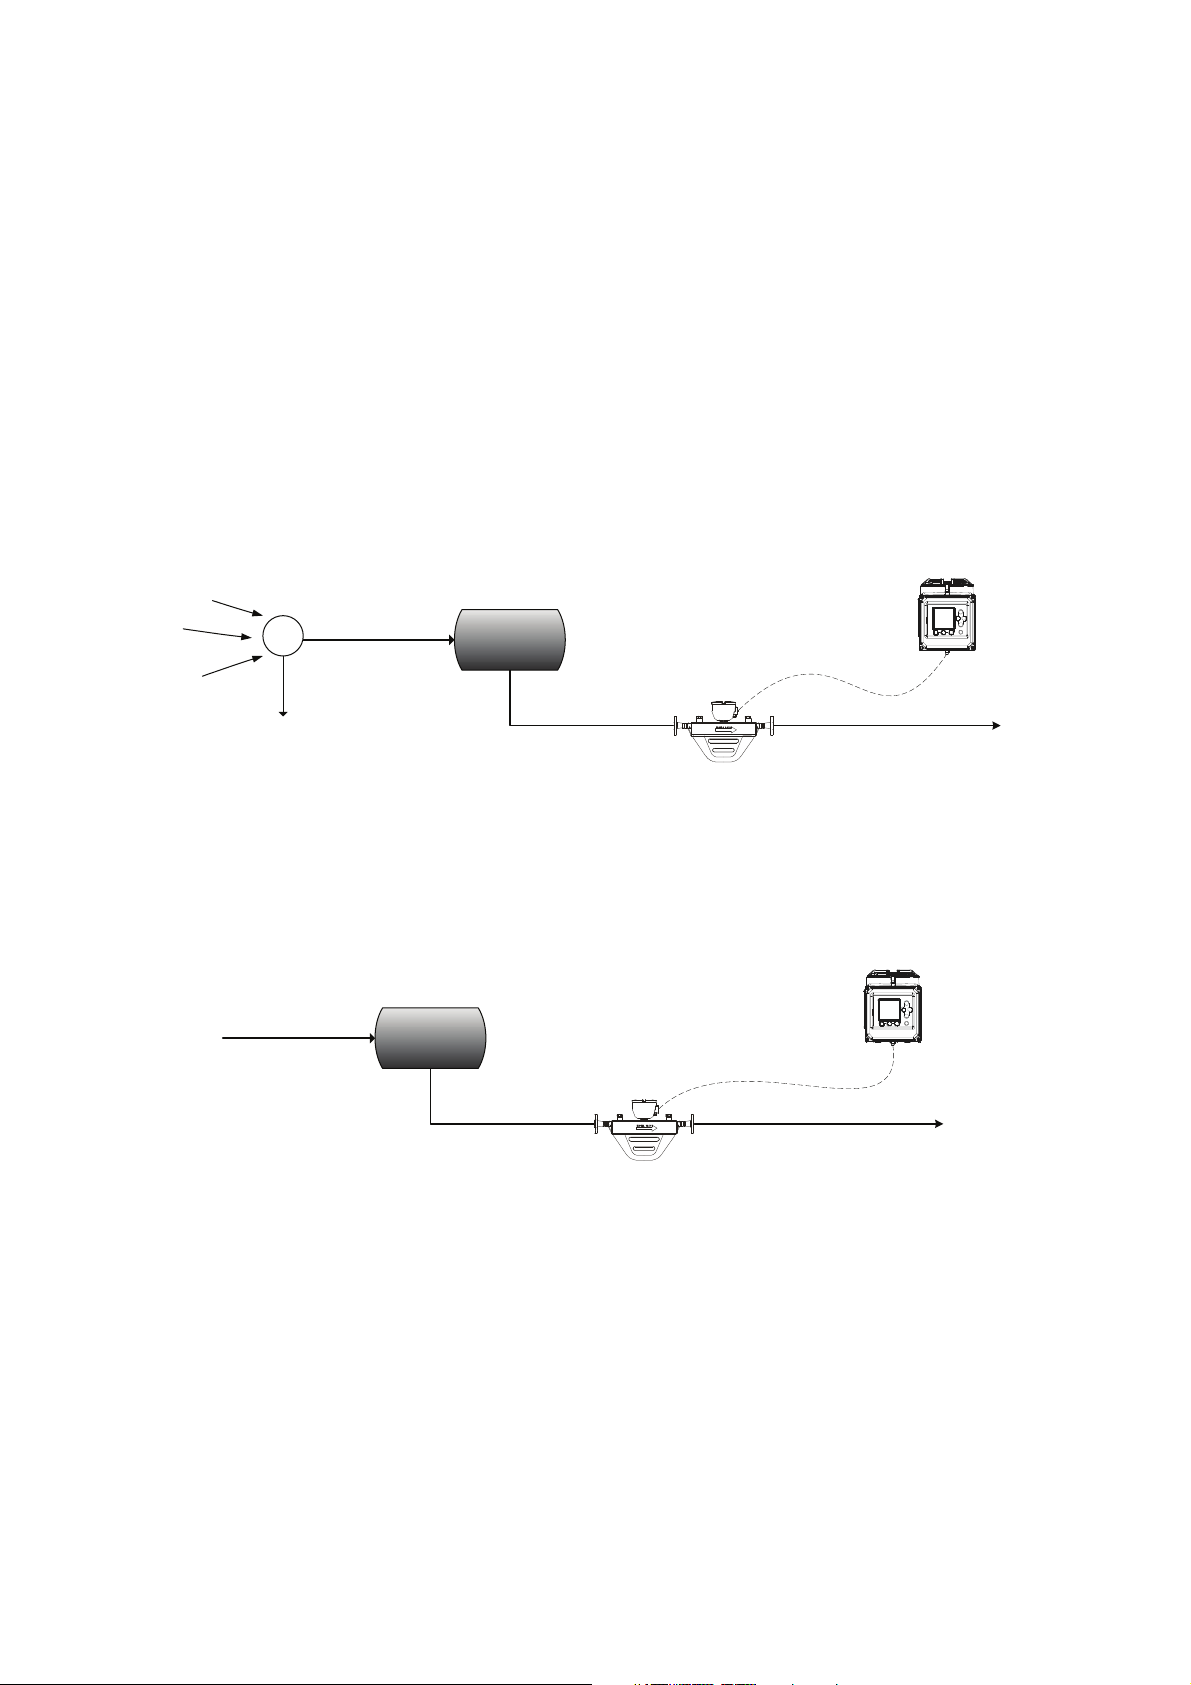
From production wells
One well to
test separator
Other wells to
production separator
Micro Motion sensor
Series 3000 platform
To production separatorLiquid leg
Micro Motion sensor
Series 3000 platform
To production separatorLiquid leg
From single well
2.2.3 Operation modes
The NOC system operates in either Well Test mode or Continuous mode:
• In Well Test mode, well tests can be performed on up to 48 wells. A manifold system is used to
ensure that output from a single well is routed through the test separator and the NOC system.
See Figure 2-4. The system can save data for three tests per well. If more than three tests are
run on a specific well, older tests are overwritten as required.
• In Continuous mode, one well is measured continuously. See Figure 2-5. The NOC system
supplies current flow data plus running averages and totals.
After initial configuration, you can change the operation mode. However, changing modes affects
current measurement and data collection. Before changing modes, see Section 5.4.
Figure 2-4 Well Test mode
Figure 2-5 Continuous mode
8 Micro Motion® Series 3000 MVD Transmitters
Page 13

NOC Overview
Water cut
D
LDO
–
D
WDO
–
-----------------------=
2.2.4 Required well data
The following information is required for each well that will be tested or measured by the
NOC system:
If the density values are not known:
• Density of dry oil from this well, at reference temperature and reference pressure. To ensure
the most accurate net oil data, the density should be based on live oil rather than dead oil.
“Live oil” refers to crude oil at line pressure.
• Density of the water from this well, at reference temperature and reference pressure.
• You can take samples of produced oil and produced water, perform laboratory analysis, and
enter the results into the well configuration.
• You can perform an in-line density determination for oil, water, or both (see Section 4.9).
During in-line density determination, the appropriate process fluid (water or live oil) is routed
through the sensor, density values are averaged over a user-specified time period, and these
values are converted to reference temperature. The water cut calculation uses these average
values for D
and DW.
O
• You can enter approximate values at initial configuration, begin measurement, and recalculate
NOC data at a later time when well-specific density values are known (see Section 2.3.7).
NOC Overview NOC ConfigurationUsing the DisplayBefore You Begin
2.2.5 Water cut determination
There are two options for determining water cut:
• Density-based – The NOC application derives the water cut by applying the following
equation:
where:
- D
= Density of the liquid (oil/gas mixture), as measured by the Micro Motion sensor
L
- D
- D
= Density of produced oil (user-supplied value)
O
= Density of produced water (user-supplied value)
W
• Water cut monitor (external water cut) – A water cut monitor is used to measure the process
stream directly, and the Series 3000 transmitter retrieves the water cut data via a HART
connection. Accordingly, a HART connection between the primary mA output on the NOC
platform and the water cut monitor is required.
Net Oil Computer Supplement 9
Page 14

NOC Overview
RefDensity
Applied
RefDensity
Configured
Pressure
Operating
Pressure
Reference
–()× CompensationFactor×=
2.3 NOC application features and options
This section describes several features and options of the NOC application.
2.3.1 Temperature correction
Temperature correction refers to the conversion of data collected at the observed process temperature
to the equivalent values at reference temperature. The NOC application automatically applies
temperature correction to NOC data, using the temperature data from the RTD built into the
Micro Motion sensor.
2.3.2 Pressure compensation
The Series 3000 MVD NOC application can perform two types of pressure compensation:
• Pressure compensation for pressure effect
• Pressure compensation for oil density and water density
Pressure compensation for pressure effect
Pressure effect is defined as the change in sensor flow tube sensitivity due to the change of process
pressure away from calibration pressure. The Series 3000 transmitter can adjust the sensor’s raw mass
or density measurements to compensate for this pressure effect.
To implement pressure compensation for pressure effect, the following information is required:
• Flow factor – the percent change in the flow rate per psi. To obtain this value, see the sensor’s
product data sheet and reverse the sign.
• Density factor – the change in fluid density, in g/cm3/psi. To obtain this value, see the sensor’s
product data sheet and reverse the sign.
• Calibration pressure – the pressure at which the flowmeter was calibrated (which therefore
defines the pressure at which there will be no pressure effect). Refer to the calibration
document shipped with your sensor. If the data is unavailable, use 20 psi.
Note: For many sensors, the pressure effect is so small that pressure compensation is not required. See
the sensor’s product data sheet.
Pressure compensation for oil density and water density
Due to the presence of gas bubbles, the density of produced oil and water can be affected by pressure.
If pressure compensation for oil density and water density is enabled, the configured reference
densities of oil and water are adjusted as shown in the equation below.
where:
• The compensation factor for oil is the value configured for Pressure Compensation for Oil
Density, entered as the density change per unit of pressure change.
• The compensation factor for water is 3.0E
–6
g/cm3/psi.
10 Micro Motion® Series 3000 MVD Transmitters
Page 15
NOC Overview
Drive gain (%)
Density (measured)
Drive gain (actual)
2.3.3 Shrinkage factors
“Shrinkage” is a decrease in volume caused by the evaporation of solution gas, by the flashing of
volatile natural gas, or by lowered temperature during the crude oil stabilization process. By
estimating the shrinkage during oil storage or transport, you can estimate sellable oil based on
upstream volume measurement.
The NOC application includes two shrinkage factors: one for oil and one for water. The net oil flow
rate and net water flow rate measured by the NOC application are automatically multiplied by the
corresponding shrinkage factor. By default, the shrinkage factors are set to 1.0, resulting in no
compensation for shrinkage.
Use your standard methods to determine the appropriate shrinkage factors, taking into consideration
the location of the Micro Motion sensor in your process.
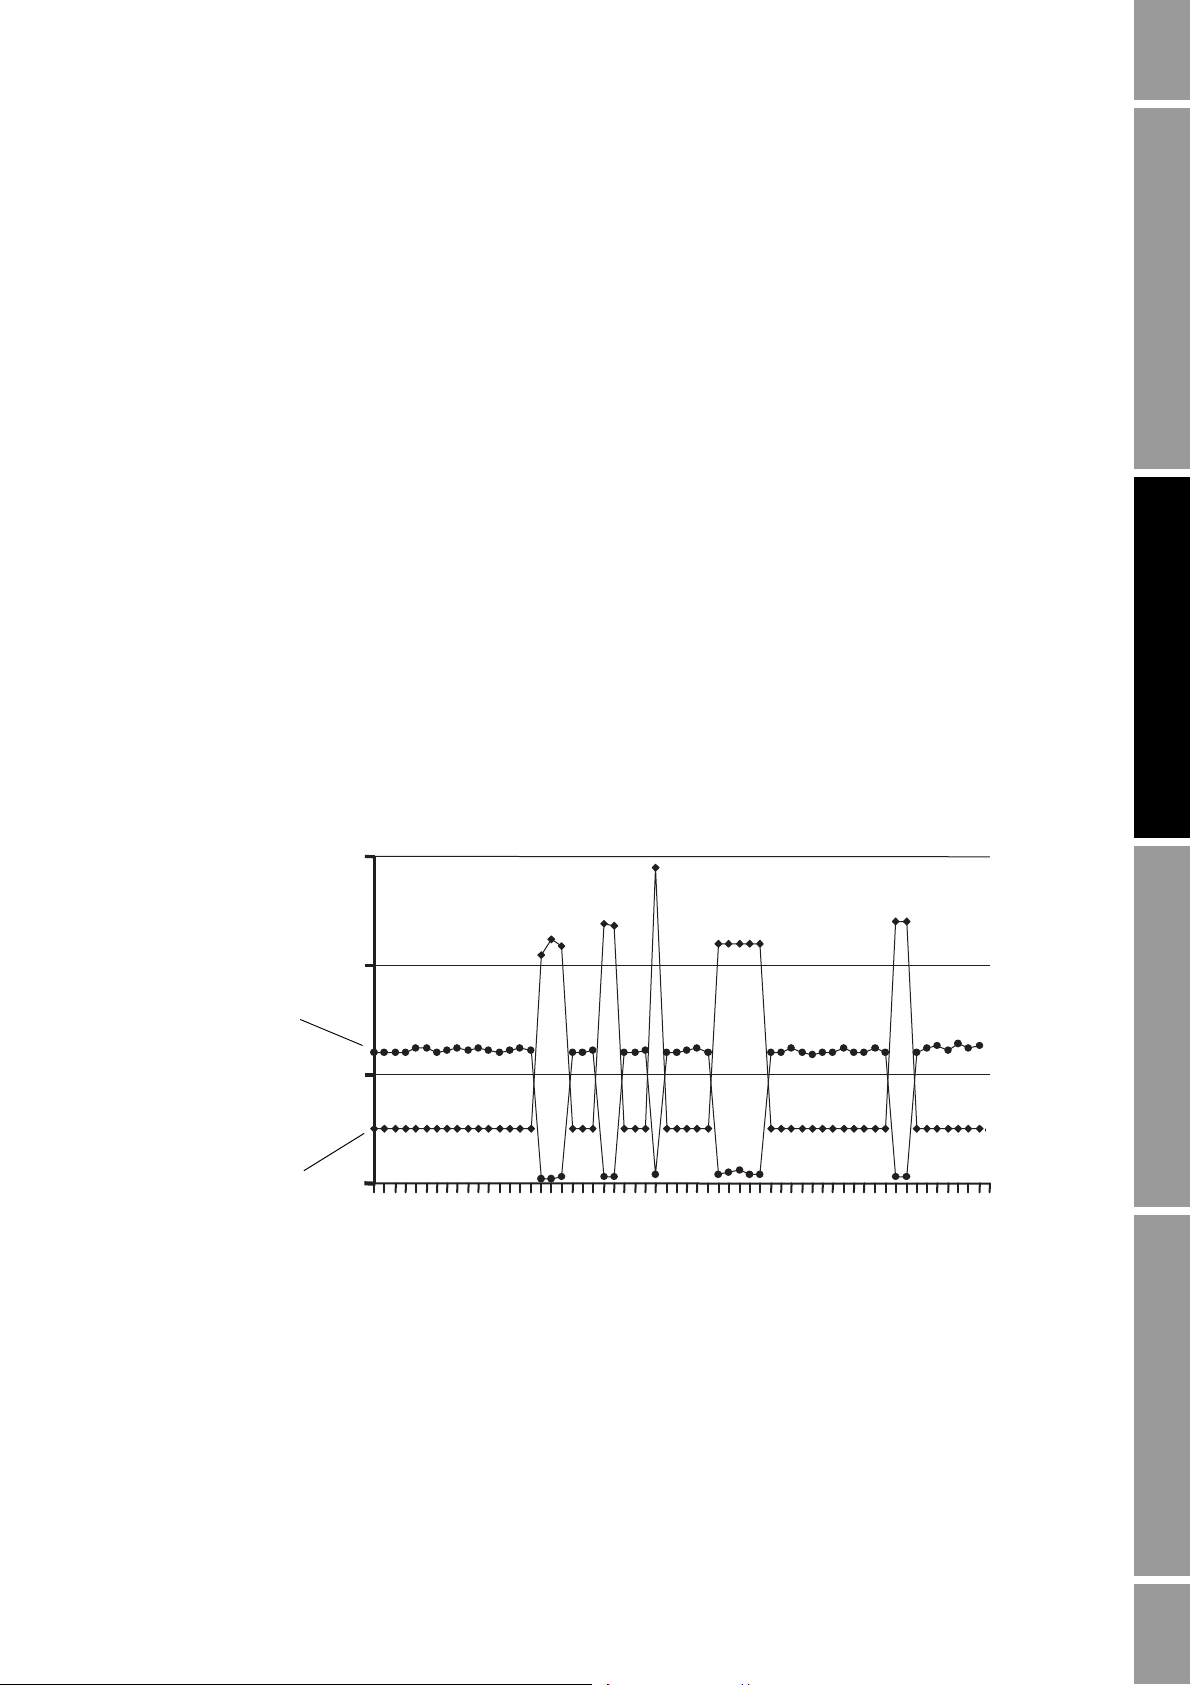
2.3.4 Gas carry-under – Transient Bubble Remediation (TBR)
Transient Bubble Remediation (TBR) is a standard feature of the NOC application. It is used to
provide more accurate process data during intermittent gas carry-under – gas entrainment in the liquid
stream. TBR is applicable only when the density-based water cut is used.
Note: If a water cut monitor is used to measure water cut directly, see the vendor documentation for
suggestions on maintaining accuracy through transient bubble conditions.
When the density-based water cut is used to calculate net oil, transient bubbles have a negative effect
on NOC measurement accuracy. Figure 2-6 shows the effect of transient bubbles on density.
Figure 2-6 Effect of transient bubbles on density
NOC Overview NOC ConfigurationUsing the DisplayBefore You Begin
Net Oil Computer Supplement 11
A “transient bubble condition” is defined in terms of the sensor’s drive gain: if the drive gain exceeds
the configured threshold for more than three seconds, the configured TBR actions are performed. The
transient bubble interval persists until drive gain is below the configured threshold for three seconds.
Page 16
NOC Overview
Density (measured)
Drive gain (actual)
Drive gain setpoint
Time Period
(seconds)
Density values
(retrieved and averaged)
To determine the value to use for the drive gain threshold, observe drive gain values for this system
during various flow conditions.
The NOC application can perform several different actions if transient bubbles are detected:
Additionally, you can configure a discrete output to report TBR status (see Section 5.3).
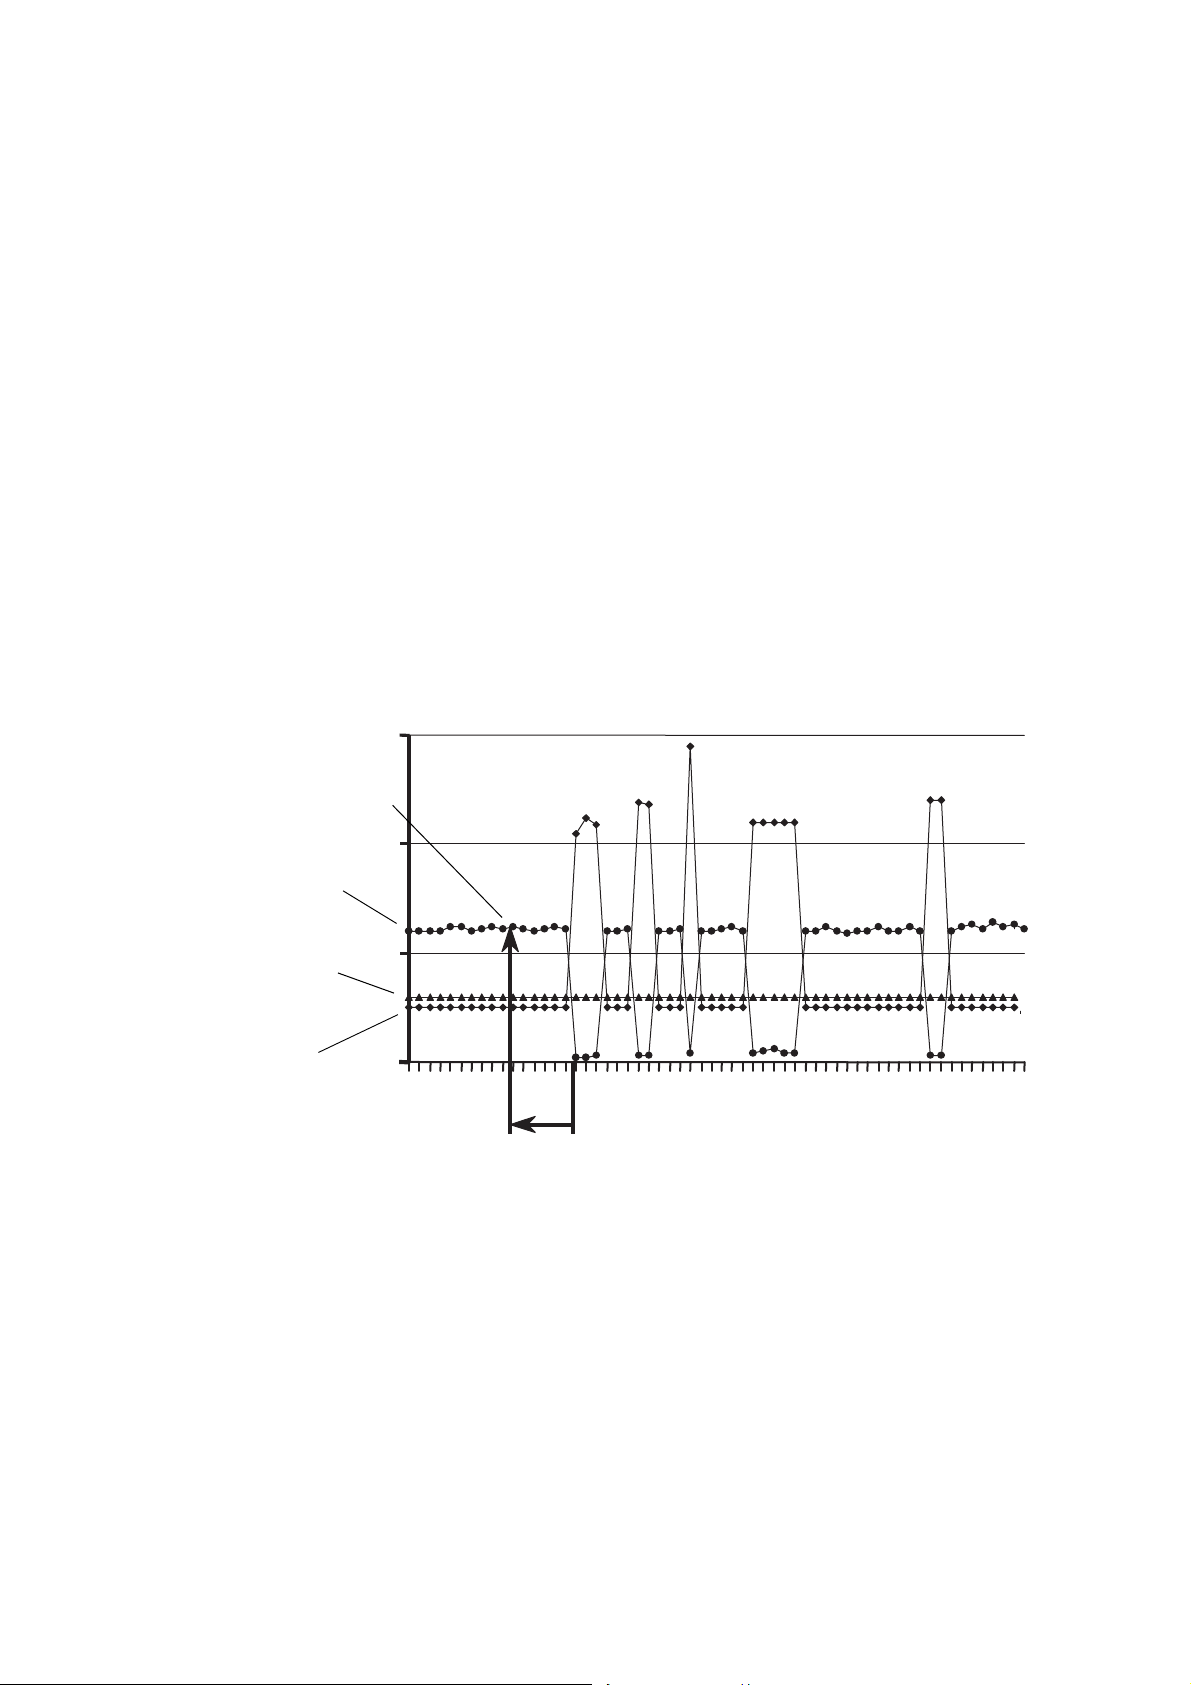
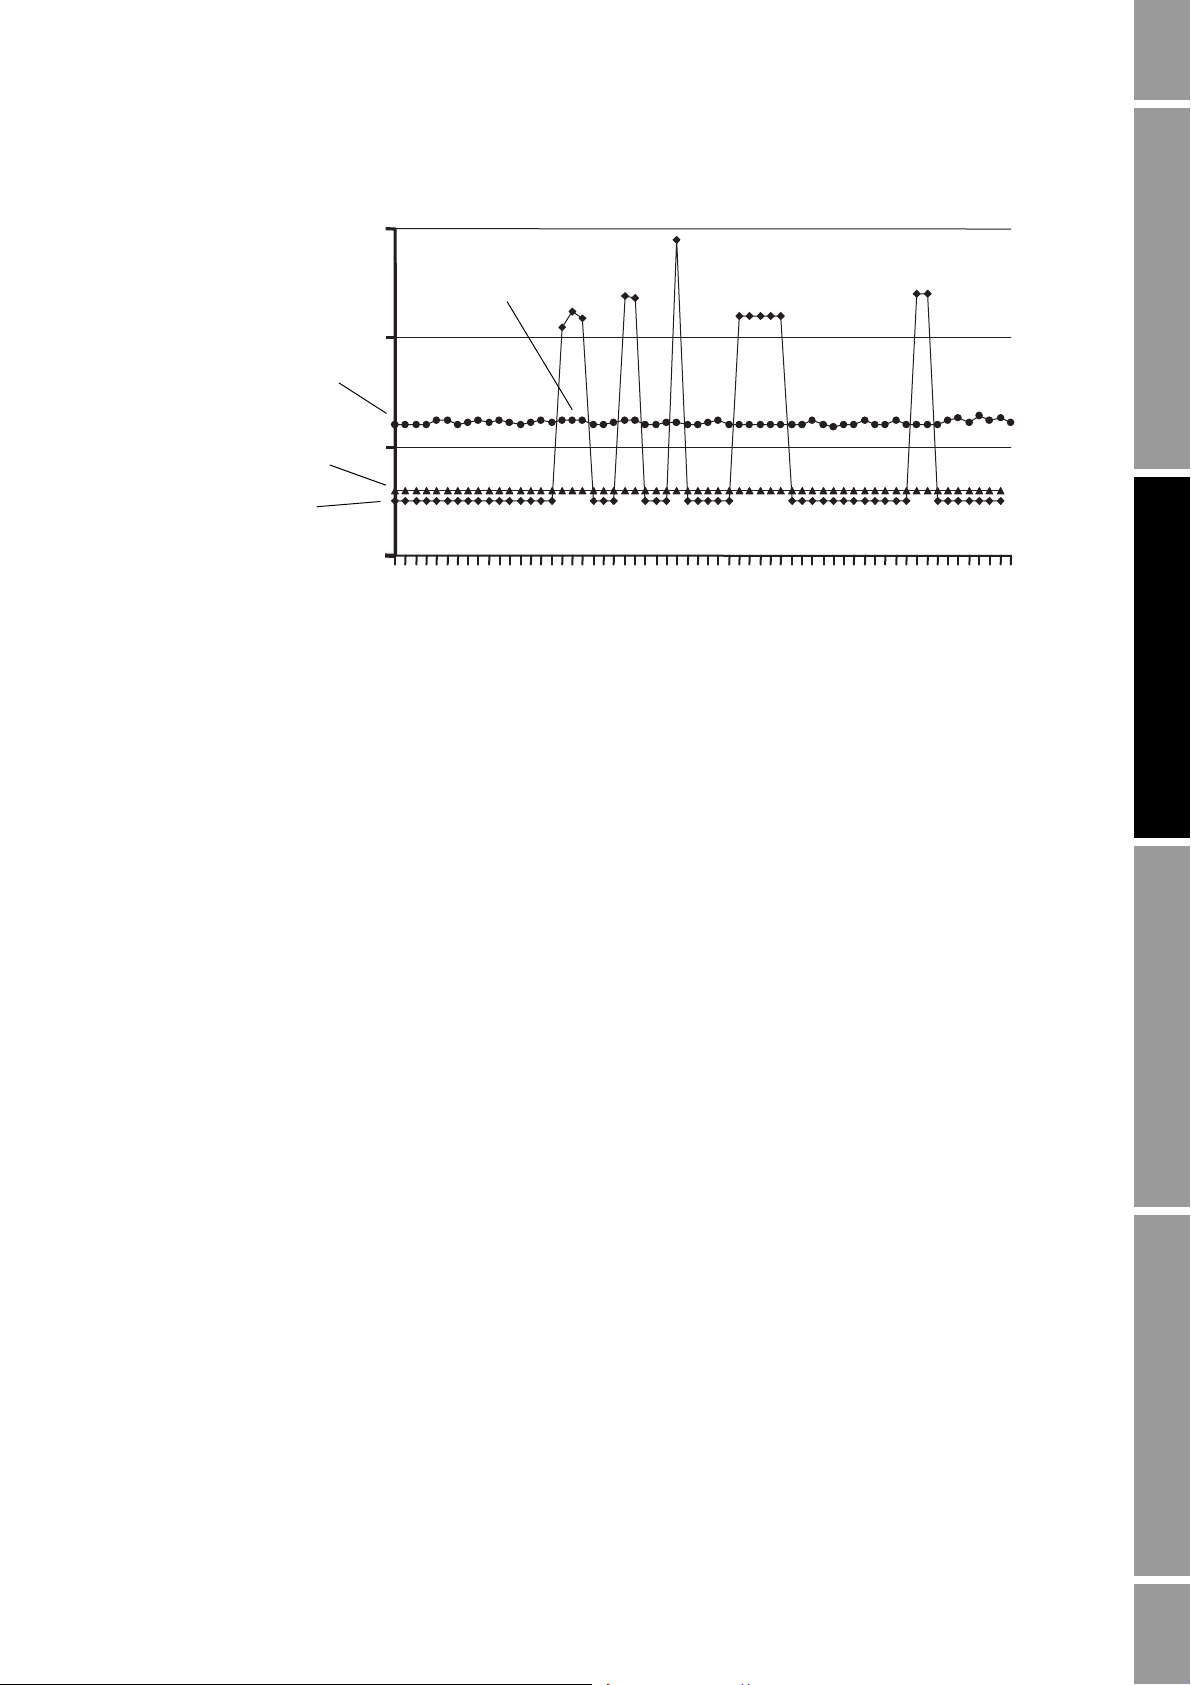
The Hold Last Value option directs the NOC application to retrieve the measured density value from
an earlier point in the process. The earlier point is identified by the configured Time Period (see
Figure 2-7). The density values from a three-second period around this point are averaged, and this
retrieved density average is then used in NOC calculations. Figure 2-8 shows how the Hold Last Value
action affects the density measurement.
Note: If the Time Period happens to fall into a previous transient bubble interval, the NOC
application automatically extends the lookback interval as required to retrieve an averaged value
from measured density values rather than substituted density values.
• Substituting a previously measured density value for the measured density value in NOC
calculations (the Hold Last Value option)
• Stopping the well test (if a well test is in progress)
• Posting an alarm
Figure 2-7 Hold Last Value option
12 Micro Motion® Series 3000 MVD Transmitters
Page 17
NOC Overview
Density
(used in NOC calculations)
Drive gain (actual)
Averaged retrieved
density value
Drive gain setpoint
Figure 2-8 Hold Last Value effect on density measurement
2.3.5 Gas measurement
If you want the NOC application to report gas flow data:
• A mass flow gas meter must be installed on the gas leg
NOC Overview NOC ConfigurationUsing the DisplayBefore You Begin
• The gas meter must be connected to the Series 3000 platform via the frequency input
• The density of produced gas at reference temperature and reference pressure must be
configured in the NOC application
The Transient Mist Remediation option may be implemented to provide more accurate gas flow data
during conditions of liquid carry-over. See the following section for more information on TMR.
If gas measurement without TMR will be implemented, the gas meter may or may not be a Micro
Motion product. If gas measurement with TMR will be implemented, the gas meter must be a Micro
Motion product.
2.3.6 Gas measurement with liquid carry-over – Transient Mist Remediation
Transient Mist Remediation (TMR) is an optional feature of the NOC application. It is used to
provide more accurate gas flow data during intermittent liquid carry-over – liquid entrained in the gas
stream. Additionally, because the liquid is assumed to be a mixture of oil and water in the same
proportions as in the liquid stream, the NOC application provides the option of adding the estimated
quantities back to the net oil and net water values from the liquid stream. This “addback” option
provides a more accurate measurement of total oil and water production from the well.
In addition to the gas measurement requirements described in the previous section, TMR requires
drive gain data from the TMR gas meter. Accordingly, a HART connection must be set up between
the primary mA output on the NOC platform and the TMR gas meter.
Variations in the drive gain from the TMR gas meter are used to detect liquid carry-over. When the
drive gain exceeds a user-specified threshold, liquid is assumed to be present in the gas stream. The
transient mist interval persists until drive gain is below the configured threshold.
To determine the value to use for the drive gain threshold, observe drive gain values for the TMR gas
meter during various flow conditions.
Net Oil Computer Supplement 13
Page 18
NOC Overview
Drive gain (actual)
Drive gain setpoint
Mass flow rate
M1
(averaged mass flow rate)
M3
(average of M1 and M2)
M2
(averaged mass flow rate)
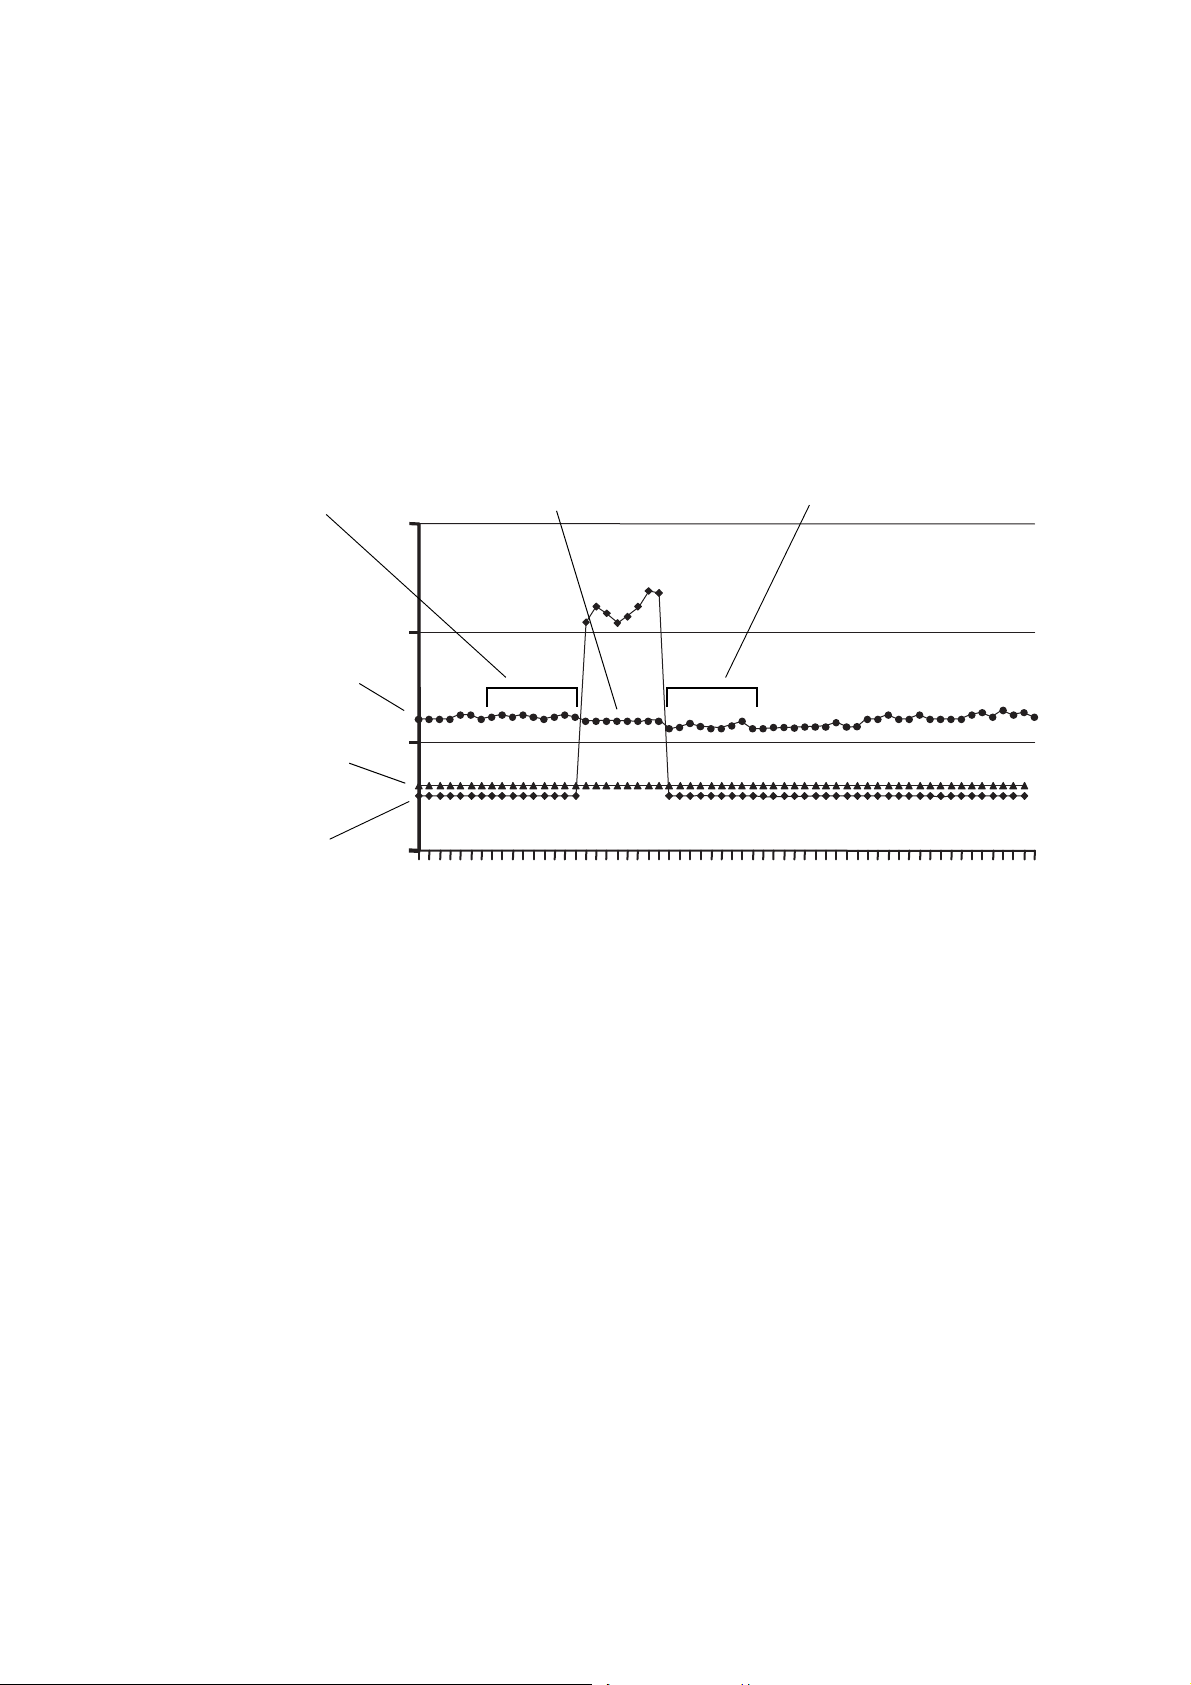
When a transient mist interval is detected:
• The mass flow rate over the previous n seconds is averaged and stored as the TMR M1 value,
where n is the value configured for Time Period.
• When the drive gain drops below the configured threshold for more than three seconds, the
mass flow rate over the next n seconds is averaged and stored as the TMR M2 value.
The M1 and M2 values are then averaged, and the resulting value M3 is used as the mass flow rate for
the TMR interval. See Figure 2-9 for an illustration of TMR.
Figure 2-9 TMR implementation
2.3.7 Recalculation
The Recalculation feature is used to convert existing NOC data to:
• A different reference temperature
• A different oil density at reference temperature
• A different water density at reference temperature
• A different reference density of gas
• A different reference pressure
• A different pressure compensation factor for oil
• Different shrinkage factors
For example, recalculation allows you to begin NOC measurement before precise reference values are
known, and then adjust the NOC data when the reference values are available.
During recalculation, you can change any or all of the values listed above. You can recalculate well
test results for any of the stored well tests, and you can recalculate the Continuous mode measurement
data for saved archive records.
When a well test or archive record is recalculated, the recalculated results can be saved if desired. The
original data is not overwritten.
14 Micro Motion® Series 3000 MVD Transmitters
Page 19

NOC Overview
Note the following:
• Only the most recent 24 hours of data can be recalculated.
• Recalculation is based on 15-minute “snapshot” average values. As a result, recalculated data
will typically be less accurate than the original data, which is based on continuous
measurement.
2.4 Planning the configuration
This section contains a set of questions that you should answer before beginning basic configuration
of the Net Oil Computer Software and the NOC system.
Note: These questions are specific to implementation of the NOC system. They do not address basic
system configuration (e.g., configuring the clock, passwords, events, communications, etc.).
1. Will this system be used to test multiple wells or to perform continuous measurement of a
single well?
2. If it will be used for well testing, what wells will be tested? in what order?
3. Will you use density-based water cut data or a water cut monitor? If you are using a water cut
monitor, what is its range?
4. For all wells that will be measured:
a. What is the oil density at reference temperature? If not known, will you perform a density
determination?
b. What is the water density at reference temperature? If not known, will you perform a
density determination?
c. (Well Test mode only) What is the well’s purge time?
NOC Overview NOC ConfigurationUsing the DisplayBefore You Begin
5. Will you use HART communications for any of the following: water cut data, pressure data, or
TMR data? If yes:
a. What is (are) the HART tag(s) of the external device(s)?
b. Is the primary mA output wired to support HART communications with the external
device(s)?
6. Does the system include gas measurement? If yes:
a. Is the frequency input wired to the gas meter?
b. What is the reference density of the gas (density at reference temperature and pressure)?
7. Will TBR be configured? If yes, what drive gain will be used as the TBR threshold?
8. Will TMR be configured? If yes, what drive gain will be used as the TMR threshold?
9. If you will configure pressure compensation for oil density, what is the value to use?
10. If you will configure shrinkage factors, what are the values to use?
Net Oil Computer Supplement 15
Page 20

NOC Overview
2.5 NOC measurement terminology
The terms used in NOC measurement are listed and defined in Table 2-1. These terms are used in a
variety of process variables and locations throughout the NOC application.
Table 2-1 NOC measurement terms and definitions
NOC term Definition
Gross The sum of the oil volume and the water volume, as measured by the NOC application.
Net oil Oil only, measured by volume, corrected to reference temperature, with the oil
Water cut Percentage of water in production stream, corrected to reference temperature, with the
Uncorrected water cut Percentage of water in production stream at operating conditions.
Net water Water only, corrected to reference temperature, with the water shrinkage factor applied.
Back flow Uncorrected volume flow moving backward through the sensor.
Uncorrected oil Oil only, through the oil or oil/water leg, measured by volume, with no corrections
Uncorrected water Water only, through the oil or oil/water leg, measured by volume, with no corrections
Uncorrected gross Raw volume flow measurement from the oil or oil/water leg.
Density Density of the mixture, with no corrections applied.
Carry-over Oil and water entrained in the gas stream and added back to the net oil and net water
Carry-under Gas entrained in the liquid stream
Gas volume Volume of gas in the gas stream, calculated by the NOC application from mass flow
Actual Flow rate as measured at the time of viewing
Average Rolling average, calculated from the beginning of the applicable time period.
Total Rolling total, calculated from the beginning of the applicable time period.
If TMR carry-over is implemented, this value includes oil and water from the gas leg.
shrinkage factor applied. If TMR carry-over is implemented, this value includes oil from
the gas leg.
water shrinkage factor applied.
If TMR carryover is implemented, this value includes water from the gas leg.
applied. Any configured pressure compensations are applied. Temperature correction
and shrinkage factors are not applied.
applied. Any configured pressure compensations are applied. Temperature correction
and shrinkage factors are not applied.
measurements
data from the gas meter
16 Micro Motion® Series 3000 MVD Transmitters
Page 21
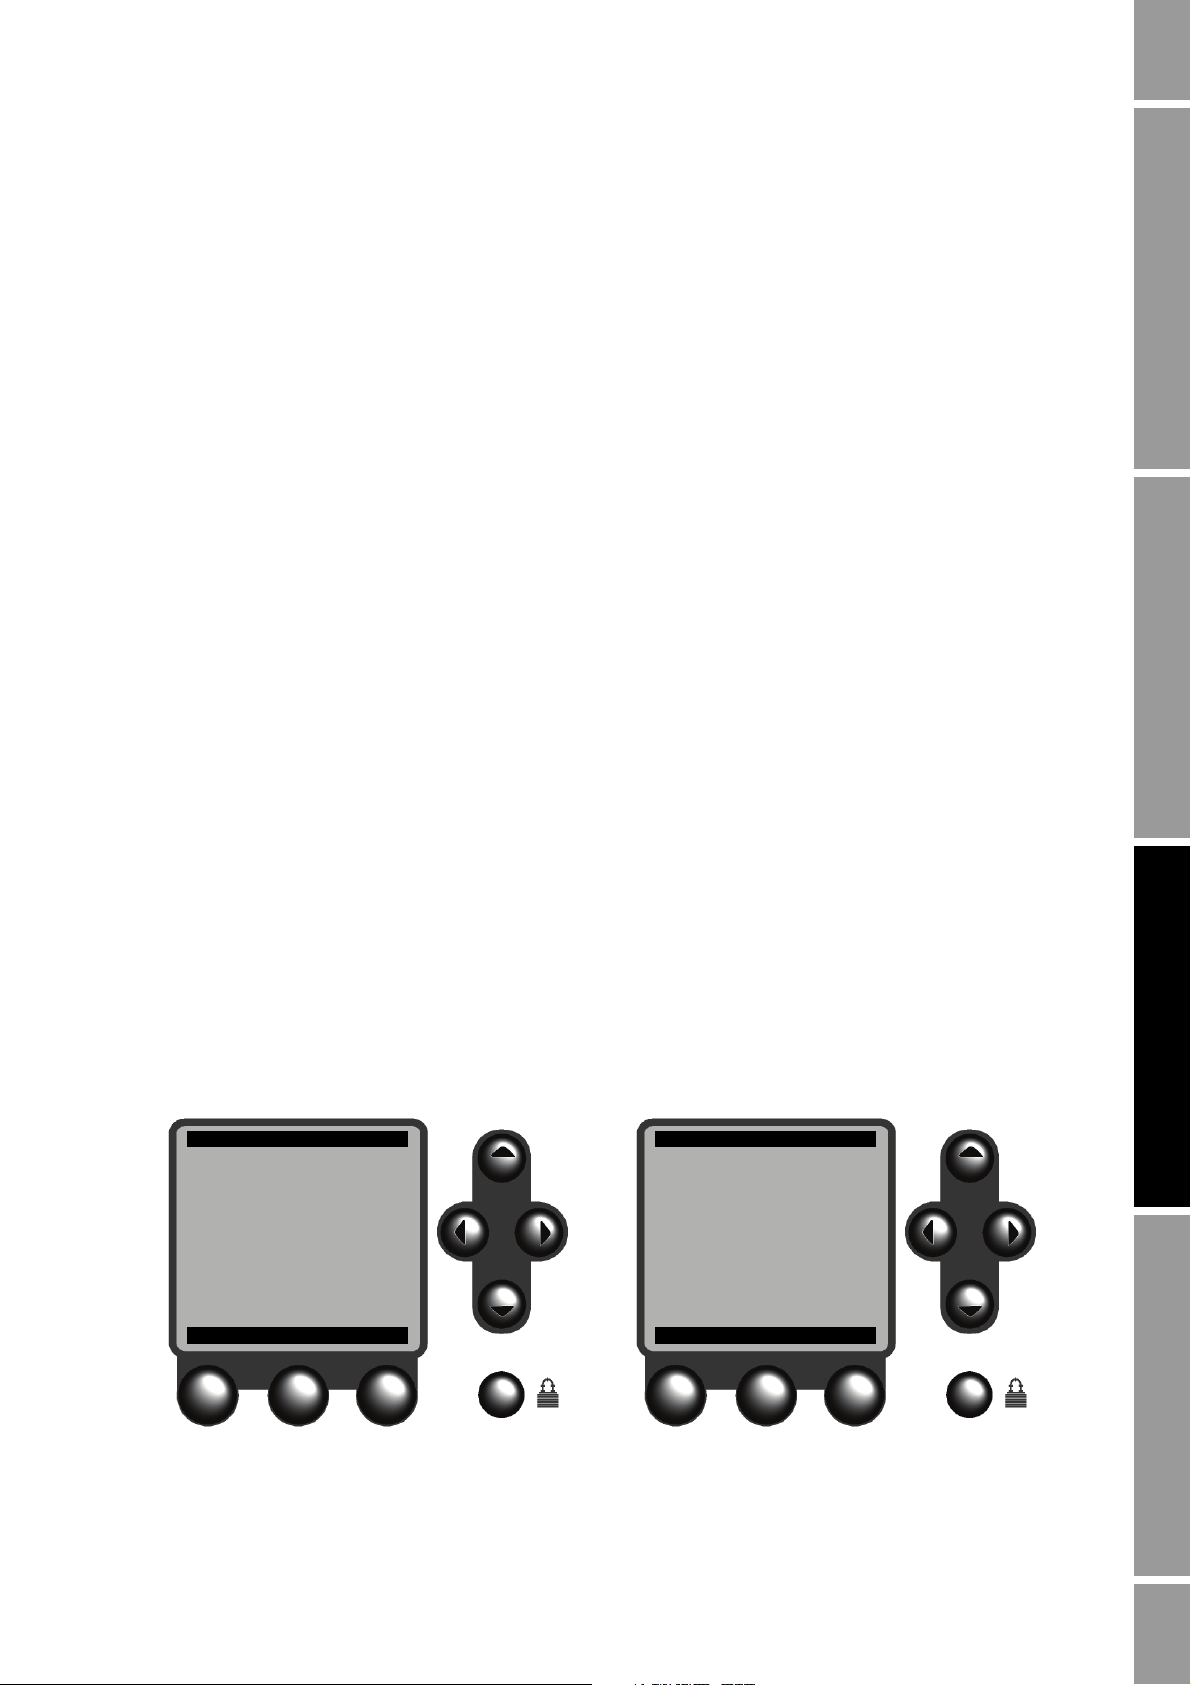
Chapter 3
Well Performance Meas
View Production Meas
Quick View
Pause / Resume
Reset
Save
SEL HELP EXIT
Well Performance Meas
Start Well Test
View Well Tests
Recalculate Well Test
SEL HELP EXIT
Continuous mode Well Test mode
Using the Display and Menu System
3.1 About this chapter
This chapter explains how to use the Series 3000 display and menu system. Using the display, you can
move through the menus, configure the application, monitor and control the application, and perform
maintenance and diagnostic tasks:
All NOC operations are accessed from the Well Performance Measurement screen.
All configuration, maintenance, and other functions are accessed via the Management menu.
3.2 Startup and Well Performance Measurement screen
When the Series 3000 device is powered on, it automatically tests its display. During display testing,
the screen darkens for approximately five seconds. After the display test is completed:
1. The Micro Motion logo is displayed for two to three seconds.
2. An application list is displayed for two to three seconds.
NOC Overview NOC ConfigurationUsing the DisplayBefore You Begin
3. The device enters operation mode and the Well Performance Measurement screen is displayed,
as shown in Figure 3-1. There are two versions of this screen, depending on whether the NOC
application is in Continuous mode or Well Test mode. All NOC operations are accessed from
this screen.
4. If there are any active alarms, the alarm category will be displayed in the alarm bar. To view,
acknowledge, or respond to the alarms, see Chapter 6.
Figure 3-1 Well Performance Measurement screen
Net Oil Computer Supplement 17
Page 22
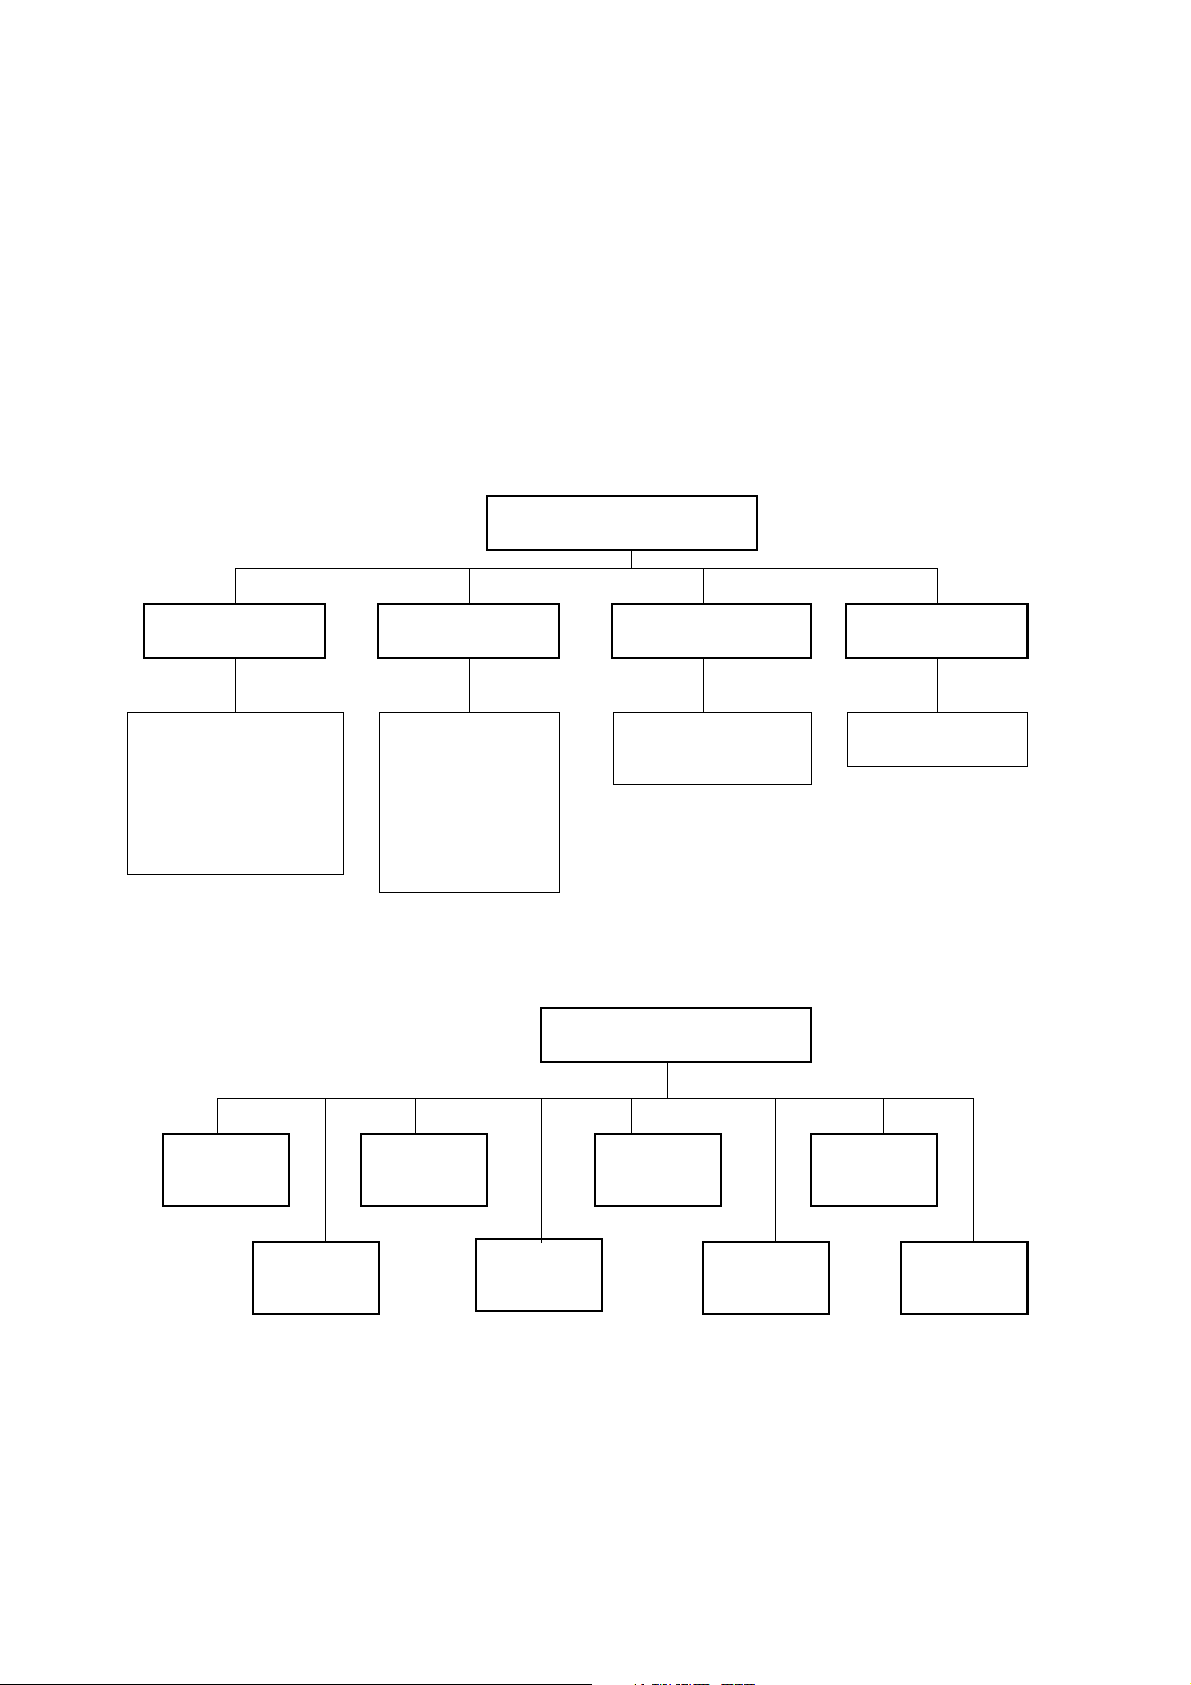
Using the Display and Menu System
Management
System
Inputs
Well Performance Meas
Measurements
Outputs
Monitoring
Digital Communication
Maintenance Security Language
Security
Passwords
Language
Configuration
Active alarm log
Alarm history
Alarm event log
Process inventory
Meter fingerprinting
(1)
Calibration
Diagnostics
Meter verification
(2)
(1) Available only on systems with the standard core processor.
(2) Available only on systems with the enhanced core processor,
and only if the meter verification option was purchased.
View
Well
performance
measurement
Process
totalizers
LCD
options
Active alarm
log
Power outageProcess
monitoring
Diagnostic
monitor
Applications
list
3.3 Menu systems
Most Series 3000 display functions are organized into two menu systems:
• The Management menu allows you to perform configuration and maintenance tasks.
• The View menu allows you to monitor and control the process. The Well Performance
Measurement screens shown in Figure 3-1 are part of the View menu.
Figures 3-2 and 3-3 show high-level views of these menu systems. More detailed menus for the NOC
application are provided in Chapters 4 and 5, and menu flowcharts for the Series 3000 device with the
NOC application are provided in Appendix A.
Figure 3-2 Management menu
Figure 3-3 View menu
18 Micro Motion® Series 3000 MVD Transmitters
Page 23

Using the Display and Menu System
To enter the menus:
• To enter the Management menu system, press the
the lower right corner of the display, marked with a padlock icon (see Figure 3-1). You may or
may not be required to enter a password (see the following section).
• To move from the Well Performance Measurement screen to the top-level View menu, press
the
EXIT button (see Figure 3-1).
3.3.1 Accessing management functions
Security button. The Security button is in
You can use the
menus. When the
Security button to access management functions from any point in the Series 3000
Security button is pressed:
• If security is disabled, the Management menu will be displayed immediately. By default,
security is disabled.
• If security has been enabled, you will be prompted to enter a password. There are two
passwords:
- The configuration password enables access to all functions. When it is entered, the
Management menu is displayed.
- The maintenance password enables access to the maintenance functions. When it is
entered, the Maintenance menu is displayed.
Both passwords consist of a sequence of four cursor control button presses. To enter a password:
1. Press the four cursor control buttons in the correct sequence.
2. Press
SEL.
To configure and enable security, see Chapter 6.
3.3.2 Shortcuts
From any point in the menu system, you can:
• Return to the Management menu (if security is disabled) or the password entry screen (if
security is enabled) by pressing the
• Return to the operating screen by pressing the
Security button, as described in the previous section.
Security button, then pressing the EXIT button.
NOC Overview NOC ConfigurationUsing the DisplayBefore You Begin
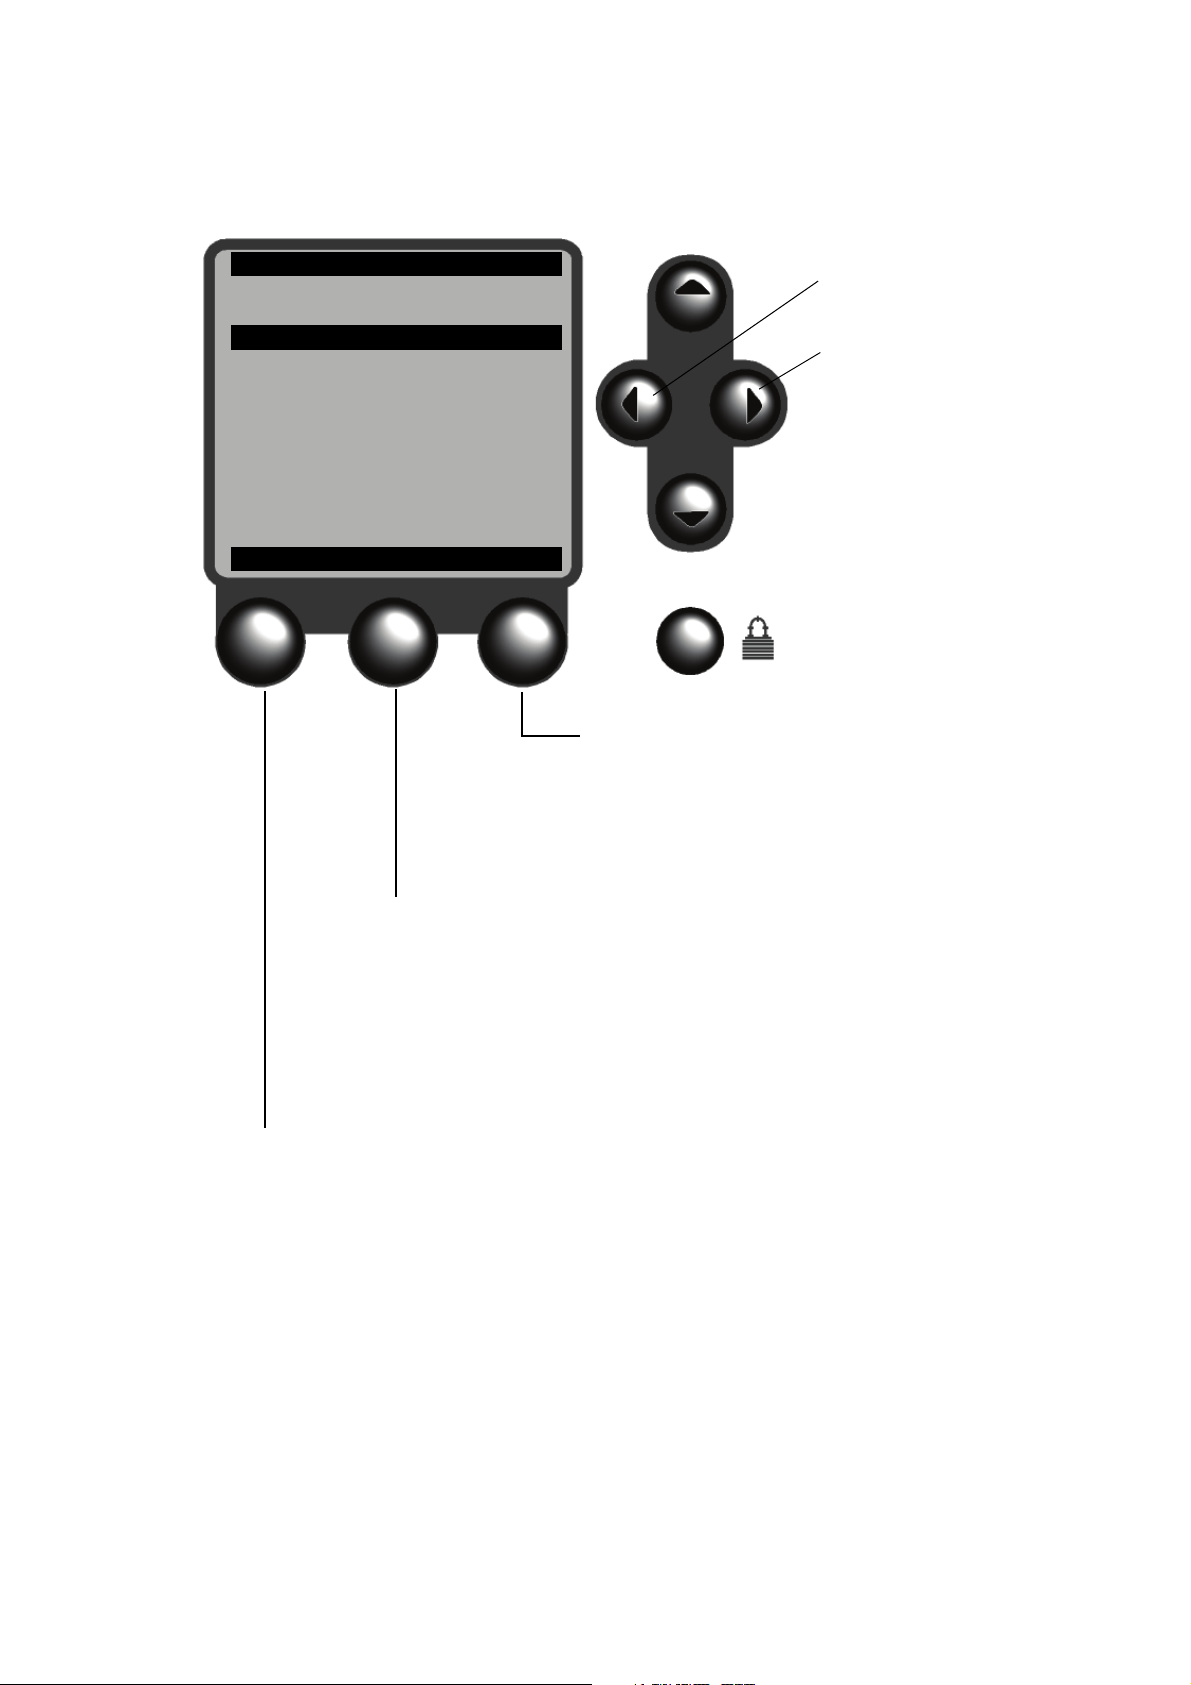
3.4 Using the function buttons
The buttons at the bottom of the display are the function buttons. The functions performed by the
buttons vary, depending on the screen and the current state of the application. The function currently
assigned to the button is always displayed on the screen, above the button. The buttons are sometimes
referred to as F1, F2, and F3. Figure 3-4 lists the functions supported by the NOC application.
Note: The left and right cursor control buttons may also be used as function buttons. See Figure 3-4.
If a cursor is shown on the display, the action performed by the function button applies to the item
where the cursor is located. Before pressing a function button, be sure the cursor is located correctly.
See Section 3.5.
Net Oil Computer Supplement 19
Page 24
Using the Display and Menu System
ALARMS
DEVICE 1
Configuration
Maintenance
Security
Language
SEL HELP EXIT
F3 function button
VIEW Access the View menu
EXIT Exit to previous menu or cancel a change
NO Cancel action
PREV Return to the previous screen
ABORT • Abort sensor zero
• Abort calibration
F2 function button
HELP Show a help screen
RESET Reset total
START Start a well test
VIEW View net oil data
PRINT Print a ticket
NEXT Advance to the next screen
ACKALL Acknowledge all alarms
F1 function button
SEL Select the highlighted menu item
CHG Make a change to the highlighted menu item
SAVE Save a change
YES Proceed with action
ACK Acknowledge an alarm message
START Start well test or density determination
STOP Stop well test or density determination
RESET Measurement group or all measurements
PAUSE (Continuous mode) Pause NOC measurement
RESUME (Continuous mode) Resume NOC measurement
NEXT Test next well
RETURN Exit to Well Test screen
CLEAR Clear power outage events
OK Acknowledge
F3 function button
F1 function button
Figure 3-4 Function buttons
20 Micro Motion® Series 3000 MVD Transmitters
Page 25

Using the Display and Menu System
3.5 Using the cursor control buttons
The cursor control buttons move the cursor around the display menus. In menus, the cursor is a
reverse-video highlight bar.
•Use the
Up and Down buttons to locate the cursor at the menu item you want to select or
change.
• After locating the cursor at the desired menu item, press
select or change the item.
3.5.1 Selecting from a list
For enumerated lists, pressing
CHG will display a separate screen from which you can choose the
desired option. From that screen:
• Press
• Press
SAVE to save the change and return to the previous screen, or
EXIT or the Left button to return to the previous screen without saving.
3.5.2 Changing a variable value
If you need to change the value of a variable, the cursor appears as a line under a character in the
current value.
• If the variable has a value of Yes or No, all cursor control buttons toggle between the two
choices.
• If the variable has a numeric or character value, press the
to increase or decrease the value of the character at the cursor.
• If the variable has more than one digit or character, press the
buttons to move the cursor to the next or previous character.
When the value is correct, press
SEL or CHG, or the Right button, to
NOC Overview NOC ConfigurationUsing the DisplayBefore You Begin
Up and Down cursor control buttons
Left and Right cursor control
SAVE.
Press
EXIT to return to the previous screen without saving.
3.5.3 Cursor control example
Figure 3-5 shows a typical configuration sequence involving both a menu item and a variable.
Pressing
HELP produces a screen that has help for the item at the cursor.
3.6 Scientific notation
Scientific notation is used on some screens for displaying values that contain more digits than the
display can show, or that exceed the precision of the floating point data type. For example, the value
1234000.000 would be displayed as 1.234E6 or 1.234+6.
Net Oil Computer Supplement 21
Page 26

Using the Display and Menu System
Density
↓
Density Units
g/cm3
Density Damping
1.7 sec
Density Cutoff
0.005
000 g/cm3
Slug Low Limit
0.005000 g/cm3
SAVE HELP EXIT
Density
↓
Density Units
g/cm3
Density Damping
1.7 sec
Density Cutoff
0.005000 g/cm3
Slug Low Limit
0.005000 g/cm3
CHG HELP EXIT
Move cursor up/Scroll up
Move cursor down/Scroll down
EXIT
Current
selection is
highlighted
Increase value at cursor
or toggle YES/NO
Decrease value at
cursor or toggle YES/NO
Var iabl e
Indicates items
available to scroll
Current
selection is
underscored
Menu item
Move cursor to left
Move cursor to right
SELECT
Figure 3-5 Cursor control buttons
22 Micro Motion® Series 3000 MVD Transmitters
Page 27

Chapter 4
Configuring the NOC Application
4.1 About this chapter
This chapter explains how to configure the NOC application and perform density determination
procedures.
The following topics are discussed:
• Basic configuration procedure – see Section 4.3
• Setting up a water cut monitor – see Section 4.4
• Setting up pressure compensation – see Section 4.5
• Setting up Transient Bubble Remediation – see Section 4.6
• Setting up gas measurement – see Section 4.7
• Setting up Transient Mist Remediation – see Section 4.8
• Performing density determination procedures – see Section 4.9
NOC Overview NOC ConfigurationUsing the DisplayBefore You Begin
- Density determination for water – see Section 4.9.1
- Density determination for oil – see Section 4.9.2
Failure to perform configuration tasks in the proper sequence could result in an incomplete
configuration. See Section 1.3 for the recommended configuration sequence.
Do not change configuration during data collection. Changes made to the NOC configuration will affect
NOC measurement. Changes made to other configuration parameters may affect NOC measurement.
To ensure accurate NOC data, follow the instructions in Section 5.2.4 (Well Test mode) or Section 5.3.4
(Continuous mode) to change configuration.
4.2 Well Performance Measurement menu
Use the Well Performance Measurement menu, shown in Figure 4-1, to access and configure NOC
parameters. The Well Performance Measurement menu is accessed through the Configuration option
of the Management menu. To access the Management menu, see Chapter 3.
Net Oil Computer Supplement 23
Page 28

Configuring the NOC Application
Continuous Mode
Well Test Mode
Well Performance Meas
60 degF
15 degC
20 degC
Transient Bubble Remd
•Drive Gain Level
• Action Taken
• Time Period
Transient Mist Remed
(2)
•Drive Gain Level
• Time Period
• Add Carry-Over Totals
• Gas Meter HART Tag
Press Comp Oil Dens
Shrinkage Factors
•Factor for Oil
• Factor for Water
Mode of operation Reference Temperature Well Data-Densities
Compensations
Wells 1 to 12
(1)
Wells 13 to 24
(1)
Wells 25 to 36
(1)
Wells 37 to 48
(1)
Well Name
(1)
Oil Density
Water Density
Gas Reference Density
Press Comp Oil Density
Reference Pressure
Purge Time
(1)
Oil Deviation
Water Devi ation
Oil Duration Ave
Water Duration Ave
Well #: Well Name
(1)
Well #: Well Name
(1)
.
.
.
Well #: Well Name
(1)
Gas Meter
Gas Volume Units
Water Cut Monitor
Ext Water Cut Limit
External inputs
(1) Displayed only in Well Test mode.
(2) Displayed only if the Transient Mist Remediation option was purchased.
Figure 4-1 Well Performance Measurement menu
4.3 Basic configuration procedure
24 Micro Motion® Series 3000 MVD Transmitters
To configure the NOC application, the following general steps are required:
1. Set
2. Set
3. If you are using Continuous mode, use the Well Data-Densities menu to set the well
Mode of Operation to Continuous or Well Test.
• In Continuous mode, one well, separator, or pipeline is monitored continuously. A reset
• In Well Test mode, a well test may be performed on any of the wells on a manifold, up to
parameters for the well to be measured. See Table 4-1 for definitions of these parameters.
function is used to define the starting point for totals, averages, and maximum/minimum
values.
48 wells. Each well is configured independently and well test data is stored separately.
Reference Temperature to the reference temperature to be used by the NOC application.
Page 29

Configuring the NOC Application
4. If you are using Well Test mode:
a. Use the Well Data-Densities menu to specify the well to configure.
b. Assign a name to the well.
c. Use the Well Data-Densities menu to set the well parameters for the well to be measured.
See Table 4-1 for definitions of these parameters.
d. Repeat for all wells in the system.
Note: Micro Motion recommends configuring wells in the order in which they will be tested. For
example, the first well to be tested should be Well 1; the second well should be Well 2, and so on. If
you do this, you can use the NEXT function to move to the next well automatically.
Table 4-1 Well parameters
Parameter Default Description
Well name None (Well Test mode only) Enter a name to identify this well.
Oil density 0.8000
Water density 1.0000
Gas reference
density
Pressure
compensated oil
density
Reference
pressure
Purge time 0 sec (Well Test mode only) The measurement delay period after a well test has been
Oil deviation 0.5000
Water deviation 0.5000
Oil duration ave 30 sec The sample time, in seconds, for an oil density determination procedure. See
Water duration ave 30 sec The sample time, in seconds, for an in-line water density determination procedure.
3
g/cm
3
g/cm
0.001205
3
g/cm
0.0000
g/cm3/PSI
0.0 PSI The reference pressure value used to correct line density values to standard density
3
kg/m
3
kg/m
The name may contain a maximum of 16 characters, including spaces.
The density of oil from this well, at reference pressure and reference temperature.
Required only if density-based water cut will be used. See Section 2.2.5.
The density of water from this well, at reference pressure and reference temperature.
Required only if density-based water cut will be used. See Section 2.2.5.
(Used only if gas measurement is implemented) The density of gas from this well at
reference pressure and reference temperature.
The factor used to compensate the configured reference density of oil for the effect of
pressure. See Section 2.3.2.
values.
started. Used to allow the separator to empty any contents from the previous test.
The maximum acceptable difference between two consecutive density readings
during a density determination for oil. If the difference is greater than the configured
oil deviation, the density averaging is restarted. See Section 4.9.2.
The maximum acceptable difference between two consecutive density readings
during a density determination for water. If the difference is greater than the
configured oil deviation, the density averaging is restarted. See Section 4.9.1.
Section 4.9.2.
See Section 4.9.1.
NOC Overview NOC ConfigurationUsing the DisplayBefore You Begin NOC Overview NOC ConfigurationUsing the DisplayBefore You Begin NOC Overview NOC ConfigurationUsing the DisplayBefore You Begin NOC Overview NOC ConfigurationUsing the DisplayBefore You Begin
5. Use the External Inputs menu shown in Figure 4-1 to enable or disable use of a water cut
monitor. If
Water Cut Monitor is enabled, additional setup is required. See Section 4.4.
6. Use the External Inputs menu shown in Figure 4-1 to enable or disable gas measurement. If
Gas Meter is enabled, additional setup is required. See Section 4.7.
Net Oil Computer Supplement 25
Page 30

Configuring the NOC Application
7. Set the parameters in the Compensations menu as desired.
•For
Transient Bubble Remediation, see Section 2.3.4 for a discussion of this feature, and
see Section 4.6 for additional setup instructions.
•For
Transient Mist Remediation, see Section 2.3.6 for a discussion of this feature, and
see Section 4.8 for additional setup instructions.
•For
Pressure Compensated Density, see Section 2.3.2 for a discussion of this feature,
and see Section 4.5 for additional setup instructions.
•For
Shrinkage Factors, see Section 2.3.3 for a discussion of this feature. To “disable”
shrinkage factors, set them to 1.0.
8. If desired, configure discrete outputs, milliamp outputs, or the frequency output to report NOC
data. To do this, refer to the manual entitled Series 3000 MVD Transmitters and Controllers:
Configuration and Use Manual and:
a. Assign the desired process variable to the output. Available NOC process variables are
listed in Table 4-2.
b. Configure other output parameters as desired.
Table 4-2 Assigning NOC process variables to outputs
Can be assigned to
NOC process variable
TBR event
External water cut ✓
Uncorrected oil volume rate ✓✓
Uncorrected water cut ✓
Uncorrected water volume rate ✓✓
Back flow rate
Net oil flow rate
Net water cut
Gross volume rate
Net water flow rate
Average uncorrected oil rate
Average uncorrected water cut
Average uncorrected gross rate
Average uncorrected water rate
Average back flow rate
Average net oil flow rate
Average net water cut
Average gross volume rate
Average net water rate
Average gas volume flow rate
(1)
Discrete outputs Milliamp outputs Frequency output
✓
✓✓
✓✓
✓
✓✓
✓✓
✓
✓
✓
✓
✓
✓
✓
✓
✓
✓
(1) ON = TBR active; OFF = TBR inactive.
26 Micro Motion® Series 3000 MVD Transmitters
Page 31

Configuring the NOC Application
9. If desired, configure the severity level of the NOC status alarms. The status alarms listed in
Table 4-3 indicate specific states of the NOC application. Like all other status alarms on the
Series 3000 platform, they can be configured for three different severity levels – Ignore, Info,
and Fault. To configure the NOC status alarms, see the instructions in the manual entitled
Series 3000 MVD Transmitters and Controllers: Configuration and Use Manual.
Table 4-3 NOC status alarms
Alarm severity
Alarm
Category
Electronics A136 Power Outage The power was off for
Process A138 TBR Active The drive gain has
Configuration A137 Measurements
number
A139 Water Cut
A140 TMR Active The drive gain has
Maintenance
menu listing Description
at least 30 seconds.
exceeded the
configured TBR
threshold.
The water cut
Overrange
Paused
measured by the
water cut monitor is
above the configured
External Water Cut
Limit.
exceeded the
configured TMR
threshold.
Continuous mode
measurements have
been paused for
more than 15
minutes.
User
config?
Info Yes No
Info Yes No
Info Yes No
Info Yes No
Info Yes No
Affected by fault
timeoutDefault
NOC Overview NOC ConfigurationUsing the DisplayBefore You Begin NOC Overview NOC ConfigurationUsing the DisplayBefore You Begin NOC Overview NOC ConfigurationUsing the DisplayBefore You Begin NOC Overview NOC ConfigurationUsing the DisplayBefore You Begin
Net Oil Computer Supplement 27
Page 32

Configuring the NOC Application
10. If desired, configure the process monitor to display NOC process variables. Instructions for
configuring the process monitor are in the manual entitled Series 3000 MVD Transmitters and
Controllers: Configuration and Use Manual. The following NOC process variables can be
assigned to the process monitor:
•External Water Cut
• Uncorrected Water Cut
•Net Water Cut
• Uncorrected Oil Volume Rate
• Uncorrected Oil Total
• Uncorrected Oil Inventory
• Uncorrected Water Volume Rate
• Uncorrected Water Total
• Uncorrected Water Inventory
• Back Flow Rate
• Back Flow Total
• Back Flow Inventory
• Net Oil Flow Rate
• Net Oil Total
• Net Oil Inventory
•Net Water Flow Rate
•Net Water Total
•Net Water Inventory
• Gross Volume Rate
• Gross Volume Total
• Gross Volume Inventory
• Gas Volume Flow Rate
•Gas Volume Total
•Gas Volume Inventory
Note: The process monitor may also be used to display other variables such as external pressure,
external temperature, etc. This may be useful to verify setup and configuration.
28 Micro Motion® Series 3000 MVD Transmitters
Page 33

Configuring the NOC Application
4.4 Setting up a water cut monitor
If you will use a water cut monitor:
1. Ensure that the water cut monitor is correctly installed and tested, and configured to report
water cut data in %.
2. Enable the water cut monitor as an external input, as described in Section 4.3, Step 5.
3. If desired, specify a value for
value, an alarm will be posted. Micro Motion recommends setting this parameter to the highest
value in your water cut monitor’s range. To disable the alarm, set the value to 100%.
4. Set up a HART polling connection between the Series 3000 device and the water cut monitor
as follows:
a. Ensure that the primary mA output has been wired to support HART protocol, and that it
has a HART connection to the water cut monitor.
b. From the Configuration menu shown in Figure 3-2, select
c. Select
d. Set
e. Set
Polling Variable 1 or Polling Variable 2.
Polling Control to Poll as Primary or Poll as Secondary.
Polled Variable to External Water Cut.
f. Specify the tag of the device to be polled.
5. To verify that water cut data is being received, view the current water cut value as shown in
Figure 5-2 (Well Test mode) or Figure 5-3 (Continuous mode). Ensure that the displayed value
matches the value sent by the water cut monitor.
4.5 Setting up pressure compensation
To set up pressure compensation:
1. Obtain the external pressure value, as described in Section 4.5.1
2. Enable and configure pressure compensation for oil density and water density and/or pressure
compensation for pressure effect, as described in Sections 4.5.2 and 4.5.3.
The same external pressure value is used for both types of pressure compensation.
Ext Water Cut Limit. When the measured water cut exceeds this
Inputs>External Inputs.
NOC Overview NOC ConfigurationUsing the DisplayBefore You Begin NOC Overview NOC ConfigurationUsing the DisplayBefore You Begin NOC Overview NOC ConfigurationUsing the DisplayBefore You Begin NOC Overview NOC ConfigurationUsing the DisplayBefore You Begin
4.5.1 Obtaining the external pressure value
To obtain the external pressure value, you must set up a HART polling connection between the Series
3000 device and the external pressure device, as follows;
1. Ensure that the primary mA output has been wired to support HART protocol, and that it has a
HART connection to the external pressure device.
2. See Figure 3-2. Select
a. Select
b. Set
c. Set
Polling Variable 1 or Polling Variable 2.
Polling Control to Poll as Primary or Poll as Secondary.
Polled Variable to Pressure.
Configuration>Inputs>External Inputs, and:
d. Specify the tag of the device to be polled.
e. Set
Pressure Units to the units used by the external pressure device.
3. To verify, configure the process monitor to display the external pressure value and observe the
pressure data.
Net Oil Computer Supplement 29
Page 34

Configuring the NOC Application
4.5.2 Setting up pressure compensation for oil density and water density
To set up pressure compensation for oil density and water density:
1. See Figure 4-1. In the Well Data-Densities menu, set
be used to compensate for the effect of pressure on oil density.
2. In the Compensations menu, set
4.5.3 Setting up pressure compensation for pressure effect
To set up pressure compensation for pressure effect:
Press Comp Oil Density to the factor to
Press Comp Density to Enable.
1. See Figure 3-2. Select
a. Select the
b. Set
c. Set
Polling Variable that you have defined for pressure.
Pressure Compensation to Enable.
Flow Factor, Density Factor, and Cal Pressure to the appropriate values for your
Configuration>Inputs>External Inputs, and:
sensor. See Section 2.3.2.
4.6 Setting up Transient Bubble Remediation
To se t up T B R:
1. See Figure 4-1. In the Compensations menu, select
a. Set
Drive Gain Level to the drive gain value (in percent) that represents a transient bubble
condition in this process stream. To determine the best value, you may find it useful to
observe drive gain values for this system using the View>Well Performance
Measurements>View Production Measurements menu.
b. Set
c. Set
Action Taken to the desired action.
Time Period to the number of seconds that the transmitter will look back to retrieve a
density value.
2. If desired, configure a discrete output to report TBR status. See Section 4.3, Step 8.
Transient Bubble Remd, and:
4.7 Setting up gas measurement
To set up and enable gas measurement:
1. Ensure that the external gas measurement device is correctly installed and tested, and
configured to report gas data in the units that will be used in the NOC application.
2. Ensure that the external gas measurement device has been wired to the frequency input of the
Series 3000 platform.
3. At the Series 3000 platform, configure the frequency input and perform a loop test, as
described in the manual entitled Series 3000 MVD Transmitters and Controllers:
Configuration and Use Manual.
4. See Figure 4-1. In the External Inputs menu:
a. Set
b. Set
30 Micro Motion® Series 3000 MVD Transmitters
Gas Meter to Enable (see Section 4.3, Step 6).
Gas Volume Units to the units to be used for gas measurement.
Page 35

Configuring the NOC Application
5. In the Well Data–Densities menu, set Gas Reference Density to the reference density of the
gas from this well.
• In Continuous mode – set for the well to be measured
• In Well Test mode – set for each well to be measured
6. To verify that gas data is being received, view the current gas volume as shown in Figure 5-1
(Well Test mode) or Figure 5-3 (Continuous mode). Ensure that the displayed value matches
the value sent by the gas measurement device.
4.8 Setting up Transient Mist Remediation
To se t up T M R:
1. Ensure that a Micro Motion meter has been installed on the gas leg, and that it is operating
correctly.
2. Follow the instructions in Section 4.7 to set up and enable gas measurement.
3. At the TMR gas meter:
a. Set the primary variable (the variable reported over the primary mA output) to drive gain.
b. Define a HART tag (software tag) for the device.
NOC Overview NOC ConfigurationUsing the DisplayBefore You Begin NOC Overview NOC ConfigurationUsing the DisplayBefore You Begin NOC Overview NOC ConfigurationUsing the DisplayBefore You Begin NOC Overview NOC ConfigurationUsing the DisplayBefore You Begin
4. Ensure that the primary mA output of the Series 3000 platform has been wired to support
HART protocol, and establish a HART connection to the TMR gas meter.
5. Refer to Figure 4-1. In the Compensations menu, select
a. Set
Drive Gain Level to the drive gain value (in percent) that represents a transient mist
condition in this process stream. To determine the best value, you may find it useful to
observe drive gain values for the TMR gas meter.
b. Set
Time Period to the number of seconds over which the transmitter will average mass
flow data.
c. Set
Add Carry-Over Totals as desired. If set to Yes, the estimated oil and water quantities
from the gas leg will be added to the net oil and net water data from the oil/water leg.
d. Set
Gas Meter HART Tag to the HART tag of the TMR gas meter.
6. To verify that drive gain data is received, view the current drive gain value as shown in
Figure 5-1 (Well Test mode) or Figure 5-3 (Continuous mode).
4.9 Performing density determination procedures
All density determination procedures are accessed from Management>Maintenance>Calibration (see
Section 3-2). When you select Density Determination from the Calibration menu:
• In Continuous mode, the Last Dates screen shown in Figure 4-2 is displayed.
• In Well Test mode, the well selection screens are shown first. After a well has been selected,
the Last Dates screen shown in Figure 4-2 is displayed.
The Last Dates screen shows the date and time of the most recent oil and density determination
procedures performed to completion on this device.
If you choose to continue, the Procedure Selection screen shown in Figure 4-3 is displayed.
If you are performing both a density determination for oil and a density determination for water, it is
typically more convenient to perform the density determination for water first.
Transient Mist Remed, and:
Net Oil Computer Supplement 31
Page 36

Configuring the NOC Application
Density Determination
Last Water Density
xxxx
Last Oil Density
xxxx
Continue?
YES NO
Density Determination
Water Density
Oil Density
Enter Water Cut
SEL HELP EXIT
Figure 4-2 Density determination – Last Dates screen
Figure 4-3 Density determination – Procedure Selection screen
4.9.1 Performing a density determination for water
There are two density determination methods for water: in-line and manual. The in-line method
requires enough water in the separator to supply a stable flowing density for the density determination
period. If there is not enough water, you must use the manual method. This section provides
instructions for both methods.
32 Micro Motion® Series 3000 MVD Transmitters
Page 37

Configuring the NOC Application
Measure & Save
Actual Rate
xxxx.x bbl/day
Water Deviation
x.xxxx g/cm3
Water Duration Ave
xx sec
START RESET EXIT
Measure & Save
Actual Water Density
x.xxxx g/cm3
Actual Temperature
xxx.x deg F
Actual Pressure
xx.xxxx PSI
Volume
xxxx.x bbl/day
START RESET EXIT
Top of screen Bottom of screen
In-line density determination for water
To perform a in-line density determination for water:
1. Ensure that the correct fluid (water) is flowing through the sensor. You may need to close the
outlet valve from the separator and wait for the phases to settle, then open the outlet valve.
2. From the Calibration menu, select
the Procedure Selection screen (see Figure 4-3) is displayed. In Well Test mode, you will be
required to select the well for which the procedure will be performed.
3. From the Procedure Selection screen, select
Density Determination and work through the screens until
Water Density.
4. From the next screen, select
Measure and Save.
5. The display now shows the current values for water density, water temperature, volume,
flowrate, and pressure (if pressure compensation for water density is enabled), plus the
configured Water Deviation and Water Duration Ave values (see Figure 4-4). Monitor the
density and temperature values, watching for the density and temperature readings to stabilize.
Note: The Water Deviation and Water Duration Ave values shown here are read-only. If you need to
change them, you must reconfigure the well data. See Section 4.3.
6. (Optional) Press
RESET to reset the volume total to 0. This enables you to monitor the amount
of fluid that remains in the separator (if the separator volume is known).
Figure 4-4 Density determination for water – Preparing to start
NOC Overview NOC ConfigurationUsing the DisplayBefore You Begin NOC Overview NOC ConfigurationUsing the DisplayBefore You Begin NOC Overview NOC ConfigurationUsing the DisplayBefore You Begin NOC Overview NOC ConfigurationUsing the DisplayBefore You Begin
7. When the density and temperature readings have stabilized, press
application will now average the density and temperature of the process fluid until a good
sample is achieved.
Net Oil Computer Supplement 33
Note: If the averaging procedure does not end automatically, you may need to verify your process
fluid or increase the Water Deviation value.
A “good sample” means that, for the configured Water Duration Ave, no two consecutive
density readings differed by more than the configured Water Deviation limit. If the water
deviation limit is exceeded, averaging is restarted.
START. The NOC
Page 38

Configuring the NOC Application
--AVERAGING--
Actual Water Density
x.xxxx g/cm3
Actual Temperature
xxx.x deg F
Actual Pressure
xx.xxxx PSI
STOP
Measure and Save
Av Watr Density @ Ref
x.xxxx g/cm3
Av Water Density at
dd-mm-yy hh:mm
Current Dens @ Ref
x.xxxxx g/cm3
Current Dens Saved
dd-mm-yy hh:mm
SAVE HELP EXIT
During this period, the screen shown in Figure 4-5 is displayed. (The current pressure value
may or may not be displayed.) You can press
to the previous screen.
Figure 4-5 Density determination for water – In process
STOP to stop the averaging. You will be returned
8. When the good sample is achieved, the results are shown on a screen similar to Figure 4-6.
This screen also displays the stored value for water density at reference temperature, and the
date and time and which this value was stored.
• To discard the data from this procedure, press
EXIT. You will be returned to the Procedure
Selection screen. From this point you can repeat the density determination procedure or
EXIT to move up the menu and return to other functions.
press
• To replace the stored value with the new value, press
SAVE.
Figure 4-6 Density determination for water – In-line procedure results
34 Micro Motion® Series 3000 MVD Transmitters
Page 39

Configuring the NOC Application
Water Density
Water Density
1.0000 g/cm3
Water Temperature
60.0 deg F
Calculate at Ref
CHG EXIT
9. If pressure compensation for oil density and water density is enabled, pressure data from the
beginning of the density determination procedure is displayed, along with the stored reference
pressure.
• Press
SAVE to save the current pressure value as the new reference pressure.
• Press
EXIT to retain the existing reference pressure.
Manual density determination for water
To perform a manual density determination for water:
1. Fill the separator with production fluid from the well to be tested, and let the phases settle.
2. Take a water sample from the bottom of the water layer or from the water trap.
3. Cover the sample container and allow the sample to cool to near-ambient temperature.
4. Measure the density and temperature of the sample, using a hygrometer and a thermometer.
5. From the Calibration menu, select
Density Determination and work through the screens until
the Procedure Selection screen (see Figure 4-3) is displayed. In Well Test mode, you will be
required to select the well for which the procedure will be performed.
6. From the Procedure Selection screen, select
7. From the next screen, select
Manually Enter.
Water Density.
8. The transmitter displays a screen similar to Figure 4-7, showing the configured reference
temperature and the stored value for water density at reference temperature. In this screen:
a. Enter the density of the water sample, in the units shown on screen.
b. Enter the temperature of the water sample, in the units shown on screen.
c. Select
Calculate at Ref, then press CHG.
NOC Overview NOC ConfigurationUsing the DisplayBefore You Begin NOC Overview NOC ConfigurationUsing the DisplayBefore You Begin NOC Overview NOC ConfigurationUsing the DisplayBefore You Begin NOC Overview NOC ConfigurationUsing the DisplayBefore You Begin
Figure 4-7 Density determination for water – Manual procedure
Net Oil Computer Supplement 35
Page 40

Configuring the NOC Application
Manually Enter
Water Density @ Ref
x.xxxx g/cm3
Water Density at
dd-mm-yy hh:mm
Current Dens @ Ref
x.xxxxx g/cm3
Current Dens Saved
dd-mm-yy hh:mm
SAVE HELP EXIT
9. The NOC application converts the observed water density to water density at reference
temperature, and displays a screen similar to Figure 4-8. This screen also displays the stored
value for water density at reference temperature, and the date and time at which this value was
stored.
• To replace the stored value with the new value, press
• To discard the data from this procedure, press
Selection screen. From this point you can repeat the density determination procedure or
EXIT to move up the menu and return to other functions.
press
Figure 4-8 Density determination for water – Manual procedure results
SAVE.
EXIT. You will be returned to the Procedure
4.9.2 Performing a density determination for oil
To perform a density determination for oil:
1. Ensure that the correct fluid (oil) is flowing through the sensor. You may need to drain water
from the separator.
2. From the Calibration menu, select
Density Determination and work through the screens until
the Procedure Selection screen (see Figure 4-3) is displayed. In Well Test mode, you will be
required to select the well for which the procedure will be performed.
3. From the Procedure Selection screen, select
Oil Density. The screen shown in Figure 4-9 is
displayed.
36 Micro Motion® Series 3000 MVD Transmitters
Page 41

Configuring the NOC Application
Oil Density
Actual Density
x.xxxx g/cm3
Actual Temperature
xxx.x degF
Actual Pressure
xx.xxxx PSI
Volume
x.xxx bbl
START RESET EXIT
Oil Density
Actual Rate
xxx.x bbl/day
Oil Deviation
x.xxxx g/cm3
Oil Duration Ave
xx sec
START RESET EXIT
Top of screen Bottom of screen
Figure 4-9 Density determination for oil – Preparing to start
NOC Overview NOC ConfigurationUsing the DisplayBefore You Begin NOC Overview NOC ConfigurationUsing the DisplayBefore You Begin NOC Overview NOC ConfigurationUsing the DisplayBefore You Begin NOC Overview NOC ConfigurationUsing the DisplayBefore You Begin
4. The display now shows the current values for oil density, oil temperature, volume, and
flowrate (see Figure 4-9), plus the configured Oil Deviation and Oil Duration Ave values.
Monitor the density and temperature values, watching for the density and temperature readings
to stabilize.
Note: The Oil Deviation and Oil Duration Ave values shown here are read-only. If you need to change
them, you must reconfigure the well data. See Section 4.3.
5. (Optional) Press
RESET to reset the volume total to 0. This enables you to monitor the amount
of fluid that remains in the separator (if the separator volume is known).
6. When the density reading has stabilized at a level that indicates that live oil is flowing through
the sensor, press
START. The NOC application will now average the density and temperature
of the process fluid until a good sample is achieved.
A “good sample” means that, for the configured Oil Duration Ave, no two consecutive density
readings differed by more than the configured Oil Deviation limit. If the oil deviation limit is
exceeded, averaging is restarted.
Note: If the averaging procedure does not end automatically, you may need to verify your process
fluid or increase the Oil Deviation value.
During this period, the screen shown in Figure 4-10 is displayed. You can press
the averaging. You will be returned to the previous screen.
STOP to stop
Net Oil Computer Supplement 37
Page 42

Configuring the NOC Application
--AVERAGING--
Actual Density
x.xxxx g/cm3
Actual Temperature
xxx.x deg F
Actual Pressure
xxx.xxx bbl/hr
External Water Cut
x.xxxx %
STOP
Figure 4-10 Density determination for oil – In process
7. If you are using the density-based water cut, take a sample of the fluid in the pipe during this
averaging period, then measure the water cut of the sample. You can use any standard
procedure (e.g., centrifuge, distillation, Karl-Fischer, etc.) to measure the water cut. Measure
in % volume.
Note: The accuracy of this water cut value directly affects the accuracy of the NOC data. Be sure to
use a representative sample and measure carefully.
If you are using a water cut monitor, this sampling procedure is optional. You may use either
the water cut data measured by the monitor or water cut data from the sample.
8. When the good sample is achieved, the results are shown on the a screen similar to
Figure 4-11.
• To discard the data from this procedure, press
EXIT. You will be returned to the Procedure
Selection screen. From this point you can repeat the density determination procedure or
press EXIT to move up the menu and return to other functions.
• To continue with this density determination procedure, press
SAVE.
38 Micro Motion® Series 3000 MVD Transmitters
Page 43

Configuring the NOC Application
Measure and Save
Average Oil Density
x.xxxx g/cm3
Average Temperature
xxx.x degF
Volume
x.x g/cm3
Actual Rate
xxx.x bbl/day
SAVE HELP EXIT
Figure 4-11 Density determination for oil – Interim results
9. If a water cut monitor is enabled, water cut data from the averaging period is displayed.
NOC Overview NOC ConfigurationUsing the DisplayBefore You Begin NOC Overview NOC ConfigurationUsing the DisplayBefore You Begin NOC Overview NOC ConfigurationUsing the DisplayBefore You Begin NOC Overview NOC ConfigurationUsing the DisplayBefore You Begin
• Press
SAVE to save this data for use in density determination. The reference density of dry
oil from this density determination will then be computed and displayed, along with the
current values.
- Press
- Press
• Press
SAVE to store the new value for reference density of oil.
EXIT to discard the new value.
EXIT to use water cut data from the manual sampling procedure.
10. If pressure compensation for oil density and water density is enabled, pressure data from the
beginning of the density determination procedure is displayed, along with the stored reference
pressure.
• Press
SAVE to save the current pressure value as the new reference pressure.
Note: This will overwrite the value stored during density determination for water.
• Press
11. If neither is enabled, press
EXIT to retain the existing reference pressure.
OK.
12. You will be returned to the Procedure Selection screen. At this point:
• If you are using density-based water cut, you must complete Steps 13 through 15.
Continue with Step 13,
• If you are using a water cut monitor and you saved the average water cut and the reference
density of oil during Step 9, the density determination procedure is complete. However,
you can still enter a manual water cut value and apply it if desired, as described in Steps 13
through 15.
13. At the Procedure Selection screen, select
Net Oil Computer Supplement 39
displayed, with the date and time of the current density determination procedure.
Enter Water Cut. The screen shown in Figure 4-12 is
Page 44

Configuring the NOC Application
Enter Water Cut
Water Cut
xx.xx %
Apply to Sample Taken
dd-mmm-yy hh:mm
Calculate at Ref
CHG EXIT
Oil Density
Oil Density @ Ref
x.xxxx g/cm3
Oil Density at
dd-mm-yy hh:mm
Current Dens @ Ref
x.xxxxx g/cm3
Current Dens Saved
dd-mm-yy hh:mm
SAVE HELP EXIT
Figure 4-12 Density determination for oil – Water cut entry screen
14. Enter the water cut measured in Step 7, then press
15. Select
Calculate at Ref, then press SEL. The NOC application uses this water cut data to
SAVE.
convert the observed oil density to dry oil density at reference temperature, and displays a
screen similar to Figure 4-13. This screen also displays the stored value for oil density at
reference temperature, and the date and time at which this value was stored.
• To replace the stored value with the new value, press
• To discard the data from this procedure, press
EXIT. You will be returned to the Procedure
Selection screen. From this point you can repeat the density determination procedure or
EXIT to move up the menu and return to other functions.
press
Figure 4-13 Density determination for oil – Procedure results
SAVE, then press YES to confirm.
40 Micro Motion® Series 3000 MVD Transmitters
Page 45

Chapter 5
Operation Mode – NOC
5.1 About this chapter
This chapter explains how to use the NOC application to run a well test or perform continuous
measurement. The following topics are discussed:
• For Well Test mode:
- Well testing overview – see Section 5.2
- Running a well test – see Section 5.2.1
- Viewing well test data – see Section 5.2.2
- Time periods for average, minimum, maximum, and total values – see Section 5.2.3
- Other activity during a well test – see Section 5.2.4
- Recalculating well test data – see Section 5.2.5
• For Continuous mode:
Troubleshooting IndexSeries 3000 MenusNOC Operation
- Continuous mode overview – see Section 5.3
- Viewing Continuous mode measurement data – see Section 5.3.1
- Pausing and resuming Continuous mode measurement – see Section 5.3.2
- Resetting, saving, and managing Continuous mode time periods – see Section 5.3.3
- Other activity during Continuous mode measurement – see Section 5.3.4
- Viewing archive records – see Section 5.3.5
- Recalculating Continuous mode measurement data – see Section 5.3.6
Additionally, this chapter provides instructions for changing modes – see Section 5.4.
5.2 Well testing overview
The Well Performance Measurement menu under the View menu, shown in Figures 5-1 and 5-2, is
used to run well tests.
A well test must be started and stopped manually (or via Modbus).
Well tests are identified by the well and by the start date and time. You can save up to three well tests
per well. If you run additional well tests on a single well, each new well test will overwrite the oldest
well test.
Net Oil Computer Supplement 41
Page 46

Operation Mode – NOC
(1) Displayed only if gas measurement is
enabled.
(2) Displayed only if the Transient Mist
Remediation option was purchased.
Figure 5-1 Well Performance Measurement menu – Selecting the well
View menu
Well Performance Meas
Start Well Test View Well Tests
Well Selection screensWell Selection screens
EXIT
Wells 1 to 12
Wells 13 to 24
Wells 25 to 36
Wells 37 to 48
Well #: Well name
Well #: Well name
Well #: Well name
Well #: Well name
...
Well name
Last Test Time Date
to Running a Well Test
Wells 1 to 12
Wells 13 to 24
Wells 25 to 36
Wells 37 to 48
Well #: Well name
Well #: Well name
Well #: Well name
Well #: Well name
...
Well test date time
Well test date time
Well test date time
View Production Meas
Quick View
Net Oil
Water Cut
Gross Flow
Net Water
Drive Gain
Density
Temperature
Back Flow
Mass Flow
Gas Volume
TMR Flow
TMR Drive Gain
(1)
(2)
(2)
Uncorrected Flow
Test Times
42 Micro Motion® Series 3000 MVD Transmitters
Page 47

Operation Mode – NOC
Stop Well Test?
Well name
Last Test Time Date
START
On Test
Test Started Date Time
Test Time Elapsed Hour Min
STOP
YESNO
EXIT
Return to Well Test
View Well Tests
View Current Test
Recalculate Well Test
VIEW
Actual Net Oil Rate
Average Net Oil Rate
Actual Water Cut
Average Water Cut
Actual Gross Rate
Average Gross Rate
Actual Density
Actual Temperature
Actual Pressure
(1)
EXIT
RETURN
VIEW
CURRENT
View Production Meas
Quick View
Net Oil
Water Cut
Gross Flow
Net Water
Drive Gain
Density
Temperature
Back Flow
Mass Flow
Gas Volume
(2)
TMR Flow
(3)
TMR Drive Gain
(3)
Uncorrected Flow
Test Times
VIEW
TESTS
Well selection screens
Well test date time
Well test date time
Well test date time
SEL
EXIT to View menu
EXIT
from View menu
Test Stop
Test Started Date Time
Test Time Elapsed Hour Min
NEXT
START
EXIT
Selects next
well for testing
Test this well
again
to Start Well
Test screen
from Well Selection screens
RETURN
(1) Displayed only if pressure
compensation for oil density and
water density is enabled.
(2) Displayed only if gas measurement is
enabled.
(3) Displayed only if the Transient Mist
Remediation option was purchased.
Figure 5-2 Well Performance Measurement menu – Running the well test
Troubleshooting IndexSeries 3000 MenusNOC Operation
Net Oil Computer Supplement 43
Page 48

Operation Mode – NOC
5.2.1 Running a well test
To run a well test:
1. Ensure that the NOC application is set for Well Test mode, and that all necessary data for the
well has been configured.
2. As shown in Figure 5-1:
a. From the View menu, select
b. Select
Start Well Test.
Well Performance Measurement.
c. Navigate to the well to be tested.
3. As shown in Figure 5-2:
a. Press
START. The well test screen is displayed, showing the test start time and the elapsed
time.
b. To end the well test, press
STOP, then press YES to confirm. The final well test values will
be automatically written to memory.
Well test records contain snapshots of actual values. The snapshots are written to memory every 15
minutes. These snapshot values are required for recalculation, but are not available for viewing.
Therefore, for meaningful recalculation, ensure that the well test is running for more than 15 minutes
so that the well test record will include snapshots.
Note: For background information on the recalculation feature, see Section 2.3.7.
During the well test (see Figure 5-2):
• You can press
• You can press
VIEW to see current test data
EXIT to:
- View more detailed data on the current test (see Section 5.2.2)
- Exit to the View menu. From the View menu, press
EXIT to return to the well test screen.
After the well test (see Figure 5-2):
• To run another test on the same well, press
• To test the next well (as defined by the well number), press
START, then press YES to confirm.
NEXT, then start the well test as
described here.
• To exit the well test menu, press
EXIT.
At any time, you can view and recalculate well test data for completed tests.
44 Micro Motion® Series 3000 MVD Transmitters
Page 49

Operation Mode – NOC
5.2.2 Viewing well test data
You can access well test data at several points in the menu.
Note: You can also read well test data via Modbus or report actual and average process variables by
assigning them to a milliamp or frequency output.
To access basic data for the current well test, press View from the On Test screen (see Figure 5-2).
The values listed in Table 5-2 are displayed.
Table 5-1 View data – Well Test mode
Process variable Definition
Actual net oil rate Current net oil flow rate. May or may not include oil carry-over, depending on TMR
configuration.
Average net oil rate Average net oil flow rate, calculated from the beginning of the well test. May or may not
include oil carry-over, depending on TMR configuration.
Actual water cut Current water cut used in net oil calculations. May be either density-based or from the water
cut monitor, depending on water cut configuration.
Average water cut Average water cut value, calculated from the beginning of the well test.
Actual gross rate Current flow rate of the production fluid (all process fluid through the NOC sensor). May or
may not include TMR carry-over data, depending on TMR configuration. Does not include gas
data.
Average gross rate Average flow rate of production fluid, calculated from the beginning of the well test. May or
may not include TMR carry-over data, depending on TMR configuration. Does not include gas
data.
Actual density Current density of the production fluid
Actual temperature Current temperature of the production fluid
Actual pressure Current pressure from the external pressure device (if available)
Troubleshooting IndexSeries 3000 MenusNOC Operation
To access more detailed data for either the current test or a stored test, use the View Production
Measurement screen. You can access this screen from either:
• The Well Performance Measurement screen (see Figure 5-1)
• The On Test screen (see Figure 5-2)
The View Production Measurement screen provides:
• Quick View data, as listed in Table 5-2
• Production data for several other process variables, as listed in Table 5-3
• TMR data, as listed in Table 5-4
Net Oil Computer Supplement 45
Page 50

Operation Mode – NOC
Table 5-2 Quick View data – Well Test mode
Process variable Definition
Average net oil rate Current net oil flow rate. May or may not include oil carry-over, depending on TMR
configuration.
Net oil total Total net oil, by volume, calculated from the beginning of the well test. May or may not include
oil carry-over, depending on TMR configuration.
Average water cut Average water cut value, calculated from the beginning of the well test.
Average gross rate Average flow rate of production fluid, calculated from the beginning of the well test. May or
may not include TMR carry-over data, depending on TMR configuration. Does not include gas
data.
Gross total Total production fluid, by volume, calculated from the beginning of the well test. May or may
not include TMR carry-over data, depending on TMR configuration. Does not include gas
data.
Test started Date and time that the well test was started
Test time elapsed Hours and minutes that the well test has been running
Transient bubble time Hours and minutes that TBR has been active
Water cut overrange (Water cut monitor only) Hours and minutes that the water cut has been above the configured
Transient mist time Hours and minutes that TMR has been active
External Water Cut Limit
Table 5-3 Production data – Well Test mode
Val ues
Min time /
Process variable
Net oil Y YYY YY Y
Water cut Y YYY YY
Gross flow Y Y Y Y Y Y Y
Net water Y Y Y Y Y Y Y
Drive gain Y Y Y Y
Density Y Y Y Y Y Y
Temperature Y Y Y Y Y Y
Back flow Y Y Y Y
Mass flow Y Y Y Y Y Y Y
Gas volume Y YYY YY Y
TMR drive gain Y Y Y Y Y Y
Uncorrected flow
Uncorrected oil Y Y Y Y Y Y Y
Uncorrected water Y Y Y Y Y Y Y
Uncorrected water cut Y Y Y Y Y Y
Uncorrected gross Y Y Y Y Y Y Y
Actual Avg Min
date Max
Max time /
date Total
46 Micro Motion® Series 3000 MVD Transmitters
Page 51

Operation Mode – NOC
Table 5-3 Production data – Well Test mode continued
Val ues
Process variable
Test times
Test started Timestamp
Test time elapsed Hours and minutes
Transient bubble time Hours and minutes
Water cut overrange Hours and minutes
Transient mist time Hours and minutes
Actual Avg Min
Min time /
date Max
Max time /
date Total
Table 5-4 TMR data – Well Test mode
Process variable Definition
Mass flow rate Current mass flow rate from the gas meter
2-phase mass total Total mass of liquid and gas in the gas stream during all TMR intervals
TMR mass total Calculated mass of gas in the gas stream during all TMR intervals
Mass carry-over Total mass of liquid in the gas stream during all TMR intervals (2-phase mass total minus TMR
Oil volume carry-over Volume of oil in gas stream during all TMR intervals
Water volume carry-over Volume of water in gas stream during all TMR intervals
Transient mist time Hours and minutes that TMR has been active
mass total)
Troubleshooting IndexSeries 3000 MenusNOC Operation
5.2.3 Time periods for average, minimum, maximum, and total values
For the current test, running average, minimum, maximum, and total values for each process variable
are calculated from the beginning of the test. When the well test is stopped, the final values will be
stored with the test data.
5.2.4 Other activity during a well test
Between well tests, you can use the Exit button to move between the Well Performance Measurement
menu and the View menu. While a well test is in progress, you can use the Exit button on the Return
to Well Test screen to move between the well test screens and the View menu.
From the View menu, you can perform any available actions.
At any point from the well test screens, including during a well test, you can press the Security button
to access the Configuration and Maintenance menus. The system does not prevent configuration
changes, calibrations, or other procedures. However, many actions (e.g., reconfiguring well data) will
cause discontinuities in the well test data, and many procedures will interfere with data collection. If
you need to change system configuration or perform a maintenance procedure:
1. Stop the well test.
2. Make the required configuration changes or perform the required procedures.
3. Start a new well test.
Net Oil Computer Supplement 47
Page 52

Operation Mode – NOC
5.2.5 Recalculating well test data
You can recalculate well test data for any stored well test. You can perform the recalculation during a
well test or between well tests. To recalculate well test data:
1. Refer to Figure 5-2 and select
2. Navigate to the well test you want to recalculate.
Recalculate Well Test.
3. Select
Recalc Parameters and set recalculation values as desired. See Table 5-9. You can set
one, several, or all of the recalculation values. If you do not assign a new value, the original
value is used during recalculation. When you have finished setting recalculation values, press
EXIT.
4. Select
Perform Recalculation. When recalculation is complete, the following message is
displayed:
Data Recalculation is complete.
Press OK to view and save the
recalculation results for this well.
Press OK to continue.
5. To view the results of the recalculation, select
press
EXIT.
View Recalc Data. When you are finished,
6. At this point, you can save or discard the results of the recalculation.
• To save the results of the recalculation, select
Save Recalc Data, then press EXIT. A
recalculation record will be written to the list of well tests for this well, and can be viewed
using the View Well Test menu shown in Figure 5-2. The recalculation record is displayed
with the original timestamp and the term REC.
• To discard the results of the recalculation, press
EXIT.
Note the following:
• Recalculation is based on the snapshot records written every 15 minutes during the well test.
• Only 96 snapshot records (24 hours of data) are stored. If the well test runs more than 24
hours, older snapshots are overwritten. Accordingly, the recalculation procedure is applied
only to data from the last 24 hours of the well test.
• You may recalculate results for each well test, and you may recalculate each well test more
than once.
• Only one recalculation record can be saved per well. If you perform a second recalculation and
save the results, the existing recalculation record will be overwritten. Be sure to record or
download (via Modbus) the existing recalculation record, if required, before performing the
next recalculation for the current well.
• TMR carry-over totals are not recalculated. If carry-over totals were added to the original oil
and water totals, the TMR carry-over data is not included in the recalculated totals.
48 Micro Motion® Series 3000 MVD Transmitters
Page 53

Operation Mode – NOC
Table 5-5 Recalculation parameters – Well Test mode
Parameter Configurable? Definition
Original Ref Temp
Recalc Reference Temp Yes Reference temperature to used for recalculation
Orig Water Density
Recalc Water Density Yes Reference density of water to be used for recalculation
Original Oil Density
Recalc Oil Density Yes Reference density of oil to be used for recalculation
Original Press Comp Oil
Recalc Press Comp Oil Yes Pressure compensation factor for oil to be used for recalculation
Original Ref Pressure
Recalc Ref Pressure Yes Reference pressure to be used for recalculation
Original Gas Ref Density
Recalc Gas Ref Dens Yes Reference density of gas to be used for recalculation
Original Factor for Oil
Recalc Factor for Oil Yes Shrinkage factor for oil to be used for recalculation
Original Factor for Water
Recalc Factor for Water Yes Shrinkage factor for water to be used for recalculation
(1)
(1)
(1)
No Reference temperature for NOC calculations applied during data
collection
No Reference density of water from this well applied during data collection
No Reference density of oil from this well applied during data collection
(1)
No Pressure compensation factor for oil applied during data collection
(1)
No Reference pressure applied during data collection
(1)
No Reference density of gas from this well applied during data collection
(1)
No Shrinkage factor for oil from this well applied during data collection
(1)
No Shrinkage factor for water from this well applied during data collection
Troubleshooting IndexSeries 3000 MenusNOC Operation
(1) If the value was changed during the well test, the value displayed here is the value in use when the well test was stopped.
5.3 Continuous mode measurement overview
In Continuous mode, measurement begins as soon as the system is up and running, or as soon as the
system is configured for Continuous mode measurement. You cannot start and stop Continuous mode
measurement. However, you can:
• Pause and resume measurement
• View current data
• Reset the start time for summary variables
• Write archive records that summarize well production from the beginning of the Continuous
mode time period up to the point the record is written.
• View archive records
• Recalculate archive records
Continuous mode measurement is managed from the Well Performance Measurement menu under the
View menu, shown in Figure 5-3.
Net Oil Computer Supplement 49
Page 54

Operation Mode – NOC
View menu
Well Performance Meas
View Production Meas
Net Oil
Water Cut
Gross Flow
Net Water
Drive Gain
Density
Temperature
Back Flow
Mass Flow
Gas Volume
(1)
TMR Flow
(2)
TMR Drive Gain
(2)
Uncorrected Flow
Quick View
Average Net Oil Rate
Net Oil Total
Average Water Cut
Average Gross Rate
Gross Total
Average/Total Since
Test Time Elapsed
Transient Bubble Time
Water Cut Overrange
(3)
Total Paused Time
Transient Mist Time
(2)
ResetPause / Resume
Pause / Resume
Production Meas Resumed
RESUME
Production Measurements
are on
PAUSE
Paused Time Hour Min
PAUSE
RESUME
PAUSE
Last Reset All Date Time
Elapsed Time Hour Min
Paused Time Hour Min
EXIT
Save
(4)
View Archives
(5)
Recalculate
(5)
(1) Displayed only if gas measurement is enabled.
(2) Displayed only if the Transient Mist Remediation option was purchased.
(3) Displayed only if a water cut monitor is enabled.
(4) See Figure 5-5 and Section 5.3.5.
(5) Displayed only if the Save function has been performed. For more information, see Figure 5-5 and Section 5.3.5.
Figure 5-3 Well Performance Measurement menu – Continuous mode measurement
50 Micro Motion® Series 3000 MVD Transmitters
Page 55

Operation Mode – NOC
5.3.1 Viewing Continuous mode measurement data
To view basic data from Continuous mode measurement, use the Quick View menu shown in
Figure 5-3. Process variables available from the Quick View menu are listed in Table 5-6.
Note: You can also read Continuous mode measurement data via Modbus or report actual and
average process variables by assigning them to a milliamp or frequency output.
Table 5-6 Quick View data – Continuous mode
Process variable Definition
Average net oil rate Average net oil flow rate, calculated from the beginning of Continuous mode measurement or
from the last reset. May or may not include oil carry-over, depending on TMR configuration.
Net oil total Total net oil, by volume, calculated from the beginning of Continuous mode measurement or
from the last reset. May or may not include oil carry-over, depending on TMR configuration.
Average water cut Average water cut value, calculated from the beginning of Continuous mode measurement or
from the last reset. May be either density-based or from the water cut monitor, depending on
water cut configuration.
Average gross rate Average flow rate of production fluid, calculated from the beginning of Continuous mode
measurement or from the last reset. May or may not include TMR carry-over data, depending
on TMR configuration. Does not include gas data.
Gross total Total production fluid, by volume, calculated from the beginning of Continuous mode
measurement or from the last reset. May or may May or may not include TMR carry-over data,
depending on TMR configuration. Does not include gas data.
Average/total since Timestamp of beginning of Continuous mode measurement or the last Reset All.
Test time elapsed Hours and minutes since this Continuous mode measurement period was started
Transient bubble time Hours and minutes that TBR has been active
Water cut overrange (Water cut monitor only) Hours and minutes that the water cut has been above the configured
External Water Cut Limit
Total paused time Hours and minutes that measurement has been paused
Transient mist time Hours and minutes that TMR has been active
Troubleshooting IndexSeries 3000 MenusNOC Operation
To view more detailed data, use the View Production Measurement menu shown in Figure 5-3. This
screen provides:
• Production data for several other process variables, as listed in Table 5-7
• TMR data, as listed in Table 5-8
Net Oil Computer Supplement 51
Page 56

Operation Mode – NOC
Table 5-7 Production data accessible via View Production Measurement screen – Continuous mode
Val ues
Min
time/
Process variable
Net oil YYYYYYYYY
Water cut YYYYYY Y
Gross flow YYYYYYYYY
Net water YYYYYYYYY
Drive gain Y Y Y Y Y
Density YYYYYY Y
Temperature YYYYYY Y
Back flow Y YYYYY
Mass flow YYYYYYYYY
TMR drive gainYYYYYY
Gas volume YYYYYYYYY
Uncorrected flow
Uncorrected oilYYYYYYYYY
Uncorrected waterYYYYYYYYY
Uncorrected water
cut
Uncorrected grossYYYYYYYYY
Actual Avg Min
YYYYYY Y
date Max
Max
time/
date Total
Reset
time/
date Inventory
Table 5-8 TMR data – Continuous mode
Process variable Definition
Mass flow rate Current mass flow rate from the gas meter
2-phase mass total Total mass of liquid and gas in the gas stream during all TMR intervals
TMR mass total Calculated mass of gas in the gas stream during all TMR intervals
Mass carry-over Total mass of liquid in the gas stream during all TMR intervals (2-phase mass total minus TMR
mass total)
Oil volume carry-over Volume of oil in gas stream during all TMR intervals
Water volume carry-over Volume of water in gas stream during all TMR intervals
Transient mist time Hours and minutes that TMR has been active
5.3.2 Pausing and resuming Continuous mode measurement
Use the Pause / Resume option shown in Figure 5-3 to pause and resume Continuous mode
measurement. While measurement is paused, no data is collected, displayed, or stored, and average,
minimum, maximum, total, or inventory values are not updated.
You can pause and resume measurement as often as you wish.
52 Micro Motion® Series 3000 MVD Transmitters
Page 57

Operation Mode – NOC
Archive Record 1
Timestamp M
Reset Beginning of Continuous mode measurement
Save Save
Archive Record 2
Timestamp N
Archive Record 3
Timestamp O
Save Save
Overwrites Archive Record 1
Timestamp P
Snapshots
5.3.3 Resetting, saving, and managing Continuous mode time periods
Running average, minimum, maximum, and total values are calculated from the beginning of
Continuous mode measurement.
Note: Inventory values are calculated from the beginning of continuous mode measurement until reset
by digital communications (Modbus coil 4 or HART command 242).
You can reset the start time for these running calculations:
• To set a new start time for all process variables at once:
a. Select
Reset from the Well Performance Measurement screen shown in Figure 5-3.
b. Press the
RESET button on that screen, then press YES to confirm.
• To set a new start time for one process variable only:
a. Navigate to the process monitor screen where the process variable data is displayed.
b. Press the
RESET button on that screen.
Note: Not all process variables can be reset individually. If the Reset button is not displayed, the
system does not allow individual reset for that process variable.
At any time during Continuous mode measurement, you can save the current values of the summary
variables to an archive record. To do this, select
SAVE from the Well Performance Measurement
menu as shown in Figure 5-3. The archive record is then available for viewing or recalculation.
Up to three archive records can be stored. Archive records are identified by the save time timestamp.
Archive records also contain snapshots of actual values. The snapshots are written to memory every
15 minutes. These snapshot values are required for recalculation, but are not available for viewing.
Therefore, for meaningful recalculation, ensure that the Continuous mode time period is longer than
15 minutes so that the archive record will include snapshots.
Figure 5-4 illustrates the relationship between Save, Reset, snapshots, and archive records.
Figure 5-4 Continuous mode timeline and time periods
Troubleshooting IndexSeries 3000 MenusNOC Operation
Net Oil Computer Supplement 53
Page 58

Operation Mode – NOC
5.3.4 Other activity during Continuous mode measurement
During continuous measurement, you can use the
screen to move between the continuous measurement screens and the View menu. From the View
menu, you can perform any available actions.
At any point from the continuous measurement screens, you can press the Security button to access
the Configuration and Maintenance menus. The system does not prevent configuration changes,
calibrations, or other procedures.
However, many actions (e.g., reconfiguring well data) will cause discontinuities in the data, and many
procedures will interfere with data collection. If you need to change system configuration or perform
a maintenance procedure:
1. Pause measurement.
2. If desired, save an archive record.
3. Make the required configuration changes or perform the required procedures.
4. Reset all process variables.
5. Resume measurement.
5.3.5 Viewing archive records
EXIT button on the Well Performance Measurement
To view archive records, refer to Figure 5-5 and:
1. Select
View Archives from the Well Performance Measurement menu.
2. Specify the archive record you want to view.
3. Select
Quick View or the specific process variable you want to view.
54 Micro Motion® Series 3000 MVD Transmitters
Page 59

Operation Mode – NOC
View menu
Well Performance Meas
EXIT
View Archives Recalculate
Timestamp
Timestamp
Timestamp
Timestamp REC
(1)
Quick View
Net Oil
Water Cut
Gross Flow
Net Water
Drive Gain
Density
Temperature
Back Flow
Mass Flow
Gas Volume
(2)
TMR Flow
(3)
TMR Drive Gain
(3)
Uncorrected Flow
Timestamp
Timestamp
Timestamp
Recalc Parameters
Original Ref Temp
Recalc Reference Temp
Orig Water Density
Recalc Water Density
Original Oil Density
Recalc Oil Density
Original Press Comp Oil
Recalc Press Comp Oil
Original Ref Pressure
Recalc Ref Pressure
Original Gas Ref Density
Recalc Gas Ref Dens
Original Factor for Oil
Recalc Factor for Oil
Original Factor for Water
Recalc Factor for Water
Perform Recalculation
View Recalc Data
Net Oil
Water Cut
Gross Flow
Net Water
Drive Gain
Density
Temperature
Back Flow
Mass Flow
Gas Volume
Uncorrected Flow
Save Recalc Data
(1) Displayed only if a recalculation record has been saved.
(2) Displayed only if gas measurement is enabled.
(3) Displayed only if the Transient Mist Remediation option was purchased.
Figure 5-5 Archive records – Continuous mode measurement
Troubleshooting IndexSeries 3000 MenusNOC Operation
Net Oil Computer Supplement 55
Page 60

Operation Mode – NOC
5.3.6 Recalculating Continuous mode data
To recalculate Continuous mode data, refer to Figure 5-5 and:
1. Select
2. Specify the archive record you want to recalculate.
3. Select
one, several, or all of the recalculation values. If you do not assign a new value, the original
value is used during recalculation. When you have finished setting recalculation values, press
EXIT.
Recalculate from the Well Performance Measurement menu.
Recalc Parameters and set recalculation values as desired. See Table 5-9. You can set
4. Select
Perform Recalculation. When recalculation is complete, the following message is
displayed:
Data Recalculation is complete.
Press OK to view and save the
recalculation results for this well.
Press OK to continue.
5. To view the results of the recalculation, select
EXIT.
press
View Recalc Data. When you are finished,
6. At this point, you can save or discard the results of the recalculation.
• To save the results of the recalculation, select
Save Recalc Data, then press EXIT. A
recalculation record will be written to archives, and can be viewed using the View
Archives option described in Section 5.3.5. The recalculation record is displayed with the
original timestamp and the term REC, as shown in Figure 5-5.
• To discard the results of the recalculation, press
EXIT.
Note the following:
• Recalculation is based on the snapshot records written every 15 minutes during the Continuous
mode measurement period.
• Only 96 snapshot records (24 hours of data) are stored. If the measurement period runs more
than 24 hours, older snapshots are overwritten. Accordingly, the recalculation procedure is
applied only to data from the last 24 hours of the measurement period.
• You may recalculate results for each archive record, and you may recalculate each archive
record more than once.
• Only one recalculation record can be saved. If you perform a second recalculation and save the
results, the existing recalculation record will be overwritten. Be sure to record or download
(via Modbus) the existing recalculation record, if required, before performing another
recalculation.
• TMR carry-over totals are not recalculated. If carry-over totals were added to the original oil
and water totals, the TMR carry-over data is not included in the recalculated totals.
56 Micro Motion® Series 3000 MVD Transmitters
Page 61

Operation Mode – NOC
Table 5-9 Recalculation parameters – Continuous mode measurement
Parameter Configurable? Definition
Original Ref Temp
Recalc Reference Temp Yes Reference temperature to used for recalculation
Orig Water Density
Recalc Water Density Yes Reference density of water to be used for recalculation
Original Oil Density
Recalc Oil Density Yes Reference density of oil to be used for recalculation
Original Press Comp Oil
Recalc Press Comp Oil Yes Pressure compensation factor for oil to be used for recalculation
Original Ref Pressure
Recalc Ref Pressure Yes Reference pressure applied to be used for recalculation
Original Gas Ref
(1)
Density
Recalc Gas Ref Dens Yes Reference density of gas to be used for recalculation
Original Factor for Oil
Recalc Factor for Oil Yes Shrinkage factor for oil to be used for recalculation
Original Factor for Water
Recalc Factor for Water Yes Shrinkage factor for water to be used for recalculation
(1)
(1)
(1)
No Reference temperature for NOC calculations applied during data
collection
No Reference density of water applied during data collection
No Reference density of oil applied during data collection
(1)
No Pressure compensation factor for oil applied during data collection
(1)
No Reference pressure applied during data collection
No Reference density of gas from this well applied during data collection
(1)
No Shrinkage factor for oil applied during data collection
(1)
No Shrinkage factor for water applied during data collection
Troubleshooting IndexSeries 3000 MenusNOC Operation
(1) If the value was changed during the measurement period, the value displayed here is the value in use when the archive record was
saved.
5.4 Changing modes
Changing from Well Test mode to Continuous mode, or from Continuous mode to Well Test mode,
affects current measurement and data collection. To change modes, follow the instructions in this
section.
To change from Well Test mode to Continuous mode:
1. If a well test is running, it will be stopped automatically when the mode is changed.
2. Perform all required or desired recalculations.
3. Well test data will be unavailable from the display while the system is in Continuous mode.
Record all required or desired well test data to an external system.
4. Change
Mode of Operation to Continuous Mode.
To change from Continuous mode to Well Test mode:
1. If desired, save an archive record.
2. Perform all required or desired recalculations.
3. Continuous mode data will be unavailable from the display while the system is in Well Test
mode. Record all required or desired data to an external system.
4. Change
Mode of Operation to Well Test Mode.
Net Oil Computer Supplement 57
Page 62

58 Micro Motion® Series 3000 MVD Transmitters
Page 63

Chapter 6
Diagnostics and Troubleshooting
6.1 About this chapter
This chapter provides information on the status alarms associated with the NOC application.
Note: For information on diagnostics or troubleshooting for the Series 3000 platform, see the manual
entitled Series 3000 MVD Transmitters and Controllers: Configuration and Use Manual.
6.2 NOC status alarms
Table 6-1 lists all status alarms associated with the NOC application, with descriptions and suggested
user actions.
For information on other Series 3000 status alarms, see the manual entitled Series 3000 MVD
Transmitters and Controllers: Configuration and Use Manual.
Troubleshooting IndexSeries 3000 MenusNOC Operation
Table 6-1 Process alarms
Alarm
number
A136 Power Outage The power was off for at least 30 seconds. No action required.
A137 Measurements
A138 TBR Active The drive gain has exceeded the configured TBR
A139 Water Cut
A140 TMR active The drive gain from the TMR gas meter has
Maintenance
menu listing Description User actions
Continuous mode measurements are paused. No action required. If desired,
Paused
Overrange
threshold and the configured TBR action has
been implemented.
The water cut measured by the water cut monitor
is above the configured External Water Cut Limit.
exceeded the configured TMR threshold.
resume measurement.
No action required.
No action required.
No action required.
Net Oil Computer Supplement 59
Page 64

60 Micro Motion® Series 3000 MVD Transmitters
Page 65

Appendix A
Well Performance Meas
Start Well Test
View Well Tests
Recalculate Well Test
EXIT
< >
>
>
View Menu Management Menu
Well Performance Meas
View Production Meas
Quick View
Pause / Resume
Reset
Save
EXIT
< >
>
>
View Menu Management Menu
Continuous mode Well Test mode
Series 3000 Menu Flowcharts
A.1 Overview
This appendix provides menu flowcharts for the Series 3000 display when the NOC application is
installed:
• Startup display – see Figure A-1
• View menu – see Figure A-2
• Management menu, top level – see Figure A-3
• Configuration menu – see Figures A-4 through A-7
• Maintenance menu – see Figure A-8
A.2 Startup display and menu access
The startup display depends on whether the NOC application is in Continuous mode or Well Test
mode, as shown in Figure A-1.
• For detailed information on using these NOC operation menus, see Chapter 5.
Troubleshooting IndexSeries 3000 MenusNOC Operation
• From either version of this display:
- To access the View menu system, press the
EXIT function button. View menu flowcharts
are provided in Section A.3.
- To access the Management menu system, press the Security button. Management menu
flowcharts are provided in Section A.4.
Figure A-1 Startup display
Net Oil Computer Supplement 61
Page 66

Series 3000 Menu Flowcharts
Screen 5
Var
Var
Screen 4
Var
Var
Screen 3
Var
Var
Screen 2
Var
Var
View Menu
LCD OptionsDiagnostic Monitor
Process TotalizersProcess Monitoring
Active Alarm Log
Applications List
Screen 1
Var
Var
Var
Process Inventory
· Mass Total
· Volume Total
· Freq Input Total
· Mass Inventory
· Volume Inventory
· Freq Input Inventory
· Tube Frequency
· Left Pickoff
· Right Pickoff
·Drive Gain
· Live Zero
· Temperature
· Contrast
· LCD Backlight
· I/O
· Core processor version
· Net Oil Computer
< >
Well Performance Meas
Power Outage
A.3 View menu
Figure A-2 shows the View menu.
Figure A-2 View menu: Special applications – Net Oil Computer
62 Micro Motion® Series 3000 MVD Transmitters
Page 67

Series 3000 Menu Flowcharts
Management Menu
LanguageSecurityMaintenanceConfiguration
Security
· Enable/disable
· Write Protect
· Totalizer Reset
Passwords
· Maintenance
· Configuration
Language
See following pagesSee following pages
A.4 Management menus
The Management menu system is illustrated in Figures A-3 through A-8:
• Figure A-3 shows the top level of the Management menu, plus the Security and Language
menus.
• Figures A-4 through A-7 show the Configuration menu. Note that the Digital Communication
menu structure changes according to the setting of the Protocol parameter.
• Figure A-8 shows the Maintenance menu.
Figure A-3 Management menu – Top level, Security menu, and Language menu
Troubleshooting IndexSeries 3000 MenusNOC Operation
Net Oil Computer Supplement 63
Page 68

Series 3000 Menu Flowcharts
Management Menu
Configuration
InputsSystem
·Tag
· Time
·Date
· Alarm Severity
· Electronics Alarms
· Process Alarms
· Sensor Alarms
· Configuration Alarms
Frequency Input
· Flow Rate Units
· Scaling Method
· Frequency
(2)
·Flow
(2)
· Pulses/Unit
(2)
· Units/Pulse
(2)
· K-factor
Sensor Information
· Sensor Model No.
· Sensor Serial No.
· Sensor Material
· Sensor Flange
· Sensor Liner
Core Processor
· FCF
· FTG
· FFQ
·D1–4
·K1–4
·FD
·DT
· DTG
· DFQ1–DFQ2
· Temperature Slope
· Temperature Offset
· Mass Factor
· Density Factor
· Volume Factor
Discrete Inputs
·Start Zero
· Reset Mass Total
· Reset Volume Total
· Reset All Totals
· Start/Stop All Totals
External Inputs
· Polling Variable 1–2
· Polling Control
· Polled Variable
· Pressure Compensation
(3)
· Pressure Units
(3)
· Flow Factor
(3)
· Density Factor
(3)
· Cal Pressure
(3)
Discrete Inputs
· Discrete Input 1–2
·Polarity
continued
Config Process Var
· Flow Variables
· Flow Damping
· Flow Direction
· Mass Units
· Mass Low Flow Cutoff
· Volume Flow Type
· Volume Units
· Vol Low Flow Cutoff
· Special Mass Units
· Special Volume Units
·Density
· Density Units
· Density Damping
· Density Cutoff
· Slug Low Limit
· Slug High Limit
· Slug Duration
· Temperature
· Temperature Units
· Temperature Damping
Sensor Cal Data
· T-Series Setup
(1)
· Flow Cal
·D1–2
· K1–2
·FD
· Dens Temp Coeff
· Temp Cal Factor
· Temperature Slope
· Temperature Offset
· Mass Factor
· Density Factor
· Volume Factor
NoYes
(1) T-Series option displayed only if transmitter is not connected to sensor. The parameter list
displayed depends on the sensor type.
(2) Options displayed depend on Scaling Method.
(3) Displayed only if Polled Variable = Pressure.
Figure A-4 Configuration menu
64 Micro Motion® Series 3000 MVD Transmitters
Page 69

Series 3000 Menu Flowcharts
Management Menu
Configuration
Well Performance Measurement
Mode of Operation
continued
Reference Temperature Well Data-Densities
Wells 1 to 12
(1)
Wells 13 to 24
(1)
Wells 25 to 36
(1)
Wells 37 to 48
(1)
Well #: Well Name
(1)
Well #: Well Name
(1)
.
.
.
Well #: Well Name
(1)
Well Name
(1)
Oil Density
Water Density
Gas Reference Density
Press Comp Oil Density
Reference Pressure
Purge Time
(1)
Oil Deviation
Water Deviation
Oil Duration Ave
Water Duration Ave
External Inputs
Gas Meter
Gas Volume Units
Water Cut Monitor
External Water Cut Limit
Compensations
Transient Bubble Remd
· Drive Gain Level
· Action Taken
· Time Period
Transient Mist Remd
(2)
· Drive Gain Level
· Time Period
· Add Carry-Over Totals
· Gas Meter HART Tag
Press Comp Oil Dens
Shrinkage Factors
· Factor for Oil
· Factor for Water
(1) Displayed only if Mode of Operation = Well Test Mode.
(2) Displayed only if the Transient Mist Remediation option was
purchased.
Figure A-5 Configuration menu continued
Troubleshooting IndexSeries 3000 MenusNOC Operation
Net Oil Computer Supplement 65
Page 70

Series 3000 Menu Flowcharts
Management Menu
Configuration
Measurements
Discrete Events
· Discrete Event 1–5
· Event Type
· Process Variable
·HI PV Value
(1)
· LO PV Value
(1)
continued
Outputs
Monitoring
Screens 1–5
· Variables 1–4
Variables
· Number of Decimals
Update Period
Discrete Outputs
· Discrete Output 1–3
· Polarity
· Assignment
· Fault Indication
· Flow Switch Source
(2)
· Flow Switch Setpoint
(2)
Milliamp Outputs
· Milliamp Output 1–2
· Fault Indication
· Condition
· Setting
· Last Meas Val Timeout
(3)
· Variable Assignment
· Calibration Span
· 20 mA
·4 mA
· Low Flow Cutoff
· Damping Seconds
· 4 mA Minimum
· 20 mA Maximum
· Minimum Span
Frequency Output
· Flow Source
· Scaling Method
· Frequency
(4)
· Flow
(4)
· Pulses/Unit
(4)
·Units/Pulse
(4)
· Max Pulse Width
·Power
·Polarity
· Fault Indication
· Last Meas Val Timeout
(3)
(1) Either or both are displayed, depending on Event Type.
(2) Displayed only if Assignment = Flow Switch.
(3) One setting applies to both milliamp and frequency outputs.
(4) Options displayed depend on Scaling Method.
Figure A-6 Configuration menu continued
66 Micro Motion® Series 3000 MVD Transmitters
Page 71

Series 3000 Menu Flowcharts
Configure RS-485
· Protocol
·HART
· Modbus RTU
· Modbus ASCII
· Printer
· Configure Protocol
· Baud Rate
· Parity
· Data Bits
· Stop Bits
· Polling Address
· Byte Order
Protocol=HART, Modbus RTU,
Modbus ASCII
Configure Bell-202
· Polling Address
· Loop Current Mode
· Burst Mode
· Burst Command
· Burst Variable 1–4
Device Setup
· Fault Setting
· Description
· User Message
·HART QV
· HART Device ID
· Transmitter Serial No
Management Menu
Configuration
Digital Communication
Protocol=Printer
Configure RS-485
· Protocol (Printer)
· Configure Printer
· Printer Selection
· Pre Header Codes
· Header Line 1–2
·Footer
· Post Footer Codes
· Baud Rate
·Parity
·Data Bits
·Stop Bits
· Chars Per Second
· Print Buf Size
· Lines Per Page
· Disable Paper Check
· Discrete Inputs
· Print Screen
· None
· Discrete Input 1–2
· Discrete Event 1–5
· Screens to Print
· Process Monitor
· Monitor Screen 1–5
· All Config Data
· Active Alarm Log
· Alarm History
· Alarm Event Log
· Audit Event Log
· Print Process Monitor
· Printer Test
Figure A-7 Configuration menu continued
Troubleshooting IndexSeries 3000 MenusNOC Operation
Net Oil Computer Supplement 67
Page 72

Series 3000 Menu Flowcharts
Management Menu
Maintenance
Alarm History
Active Alarm Log
Alarm Event Log
Process Inventory
Mass Inventory
Volume Inventory
Freq Input Inventory
Calibration
Sensor Zero
· Zero Time
· Mass Flow Rate
· Calibrate Zero
· Restore Factory Zero
· View Current Data
Density
· Low Density
·Density
·D1
· Calibrate Density
· High Density
·Density
·D2
· Calibrate Density
· Flowing Density
· View Current Data
mA Output Trim
· Milliamp Output 1–2
· Trim 4.0 mA
· Trim 20.0 mA
Temperature
· Low Temperature
· High Temperature
· View Current Data
Density Determination
Diagnostics
Read External Inputs
· Discrete Input 1–2
· Frequency Input
· External Pressure
(1)
· External Temperature
(2)
Simulate Outputs
· Discrete Output 1–3
· Milliamp Output 1–2
· Frequency Output
Meter Verification
(3)
Uncertainty Limit
Counter
Start Meter Verify
·Fault
· Hold Last Value
(1) Displayed only if polling for pressure is configured.
(2) Displayed only if polling for temperature is configured.
(3) Displayed only if the meter verification option is available.
Figure A-8 Maintenance menu
68 Micro Motion® Series 3000 MVD Transmitters
Page 73

Index
A
Archive records 53
B
Buttons
cursor control buttons 21
function buttons 19
Security button 19
C
Communication tools
375 Field Communicator 1
local display 1
ProLink II 1
Configuration
basic procedure 24
configuration overview 1
displaying NOC data on process monitor 28
gas measurement 25, 30
NOC status alarms 27
operation mode 24
planning 15
pressure compensation 26, 29
reference temperature 24
reporting NOC data over outputs 26
shrinkage factors 26
TBR 26, 30
TMR 26, 31
water cut monitor 25, 29
well parameters 25
Continuous mode
archive records 53
changing to Well Test mode 57
overview 8, 49
pausing and resuming measurement 52
recalculating data 56
resetting totals 53
saving archive records 53
viewing archive records 54
viewing current data 51
Cursor control buttons 21
Customer service, contacting 2
D
Density-based water cut
See Water cut, density-based
Display
scientific notation 21
using 17
E
External water cut
See Water cut, from water cut monitor
F
Function buttons 19
G
Gas carry-under
See TBR
Gas measurement
configuration 25, 30
overview 13
TMR option 13
Gas meter 4
Gas reference density 25
Gas-Liquid Cylindrical Cyclone
See GLCC
GLCC 7
I
Installation steps 1
L
Liquid carry-over
See TMR
Troubleshooting IndexSeries 3000 MenusNOC Operation
Net Oil Computer Supplement 69
Page 74

Index
M
Management menu 18
Security button 19
Manuals 1
Menu system
flowcharts 61
Management menu 18
Management menu flowcharts 63
shortcuts 19
using 17
View menu 18
View menu flowcharts 62
Well Performance Measurement menu
(Configuration) 23
Well Performance Measurement menu
(Configuration) flowcharts 24
Well Performance Measurement menu (View)
Continuous mode 50, 55
Well Test mode 42, 43
Well Performance Measurement menu (View)
flowcharts 50
Continuous mode 50, 55
Well Test mode 43
42
Micro Motion customer service 2
NOC system
components 4
configuration planning 15
installation architecture 4
overview 3
with GLCC 7
with three-phase separator 6
with two-phase separator 5
O
Oil deviation 25
Oil duration ave 25
Operation modes
changing 57
overview 8
P
Pressure compensated oil density 25
Pressure compensation
configuration 26, 29
for oil density and water density 10
for pressure effect 10
overview 10
Pressure sensor 4
Purge time 25
N
Net Oil Computer
See NOC
NOC application
configuration 23
Continuous mode 8
features and options 10
gas measurement 13
measurement terms 16
pressure compensation for oil density and water
density 10
pressure compensation for pressure effect 10
recalculation 14
shrinkage factors 11
status alarms 27, 59
TBR 11
temperature correction 10
TMR 13
Well Test mode 8
R
Recalculation
Continuous mode data 56
overview 14
well test data 48
Reference density of gas 25
Reference density of oil 9, 25
Reference density of water 9, 25
Reference pressure 25
Reference temperature 24
S
Scientific notation 21
Security button 19
Separators 4
GLCC 7
three-phase separator 6
two-phase separator 5
Shrinkage factors
configuration 26
overview 11
Status alarms 59
70 Micro Motion® Series 3000 MVD Transmitters
Page 75

Index
T
TBR
configuration 26, 30
overview 11
Temperature correction 10
Terminology 16
TMR
configuration 26, 31
overview 13
Transient Bubble Remediation
See TBR
Transient Mist Remediation
See TMR
Troubleshooting 59
customer service telephone number 2
V
View menu 18
W
Water cut 9
density-based 9
determination options 9
external water cut 9
from water cut monitor 9
Water cut monitor 4, 9
configuration 25, 29
Water deviation 25
Water duration ave 25
Well name 25
Well Test mode
changing to Continuous mode 57
overview 8, 41
recalculating well test data 48
running a well test 44
viewing current data 45
viewing stored well test data 45
Troubleshooting IndexSeries 3000 MenusNOC Operation
Net Oil Computer Supplement 71
Page 76

72 Micro Motion® Series 3000 MVD Transmitters
Page 77

Page 78

Micro Motion Inc. USA
Worldwide Headquarters
7070 Winchester Circle
Boulder, Colorado 80301
T +1 303-527-5200
+1 800-522-6277
F +1 303-530-8459
Micro Mot ion Europe
Emerson Process Management
Neonstraat 1
6718 WX Ede
The Netherlands
T +31 (0) 318 495 555
F +31 (0) 318 495 556
Micro Motion Japan
Emerson Process Management
1-2-5, Higashi Shinagawa
Shinagawa-ku
Tokyo 140-0002 Japan
T +81 3 5769 -6803
F +81 3 5769-6844
Micro Motion Asia
Emerson Process Management
1 Pandan Crescent
Singapore 128461
Republic of Singapore
T +65 6777- 8211
F +65 6770- 8003
Micro Motion United Kingdom
Emerson Process Management Limited
Horsfield Way
Bredbury Industrial Estate
Stockport SK6 2SU U.K.
T +44 0870 240 1978
F +44 0800 966 181
©2008, Micro Motion, Inc. All rights reserved. P/N MMI-20011276, Rev. A
*MMI-20011276*
For the latest Micro Motion product specifications, view the
PRODUCTS section of our web site at www.micromotion.com
 Loading...