

Page 1

Reliability Solutions
AMS Machinery Manager
Dashboard overview for status at a glance
Analysis tools for diagnosis and prognosis
of machinery health
Real-time asset health integration with
process automation systems
Integration with multiple predictive
maintenance technologies for a complete
picture of mechanical asset health
AMS Machinery Manager provides you with the tools that you
need to determine your plant’s machinery health.
Product Data Sheet
January 2021
A Comprehensive View with Accurate Diagnosis
At some point, mechanical equipment will break down.
With luck, the breakdown won’t occur at the peak of your
production schedule or be caused by an out-of-inventory part.
By knowing the health of your rotating mechanical assets,
you can plan for repairs rather than react to failures.
You can also share the information between maintenance
and operations so that repairs are anticipated and production
schedules are adjusted accordingly. Your facility can achieve
increased availability and performance from production assets,
rather than experience expensive downtime and costly repairs.
AMS Machinery Manager combines predictive maintenance
techniques with comprehensive analysis tools to provide
easy and accurate assessment of the machinery health in
your facility.
Integrated Solution
AMS Machinery Manager can integrate with multiple predictive
diagnostic technologies to monitor different types of
mechanical assets and identify unique failure symptoms.
The modular technology applications incorporate diagnostic
and reporting sources into a common database for analysis
of machinery health across the entire plant.
Through this integration, you gain a comprehensive view of
each monitored machine and more accurate diagnosis of
developing problems. Correlation from multiple technologies
allows you to identify and x the root cause of issues once,
instead of xing the symptoms over and over again.
Integrated Technology Solutions Include:
Portable vibration analysis
Continuous online machinery monitoring
with the AMS 6500 Machinery Health Monitor
Wireless vibration analysis with the
AMS 9420 Wireless Vibration Transmitter
Page 2
Lubrication analysis
Infrared thermography
Laser alignment
AC motor diagnostics
Dynamic balancing
Easy to Understand for Users of All Levels
January 2021AMS Machinery Manager
While maintenance personnel may specialize in different
monitoring technologies, the centralized dashboard,
common user interface, and database administration tools
in AMS Machinery Manager modules make the integration
of asset health information easy to understand for all users.
Users have a shorter learning curve with each new technology,
and some technology modules include different levels of
functionality, to give both the beginner and advanced user
the experience and information they need.
Simple to Install
Information Technology personnel appreciate the ease of
installation and the self-contained database tools that allow
a software administrator to handle any issues that may arise,
from granting user access to managing the database.
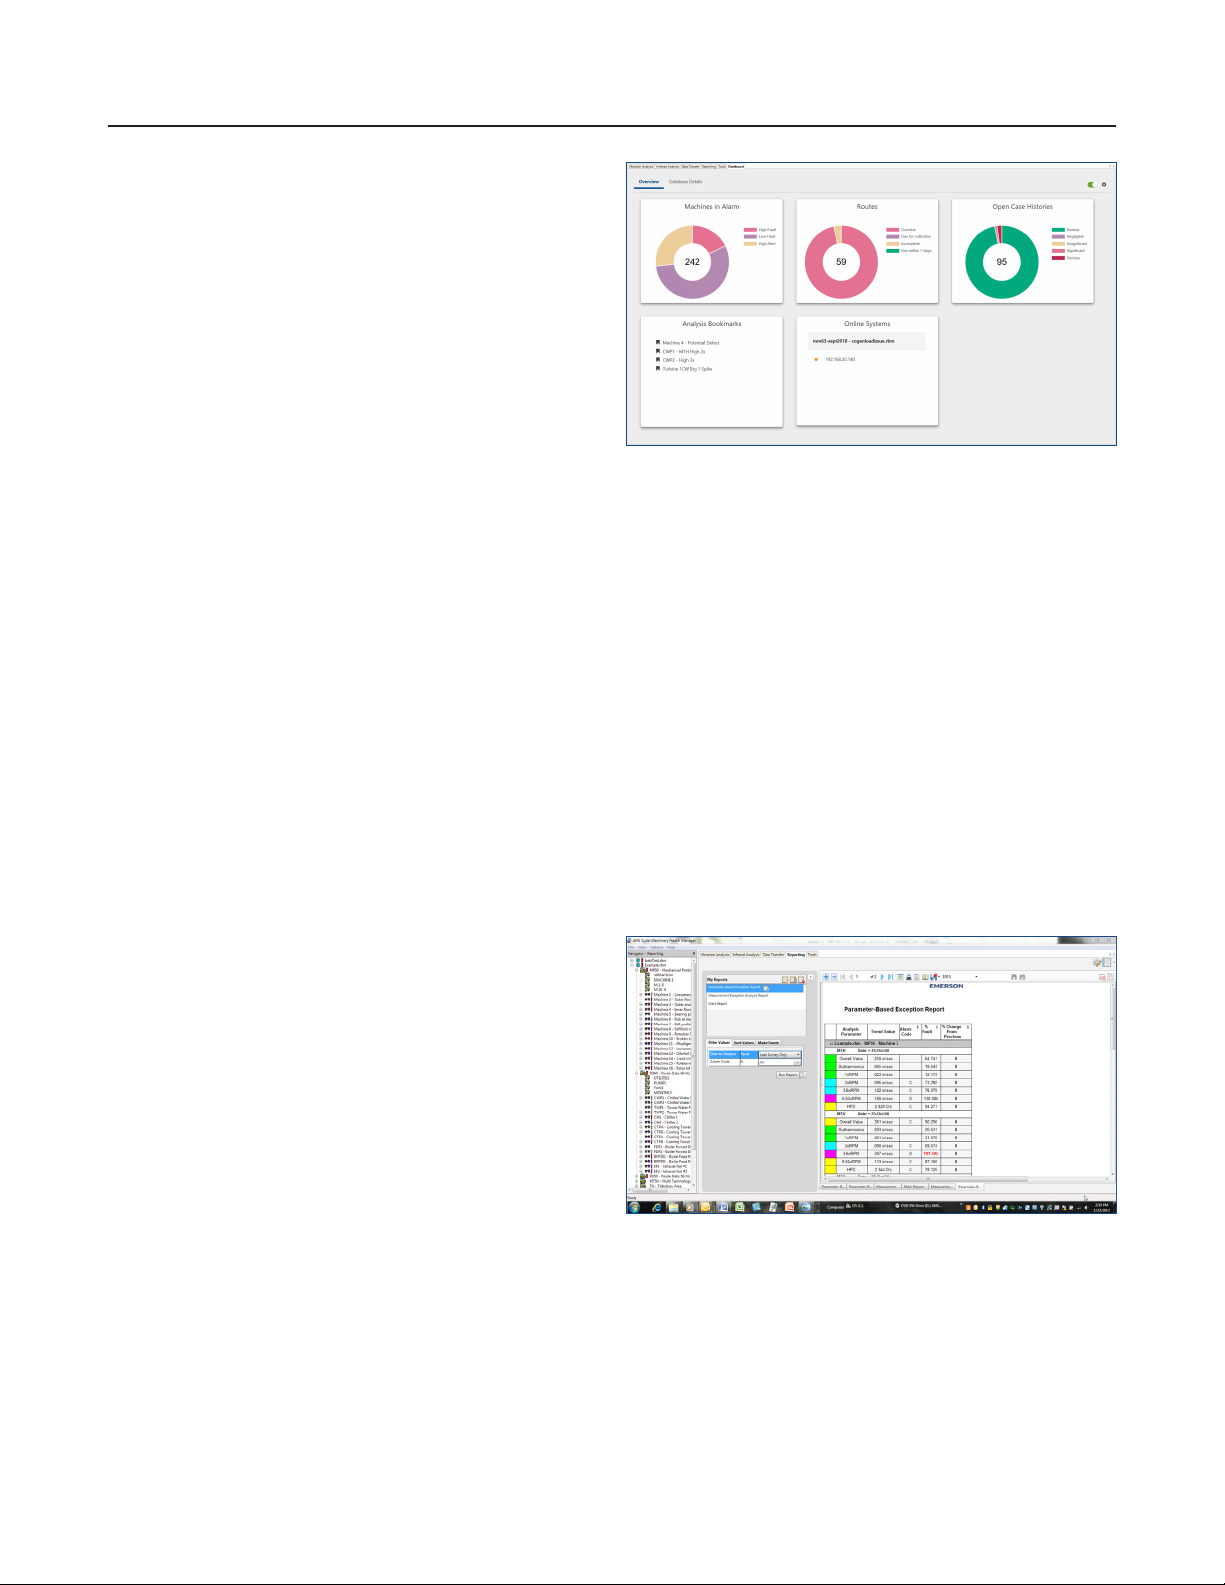
Report, Track, and Trend in a Central Location
AMS Machinery Manager provides a central location
for all current and historical reporting, shareable across
the organization. Graphical representation from
equipment problem trends, work order status, cost savings,
and management style reporting are easily generated through
an established case history repository.
The dashboard allows you to quickly assess the status of your
machines and reliability program, then launch directly to areas
of importance.
A web-based Machine History Viewer allows diagnostics to be
viewed from any computer with Internet Explorer access to your
intranet or internet. Management and maintenance personnel
can access machinery health status and historical information
to make informed decisions.
Machine History Viewer allows the user to select the elds
to display for fast review of critical asset information.
You can also search on specic items, lter by dates,
and print detailed reports. In addition, the Machine History
Viewer is an array of web parts. Each web part can be
minimized, maximized, moved, closed, and reopened.
This functionality provides added exibility to arrange
the web application in any manner desired.
The case history module is a multi-technology asset information
repository, so it allows you to view case history information
from many different technologies. This allows you to be well
informed on the status of your assets through information
logged by oil analysts, vibration analysts, infra red analysts
and others. The inclusions of asset images, diagnostic plots,
Windows audio and video les, and Microsoft les such as
Word and Excel give you the complete information you need
in order to make the best diagnosis.
Interactive reports allow you to customize what information will be
included and how it will appear.
www.emerson.com/ams 2
Page 3
January 2021AMS Machinery Manager
Machine Train
Interactive Reporting
The Reporting Application allows you to generate interactive
reports from their databases. You can sort, expand and
collapse asset results, and select parameter data in the report
to be viewed in the vibration plot. Print and customize the
reports with company logos and export reports to Word,
Excel and or .pdf for further edits. This Reporting application
allows you to dene exactly what types of parameters to
view within a report as well as to share ‘your setup’ with
other AMS Machinery Manager users.
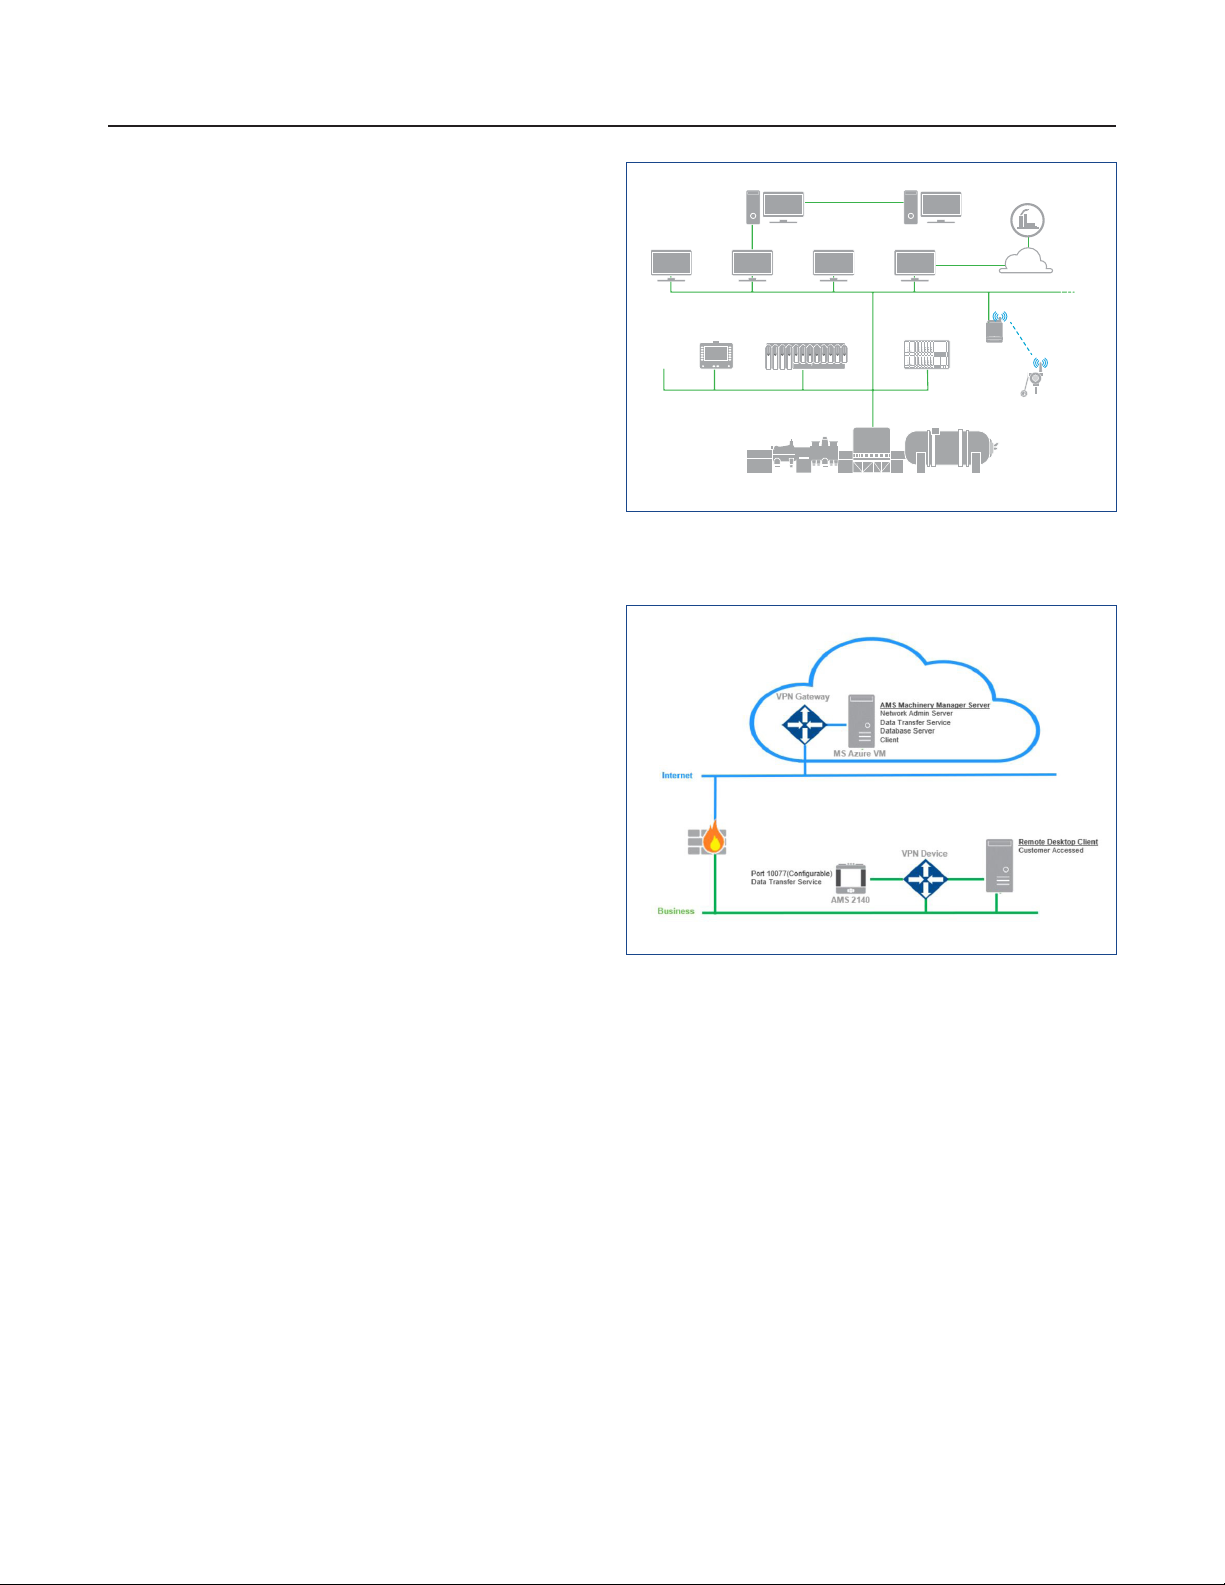
Deployment Options to Fit Any Organization
Whether you are a small organization or a global multi-plant
operation, AMS Machinery Manager’s platform offers a wide
variety of licensing and deployment options to t your needs.
From a standalone system to wide area networking capabilities,
AMS Machinery Manager provides efcient and reliable storage
and analysis of data that can be accessed from anywhere in
your organization.
Single-Users
Single-user, standalone systems operate on a single PC.
If you operate two or more single-user PCs, a keyed version
will allow you to run AMS Machinery Manager based on
the computer with the key. The keyed version is great for
consultants or co-workers.
Other
CSI Technologies
Portable
Vibration Analysis
AMS Asset Portal
AMS Machinery
Manager Server
Process Automation System
CMMS/EAM System
Citrix or
Terminal Server
Online
Machinery Monitoring
Additional Facility
WAN
PVN
Vibration Monitoring
A wide area network allows communication and analysis of
machinery health information around the globe.
Wireless
Local Area Networks (LAN)
Local area networks are perfect for organizations that need
to share their data internally. The network license has read
access capability for up to 249 users. This allows other plant
personnel to access and view the data concurrently. Write seats,
database access, analysis, reporting, and communications are
controlled by the user’s job responsibilities.
Wide Area Network (WAN)
For a global environment, a wide area network license
allows for communication around the world. Data transfer
can be completed by simply uploading a route by ethernet
or intermediate le transfer. In addition, route denition
information can be emailed to personnel and uploaded to an
analyzer at any time without having access to a client or server
software application.
Analysis and other tasks can be performed globally as if
you were at the server site. Read access for up to 249 users
and congurable write access customized to a user’s job
responsibilities are a part of the WAN environment.
Cloud based installations can reduce maintenance costs and
provides an alternative to wide area network installations.
To better enable digital transformation, AMS Machinery
Manager can also be deployed in the Microsoft Azure cloud,
removing the need to install software locally. The supported
architectures in the cloud can support single servers, as well as
client/server architectures including data lockers, and allow for
up to ten concurrent users. Please note, cloud deployment is
supported for AMS 2140 users only.
www.emerson.com/ams 3
Page 4
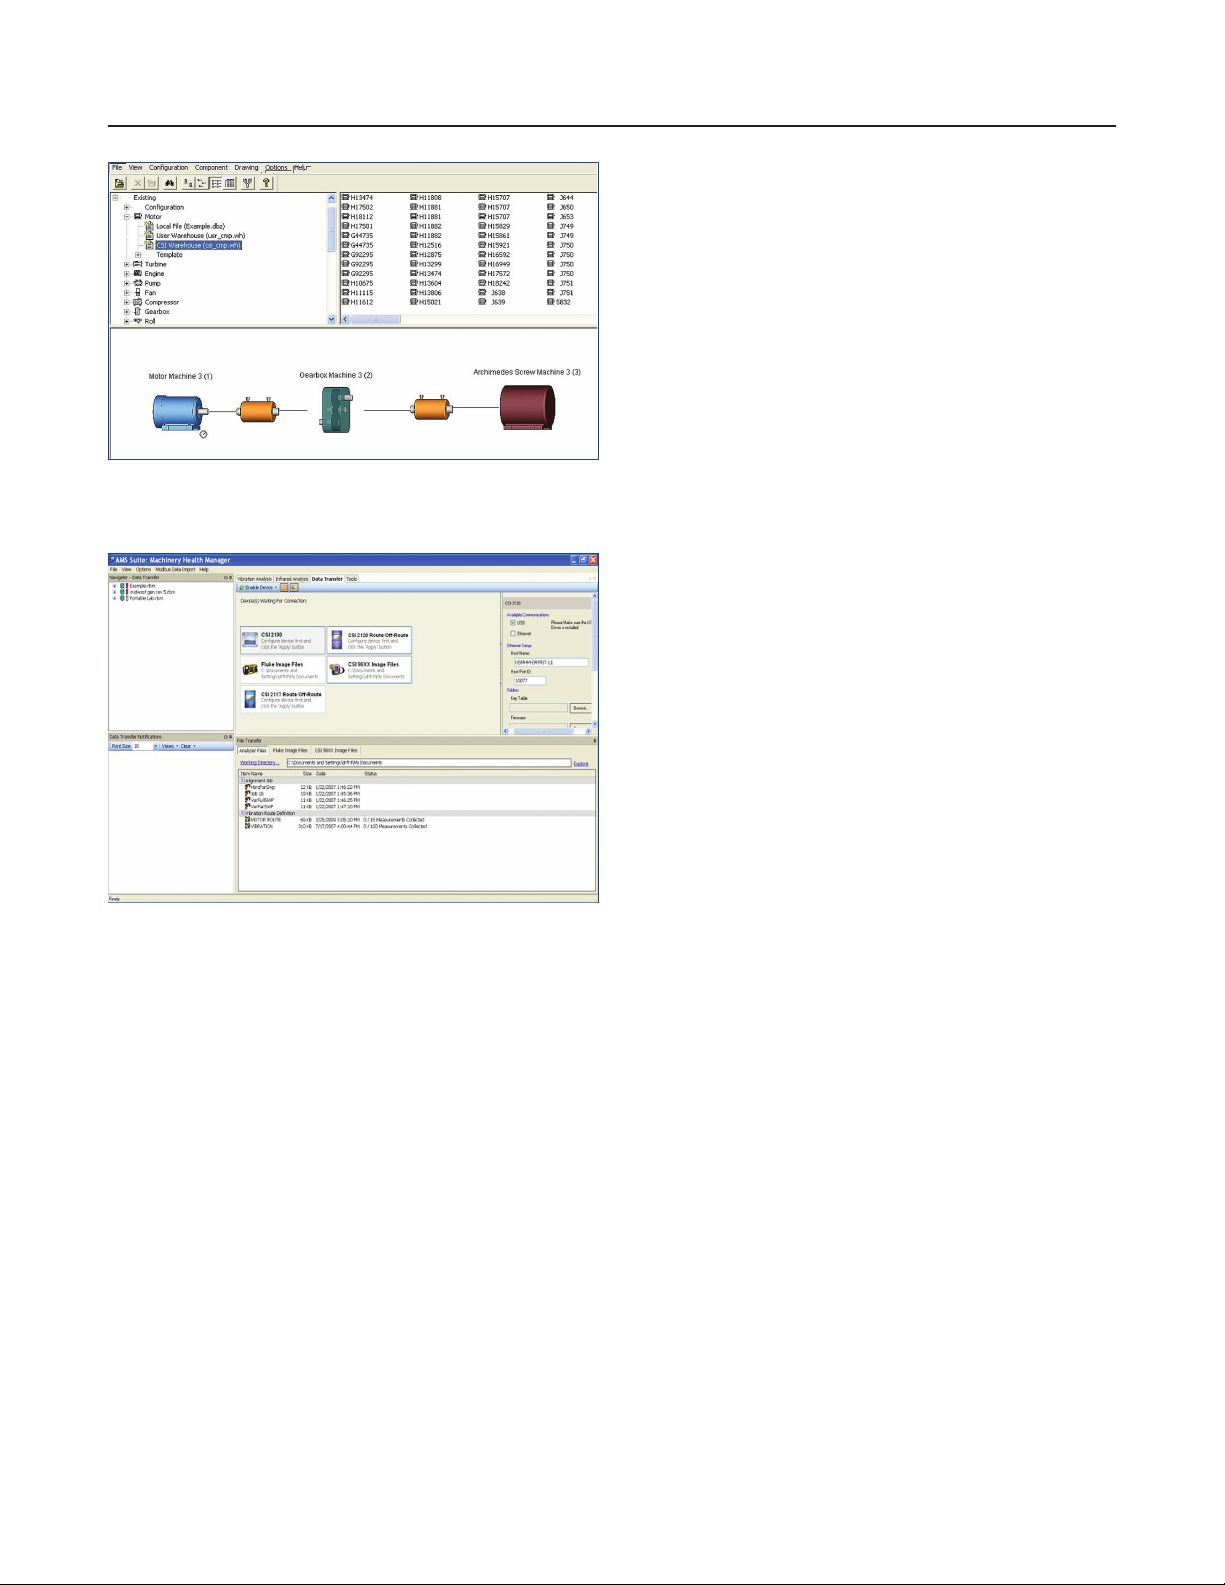
Quickly build a predictive maintenance database through the
step-by-step, graphical, drag-and-drop wizard application.
January 2021AMS Machinery Manager
Within a network environment, you can communicate with
other AMS Machinery Manager users logged into the system
through the Collaboration Tool. See which other users are
currently available online and exchange messages on problem
assets with appropriate personnel. These messages can contain
les and images related to the asset, including vibration plots
and thermographic images. The tool also displays current
conversations between users, allowing others to participate
in the conversation as needed.
Build Databases in Minutes and Access Predictive Diagnostics Immediately
Setting up your database can be one of the most challenging
parts of building a predictive maintenance program.
Gathering and organizing the appropriate asset information
is a daunting task, especially for novice users.
With AMS Machinery Manager, a database wizard eliminates
the guesswork by stepping you through the entire process
with a graphical drag-and-drop interface. You can set up
everything you need – from individual machine components
to machine trains.
Drag-and-drop your route to upload and download your data.
Automatically Setup Alarms, Analysis Parameters,
and Measurement Points
Simply choose assets from an extensive library of motors,
bearings, gearboxes, belts, and other components.
A knowledge engine compiled from years of eld analyst
experience automatically creates multi-technology
measurement points, analysis parameter sets, and alarm
limit settings along with congurations for the automated
diagnostic system.
With a few simple keystrokes, you can build the database,
download route information, analyze data, and report your
machinery health ndings.
www.emerson.com/ams 4
Page 5
January 2021AMS Machinery Manager
Efficient Route Setup
A route is an ordered list of asset data collection points that
can be used to efciently acquire data. Route collection options
allow you to determine the type of data you wish to store,
along with when and how to store the data.
Choose the assets you want to include in the route by simply
right-clicking on the navigator and selecting Create Route.
Then drag-and-drop the routes to the portable analyzer or
folder on your computer. Once you have collected your data,
drag-and-drop the route information back to AMS Machinery
Manager for analysis.
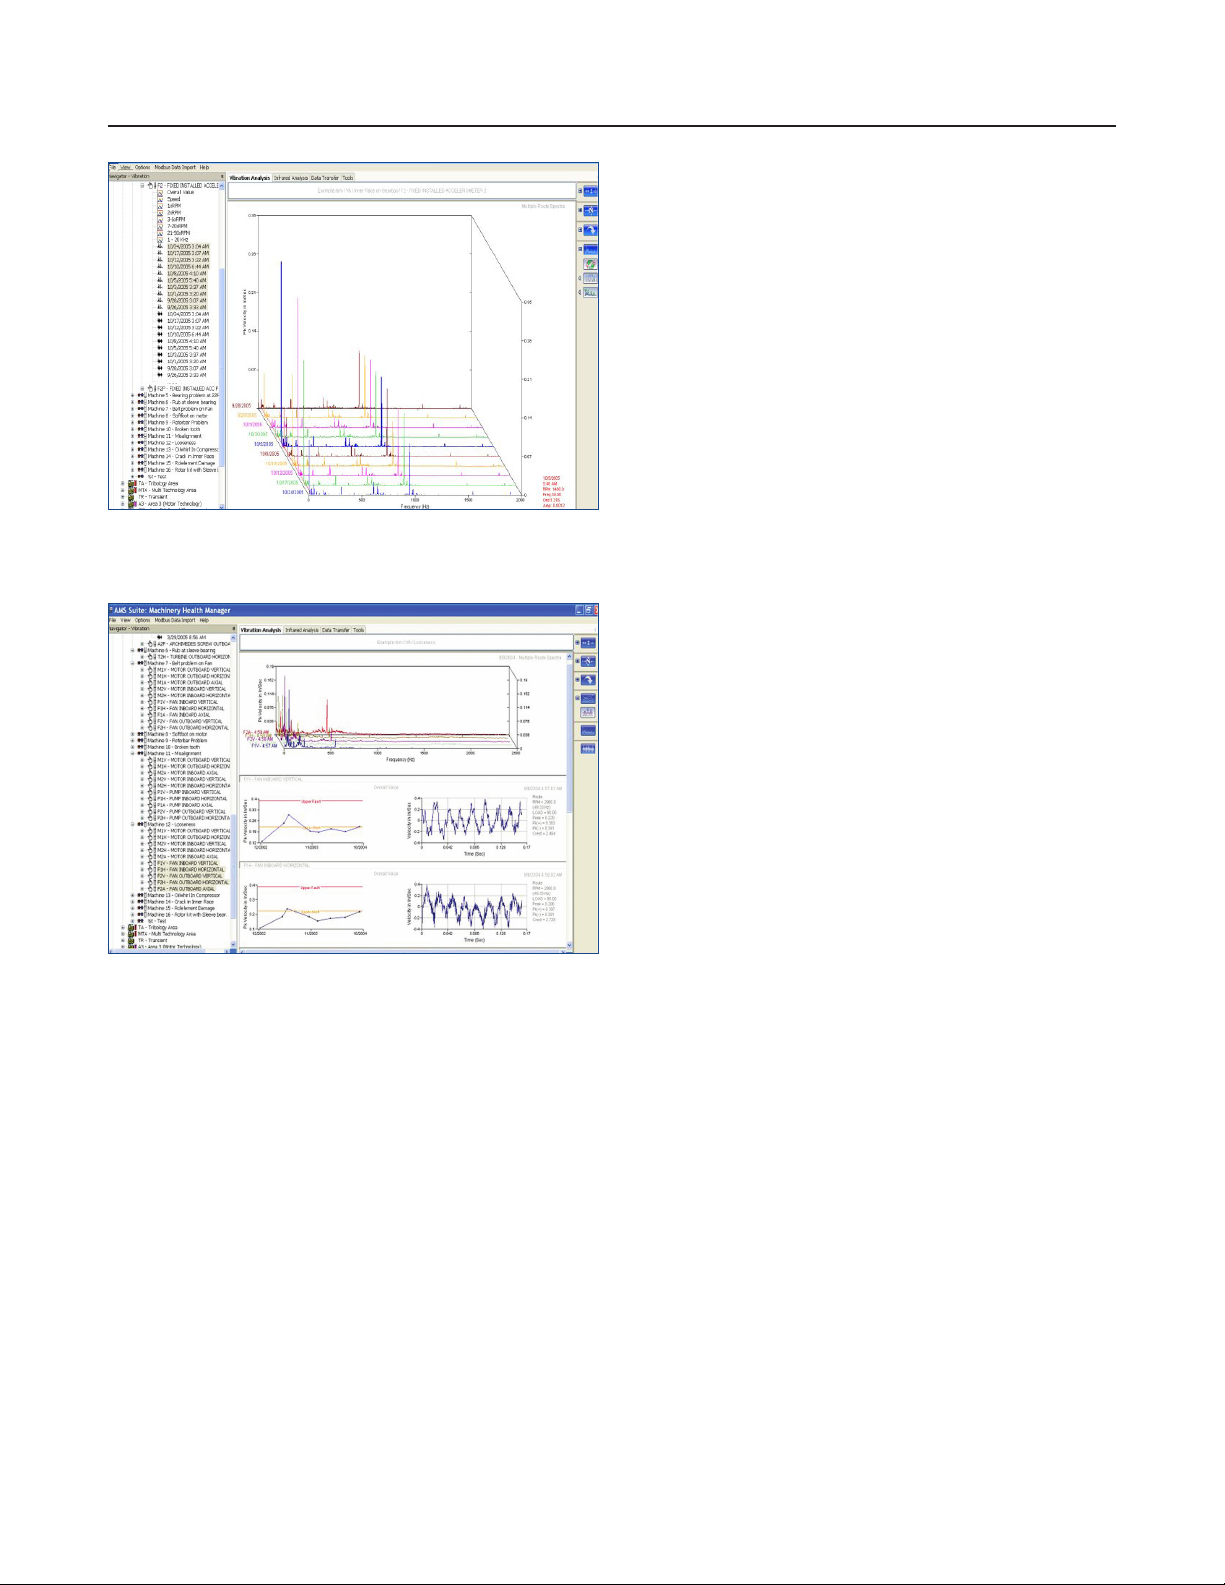
Flexible Analysis Interface
Dynamic display controls allow you to adjust the angle of the
plot display.
View a complete machine at one time and customize your plot view
by selecting what you want to see on the screen. This view shows
spectrum, waveform, and trend plots.
With AMS Machinery Manager, you can view data more
efciently because you don’t need to constantly switch screens.
All plots can be displayed as full screen or several plots can be
combined in a single window. With multiple monitor support,
separate plots can be displayed on up to three monitors.
Common applications of this powerful exibility include:
Looking at three directions: the X, Y, and Z plot in a
single screen
Viewing the complete machine component:
all measurement points on a motor in a single screen
Viewing a complete machine
Viewing similar machines from more than one database
Selecting how many and what types of plots will appear
in your view
Identifying changes in data from month to month
www.emerson.com/ams 5
Page 6
January 2021AMS Machinery Manager
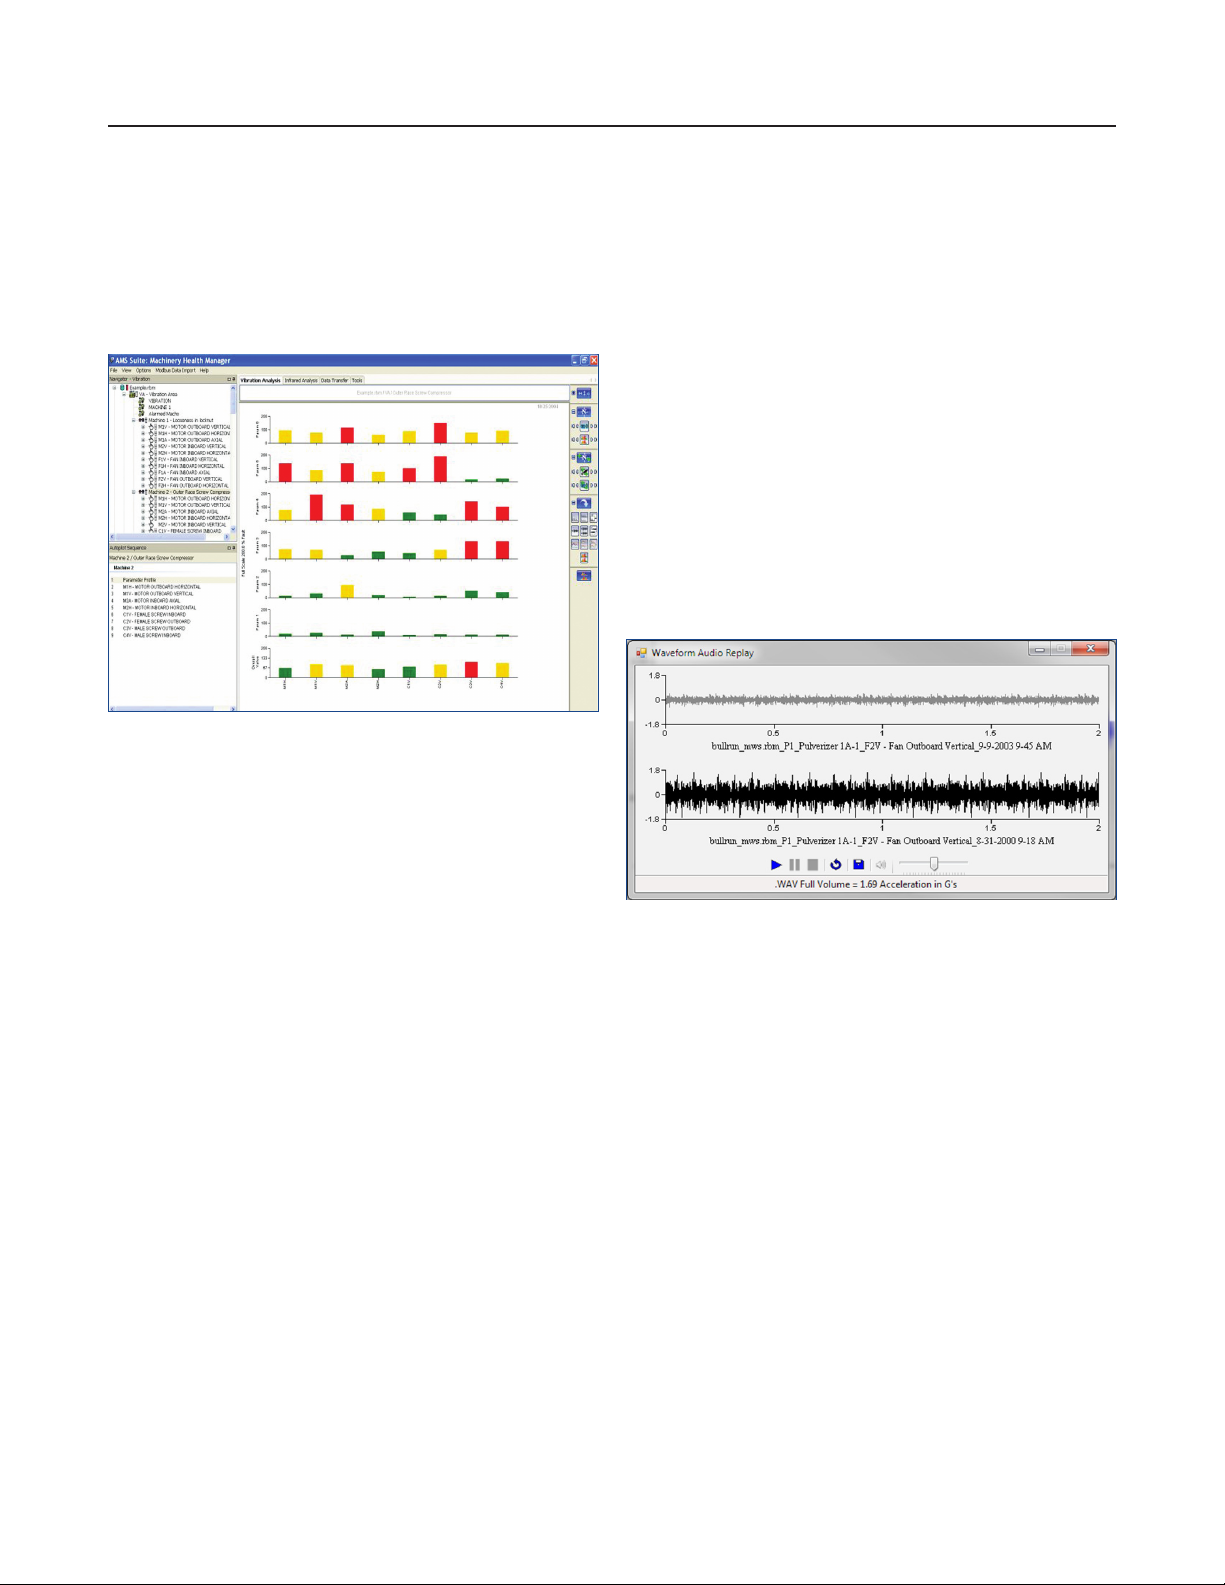
Quickly Determine Machine Status
Use the AMS Machinery Manager Parameter Status Prole
to quickly view parameter alarm status of a machine with
a simple, congurable color selection (like green, yellow,
and red). This capability helps you to determine where
additional attention is needed.
Quickly determine the status of a machine with the Parameter
Status Prole.
Fine Tune Alarms
During your analysis or after you have had time to acquire
several months of data, you may need to adjust your original
alarm setups. The Automated Statistical Limit Calculation
module can take data from vibration patterns and construct
narrowband alarms. Envelope alarms can also be manually
dened and created from a reference spectrum.
Waveform Audio Replay
Replay the audio from a periodic or online waveform,
a transient detailed waveform, or an analyze job waveform.
A loop button is available to continuously repeat shorter
waveforms. You can also compare the audio from two
waveforms. For example, a waveform collected from a problem
machine will often sound different than a waveform from a
similar machine without a fault present. The audio output
can be saved as a .wav le and attached to reports for sharing.
Navigational Ease
Navigational functionality allows you to maneuver between
different plot types like single spectrum, multiple-point
wavefoms, and trends. Navigation between data, measurement
points, machines, areas, and multiple databases is easy with the
navigational tree.
Prescreen to narrow the search by selecting only points in
alarm, survey dates, or notes that have been assigned to a
machine or data point.
Automated Diagnostics Narrow the Search
When you are unsure or need a second opinion on your
analysis, the Automated Diagnostic module can conrm
your diagnosis or point you to other underlying faults. The
Automated Diagnostic program will help you understand how
it reached its conclusion and can also be used as a training tool.
The module steps you through reasoning, rules, and facts as
it analyzes the collected data to increase your knowledge and
diagnostic skills.
Compare the audio from two different waveforms with the
Waveform Audio Replay option.
www.emerson.com/ams 6
Page 7

Viewing a waterfall plot in color allows you to see the difference in
the amplitudes more readily.
January 2021AMS Machinery Manager
Advanced Analytical Tools
AMS Machinery Manager offers extensive analysis tools to
enable accurate diagnosis of machine health.
Analysis tools are available for specic challenges,
such as slow or variable speed equipment, rolls, waveform
analysis, early bearing or gear impacting, electrical defects,
and more. Advanced tools include:
Colored waterfall plots
Waveform autocorrelation
Waveform Audio Replay
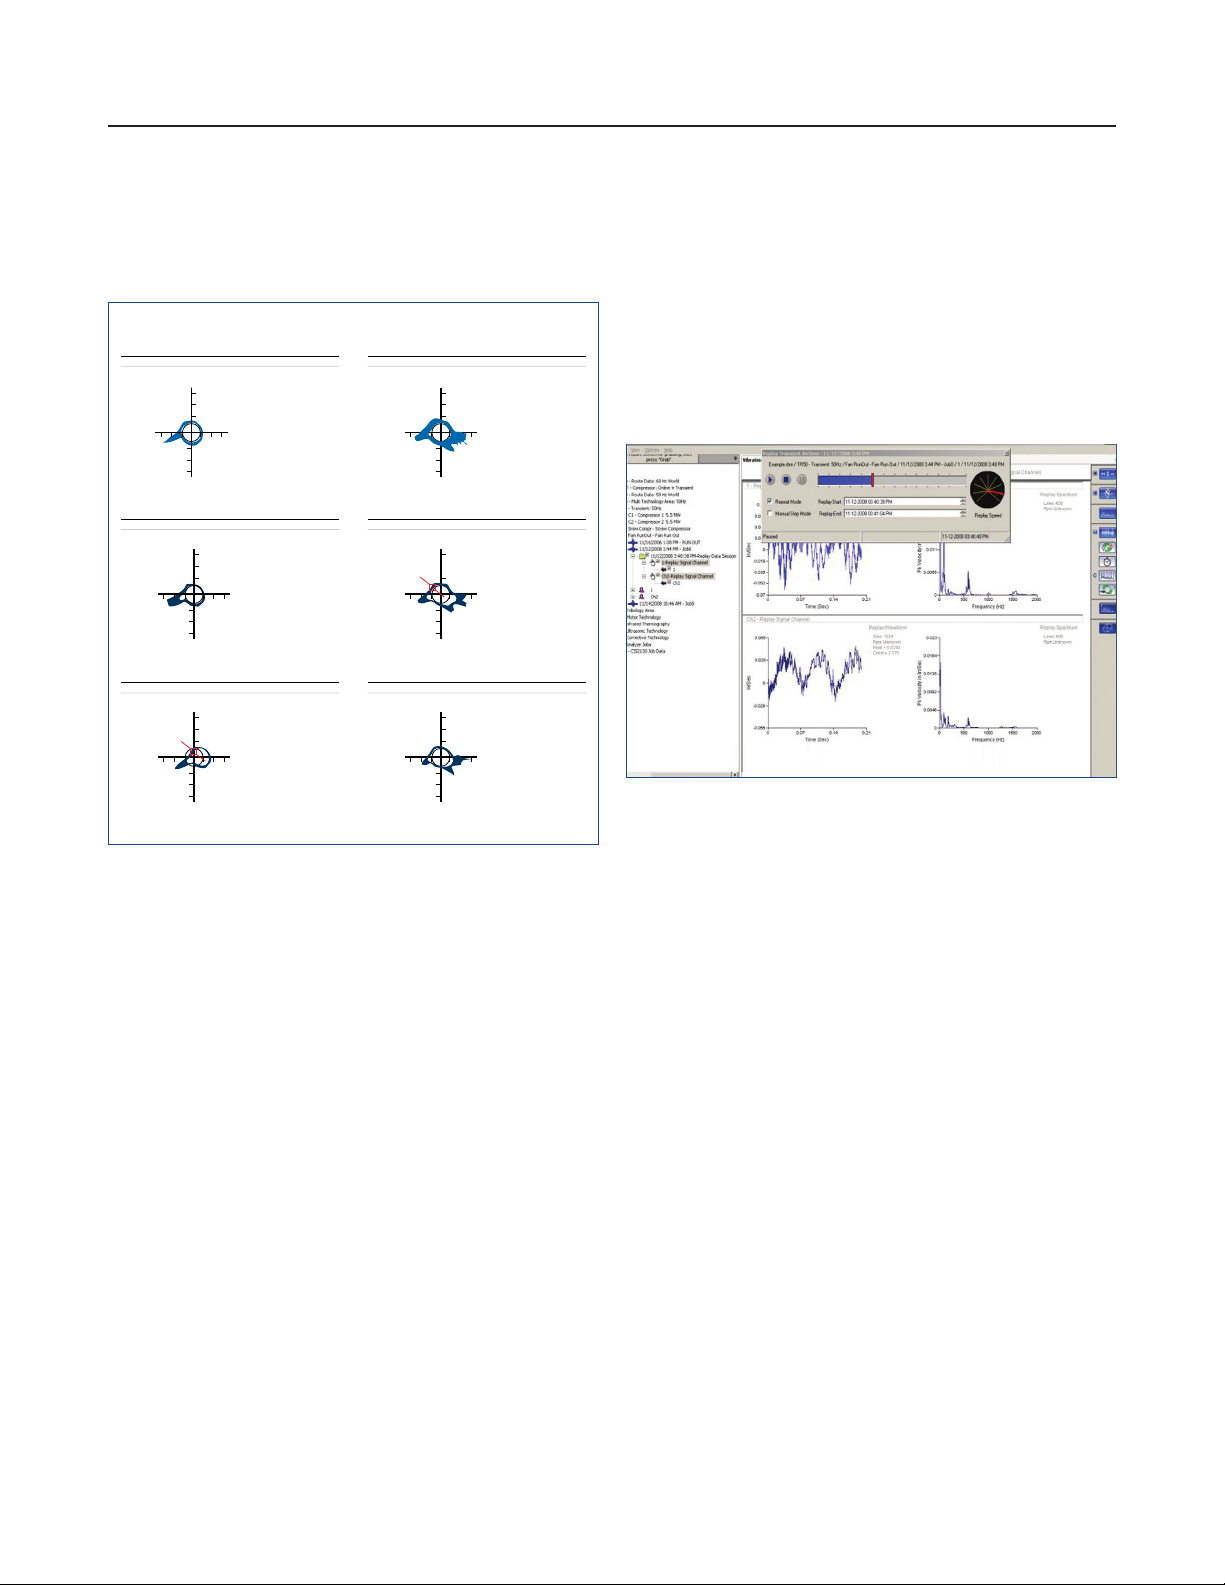
Circular waveform plot
Orbits/ltered orbits
Bode nyquist
Full Spectrum & Cascade Full Spectrum (online data)
3D Shaft Centerline Animation Plot (online data)
With Cascade Full Spectrum, the user can quickly differentiate
between a rub and an oil swirl anomaly.
Transient replay that replays a AMS 2140 transient signal,
including the startup of your critical machinery
Transient waveform runout correction
Customizable narrow band trends
Dynamic display control to customize the view of 3D plots
www.emerson.com/ams 7
Page 8

January 2021AMS Machinery Manager
The Perfect Vibration Analysis Package for Your Organization
AMS Machinery Manager provides a wide breadth of vibration
capabilities – from entry level packages with basic vibration
analysis tools to more advanced capabilities like dual-channel
and transient analysis.
Advanced Vibration Analysis Module
The Advanced Vibration Analysis module provides in-depth
analysis options for transient and cross-channel data
collected with a AMS 2140 Machinery Health Analyzer,
including cross-channel phase, coherence, and transfer
functions. You can post process transient data to show the
vibration frequency characteristics during machine coastdown
or startup.
Export data directly from AMS Machinery Manager to a
companion software module for Operating Deection Shape
(ODS) and Modal analysis.
Create a machine model and animate vibration readings
to generate powerful documentation on machinery faults.
Perform in-depth structural analysis with the Modal Analysis
module and test virtual design modications to eliminate the
root cause of reliability issues.
Continuous Online Machinery Monitoring
The same powerful predictive analysis tools available for
the portable vibration analysis module are available online
monitoring systems, including plotting, trending, transient,
spectral analysis, PeakVue™ technology, autocorrelation,
and statistical analysis.
Predictive monitoring and analysis features include:
Web-based current and historical data
Web-based asset prioritization and maintenance planning
Web-based performance monitoring
Customized graphical user interface
Integration to 3rd party control systems via Modbus protocol
Shaft animation plots for transient archives
Full spectrum and cascade full spectrum
www.emerson.com/ams 8
Page 9
January 2021AMS Machinery Manager
Easy Reciprocating Compressor Monitoring
AMS Machinery Manager displays PeakVue waveforms on a
circular polar plot for easy identication of leaking exhaust
valves on reciprocating compressors.
Properly operating valve Leaking exhaust valve
Peakvue
0°
105
270° 90°
0
180°
Peakvue 10K
0°
76
270° 90°
0
180°
Peakvue 20K
0°
45
270° 90°
0
180°
Units=G’s
Exceptional
Peakvue
HP 5k Hz
RPM = 999.60
(16.66 Hz)
LOAD = 0.00
RMS = 9.591
Pk (+) = 100.84
Crest = 10.51
Units=G’s
Routine
Peakvue
HP 10k Hz
RPM = 999.40
(16.66 Hz)
LOAD = 0.00
RMS = 12.49
Pk (+) = 75.33
Crest = 6.032
Units=G’s
Routine
Peakvue
HP 20k Hz
RPM = 998.93
(16.65 Hz)
Rev:4.845
Time:0.291
Amp:1.610
Peakvue
0°
38
270° 90°
0
180°
Peakvue 10K
0°
44
270° 90°
0
180°
Peakvue 20K
0°
29
270° 90°
0
180°
Units=G’s
Routine
Peakvue
HP 5k Hz
RPM = 998.92
(16.65 Hz)
LOAD = 0.00
RMS = 7.655
Pk (+) = 37.20
Crest = 4.880
Units=G’s
Routine
Peakvue
HP 10k Hz
RPM = 999.51
(16.66 Hz)
Rev:4.848
Time:0.291
Amp:5.211
Units=G’s
Routine
Peakvue
HP 20k Hz
RPM = 999.48
(16.66 Hz)
Waveform data incorporated onto circular polar plots delivers
insight to developing valve faults.
Transient Live Display Mode
The live mode in AMS Machinery Manager provides real-time
data plots, including overall levels, orbits, shaft centerline,
Bode/Nyquist, cascade, waveform, and spectrum.
Overlay baseline plots (from portable or online systems)
on good startup plots to view differences.
With the transient live mode, you can make real-time decisions
with operators and production staff to bring a turbine up for
critical production needs or to shut down to protect the asset.
Transient data collection allows for continuous data recording
simultaneously on all channels. You can replay the stored data
for detailed analysis at any moment within the collection cycle.
www.emerson.com/ams 9
Page 10

Live 3D shaft animation plots show the actual motion of the shaft
around the average shaft position.
Shaft Animation Plots
The shaft animation plot shows the actual motion of the shaft
around the average shaft position. Click on displayed sensors
to bring up detailed spectrum, waveform, waterfall or bode/
Nyquist plots, while clicking on a bearing brings up orbit and
shaft centerline plots. Orbit and waveform plots have animated
cursors that update as the shaft rotates. You control the setup
information for the animation, including graphics quality,
play speed, and resting voltage and bearing clearance data
crucial for accuracy in the animation. The View Control buttons
provide four default views (front, side, top, and a combination
of the three). Or you can also rotate or pan across the view by
holding down either the left or right mouse button over the plot
and dragging. Rotating the mouse wheel changes the zoom.
January 2021AMS Machinery Manager
Wireless and Wired Transmitters
AMS Machinery Manager supports the import of advanced
diagnostic data, including spectra and waveforms from the
AMS 9420 Wireless Vibration Transmitter. This data along with
other types of process variables are imported via the Smart
Wireless Gateway. In addition, process data from any IEC
-approved WirelessHART®-enabled transmitter can be imported
into AMS Machinery Manager through the Smart Wireless
Gateway. Correlating both vibration and process data allows
for a more comprehensive analysis of developing problems.
With data import, you can view process automation information
or diagnostics from WirelessHART devices.
Conguration and user interface options in AMS Machinery
Manager optimize bandwidth usage, battery life, and time
spent interacting with transmitters:
Spectrum-on-Alert automatically retrieves only the data
you need, when you need it
Select spectrum resolution - from 400 to 1,600 lines -
to conserve power and bandwidth
Use efciency tools for easy mapping and conguration
of transmitters
Auto-calculate capabilities optimize network trafc
Use the device log to identify and resolve system issue
quickly by providing insight into transmitter operations
www.emerson.com/ams 10
Page 11

Vibration Analysis Packaging
Module/Package
Database Management
January 2021AMS Machinery Manager
A472008 A472001 A472002 A472003 A474505
Vib View
Transmitter
4 4 4 4 4
Vib View
Silver
Vib View
Gold
Vib View
Platinum
Vib View
Online
OilView Trivector Lab
ODBC Driver
Trend Plotting
Fault Frequencies
Advanced Plotting and Analysis Tools
Wizard Database Setup
CMMS Interface Tools
Advanced Reporting
Machine History Viewer
Asset History Management
Basic Statistical Alarm Management
Multi Window Plotting and Analysis
Dual-Monitor Support
Management Reporting
Multi Speed-Multi Plane Balance Calculator
Manual Data Entry
Route Management
4 4 4 4 4
4 4 4 4 4
4 4 4 4 4
4 4 4 4 4
4 4 4 4 4
4 4 4 4 4
4 4 4 4 4
4 4 4 4 4
4 4 4 4 4
4 4 4 4 4
4 4 4 4 4
4 4 4 4 4
4 4 4 4 4
4 4 4 4 4
4 4 4 4
4 4 4 4
4 4 4
Advanced Statistical Alarm Management
Rule-Based Automated Diagnostics
Additional Management Reporting
Dual-Channel and Transient Analysis Support
Advanced Cross-Channel Analysis, ODS/Modal Support
Online Database Conguration
Dashboard View of Monitored Equipment
4 4
4 4
4
4
4
4
4
www.emerson.com/ams 11
Page 12

January 2021AMS Machinery Manager
Oil Analysis
The AMS Machinery Manager Oil Analysis module turns oil
data into maintenance information. Applications for onsite oil
analysis, offsite laboratory data, and wear debris analysis can
be used individually or together to turn oil analysis data into a
predictive maintenance tool.
The Oil Analysis module performs automated analysis,
plotting and trending, data storage, and reporting,
and has a tutorial to get you running quickly.
The Trivector Plot condenses rows of data into one intuitive
plot with three vectors: chemistry, contamination, and wear.
Alarm levels on each vector are customized to the type of
machine and the operating environment.
The Minilab application supports both the AMS 5200 Machinery
Health Oil Analyzer and the Spectro 5200 oil analysis minilab.
Oil Analysis Packaging
It includes easy-to-understand graphical plots and trends for
each measurement, automated diagnostic interpretations and
recommendations, and step-by-step operational instructions for
each instrument.
The Lab Information Management System (LIMS) is a
comprehensive oil analysis management application that
imports data from most oil labs as well as oil analyzers and
minilabs from Spectro Incorporated. In addition to importing
data, LIMS also exports oil route information to Spectro
Scientic’s Q1100, Q230, and Q3050 mini-lab instrumentation.
The LIMS applications offers automatic reporting and
distribution, detailed sample tracking, and a custom
address book. Use of the LIMS package results in an efcient,
versatile oil analysis operation.
The Wear Debris Analysis application allows you to analyze
and compare images, store data, and report your ndings
on particulate material in the oil.
A475100 A475101 A475103
Module/Package Minilab LIMS Wear Debris Analysis
Advanced Plotting and Analysis Tools
Wizard Database Setup
Import Lab and Diagnosis
Step-by-Step Operational Instructions
Calibration, Operation, and Data Storage for each
Minilab Instrument
Automated Interpretation and Recommendations
Trivector Plot of Wear, Contamination,
and Chemistry
Database of Common Lubricants
Alarm Management
Create and Manage Batches
Sample Scheduling with Tools
Export Data and Reports
Print oil route point labels
Export oil route to Q1100, Q230, and Q3050
Import oil data from most Spectro Inc. analyzers
4 4 4
4 4 4
4 4 4
4
4
4
4
4
4 4
4
4
4
4
4
4
View and Analyze Wear Debris
WDA Image Library
4
4
www.emerson.com/ams 12
Page 13

January 2021AMS Machinery Manager
Infrared Thermography
A successful and efcient infrared thermography inspection
program is more than just an infrared camera. With AMS
Machinery Manager, you can execute a well-planned program
that mirrors the structure of your vibration analysis program –
from setup to reporting.
The Infrared Analysis module features a Diagnostic Fault
Tree that contains a log of equipment types, fault types,
and recommended actions.
Rather than simply annotating IR images, you can create a
detailed fault analysis of the image. The Fault Diagnostic Tree
reduces the time needed to analyze and report on images
and provides consistent analysis of anomalies, even between
different thermographers.
Tools for both analysis and reporting are available on a single
screen, allowing you to go directly from an IR image to detailed
analysis to a machinery health report quickly.
The Infrared Analysis module provides a complete set
of postscan analysis tools, allowing you to:
Indicate specic location temperatures with spot
meter placement
Draw lines across an image and produce a temperature prole
plot that indicates the temperature change along
the line
Place shapes on the image to produce a temperature
histogram plot
Identify locations of a specic temperature on an image
Users can view and analyze FLIR® visual and thermal images
using AMS Machinery Manager. The Infrared Analysis Module
supports FLIR Thermal Images for all current FLIR cameras.
The module also supports FLIRspecic palette types of Rainbow
and Rainbow High contrast and FLIR polyline annotation types.
AMS Machinery Manager also supports Fluke® infrared camera
images. With this functionality, you can view and fully analyze
Fluke visual and thermal images. IR reporting formats provide
selectable items for inclusion within the reports.
Because the database seamlessly integrates IR analysis with
other machinery health technologies, reports generated from
AMS Machinery Manager are powerful cross-technology tools
for verifying the fault and severity of machinery problems.
Infrared Packaging
A479400
Module/Package Infrared Thermography Silver
Database Management
Import/Export of IR data
Import IR Off-Route Image Files
Infrared Event Management
Information Framework
Set Environmental and Electrical Parameters
Detection of High-Resistance Joints
Thermal Prole Plot, Histogram, Isotherms, and Temperature Table
Over Ten Available Temperature Pallettes
Associate Temperature with Isotherms
Data Transfer
4
4
4
4
4
4
4
4
4
4
4
www.emerson.com/ams 13
Page 14

January 2021AMS Machinery Manager
Motor Diagnostics
AMS Machinery Manager provides analysis and diagnostic
tools for electric motor condition monitoring using Emerson’s
nonintrusive Flux Coil and Current Clamp. The Motor Diagnostic
module in AMS Machinery Manager detects motor-related
electrical faults, such as broken rotor bars, high-resistance
joints, voids in aluminum cast rotors, and cracked rotor end
rings in squirrel-cage induction motors.
The gold version of the Motor Diagnostics module can be
used to detect additional electrical problems, such as voltage
imbalance and faults in rotors and stators.
The Motor Diagnostics module features expert diagnostic
systems with patented technology to perform automated
analysis of collected ux, temperature, and shaft voltage/
current data. After diagnosis, AMS Machinery Manager provides
recommendations for appropriate follow-up actions – taking
the guesswork out of your analysis.
Laser Alignment and Dynamic Balancing
AMS Machinery Manager includes software modules for
laser alignment and dynamic balancing corrective actions.
The software archives job documentation generated by
AMS-brand alignment and balancing tools.
Results are automatically compared to original condition
tolerance specication for display and reporting. Once the job
is complete, data can be stored in AMS Machinery Manager for
reporting and future use. If it is necessary to revisit the same
machine at a later time, data can be downloaded to provide
an opportunity for a one-shot rebalance.
Laser alignment and precision balancing jobs can be stored and
reported in AMS Machinery Manager.
MotorView Packaging
A473001 A473002
Module/Package MotorView Silver MotorView Gold
Database Management
Analyzer Data Transfer
Route Management
Trend Plotting
Fault Frequencies
Motor Diagnostic Plotting and Analysis Tools
Detection of Rotor Related Faults
Detection of Broken Rotor Bars
Detection of High-Resistance Joints
Detection of Voids in Aluminum Cast Rotors & Cracked Rotor End Rings
in Squirrel-Cage Induction Motors
Detect Rotor and Voltage Imbalance
Flux Motor Analysis
Motor Surface Temperature Trending
4 4
4 4
4 4
4 4
4 4
4 4
4 4
4 4
4 4
4 4
4 4
4
4
Detect Electrical Problems in Rotors, Stators, and Voltage
4
www.emerson.com/ams 14
Page 15

January 2021AMS Machinery Manager
Continuing Support to Ensure Success
Training Courses Build Expertise
Emerson Educational Services help maximize the return on
your technology and personnel investment. Courses are taught
by professionals with experience in developing or working
within actual plant predictive or reliability-based maintenance
programs. Training is offered in Emerson’s state-of-the-art
training facilities or onsite, giving you expert training
without leaving your facility. Emerson also offers virtual
classroom training.
Certied instructors deliver the curriculum using Adobe
Connect Meeting Room with full audio and video support.
Students can pose question directly to the instructor or share
them with the classroom.
Technical Support You Can Count On
Your company makes signicant investments in technology
to safeguard its production assets. Emerson is committed to
providing quality technical support for your machinery analysis
tools. Our Technical Support Agreements for hardware and
software products do more than keep your technologies
running smoothly. They provide the latest functionality
for your existing technologies and protect your investment
through priority access to support and repair services.
AMS Machinery Manager Cloud Hosted Solution
Emerson has partnered with Microsoft to offer AMS Machinery
Manager Cloud Hosted Solution in the Azure platform.
This eliminates the need for customers to deploy and maintain
on-premise installations of the software along with costly
infrastructure investment. Available functionality includes
route vibration data upload and download, use of data lockers,
and the full breadth of vibration analysis and reporting tools
traditionally supported for the AMS 2140 in AMS Machinery
Manager.
Having your system on the cloud means that authorized
staff can securely access information and data anytime
and anywhere. This translates into enhanced mobility,
exibility and collaboration within your teams, with your
corporate analyst pool, or even with Emerson experts.
Asset Condition Monitoring Services
Emerson’s team of machinery monitoring experts can
supplement plant programs with Asset Condition Monitoring
Services. Specialists are available to monitor and analyze data
from Emerson’s route-based vibration analyzers, wireless
vibration devices, and online systems. They follow up with
easy-to-read, actionable periodic reports for your maintenance
department.
Contact Us
www.emerson.com/contactus
©2021, Emerson. All rights reserved.
The Emerson logo is a trademark and service mark of Emerson Electric Co. The AMS logo is
a mark of one of the Emerson family of companies. All other marks are the property of their
respective owners.
The contents of this publication are presented for informational purposes only, and while
diligent efforts were made to ensure their accuracy, they are not to be construed as warranties
or guarantees, express or implied, regarding the products or services described herein or their
use or applicability. All sales are governed by our terms and conditions, which are available on
request. We reserve the right to modify or improve the designs or specifications of our products
at any time without notice.
 Loading...