

Page 1

Ember Evaluation Kit
User’s Guide
Final
120-0047-000C
28 May 2004
Page 2

FCC Compliance for the CC1020 and EM2420 Ember Evaluation Modules
Compliance Statement (Part 15.19)
The Ember Evaluation Kit Module complies with Part 15 of the FCC Rules and with RSS-210 of Industry Canada.
Operation is subject to the following two conditions:
--This device may not cause harmful interference, and
--This device must accept any interference received, including interference that may cause undesired operation.
War nin g (Pa r t 1 5.21)
Changes or modifications not expressly approved by the party responsible for compliance could void the user's authority to operate the
equipment.
RF Exposure (OET Bulletin 65)
To comply with FCC RF exposure requirements for mobile transmitting devices, this transmitter should only be used or installed at
locations where there is at least 20 cm separation distance between the antenna and all persons.
FCC, Industry Canada, and CE certifications for the CC1020 and EM2420 Ember Evaluation Modules are pending.
Copyright © 2002-2004 by Ember Corporation
All rights reserved.
The information in this document is subject to change without notice. The statements, configurations, technical data, and
recommendations in this document are believed to be accurate and reliable but are presented without express or implied warranty.
Users must take full responsibility for their applications of any products specified in this document. The information in this document
is the property of Ember Corporation.
Title, ownership, and all rights in copyrights, patents, trademarks, trade secrets and other intellectual property rights in the Ember
Proprietary Products and any copy, portion, or modification thereof, shall not transfer to Purchaser or its customers and shall remain in
Ember and its licensors.
No source code rights are granted to Purchaser or its customers with respect to all Ember Application Software. Purchaser agrees not
to copy, modify, alter, translate, decompile, disassemble, or reverse engineer the Ember Hardware (including without limitation any
embedded software) or attempt to disable any security devices or codes incorporated in the Ember Hardware. Purchaser shall not alter,
remove, or obscure any printed or displayed legal notices contained on or in the Ember Hardware.
EmberNet, Ember Enabled, Ember, and the Ember logo are trademarks of Ember Corporation.
All other trademarks are the property of their respective holders.
Page 3

Contents
Document Purpose .......................................................................................................................8
Audience .......................................................................................................................................8
Documentation Conventions .......................................................................................................8
Safety Symbols .............................................................................................................................9
Chapter 1 Evaluation Kit Overview .............................................................. 10
Purpose of the Evaluation Kit ...................................................................................................10
Evaluation Kit Contents .............................................................................................................11
Hardware and Software Requirements ...................................................................................11
Hardware Description ..............................................................................................................12
Ember Evaluation Module .................................................................................................12
Power Adapter Cable .......................................................................................................12
Serial Adapter Cable ........................................................................................................13
Software Description .................................................................................................................13
Ember Studio Lite ............................................................................................................... 14
Ember Chat .........................................................................................................................14
Accessing the EUI Number ......................................................................................................14
Getting Help .............................................................................................................................. 15
Chapter 2 Operating and Maintaining Evaluation Kit Components........... 16
Operating Evaluation Kit Modules .......................................................................................... 16
Positioning Modules .......................................................................................................... 16
Activating Modules ............................................................................................................17
Turning Modules On and Off ...........................................................................................17
Connecting Modules to an External Power Source ........................................................18
Reading Module Lights ...................................................................................................... 18
Connecting a PC to a Gateway Module ........................................................................19
Connecting and Positioning the Antenna ........................................................................20
Maintaining Evaluation Kit Modules .......................................................................................20
Inserting or Changing Module Batteries ..........................................................................20
Storing Modules .................................................................................................................21
Ember Evaluation Kit User’s Guide 120-0047-000C Final Page 3
Page 4

Cleaning Modules .............................................................................................................21
Chapter 3 Evaluating EmberNet Networks................................................... 22
About EmberNet Networks ......................................................................................................22
Evaluating a Simple EmberNet Network ................................................................................22
Evaluating Complex EmberNet Networks ..............................................................................26
Subdividing a Complex Network Via Radio Channels ......................................................... 26
Chapter 4 Using the Evaluation Kit Sample Applications ............................ 28
Available Evaluation Kit Sample Applications .......................................................................28
Using the Sensor Data Application ......................................................................................... 29
Available Sensor Data ......................................................................................................29
Obtaining Sensor Data .....................................................................................................30
Using the Power Management Application ...........................................................................30
Using the Node Pairing Application .......................................................................................30
Using the Ember Chat Application ..........................................................................................33
Setting Up to Run Ember Chat ..........................................................................................33
Installing Ember Chat .........................................................................................................33
Opening Ember Chat ........................................................................................................ 33
Using Ember Chat ..............................................................................................................34
Closing Ember Chat ...........................................................................................................36
Uninstalling Ember Chat ....................................................................................................36
Chapter 5 Collecting and Viewing Sensor Data ........................................... 37
Stimulating Sensors to Obtain Data ........................................................................................37
Collecting Sensor Data .............................................................................................................37
Viewing Sensor Data ................................................................................................................ 39
Viewing Raw Sensor Data ................................................................................................ 39
Viewing Sensor Data Graphs ...........................................................................................40
Enabling Power Management .................................................................................................40
Chapter 6 Getting Started with Ember Studio Lite........................................ 42
Installing Ember Studio Lite ......................................................................................................42
Opening and Closing Ember Studio Lite ................................................................................ 42
Viewing Ember Studio Lite Help ..............................................................................................43
About the Ember Studio Lite Main Window ...........................................................................43
About the Folder Tree ........................................................................................................44
About the Message Pane ..................................................................................................44
Printing the Main Window ................................................................................................ 45
Ember Evaluation Kit User’s Guide 120-0047-000C Final Page 4
Page 5

Connecting to a Network .........................................................................................................45
Using the Network Connection Wizard ..........................................................................46
Switching to a Different Network ..................................................................................... 47
Deleting a Network Connection .......................................................................................48
Changing Network Settings .....................................................................................................48
Using the Network Map ........................................................................................................... 50
Network Map Elements ....................................................................................................51
Refreshing the Network Map ...........................................................................................52
Moving Network Map Icons ............................................................................................52
Configuring Network Map Preferences ..........................................................................52
Displaying a Custom Background Image ........................................................................ 54
Chapter 7 Managing Network Nodes .......................................................... 55
Viewing Node Status Information ...........................................................................................55
Viewing Node Parameters ....................................................................................................... 56
Viewing Node Statistics ............................................................................................................57
Viewing Node Properties .........................................................................................................59
Setting Node Properties ...........................................................................................................62
Pinging a Node .........................................................................................................................62
Rebooting a Node ....................................................................................................................63
Viewing Node Status Messages .............................................................................................. 63
Chapter 8 Testing the Network ...................................................................... 64
Available Network Tests ...........................................................................................................64
How Ember Studio Lite Implements Network Tests ................................................................64
Ensuring a Successful Network Test ........................................................................................65
Ping Test Example ..............................................................................................................66
Trace Route Test Example .................................................................................................68
Performing a Ping Test ..............................................................................................................69
Running a Ping Test ............................................................................................................69
Reading Ping Test Results ..................................................................................................71
Performing a Trace Route Test .................................................................................................73
Running a Trace Route Test ...............................................................................................73
Reading Trace Route Test Results ..................................................................................... 75
Viewing Results of Previously Run Tests ...................................................................................79
Deleting Test Results ..................................................................................................................79
Configuring Ping and Trace Route Test Preferences ..............................................................79
Ember Evaluation Kit User’s Guide 120-0047-000C Final Page 5
Page 6

Chapter 9 Uploading EmberNet Upgrades .................................................. 81
Obtaining EmberNet Upgrades ..............................................................................................81
Uploading a New EmberNet Image to Modules ..................................................................81
Appendix A Ember Studio Lite Quick Reference .............................................. 84
Appendix B Ember Evaluation Module Technical Features ............................ 89
Appendix C Module Radio Settings .................................................................. 91
Transmission Power Settings .....................................................................................................91
EM2420 .............................................................................................................................91
CC1020 .............................................................................................................................92
Radiofrequency Channel Settings ...........................................................................................93
EM2420 .............................................................................................................................93
CC1020, 868MHz ........................................................................................................... 93
CC1020, 915MH ............................................................................................................. 94
Appendix D Ember Serial Command Set Reference ........................................ 95
About the Ember Serial Command Set ...................................................................................95
Command Syntax ......................................................................................................................95
Commands .................................................................................................................................96
deliver .................................................................................................................................96
broadcast ............................................................................................................................ 96
local_id ...............................................................................................................................96
ping .....................................................................................................................................97
ping_all ...............................................................................................................................97
reset .....................................................................................................................................97
set_channel ......................................................................................................................... 98
set_local_id ........................................................................................................................98
set_power ........................................................................................................................... 98
status ....................................................................................................................................99
Responses ..................................................................................................................................99
Error Messages .........................................................................................................................99
Resetting Local IDs ..................................................................................................................101
Configuring a Terminal Emulator for the Serial Command Set ...........................................101
Ember Evaluation Kit User’s Guide 120-0047-000C Final Page 6
Page 7

Ember Evaluation Kit User’s Guide 120-0047-000C Final Page 7
Page 8

About This Document
Document Purpose . . . . . . . . . . . . . . . . . . . . . . . . . . . . . . . . . . . . . . . . . . . . . . . . . . . . 8
Audience . . . . . . . . . . . . . . . . . . . . . . . . . . . . . . . . . . . . . . . . . . . . . . . . . . . . . . . . . . . 8
Documentation Conventions . . . . . . . . . . . . . . . . . . . . . . . . . . . . . . . . . . . . . . . . . . . . 8
Safety Symbols. . . . . . . . . . . . . . . . . . . . . . . . . . . . . . . . . . . . . . . . . . . . . . . . . . . . . . . 9
Document Purpose
This document describes the contents and use of the Ember Evaluation Kit, including
equipment and software installation, EmberNet™ network setup, use of Ember Studio Lite,
and the debugging, building, and uploading of applications.
Audience
The audience for this document is customers who have purchased the Ember Evaluation Kit.
Customers are assumed to understand basic networking concepts and to be familiar with
networking hardware and software.
Documentation Conventions
Notation Meaning Example
Italics Identifies on-screen software menu
options.
UPPERCASE Identifies a keyboard key. ENTER
Right-angle bracket Delimits a series of software program
menu options to be clicked.
Courier Identifies software code and, in body
text, variables.
Angle brackets around
a term
Delimits a placeholder to be replaced
with the data indicated by the term.
Refresh Screen
Open > Save
void Main(String[] argv)
the buffer variable
<ipAddress>
Ember Evaluation Kit User’s Guide 120-0047-000C Final Page 8
Page 9
Safety Symbols
Symbol Meaning
Signifies a warning about a potential personal safety hazard.
Safety Symbols
Caution!
Signifies a warning about a potential hazard to a piece of equipment.
Ember Evaluation Kit User’s Guide 120-0047-000C Final Page 9
Page 10

CHAPTER 1 Evaluation Kit Overview
Purpose of the Evaluation Kit . . . . . . . . . . . . . . . . . . . . . . . . . . . . . . . . . . . . . . . . . . . 10
Evaluation Kit Contents . . . . . . . . . . . . . . . . . . . . . . . . . . . . . . . . . . . . . . . . . . . . . . . 11
Hardware and Software Requirements . . . . . . . . . . . . . . . . . . . . . . . . . . . . . . . . . . . 11
Hardware Description . . . . . . . . . . . . . . . . . . . . . . . . . . . . . . . . . . . . . . . . . . . . . . . . 12
Ember Evaluation Module . . . . . . . . . . . . . . . . . . . . . . . . . . . . . . . . . . . . . . 12
Power Adapter Cable . . . . . . . . . . . . . . . . . . . . . . . . . . . . . . . . . . . . . . . . . 12
Serial Adapter Cable. . . . . . . . . . . . . . . . . . . . . . . . . . . . . . . . . . . . . . . . . . 13
Software Description . . . . . . . . . . . . . . . . . . . . . . . . . . . . . . . . . . . . . . . . . . . . . . . . . 13
Ember Studio Lite . . . . . . . . . . . . . . . . . . . . . . . . . . . . . . . . . . . . . . . . . . . . . 14
Ember Chat. . . . . . . . . . . . . . . . . . . . . . . . . . . . . . . . . . . . . . . . . . . . . . . . . . 14
Accessing the EUI Number . . . . . . . . . . . . . . . . . . . . . . . . . . . . . . . . . . . . . . . . . . . . 14
Getting Help. . . . . . . . . . . . . . . . . . . . . . . . . . . . . . . . . . . . . . . . . . . . . . . . . . . . . . . . 15
Purpose of the Evaluation Kit
Ember recognizes that you need to evaluate wireless solutions in your own environment
before investing valuable resources to develop products centered on new technology. The
Ember Evaluation Kit gives you everything you need to demonstrate a live wireless sensor
network instantly and to begin to characterize the technology for your environment and
application—for example:
z Observe the self-healing, self-organizing nature of an EmberNet network
z View and test real-time network traffic patterns
z Configure network parameters
z Send and receive several types of data over the network
The Evaluation Kit is not intended to be used for:
z Application development
z Resale
z Extended use or use in operating conditions exceeding those listed in Appendix B,
“Ember Evaluation Module Technical Features.”
z Any purpose other than evaluating Ember technology for business purposes
Ember Evaluation Kit User’s Guide 120-0047-000C Final Page 10
Page 11

Chapter 1: Evaluation Kit Overview Evaluation Kit Contents
Evaluation Kit Contents
Your Evaluation Kit contains the following items:
Hardware
z 12 Ember Evaluation Modules
z 12 external antennas
z 2 AC power adapters with snap-on North American,
European, United Kingdom, and Australian plugs
z 2 serial adapter cables
z 24 AAA batteries
z 1 phillips screwdriver
CD
z Ember Studio Lite
z Ember Chat
z Ember Studio Lite Release Notes, Adobe PDF file
z Ember Evaluation Kit User’s Guide, Adobe PDF file (this
document)
z Datasheet for the radio chip that you purchased, Adobe PDF
file:
z Quick Start Guide: Ember Evaluation Kit, Adobe PDF file
z Microsoft .NET Framework
Hardware and Software Requirements
The following hardware and software conditions must be in place before you can use your
Evaluation Kit:
Hardware
z Available RS-232 serial port or USB port
requirements
Software
requirements
z Microsoft Windows 2000 or XP
z Adobe Acrobat Reader (available free from www.adobe.com)
z Microsoft .NET Framework, required for running the Ember
Chat application (The Evaluation Kit includes a .NET
Framework installer as a convenience for customers who do
not already have .NET installed.)
Ember Evaluation Kit User’s Guide 120-0047-000C Final Page 11
Page 12
Chapter 1: Evaluation Kit Overview Hardware Description
Hardware Description
Ember Evaluation Module
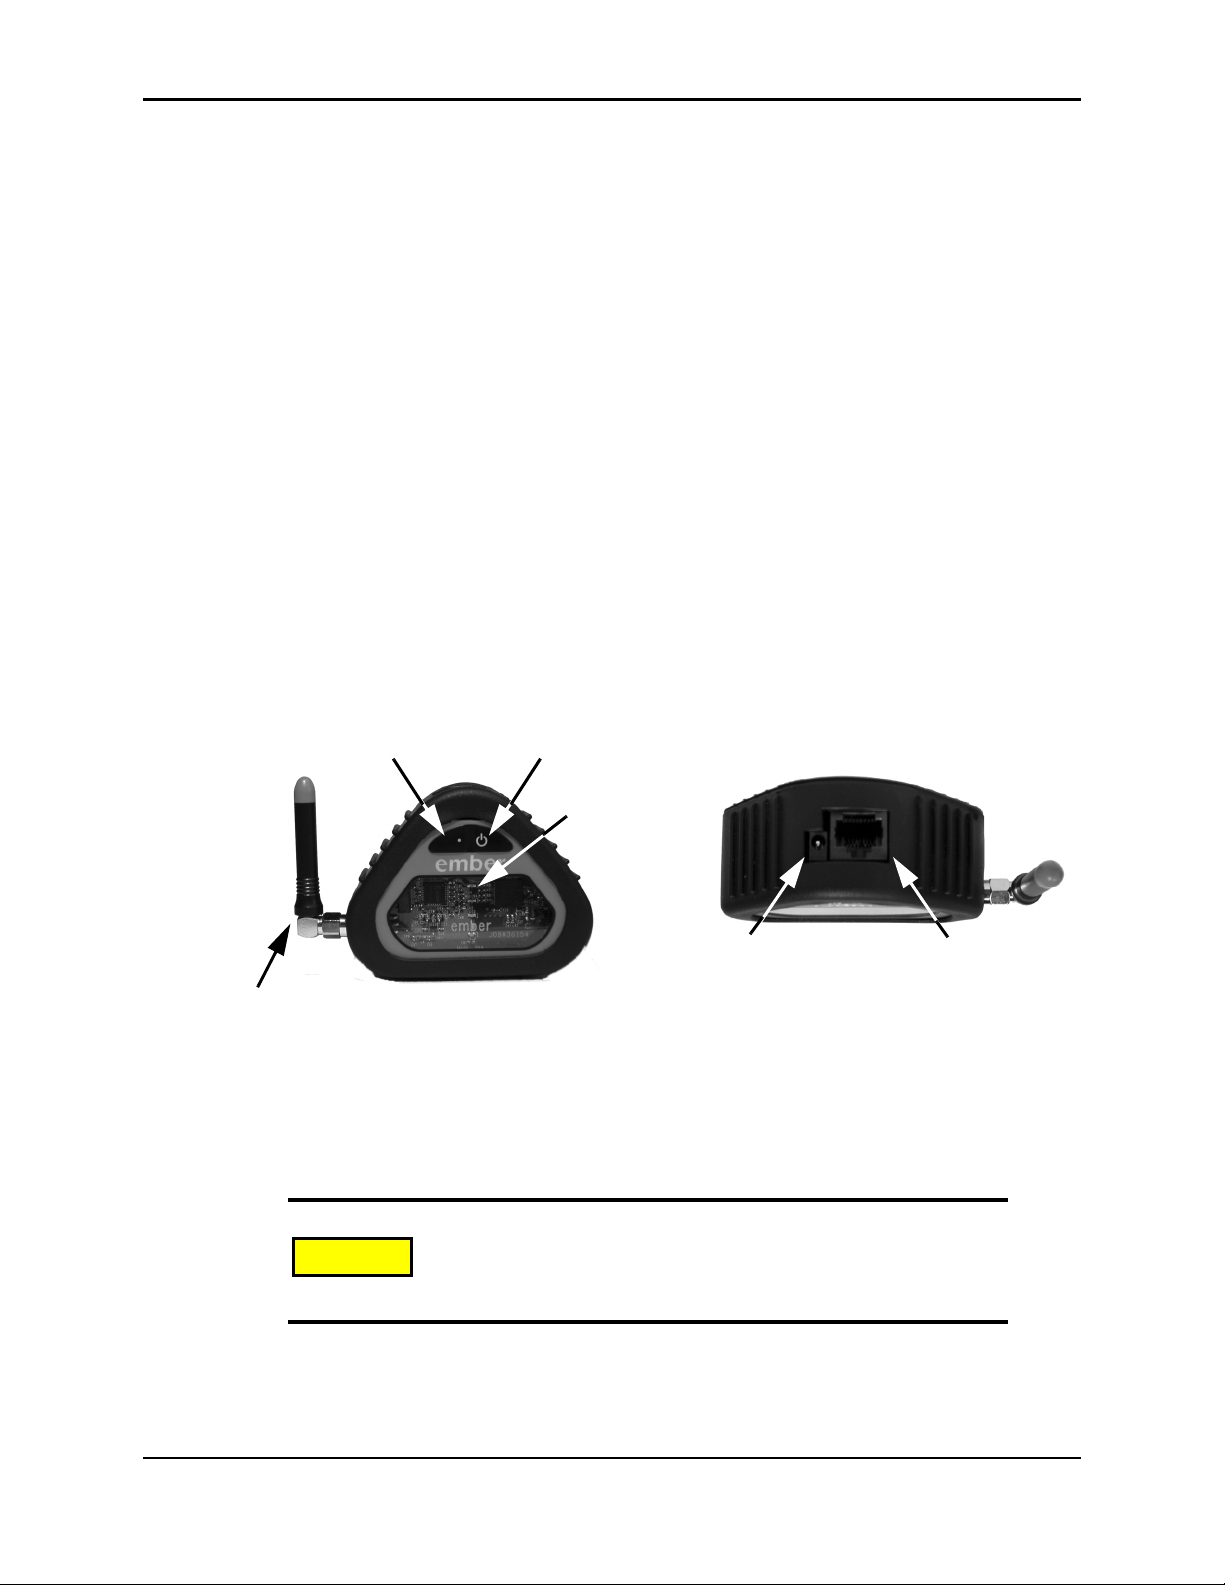
The Ember Evaluation module (Figure 1-1) is a small device containing a low-power radio of
your choice:
z CC1020 operating at the 868 or 915MHz band
z EM2420 operating at the 2.4GHz band
The radio has been designed to work with the supplied external antenna and will not perform
as expected if a different antenna is attached to the module.
The module can operate on battery power or by an external electrical source (such as an
electrical power outlet) via the supplied power adapter. See chapter 2, “Operating and
Maintaining Evaluation Kit Components,” for detailed operating instructions.
Modules are uniquely identified by their IEEE extended unique identifier (EUI), which
appears on a label on the back of the module and in Ember Studio Lite (see “Accessing the
EUI Number” on page 14).
Appendix B, “Ember Evaluation Module Technical Features,” describes the technical features
of the module.
Programmable
button
Antenna
Figure 1-1: External features
Power Adapter Cable
Caution!
Power button
LEDs
RJ45 Serial portPower connector
Use only the power adapter cable provided in your Evaluation Kit.
Using any other power adapter cable can severely damage the
module microprocessor.
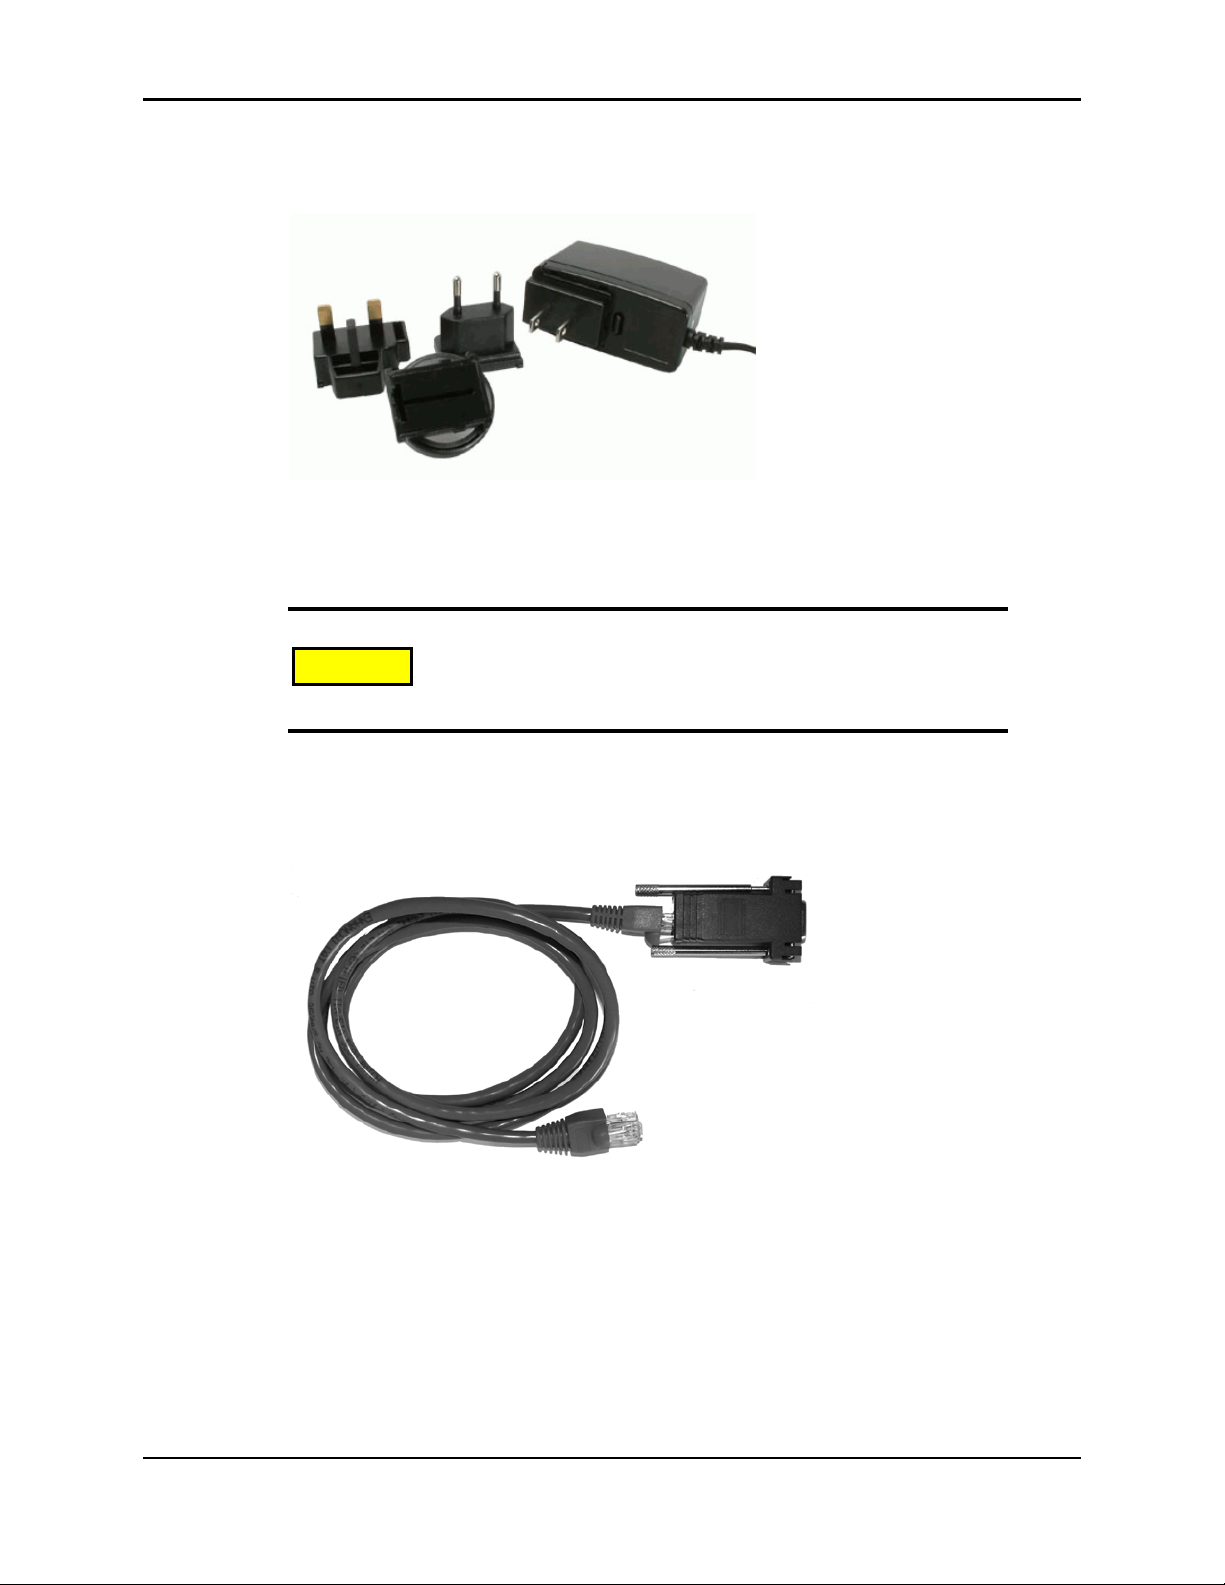
The AC power adapter cable (Figure 1-2) is a linear regulated wall plug power supply with
5.0VDC at 1600mA regulated output. It has a six-foot output cord and a power supply with
four interchangeable snap-in input plugs (North American, European, United Kingdom, and
Ember Evaluation Kit User’s Guide 120-0047-000C Final Page 12
Page 13
Chapter 1: Evaluation Kit Overview Software Description
Australian). The cable in your Evaluation Kit has been approved by the correct regulatory
agency for your location.
Figure 1-2: Power adapter cable
Serial Adapter Cable
Use only the serial adapter cable provided in your Evaluation Kit.
Caution!
Using any other serial adapter cable can severely damage the
module microprocessor.
The serial adapter cable (Figure 1-3) is an Ethernet CAT-5E patch cable with RJ45
connectors. The RJ45-to-DB9S adapter attached to one end of the cable has been specially
altered to work with Evaluation Kit modules.
Figure 1-3: Serial adapter cable
Software Description
Note: The Evaluation Kit is not intended for application development. If you would like to
develop applications, a complete EmberNet API is provided with the Developer Kit,
along with comprehensive support services. Contact Ember for more information
about this kit (see “Getting Help” on page 15).
Ember Evaluation Kit User’s Guide 120-0047-000C Final Page 13
Page 14
Chapter 1: Evaluation Kit Overview Accessing the EUI Number
Ember Studio Lite
Ember Studio Lite allows you to explore the capabilities of Ember radios running the
EmberNet networking software:
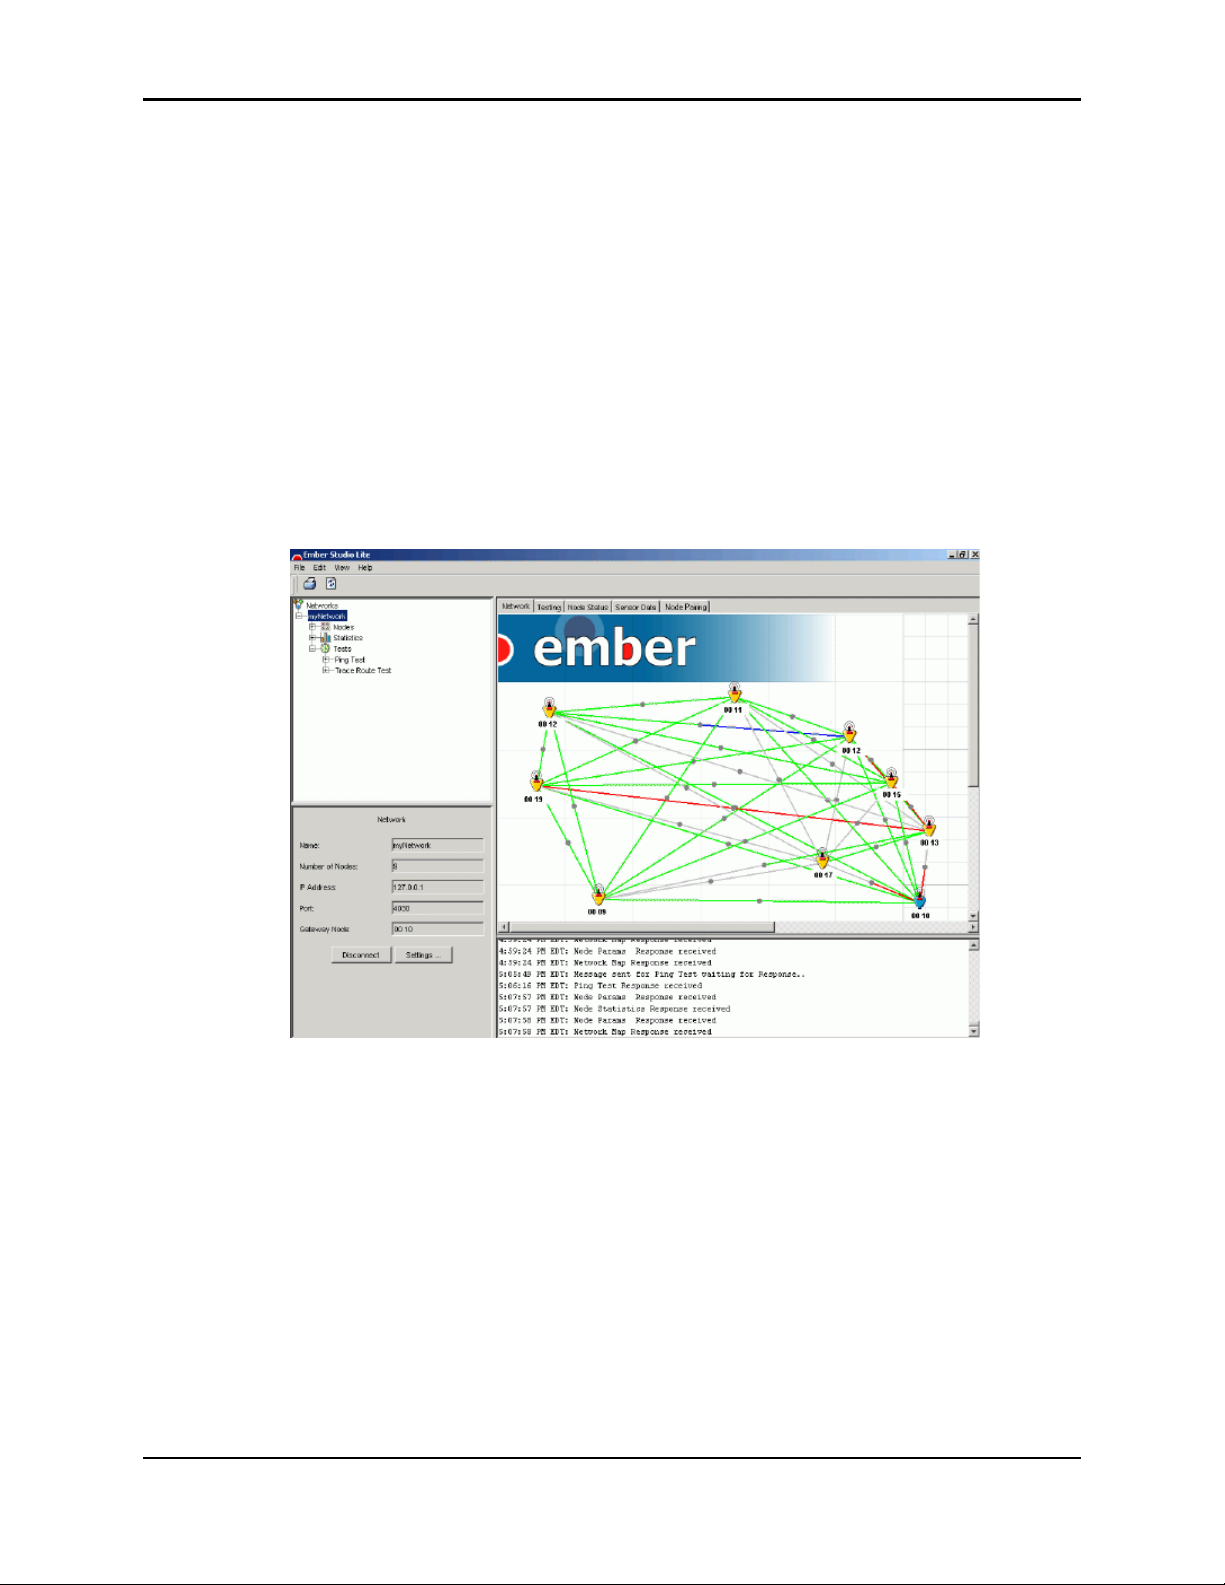
z View a customizable real-time map of networked Evaluation Kit modules (see Figure
1-4).
z View network performance data.
z Run network tests (ping, trace route).
z Gather and display live temperature, orientation, and power data from sensors embedded
in Evaluation Kit modules.
z View paired nodes in the network map.
z Configure network and module settings.
z Print the main window.
Figure 1-4: Ember Studio Lite main window
Ember Chat
Ember Chat is a sample application that demonstrates data transmission via the RS-232 port.
For information about running Ember Chat, see “Using the Ember Chat Application” on
page 33.
Accessing the EUI Number
A hexadecimal representation of the IEEE 64-bit EUI number for a module is printed on a
label on the back of the module and is also visible in the Address64Bit field of the Node
Properties window in Ember Studio Lite. See “Viewing Node Properties” on page 59 for
information on opening this window.
Ember Evaluation Kit User’s Guide 120-0047-000C Final Page 14
Page 15

Chapter 1: Evaluation Kit Overview Getting Help
Getting Help
If you have any questions about your Evaluation Kit, please contact your Ember account
representative:
United States 313 Congress Street, 4th Floor
Boston, MA 02210
Telephone: +1 617-951-0200
Fax:+1 617-951-0999
Email: [email protected]
Europe Unit 29
Science Park, Milton Road
Cambridge
CB4 0DW, UK
Telephone : +44 (0) 1223 423322
Fax : +44 (0) 1223 423390
Email: [email protected]
The Ember website contains information about the full range of Ember products and
services and allows you to sign up for the support section of the site:
support.ember.com
Ember Evaluation Kit User’s Guide 120-0047-000C Final Page 15
Page 16
CHAPTER 2 Operating and Maintaining
Evaluation Kit Components
Operating Evaluation Kit Modules . . . . . . . . . . . . . . . . . . . . . . . . . . . . . . . . . . . . . . 16
Positioning Modules . . . . . . . . . . . . . . . . . . . . . . . . . . . . . . . . . . . . . . . . . . . 16
Activating Modules . . . . . . . . . . . . . . . . . . . . . . . . . . . . . . . . . . . . . . . . . . . 17
Turning Modules On and Off . . . . . . . . . . . . . . . . . . . . . . . . . . . . . . . . . . . 17
Connecting Modules to an External Power Source. . . . . . . . . . . . . . . . . . . 18
Reading Module Lights . . . . . . . . . . . . . . . . . . . . . . . . . . . . . . . . . . . . . . . . 18
Connecting a PC to a Gateway Module. . . . . . . . . . . . . . . . . . . . . . . . . . . 19
Connecting and Positioning the Antenna. . . . . . . . . . . . . . . . . . . . . . . . . . .20
Maintaining Evaluation Kit Modules . . . . . . . . . . . . . . . . . . . . . . . . . . . . . . . . . . . . .20
Inserting or Changing Module Batteries . . . . . . . . . . . . . . . . . . . . . . . . . . .20
Storing Modules. . . . . . . . . . . . . . . . . . . . . . . . . . . . . . . . . . . . . . . . . . . . . . 21
Cleaning Modules . . . . . . . . . . . . . . . . . . . . . . . . . . . . . . . . . . . . . . . . . . . . 21
Operating Evaluation Kit Modules
Positioning Modules
Warning! Position Evaluation Kit modules so that they are at least
20 cm away from users, to avoid exposing users to excessive
radiofrequency emissions, as determined by the FCC.
You can position Ember Evaluation Kit modules in any spatial orientation (for example,
horizontally, vertically, or upside-down), but for optimal performance all devices should be
positioned with the antennas in the same orientation. When placing modules to set up a
network, observe the operating temperature limits described in Appendix B, “Ember
Evaluation Module Technical Features.”
Ember Evaluation Kit User’s Guide 120-0047-000C Final Page 16
Page 17

Chapter 2: Operating and Maintaining Evaluation Kit Components Operating Evaluation Kit Modules
In general, objects near modules do not affect radio transmission. Very large solid objects
such as walls and metal objects can diminish the radio range of modules positioned within a
few inches of them. Placing a module within a metal box can completely isolate the module
from the network. Repositioning the module 20 to 30 cm from any obstructions will usually
restore full range. You can also reconfigure the network to work around a radio obstacle.
Modules operating in the 2.4Ghz spectrum will have the same restrictions as the lower
frequency nodes, except that they are also likely to be significantly affected by being placed
closely to water or objects containing large amounts of water.
Activating Modules
Modules are shipped in a shut-down state, without batteries and with a black plastic plug
inserted into the power connector. To activate the modules, remove the black plastic plug and
power them up by either inserting batteries (see “Inserting or Changing Module Batteries” on
page 20) or connecting them to an external power source such as an electrical power outlet
(see “Connecting Modules to an External Power Source” on page 18). The power indicator
light will begin blinking in a pattern that indicates the power source that the module is using
(see “Reading Module Lights” on page 18).
After modules have been activated, you can turn them on and off by pressing the power
button. Note that battery-powered modules continue to consume power even after being
turned off via the power button. For further information about this, see “Turning Modules
On and Off ” on page 17.
Note: Do not discard the black plastic plug. It it required to completely power down
modules and should be reinstalled in the module when the module is not in use.
Turning Modules On and Off
To turn modules on and off, press the power button until the module beeps. When modules
are turned on, their power indicator light blinks in a pattern determined by the power source
(see “Reading Module Lights” on page 18). When modules are turned off, this light stops
blinking.
Turning a module off does not necessarily fully power it down:
z Modules that do not have batteries inserted and that have been connected to an external
power source are fully powered down when turned off.
z Modules containing batteries will continue to use low levels of power when turned off.
This is true both for battery-operated modules and for modules containing batteries that
are operating via external power.
To fully power down a module that contains batteries:
Insert the black plastic plug into the power connector.
Ember Evaluation Kit User’s Guide 120-0047-000C Final Page 17
Page 18
Chapter 2: Operating and Maintaining Evaluation Kit Components Operating Evaluation Kit Modules
Connecting Modules to an External Power Source
Use only the power adapter cable provided in your Evaluation Kit.
Caution!
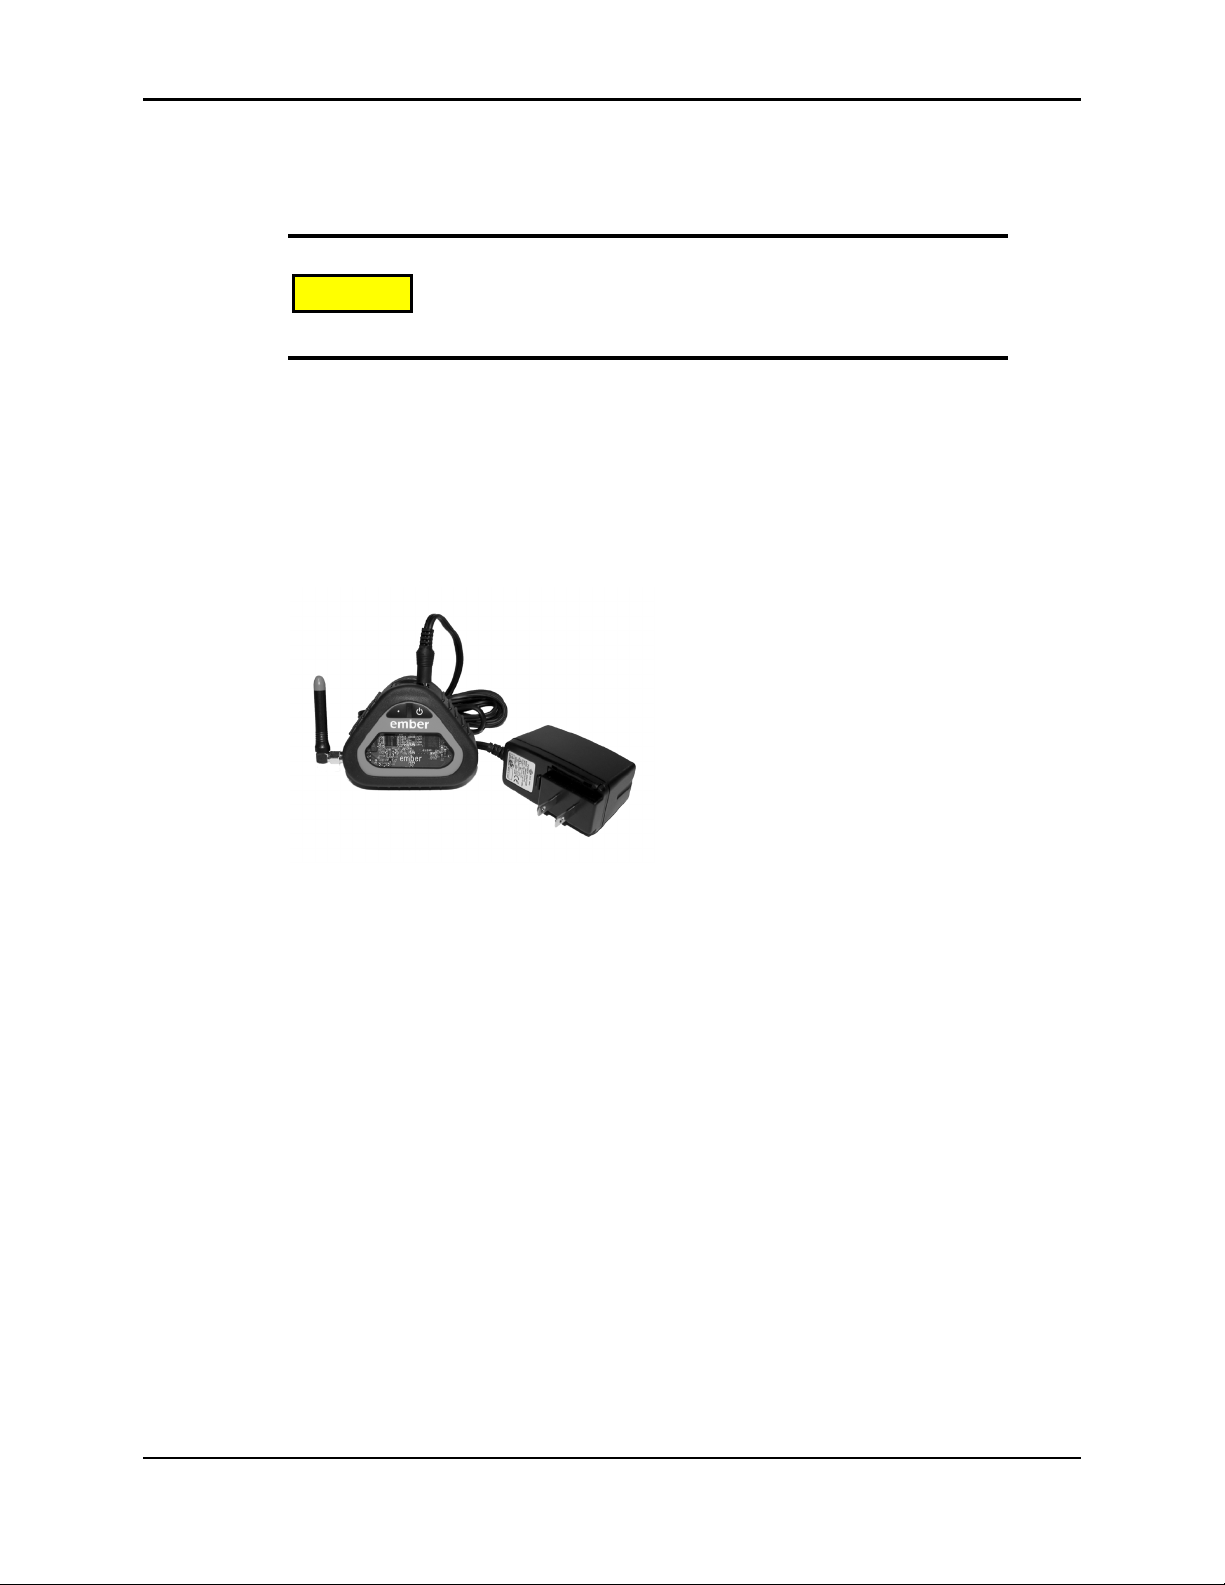
To power a module by an external power source such as an electrical power outlet, snap the
correct input plug into the adapter, connect the power adapter to the module (Figure 2-1),
and plug the adapter into the power source. The power indicator light will begin to blink in
the external power source pattern (see “Reading Module Lights” on page 18).
If the module contains batteries, unplugging the power adapter from the module will switch
the module to battery power.
Using any other power adapter cable can severely damage the
module microprocessor.
Figure 2-1: Module with connected power adapter
Reading Module Lights
Network Traffic Light
The network traffic light blinks whenever the module receives packet data.
Ember Evaluation Kit User’s Guide 120-0047-000C Final Page 18
Page 19
Chapter 2: Operating and Maintaining Evaluation Kit Components Operating Evaluation Kit Modules
Power Indicator Light
The power indicator light blinks in a pattern determined by the power source
= light on, — = light off):
(
Battery, full power Quick flashes of light separated by lengthy pauses
—————————)
(
Battery, low power Two quick flashes of light separated by lengthy pauses
–———–———–———)
(
External power via
power adapter
Long bursts of light separated by medium-length pauses
——————)
(
Note: When a module begins blinking in the low-battery-power pattern, change the
batteries as soon as is practical, because when battery power drops below a certain
level, modules can behave in an erratic manner.
Connecting a PC to a Gateway Module
Use only the serial adapter cable provided in your Evaluation Kit.
Caution!
Any module can serve as the gateway for the network, once it has been connected to a PC.
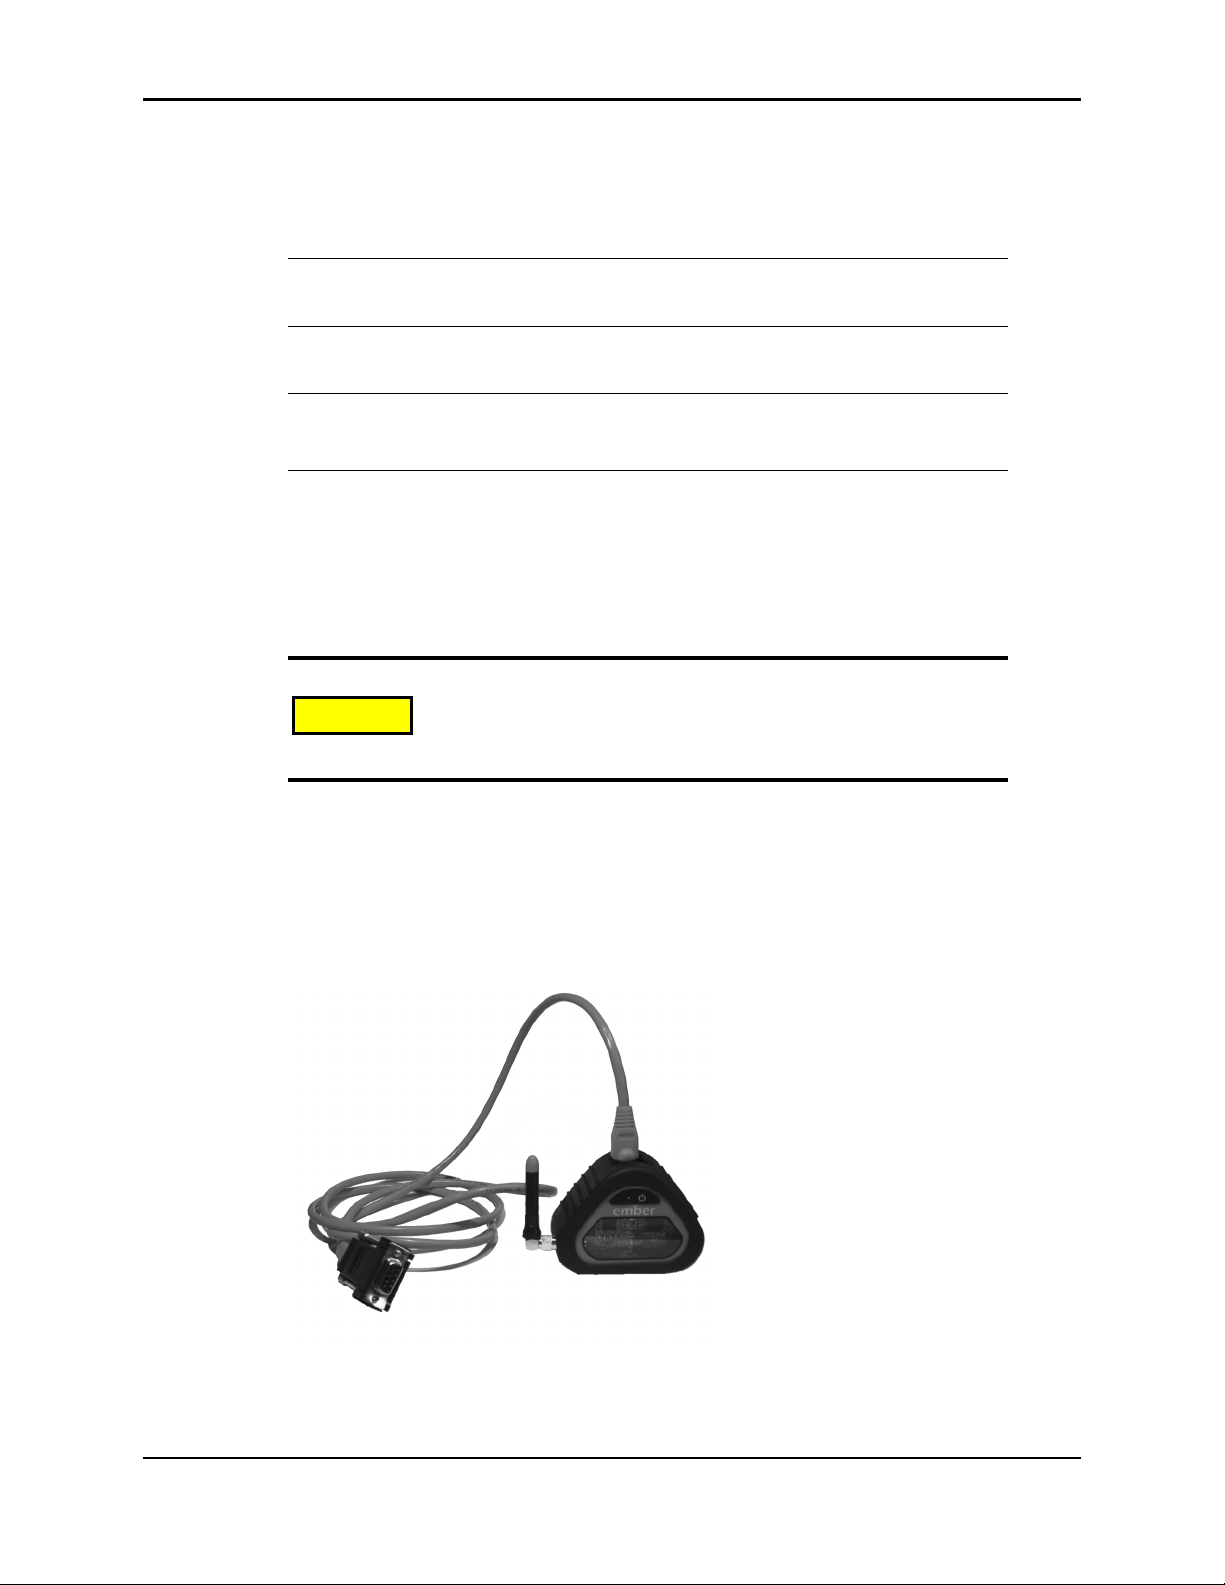
Use the Evaluation Kit serial adapter cable to connect the gateway module
to a PC (Figure 2-2).
If your computer only has a USB port, you can use any USB–to–RS-232 adapter to connect
the serial adapter cable to the computer.
Using any other serial adapter cable can severely damage the
module microprocessor.
Figure 2-2: Module with connected serial adapter cable
Ember Evaluation Kit User’s Guide 120-0047-000C Final Page 19
Page 20
Chapter 2: Operating and Maintaining Evaluation Kit Components Maintaining Evaluation Kit Modules
Connecting and Positioning the Antenna
Before connecting the antenna to an Evaluation Kit module, make
Caution!
Use only the antennas supplied in your Evaluation Kit. Using different antennas will degrade
the radio performance of modules.
To connect the antenna:
1. Make sure the module is completely powered down:
Battery-powered module: Insert the black plastic plug into the power connector.
Module running on external power: Unplug the module from the power source.
Module running on external power but with batteries inserted: Unplug the
module from the power source, then insert the black plastic plug into the power
connector.
2. Connect the antenna to the module RP-SMA connector.
sure the module is completely powered down. Connecting an
antenna to a module that is running on either battery or external
power can damage the module’s radio chip.
3. Tighten the RP-SMA connector to finger-tightness only.
To position the antenna:
To obtain the best possible reception, point all antennas in a network in the same direction.
Maintaining Evaluation Kit Modules
Inserting or Changing Module Batteries
The circuit board inside the Evaluation Kit module is sensitive to
Caution!
Change batteries when the power indicator light flashes in the low-battery-power pattern (see
“Reading Module Lights” on page 18).
To change module batteries:
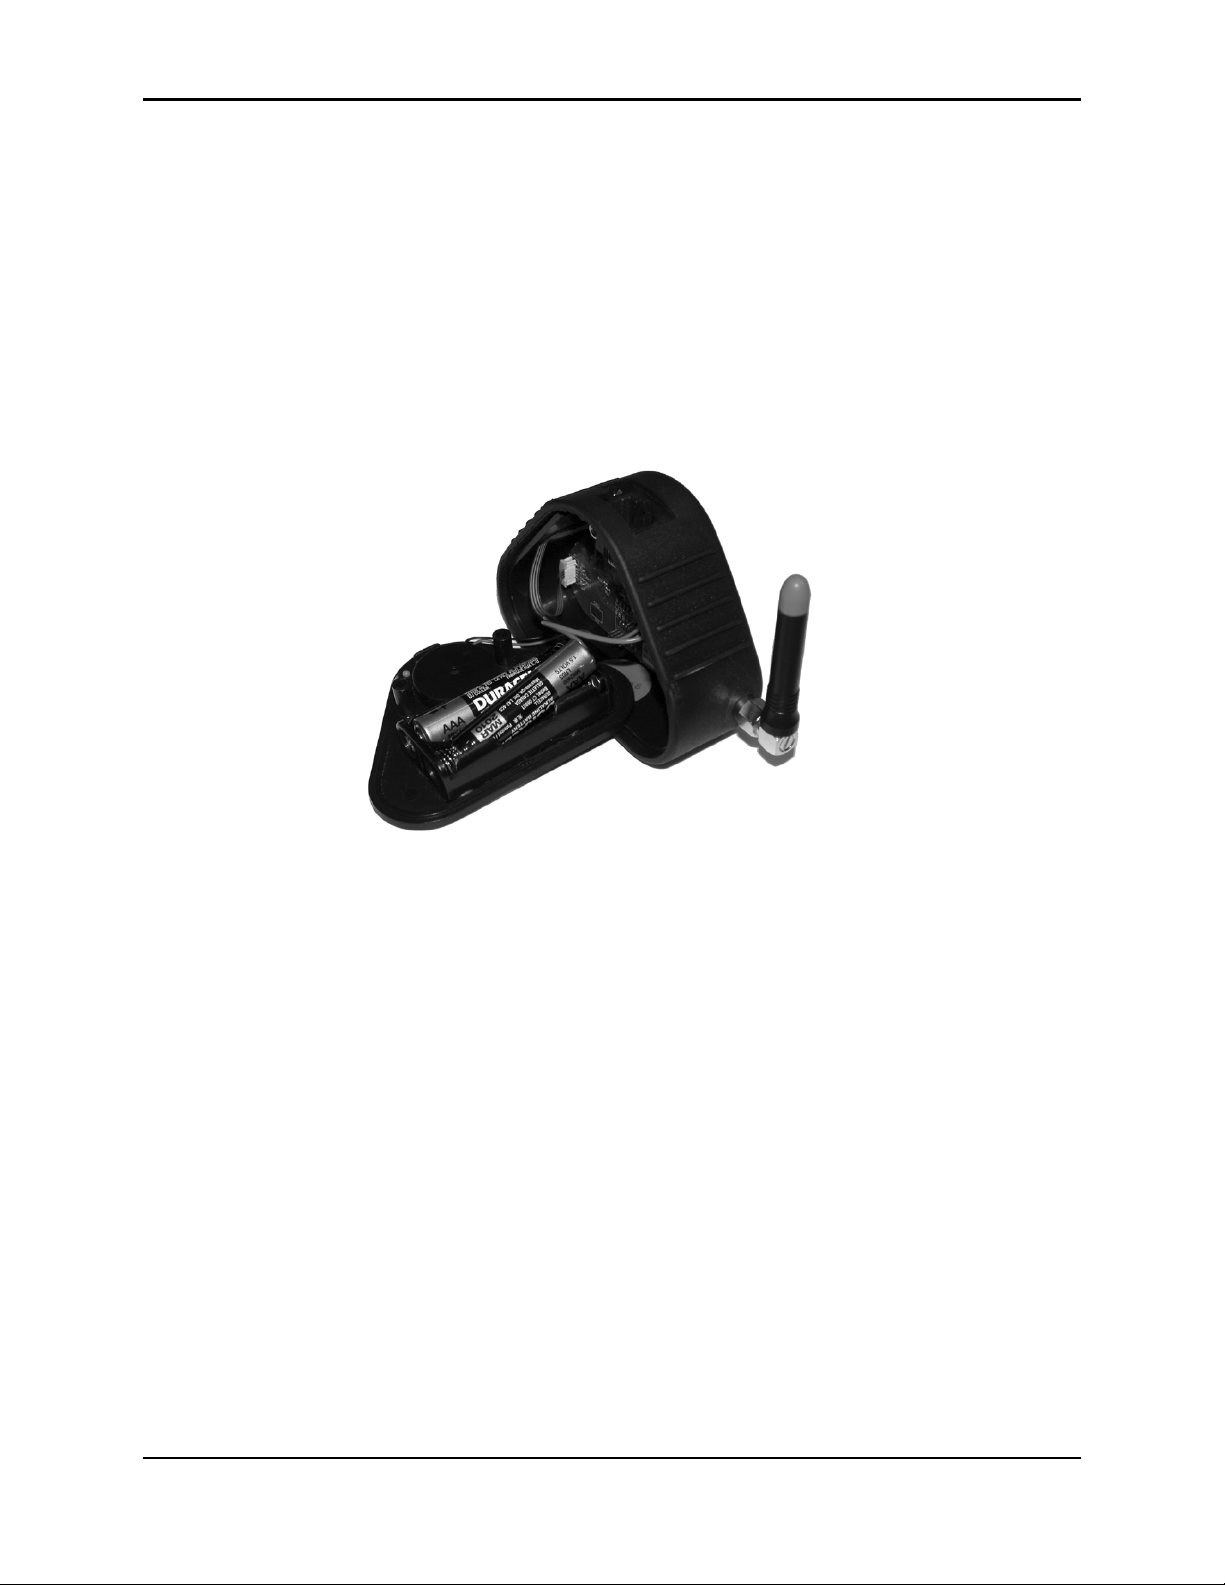
1. Remove and set aside the two screws holding the module’s bottom plate in place. Lift the
bottom plate off of the module and set it to one side (Figure 2-3). Avoid disconnecting
the bottom plate from the module, particularly if you are working with more than one
module at a time.
electrostatic discharge. Follow electrostatic discharge (ESD)
procedures when changing module batteries.
Note: The bottom plates of modules are not interchangeable. The bottom plate
carries a label showing the EUI number for the module to which the plate
Ember Evaluation Kit User’s Guide 120-0047-000C Final Page 20
Page 21
Chapter 2: Operating and Maintaining Evaluation Kit Components Maintaining Evaluation Kit Modules
belongs. If the wrong bottom plate is put onto a module, the label will no longer
indicate the correct EUI number. If you suspect that the wrong bottom plate has
been put onto a module, check the Address64Bit field for the module in the
Ember Studio Lite Node Configuration window. The value in this field should be
the same as the EUI number on the label. (For information on viewing the Node
Configuration window, see chapter 7, “Managing Network Nodes.”)
2. Insert or replace the batteries (use only AAA batteries). The module beeps to indicate
that the batteries are working.
3. Replace the bottom plate and hold it in position as you replace the two screws.
Figure 2-3: Opened module
Storing Modules
When they are not in use, store modules in the Evaluation Kit carrying case, with the black
plastic plug inserted into the power connector. This will protect the modules from damage
and ensure that they are fully shut down when in storage.
Cleaning Modules
If the exterior of a module becomes dirty, wipe it lightly with a clean, damp cloth.
Ember Evaluation Kit User’s Guide 120-0047-000C Final Page 21
Page 22

CHAPTER 3 Evaluating EmberNet Networks
About EmberNet Networks . . . . . . . . . . . . . . . . . . . . . . . . . . . . . . . . . . . . . . . . . . . .22
Evaluating a Simple EmberNet Network. . . . . . . . . . . . . . . . . . . . . . . . . . . . . . . . . . 22
Evaluating Complex EmberNet Networks. . . . . . . . . . . . . . . . . . . . . . . . . . . . . . . . . 26
Subdividing a Complex Network Via Radio Channels. . . . . . . . . . . . . . . . . . . . . . . 26
About EmberNet Networks
Ember technology gives you a plug-and-play networking solution. Using an EmberNet chip
and network lets you concentrate on designing your data collection or control application by
providing you with all the lower-level communications functions.
EmberNet networks gain their power from the following key features:
Automatic
recognition
Self-organization Modules autonomously determine how to route data
Multihop routing All modules can act as repeaters for other modules, to
Self-healing An EmberNet network automatically reconfigures itself
Scalability You can incrementally expand an existing EmberNet
Modules discover each other without complex setup and
configuration. In particular, modules discover and send
data to the gateway module, providing automatic access
to network status information.
through the network to its proper destination.
extend the range of communication.
instead of breaking when a module fails or is removed.
network by simply adding more modules to it.
Evaluating a Simple EmberNet Network
The following procedure takes you through the steps of evaluating a simple EmberNet
network. The procedure demonstrates the key features of an EmberNet network.
Ember Evaluation Kit User’s Guide 120-0047-000C Final Page 22
Page 23
Chapter 3: Evaluating EmberNet Networks Evaluating a Simple EmberNet Network
To evaluate a simple Ember Network:
Preparatory steps Install Ember Studio Lite (see “Installing Ember Studio Lite” on page
42).
Set up a small network Turn on three Evaluation Kit modules and connect one to the COM1
port on the PC, using the serial adapter cable provided in your Evaluation
Kit. (The connected module is the network gateway.) We recommend
operating the modules on battery power for this procedure.
(For information on connecting and powering modules, see chapter 2,
“Operating and Maintaining Evaluation Kit Components.”)
Evaluate the ability of modules
to automatically discover
each other and
spontaneously organize into
a network
Double-click Ember Studio Lite and select Create New Local Network in the
connection wizard. Enter a network name (can be anything). (For
information on opening Ember Studio Lite and connecting to a network,
see chapter 6, “Getting Started with Ember Studio Lite.”)
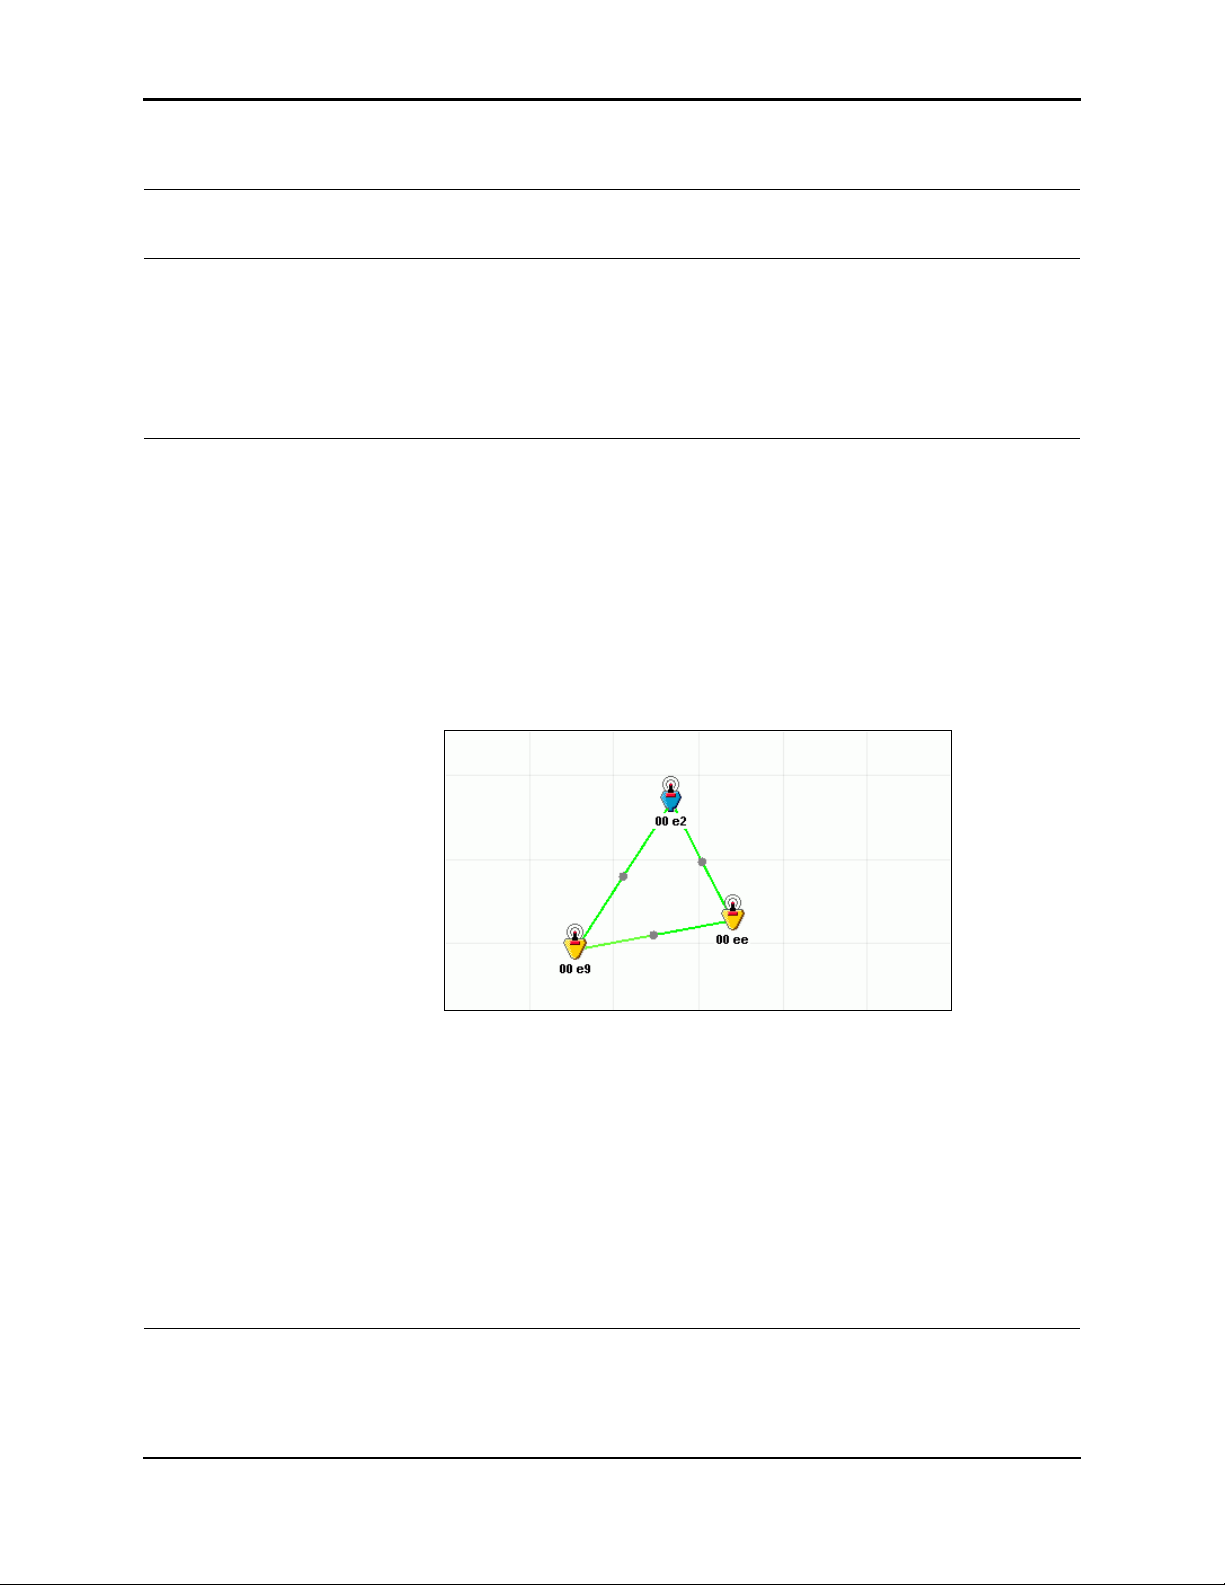
A network map resembling the following displays. If the link lines overlap,
making the map hard to read, drag the node icons to new positions on the
map. If your modules are hearing each other, the link lines in the network
map will be green, blue, or red. For best results, try to change red lines to
blue or green by moving modules. A red icon indicates that the module is
not powered on or is offline for some reason.
Module 2
Module 3
Module 1
The appearance of a network map showing three icons connected by
green, blue, or red lines demonstrates that:
z The modules discovered each other without requiring human
intervention.
z Modules 2 and 3 discovered the gateway module and sent network
data to it.
z All three modules spontaneously organized themselves into an
EmberNet network.
(For further information on reading the network map, see chapter 6,
“Getting Started with Ember Studio Lite.”)
Ember Evaluation Kit User’s Guide 120-0047-000C Final Page 23
Page 24
Chapter 3: Evaluating EmberNet Networks Evaluating a Simple EmberNet Network
Evaluate the network’s ability
to perform multihop routing
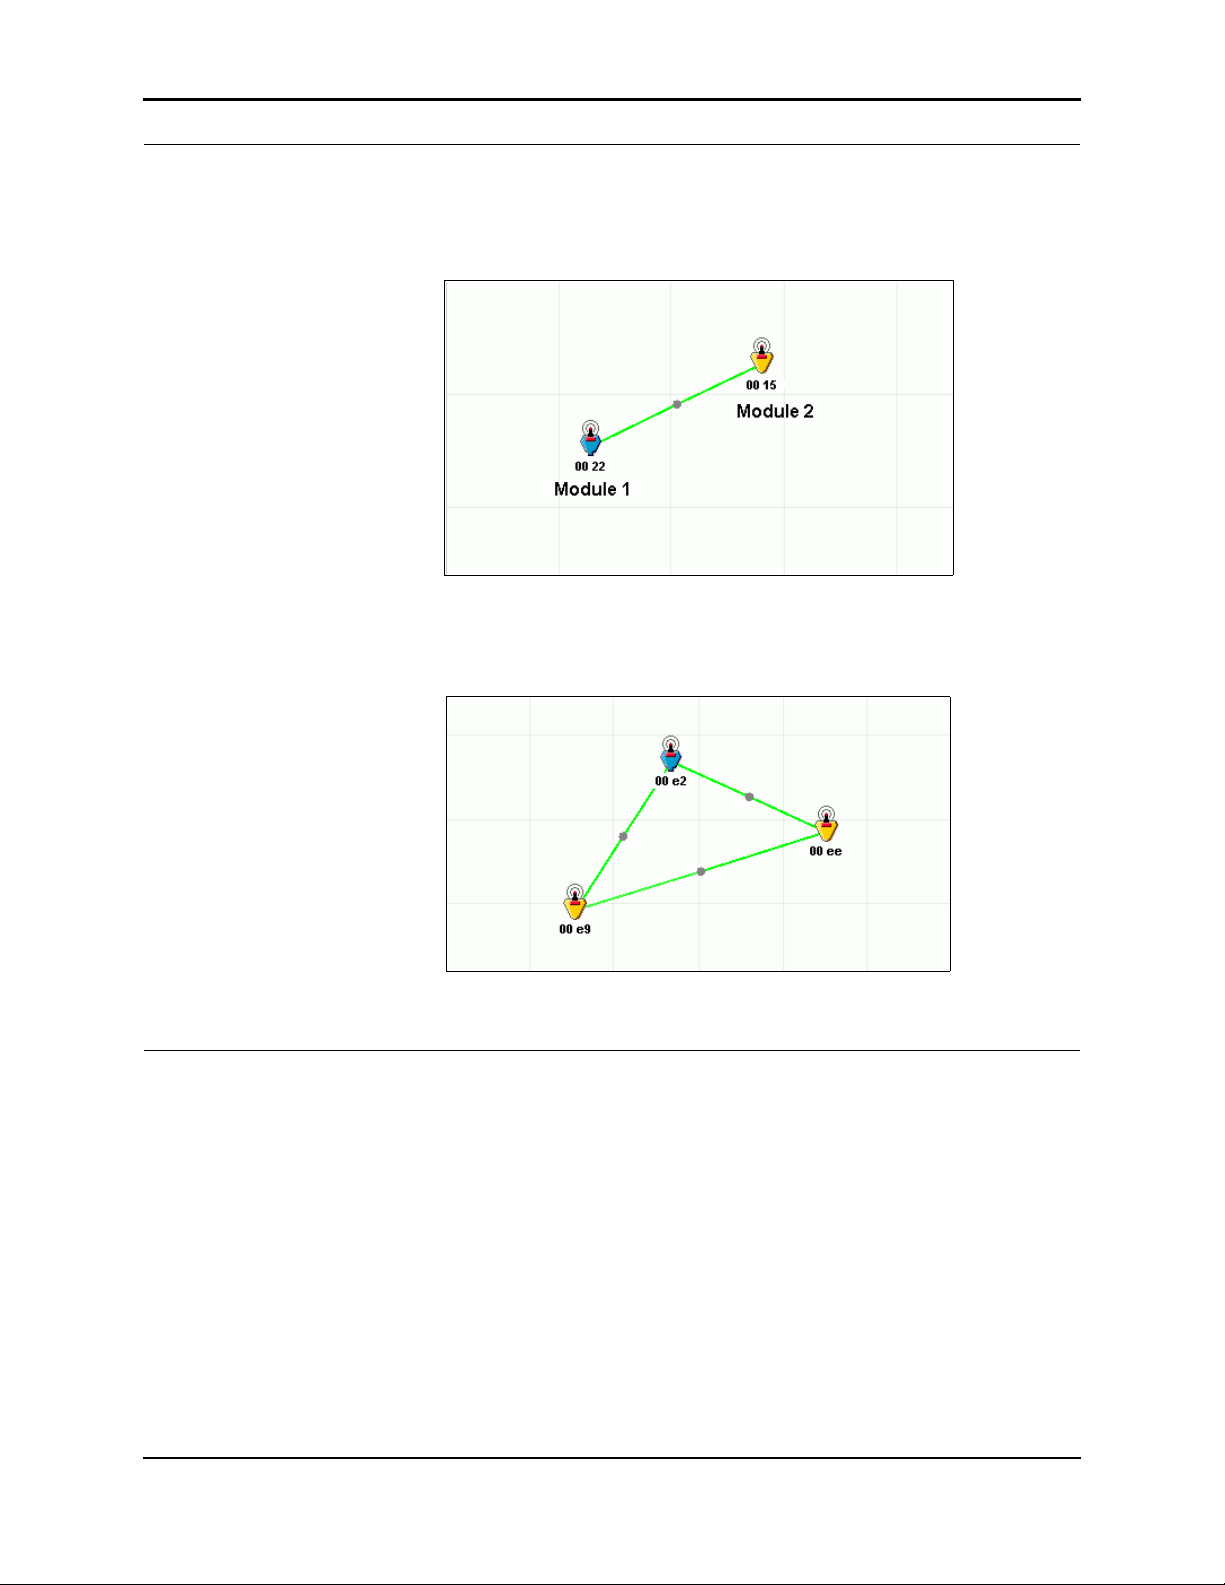
Carry module 3 approximately 100 feet away from modules 1 and 2.
When the network map updates (this may take a few minutes), it will no
longer display module 3. (If module 3 still appears in the map, move it
farther away.)
Module 2
Module 1
Now carry module 2 half of the distance between module 1 and
module 3.
When the network map updates, it will again display all three modules.
Module 2
Module 3
Module 1
The reappearance of module 3 in the network map demonstrates that
module 2 acted as a repeater, enabling multihop routing for module 3.
Ember Evaluation Kit User’s Guide 120-0047-000C Final Page 24
Page 25
Chapter 3: Evaluating EmberNet Networks Evaluating a Simple EmberNet Network
Evaluate the network’s ability
to route packets through
multiple pathways
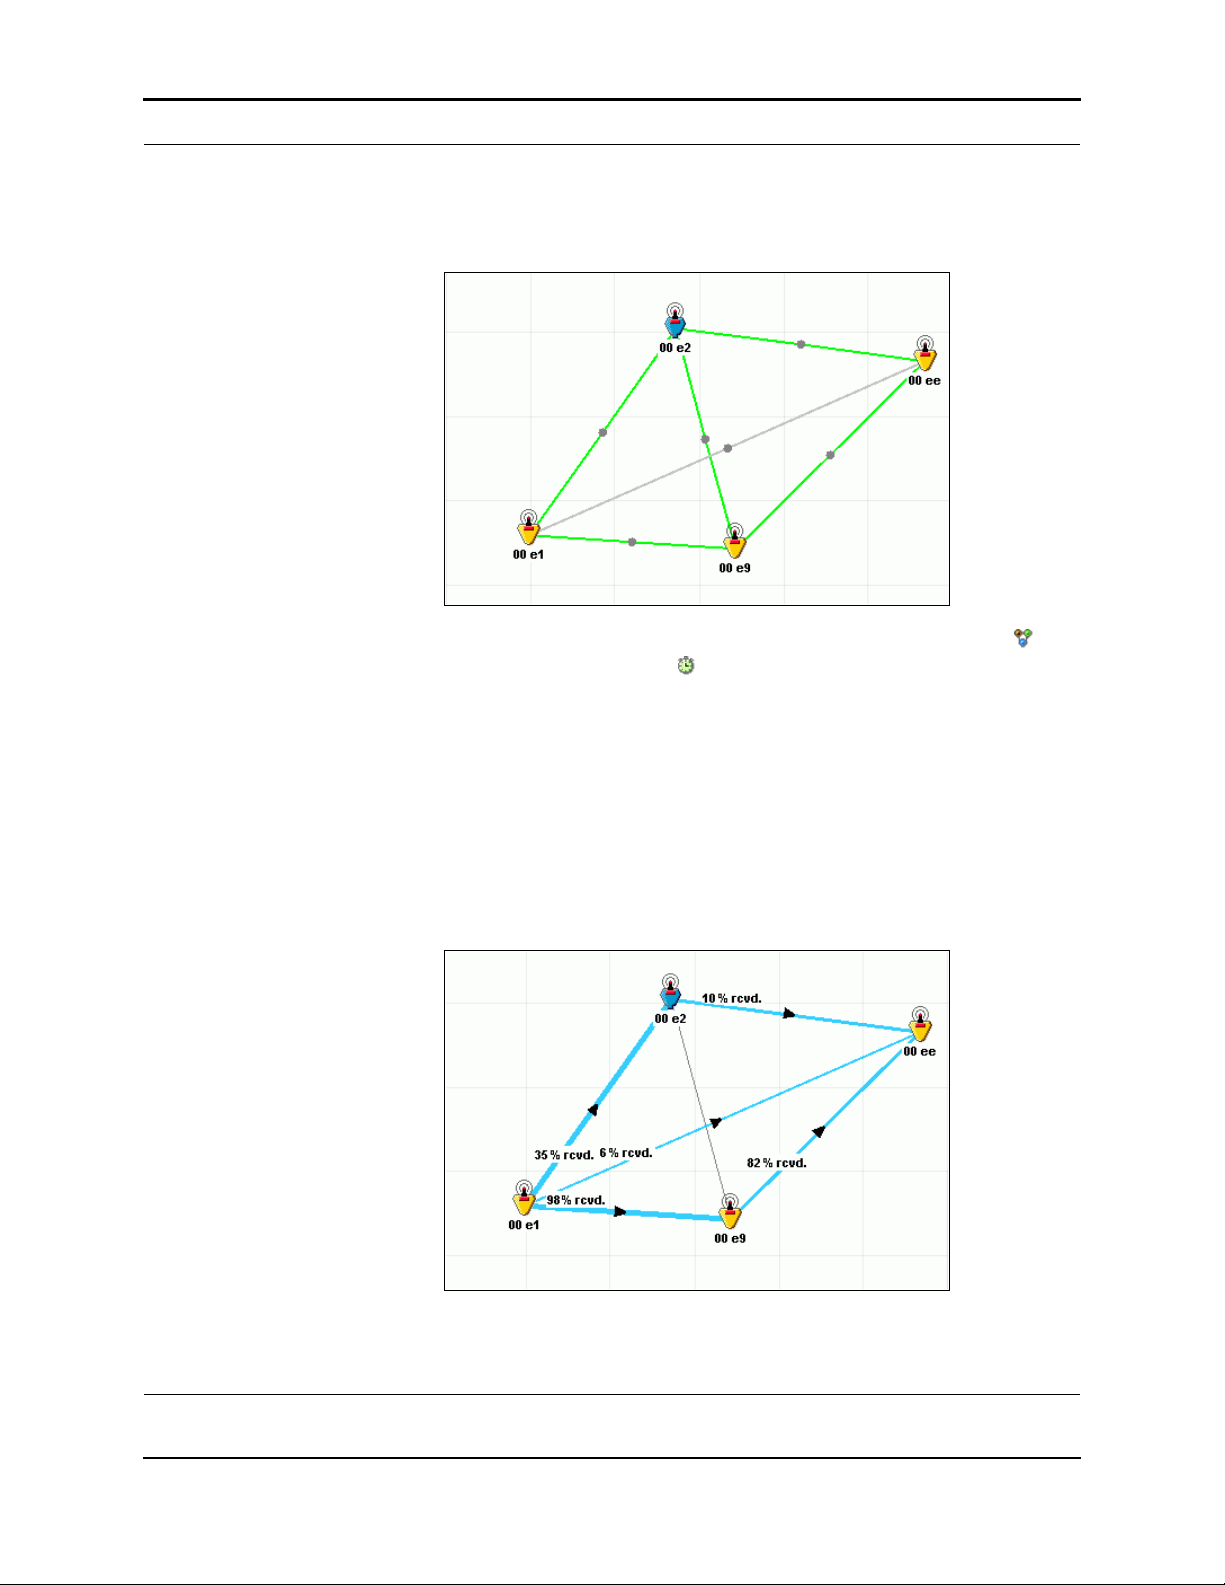
Turn on a fourth module and add it to the network, but position it far
enough away from module 1 that module 1 cannot hear it. When the
network map updates, the link line between modules 1 and 4 should be
gray or invisible.
Module 2
Module 4
Module 1
Module 3
In Ember Studio Lite, click the Networks folder in the folder tree ( ),
then click the Tests folder ( ). Click the Trace Route Test folder. The
trace route test configuration window displays.
In the configuration window, click the Send Node field, then click the
icon for module 1. Repeat for the Receive node field but click the icon for
module 4. Do not change the default test parameters in the other window
fields.
Click Start to run the trace route test. When the test finishes, a results
folder named Test1 appears in the Trace Route Test folder.
Click the Testing tab, then click the Test1 folder. Ember Studio Lite
displays the test results, which will resemble the following figure.
Module 2
Module 4
Module 1
Module 3
The test results demonstrate that the network routed packets to module 4
via both module 2 and module 3. (For more information on reading trace
route test results, see chapter 8, “Testing the Network.”)
Ember Evaluation Kit User’s Guide 120-0047-000C Final Page 25
Page 26
Chapter 3: Evaluating EmberNet Networks Evaluating Complex EmberNet Networks
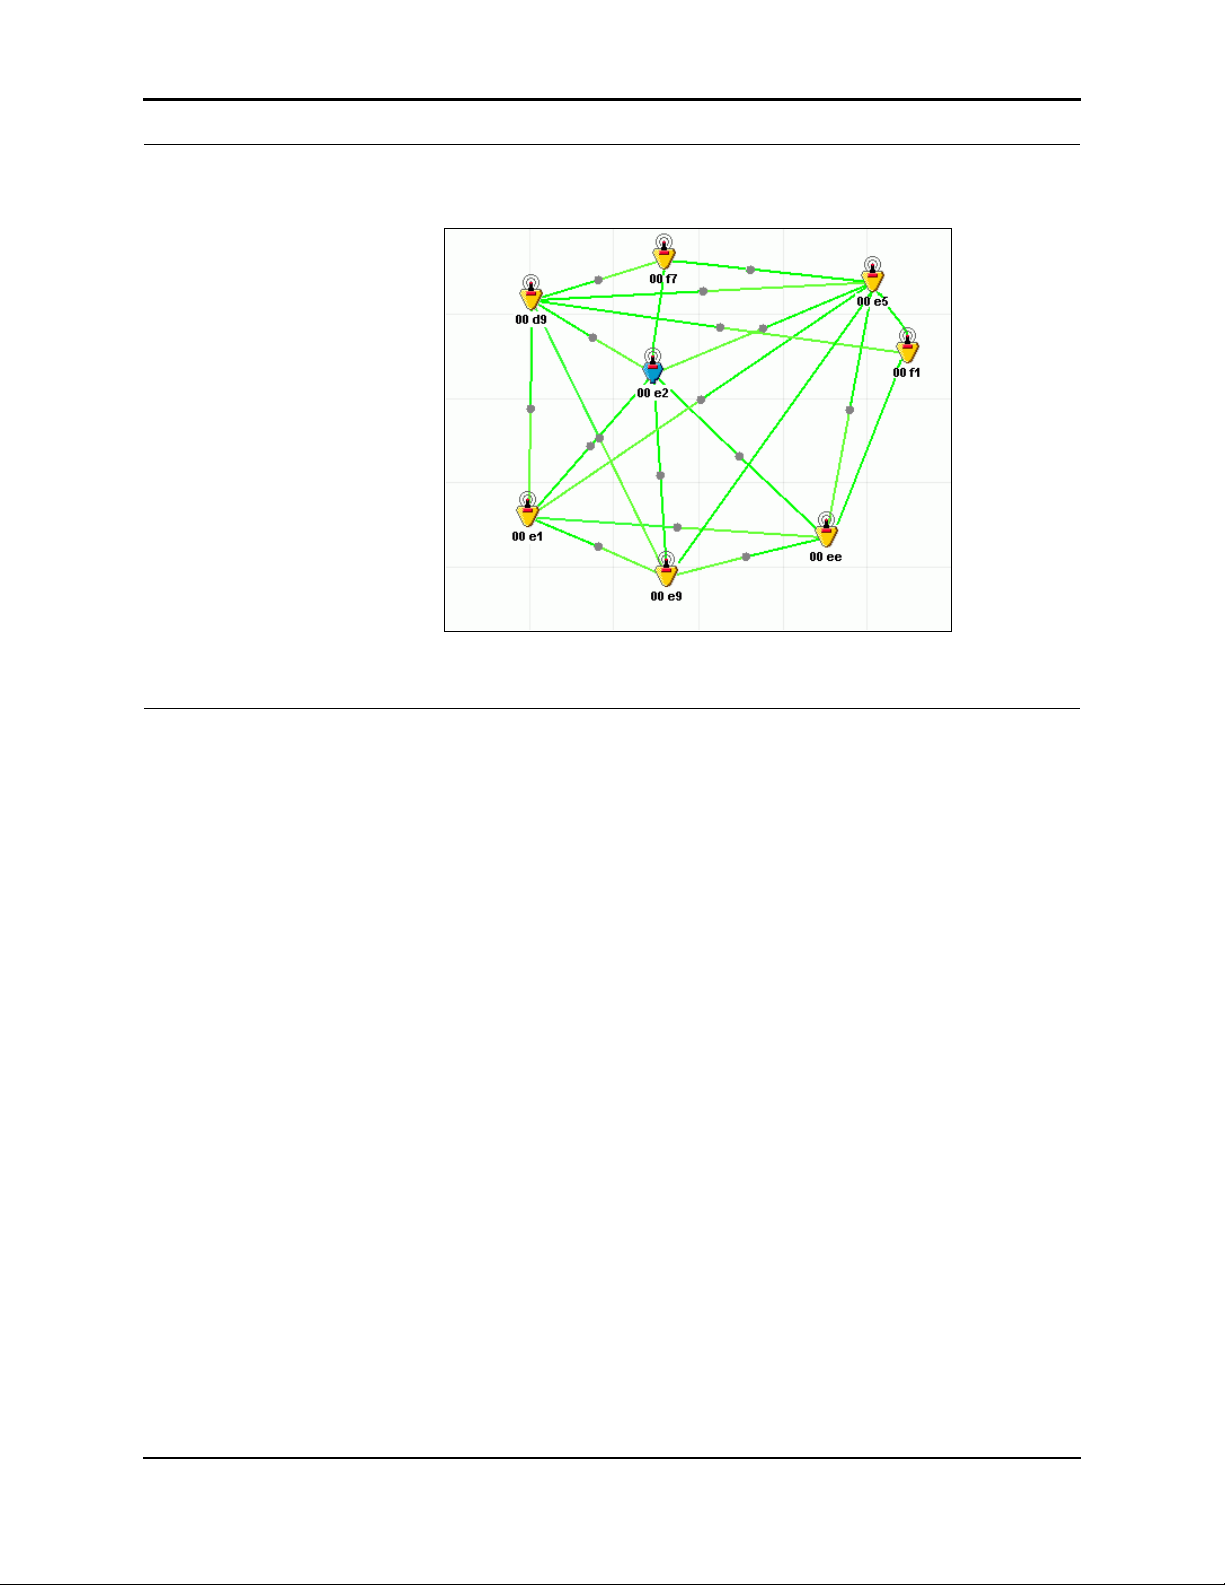
Evaluate the scalability of the
network
Add several modules to the network and refresh the network map.
The map updates to show the new modules.
The network map demonstrates that the existing network has been
quickly and automatically expanded.
Evaluating Complex EmberNet Networks
After you have put a simple network through its paces, you will be ready to set up networks
that model real-life operating conditions. Some common situations include:
z Sensors located on multiple floors
z Metal-reinforced concrete walls creating radio-opaque corners around which the
network must route
z Heavy metal machinery creating radio-opaque obstacles inside of a network
z Intermittent movement of vehicles or other obstructions through network paths
z Reflections created by the sudden intrusion of an obstacle into a network path
The specific challenges you will want to test depend on your application environment. In
every case, though, EmberNet’s key features will allow you to design an efficient network.
The Ember Evaluation Kit is optimized for mesh networking, using redundant pathways to
ensure reliable data transfer. When designing test networks, we strongly suggest that you
reduce potential single points of failure. Linear paths of nodes are not recommended.
Gateway nodes should have multiple wireless connections to the network to ensure best data
throughput.
Subdividing a Complex Network Via Radio Channels
When you advance to testing complex networks, you may wish to subdivide your network so
that multiple people can work on sections of it without interfering with each other’s work.
Ember Evaluation Kit User’s Guide 120-0047-000C Final Page 26
Page 27

Chapter 3: Evaluating EmberNet Networks Subdividing a Complex Network Via Radio Channels
To subdivide a network:
1. Install Ember Studio Lite on each person’s PC.
2. Assign each person a specific radiofrequency channel. See Appendix C, “Module Radio
Settings,” for a list of available channels.
3. Set different sets of modules in the network to the channels assigned to the people
working on the network. For information on setting channels, see “Viewing Node
Properties” on page 59.
4. Have each person connect a module to his or her PC and then set the module to his or
her assigned channel. This gives each person a gateway node that can see only network
nodes set to the same channel that it is set to.
Ember Evaluation Kit User’s Guide 120-0047-000C Final Page 27
Page 28

CHAPTER 4 Using the Evaluation Kit Sample
Applications
Available Evaluation Kit Sample Applications . . . . . . . . . . . . . . . . . . . . . . . . . . . . . 28
Using the Sensor Data Application . . . . . . . . . . . . . . . . . . . . . . . . . . . . . . . . . . . . . . 29
Available Sensor Data . . . . . . . . . . . . . . . . . . . . . . . . . . . . . . . . . . . . . . . . .29
Obtaining Sensor Data . . . . . . . . . . . . . . . . . . . . . . . . . . . . . . . . . . . . . . . . 30
Using the Power Management Application. . . . . . . . . . . . . . . . . . . . . . . . . . . . . . . . 30
Using the Node Pairing Application . . . . . . . . . . . . . . . . . . . . . . . . . . . . . . . . . . . . . 30
Using the Ember Chat Application . . . . . . . . . . . . . . . . . . . . . . . . . . . . . . . . . . . . . . 33
Setting Up to Run Ember Chat . . . . . . . . . . . . . . . . . . . . . . . . . . . . . . . . . . . 33
Installing Ember Chat . . . . . . . . . . . . . . . . . . . . . . . . . . . . . . . . . . . . . . . . . . 33
Opening Ember Chat . . . . . . . . . . . . . . . . . . . . . . . . . . . . . . . . . . . . . . . . . .33
Using Ember Chat . . . . . . . . . . . . . . . . . . . . . . . . . . . . . . . . . . . . . . . . . . . . 34
Closing Ember Chat . . . . . . . . . . . . . . . . . . . . . . . . . . . . . . . . . . . . . . . . . . .36
Uninstalling Ember Chat. . . . . . . . . . . . . . . . . . . . . . . . . . . . . . . . . . . . . . . . 36
Available Evaluation Kit Sample Applications
The Evaluation Kit includes the following sample applications, which demonstrate selected
commercial uses for Ember’s wireless mesh networking technology:
Sensor data Collect temperature, position, and battery life data from
module sensors and view data in Ember Studio Lite.
Power management Use Ember Studio Lite to cause a node to sleep (that is,
enter low-power mode) except when reporting sensor
data.
Node pairing Pair nodes so that one can transmit control instructions
to the other.
Ember Chat Transmit data over the RS-232 port via a simple chat
application.
Ember Evaluation Kit User’s Guide 120-0047-000C Final Page 28
Page 29
Chapter 4: Using the Evaluation Kit Sample Applications Using the Sensor Data Application
Using the Sensor Data Application
The sensor data application allows you to sample module sensor data and then view real-time
graphs of those data. You can simultaneously sample data from multiple modules. The
application is run from Ember Studio Lite (see chapter 5, “Collecting and Viewing Sensor
Data”).
You must stimulate the module sensors to obtain viewable data. See “Obtaining Sensor Data”
on page 30 for suggested methods.
The sensors acquire data at different rates, which makes them suitable for different types of
demonstrations:
z The temperature and battery voltage sensors acquire data slowly and are best used to
demonstrate the collection of sensor data over time.
z The acceleration sensors acquire data rapidly and are suitable for immediate
demonstrations of the collection and display of sensor data.
Note: The sensors are not calibrated on the modules, so they do not provide exact
temperature, battery, and acceleration data.
Available Sensor Data
Each Evaluation Kit module includes the following sensors:
Tempe ra tu re Ambient air temperature in degrees Celsius
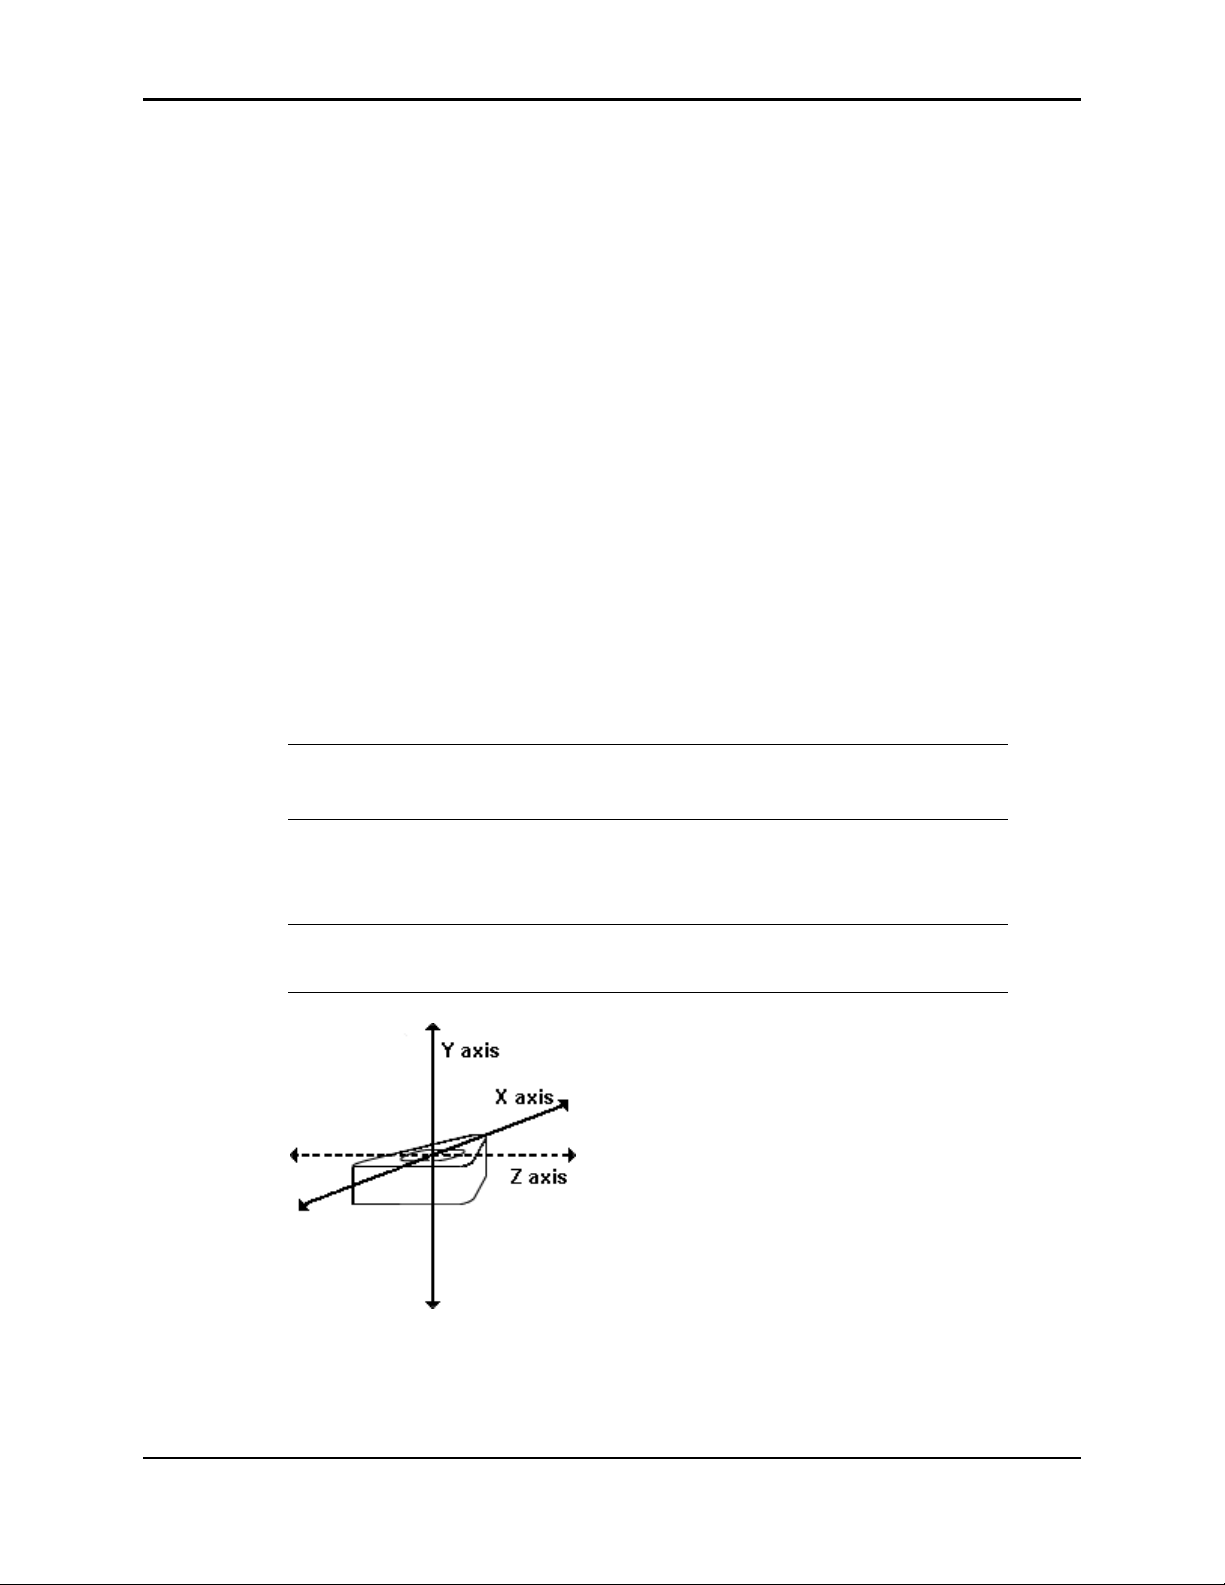
Acceleration Module orientation in space, in terms of acceleration in
Battery voltage Charge (volts) remaining in module batteries
Range: -55°C to +130°C
either the X or the Y axis (Figure 4-1)
Range: + / -2
(Fresh batteries have approximately 3.3V of charge.)
g
Figure 4-1: Accelerometer axes. The module is lying face up. The X-Z plane is
horizontal to the module face, and the Y-Z plane is orthogonal to it.
Ember Evaluation Kit User’s Guide 120-0047-000C Final Page 29
Page 30
Chapter 4: Using the Evaluation Kit Sample Applications Using the Power Management Application
Obtaining Sensor Data
Following are some simple strategies for stimulating module sensors to obtain data for the
sensor application:
Temperature
Acceleration Grasp the module and tilt it from front to back or side to side. (Figure 4-1
Battery
voltage
z To obtain temperature data over time: Expose the module to cold
or hot temperatures over a long period of time. For example, place the
module in a very cold or hot room, inside a glass-sided refrigerator (a
metal refrigerator will block radio transmissions), or beneath a hot
light.
z To obtain (relatively) rapid changes in temperature data: Expose
the module to temperature extremes for short periods of time. For
example, place the module in a refrigerator for approximately 10
minutes, then remove it to observe gradual sensor warming.
Do not expose the module to temperatures
Caution!
illustrates the accelerometer’s axes of movement.)
z Plug the power adapter into the module, which produces a voltage
change.
z Run a module on battery power until the batteries begin to lose
charge.
outside of its operating temperature limits of 0°C
to 70°C.
Using the Power Management Application
The power management application allows you to use Ember Studio Lite to instruct a module
to enter a low-power sleep state except when it is transmitting sensor data. For information
on enabling power management, see “Enabling Power Management” on page 40.
When power management is enabled for a module, it stops relaying packets and sleeps except
when collecting and transmitting sensor data. The module processor and radio wake up at the
specified sensor data report interval to collect sensor data and transmit it to the gateway node.
Otherwise, the module does not respond to any network commands except sensor data
commands. Turning a module off disables power management.
Note: When power management is enabled, Ember Studio Lite will not allow you to run a
ping or trace route test, collect statistics, or reconfigure node properties.
Using the Node Pairing Application
The node pairing application allows you to pair modules such that one module (the “output”
module) beeps when the other module (the “input” module) transmits accelerometer data to
it.
Ember Evaluation Kit User’s Guide 120-0047-000C Final Page 30
Page 31

Chapter 4: Using the Evaluation Kit Sample Applications Using the Node Pairing Application
To use the node pairing application, you must manually pair modules and then stimulate the
accelerometer in the input module. Modules stay paired until you disable the pairing.
Note: Do not perform a ping or trace route test or use the sensor data application while
using the node-pairing application. These tests increase network traffic, which can
interfere with node pairing.
You can pair one input module with up to three output modules. You can also pair multiple
input modules to a single output module. You can view a customizable map of paired
modules in Ember Studio Lite, in the Node Pairing window.
To pair one input module with up to three output modules:
1. Press and hold the left button of the input module until it beeps twice in rapid
succession. The input module is now in learning mode and can be paired with an output
module.
2. Press the left button of an output module. The output module and the input module
both beep once, signifying that the input module heard the pairing message that the
output module sent.
3. To pair up to two more output modules to the input module, repeat the preceding step.
4. Press the left button of the input module. The module rapidly beeps twice, signifying that
it is no longer in learning mode and is now paired with the output module or modules.
To pair two or more input modules to one output module:
1. Press and hold the left button of an input module until it beeps twice in rapid succession.
The input module is now in learning mode and can be paired with an output module.
2. Press the left button of an output module. The output module and the input module
both beep once, signifying that the input module heard the pairing message that the
output module sent.
3. To pair a second input module to the same output module, repeat the preceding steps,
using a different input module.
4. Repeat the preceding steps to pair multiple input modules to the output module.
5. Press the left button of each input module. Each rapidly beeps twice, signifying that it is
no longer in learning mode and is now paired with the output module or modules.
To use the node-pairing application:
Tilt an input module. Any output modules paired to it beep to indicate that control data
passed from the input to the output module.
To disable node pairing:
Do one of the following:
z Press the left button on the output module twice.
z Turn off the output module. Note that this will cause the node to disappear from any
network it participates in.
Ember Evaluation Kit User’s Guide 120-0047-000C Final Page 31
Page 32
Chapter 4: Using the Evaluation Kit Sample Applications Using the Node Pairing Application
To view a map of paired modules:
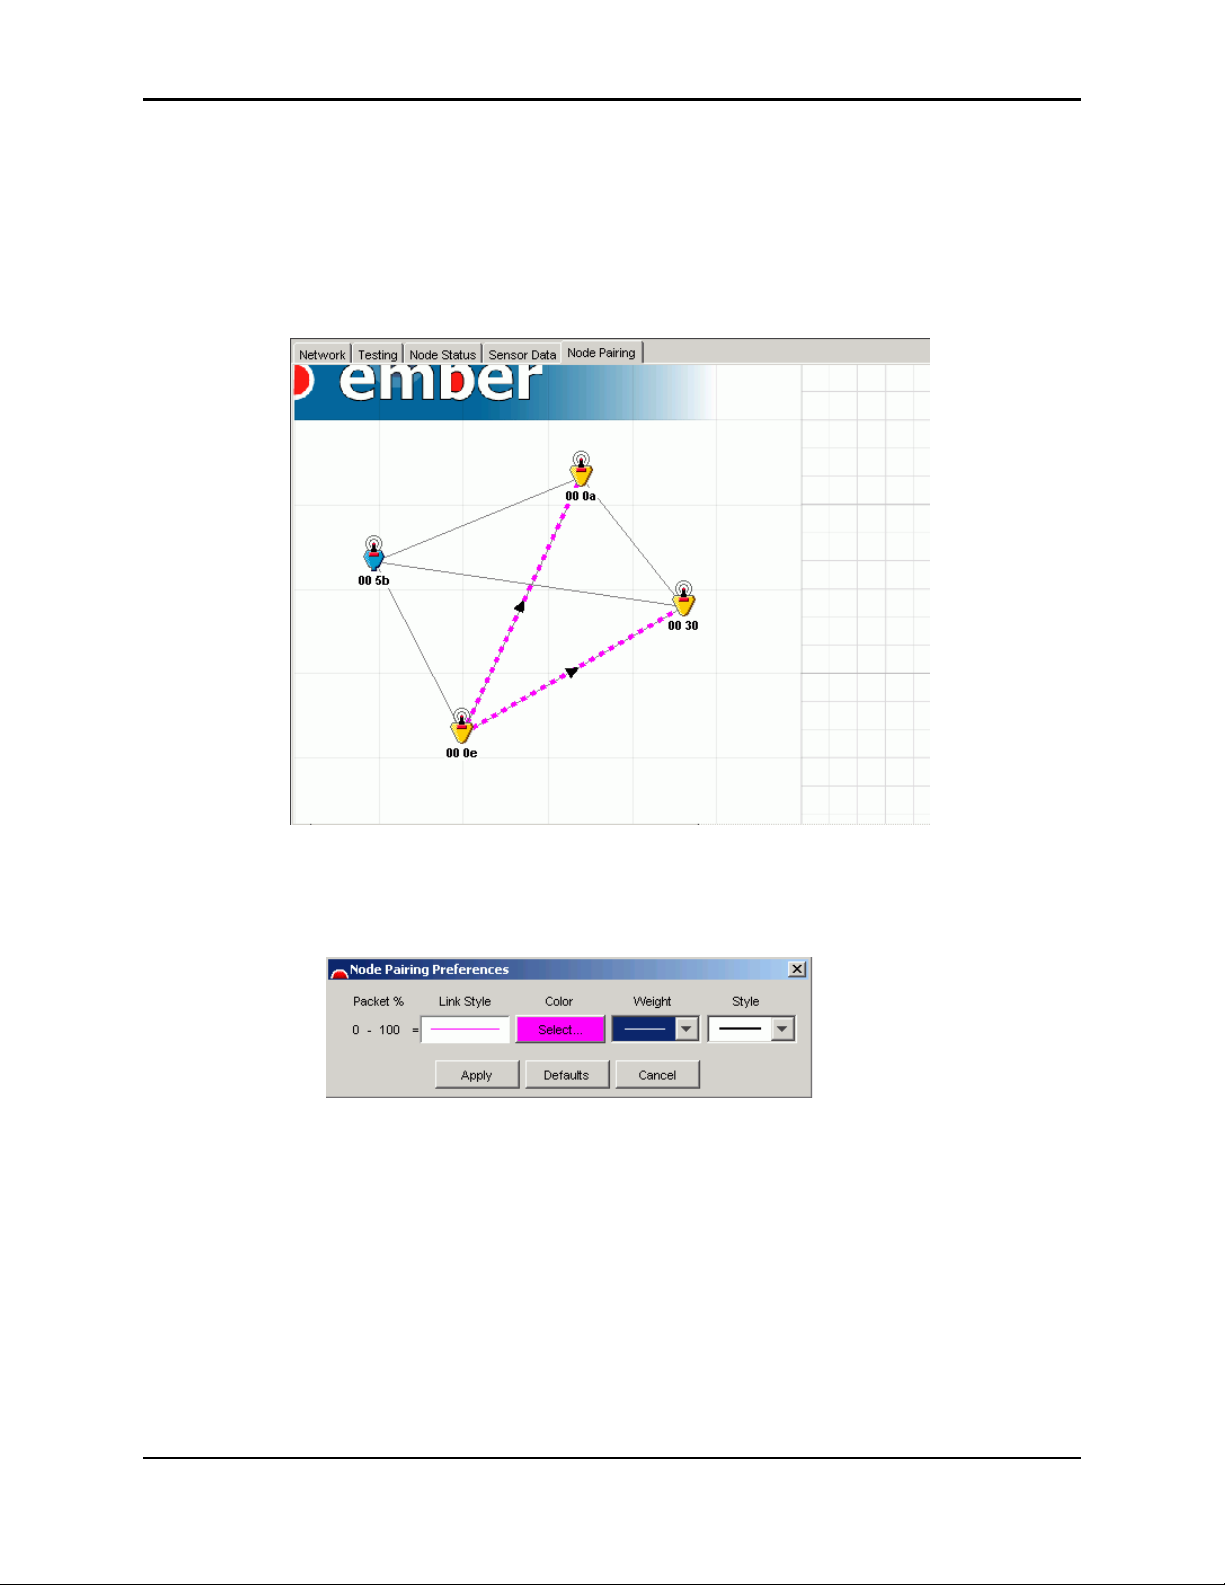
In Ember Studio Lite, click the Node Pairing tab. The Node Pairing window displays. The
window shows the network map with all link lines inactivated except for those between paired
modules. The arrowhead superimposed on the pairing link lines points from the input
module node icon to the output module node icon. You can set the color and weight of the
pairing link lines.
To customize the pairing link lines:
1. Right-click the map and select Node Pairing Preferences. The Node Pairing Preferences
window displays:
2. Do one of the following:
Select a new line weight and style as desired from the drop-down menus.
Click Defaults to restore the default line preferences.
3. Click Apply. The new preferences display in the map.
Ember Evaluation Kit User’s Guide 120-0047-000C Final Page 32
Page 33
Chapter 4: Using the Evaluation Kit Sample Applications Using the Ember Chat Application
Using the Ember Chat Application
The Ember Chat application is a simple text entry application that allows two people to chat
over computers connected anywhere on the network. It demonstrates the transmission of
data to a computer via an EmberNet network gateway node’s RS-232 port.
You can also write your own RS-232 data transmission applications with the Ember Serial
Command Set. See Appendix D, “Ember Serial Command Set Reference,” for complete
documentation of these commands.
Setting Up to Run Ember Chat
Use only the serial adapter cable provided in your Evaluation Kit.
Caution!
Before you can run Ember Chat, set up an EmberNet network (see chapter 2, “Operating and
Maintaining Evaluation Kit Components”). Install the Ember Chat application on two
computers (see “Installing Ember Chat” on page 33) and connect a module to each with the
serial adapter cables provided in your Evaluation Kit.
Using any other serial adapter cable can severely damage the
module microprocessor.
Installing Ember Chat
Ember Chat requires Microsoft .NET Framework. The .NET Framework installer is
provided as a convenience to you if it is not already installed on network-connected
computers.
To install the Ember Chat application:
1. Place the Evaluation Kit CD into a PC.
2. If you need to install the .NET Framework, click its installer on the Ember Chat CD
(NET Framework Installer.exe) and follow the instructions.
3. Click setup.exe to install the Ember Chat application. The installer writes the application
files to C:\Program Files\Ember\EmberEvalChat, creates a desktop shortcut, and
places Ember Chat in the Start menu.
Opening Ember Chat
Note: Make sure that no one participating in the chat session is running Ember Studio Lite
at the same time as Ember Chat.
To open the Ember Chat application:
1. Start the application by doing one of the following:
Click the desktop shortcut.
Select the application in the Start menu.
Run the executable:
Ember Evaluation Kit User’s Guide 120-0047-000C Final Page 33
Page 34
Chapter 4: Using the Evaluation Kit Sample Applications Using the Ember Chat Application
C:\Program Files\Ember\EmberEvalChat\EmberEvalChat.exe
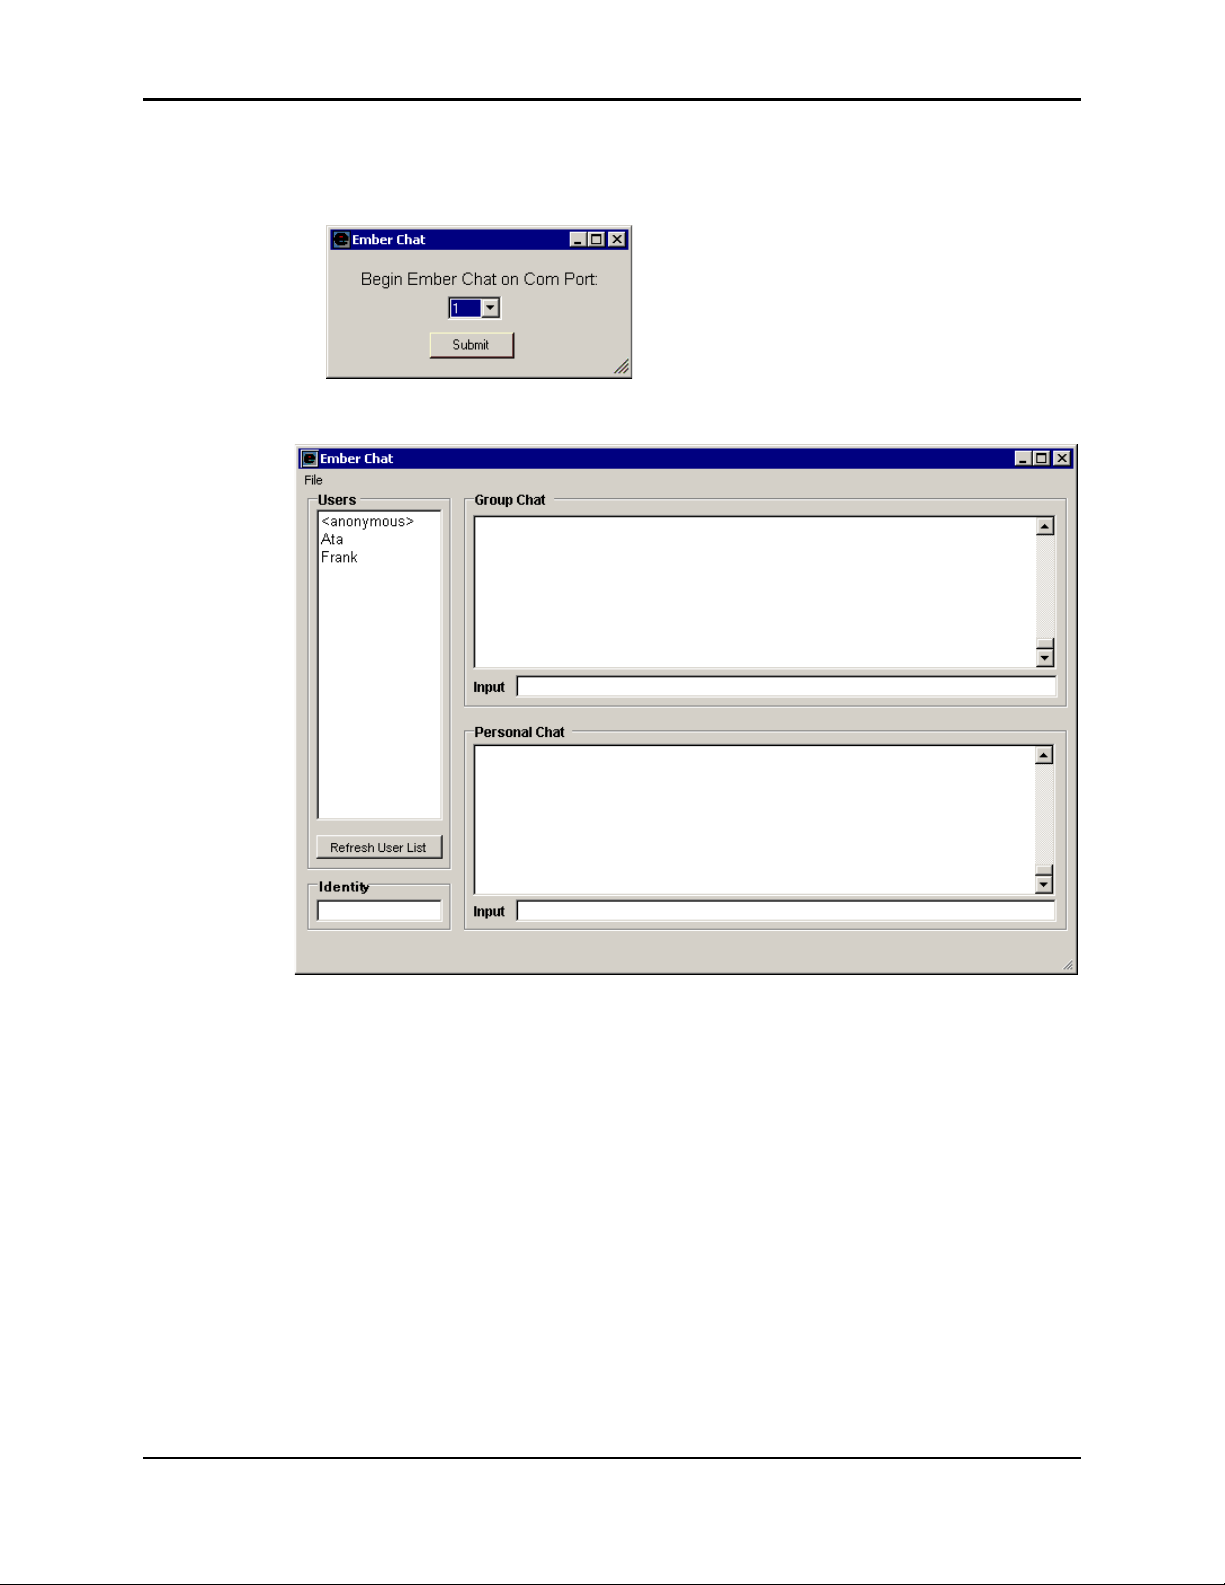
The Begin Ember Chat window displays:
2. Select a COM port number and click Submit. The Ember Chat window displays:
The Users box lists the name of everyone currently logged into the network. The application
refreshes this list every few seconds. To manually update the list, click Refresh User List.
Using Ember Chat
After logging into the application, you can chat with everyone who is logged in or to a
specific individual. Chatting with one person at a time can simplify communication, because
you avoid all the crosstalk that occurs with group chatting.
To chat over the network:
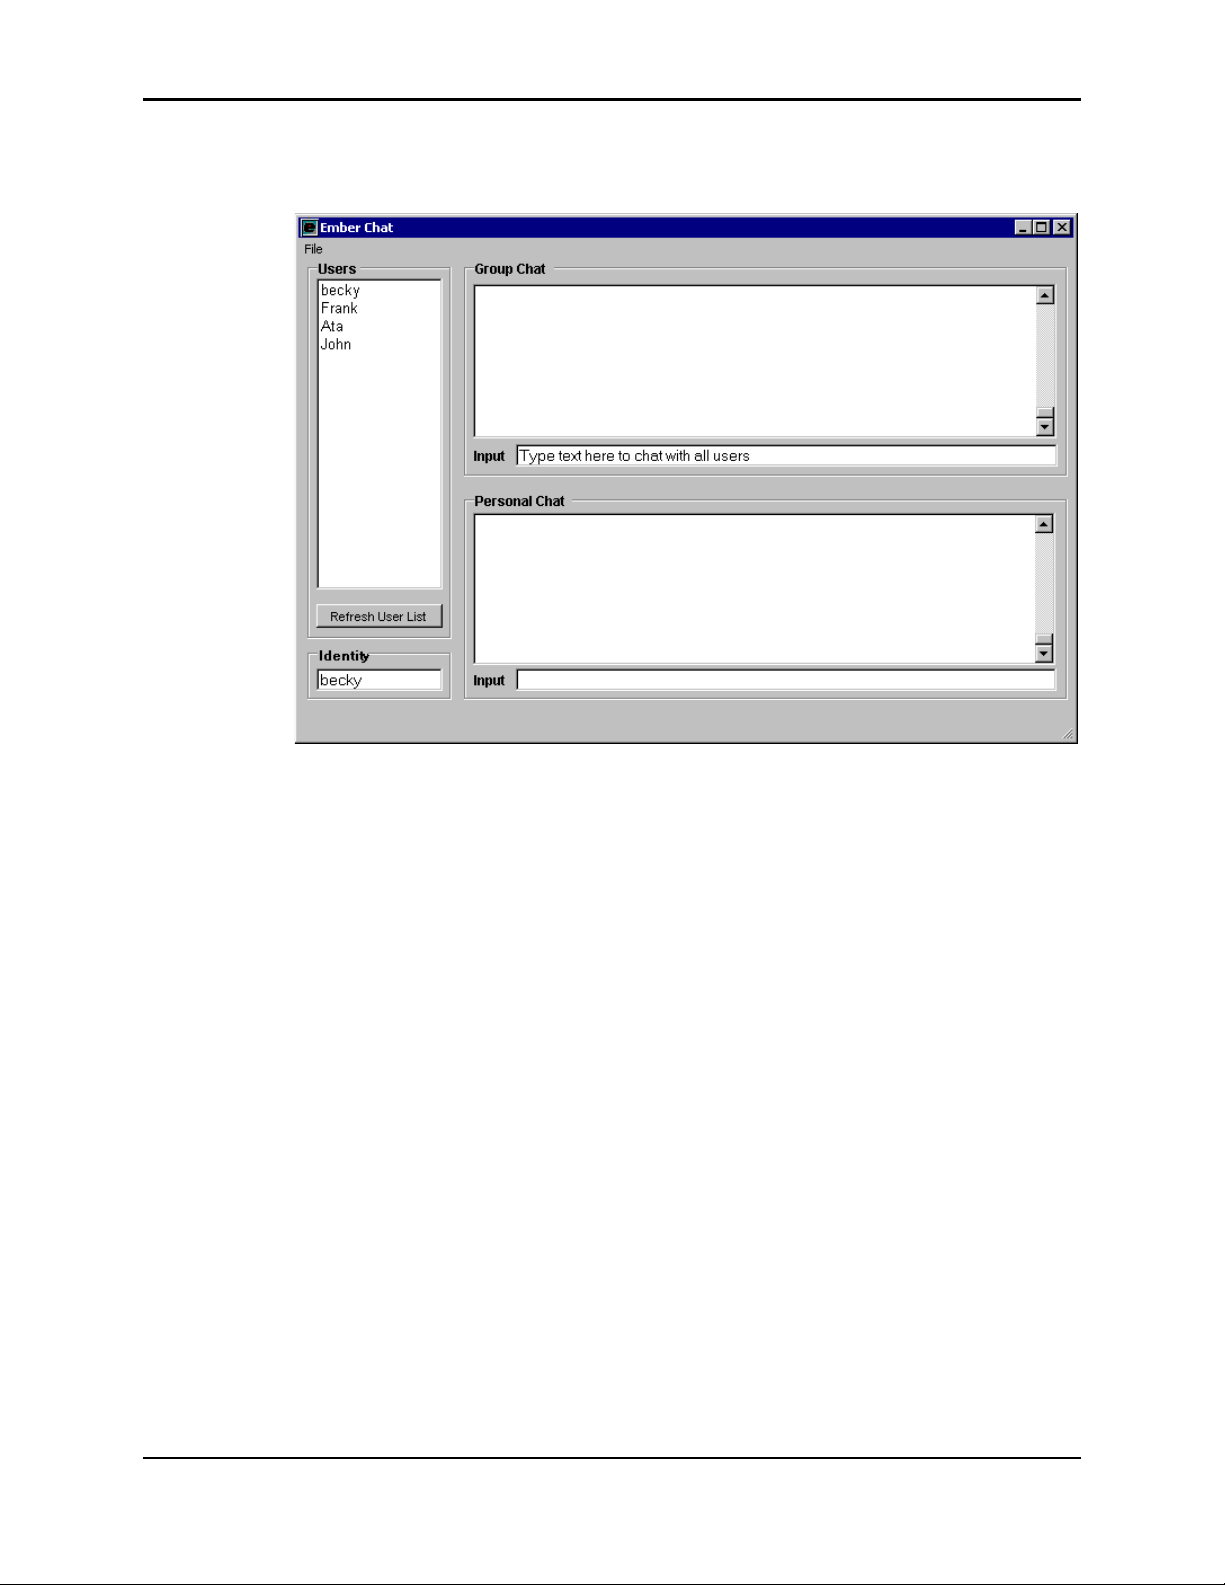
1. Log into the program by typing a name for yourself in the Identity field and pressing
ENTER. The name appears in the Users list. You can change this name at any time by
entering a different name into the Identity field.
2. Enter text into one of the input fields. You can type up to 65 characters in a field at one
time.
Ember Evaluation Kit User’s Guide 120-0047-000C Final Page 34
Page 35
Chapter 4: Using the Evaluation Kit Sample Applications Using the Ember Chat Application
To chat with everyone, enter text into the Input field for the Group Chat box and press
ENTER.
Ember Evaluation Kit User’s Guide 120-0047-000C Final Page 35
Page 36
Chapter 4: Using the Evaluation Kit Sample Applications Using the Ember Chat Application
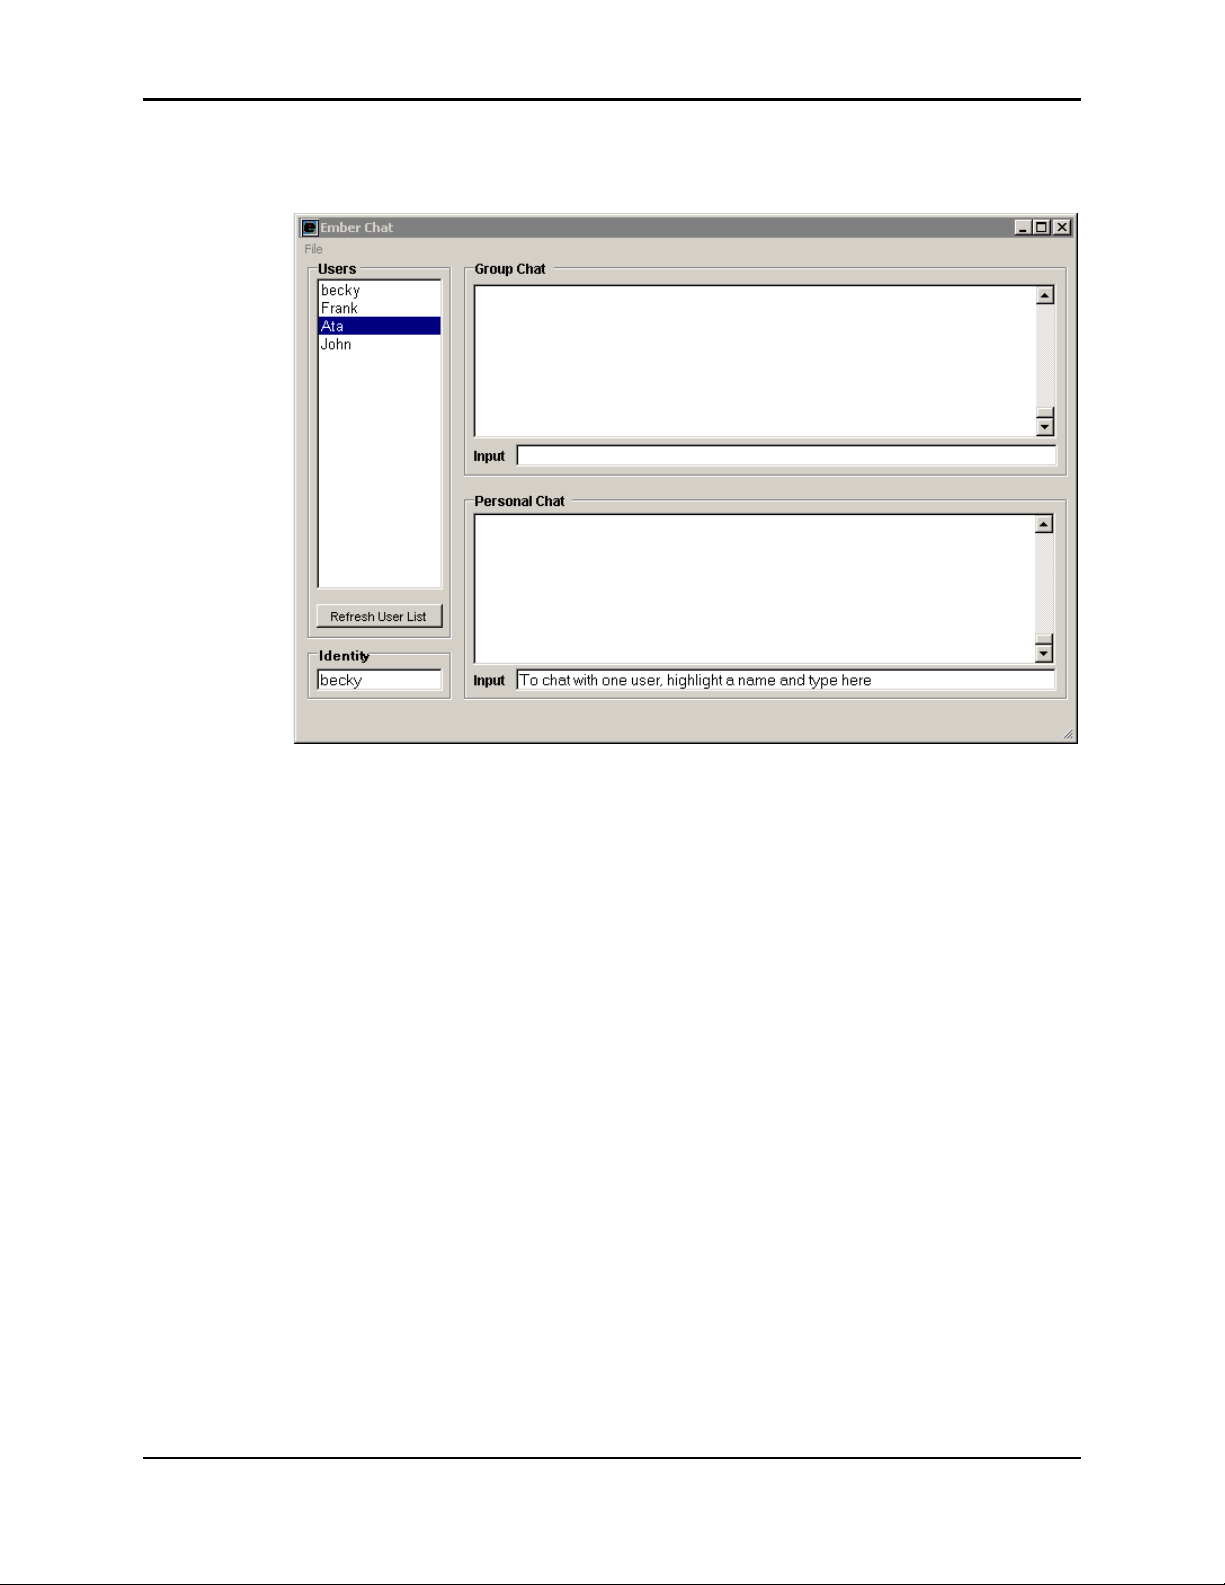
To chat with a single person, enter text into the Input line for the Personal Chat
box and press ENTER.
Closing Ember Chat
To close the application, close the chat window.
Uninstalling Ember Chat
To uninstall the application, use the Add/Remove Programs utility in your PC’s Control
Panel.
Ember Evaluation Kit User’s Guide 120-0047-000C Final Page 36
Page 37

CHAPTER 5 Collecting and Viewing Sensor
Data
Stimulating Sensors to Obtain Data. . . . . . . . . . . . . . . . . . . . . . . . . . . . . . . . . . . . . . 37
Collecting Sensor Data . . . . . . . . . . . . . . . . . . . . . . . . . . . . . . . . . . . . . . . . . . . . . . . 37
Viewing Sensor Data . . . . . . . . . . . . . . . . . . . . . . . . . . . . . . . . . . . . . . . . . . . . . . . . . 39
Viewing Raw Sensor Data . . . . . . . . . . . . . . . . . . . . . . . . . . . . . . . . . . . . . .39
Viewing Sensor Data Graphs . . . . . . . . . . . . . . . . . . . . . . . . . . . . . . . . . . .40
Enabling Power Management . . . . . . . . . . . . . . . . . . . . . . . . . . . . . . . . . . . . . . . . . .40
Stimulating Sensors to Obtain Data
To obtain sensor data that you can collect and view with Ember Studio Lite, you must
stimulate module sensors appropriately. See “Using the Sensor Data Application” on page 29
for information on module sensors and ideas for obtaining useful sensor data.
Collecting Sensor Data
Use the Ember Studio Lite Sensor Data window to instruct modules to collect sensor data
and report them to the gateway node at a specified interval. You can select from two sensor
data transmission protocols:
z Best Effort: The module transmits sensor data reports without listening for
acknowledgements from Ember Studio Lite. Reports are transmitted rapidly with this
method but can be lost if collisions occur on the way to the gateway node.
z Reliable: The module transmits re-transmits reports until Ember Studio Lite
acknowledges their receipt. Report transmission is slower with this method, but reports
are never lost.
If you enable power management for nodes that are collecting sensor data, the nodes will
enter and remain in a low-power sleep state except when they transmit sensor data (see
“Enabling Power Management” on page 40). For information about the power management
sample application, see “Using the Power Management Application” on page 30.
Ember Evaluation Kit User’s Guide 120-0047-000C Final Page 37
Page 38
Chapter 5: Collecting and Viewing Sensor Data Collecting Sensor Data
To collect sensor data:
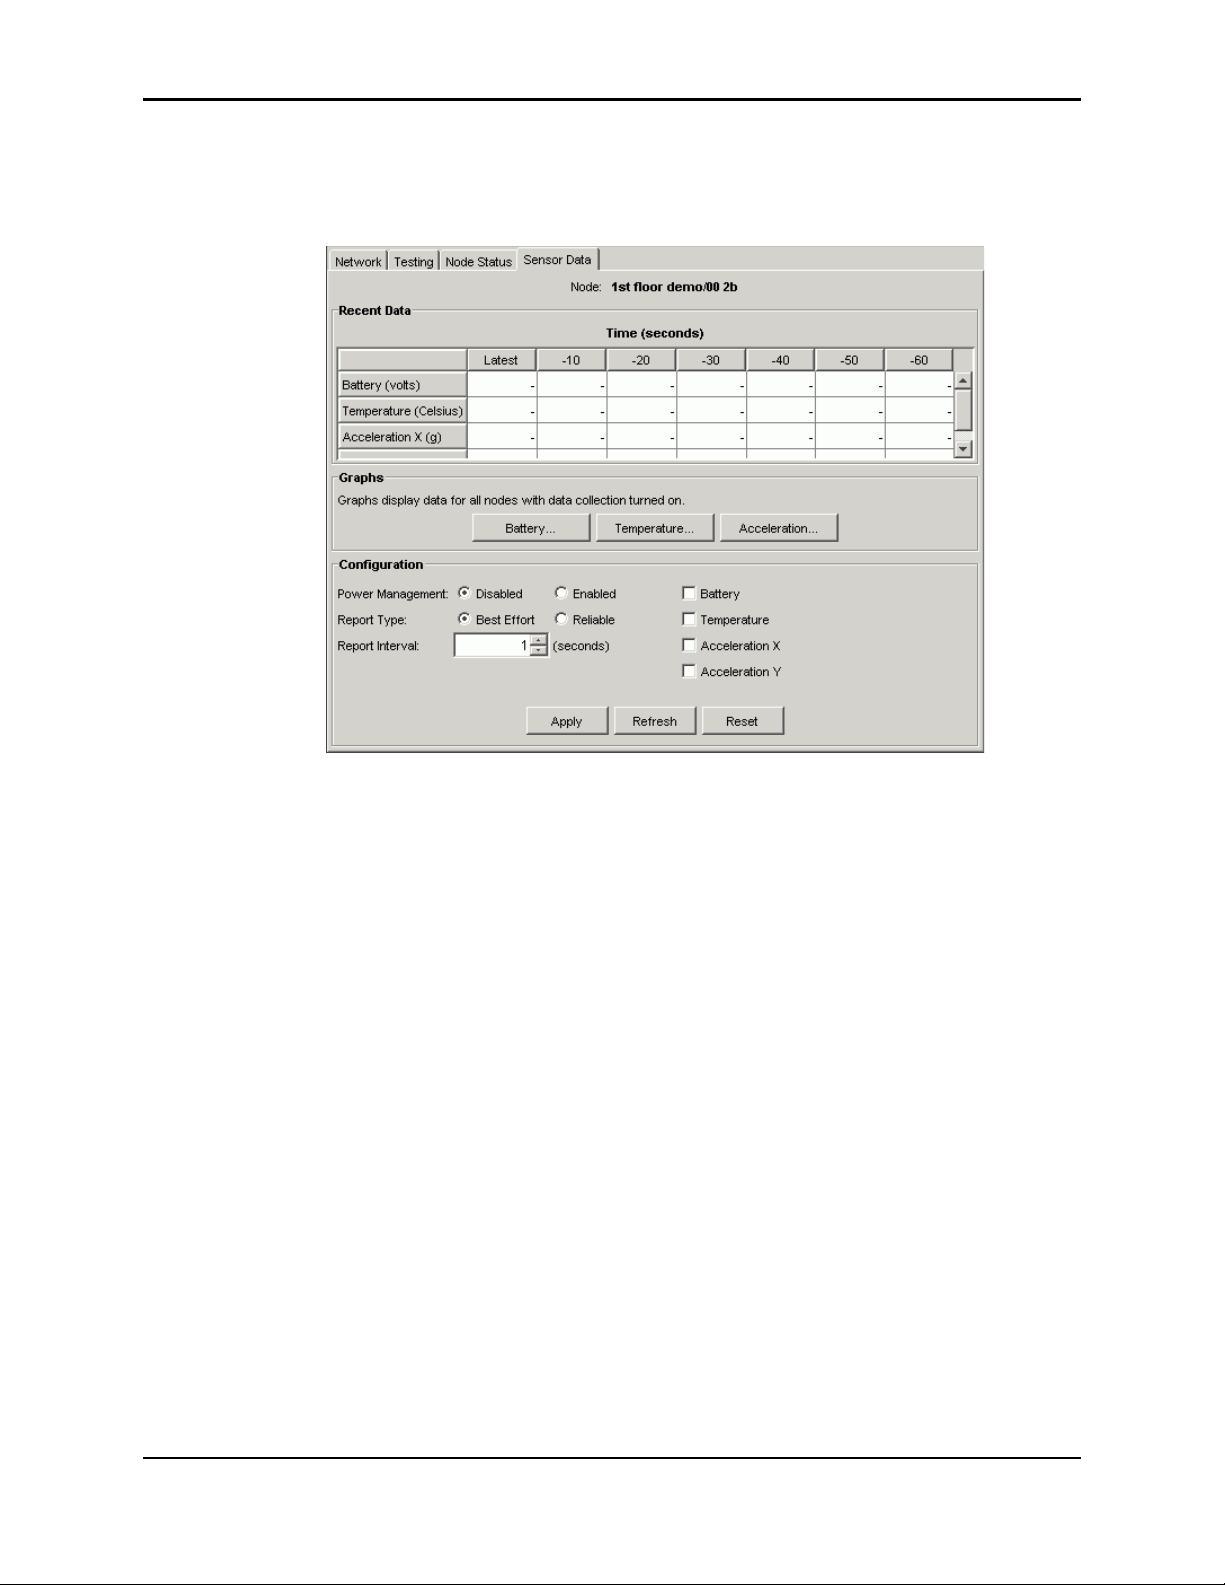
1. Click the Sensor Data tab. The Sensor Data window displays. The window may display a
node label and node ID:
2. Specify the node from which you want to collect data by one of the following methods:
Click the Nodes folder in the folder tree, then click the folder for an individual node.
Display the network map and click a node.
The ID of the selected node appears in the window, and the window fields activate.
If the node ID does not appear, click the Refresh button at the bottom of the Sensor
Data window. If the node ID still does not appear, Ember Studio Lite cannot hear the
node well enough. Try repositioning the node or increasing its transmission power
setting. (See “Viewing Node Properties” on page 59 for information on changing the
transmission power property.)
If the window displays a message that the sensor data application cannot resolve the local
ID, open the Node Configuration window and click the Refresh button. To open the
Node Configuration window, double-click a node icon in the network map or the Nodes
folder.
3. Select the checkbox for the data that you want to collect.
4. Select Best Effort or Reliable.
5. Specify a report interval.
6. Click Apply. After a few seconds, the window displays a message reporting that the
module sensor has accepted the new data settings.
Ember Evaluation Kit User’s Guide 120-0047-000C Final Page 38
Page 39
Chapter 5: Collecting and Viewing Sensor Data Viewing Sensor Data
7. Stimulate the module sensor whose output you are collecting. For information on doing
this, see “Obtaining Sensor Data” on page 30.
Viewing Sensor Data
Sensor data can be viewed in raw or graphed form.
Viewing Raw Sensor Data
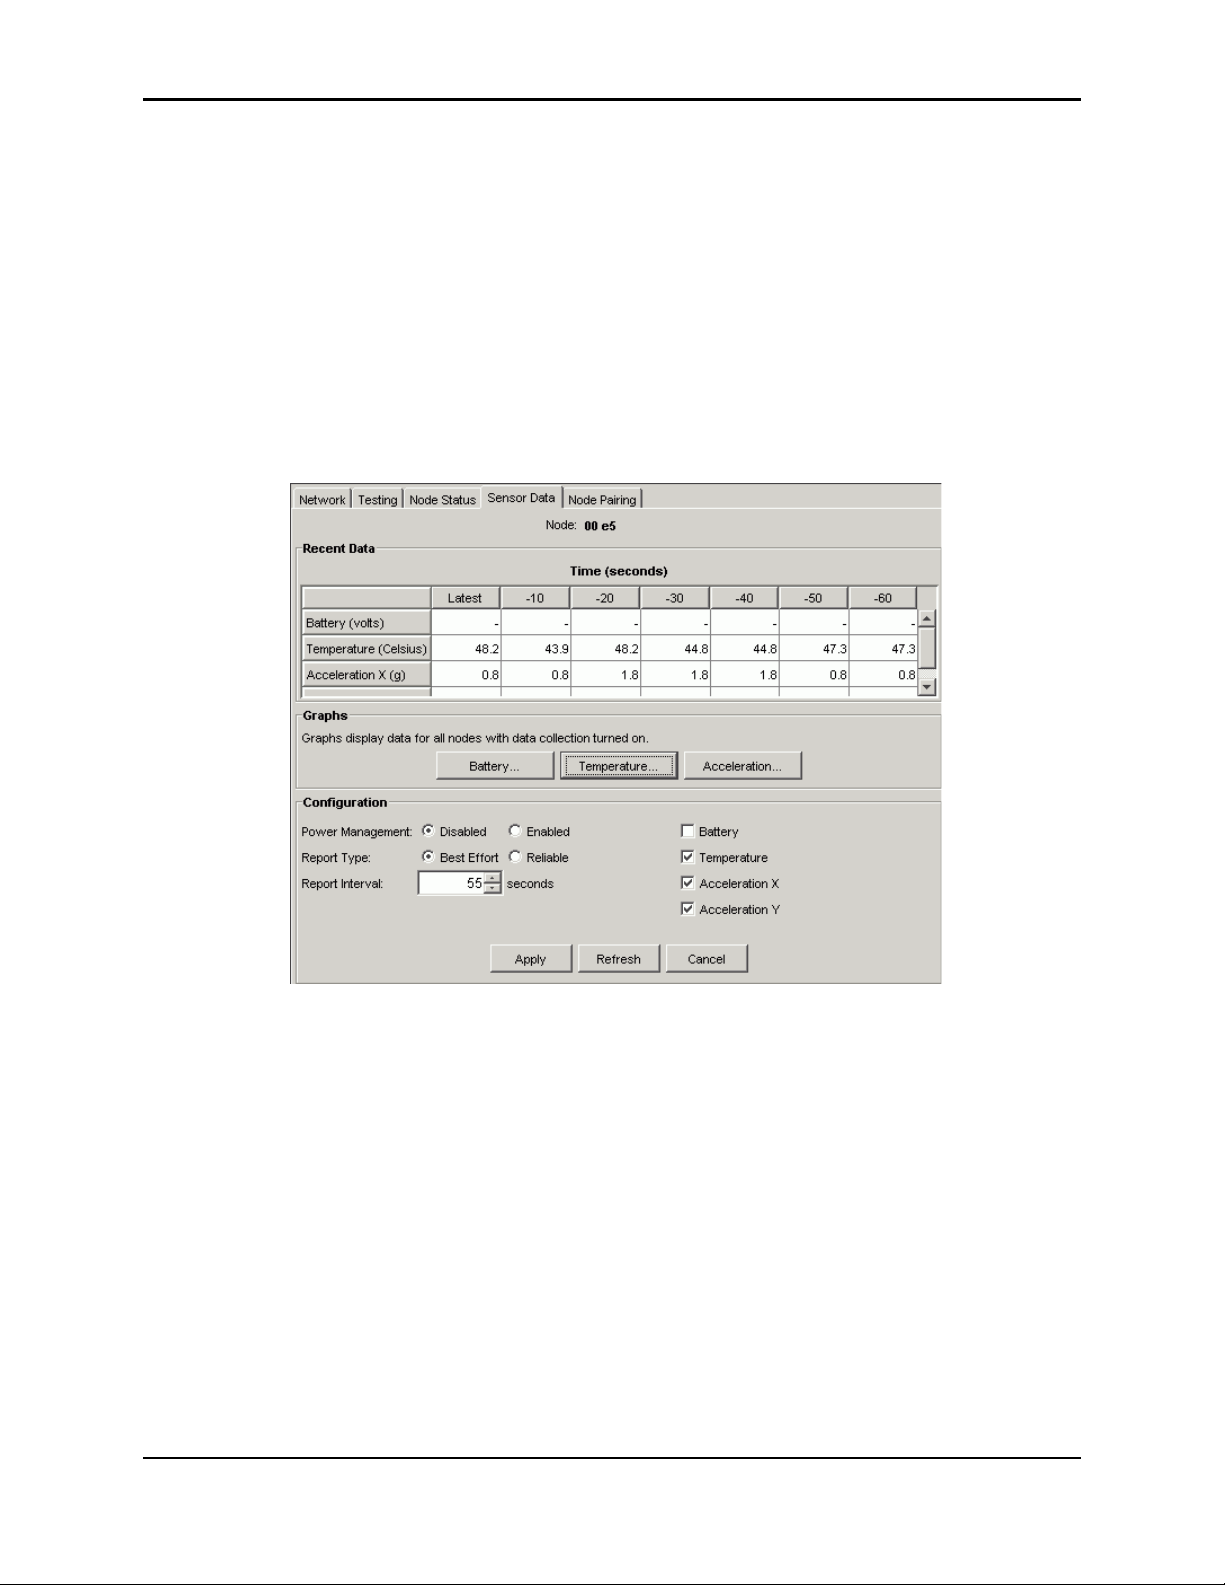
Raw sensor data are reported in the Recent Data section of the Sensor Data window. This
section shows the most recent data value, plus old data back to 60 seconds before the latest
report.
Ember Evaluation Kit User’s Guide 120-0047-000C Final Page 39
Page 40
Chapter 5: Collecting and Viewing Sensor Data Enabling Power Management
Viewing Sensor Data Graphs
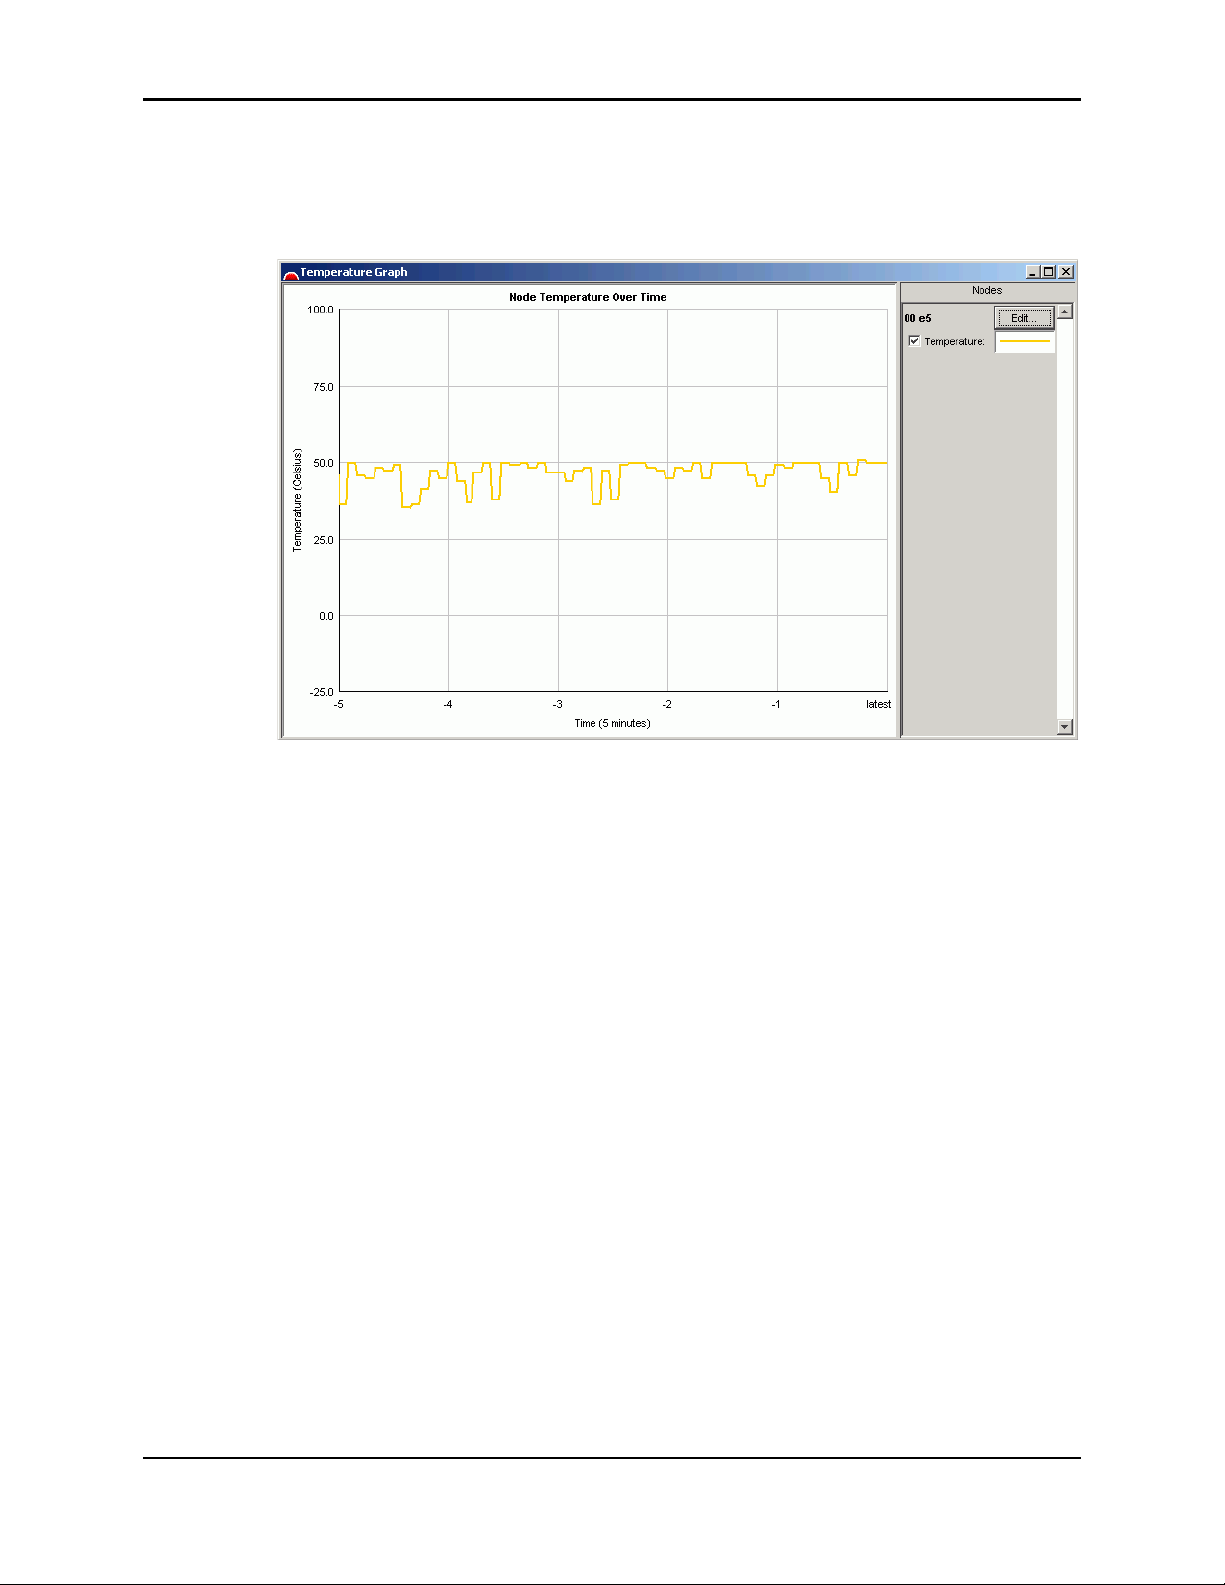
To view a sensor data graph, click a graph button in the Graphs section of the Sensor Data
window. The selected graph displays in a new window.
Enabling Power Management
Use the power management sample application to instruct a module to enter a low-power
sleep state except when it is transmitting sensor data. For an explanation of how power
management works, see “Using the Power Management Application” on page 30.
Ember Evaluation Kit User’s Guide 120-0047-000C Final Page 40
Page 41
Chapter 5: Collecting and Viewing Sensor Data Enabling Power Management
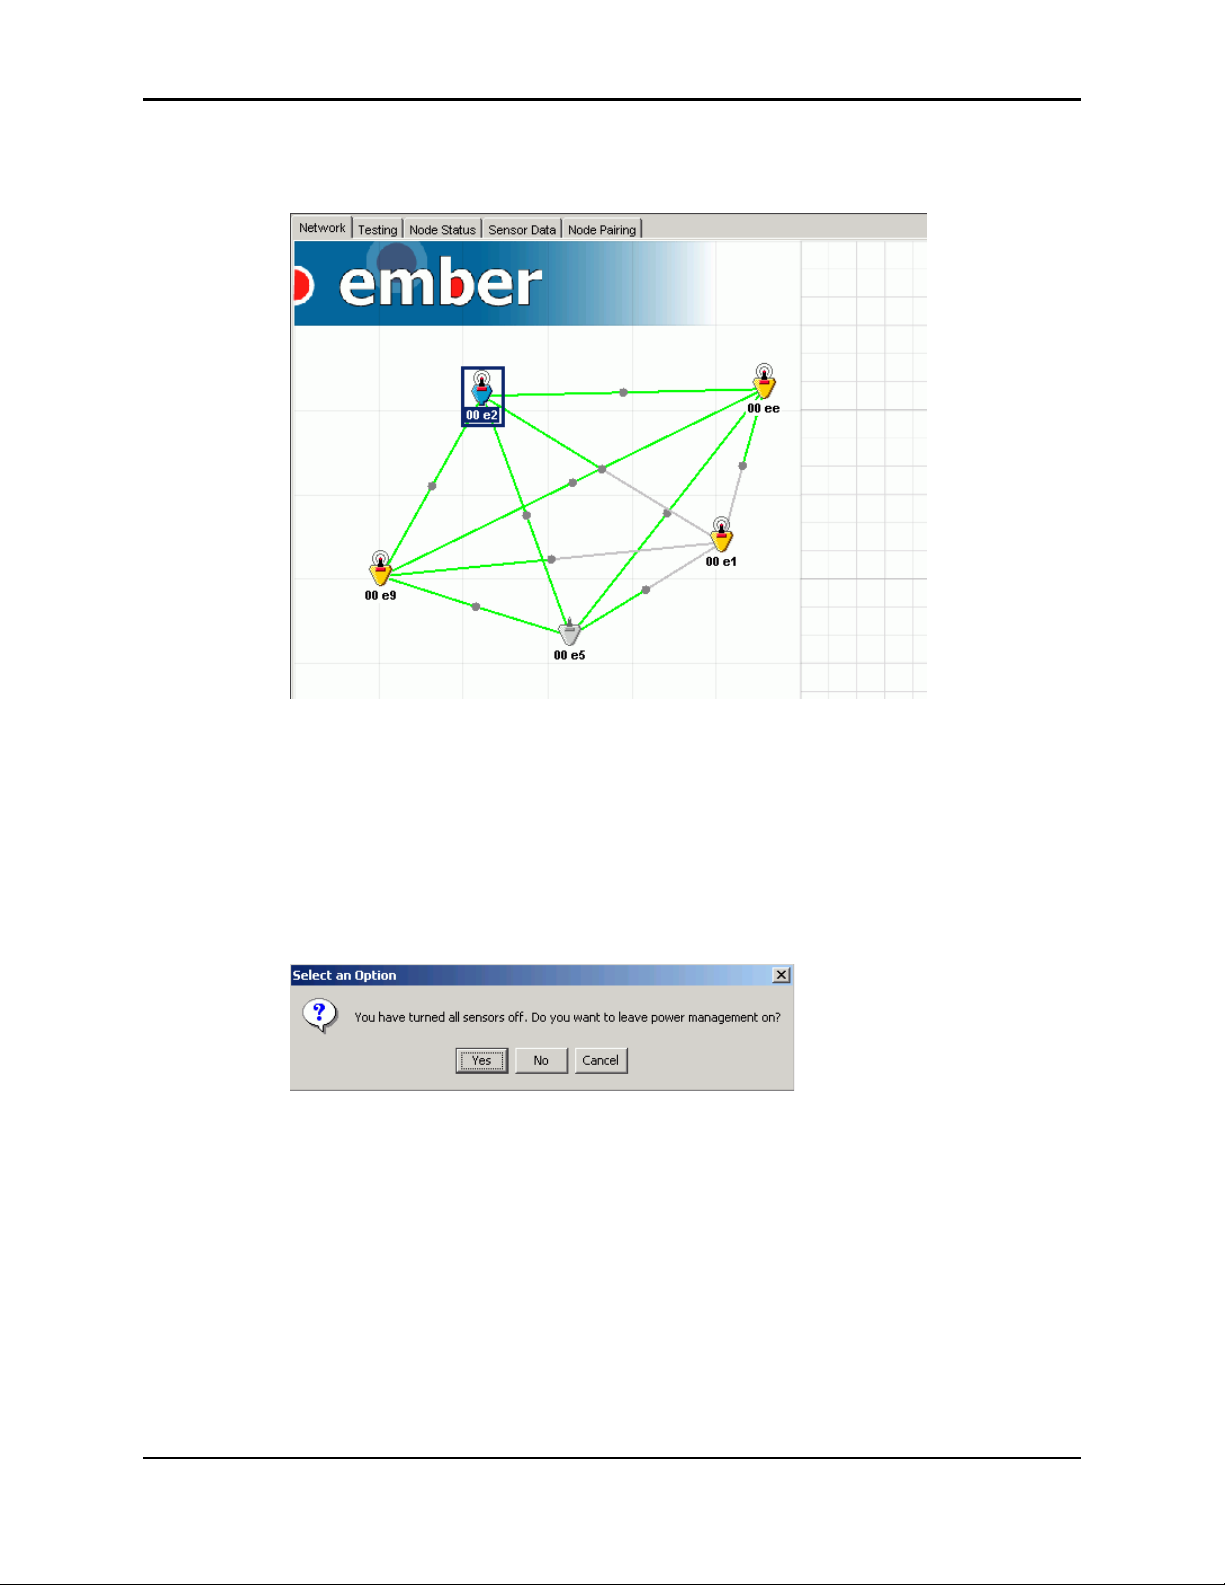
The network map displays the inactive node icon for sleeping nodes. In the following figure,
node 00E5 is sleeping:
To enable power management:
Select the Enabled checkbox in the Configuration section of the Sensor Data window. The
node enters a sleep-wake cycle, waking only to report the data it has been configured to
report. For more information about how power management works, see “Using the Power
Management Application” on page 30.
If you attempt to enable power management without specifying sensor data collection, the
following message displays:
To disable power management:
Use one of the following methods:
z Deselect the Disabled checkbox in the Configuration section of the Sensor Data window.
z Turn the module off.
The node exits the sleep-wake cycle and begins participating in the network again.
Ember Evaluation Kit User’s Guide 120-0047-000C Final Page 41
Page 42

Chapter 6: Getting Started with Ember Studio Lite Installing Ember Studio Lite
CHAPTER 6 Getting Started with Ember Studio
Lite
Installing Ember Studio Lite . . . . . . . . . . . . . . . . . . . . . . . . . . . . . . . . . . . . . . . . . . . .42
Opening and Closing Ember Studio Lite . . . . . . . . . . . . . . . . . . . . . . . . . . . . . . . . . .42
Viewing Ember Studio Lite Help. . . . . . . . . . . . . . . . . . . . . . . . . . . . . . . . . . . . . . . . . 43
About the Ember Studio Lite Main Window . . . . . . . . . . . . . . . . . . . . . . . . . . . . . . . 43
Printing the Main Window . . . . . . . . . . . . . . . . . . . . . . . . . . . . . . . . . . . . . . 45
Connecting to a Network . . . . . . . . . . . . . . . . . . . . . . . . . . . . . . . . . . . . . . . . . . . . . 45
Using the Network Connection Wizard . . . . . . . . . . . . . . . . . . . . . . . . . . .46
Switching to a Different Network. . . . . . . . . . . . . . . . . . . . . . . . . . . . . . . . . 47
Deleting a Network Connection . . . . . . . . . . . . . . . . . . . . . . . . . . . . . . . . . 48
Changing Network Settings. . . . . . . . . . . . . . . . . . . . . . . . . . . . . . . . . . . . . . . . . . . .48
Using the Network Map . . . . . . . . . . . . . . . . . . . . . . . . . . . . . . . . . . . . . . . . . . . . . . 50
Network Map Elements . . . . . . . . . . . . . . . . . . . . . . . . . . . . . . . . . . . . . . . . 51
Refreshing the Network Map. . . . . . . . . . . . . . . . . . . . . . . . . . . . . . . . . . . . 52
Moving Network Map Icons . . . . . . . . . . . . . . . . . . . . . . . . . . . . . . . . . . . .52
Configuring Network Map Preferences. . . . . . . . . . . . . . . . . . . . . . . . . . . . 52
Displaying a Custom Background Image . . . . . . . . . . . . . . . . . . . . . . . . . . 54
Installing Ember Studio Lite
Insert the Evaluation Kit CD into your CDROM drive. The installation program should
begin to run. If it does not, browse to the CDROM drive and double-click
EmberStudioLiteInstaller.exe.
Opening and Closing Ember Studio Lite
To open Ember Studio Lite, click the Ember Studio Lite desktop icon:
The Ember Studio Lite main window and network connection wizard display. Use the wizard to
connect to a network
either remotely or locally (see “Connecting to a Network” on page 45).
Ember Evaluation Kit User’s Guide 120-0047-000C Final Page 42
Page 43
Chapter 6: Getting Started with Ember Studio Lite Viewing Ember Studio Lite Help
To close Ember Studio Lite, click the Close button in the top right corner of the window, or
select File > Exit.
Viewing Ember Studio Lite Help
Select Help > Documentation from the main menu to open a PDF help document. Click the
Bookmarks tab to view the document table of contents.
About the Ember Studio Lite Main Window
The Ember Studio Lite main window allows you to:
z View the network or the results of network tests, in both graphic and text form.
z Perform network tests and network administration tasks.
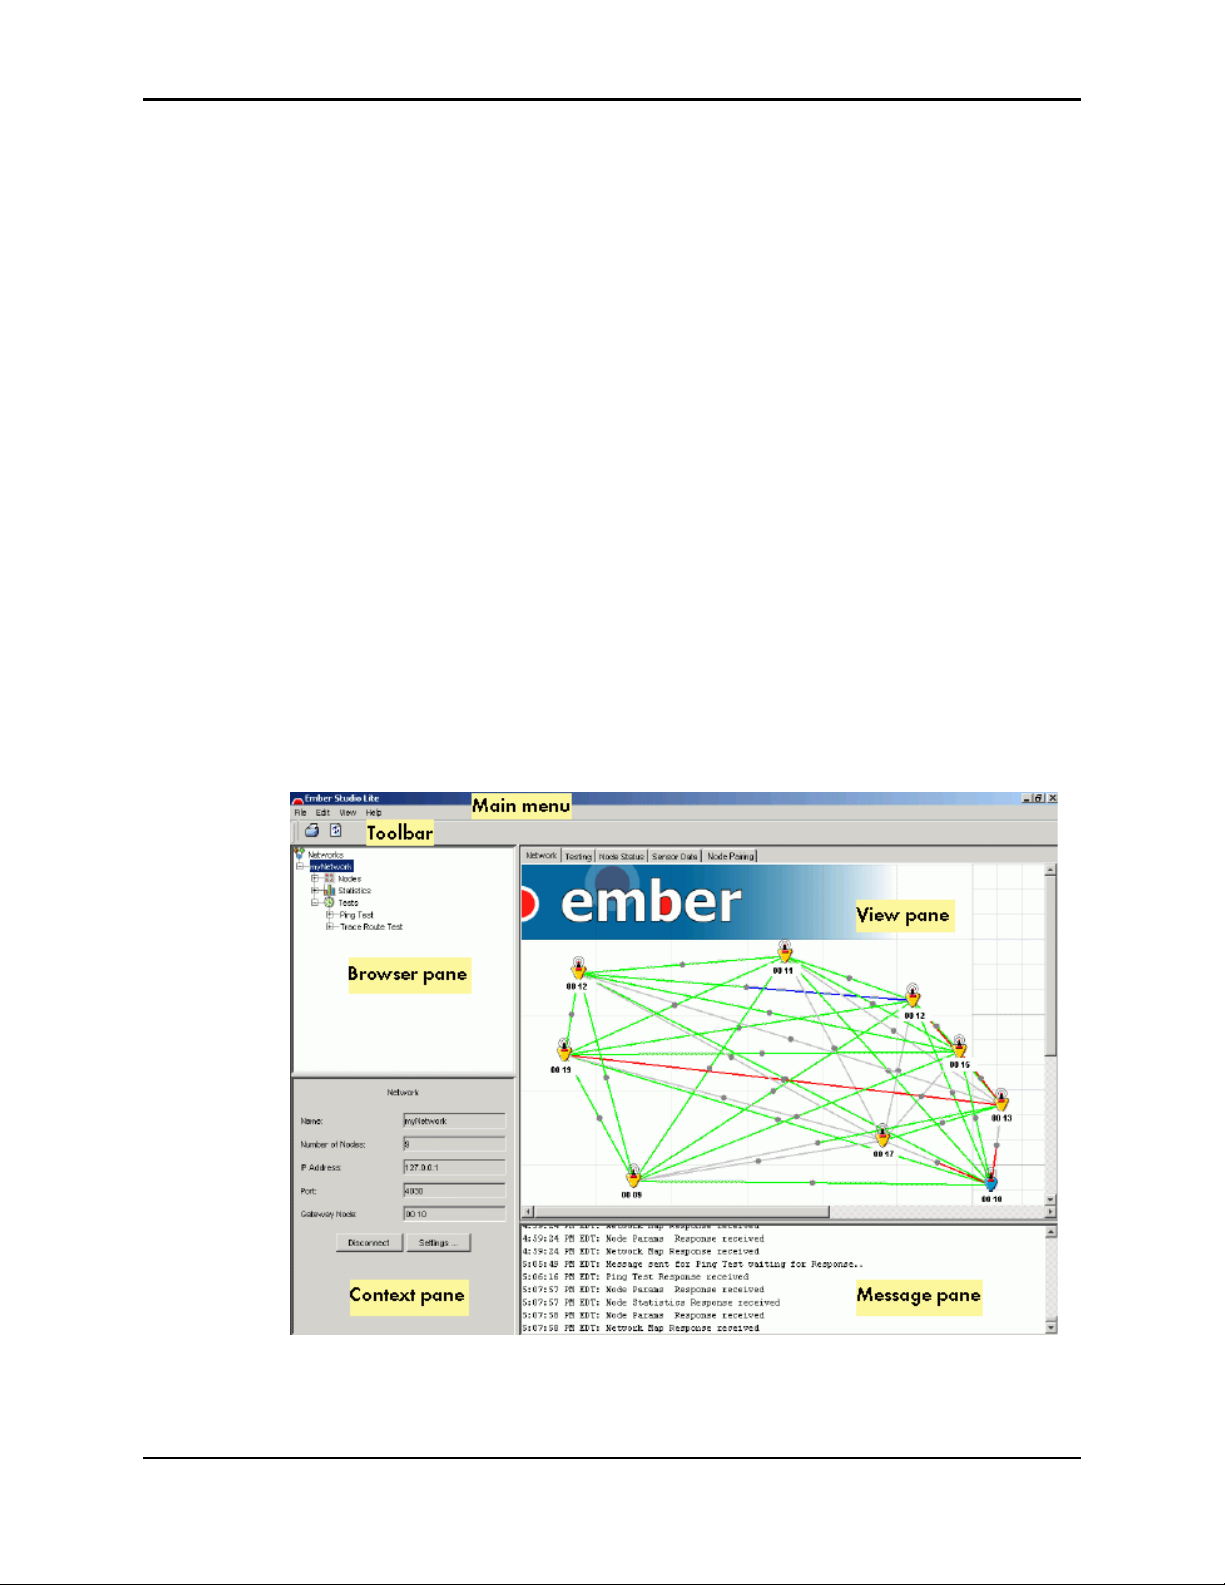
The main window operates as described in Figure 6-1. The Tree View controls what displays
in the other main window panes:
z To see the network map: Click Nodes.
z To run a ping or trace route test or to view test results: Click Ping Tests or Trace Route
Tests.
To perform other Ember Studio Lite operations, such as refreshing the screen, select an
option from the main menu or the toolbar. Available options and tools are documented
elsewhere in this user guide.
Figure 6-1: Ember Studio Lite main window
Ember Evaluation Kit User’s Guide 120-0047-000C Final Page 43
Page 44
Chapter 6: Getting Started with Ember Studio Lite About the Ember Studio Lite Main Window
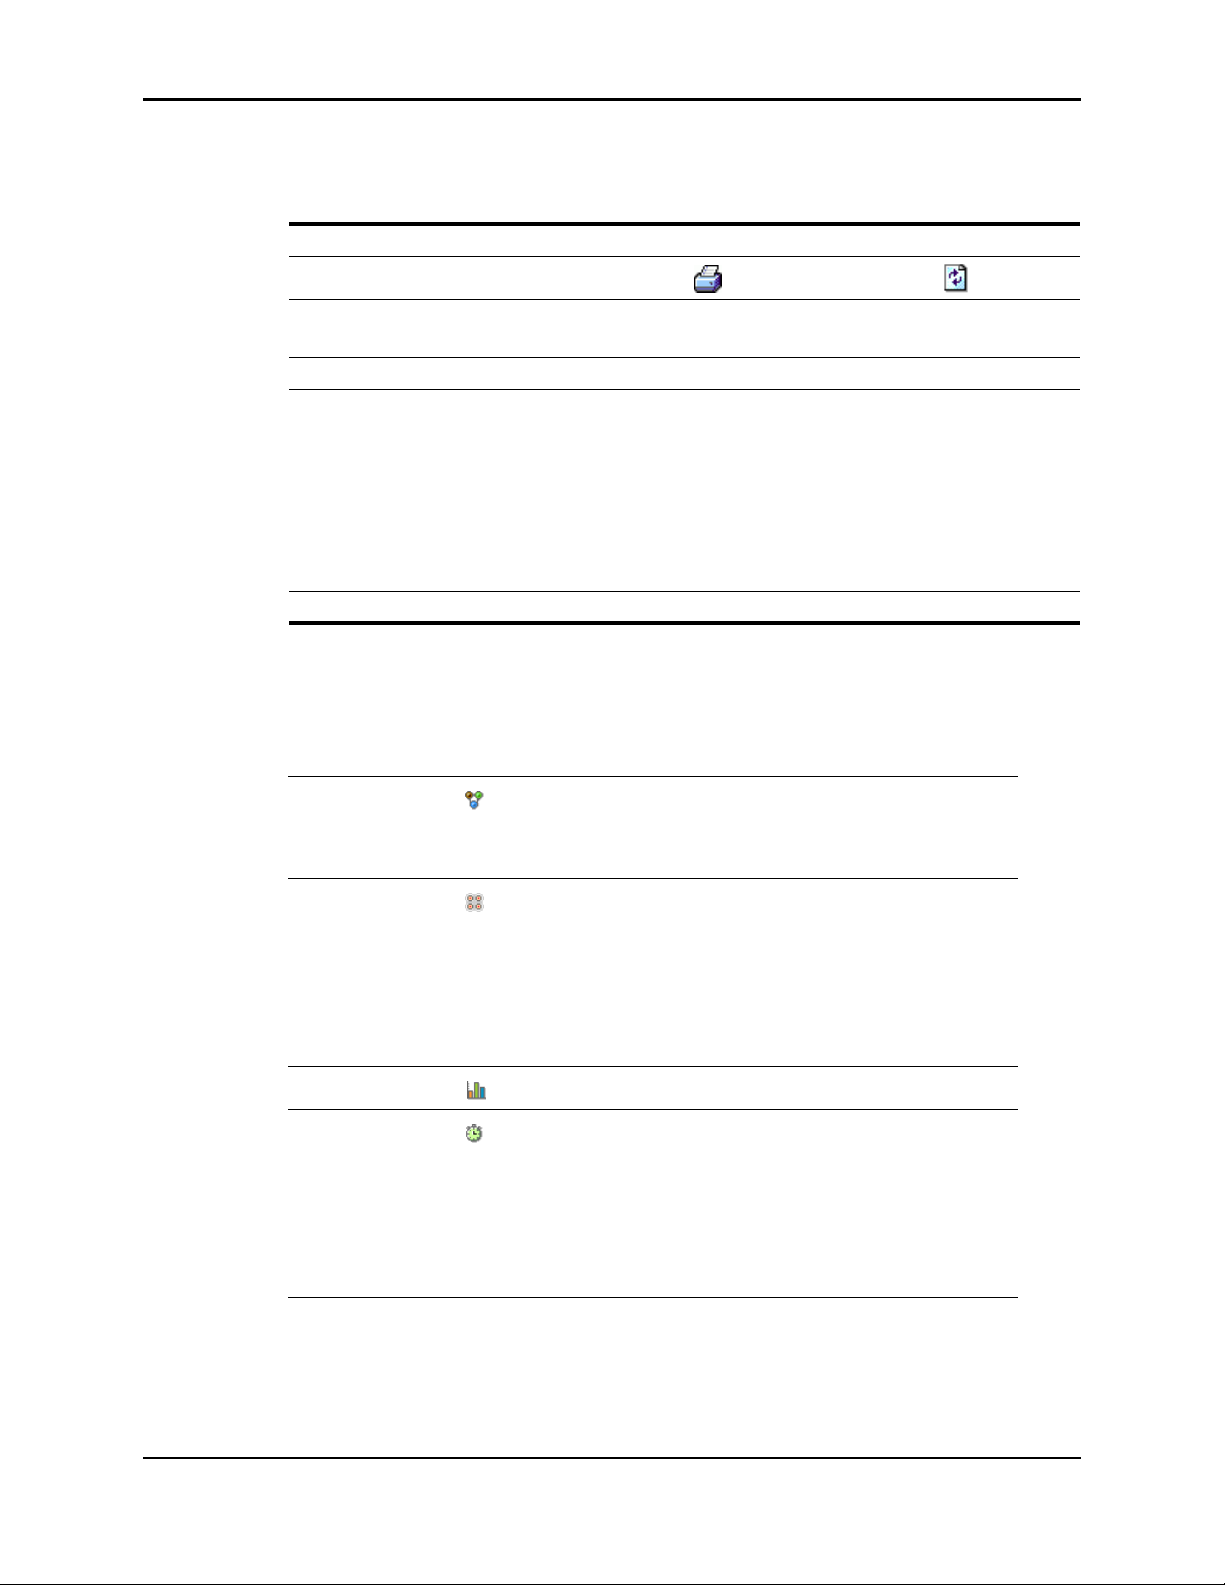
Table 6-1: Ember Studio Lite Main Window Regions
Main menu Contains the File, Edit, View, and Help menus.
Tool bar
Contains the Print button ( )and the Refresh button ( ).
Browser pane Displays a collapsible folder tree that provides information about the
network and access to network management tools.
Context pane Displays data entry windows or report windows.
View pane Displays the contents of its tabbed windows:
z Network: Graphical network map
z Testi ng : Graphical view of test results
z Node Status: Real-time node status data
z Sensor Data: Module sensor data settings and graphs
z Node Pairing: Graphical view of paired nodes
Message pane Displays Ember Studio Lite status messages.
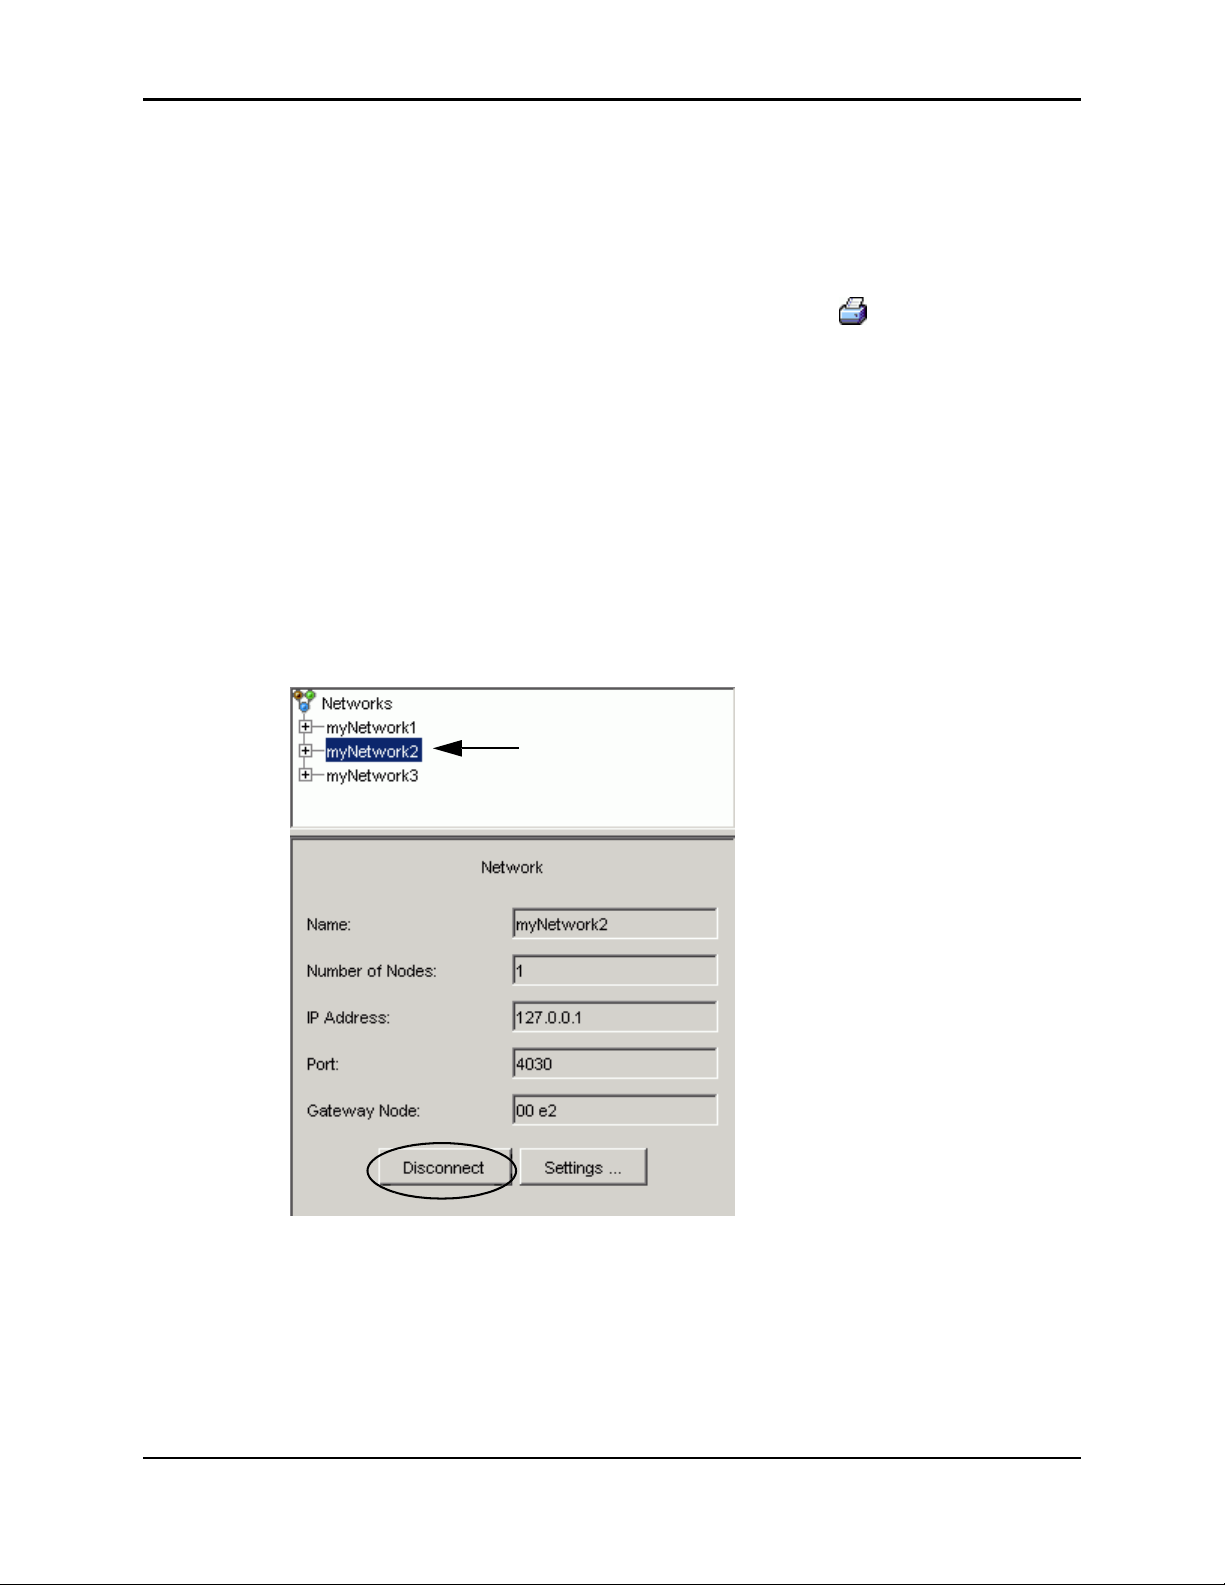
About the Folder Tree
Clicking folders in the folder tree gives you access to Ember Studio Lite tools and network
data:
Networks folder
Nodes folder
Statistics folder
Tests folder
z Single-click the folder to view a window allowing you to
connect to a network.
z Right-click any network folder to delete it.
z Single-click the folder to display a folder for each
networked node.
z Single-click a specific node folder to view parameters
for the node.
z Double-click the top-level Node folder to open the
Node Configuration window.
z Double-click to display the Statistics window.
z Single-click the folder to display the Ping Test and Trace
Route Test folders.
z Single-click a test folder to run a test or to view results
of previously run tests.
z Right-click the Ping Test or Trace Route Test folder to
delete all tests. Right-click a single test folder to delete it.
About the Message Pane
Occasionally Ember Studio Lite prints an error message in the Message pane. Usually Ember
Studio Lite will continue operating normally, and you can disregard the message. If Ember
Ember Evaluation Kit User’s Guide 120-0047-000C Final Page 44
Page 45
Chapter 6: Getting Started with Ember Studio Lite Connecting to a Network
Studio Lite seems to be malfunctioning when it prints an error message, record the message
and contact Ember (see “Getting Help” on page 15). An Ember support engineer will use the
message to diagnose the problem.
Printing the Main Window
To print the main window, click the print button on the toolbar ( ),or select File > Print.
Connecting to a Network
You can connect to a network in two ways:
z Locally via the Ember Studio Lite gateway module connected to your computer.
z Remotely via Ethernet to a computer to which a gateway module is connected.
You c an serially connect to any number of EmberNet networks. Each network connection
that you open creates a network folder in the folder tree. Network folders persist, allowing
you to switch connections easily, but you can delete them at will.
To determine which network is active, click network folders until you locate the one whose
network window displays the Disconnect button:
This is the active network.
Note the Disconnect
button.
Ember Evaluation Kit User’s Guide 120-0047-000C Final Page 45
Page 46
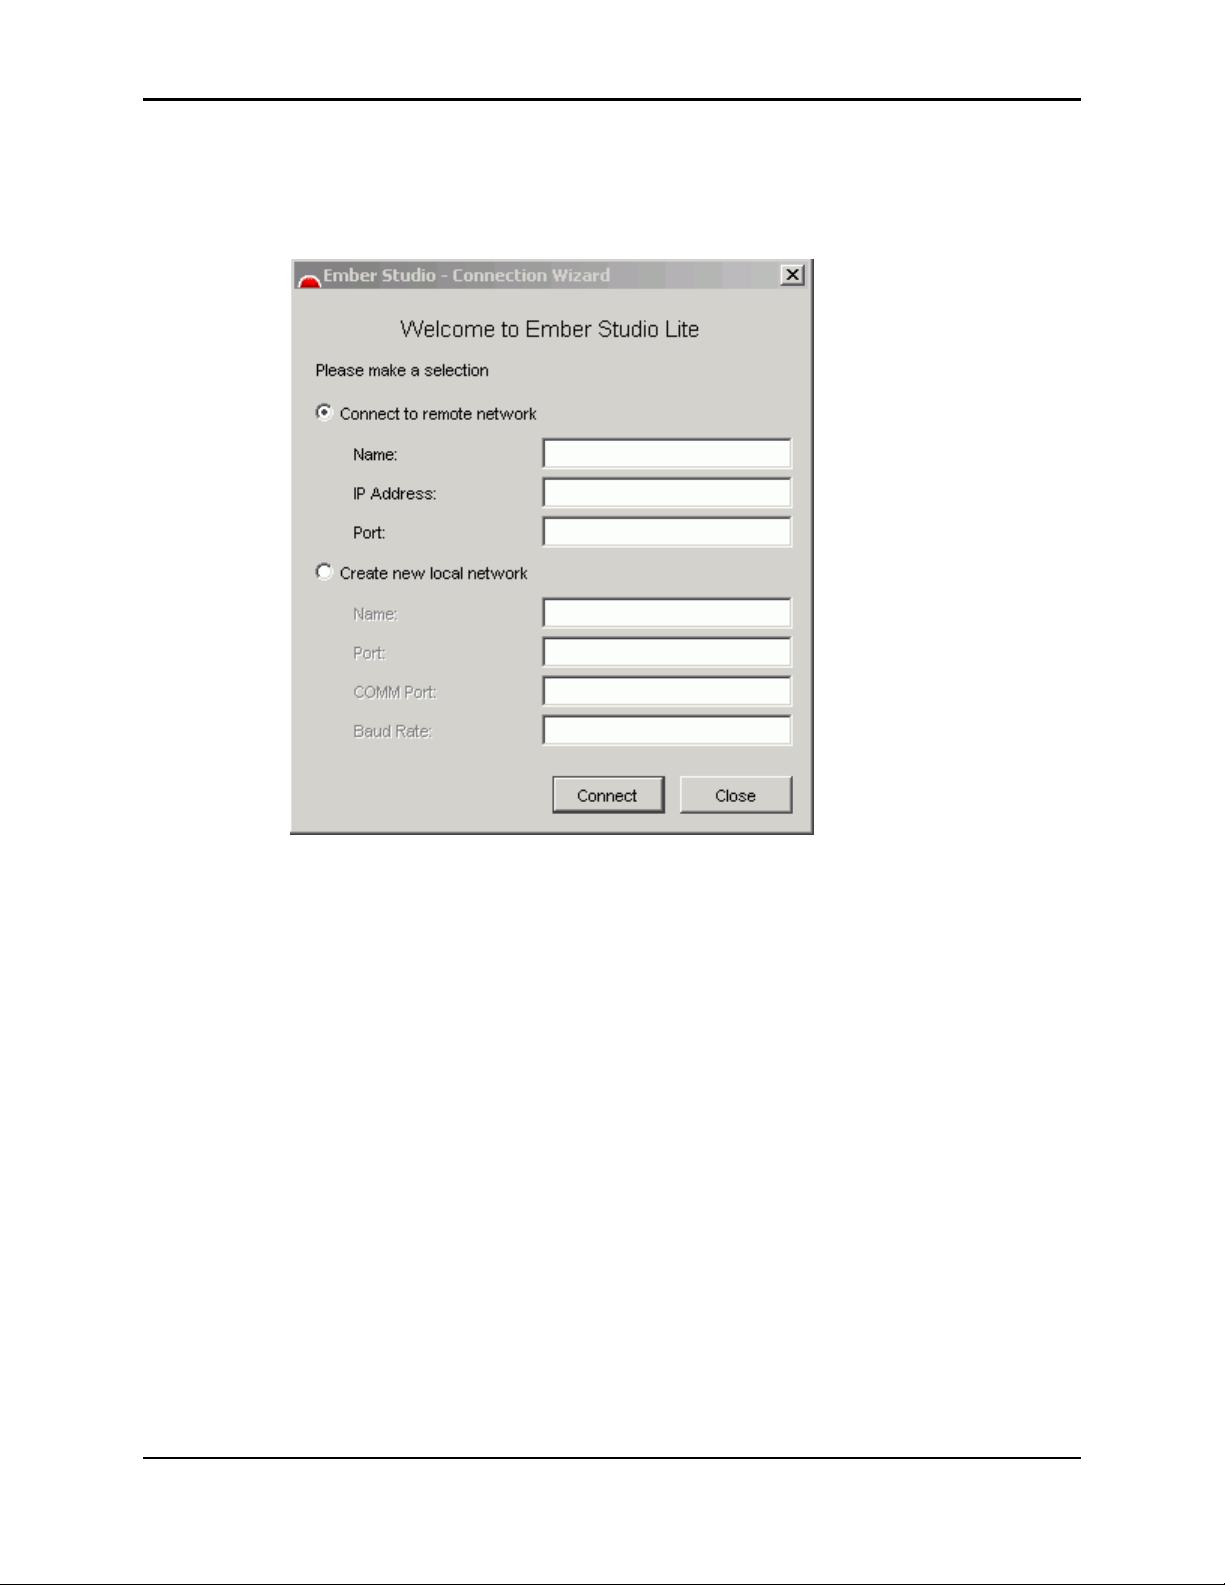
Chapter 6: Getting Started with Ember Studio Lite Connecting to a Network
Using the Network Connection Wizard
The network Connection Wizard automatically displays when you start Ember Studio Lite.
You can also manually display it by selecting File > Connection Wizard.
To connect via the Connection Wizard:
1. Select Connect to Remote Network or Create New Local Network.
2. Enter values into the fields for the selected option.
Name: User-assigned name; will be used for the network folder in the folder tree.
Can be any name you like (for example, Test, network123, My Test Network).
IP Address: IP address of the computer that is connected to the network. 127.0.0.1
is the default.
Port: 4030 is the default.
COMM Port: COM1 is the default.
Baud Rate: 19200 is the default.
3. Click Connect.
Ember Evaluation Kit User’s Guide 120-0047-000C Final Page 46
Page 47
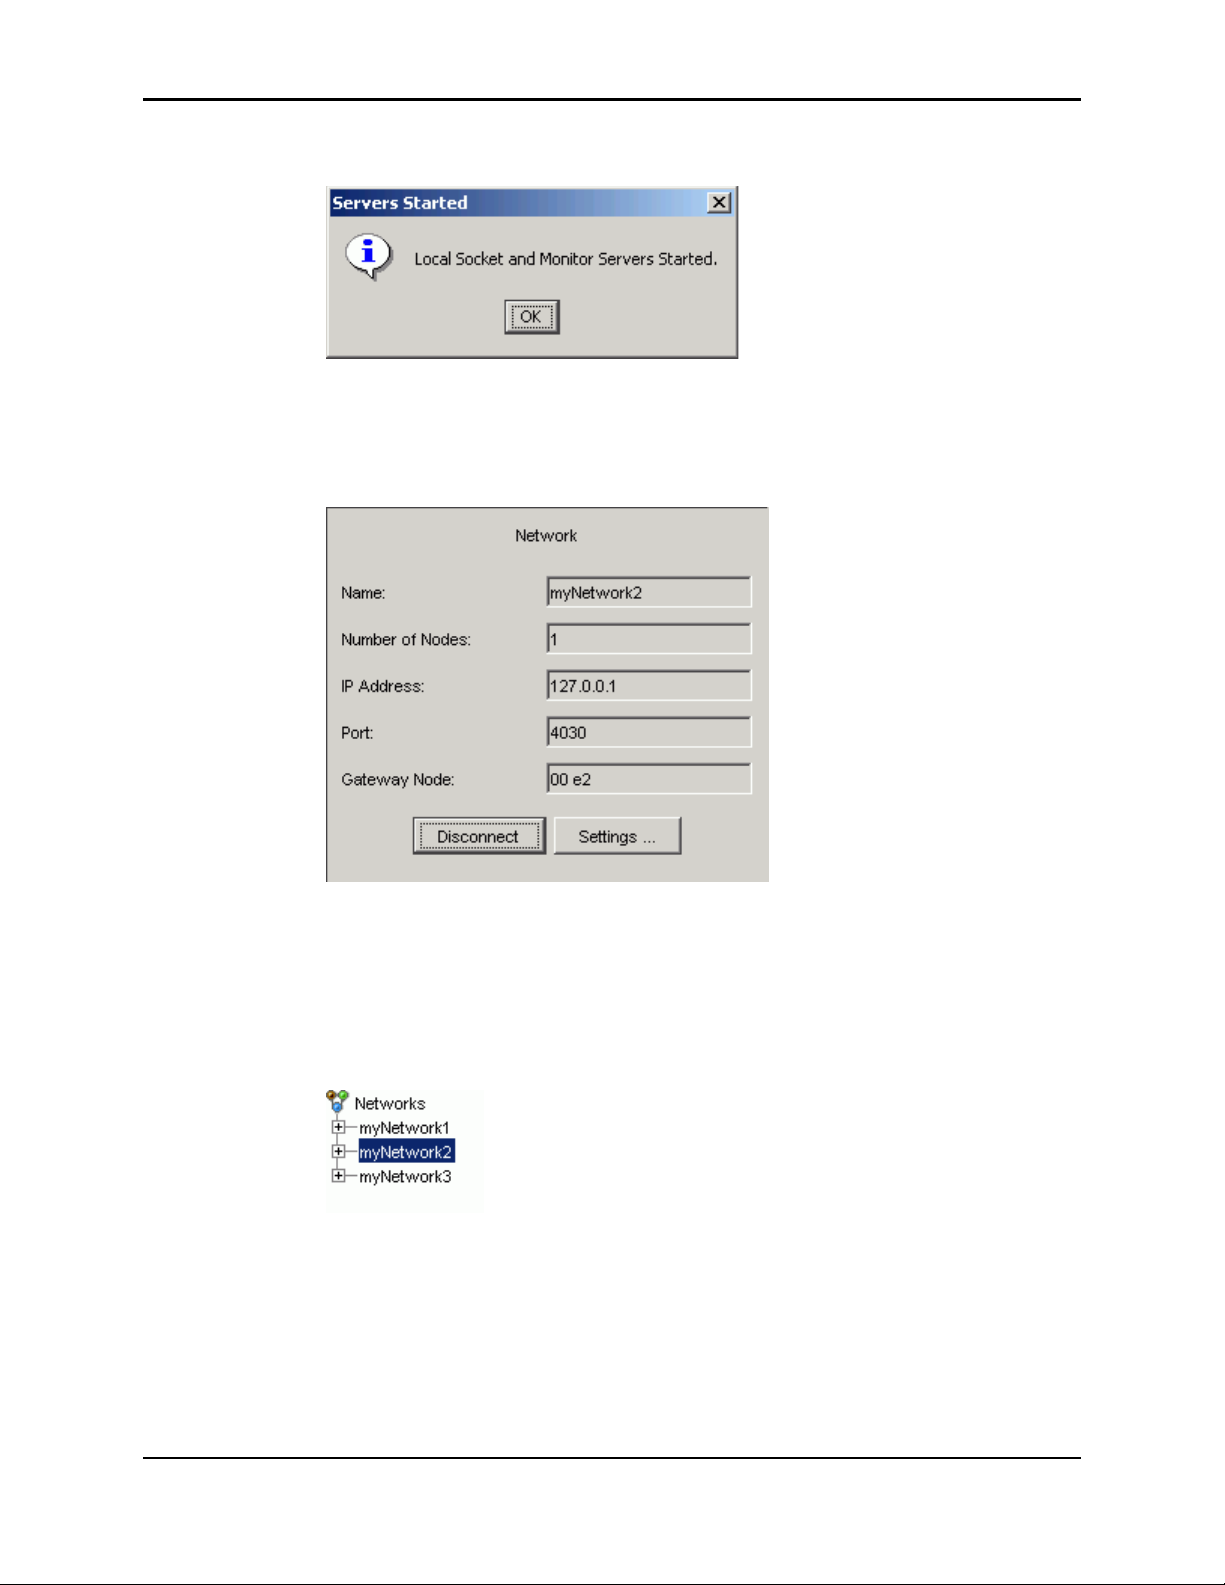
Chapter 6: Getting Started with Ember Studio Lite Connecting to a Network
If you connected to a local network, Ember Studio Lite displays a confirmation window:
4. Click OK in the confirmation window. The Network folder displays in the folder tree,
with three folders under it (Nodes, Statistics, Testing). The network map displays in the
View pane (see Figure 6-1). The Network window displays in the Context pane, showing
information for the new connection:
Switching to a Different Network
To switch to a different network, you must first disconnect from the active network.
To switch to a different network:
1. Click the folder for the active network. The Network window displays in the Tree View:
Ember Evaluation Kit User’s Guide 120-0047-000C Final Page 47
Page 48
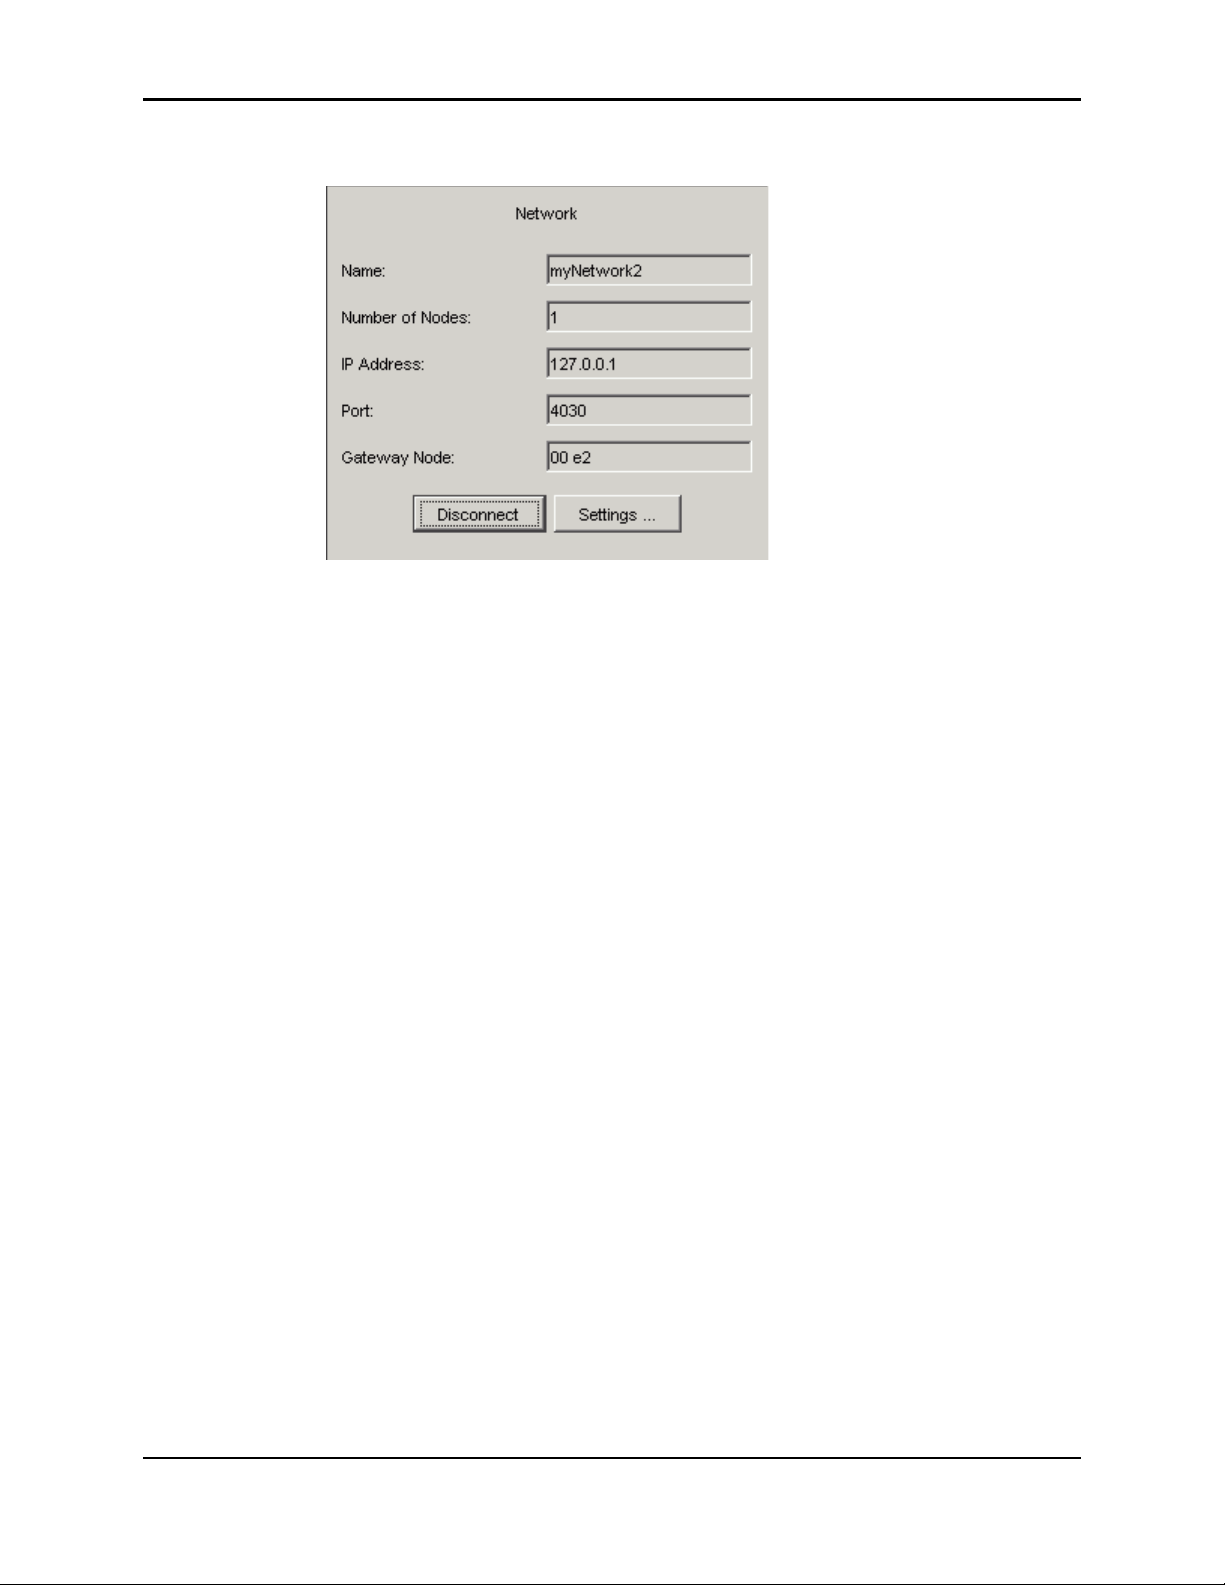
Chapter 6: Getting Started with Ember Studio Lite Changing Network Settings
The Network window displays, showing information for the active network:
The network window shares three fields with the Connection Wizard—Name, IP
Address, and Port—plus the following two unique fields:
Number of Nodes: Number of nodes in the network
Gateway Node: Node ID of the network gateway, consisting of the last two bytes of
the hexadecimal representation of the module’s 64-bit EUI number. (To view the
entire 64-bit number, open the Node Parameters window for the gateway; see
“Viewing Node Parameters” on page 56.)
2. Click Disconnect. The Connect button replaces the Disconnect button, signifying that
Ember Studio Lite is no longer connected to that network.
3. Do one of the following:
To open a new network connection: Follow the procedure in “Using the Network
Connection Wizard” on page 46.
To re-open a previously established network connection: Click the network
folder, then click Connect in the Network window. The Disconnect button replaces
the Connect button, signifying that Ember Studio Lite is now connected to the
network. The network map for the connection displays in the View pane.
Deleting a Network Connection
To delete a network connection, right-click the folder and select Delete Network.
Changing Network Settings
You can adjust the pace and intensity of network traffic by changing the following network
settings:
z Statistics Refresh Rate: Time interval at which the statistics window refreshes itself.
z Node Timeout Interval: Time period over which Ember Studio Lite listens for a node
to respond to a network ping.
Ember Evaluation Kit User’s Guide 120-0047-000C Final Page 48
Page 49
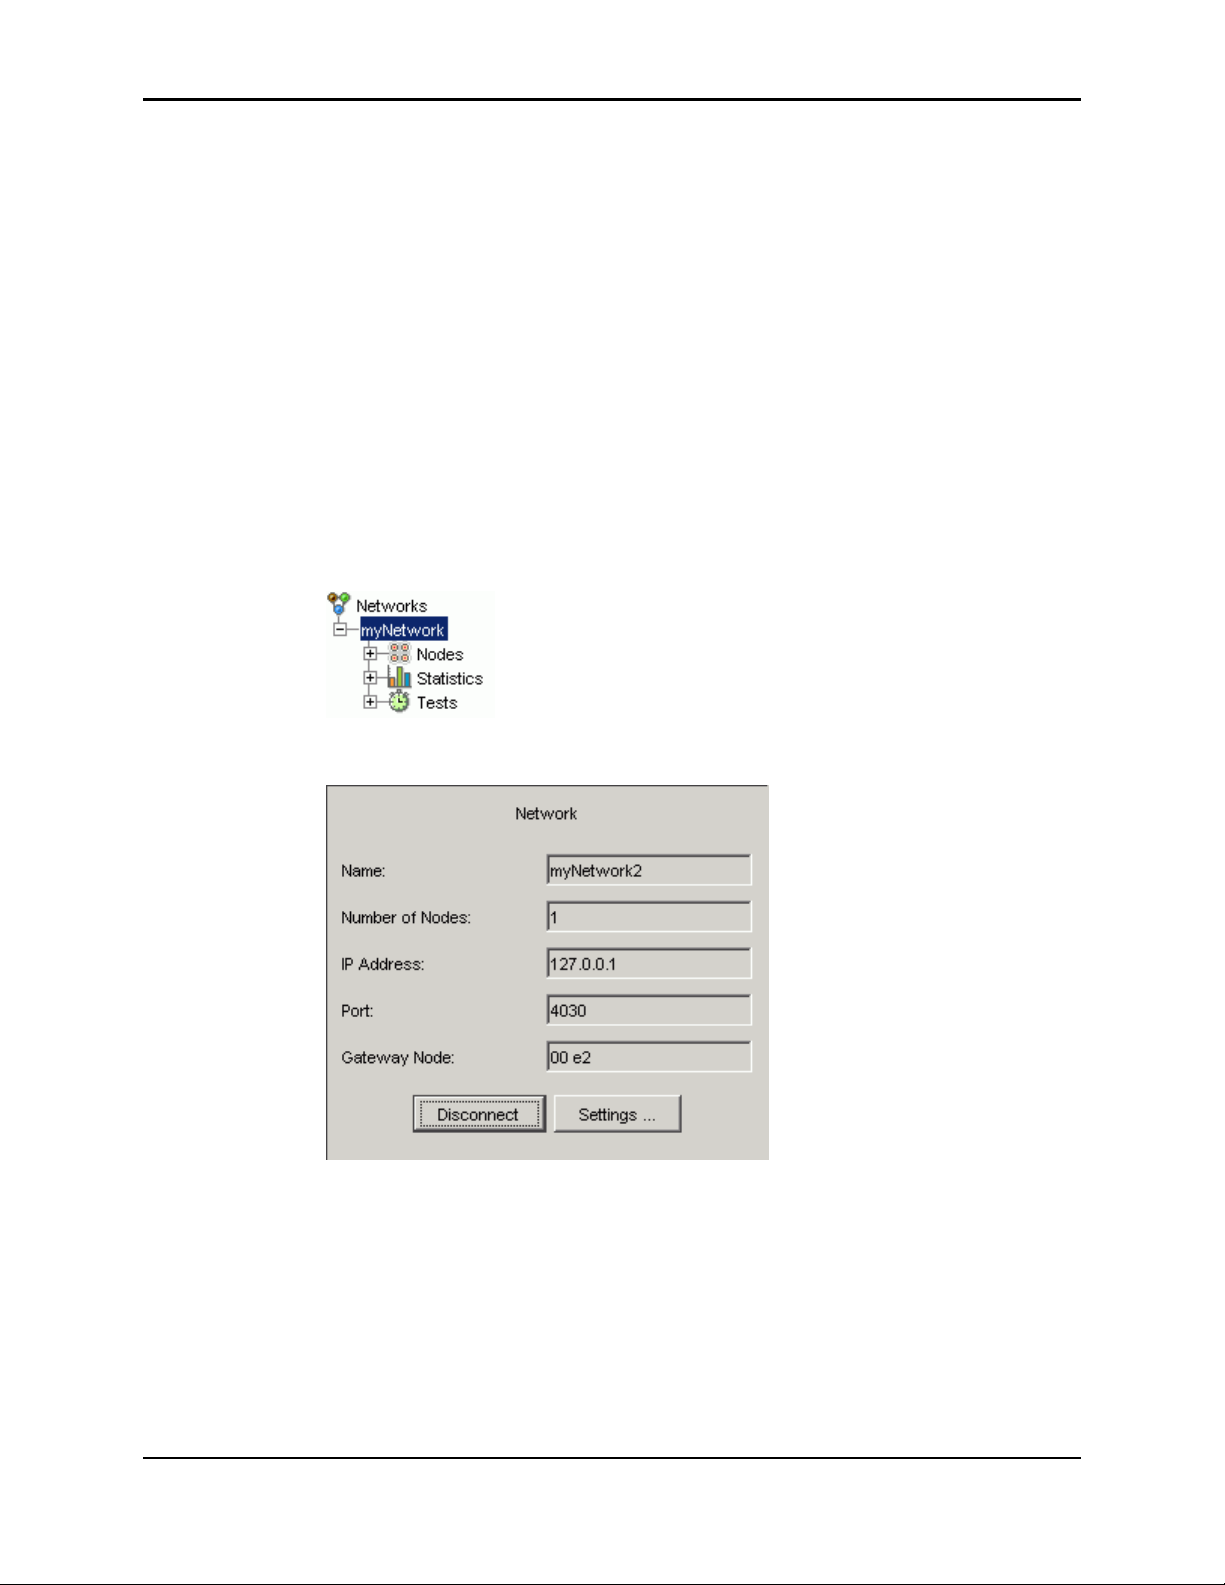
Chapter 6: Getting Started with Ember Studio Lite Changing Network Settings
z Node Ping Interval: Time period at which Ember Studio Lite pings all nodes in the
network and then updates the network map
The node timeout interval must be substantially greater than the node ping interval.
Ember recommends making it three time greater. If it is not, nodes will suddenly go into and
out of the error condition as their timeout periods are reached and Ember Studio Lite decides
that they are offline. If you have turned off the display of error nodes, you will see nodes
suddenly disappear from the network map and then reappear. What is happening is that
Ember Studio Lite is pinging the network to discover all nodes less frequently than it is
listening for nodes to time out. (For information on configuring the display of error nodes,
see “Configuring Network Map Preferences” on page 52.)
To decrease network traffic, enter large values for the statistics refresh rate and node ping
interval.
To change network settings:
1. Click the active network in the folder tree:
The network window displays:
Ember Evaluation Kit User’s Guide 120-0047-000C Final Page 49
Page 50
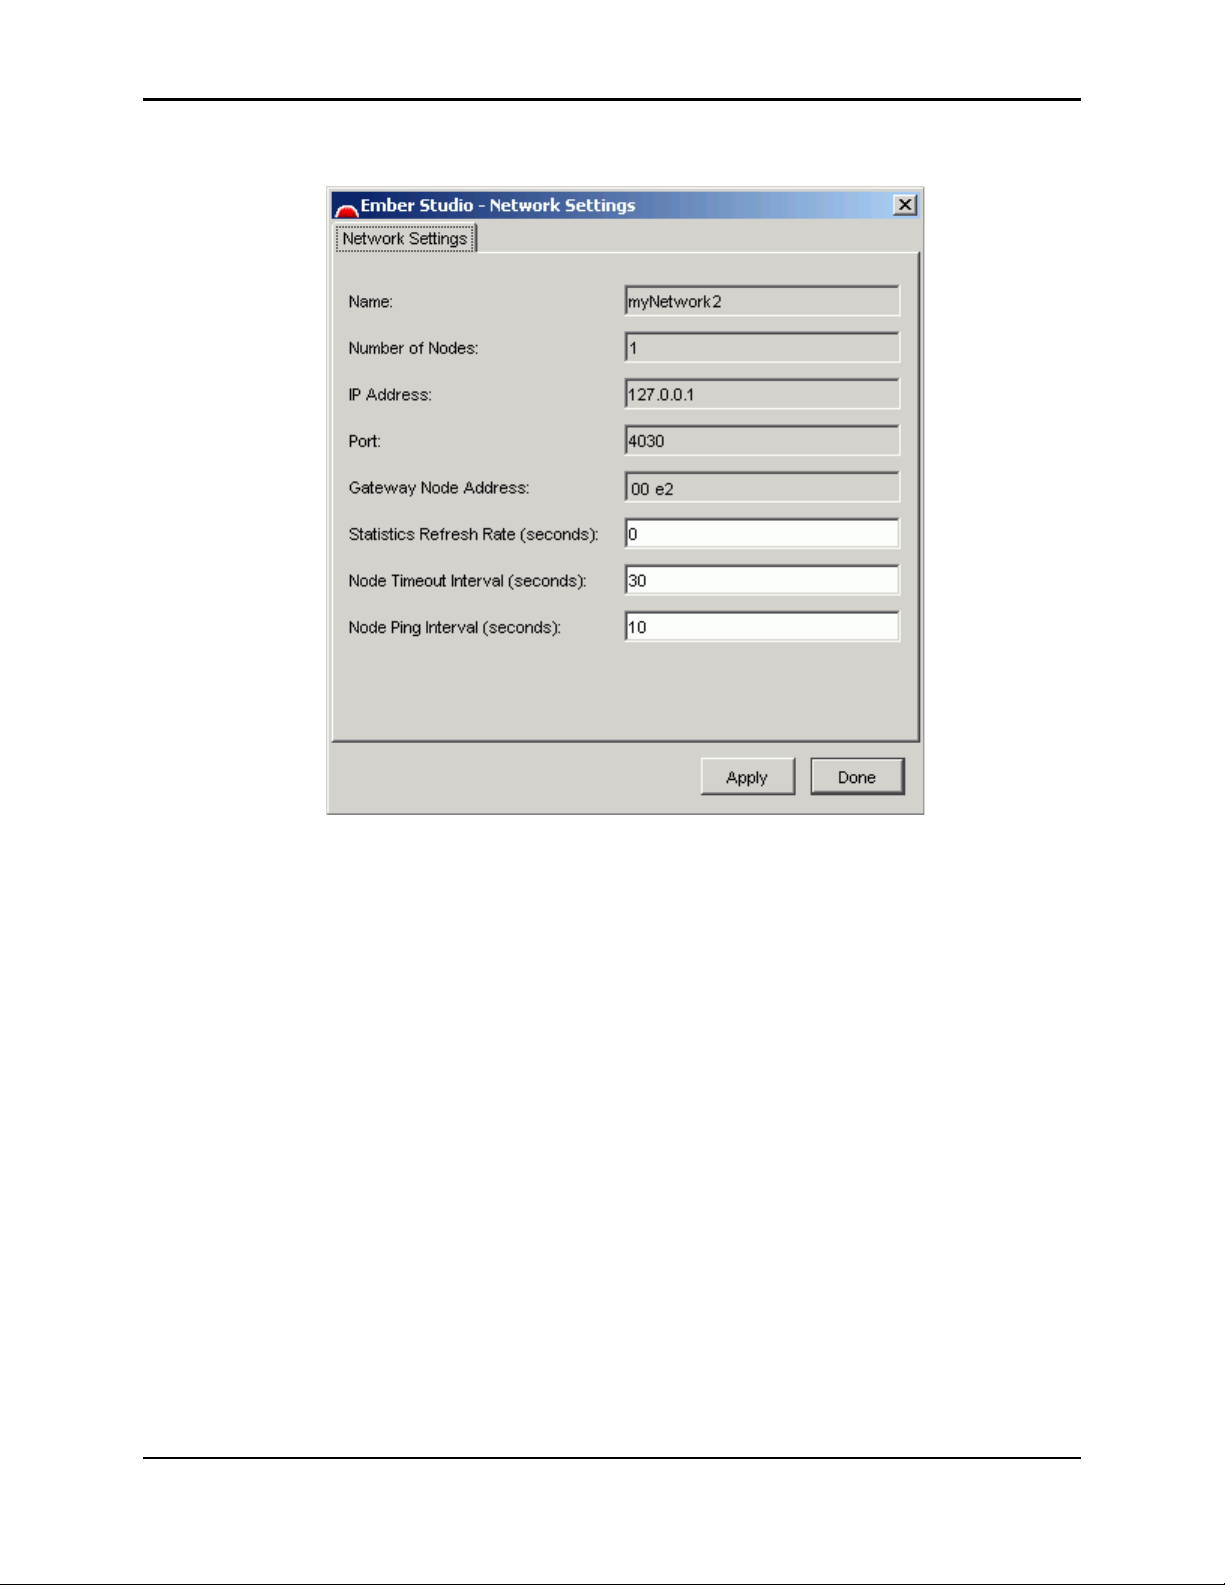
Chapter 6: Getting Started with Ember Studio Lite Using the Network Map
2. Click Settings. The network settings window displays:
3. Enter values into the configurable fields and click Apply.
Using the Network Map
The network map displays:
z A logical representation of a physical network, with icons representing nodes and
lines representing links between nodes.
z An indication of node status, represented by the color of node icons.
z An indication of link signal strength, represented by the color, weight, and style of
node link lines.
You can simulate the physical network on the network map by displaying a background image
of the network environment (for example, a floor plan) behind the map and dragging icons to
positions on the image. You can also customize the node icons and the link lines.
Ember Evaluation Kit User’s Guide 120-0047-000C Final Page 50
Page 51

Chapter 6: Getting Started with Ember Studio Lite Using the Network Map
Network Map Elements
The network map contains the following elements (see Figure 6-2):
z Node icons: Represent the network status of Evaluation Kit modules. There are four
types:
Gateway icon: Node (module) that is physically connected to a computer.
Normal icon: Normally operating network node.
Error icon: Node that is in an error state.
Power management icon: Node that is running the power management sample
application (called “inactive” in the Node Preferences window).
z Node IDs: Consist of the last two bytes of the hexadecimal representation of the node’s
64-bit EUI number. (The entire 64-bit number is visible in the Node Parameter window
(see “Viewing Node Parameters” on page 39.)
z Link lines: Represent links between nodes. The color, weight, and style of the line drawn
from a node to a gray dot signifies the strength of the link between that node and the
node on the other side of the gray dot. Figure 6-2 shows the default preferences for link
lines:
Green: Good signal strength
Blue: Fair signal strength
Red: Poor signal strength
Gray: Very poor signal strength
If no signals are passing between two nodes, no link line will appear between them.
In Figure 6-2 the line between 0022 and 0010 represents an internodal link. The signal
strength represented by line segments A and B is strong. By comparison, 0010 hears only
a fair-quality signal from 0013 and a poor-quality signal from 0007. All links between
Ember Evaluation Kit User’s Guide 120-0047-000C Final Page 51
Page 52
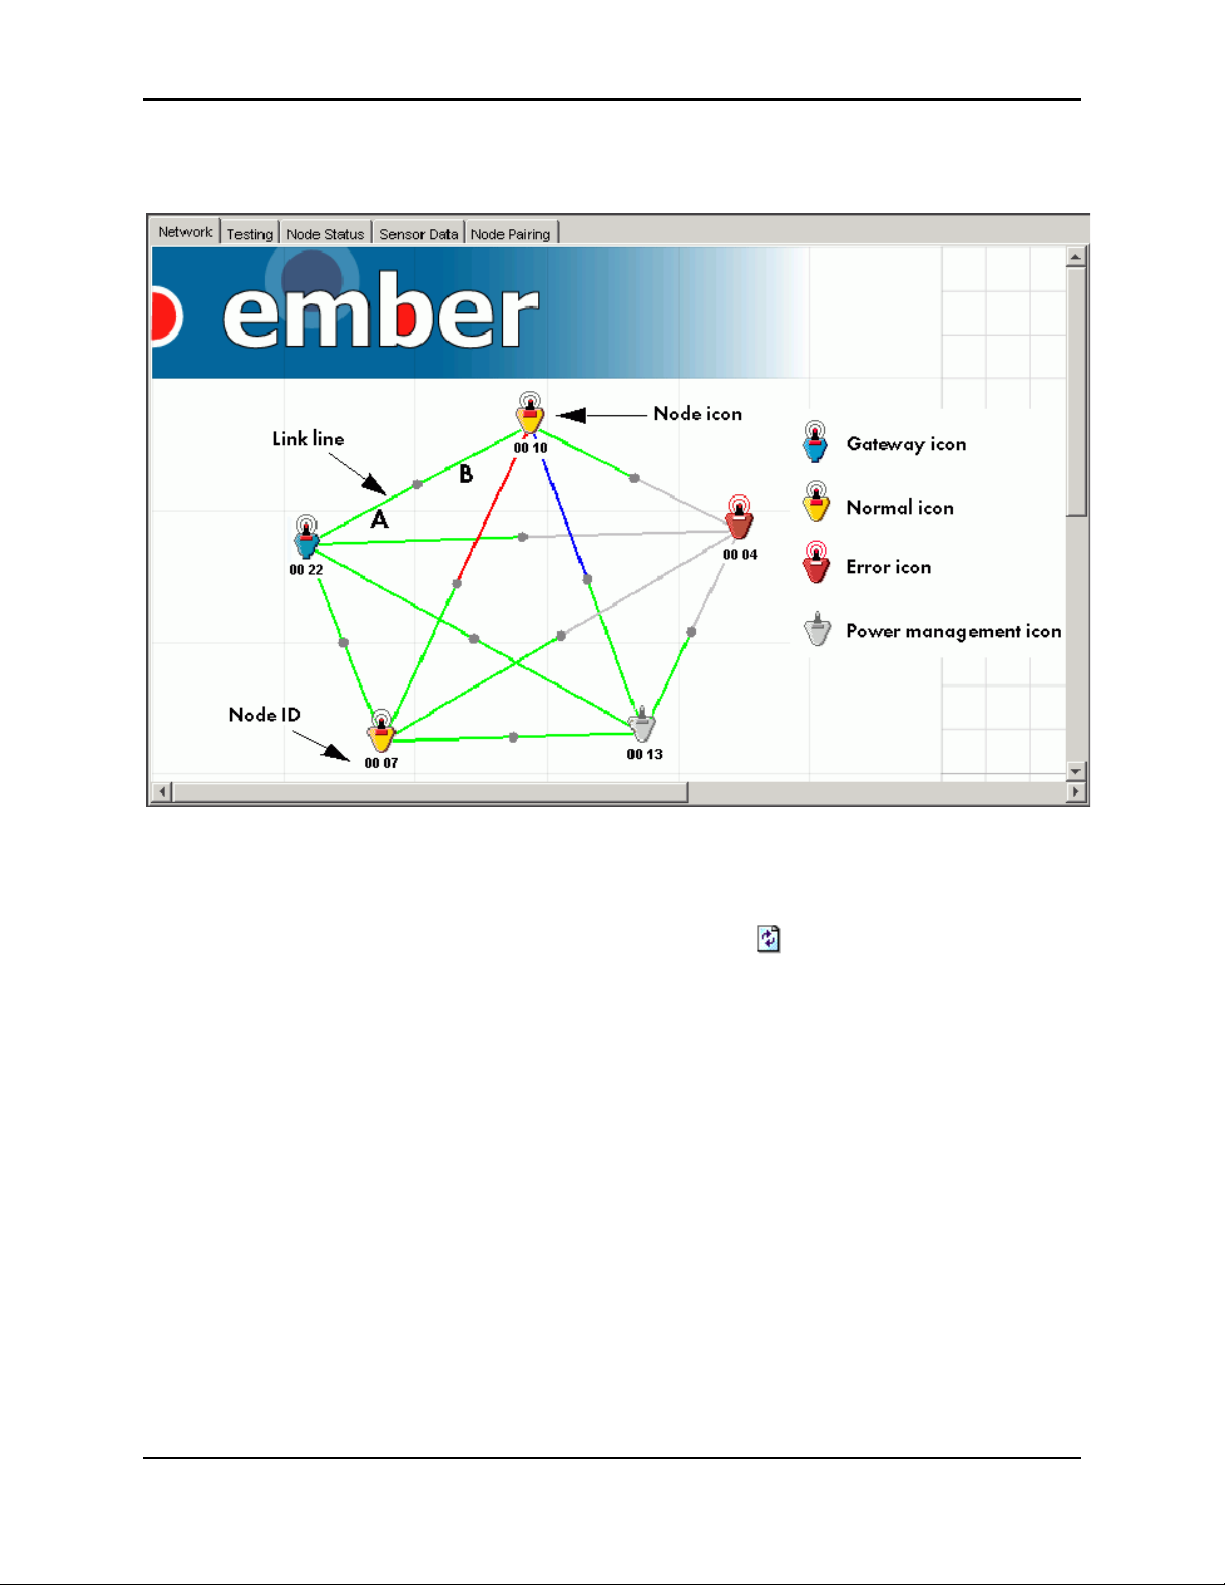
Chapter 6: Getting Started with Ember Studio Lite Using the Network Map
0004 and its neighbors are gray because the node is in an error state, meaning that it hears
almost nothing and transmits no data.
Figure 6-2: Network map elements
Refreshing the Network Map
To refresh the network map, click the Refresh button ( ) or right-click the map and select
Refresh. After a short delay, Ember Studio Lite updates the map.
Moving Network Map Icons
To improve the readability of the network map or to position nodes on a custom background
image, click and drag node icons to a new position.
When you click an icon, a black box displays around it, indicating that the icon has been
selected.
Note: Rearranging node icons does not change the logical structure of a map.
Configuring Network Map Preferences
You can set preferences for the following network map features:
z Nodes
Display your own icons for gateway, normal, error, and power management nodes.
(The power management node icon is termed “inactive” in the Node Preferences
window.)
Ember Evaluation Kit User’s Guide 120-0047-000C Final Page 52
Page 53
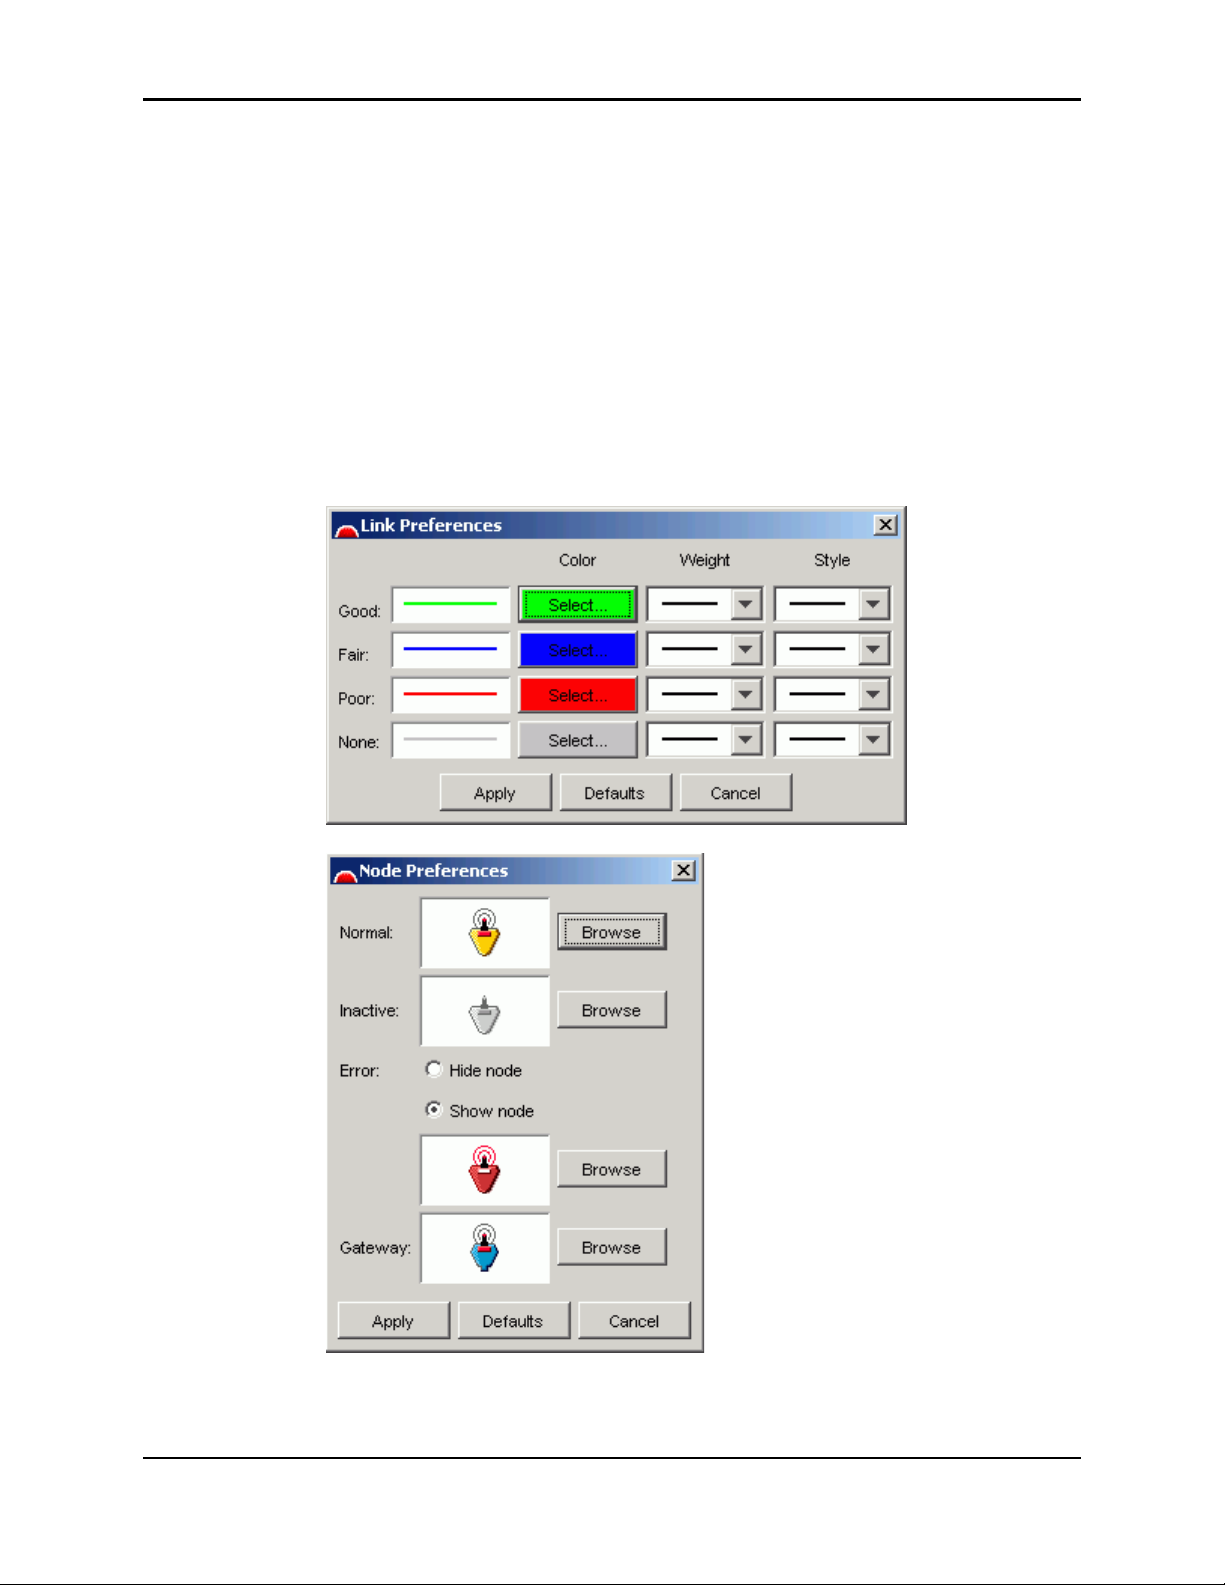
Chapter 6: Getting Started with Ember Studio Lite Using the Network Map
Hide or display nodes that are in an error state.
z Link lines
Specify line color, weight, and style.
You can also toggle the display of error nodes by selecting View > Show Nodes With Error from
the main menu.
To set network map preferences:
1. Do one of the following:
Right-click anywhere in the map and select Link Preferences or Node Preferences.
Select View > Preferences.
2. The selected preferences window displays, showing the current link or node preferences.
3. Select preferences:
To change the color, weight, or style of link lines:
Ember Evaluation Kit User’s Guide 120-0047-000C Final Page 53
Page 54

Chapter 6: Getting Started with Ember Studio Lite Using the Network Map
Select line weight or style from their respective drop-down menus. Click the color
box, then select a color from the palette that displays.
To display custom node icons:
Browse to the folder containing the custom icons and select files.
To toggle the display of nodes in an error state:
Click the hide or show option.
4. Click Apply. After a short delay, the map displays the new preferences.
To restore map icons and link lines to defaults:
Display the node or link preferences window (see “Configuring Network Map Preferences”
on page 52) and click the Defaults button. The default icons or link settings display in the map.
Displaying a Custom Background Image
You can replace the default network map background image with an image of your own
design, such as a graphic of a floor plan, shop floor, or blueprint. Custom maps can be GIF
or JPEG files.
To display a custom background image:
1. Right-click anywhere in the map to display the map preferences menu.
2. Click Set Background Image and browse to the image you want to display.
3. Click Open. The background image displays in the View pane.
4. Drag node icons to their locations on the background image.
To remove a displayed background image:
Right-click the map and select Remove Background Image.
Ember Evaluation Kit User’s Guide 120-0047-000C Final Page 54
Page 55

CHAPTER 7 Managing Network Nodes
Viewing Node Status Information . . . . . . . . . . . . . . . . . . . . . . . . . . . . . . . . . . . . . . .55
Viewing Node Parameters. . . . . . . . . . . . . . . . . . . . . . . . . . . . . . . . . . . . . . . . . . . . .56
Viewing Node Statistics . . . . . . . . . . . . . . . . . . . . . . . . . . . . . . . . . . . . . . . . . . . . . . . 57
Viewing Node Properties. . . . . . . . . . . . . . . . . . . . . . . . . . . . . . . . . . . . . . . . . . . . . .59
Setting Node Properties. . . . . . . . . . . . . . . . . . . . . . . . . . . . . . . . . . . . . . . . . . . . . . .62
Pinging a Node . . . . . . . . . . . . . . . . . . . . . . . . . . . . . . . . . . . . . . . . . . . . . . . . . . . . .62
Rebooting a Node. . . . . . . . . . . . . . . . . . . . . . . . . . . . . . . . . . . . . . . . . . . . . . . . . . . 63
Viewing Node Status Messages . . . . . . . . . . . . . . . . . . . . . . . . . . . . . . . . . . . . . . . .63
Viewing Node Status Information
The Node Status window displays real-time information about each active node.:
Label User-defined label for the node, if one has been applied
Node ID ID number consisting of the last two bytes of the hexadecimal
representation of the node’s 64-bit EUI number
Type Type of node
Last Heard
(Seconds)
Connection Number of links to the node
Traffic (Nos) Number of messages that the node sent, received, or forwarded
Status Operational status of the node
Time since Ember Studio Lite last heard a ping response from a
node
in the last polling cycle
Ember Evaluation Kit User’s Guide 120-0047-000C Final Page 55
Page 56
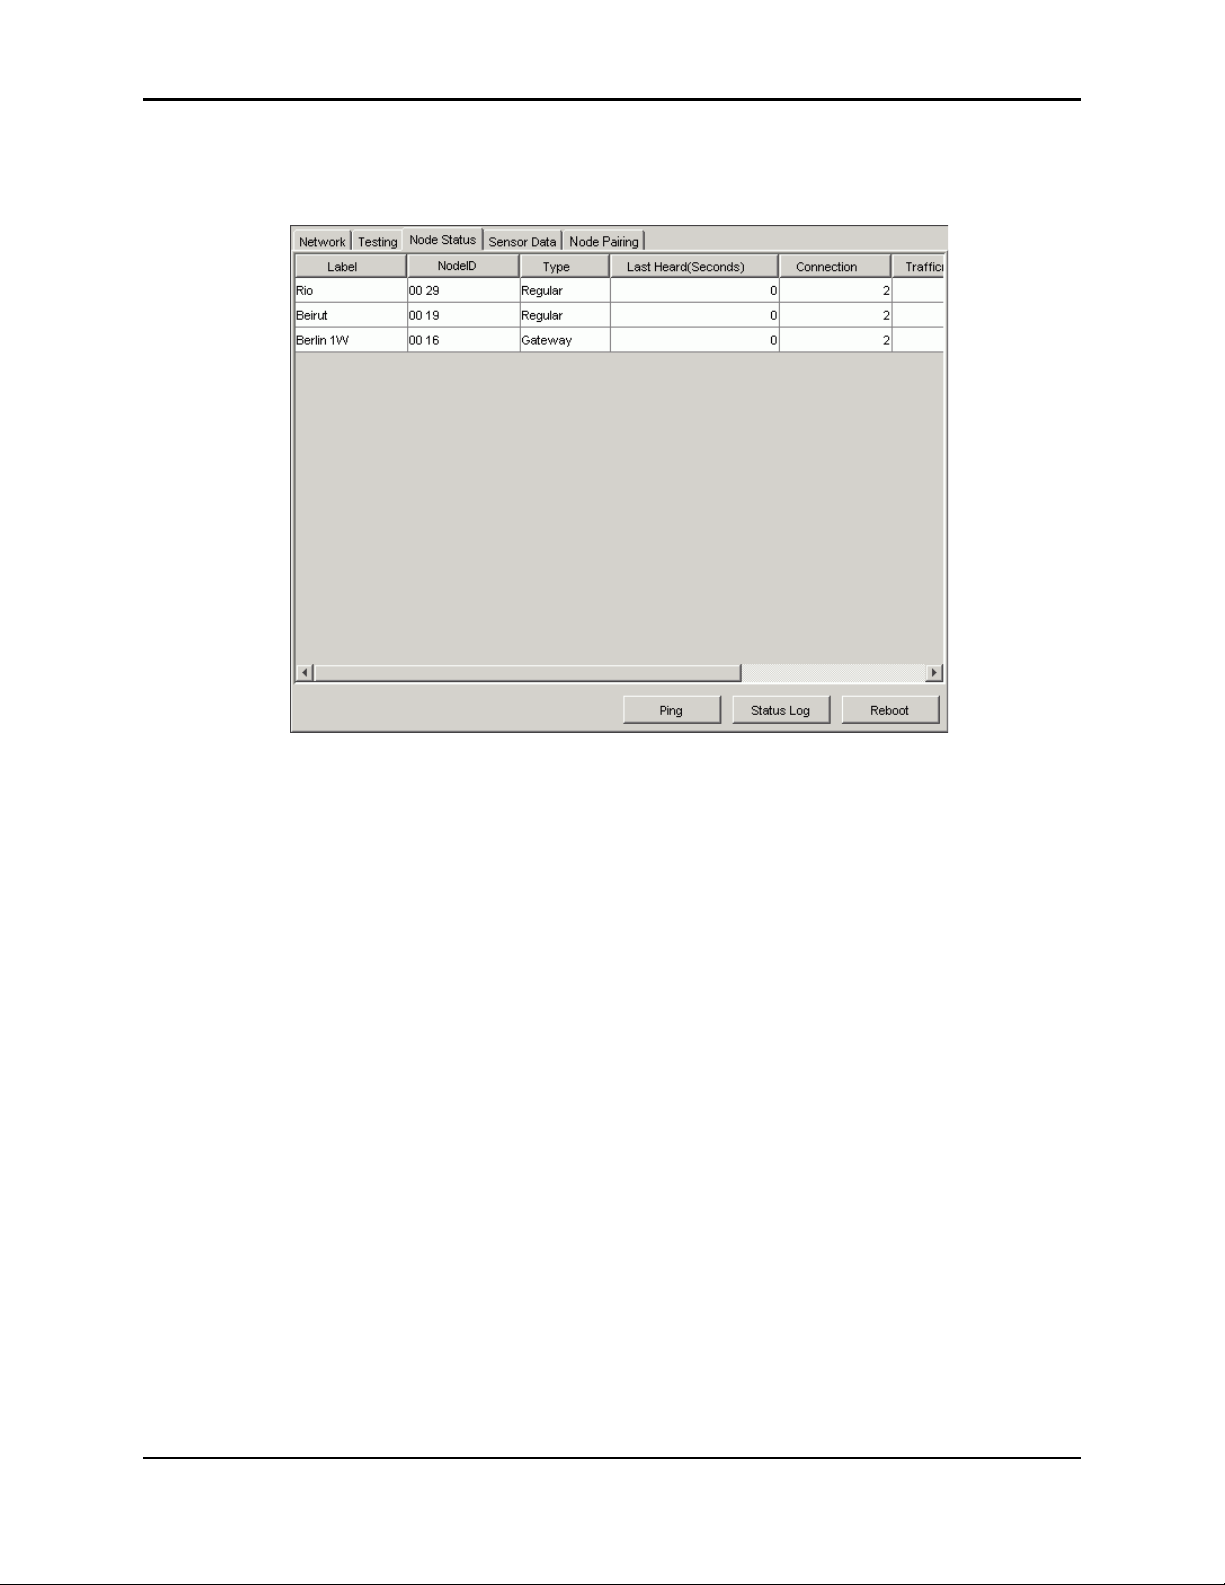
Chapter 7: Managing Network Nodes Viewing Node Parameters
To view Node Status information:
Click the Node Status tab. The Node Status window displays:
To sort Node Status window columns:
Single-click a column head to sort the rows in ascending order by that column.
Double-click a column head to sort the rows in descending order by that column.
To reorder Node Status window columns:
Drag a column to the left or right to change the order.
Viewing Node Parameters
The Node Parameters window displays a subset of the node status data for a given node, plus
the node’s 64-bit EUI number. For definitions of the fields in this window, see “Viewing
Node Statistics” on page 57.
Note that this window displays the complete hexadecimal representation of the node’s 64-bit
number and not just the last two bytes of it.
The window also includes the Ping and Reboot buttons for diagnosing node connectivity
problems.
Ember Evaluation Kit User’s Guide 120-0047-000C Final Page 56
Page 57
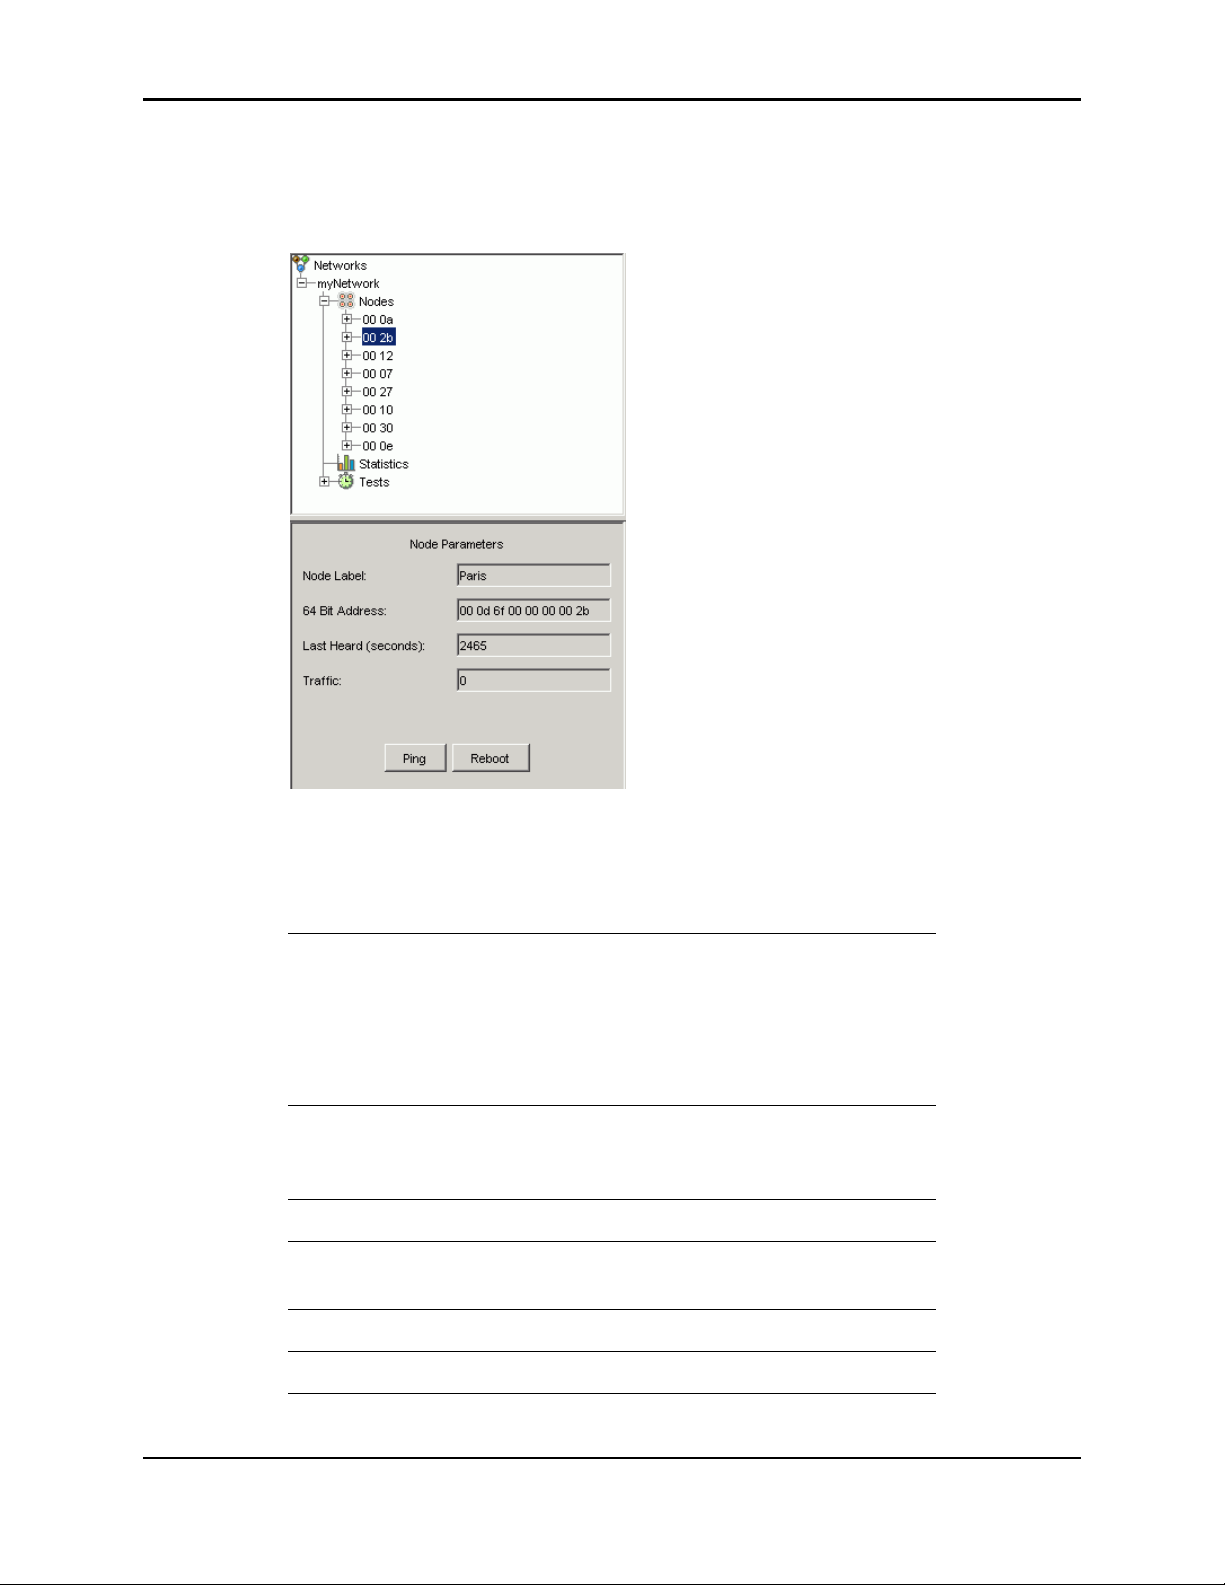
Chapter 7: Managing Network Nodes Viewing Node Statistics
To view a node’s parameters:
Click the Nodes folder in the folder tree, then click the folder for a node. The Node
Parameters window displays in the Context pane:
Viewing Node Statistics
You can poll the network for the following node performance statistics:
CCAFail Total number of times clear channel assessment
CCASuccess Number of times CCA succeeded in the media
DupMessagesRcvd Number of duplicate messages received.
MaxCCA Number of times a transmission failed because
MessagesForwarded Number of messages forwarded by node.
MessagesOriginated Number of messages originated from node.
(CCA) failed. A CCA failure is not the same as a
transmission failure, since the carrier sense
multiple access (CSMA) algorithm retries CCA
up to MAX_CSMA_RETRIES times before
giving up.
access control’s (MAC’s) CSMA algorithm.
Equals number of transmissions.
of a busy channel.
Ember Evaluation Kit User’s Guide 120-0047-000C Final Page 57
Page 58
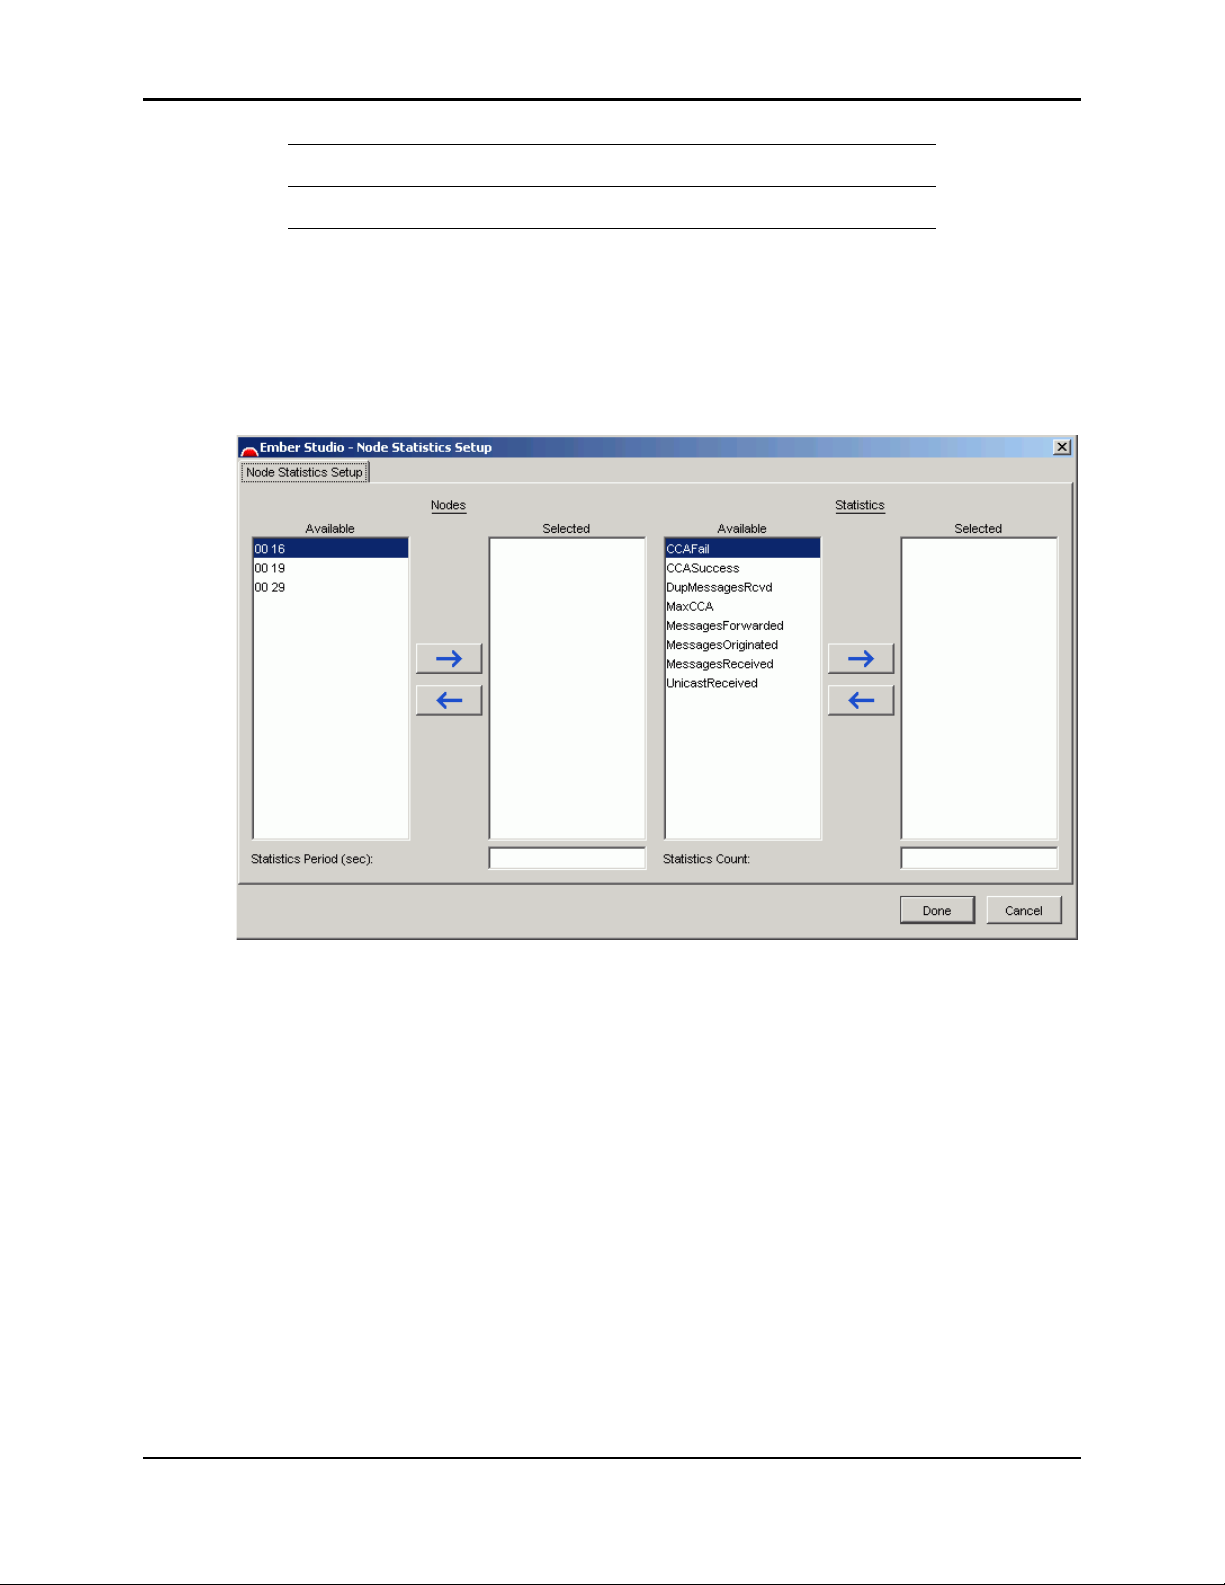
Chapter 7: Managing Network Nodes Viewing Node Statistics
MessagesReceived Number of messages received.
UnicastReceived Number of unicasts received.
To view node statistics:
Note: Make sure power management is not enabled for the nodes that you poll (see “Using
the Power Management Application” on page 30).
1. Double-click the Statistics folder in the folder tree. The Node Statistics Setup window
displays:
2. Click a node ID, then click the right arrow. The node ID displays in the Selected box.
Repeat to select additional nodes.
3. Click a statistic, then click the left arrow. The statistic displays in the Selected box. Repeat
to select additional statistics.
4. Enter an integer into the Statistics Period field, to specify the polling frequency.
5. Enter an integer into the Statistics Count field, to specify the number of times to poll
selected nodes.
Ember Evaluation Kit User’s Guide 120-0047-000C Final Page 58
Page 59
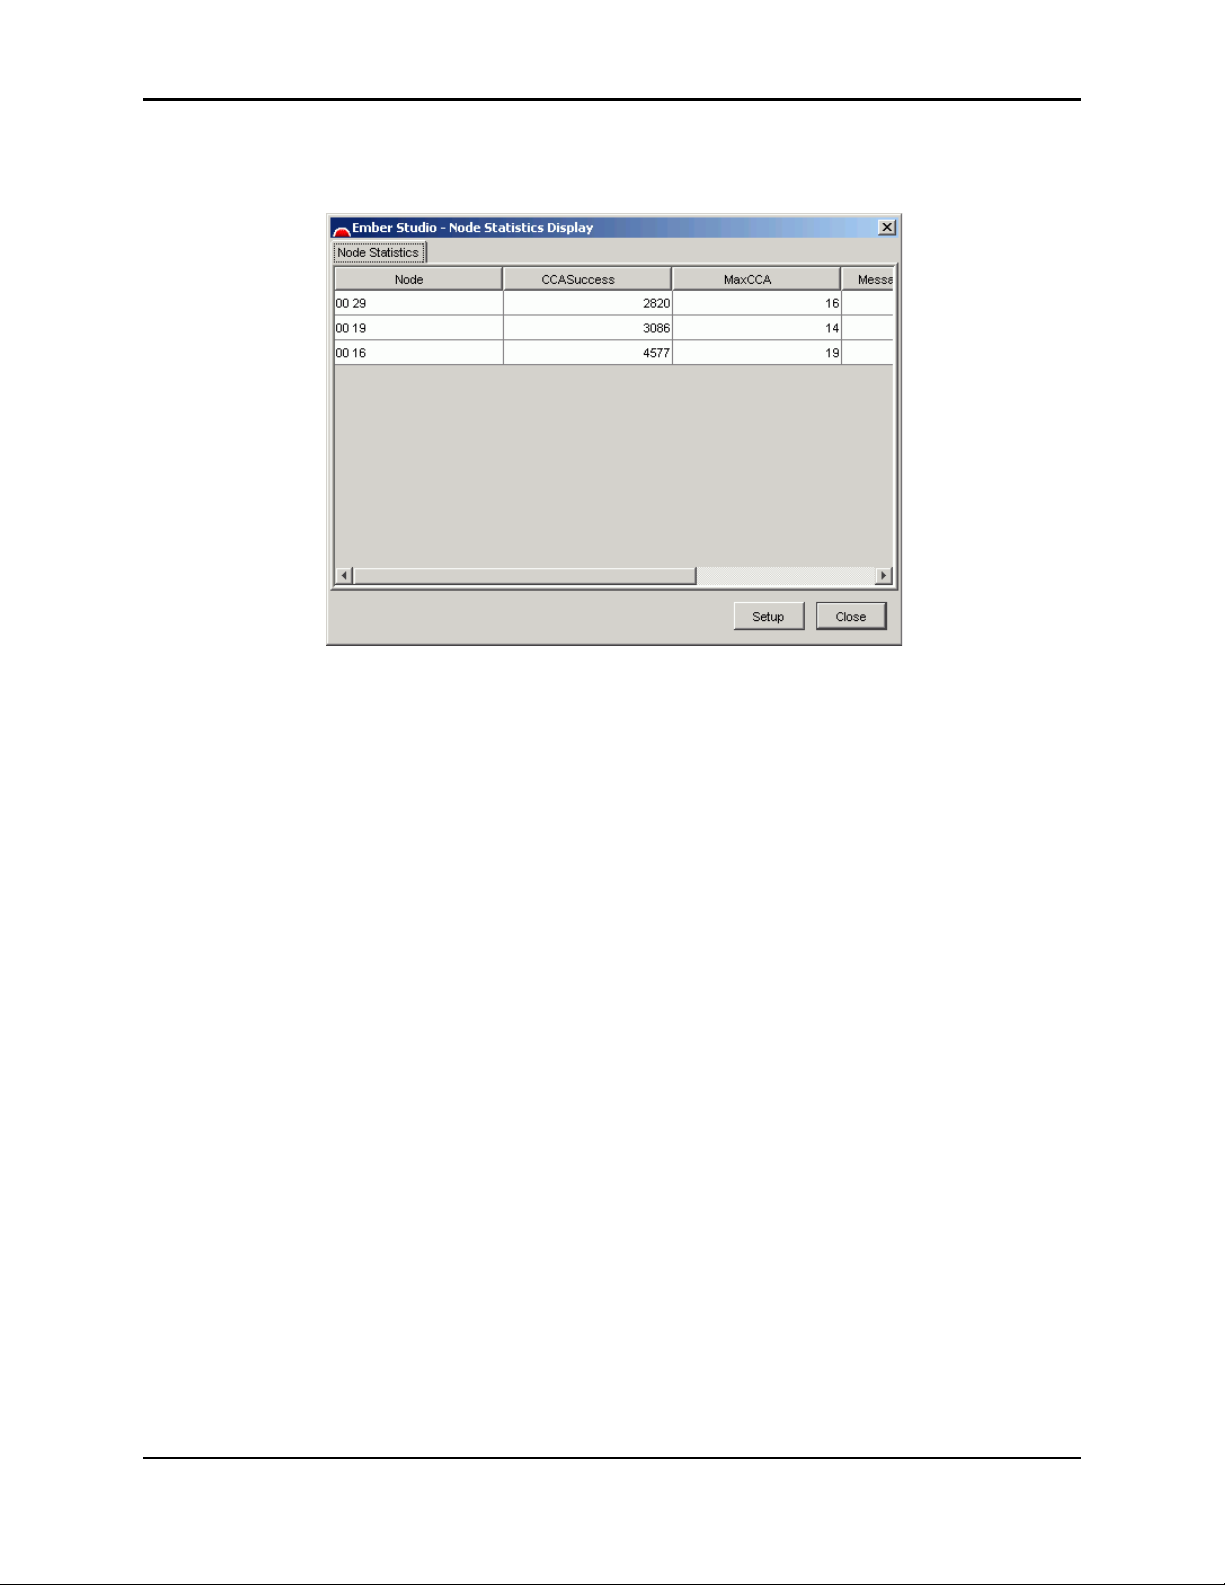
Chapter 7: Managing Network Nodes Viewing Node Properties
6. Click Done. The Node Statistics Display window displays. Use the scrollbar to view all
columns, or drag the right border to enlarge the window.
7. To collect different statistics or poll other nodes, click Setup. The Node Statistics Setup
window displays again.
Viewing Node Properties
You can view values that have been set for each node’s properties (Table 7-1)
Certain properties may not show if a node did not send its configuration information the last
time it was pinged. Click the Refresh button to make the node send these values to the
gateway.
Note: Ember Studio Lite will not let you configure the properties of a node for which
power management is enabled (see “Using the Power Management Application” on
page 30).
To view properties for a node:
1. Double-click the Nodes folder in the folder tree. The Node Configuration window opens.
2. Click a node in the Nodes column. The properties in effect for the node display in the
window’s Key and Value columns. The Key column displays the properties, and the Value
Ember Evaluation Kit User’s Guide 120-0047-000C Final Page 59
Page 60
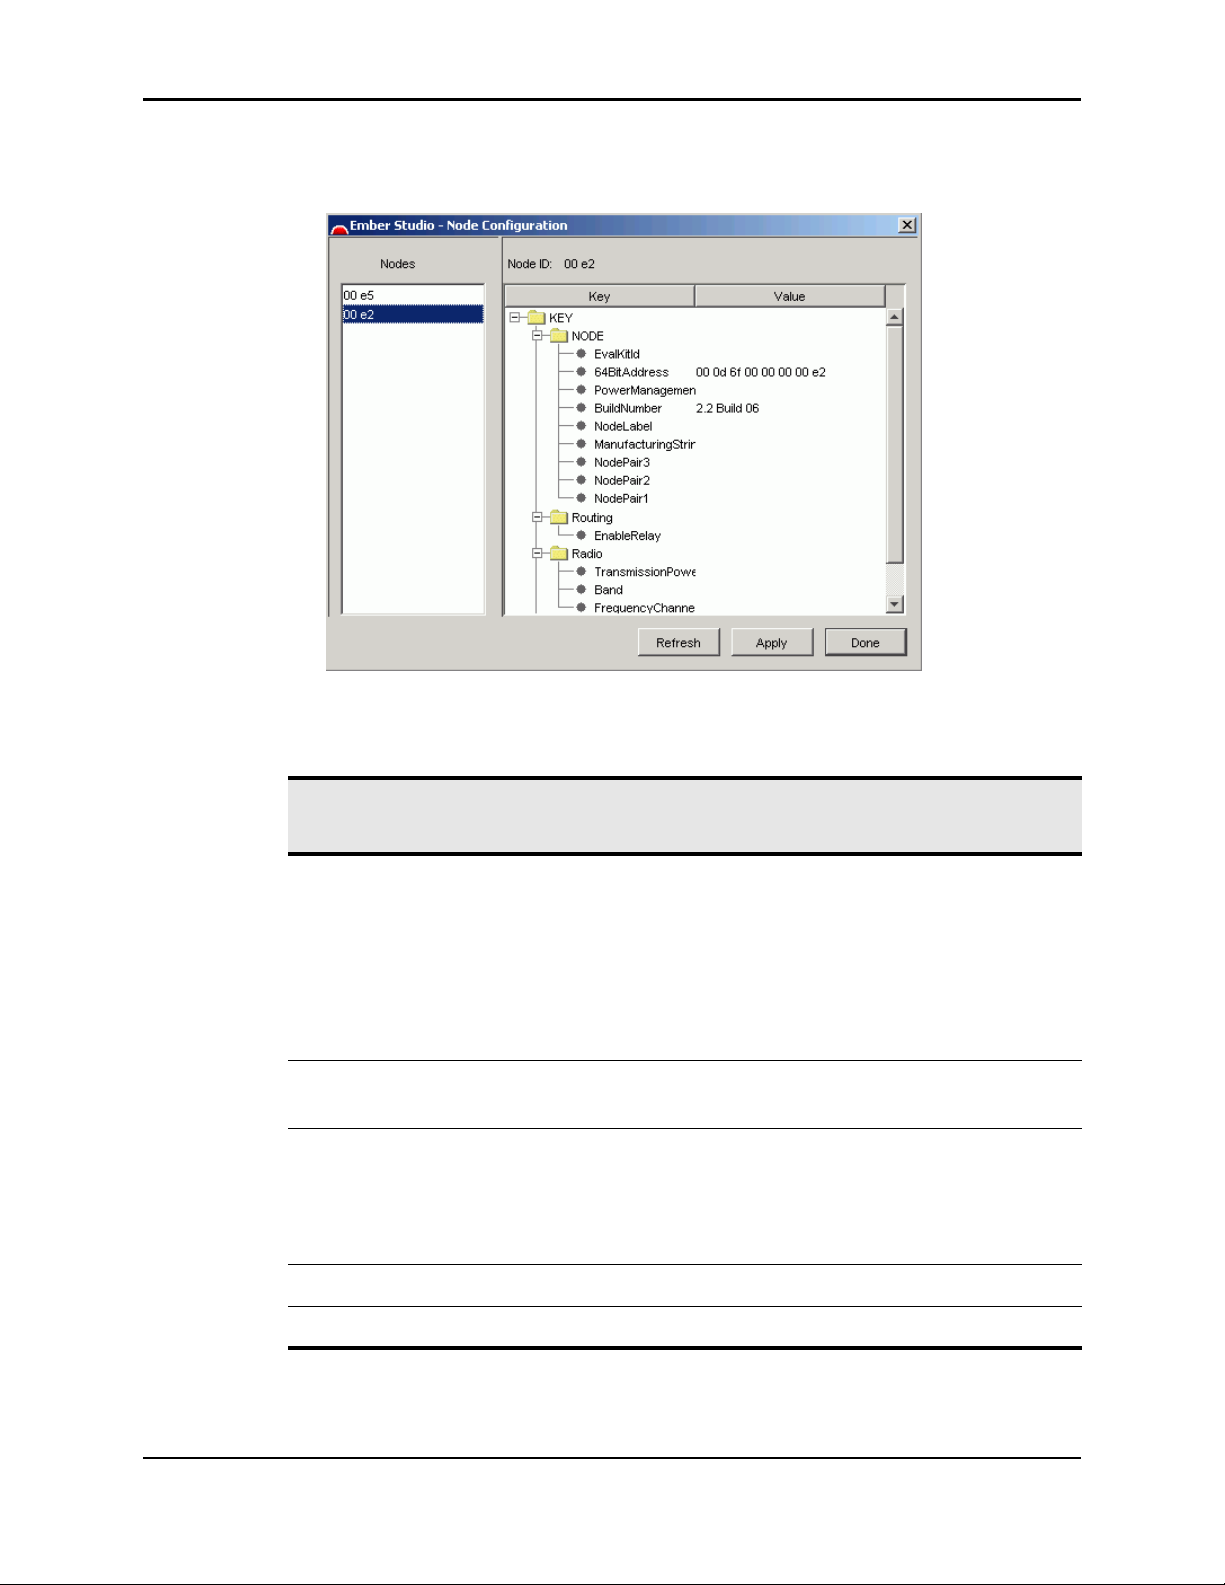
Chapter 7: Managing Network Nodes Viewing Node Properties
column displays the property value. (If any properties are missing, click the Refresh
button.)
Table 7-1: Node Properties
CategoryProperty Definition
Node EvalKitId Local ID for the node (that is, the RF communication
module) (used only when running Ember Serial
Command Set commands)
Note: Do not change the value in this field unless you
have purchased more than one Evaluation Kit and
need to give all the modules consecutive local IDs. See
“Resetting Local IDs” on page 101.
64BitAddress Hexadecimal representation of the 64-bit EUI number
assigned to the module
Power Management Flag indicating whether power management has been
enabled for the node
true = enabled
false = disabled
BuildNumber Ember stack build number
NodeLabel User-assigned node name
Ember Evaluation Kit User’s Guide 120-0047-000C Final Page 60
Page 61

Chapter 7: Managing Network Nodes Viewing Node Properties
Table 7-1: Node Properties (Continued)
CategoryProperty Definition
ManufacturingString Five-part number assigned by the node manufacturer.
The parts are defined below with reference to the
following sample number:
8473/0331/0060/01/A1
8473: Board number
0331: Lot code (31st week of 2003)
0006: Manufacturer’s serial number
01: Manufacturing code
A1: Board revision
NodePair3 Either the EvalKitID for a node that has been paired
to this node or “No Pair”
NodePair2 Either the EvalKitID for a node that has been paired
to this node or “No Pair”
NodePair1 Either the EvalKitID for a node that has been paired
to this node or “No Pair”
Routing EnableRelay A flag that determines whether the node relays
messages
Radio Transmission Power Transmission power, in dB
Band Radio band
FrequencyChannel RF channel
NeighborNumber of
Number of neighboring nodes
neighbors
[list of each neighbor
node]
Value representing the quality of a node’s link to each
neighbor node. The range is 100 for the strongest
possible link to 0 for no link.
Ember Evaluation Kit User’s Guide 120-0047-000C Final Page 61
Page 62

Chapter 7: Managing Network Nodes Setting Node Properties
Setting Node Properties
Table 7-2 identifies the properties that you can set and the values to input for each.
Table 7-2: Configurable Node Properties
Property Parameters
NodeLabel Any string. Whitespaces are allowed.
EvalKitId Enter any integer that does not exceed the total number of
nodes.
Note: Be careful when changing the EvalKitId field. If two
or more nodes are accidentally assigned the same local ID,
their behavior will become erratic and networks including
them will malfunction. See “Resetting Local IDs” on page
101.
Enable Relay Select true or false from the drop-down list.
Transmit Power Enter a value from Appendix C, “Module Radio Settings.”
.
Channel Enter a channel from Appendix C, “Module Radio
Settings.”
.Note: When resetting node channels, be sure to change
the network gateway’s channel last. When you change a
node’s channel, the node disappears from the network map
because it is no longer set to the same channel as the
gateway node. Therefore, if you change the gateway’s
channel first, you will be unable to see the nodes that still
need to be changed. If you accidentally change the gateway’s
channel too early, change it back to the original channel so
that you can see all the nodes still set to that channel.
To set node properties:
1. Display the Node Configuration window (double-click the Nodes folder in the folder tree and
click a node in the Nodes column).
2. Double-click the Value field for a property that you want to set. A selection box
surrounds the property’s value. Enter a new value for the property (refer to Table 7-2,
and be sure to heed the special warnings about setting certain properties).
3. Repeat the preceding step as needed.
4. Click Apply to put the new property settings into effect.
5. Click Done to close the window.
Pinging a Node
You can ping individual nodes from within the Node Status and Node Parameters windows.
Ember Evaluation Kit User’s Guide 120-0047-000C Final Page 62
Page 63

Chapter 7: Managing Network Nodes Rebooting a Node
Note: Do not ping a node for which power management is enabled (see “Using the Power
Management Application” on page 30). Ember Studio Lite will display an error
message if you attempt to do this.
z Node Status window: Click a node, then click the Ping button.
z Node Parameters window: Click the Ping button.
Rebooting a Node
You can reboot a node that seems to be stuck in an error state, to bring it back on line, from
within Node Status and Node Parameters windows:
z Node Status window: Click a node, then click the Reboot button.
z Node Parameters window: Click the Reboot button.
Viewing Node Status Messages
You can view a log of Ember Studio Lite messages about a node from within Node Status
and Node Parameters windows:
z Node Status window: Click a node, then click the Reboot button.
z Node Parameters window: Click the Reboot button.
Ember Evaluation Kit User’s Guide 120-0047-000C Final Page 63
Page 64

CHAPTER 8 Testing the Network
Available Network Tests . . . . . . . . . . . . . . . . . . . . . . . . . . . . . . . . . . . . . . . . . . . . . .64
How Ember Studio Lite Implements Network Tests . . . . . . . . . . . . . . . . . . . . . . . . . . 64
Ensuring a Successful Network Test. . . . . . . . . . . . . . . . . . . . . . . . . . . . . . . . . . . . . . 65
Ping Test Example. . . . . . . . . . . . . . . . . . . . . . . . . . . . . . . . . . . . . . . . . . . . . 66
Trace Route Test Example. . . . . . . . . . . . . . . . . . . . . . . . . . . . . . . . . . . . . . . 68
Performing a Ping Test . . . . . . . . . . . . . . . . . . . . . . . . . . . . . . . . . . . . . . . . . . . . . . . . 69
Running a Ping Test. . . . . . . . . . . . . . . . . . . . . . . . . . . . . . . . . . . . . . . . . . . .69
Reading Ping Test Results . . . . . . . . . . . . . . . . . . . . . . . . . . . . . . . . . . . . . . . 71
Performing a Trace Route Test . . . . . . . . . . . . . . . . . . . . . . . . . . . . . . . . . . . . . . . . . . 73
Running a Trace Route Test. . . . . . . . . . . . . . . . . . . . . . . . . . . . . . . . . . . . . . 73
Reading Trace Route Test Results . . . . . . . . . . . . . . . . . . . . . . . . . . . . . . . . . 75
Viewing Results of Previously Run Tests . . . . . . . . . . . . . . . . . . . . . . . . . . . . . . . . . . .79
Deleting Test Results . . . . . . . . . . . . . . . . . . . . . . . . . . . . . . . . . . . . . . . . . . . . . . . . . . 79
Configuring Ping and Trace Route Test Preferences . . . . . . . . . . . . . . . . . . . . . . . . .79
Available Network Tests
Ember Studio Lite includes the following network tests:
z Ping: Tests network performance between two nodes in a multi-node network that
cannot hear each other (in this instance you may see multihop performance), or tests the
strength of the radio link between two nodes that can hear each other.
z Trace route: Determines the statistical route that a series of packets traveled to get from
one specified node to another.
How Ember Studio Lite Implements Network Tests
In the Ember Studio Lite ping test, the sending node ensures that it has a path to the
receiving node and then sends unicast packets of a selected size at a selected delay.
(Occasionally a node will send packets before establishing a route, in which case the ping test
will fail.) The receiving node sends the packets back to the sending node. Both the sending
and receiving nodes send packets through the network on a best-effort basis.
Ember Evaluation Kit User’s Guide 120-0047-000C Final Page 64
Page 65

Chapter 8: Testing the Network Ensuring a Successful Network Test
Ember Studio Lite implements trace route similarly to ping, except that the test is performed in
one direction only. As part of the test setup, other nodes in the network are asked to count
packets from a sender to receiver. Each node that receives a packet makes a forwarding decision
based on the cost remaining to route the packet. If the node believes that it can forward the
packet at the same or a lower cost indicated in the packet, it will try to forward the packet.
However, if the node hears another node forward the packet while it is waiting to transmit, it will
remove the packet from its transmit queue. Because of the nature of the mesh, link quality, and
variations in timing between nodes, trace route shows that packets will take different paths
through the network.
Ensuring a Successful Network Test
The quality of the results that you obtain from ping or trace route depend on the way the
network is set up, traffic levels on the network, and the parameters supplied to the test,
particularly packet size and packet delay. Best results are obtained when you observe the
following guidelines:
z Ensure that there are multiple paths of high-quality links from source to destination,
to provide alternate paths if a node is busy or subject to interference. The network does not
operate well if there are traffic bottlenecks. Figure 8-1 shows an example of a well-formed
test network.
z Be careful about moving modules during the test. Ember Evaluation modules are
designed to support portability, rather than mobility. As in any network design, there is a
trade-off between the network rediscovery rate and data throughput. Modules are designed
to automatically discover and incorporate new modules into the network and to route
around modules that are no longer responding. However, moving active modules during a
test results in the modules’ trying to use neighbors for routing that may no longer be
present, and the alternate paths may also not be present. This could disrupt test packet
routing. Moving a gateway module can result in the test initiation or test result messages not
making it to the gateway. To avoid this problem:
Do not move modules during tests.
If you move a module between tests, reboot it so that its neighbors will rediscover it.
If you move the gateway module or it does not appear to be receiving network data,
reboot the gateway module.
z Run tests with small packet sizes and lengthy interpacket delays. The smaller the
packet, the quicker it travels through the network. The longer the packet delay, the more
time the packet has to travel between source and destination.
z Reduce network traffic during the test. Tests run over a quiet network have a higher
packet success rate than those run over a busy network that is, for example, gathering
statistics at frequent intervals and running multiple concurrent tests. Nodes cannot transmit
while they are receiving a packet or while one of their neighbors is transmitting. The
network will attempt to retry packets that could not be sent because the network was busy,
but after a set of unsuccessful retries the packet will be dropped by the intermediate nodes.
Ember Evaluation Kit User’s Guide 120-0047-000C Final Page 65
Page 66
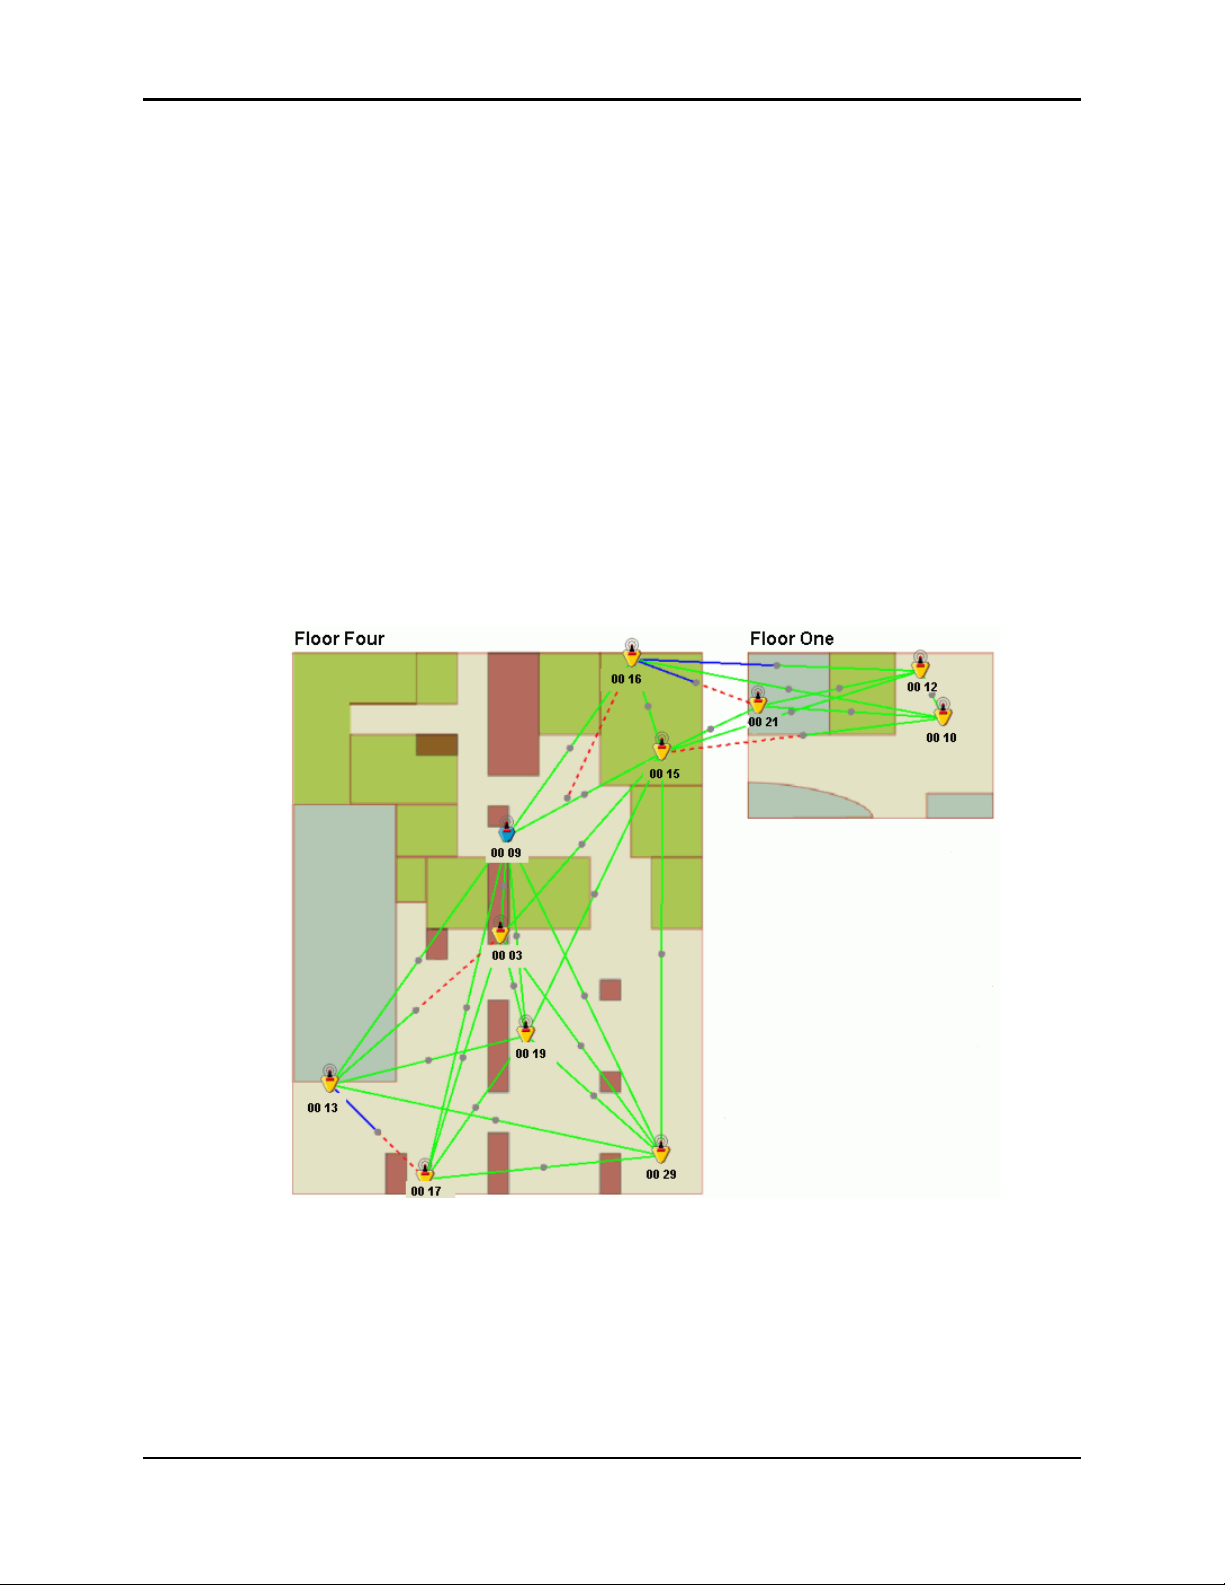
Chapter 8: Testing the Network Ensuring a Successful Network Test
Ping Test Example
The data in Table 8-1 and Table 8-2, obtained during a series of ping tests run on the network
depicted in Figure 8-1, provide an example of the effect of packet size, packet delay, and
network traffic on the packet success rate. The network was configured to ping all nodes
every 10 seconds to verify status and to poll selected nodes for statistics every 30 seconds.
Table 8-1 shows the result of (1) varying packet size while holding packet delay constant at
250 milliseconds and (2) varying packet delay while holding packet size constant at 25 bytes.
Table 8-2 shows the result of varying network traffic (in this instance, the interval for statistics
polling) while holding packet size and packet delay constant.
These data demonstrate the inverse relationship between packet size, packet delay, and
network traffic and packet success rate.
Figure 8-1: A well-formed test network
Ember Evaluation Kit User’s Guide 120-0047-000C Final Page 66
Page 67

Chapter 8: Testing the Network Ensuring a Successful Network Test
Table 8-1: Effect of Packet Size and Packet Delay on Packet Success Rate
Variable Value Success Rate for the
Send-to-Receive Portion
Success Rate for the
Receive-to-Send Portion
Packet size (bytes) 5 100% 100%
10 100% 100%
20 100% 100%
40 100% 100%
60 100% 95%
80 100% 83%
Packet Delay 80 75% 60%
120 99% 84%
160 100% 97%
200 100% 100%
250 100% 100%
300 100% 100%
350 100% 100%
400 100% 100%
450 100% 100%
500 100% 100%
Table 8-2: Effect of Network Traffic Level on Packet Success Rate
Statistics Interval (seconds) Success Rate for the
Send-to-Receive Portion
Success Rate for the
Receive-to-Send Portion
30 98% 100%
10 100% 100%
5 100% 99%
2 91% 82%
Ember Evaluation Kit User’s Guide 120-0047-000C Final Page 67
Page 68
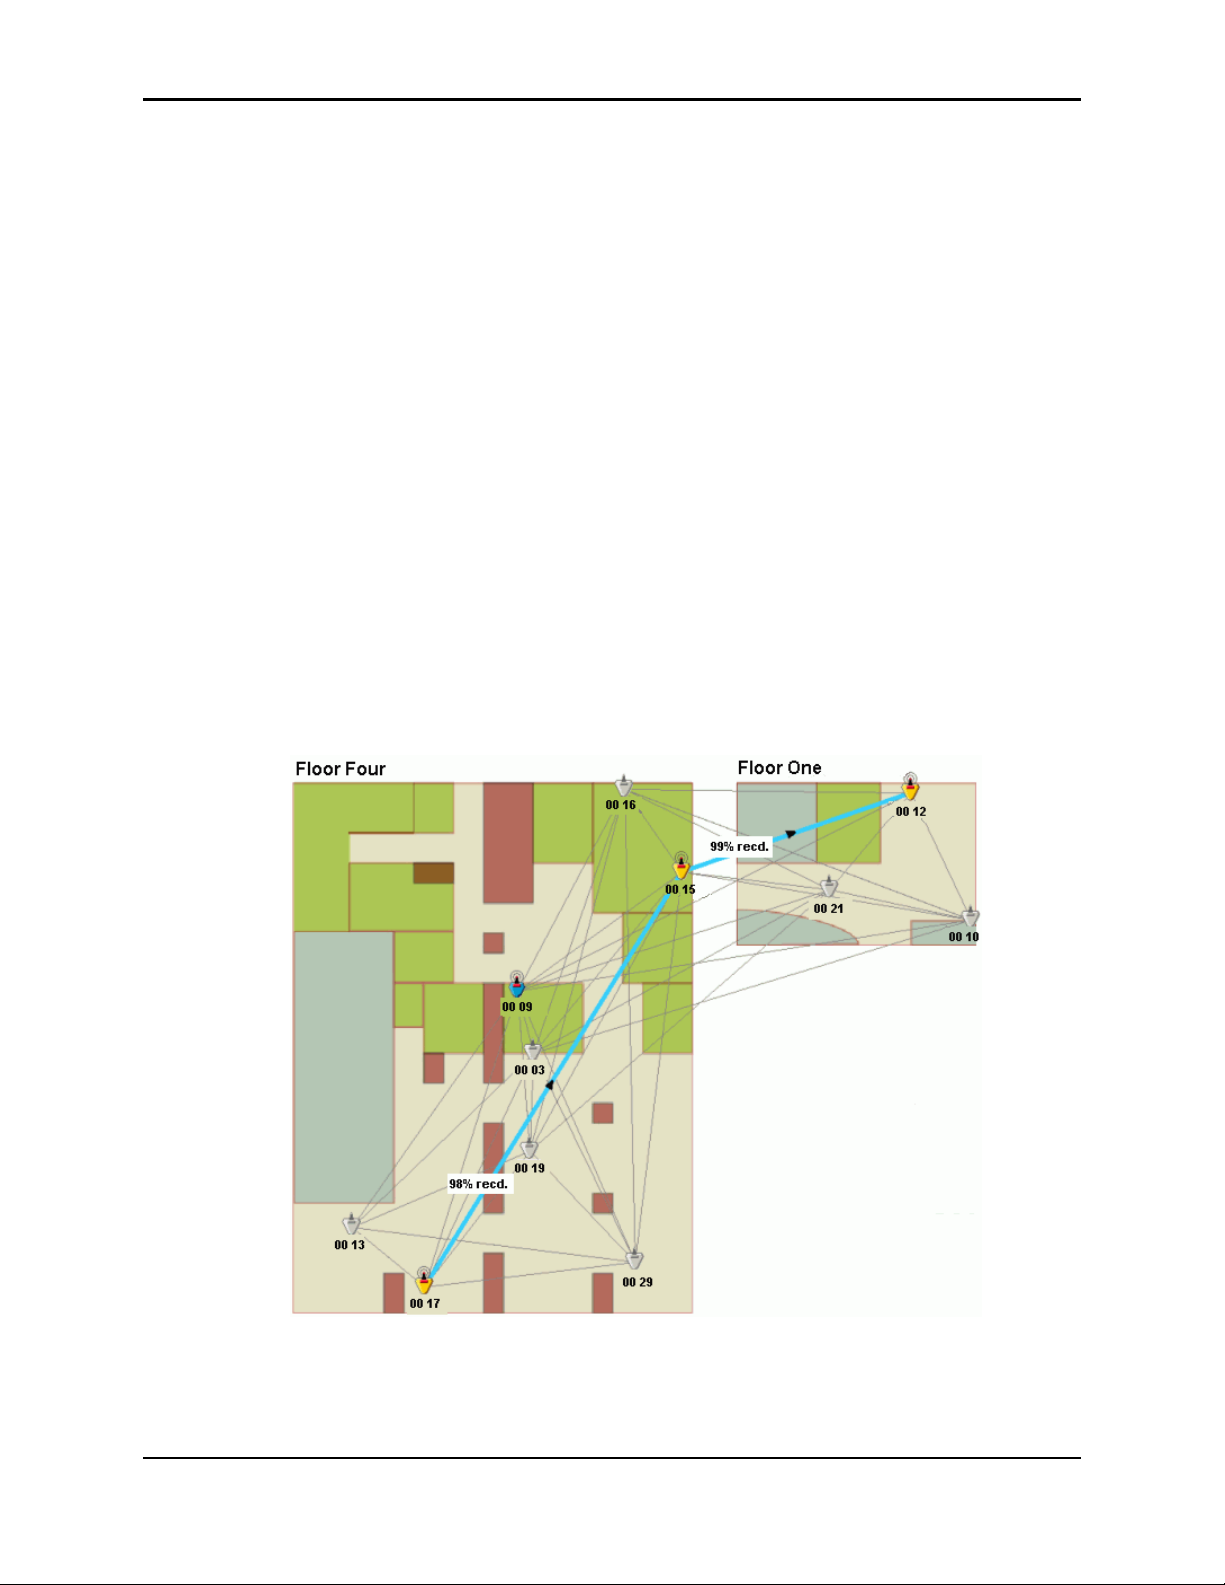
Chapter 8: Testing the Network Ensuring a Successful Network Test
Trace Route Test Example
Figure 8-2 and Figure 8-3 show the results of two trace route tests run on the network shown
in Figure 8-1 and illustrate the effect of link quality and routing on the path a packet takes
through the network.
In test 1, node 0017 was asked to send 100 packets to node 0012. Figure 8-2 shows the simple
path that the data took in this test. Although node 0015 did not have a high-quality link from
node 0017, it heard 98 of those packets. Since it had a low-cost route to node 0012, node 0017
forwarded the packets. Figure 8-2 shows the simple path that the data took in this test.
In test 2 the path for test 1 was reversed, with node 0012 sending 100 packets to node 0017.
As Figure 8-3 shows, the results for this test were not quite as simple as those for test 1.
Nodes 0016, 0015, and 0010 all heard and forwarded some of the packets. The weak link
between 0015 and 0017 was used to eliminate a packet hop. But node 0009 acted as a repeater
and forwarded the highest number of packets on to node 0017.
These two trace route tests illustrate how the asymmetric links typical in a wireless
environment influence mesh-based routing in an EmberNet network. Node 0015 clearly
hears node 0017 better than node 0017 hears node 0015. As a result of the variation in the
link, what was a two-hop path in one direction requires on the return path requires two and
three hops and takes many more paths.
Ember Evaluation Kit User’s Guide 120-0047-000C Final Page 68
Page 69
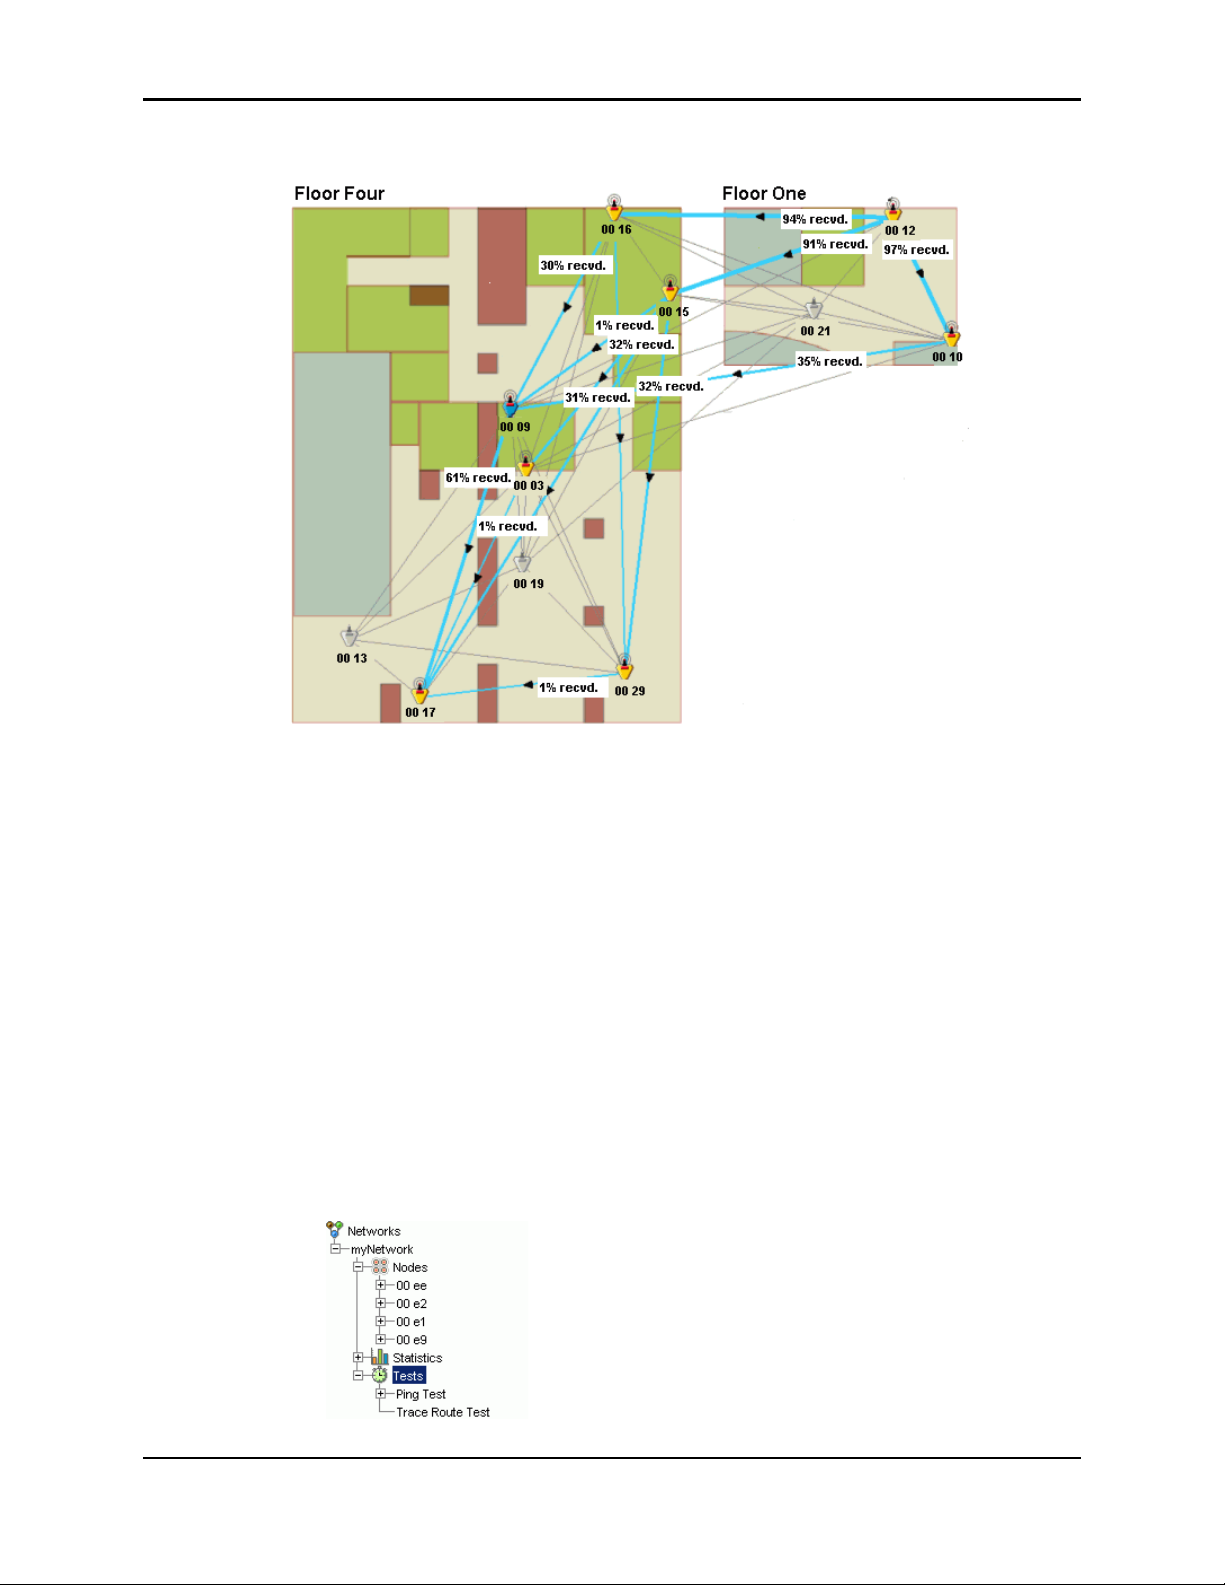
Chapter 8: Testing the Network Performing a Ping Test
Figure 8-2: Trace route test 1 results
Figure 8-3: Trace route test 2 results
Performing a Ping Test
Running a Ping Test
For best results, observe the guidelines set out in “Ensuring a Successful Network Test” on
page 65.
Note: Make sure power management is not enabled for the sender or receiver node in a ping
test (see “Using the Power Management Application” on page 30). Ember Studio Lite
will display an error message if you attempt to run a ping test on a node that is under
power management.
To run a ping test:
1. Click the Tests folder in the folder tree. The folder tree expands to list the Ping Test and
Trace Route Test folders:
Ember Evaluation Kit User’s Guide 120-0047-000C Final Page 69
Page 70
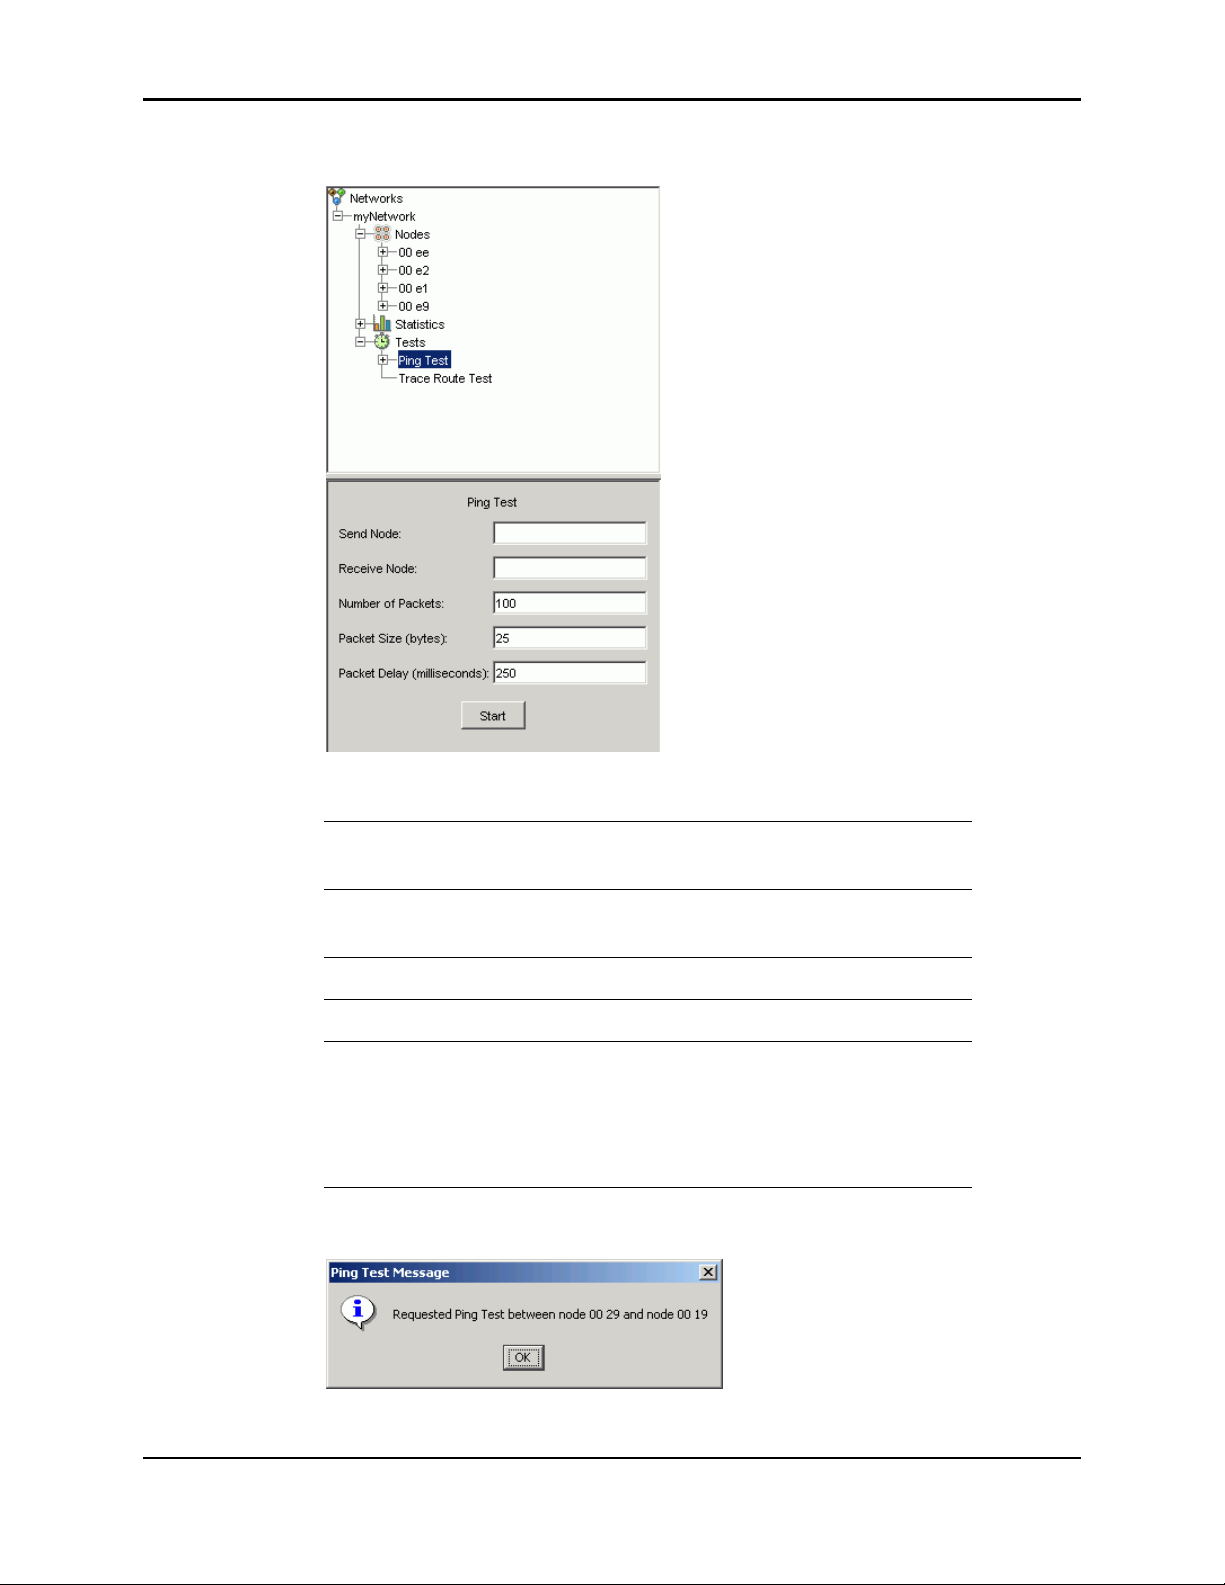
Chapter 8: Testing the Network Performing a Ping Test
2. Click the Ping Test folder. A test setup window displays:
3. Enter parameters into the test setup window.
Send Node Click the field, then click the send node in the
network map, or enter the send node ID.
Receive Node Click the field, then click the receive node in the
network map, or enter the receive node ID.
Number of Packets Enter a number from 1 to 999.
Packet Size (bytes) Enter a number from 1 to 100.
Packet Delay
(milliseconds)
Enter a number that, when plugged into the
formula below, will result in a value of 5 minutes
or less:
Number of packets times number of
milliseconds plus 20 seconds
4. Click Start. Ember Studio Lite displays a test initiation message:
Ember Evaluation Kit User’s Guide 120-0047-000C Final Page 70
Page 71
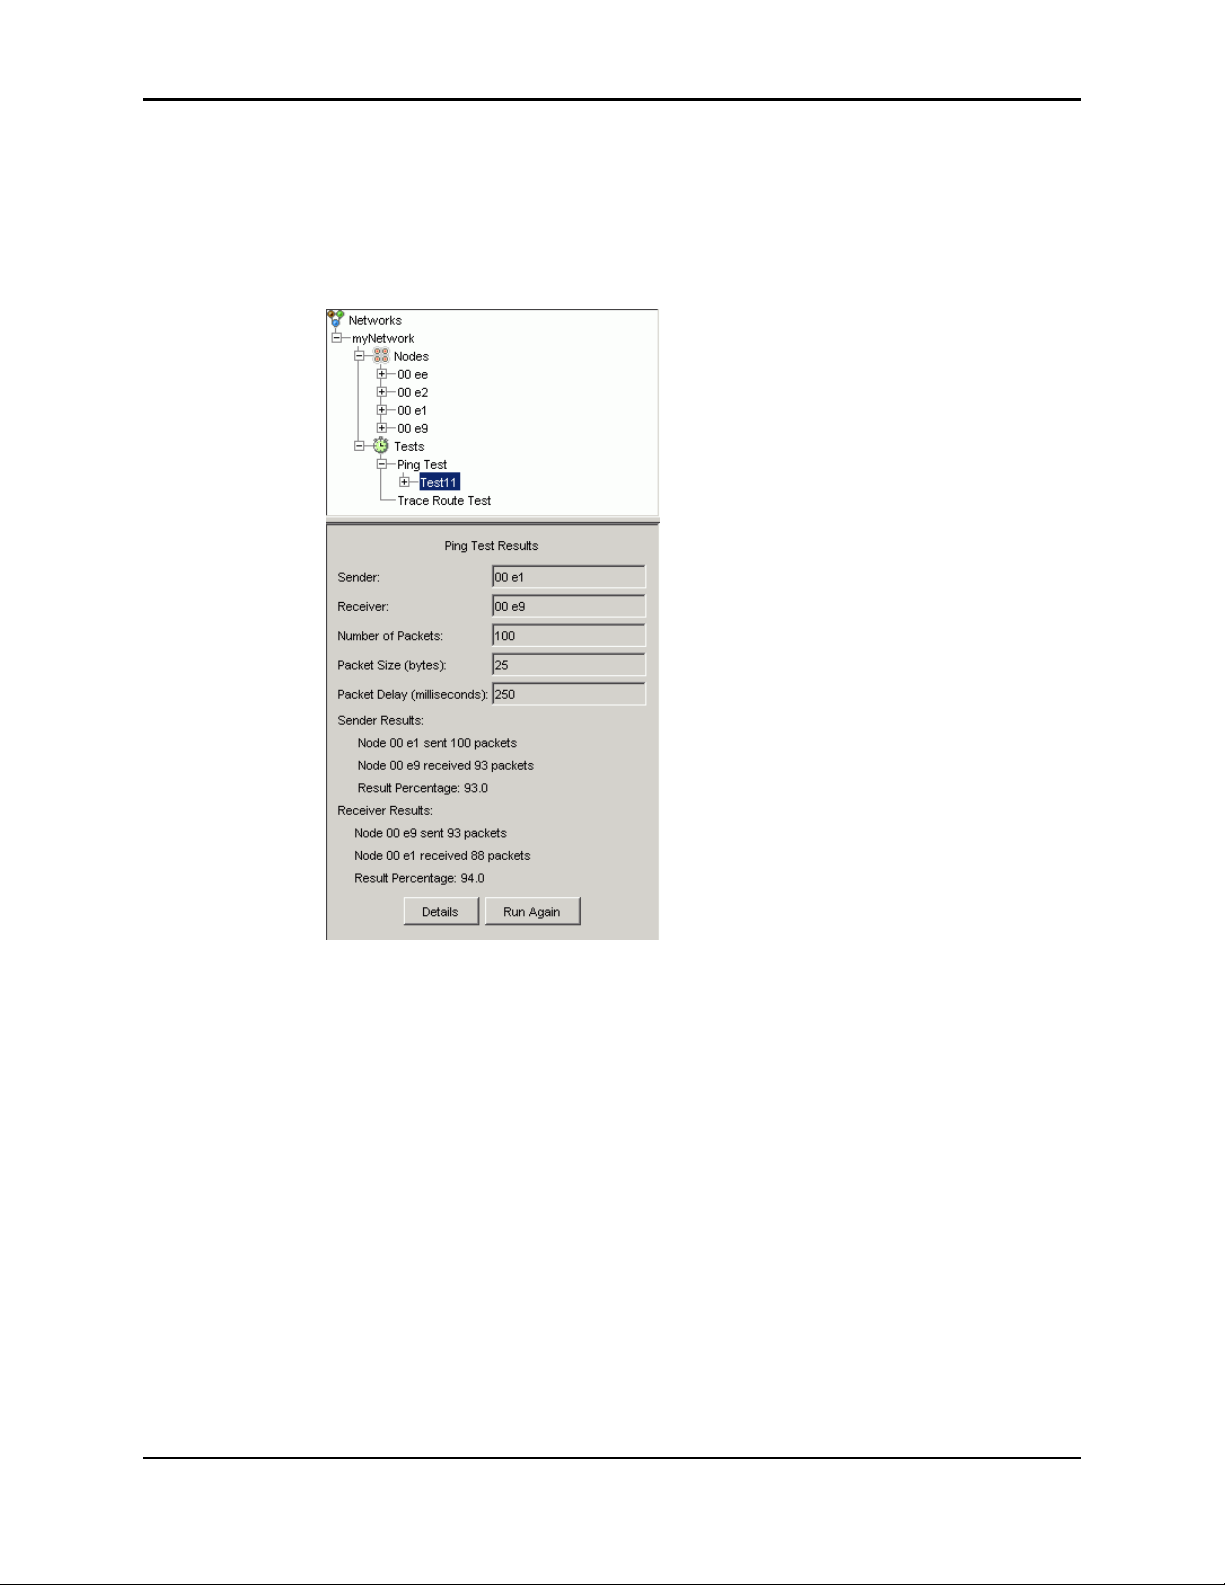
Chapter 8: Testing the Network Performing a Ping Test
5. Click OK. When the test finishes, Ember Studio Lite places the results in a numbered
subfolder in the Ping Test folder.
6. Click the Testing tab, then click the numbered test result folder. Test results display in the
View pane, superimposed on the network map, and the Ping Test Results window
displays. See the following section for information on reading ping test results.
7. Optional: To re-run the test with the same parameters, click Run Again. To re-run the test
with different parameters, enter new parameters into the Ping Test Results window and
click Run Again.
Reading Ping Test Results
Interpreting the Ping Results Graphic
Ember Studio Lite displays the paths that ping packets traveled as lines superimposed on a
ghosted version of the network map. The color, weight, and style of these lines can be
configured to indicate the percentage of packets transmitted over a line (see “Configuring
Ping and Trace Route Test Preferences” on page 79). The following table shows the default
Ember Evaluation Kit User’s Guide 120-0047-000C Final Page 71
Page 72
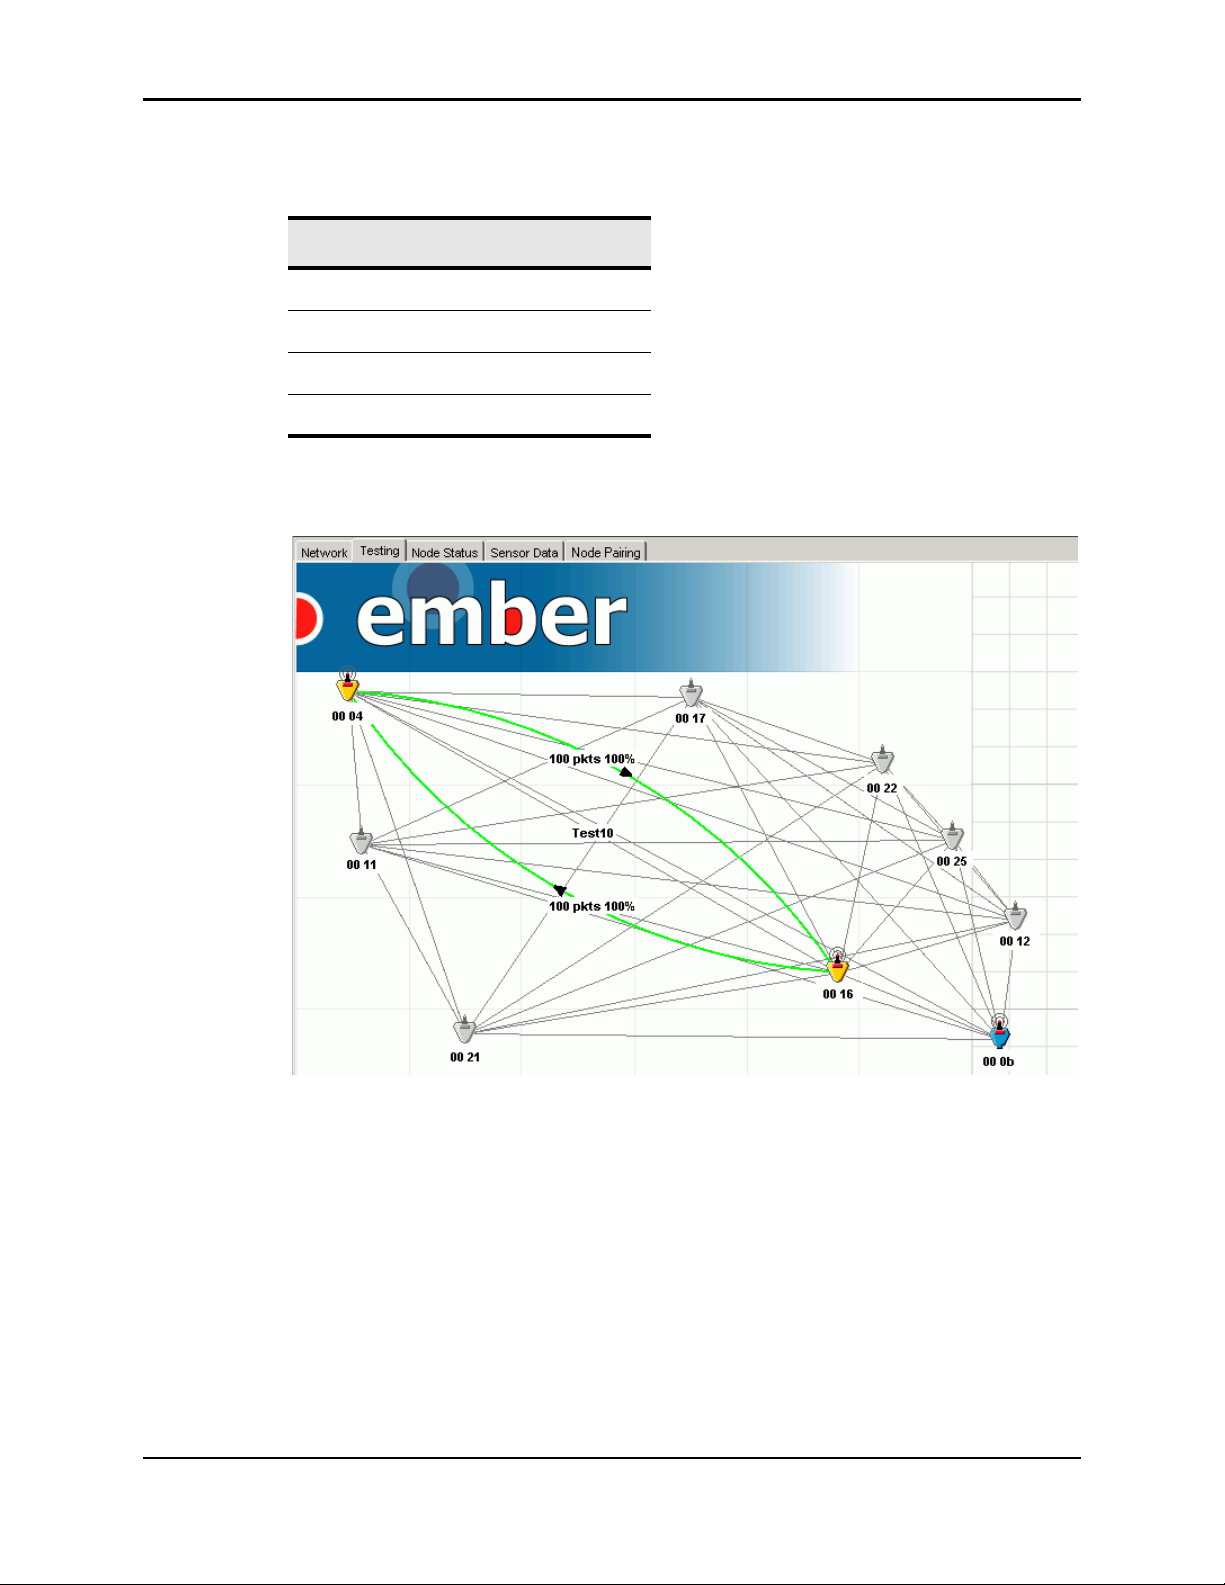
Chapter 8: Testing the Network Performing a Ping Test
ping display settings, which hold line weight and style constant and use only color to signify
packet success rates:
Color Percentage of Packets
Green 76 – 100
Yellow 51 – 75
Red 26 – 50
Black 0 – 25
According to the default settings, the ping test depicted below had a 100 percent success rate,
indicating a high-quality link between the two nodes.
Ember Evaluation Kit User’s Guide 120-0047-000C Final Page 72
Page 73
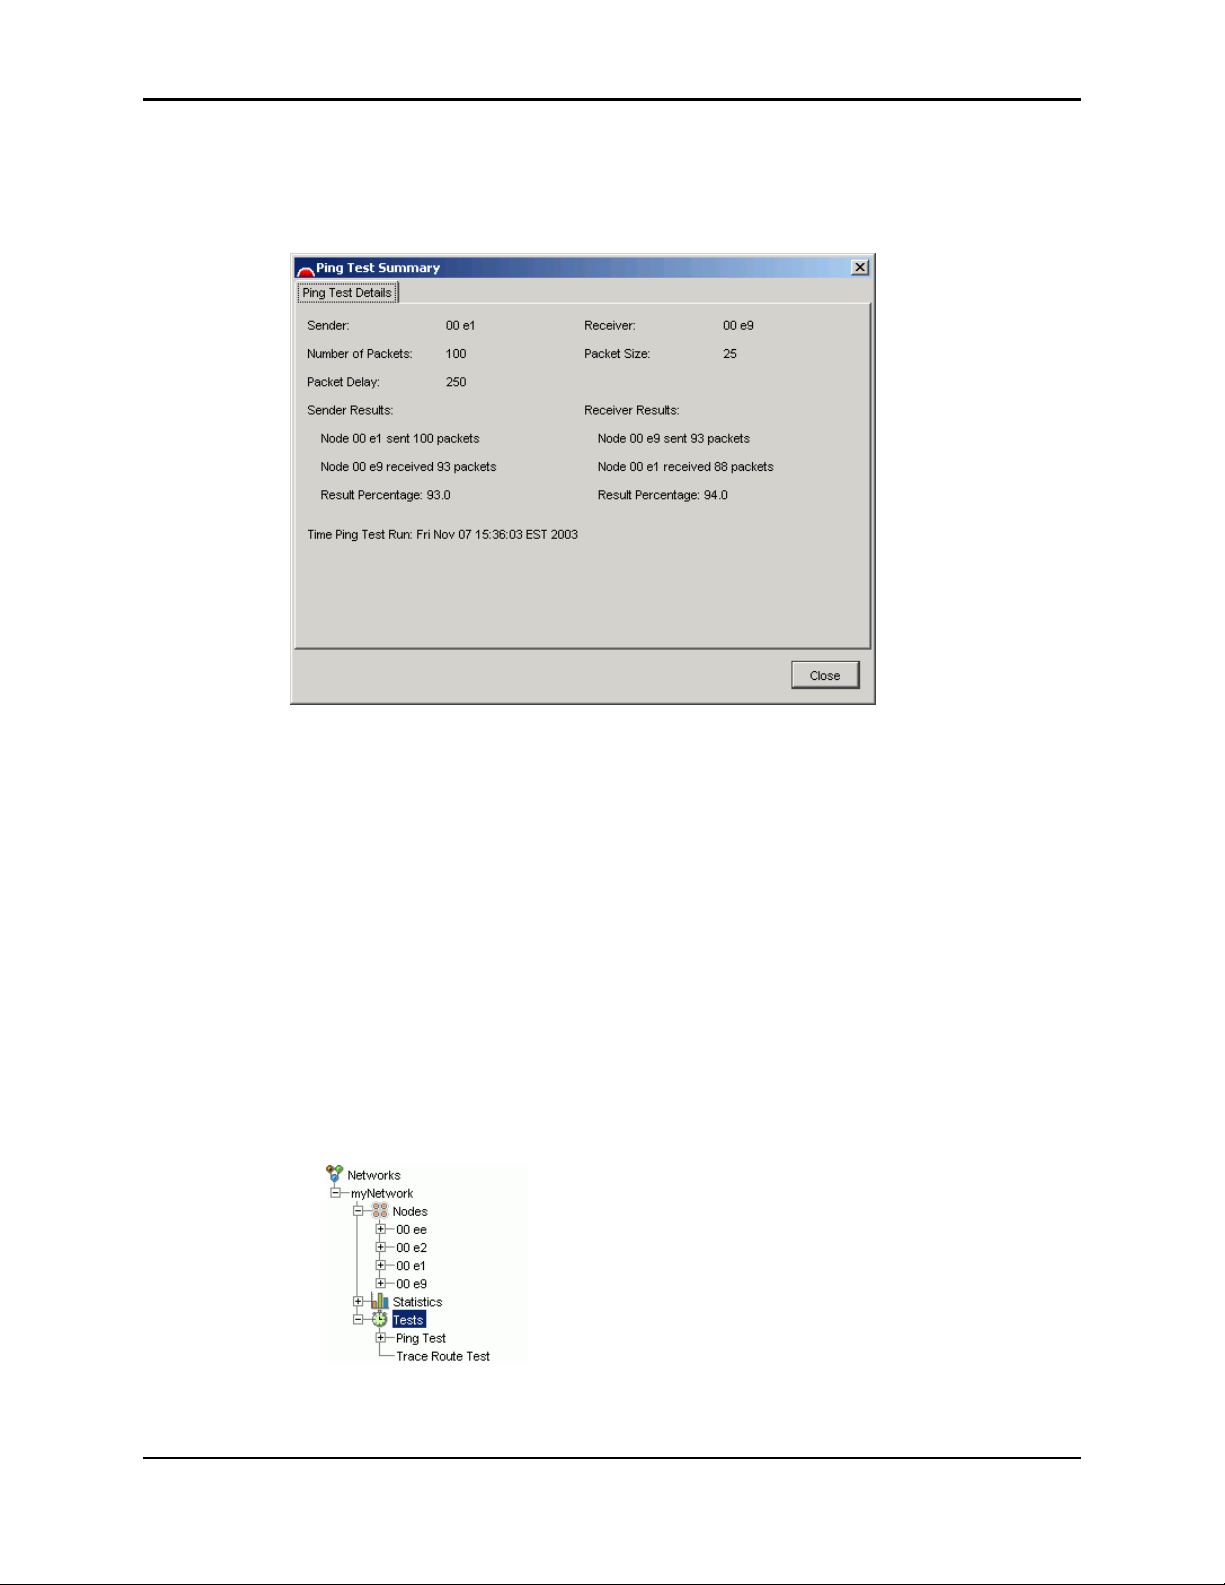
Chapter 8: Testing the Network Performing a Trace Route Test
Reading the Ping Test Reports
The Ping Test Results window provides an abbreviated report of the events in a ping test. To
view a complete report, click Details to display the Ping Test Summary window.
Performing a Trace Route Test
Running a Trace Route Test
For best results, observe the guidelines set out in “Ensuring a Successful Network Test” on
page 65.
Note: Make sure power management is not enabled for the sender or receiver node in a
trace route test (see “Using the Power Management Application” on page 30). Ember
Studio Lite will display an error message if you attempt to run a trace route test on a
node that is under power management.
To run a trace route test:
1. Click the Tests folder in the folder tree. The folder tree expands to list the Ping Test and
Trace Route Test folders:
Ember Evaluation Kit User’s Guide 120-0047-000C Final Page 73
Page 74
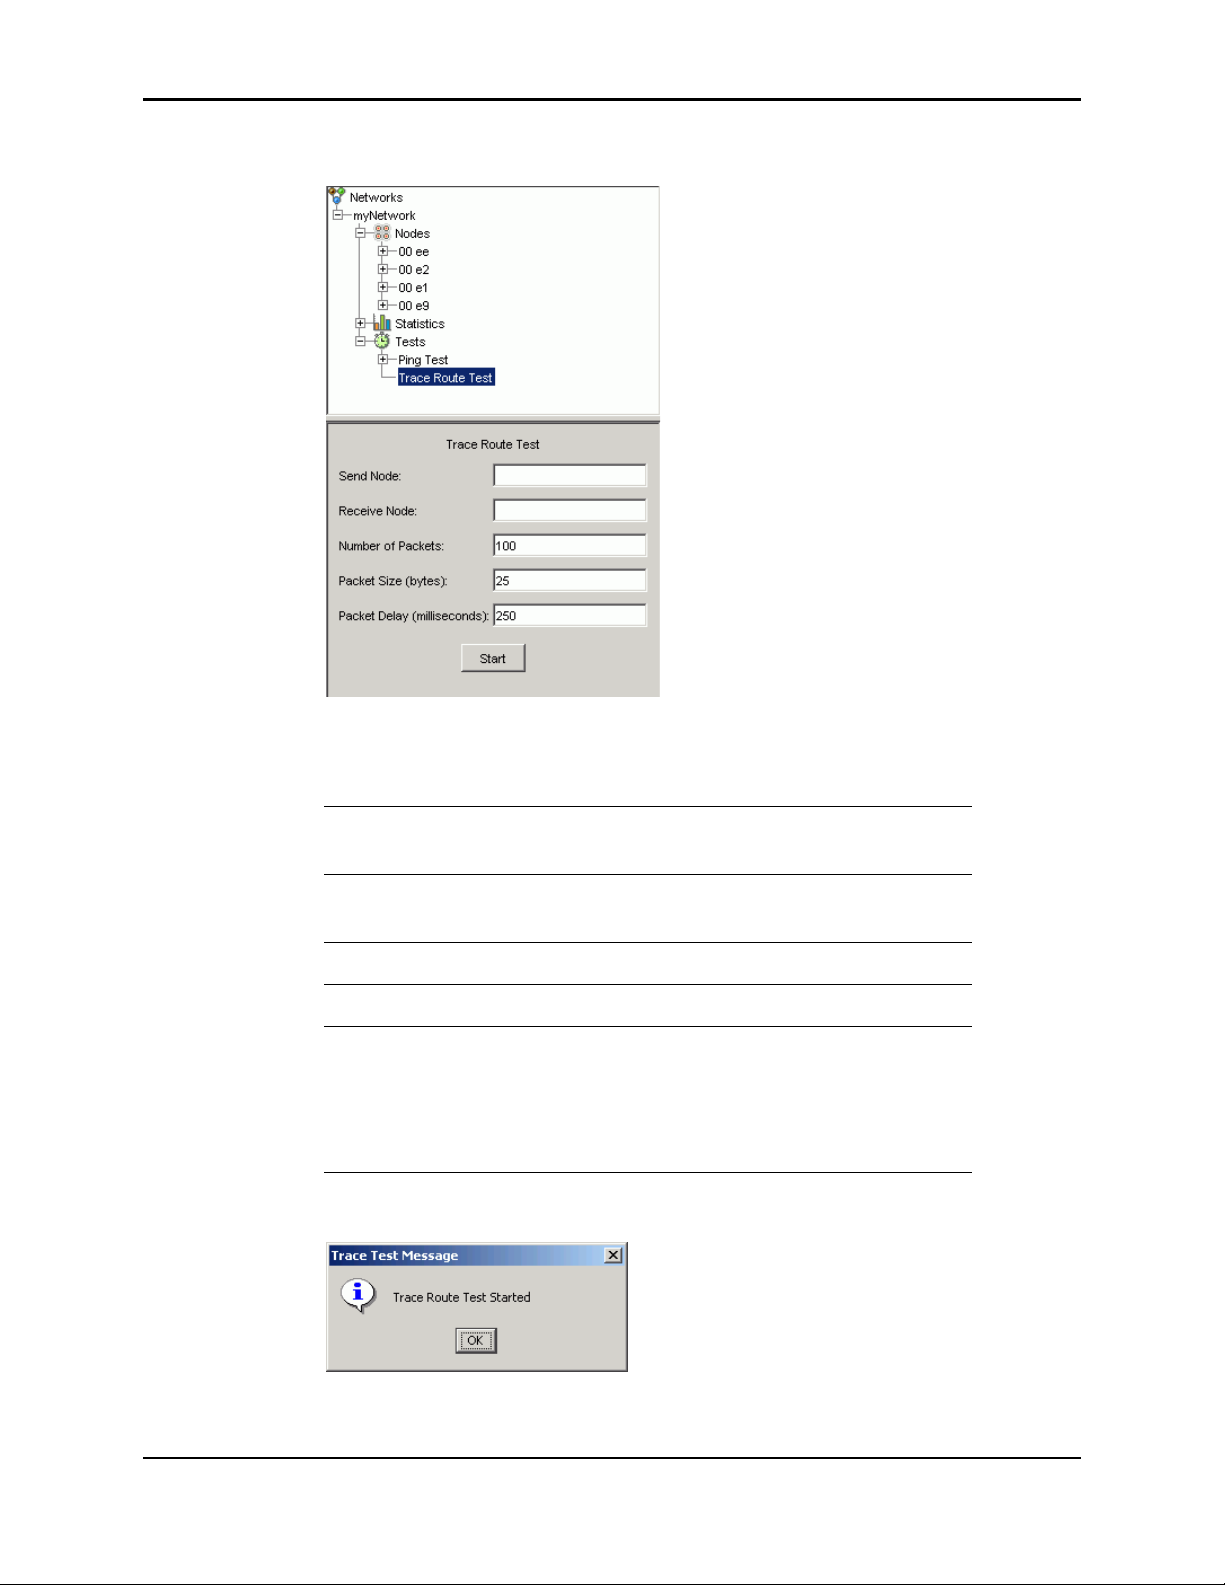
Chapter 8: Testing the Network Performing a Trace Route Test
2. Click the Trace Route Test folder. A test setup window displays:
3. Enter parameters into the test setup window.
Note: Do not select the gateway node for the send or receive node.
Send Node Click the field, then click the send node in the
network map, or enter the send node ID.
Receive Node Click the field, then click the receive node in the
network map, or enter the receive node ID.
Number of Packets Enter a number from 1 to 999.
Packet Size (bytes) Enter a number from 4 to 100.
Packet Delay
(milliseconds)
Enter a number that, when plugged into the
formula below, results in a value of 5 minutes or
less:
Number of packets times packet delay plus 60
seconds
4. Click Start. Ember Studio Lite displays a test initiation message:
Ember Evaluation Kit User’s Guide 120-0047-000C Final Page 74
Page 75
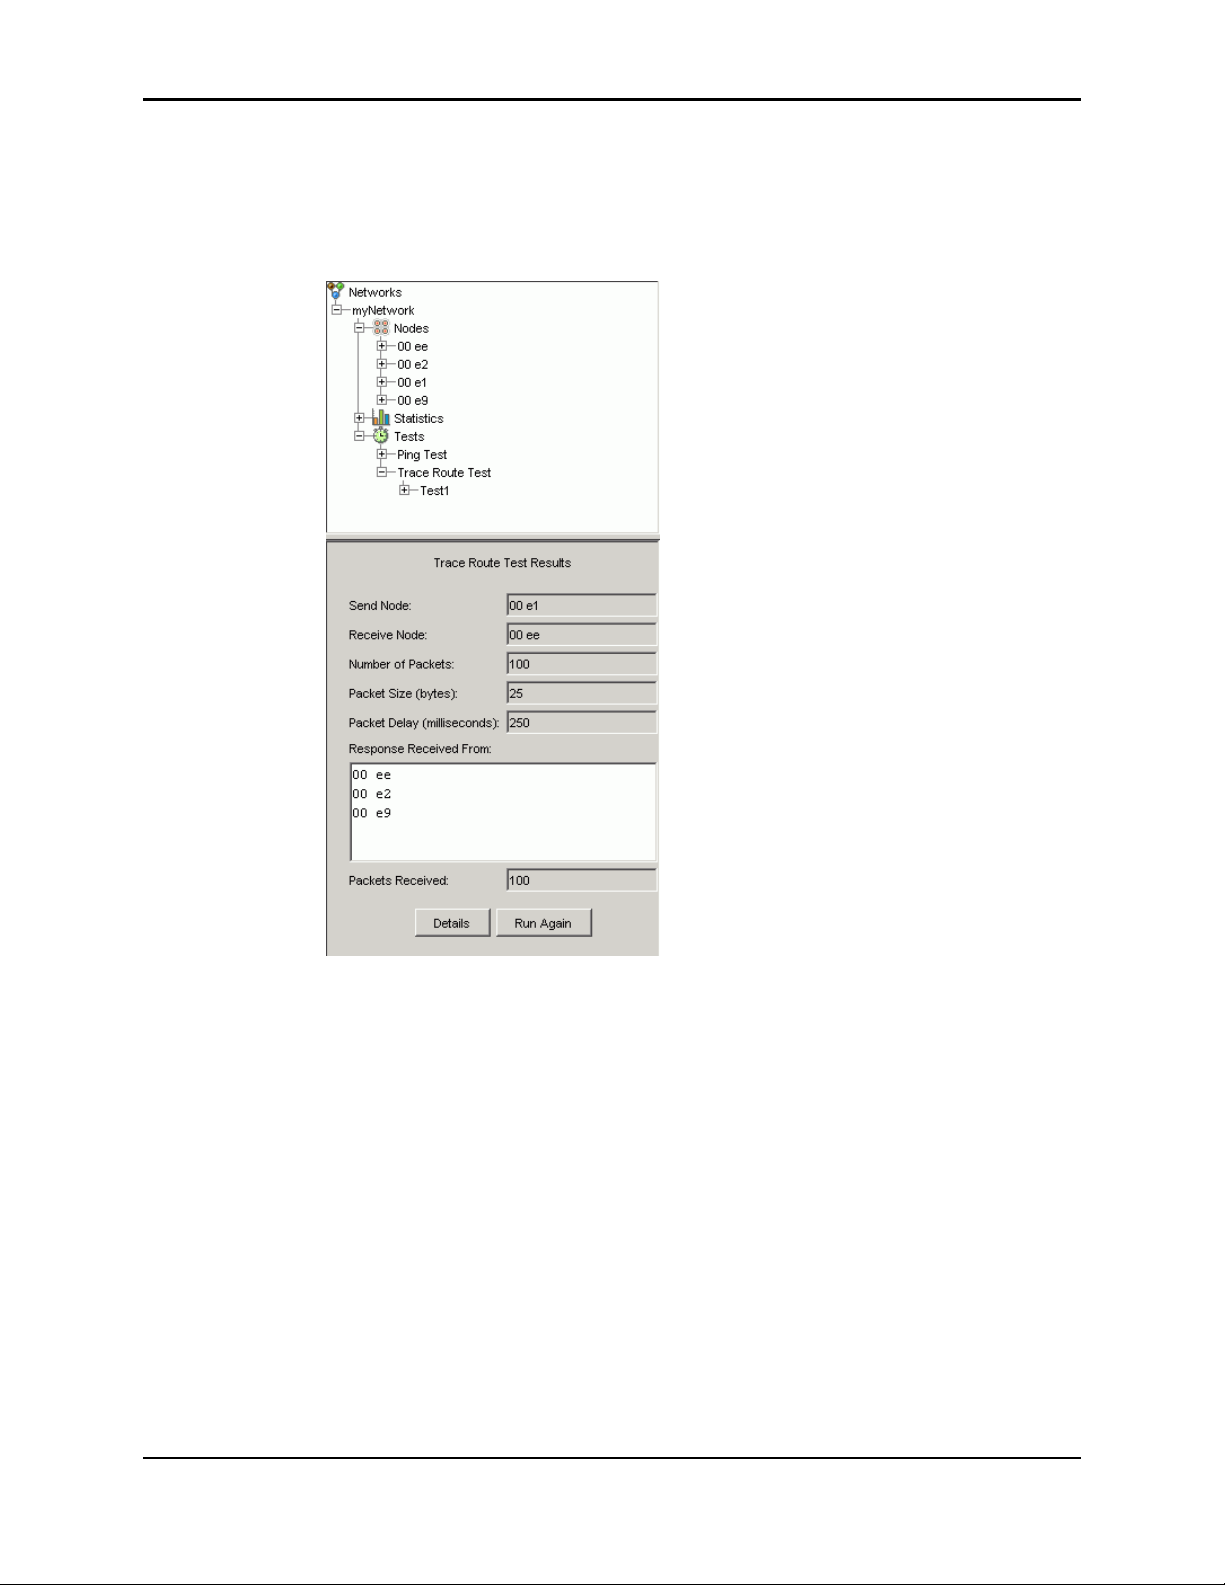
Chapter 8: Testing the Network Performing a Trace Route Test
5. Click OK. Ember Studio Lite displays the Trace Route Test Results window, which shows
the progress of the test.
When the test finishes, Ember Studio Lite places the results in a numbered subfolder in
the Trace Route Test folder and the Trace Route Test Results window stops updating:
6. Click the Testing tab. Test results display in the View pane. See the following section for
information on reading the test results.
7. Optional: To re-run the test with the same parameters, click Run Again. To re-run the test
with different parameters, enter new parameters into the Trace Route Test Results
window and click Run Again.
Reading Trace Route Test Results
Reading the Trace Route Graphic
Ember Studio Lite displays the paths that trace route packets traveled as lines superimposed
on a ghosted version of the network map. The color, weight, and style of these lines can be
configured to indicate the percentage of packets transmitted over a line (see “Configuring
Ping and Trace Route Test Preferences” on page 79). The following table shows the default
Ember Evaluation Kit User’s Guide 120-0047-000C Final Page 75
Page 76
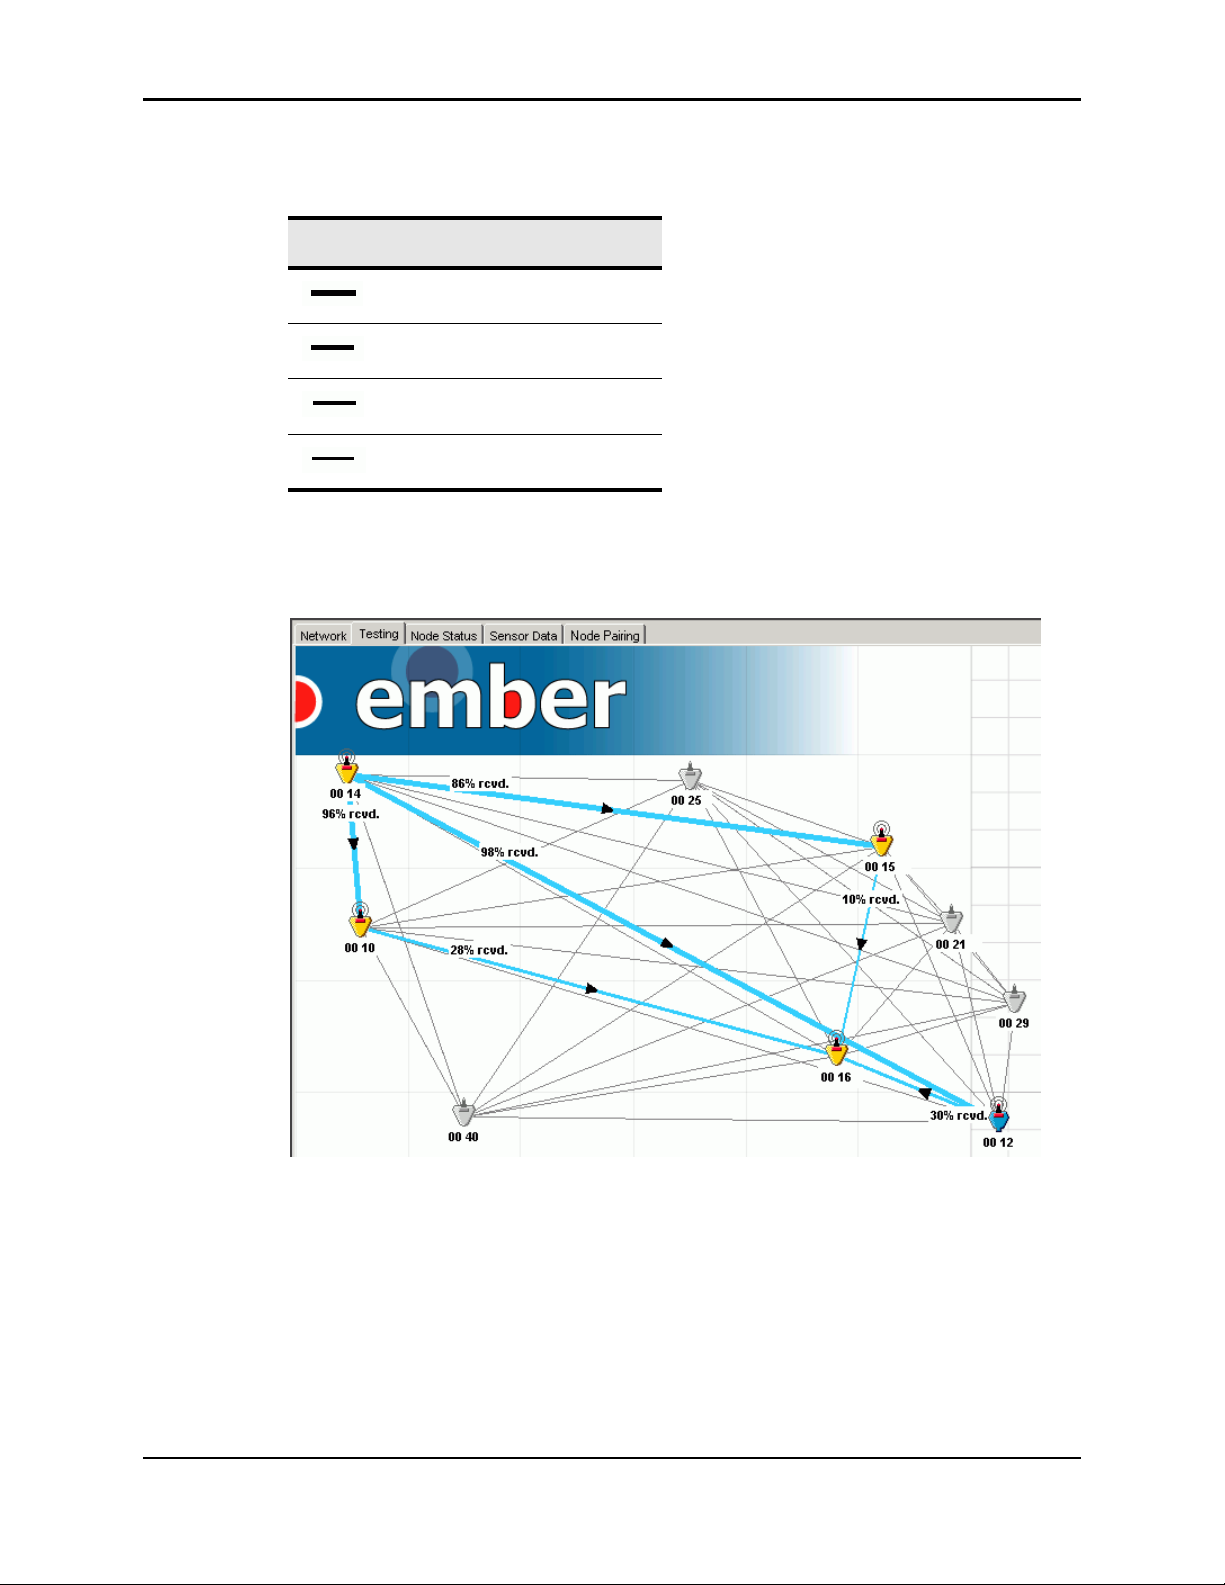
Chapter 8: Testing the Network Performing a Trace Route Test
trace route display settings, which hold color and line style constant and use only line weight
to signify packet success rates:
Line Weight Percentage of Packets
76 – 100
51 – 75
26 – 50
0 – 25
According to the default settings, during the test whose results are depicted below certain
node links transmitted a higher percentage of packets than others, indicating variation in the
quality of the links.
The depicted network is a simple one, and thus it is easy to discern all the paths that data took
to move from the send to the receive node. If you are performing a trace route test on a
complex network, the result lines may collide and be difficult to read. You can make such a
confusing result graphic easier to read by selectively displaying lines; for information on doing
this, see “Reading the Trace Route Test Summary” on page 77.
Ember Evaluation Kit User’s Guide 120-0047-000C Final Page 76
Page 77
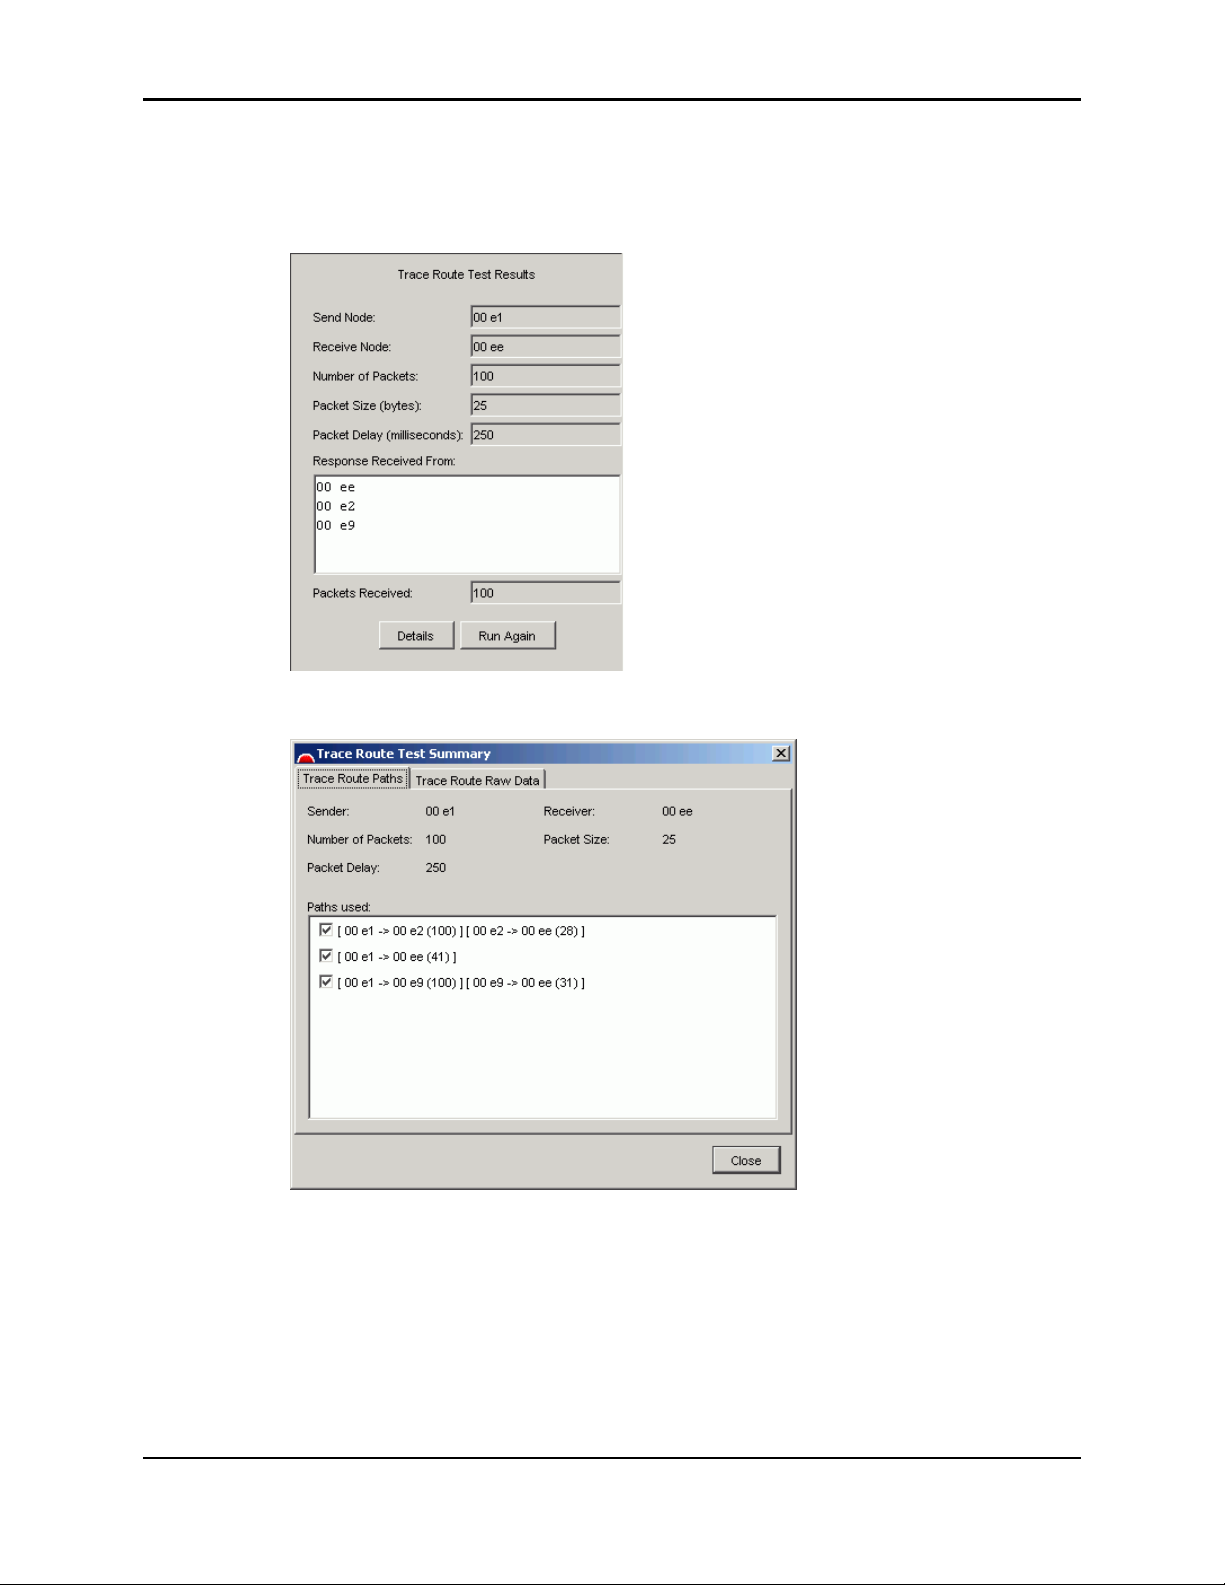
Chapter 8: Testing the Network Performing a Trace Route Test
Reading the Trace Route Test Summary
The Trace Route Test Results window provides an abbreviated report of the events in a trace
route test:
To see a complete report, click Details to display the Trace Route Test Summary window:
The tabs in this window provide different views of the test results:
z Trace Route Paths: Shows test results for each path and allows you to selectively turn
paths on and off in the results map, to obtain a clearer view of a complicated test result
pattern.
z Trace Route Raw Data: Displays raw test result data for either nodes on the trace route
path or for all nodes.
Ember Evaluation Kit User’s Guide 120-0047-000C Final Page 77
Page 78
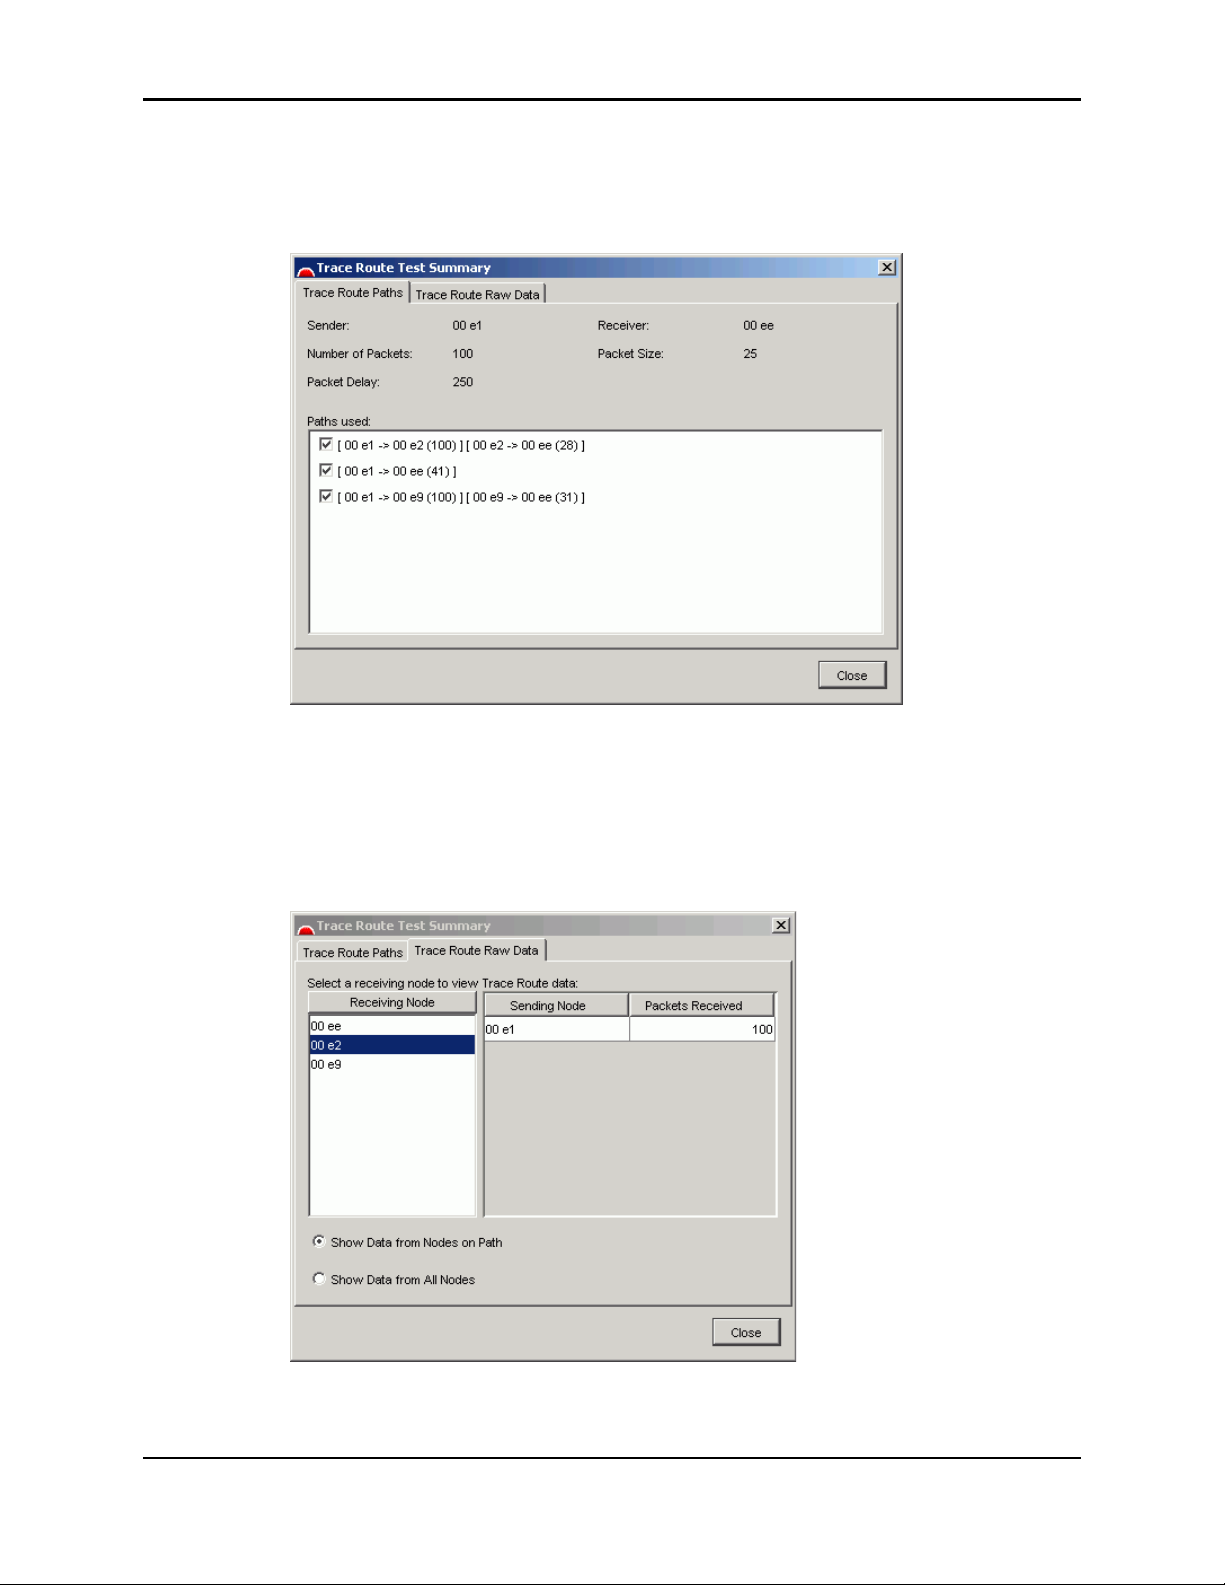
Chapter 8: Testing the Network Performing a Trace Route Test
To selectively display trace route paths in the test results map:
Click the Trace Route Paths tab and select or deselect checkboxes to display or hide paths in
the results map.
To selectively view raw data from nodes on the trace route path or from all nodes:
Click the Trace Route Raw Data tab, then:
z Click a receiving node to see the nodes that sent packets to it and the number of packets
sent.
z Select whether to show data for all nodes or only nodes on the trace route path.
Ember Evaluation Kit User’s Guide 120-0047-000C Final Page 78
Page 79
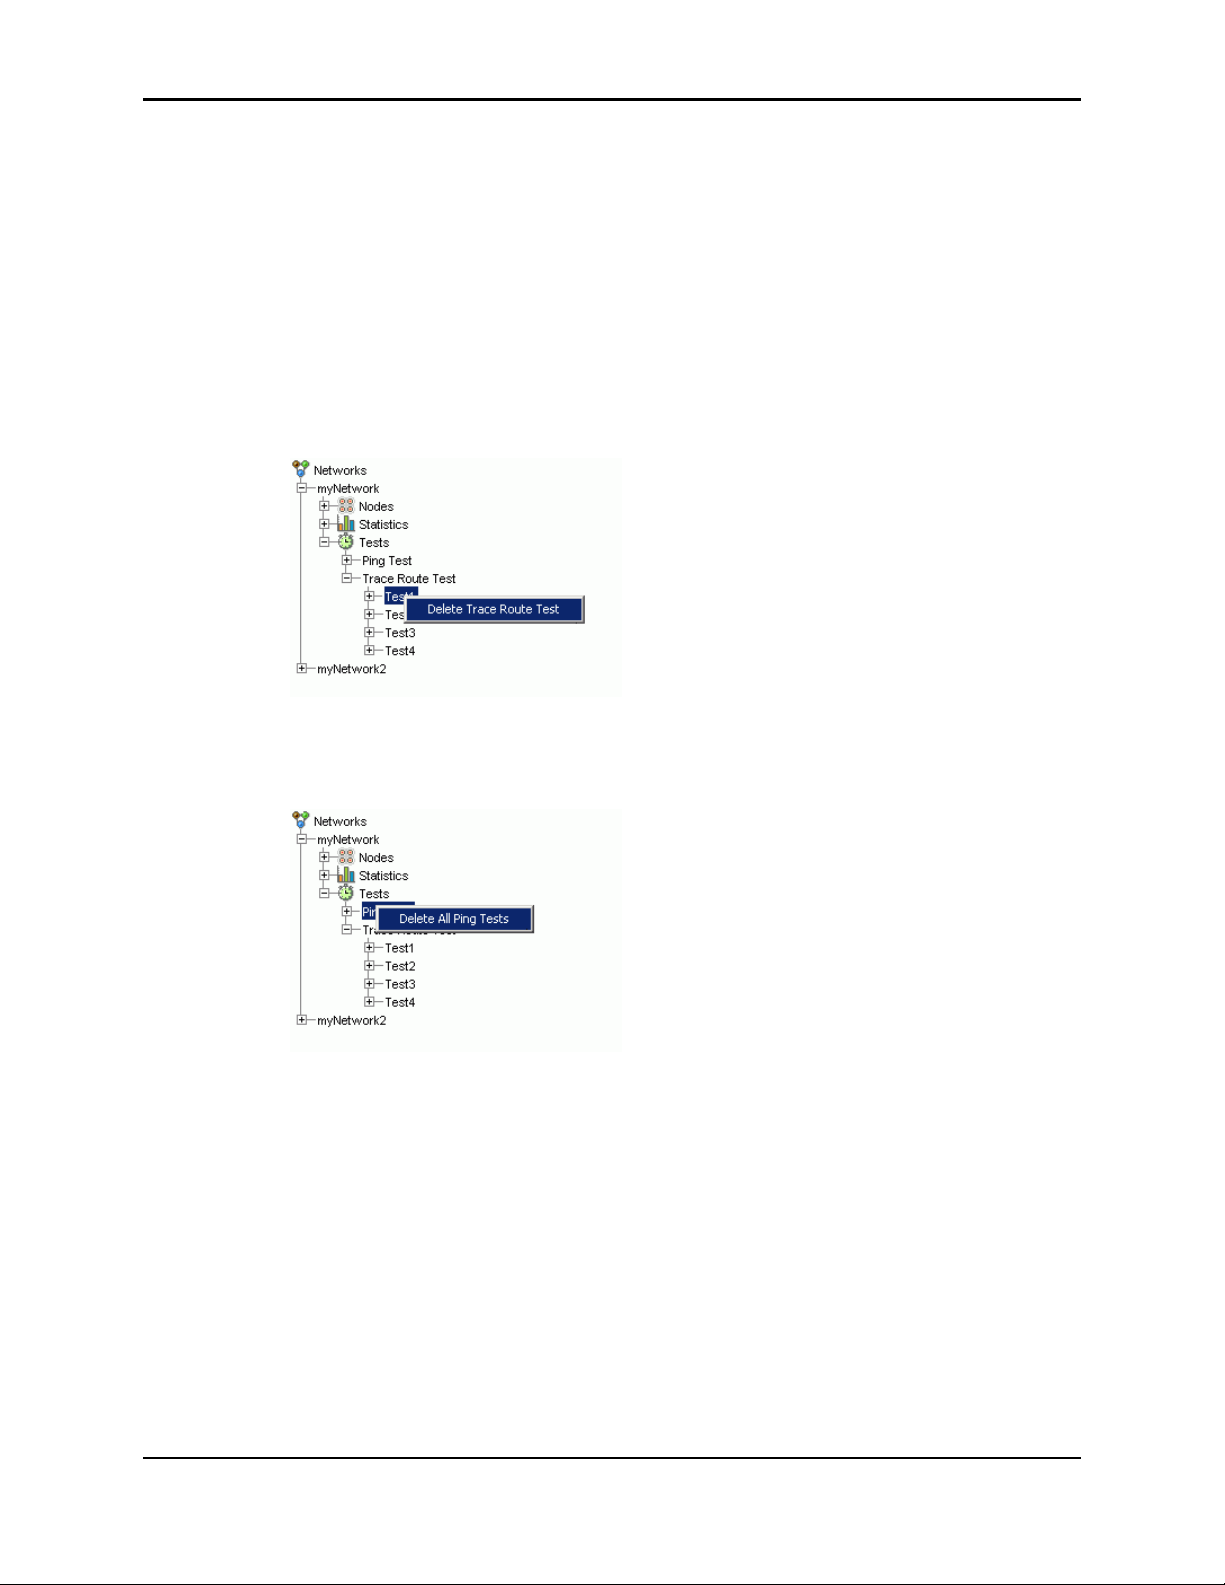
Chapter 8: Testing the Network Viewing Results of Previously Run Tests
Viewing Results of Previously Run Tests
Click a test results folder, then click the Testing tab. The graphical and text results display.
Deleting Test Results
You can delete some or all test results. Be careful when deleting test results, because they
cannot be recovered.
To delete tests results one at a time:
Right-click a test result folder and select the pop-up:
To delete a l l t e s ts:
Right-click the Ping Test or Trace Route Test folder and select the pop-up.
Configuring Ping and Trace Route Test Preferences
The color, line weight, and style of the lines in ping or trace route test results indicate the
percentage of packets that traveled over a given leg of the test route. You can configure
preferences for these display variables.
Note: We recommend using one color and line style for trace route test result lines. Using
a single color and line style minimizes visual clutter on the screen when the results
involve many lines. In most cases, the varying line weights are sufficient to visually
distinguish the routes.
To change the color, weight, or style of test result lines:
1. Click the Testing tab.
Ember Evaluation Kit User’s Guide 120-0047-000C Final Page 79
Page 80
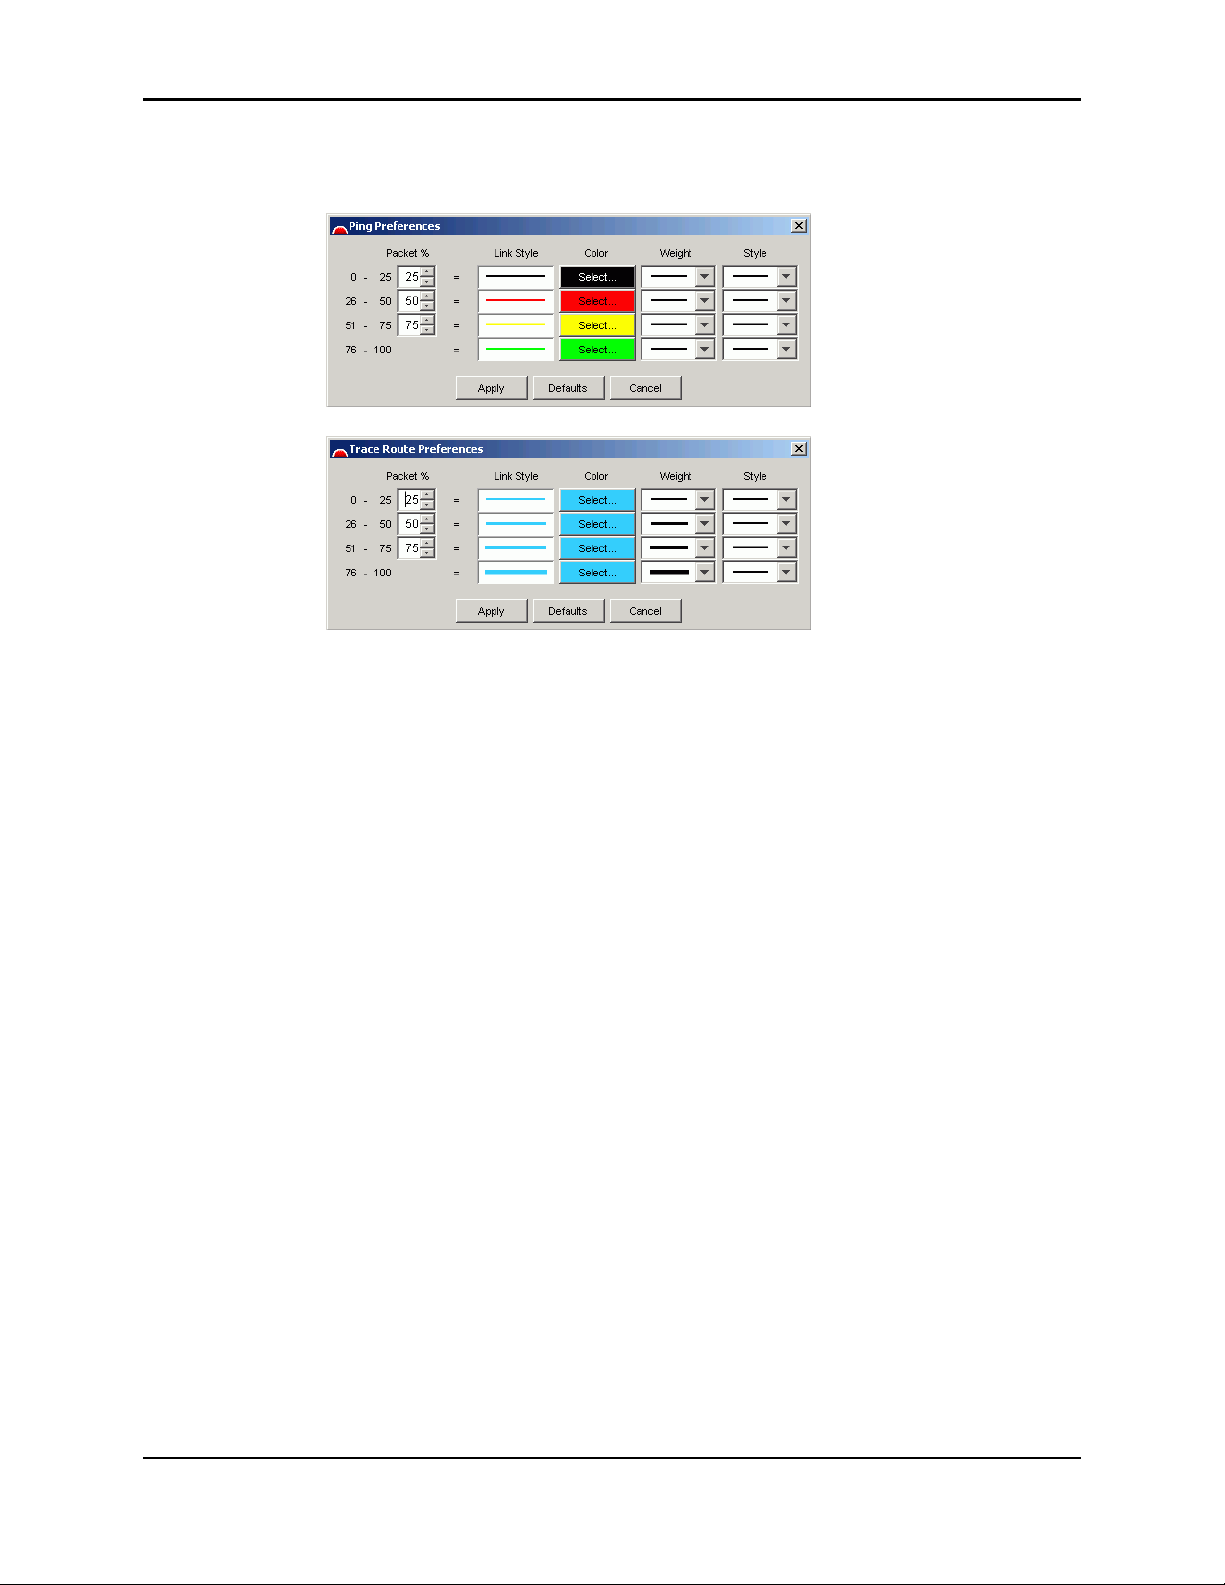
Chapter 8: Testing the Network Configuring Ping and Trace Route Test Preferences
2. Right-click anywhere in the Testing window and select Ping Preferences or Trace Route
Preferences. One of the following windows displays:
3. Optional: Change the percentage of packets to which a given preference applies. By
default the preferences are equally divided at 25 percent each.
4. Select a line style, color, and line weight from their respective drop-down menus. To
configure color, click the color box, then select a color from the palette that displays.
5. Click Apply. The new settings take effect immediately.
To restore the default ping or trace route preferences:
To restore the defaults, display a preferences window as describe above, click Defaults, then
click Apply. The default settings take effect immediately.
Ember Evaluation Kit User’s Guide 120-0047-000C Final Page 80
Page 81

CHAPTER 9 Uploading EmberNet Upgrades
Obtaining EmberNet Upgrades . . . . . . . . . . . . . . . . . . . . . . . . . . . . . . . . . . . . . . . . 81
Uploading a New EmberNet Image to Modules . . . . . . . . . . . . . . . . . . . . . . . . . . . 81
Obtaining EmberNet Upgrades
Ember will notify you when an EmberNet upgrade is available and upon your request will
mail you a CD containing the binary.
Uploading a New EmberNet Image to Modules
Ember Studio Lite includes a wizard to help you to upload a new EmberNet image to your
modules.
Note: You must upload the new image to every module in your kit. Failure to do so may
cause Ember Studio Lite to behave in an unpredictable manner.
A module must be connected to the computer via a serial port before the image can be
uploaded. If you are uploading via a serial port connected to a gateway node, the network will
shut down when the upload begins
When performing this procedure, use only the serial adapter cable
Caution!
To upload a new EmberNet image to a module:
1. Using the serial adapter cable that came with your Evaluation Kit, connect the module to
a port on your computer that has been assigned to COM1. Turn the module on if
necessary.
Note: The module will not appear in the network map.
Ember Evaluation Kit User’s Guide 120-0047-000C Final Page 81
provided in your Evaluation Kit. Using any other serial adapter
cable can severely damage the module microprocessor.
.
Page 82
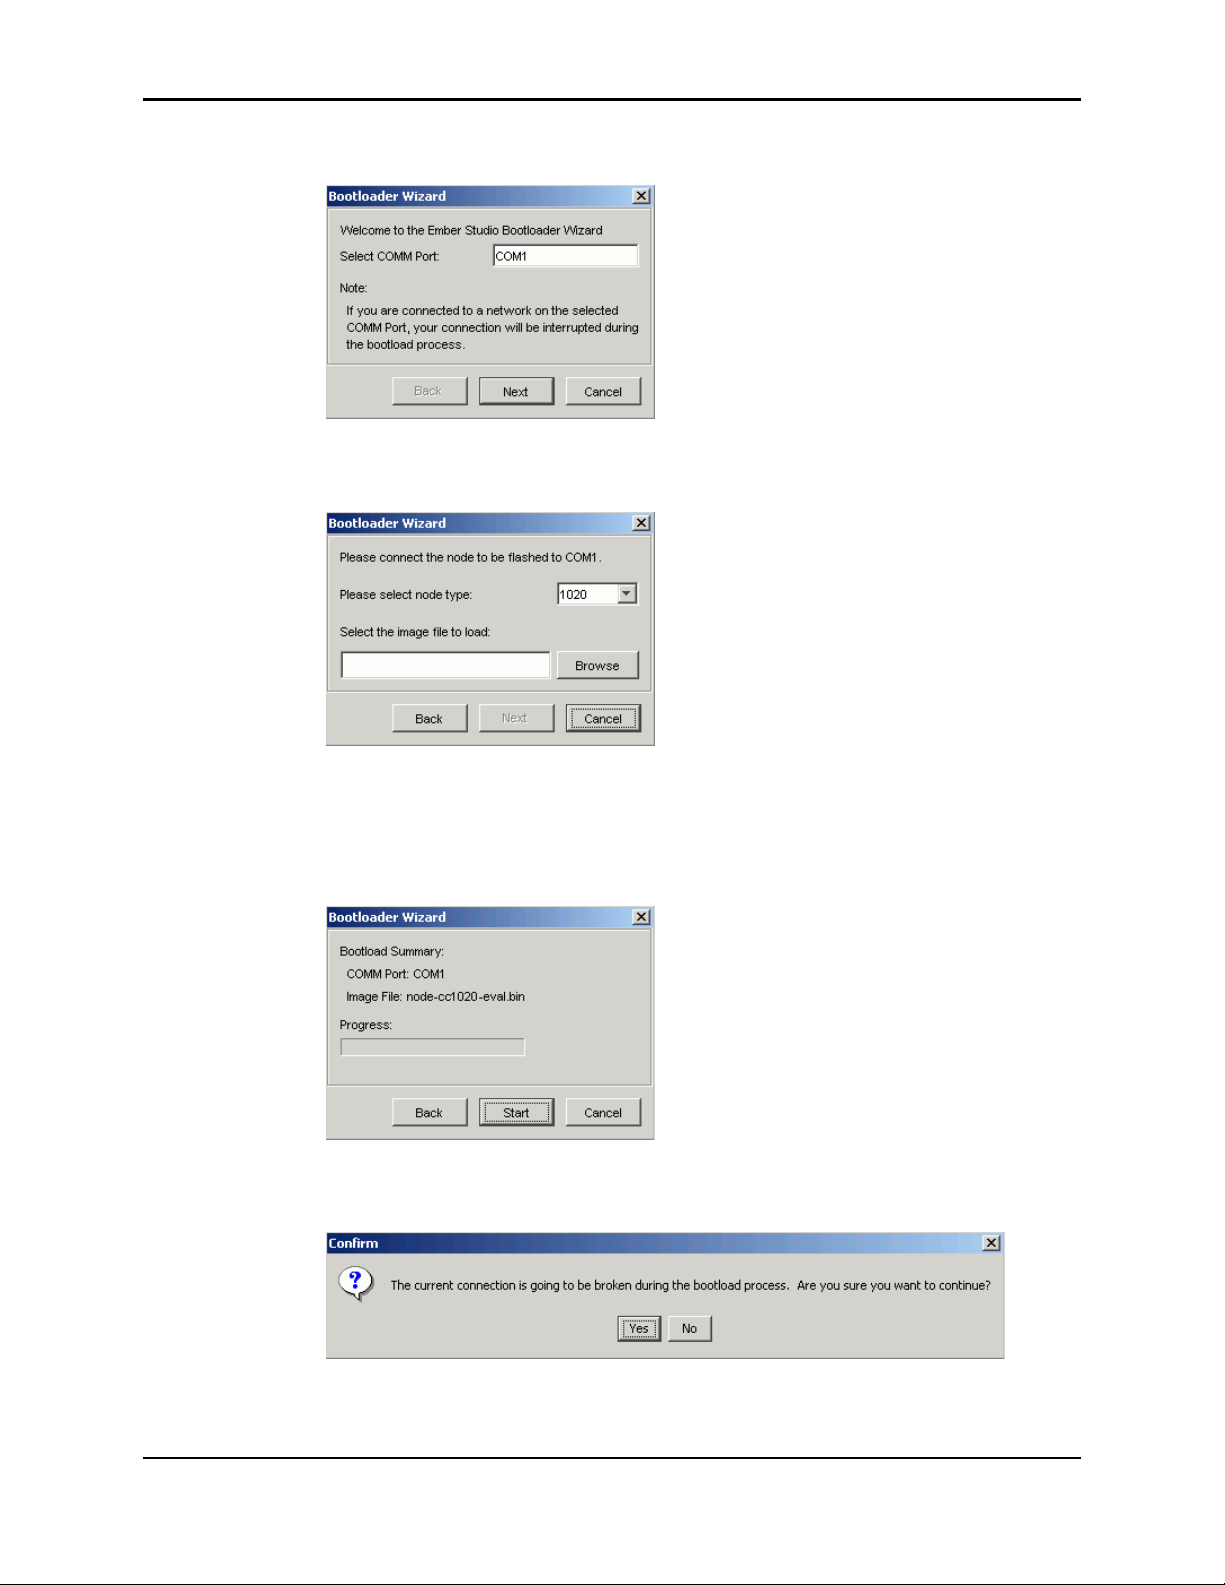
Chapter 9: Uploading EmberNet Upgrades Uploading a New EmberNet Image to Modules
2. Select Edit > Bootload Wizard. The Bootload Wizard displays:
3. Enter a COMM port or accept the default and click Next. The next wizard window
displays:
4. Select the node type according to the type of Ember Evaluation module you purchased
(EM2420 or CC1020).
5. Browse to the image (.bin) file to be uploaded or enter the file into the textbox and press
Next. The next wizard window displays:
6. Click Start. The wizard informs you that if you are using a serial port that is running a
network, the network connection will close when the upload begins:
Ember Evaluation Kit User’s Guide 120-0047-000C Final Page 82
Page 83
Chapter 9: Uploading EmberNet Upgrades Uploading a New EmberNet Image to Modules
7. Click Yes. The wizard displays a progress bar as it uploads the image. When the upload is
complete, the icon for the module appears in the network map, and the the following
window displays:
8. Do one of the following:
Click Yes to upload the image to another module. The first window of the wizard
displays. Repeat steps 2 to 6.
If your computer is providing the local connection for a network, reconnect the
gateway node to the serial port, then click No to close the wizard. Otherwise, just
click No. If you do not reconnect a network gateway to the serial port before closing
the wizard, you will have to open the connection wizard to reconnect the gateway
module to the network. (For information on using the connection wizard, see “Using
the Network Connection Wizard” on page 46.
Ember Evaluation Kit User’s Guide 120-0047-000C Final Page 83
Page 84

APPENDIX A Ember Studio Lite Quick Reference
Network Connections . . . . . . . . . . . . . . . . . . . . . . . . . . . . . . . . . . . . . . . . . . . . . . . .84
Network Map . . . . . . . . . . . . . . . . . . . . . . . . . . . . . . . . . . . . . . . . . . . . . . . . . . . . . .85
Node Management. . . . . . . . . . . . . . . . . . . . . . . . . . . . . . . . . . . . . . . . . . . . . . . . . . 86
Network Testing . . . . . . . . . . . . . . . . . . . . . . . . . . . . . . . . . . . . . . . . . . . . . . . . . . . . . 86
Sensor Data . . . . . . . . . . . . . . . . . . . . . . . . . . . . . . . . . . . . . . . . . . . . . . . . . . . . . . . . 87
Node Pairing . . . . . . . . . . . . . . . . . . . . . . . . . . . . . . . . . . . . . . . . . . . . . . . . . . . . . . .88
General Tasks. . . . . . . . . . . . . . . . . . . . . . . . . . . . . . . . . . . . . . . . . . . . . . . . . . . . . . . 88
Topic To Do This Perform These Actions
Network
Connections
Connect to a new
network
Switch to a different
network
Delete a network
connection
Configure a network
connection
1. Click the folder for the network to which Ember
Studio Lite is connected.
2. Click Disconnect.
3. Select Connect to Remote Network or Create New Local
Network.
4. Enter values into the Name, IP Address, and Port fields.
5. Click Connect.
1. Click the folder for the network to which Ember
Studio Lite is connected.
2. Click Disconnect.
3. Click a different network in the folder tree.
4. Click Connect.
Right-click the network folder and select Delete Network.
For important information on configuring for optimum
performance, see “Changing Network Settings” on page
48.
1. Click the network folder in the folder tree.
2. Click Settings.
3. Enter values in to the configurable fields.
4. Click Apply.
Ember Evaluation Kit User’s Guide 120-0047-000C Final Page 84
Page 85

Appendix A: Ember Studio Lite Quick Reference
Topic To Do This Perform These Actions
Network Map View the map Click the Network tab.
Refresh the map Three methods:
z Click the Refresh button in the toolbar.
z Right-click the map and select Refresh.
z Select Edit > Refresh.
Rearrange map icons Drag icons to new positions on the map.
Zoom the map Right-click the map and select a zoom value.
Pan the map Hold the mouse button down until the cursor changes
to a pointing finger, then, with the mouse button down,
move the cursor.
Display custom node
icons
Hide or show error
nodes
Change the color,
weight, or style of
node link lines
Restore default
preferences for node
icons or link lines
1. Right-click the map and select Node Preferences.
2. Browse to locate new icon files.
3. Select one or more icon files and click Open.
4. Click Apply.
Two metho ds:
z In the main menu, select View > Show Nodes With
Error.
OR
1. Right-click the map and select Node Preferences.
2. Select Hide node.
3. Click Apply.
1. Right-click the map and select Link Preferences.
2. Select color, line weight, and line style preferences.
3. Click Apply.
1. Right-click the map and select Link Preferences or Node
Preferences.
2. Click Defaults.
3. Click Apply.
Display a custom
background image
1. Right-click the map and select Set Background Image.
2. Browse to locate the new background image file.
3. Select the file and click Open.
Display the default
Right-click the map and select Remove Background Image.
background image
Ember Evaluation Kit User’s Guide 120-0047-000C Final Page 85
Page 86

Appendix A: Ember Studio Lite Quick Reference
Topic To Do This Perform These Actions
Node Management View node status Click the Node Status tab.
View node statistics 1. Double-click the Statistics folder in folder tree.
2. Enter a polling frequency in the Statistics Period
field.
3. Enter number of times to poll network in Statistics
Count field.
4. Select nodes to poll and statistics.
5. Click Done.
View a node’s
Click a node folder in the folder tree.
parameters
View properties for all
nodes
Two metho ds:
z Double-click a node in the network map.
z Double-click the Nodes folder in the folder tree.
Set node properties See Table 7-2 for a list of configurable properties.
1. Double-click a configurable property.
2. Enter a new value and click Apply.
3. Click Done.
Network Testing Run ping test 1. Click the Tests folder in the folder tree, then click the
Ping folder.
2. Enter values in the Ping Test configuration window.
3. Click Start.
Run trace route 1. Click the Tests folder in the folder tree, then click the
Trace Route folder.
2. Enter values in the Trace Route Test configuration
window.
3. Click Start.
4. To view results, click the numbered test result folder
under Trace Route Test, then click the Testing tab.
View test results Click the numbered test result folder, then click the
Testing tab. A test report displays in Context pane. To
view an expanded report, click Details.
Selectively display
paths in trace route
results map
Ember Evaluation Kit User’s Guide 120-0047-000C Final Page 86
1. Click Details in the Trace Route Test Result window.
2. Click the Trace Route Paths tab.
3. De-select checkboxes to turn off lines.
Page 87

Appendix A: Ember Studio Lite Quick Reference
Topic To Do This Perform These Actions
View and filter trace
route raw data
Delete one test Right-click the test result folder.
Delete all tests Right-click the Ping Test or Trace Route Test folder.
Change the color,
weight, or style of test
result lines
Restore the default
preferences for ping
or trace route result
lines
Sensor Data Stimulate module
sensors
1. Click Details in the Trace Route Test Result window.
2. Click the Trace Route Raw Data tab.
3. Select a node to view its raw data. Select a checkbox
to view data from all nodes or path nodes only.
1. Right-click the Testing window and select Ping
Preferences or Trace Route Preferences.
2. Optional: Change the percentage of packets to which
a given preference applies.
3. Select color, line weight, or line style preferences.
4. Click Apply.
1. Right-click the Testing window and select Ping
Preferences or Trace Route Preferences.
2. Click Defaults, then click Apply.
See “Obtaining Sensor Data” on page 30 for ideas.
Collect sensor data 1. Click the Sensor Data tab.
2. Do one:
Double-click a node in the network map.
Click a node folder in the folder tree.
3. Select data checkboxes.
4. Select a report type.
5. Specify a report interval.
6. Click Apply.
7. Stimulate module sensors.
View graphed sensor
data
1. Click the Sensor Data tab.
2. Click a graph button.
View raw sensor data Click the Sensor Data tab.
Turn on power
Select Power Management in the Sensor Data window.
management
Ember Evaluation Kit User’s Guide 120-0047-000C Final Page 87
Page 88

Appendix A: Ember Studio Lite Quick Reference
Topic To Do This Perform These Actions
Node Pairing View map of paired
Click the Node Pairing tab.
nodes
General Tasks View help Select Help > Documentation.
Print the main
window
Click the Print button in the toolbar, or select File >
Print.
Ember Evaluation Kit User’s Guide 120-0047-000C Final Page 88
Page 89
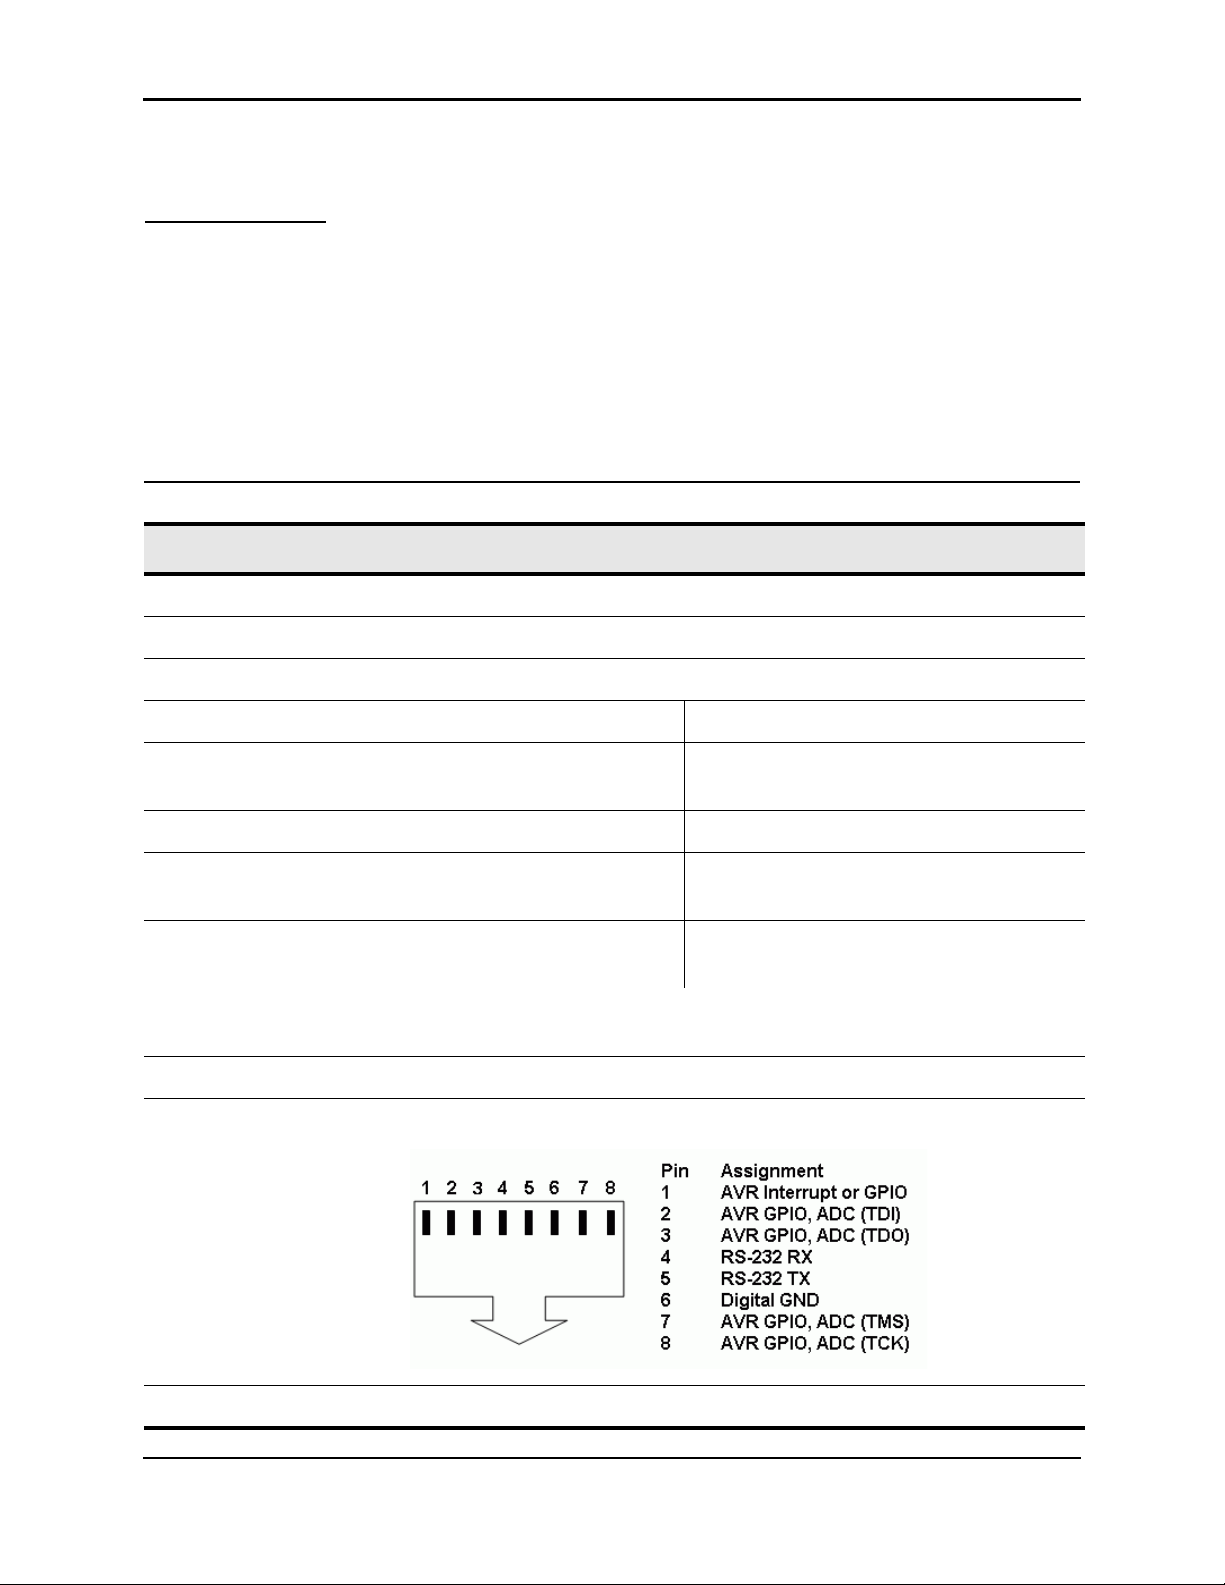
APPENDIX B Ember Evaluation Module
Technical Features
Feature Description
Dimensions Triangular shape, 6.35 cm on each side, 2.5 cm deep
0°C – 70°C
Radio CC1020 or EM2420 (For detailed specifications, see the datasheet.)
EM2420 CC1020
Operating frequency North America and Europe:
2.400 – 2.483GHz
Power 0dBm – 25dBm -25dBm to + 5dBm
Channels 16 channels 902 – 928MHz: 49 channels
Antenna North America and Europe:
Tuned for 2.4GHz
Omni-directional high-performance 1/4-wave monopole antenna with a
right-angle RP-SMA female connector
Processor Atmega 128
Data interface connector RJ45 serial jack, not Ethernet compliant, with the following pin assignments:
North America: 902–928MHz
Europe: 868MHz
868MHz: 4 channels
North America: Tuned for 915MHz
Europe: Tuned for 868MHz
Power connector DC power jack
Ember Evaluation Kit User’s Guide 120-0047-000C Final Page 89
Page 90

Appendix B: Ember Evaluation Module Technical Features
Feature Description
Batteries Two AAA batteries
Sensors
z Temperature sensor
Range: -55°C to +130°C
Maximum: +/- 5°C
z Two-axis accelerometer (Y and X)
Range: + / - 2
Maximum: 3500
g in any dimension
g, 0.5 ms
Note: Do not operate the module outside of the operating temperature limits
described above.
Indicators
z Four LEDs (listed in order from top to bottom; the arrow in figure 1-1
points to the first LED):
1. Network traffic
2. Unspecified
3. Unspecified
4. Power/heartbeat
z Programmable button
z Piezoelectric buzzer
Software EmberNet networking application
Certifications FCC Part 15 compliant
CE (EN 300 220-3 v1.1.1 and EN 301 489-3 v1.1.1)
Industry Canada RSS-210
Ember Evaluation Kit User’s Guide 120-0047-000C Final Page 90
Page 91

APPENDIX C Module Radio Settings
Transmission Power Settings. . . . . . . . . . . . . . . . . . . . . . . . . . . . . . . . . . . . . . . . . . . . 91
EM2420. . . . . . . . . . . . . . . . . . . . . . . . . . . . . . . . . . . . . . . . . . . . . . . . . . . . 91
CC1020 . . . . . . . . . . . . . . . . . . . . . . . . . . . . . . . . . . . . . . . . . . . . . . . . . . . .92
Radiofrequency Channel Settings . . . . . . . . . . . . . . . . . . . . . . . . . . . . . . . . . . . . . . . 93
EM2420. . . . . . . . . . . . . . . . . . . . . . . . . . . . . . . . . . . . . . . . . . . . . . . . . . . . 93
CC1020, 868MHz . . . . . . . . . . . . . . . . . . . . . . . . . . . . . . . . . . . . . . . . . . .93
CC1020, 915MH . . . . . . . . . . . . . . . . . . . . . . . . . . . . . . . . . . . . . . . . . . . . 94
Transmission Power Settings
EM2420
Setting Power Setting Power
0 -13 12 -5
1 -13 13 -5
2 -11 14 -4
3 -10 15 -3
4 -10 16 -3
5 -10 17 -3
6-8 18-2
7-7 19-2
8-7 20-2
9-7 21-2
10 -6 22 -1
11 -5 — —
Ember Evaluation Kit User’s Guide 120-0047-000C Final Page 91
Page 92

Appendix C: Module Radio Settings Transmission Power Settings
CC1020
Setting Power Setting Power
0 -25 10 -15
1 -24 11 -14
2 -23 12 -13
3 -22 13 -12
4 -21 14 -11
5 -20 15 -10
6 -19 16 -9
7 -18 17 -8
8 -17 18 -7
9 -16 19 -6
Ember Evaluation Kit User’s Guide 120-0047-000C Final Page 92
Page 93

Appendix C: Module Radio Settings Radiofrequency Channel Settings
Radiofrequency Channel Settings
EM2420
Channel Frequency Channel Frequency
0 2.405 8 2.445
1 2.410 9 2.450
2 2.415 10 2.455
3 2.420 11 2.460
4 2.425 12 2.465
5 2.430 13 2.470
6 2.435 14 2.485
7 2.440 15 2.480
CC1020, 868MHz
Channel Frequency
50 863.250
51 863.750
52 864.250
53 864.750
Ember Evaluation Kit User’s Guide 120-0047-000C Final Page 93
Page 94

Appendix C: Module Radio Settings Radiofrequency Channel Settings
CC1020, 915MH
Channel Frequency Channel Frequency
1 902.791 25 915.430
2 903.318 26 915.957
3 903.845 27 916.484
4 904.371 28 917.010
5 904.898 29 917.537
6 905.425 30 918.064
7 905.951 31 918.590
8 906.478 32 919.117
9 907.004 33 919.643
10 907.531 34 920.170
11 908.058 35 920.697
12 908.584 36 921.223
13 909.111 37 921.750
14 909.638 38 922.277
15 910.164 39 922.803
16 910.691 40 923.330
17 911.217 41 923.857
18 911.744 42 924.383
19 912.271 43 924.910
20 912.797 44 925.436
21 913.324 45 925.963
22 913.851 46 926.490
23 914.377 47 927.016
24 914.904 48 927.543
Ember Evaluation Kit User’s Guide 120-0047-000C Final Page 94
Page 95

APPENDIX D Ember Serial Command Set
Reference
About the Ember Serial Command Set . . . . . . . . . . . . . . . . . . . . . . . . . . . . . . . . . . . 95
Command Syntax . . . . . . . . . . . . . . . . . . . . . . . . . . . . . . . . . . . . . . . . . . . . . . . . . . . 95
Commands . . . . . . . . . . . . . . . . . . . . . . . . . . . . . . . . . . . . . . . . . . . . . . . . . . . . . . . . . 96
Responses. . . . . . . . . . . . . . . . . . . . . . . . . . . . . . . . . . . . . . . . . . . . . . . . . . . . . . . . . .99
Error Messages . . . . . . . . . . . . . . . . . . . . . . . . . . . . . . . . . . . . . . . . . . . . . . . . . . . . . 99
Resetting Local IDs . . . . . . . . . . . . . . . . . . . . . . . . . . . . . . . . . . . . . . . . . . . . . . . . . . 101
Configuring a Terminal Emulator for the Serial Command Set. . . . . . . . . . . . . . . . 101
About the Ember Serial Command Set
You can use the Ember Serial Command Set to write small sample applications that you can
run over your networked Ember Evaluation Kit modules. You can also directly address these
commands to modules via a terminal emulator, such as Hyperterm or Tera Term, to
immediately observe the transmission of data through the network.
Command Syntax
A Serial Command Set command consists of a single line listing the command name and
followed by zero, one, or two whitespace-separated parameters:
command parameter parameter
Command parameters can consist of:
z Numbers (for local IDs)
z ASCII strings enclosed in quotation marks
z Binary messages enclosed in square brackets. For binary messages, the first byte must give
the number of following bytes, not including the closing bracket.
The local ID is a number that uniquely identifies each module in an Evaluation Kit. Only
Serial Command Set commands call modules by their local ID. To determine the local ID of a
module, run the local_id command. Under certain circumstances, you may want to reset
module local IDs (see “Resetting Local IDs” on page 101).
Ember Evaluation Kit User’s Guide 120-0047-000C Final Page 95
Page 96

Appendix D: Ember Serial Command Set Reference Commands
Commands
deliver
Repeatedly sends an unacknowledged message to a specified node, until the node returns an
acknowledgment. (Abbreviation: d)
Parameters
Single integer consisting of a device ID
ASCII string in quotation marks OR binary message in square brackets
(maximum length: 80 chars or bytes)
Example
deliver 2 “hello node 2”
broadcast
local_id
Broadcasts a message to all nodes. (Abbreviation: b)
Parameters
ASCII string in quotation marks OR binary message in square brackets
(maximum length: 80 chars or bytes)
Example
broadcast “hello all”
Queries a device for its local ID number. (Abbreviation: l)
Parameters
None
Example
local_id
Ember Evaluation Kit User’s Guide 120-0047-000C Final Page 96
Page 97

Appendix D: Ember Serial Command Set Reference Commands
ping
Pings a specified node. (Abbreviation: p)
Parameters
Single integer consisting of a local ID
Example
ping 2
ping_all
Broadcasts a ping to all nodes. (Abbreviation: a)
Parameters
None
reset
Example
ping_all
Empties the message queue for a specified node and resets the connection. (Abbreviation:
r)
Parameters
Single integer consisting of a local ID
Example
reset 1
Ember Evaluation Kit User’s Guide 120-0047-000C Final Page 97
Page 98

Appendix D: Ember Serial Command Set Reference Commands
set_channel
Sets the radio channel of the gateway node. (Abbreviation: none available)
Parameters
EM2420:
z Single integer with value of 0 to 15
CC1020:
z 915MHz radio: Single integer with value of 1 to 49
z 868MHz radio: Single integer with value of 50, 51, 52, or 53
Example
set_channel 3
set_local_id
Sets the local ID for a node. (Abbreviation: none available)
set_power
Be careful when resetting local IDs. See “Resetting Local IDs” on page 101 for important
information.
Parameters
Single integer
Example
set_local_id 14
Sets the radio power of the gateway node to a specified value. (Abbreviation: none available)
Parameters
Single integer with value of 0, 1, or 2
Example
set_power 1
Ember Evaluation Kit User’s Guide 120-0047-000C Final Page 98
Page 99

Appendix D: Ember Serial Command Set Reference Responses
status
Queries a specified node for its channel and power settings. (Abbreviation: none available)
Parameters
Single integer consisting of a local ID
Example
status 2
Responses
Responses from Ember Serial Nodes have the same format as commands. Table D-1 lists
some sample responses. Note that a status report is printed after every reboot.
Table D-1: Sample Command Responses
Response Meaning
datagram 3 “hello device 3” Response from node 3 to a send command
unicast 3 “hello device 2” Response from node 2 to a deliver command
broadcast 3 “hello everyone” Broadcast from node 3
ping_reply 4 Ping response from node 4
local_id 2 Node 2 reporting its local ID
device 2 on channel 12 at power 0 Status report for node 2
Error Messages
All error messages except for delivery errors consist of the word “error,” a two-digit
hexadecimal number giving the type of error, and a single parameter consisting of an ASCII
string:
error hex_error_num string
Table D-2 lists all possible error messages.
Ember Evaluation Kit User’s Guide 120-0047-000C Final Page 99
Page 100

Appendix D: Ember Serial Command Set Reference Error Messages
Table D-2: Serial Command Set Error Messages
Message Meaning
error 01 “serial port error” The serial port detected an error, such as a parity error
(if enabled) or a garbled byte. If you receive this
message, check cables.
error 02 “command processor busy” Commands were sent too fast for the processor.
error 03 “no such command” A command contained one or more of the following
mistakes:
z Command was mistyped.
Example: sned
z Out-of-range value was specified.
Example:
set_power 4
error 04 “incorrect command
arguments”
Illegal parameters were appended to a command.
Example:
broadcast 3 “hello all”
error 05 “integer argument out of
range”
Out-of-range value was specified for command.
Example:
send 1000 “hello”, for a 5-node network
error 06, “argument syntax error” Illegal value was specified for a numeric parameter.
Examples: 2.2, O
error 07, “message too long” String/binary parameter exceeded 80 characters or
bytes.
Example:
send 3 “on and on and ...”
error 08 “missing binary message
terminator”
Binary parameter to a command does not end with a
closing square bracket (“]”).
error 09, “broken connection” Gateway node could not reach the device specified in
command.
error 0A, “outgoing message
Message queue for the specified node is full.
pipeline full” NUM
(where NUM is a device ID)
Ember Evaluation Kit User’s Guide 120-0047-000C Final Page 100
 Loading...