

Page 1

Henson Perimeter User Manual
© 2017 Elektron Technology
Page 2

Henson 9000
© 2017 Elekt ron T ec hno logy
All rights reserved. No parts of this work may be reproduced in any form or by any means - graphic,
electronic, or mechanical, including photocopying, recording, taping, or information storage and retrieval
systems - without the written permission of the publisher.
Products that are referred to in this document may be either trademarks and/or registered trademarks
of the respective owners. The publisher and the author make no claim to these trademarks.
While every precaution has been taken in the preparation of this document, the publisher and the author
assume no responsibility for errors or omissions, or for damages resulting from the use of information
contained in this document or from the use of programs and source code that may accompany it. In no
event shall the publisher and the author be liable for any loss of profit or any other commercial damage
caused or alleged to have been caused directly or indirectly by this document.
Printed: April 2017
The Henson 9000 is manufactured in the United Kingdom by
Elektron Technology UK Ltd.
Broers Building
J.J. Thompson Avenue
Cambridge
Cambridgeshire
CB3 0FA
Tel : 01803 407 700
Fax : 01803 407 724
Email: info@elektron-healthcare.com
at our manufacturing site in Torquay.
Elektron Technology
Woodland road
Torquay
Devon
TQ2 7AY
Page 3

Table of Contents
3Cont ent s
Part I
............................................................................................................... 81 Ele ktro n co mp a ny no tice s
............................................................................................................... 92 Impo rta nt w arnin gs
............................................................................................................... 103 Re visio n hist ory
............................................................................................................... 124 He lp /Man ua l info rma tion
............................................................................................................... 135 Ackn ow led ge me nt s
Part II
............................................................................................................... 151 Sin gle s timu lu s te st
............................................................................................................... 162 Multip le s timulus te s t
............................................................................................................... 173 ZATA th e s hold t es t
............................................................................................................... 184 Drive rs te st
Part III
............................................................................................................... 201 Sup ra -th re sh old te st s
............................................................................................................... 392 Za ta t hres ho ld te st
Welcome
Quick start
Visual field tests
Presenting and selecting different multiple stimulus
patterns
7
14
19
21Multiple stimulus
23Patient instructions
24
25Missed stimuli in multiple stimulus suprathreshold test
26Single stimulus
28Patient instructions
29Setting the test intensity
31Single stimulus algorithm
32Multiple Stimulus algorithm
33Test status indicator
34Extending the test
35Adding and correcting presentations
36Changing the supra-threshold increment
37Analysing the results
38Toolbar
41Blind spot
42Fovea measurement
43Global Indices
44Mean Defect
45Standard Deviation
46Hemifield Test
47Outputs
48Threshold
49Gray Scale
50Defect
51Pattern defect
53Print Out
54Progression: Rate of change
© 2017 Elektron Technology
Page 4

Henson P erimet er User Manual4
............................................................................................................... 643 Drive rs te sts
56GSS2
58Printing
59Patient instructions
60Stimulus locations
61Using existing patient details
63ZATA toolbar
65Patient Instructions
66Options
67Stimulus locations
Part IV
............................................................................................................... 711 P re pa ring t h e p atie nt
............................................................................................................... 752 Aut o t imin g
............................................................................................................... 763 C atch Tria ls
............................................................................................................... 774 C han ging e yes
............................................................................................................... 785 De mon stra tin g the t es t
............................................................................................................... 796 En te rin g t he p atie nt's da te o f b irth
............................................................................................................... 807 Fixa tio n t arg e ts
............................................................................................................... 818 He lp fa cilit y
............................................................................................................... 829 P rint ing th e re sults o f a fie ld te s t
............................................................................................................... 8410 Re spo ns e bu tto n
............................................................................................................... 8511 Sa ving visu al fie ld d ata
............................................................................................................... 8712 Vid eo ca me ra
Part V
............................................................................................................... 891 Add re ss
............................................................................................................... 902 Te s ts
............................................................................................................... 913 C omp ute r
............................................................................................................... 924 Da ta ba se
............................................................................................................... 945 Ba ckup
............................................................................................................... 966 Vid eo Se tup
............................................................................................................... 977 Int eg ra tio n
............................................................................................................... 988 P DF
............................................................................................................... 999 Sa ve /C ance l
General information
Options program
68
72Aligning the patient
73Patient Instructions
74Refractive correction
88
Part VI
............................................................................................................... 10 31 Ba cku p co py of th e da ta ba s e
............................................................................................................... 10 42 Cha nging th e a ctive d ata ba se
............................................................................................................... 10 53 De le ting a re co rd from t he d ata ba se
............................................................................................................... 10 64 Ed itin g d ata in th e da ta ba se
............................................................................................................... 10 75 Find ing a re co rd in th e d a ta ba se
Database program
100
© 2017 Elektron Technology
Page 5

............................................................................................................... 10 86 Mo vin g t hro ug h t he d ata ba se
............................................................................................................... 10 97 Ima ge file s
............................................................................................................... 11 08 Prin tin g a da tab as e re co rd
............................................................................................................... 11 19 Sa vin g re co rd s in d a ta ba se
............................................................................................................... 11 210 P ro gre ss io n An alysis
............................................................................................................... 11 811 Imp ort from s pre ad sh ee t
5Cont ent s
113Progression Screen
115Glaucoma Staging System: GSS II
117Printing
Part VII
............................................................................................................... 12 01 Op en ing a n e xis t ing vis ual fie ld d ata ba se
............................................................................................................... 12 12 Cre a tin g a n ew vis ua l fie ld d ata ba se
............................................................................................................... 12 23 Cop ying a vis ual fie ld d ata ba se
............................................................................................................... 12 34 De le ting a re co rd
............................................................................................................... 12 45 Me rg ing d ata ba se s
............................................................................................................... 12 56 Tra ns fe rring re co rd s b e tw e en da ta ba se s
............................................................................................................... 12 67 Imp orting d ata fro m a He ns on 5/60 00 Da ta ba se
Part VIII
Utilities program
Appendix 1 - 9000 Technical
specifi cation
Part IX
Appendix 2 - 9000
Connection details
Part X
Part XI
Appendix 3 - Instal lation
Appendix 4 - Maintenance
and warranty
............................................................................................................... 13 51 Reg ular ins pe ctio n an d ma int ena nce
............................................................................................................... 13 92 Up grad in g t he s oftw a re
............................................................................................................... 14 03 Cle an in g
............................................................................................................... 14 14 Preve nta tive main t en ance
............................................................................................................... 14 25 Rep la ce me nt pa rts
............................................................................................................... 14 36 Rep airs a nd re ca libra tio n
............................................................................................................... 14 47 Wa rra nty
119
127
130
131
134
Part XII
............................................................................................................... 14 61 Ba ckg ro und o ut of to le ra nce
............................................................................................................... 14 72 Bow l e rro r
............................................................................................................... 14 83 LE D e rro r
............................................................................................................... 14 94 Chinre st
............................................................................................................... 15 05 Key vio la tio n
............................................................................................................... 15 16 Dat ab as e e rro rs
© 2017 Elektron Technology
Appendix 5 - Troubleshooting
145
152Test Not recognised
Page 6

Henson P erimet er User Manual6
153Database Backup not available
Part XIII
Part XIV
Part XV
Appendix 6 - License file
Appendix 7 - Networking
Appendix 8 - Practice
management Integration
Index
154
155
156
159
© 2017 Elektron Technology
Page 7

7Welcome
To find out more about the Henson range of perimeters visit:
http://www.elektron-healthcare.com
or scan the QR code opposite.
1
Welcome
Henson 9000 Perimeter
© 2017 Elektron Technology
Page 8

8
Henson Perimeter User Manual
1. 1
Elekt ron company not ic es
The Henson 9000 is manufactured in the United Kingdom by
Elektron Technology Uk Ltd.,
Broers Building,
J.J. Thompson Avenue,
Cambridge.
CB3 0FA
The Henson unit must be used in accordance with the operating instructions.
Please read the instructions before attempting operation.
The instructions in this guide are to be view ed as an accompaniment to correct
training on this equipment.
Contact your sales agent for details of on-site training or contact the
manufacturer for details of training videos and webinar training sessions.
The results of a test are only to be analysed by a suitable qualified person, and
it is the responsibility of the practice manager/owner to ensure that only
suitably trained personnel are operating this equipment.
The only warranties for Elektron Technology UK Ltd. products and services are
set forth in the express warranty statements accompanying such products and
services. Nothing herein should be construed as constituting an additional
warranty.
This symbol on the product or on its packaging indicates that to
preserve the environment, this product must be recycled after its useful life as
required by law and must not be disposed of with your household or
commercial waste. It is your responsibility to dispose of your waste electrical
and electronic equipment by handing it over to a designated collection point for
the proper recycling of such equipment. The separate collection and recycling of
your waste equipment at the time of disposal will help to conserve natural
resources and ensure that it is recycled in a manner that protects human
health and the environment. For more information about the authorized
collection location nearest to you, please contact your local city office, your
household waste disposal service or the agent from whom you purchased the
product.
© 2017 Elektron Technology
Page 9
9Welcome
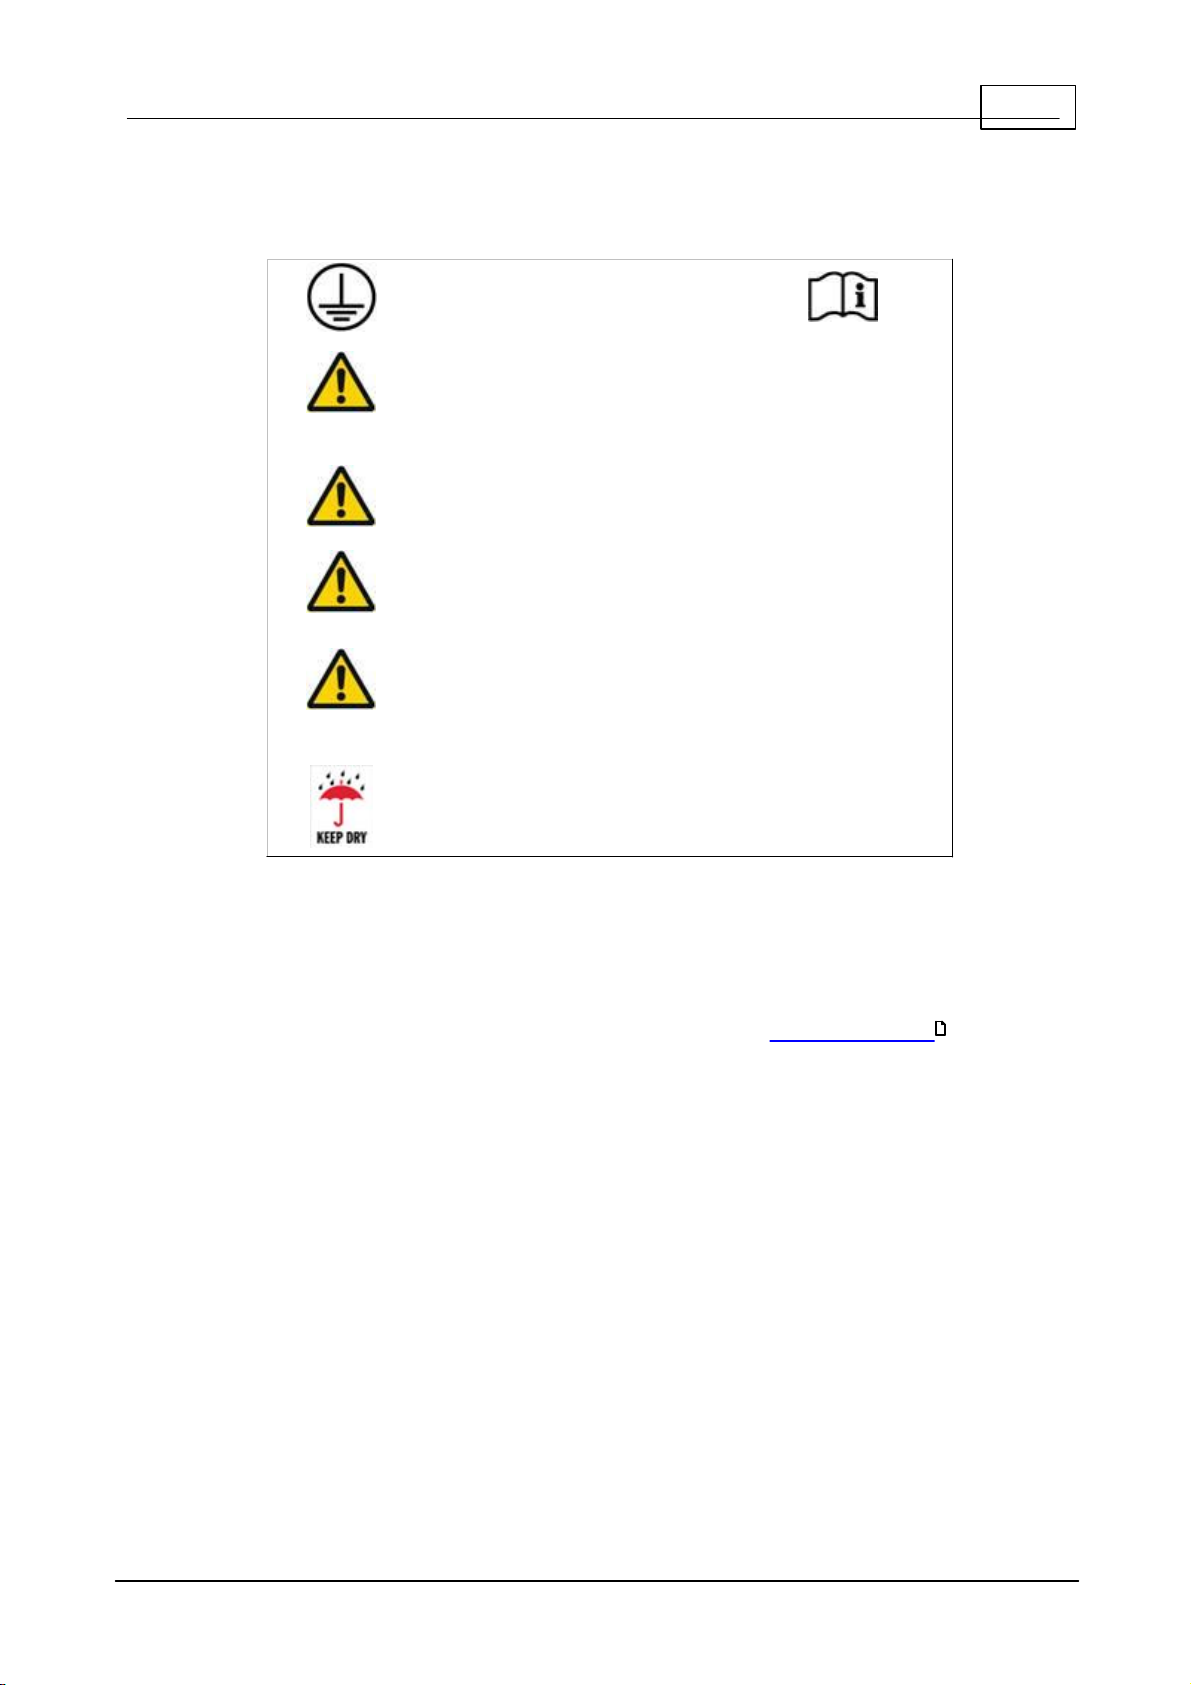
This unit must be
connected to an earthed
mains supply
Hazardous voltages are
present inside this unit.
No user-serviceable parts
inside
No modification of this
equipment is allow ed
This equipment is not
suitable for use in an
oxygen rich environment
The instrument is not
suitable for operation in
environments where
handling of fluids is
normal use.
This equipment should be
kept dry at all times
1. 2
Important warnings
Backing up your data
It is strongly recommended that you regularly back up the database of patient
records on a USB memory stick, or other suitable removable media, to avoid
any possibility of data loss.
This simple procedure is described later in this manual in Database Backup .
103
Allergy advice
The chin and head rest pads are made from a low allergy Silicone, but you
should check with the patient that the do not have an allergy to silicone before
allowing them to touch the Henson.
© 2017 Elektron Technology
Page 10
10
Re lease
Dat e
Chan ge
Version 1.0
30/08/13
New version for V2.0 software
Version 1.1
May 2014
For version 2.1 onwards software
Version 1.2
July 2014
Additional Installation Information
added
Version 1.4
May 2015
Changes to patient instructions in
the first person. Additional
formatting changes and
corrections.
Version 1.5
Novembe
r 2015
Added Progression information to
coincide with Version 3.4
Software release
Version 1.6
April
2017
Changes for Version 3.5 Softw are
release - addition of integration,
changes to Database images,
additional language support.
Henson Perimeter User Manual
1. 3
Revision history
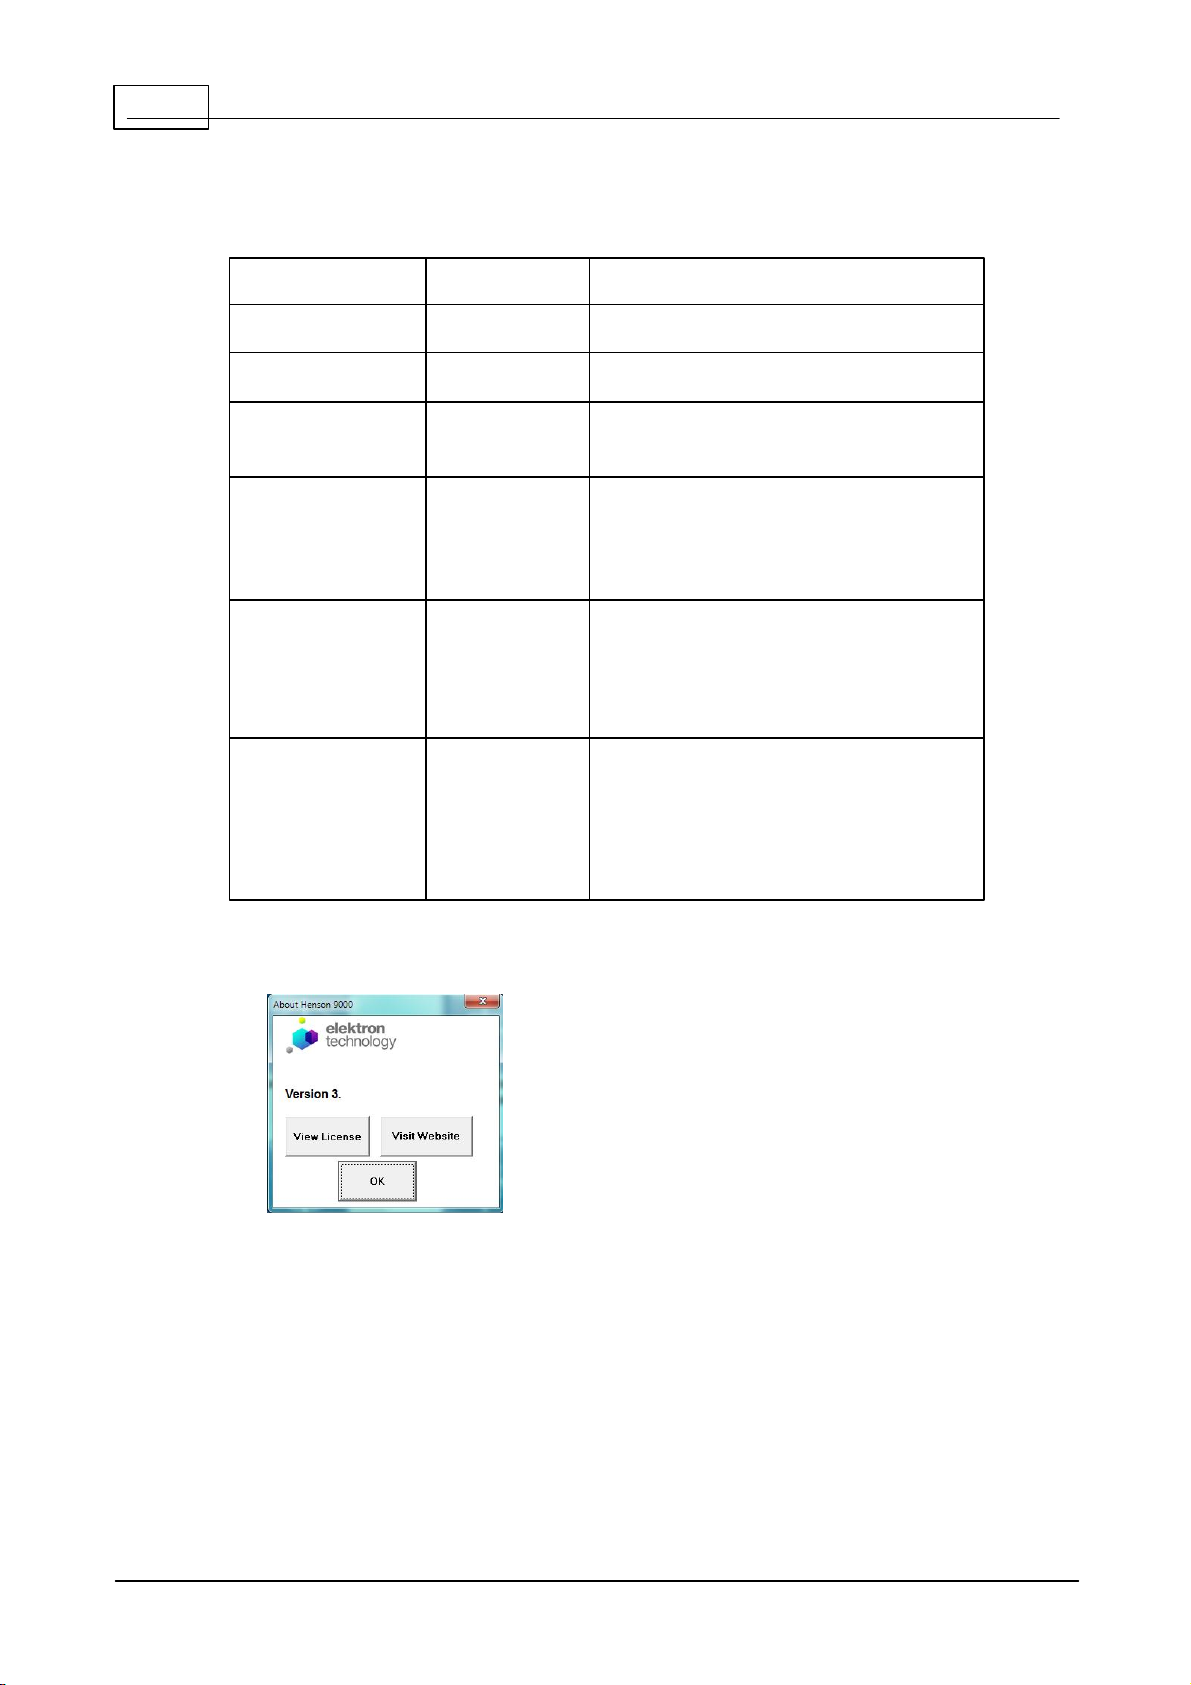
To determine the version of installed software, click ABOUT on the main menu.
Info rma t io n fo r th e Ve rs io n 3 .5 re le as e
The release version of softw are called 3.5 contains some important changes to
the way the softw are operates. These may not affect your operation of the
instrument if you do not use the database or have any practice management
integration, but it is important that you understand them if you do.
The previous versions of the software stored a PDF copy of the printout
alongside the database in an images folder and this has now changed to a
jpeg picture file. The database will operate in the same way as before except
that the 2 eyes plots (threshold tests) are shown on different tabs.
The quality of the jpeg picture file can be set in the options program.
© 2017 Elektron Technology
Page 11

If you currently use the PDF file for another reason, and the Jpeg file cannot be
substituted then an additional PDF file can still be created when saving. The
location for this can be set in the options program (PDF tab )
98
11Welcome
© 2017 Elektron Technology
Page 12
12
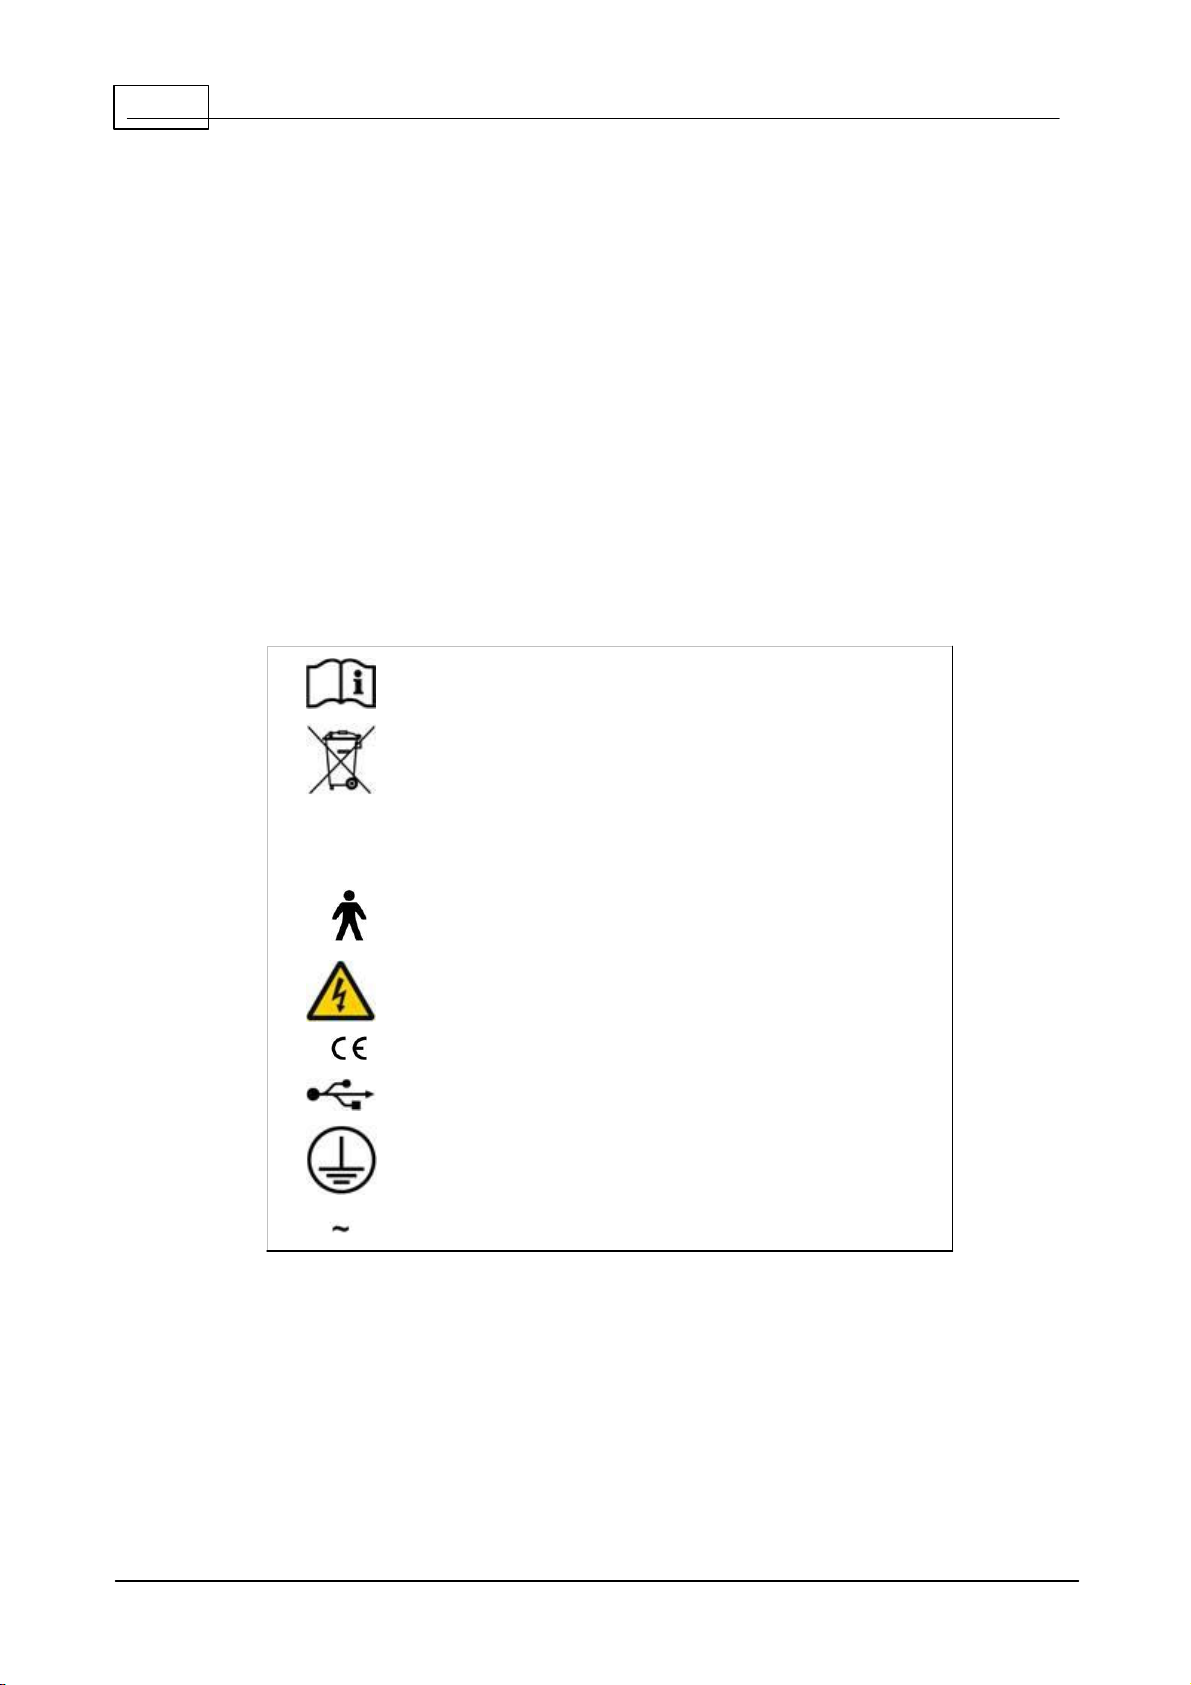
Consult manual
WEEE Directive
0
1
Power Off (0)
Power On (1)
Type B Applied Part
Hazardous voltage
CE mark
USB
Protective earth
AC Mains
Henson Perimeter User Manual
1. 4
Help/Manual informat ion
Many of the images in this manual have 'hot spots'. If you place the cursor over
one of these and click then you will jump to a new page giving further
information on a topic.
Some of the screen shots in this manual may differ slightly from the software
installed on your machine.
The information contained in this manual is subject to change without notice.
All rights reserved. Reproduction, translation, or adaptation of this manual
without prior written permission of Elektron Technology UK Ltd. is prohibited,
except as allowed under copyright laws.
Elektron Technology UK Ltd. shall not be liable for technical or editorial errors or
omissions contained herein.
The following symbols are used in the manual and on the instrument.
© 2017 Elektron Technology
Page 13

13Welcome
1. 5
Ac knowle dgement s
Microsoft, Windows, Windows 7 and Windows 8 and Windows 10 are
registered trademarks of Microsoft Corporation.
Adobe and Acrobat (R) reader(R) are registered trademarks of Adobe systems.
© 2017 Elektron Technology
Page 14
14
Henson Perimeter User Manual
2
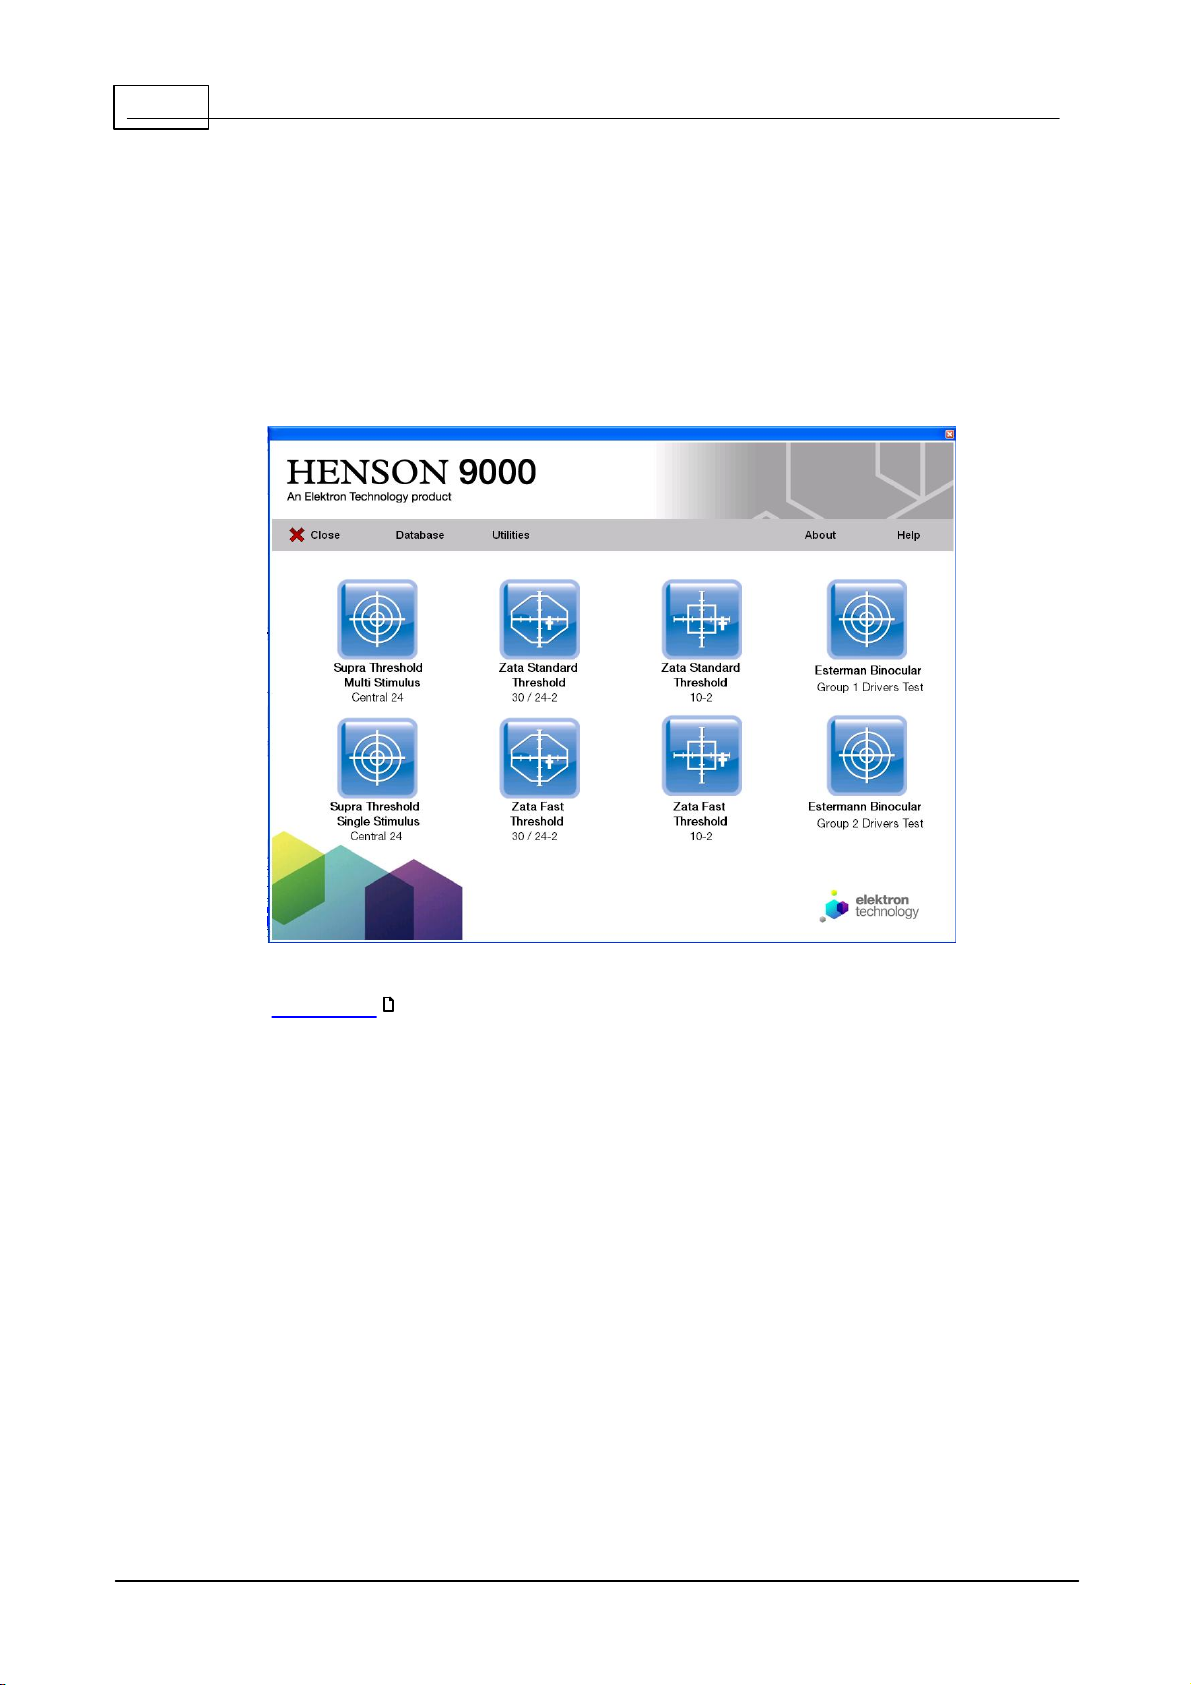
Quick start
To start a visual field test or one of the menu bar items click over that item on
the start-up screen.
To g et mo re h e lp o n a n ite m in th e s ta rt-u p s cre e n click th at ite m o n th e im a g e
b elo w .
See Appendix 3 for installing and setting up the software.
131
© 2017 Elektron Technology
Page 15
15Quick start
2. 1
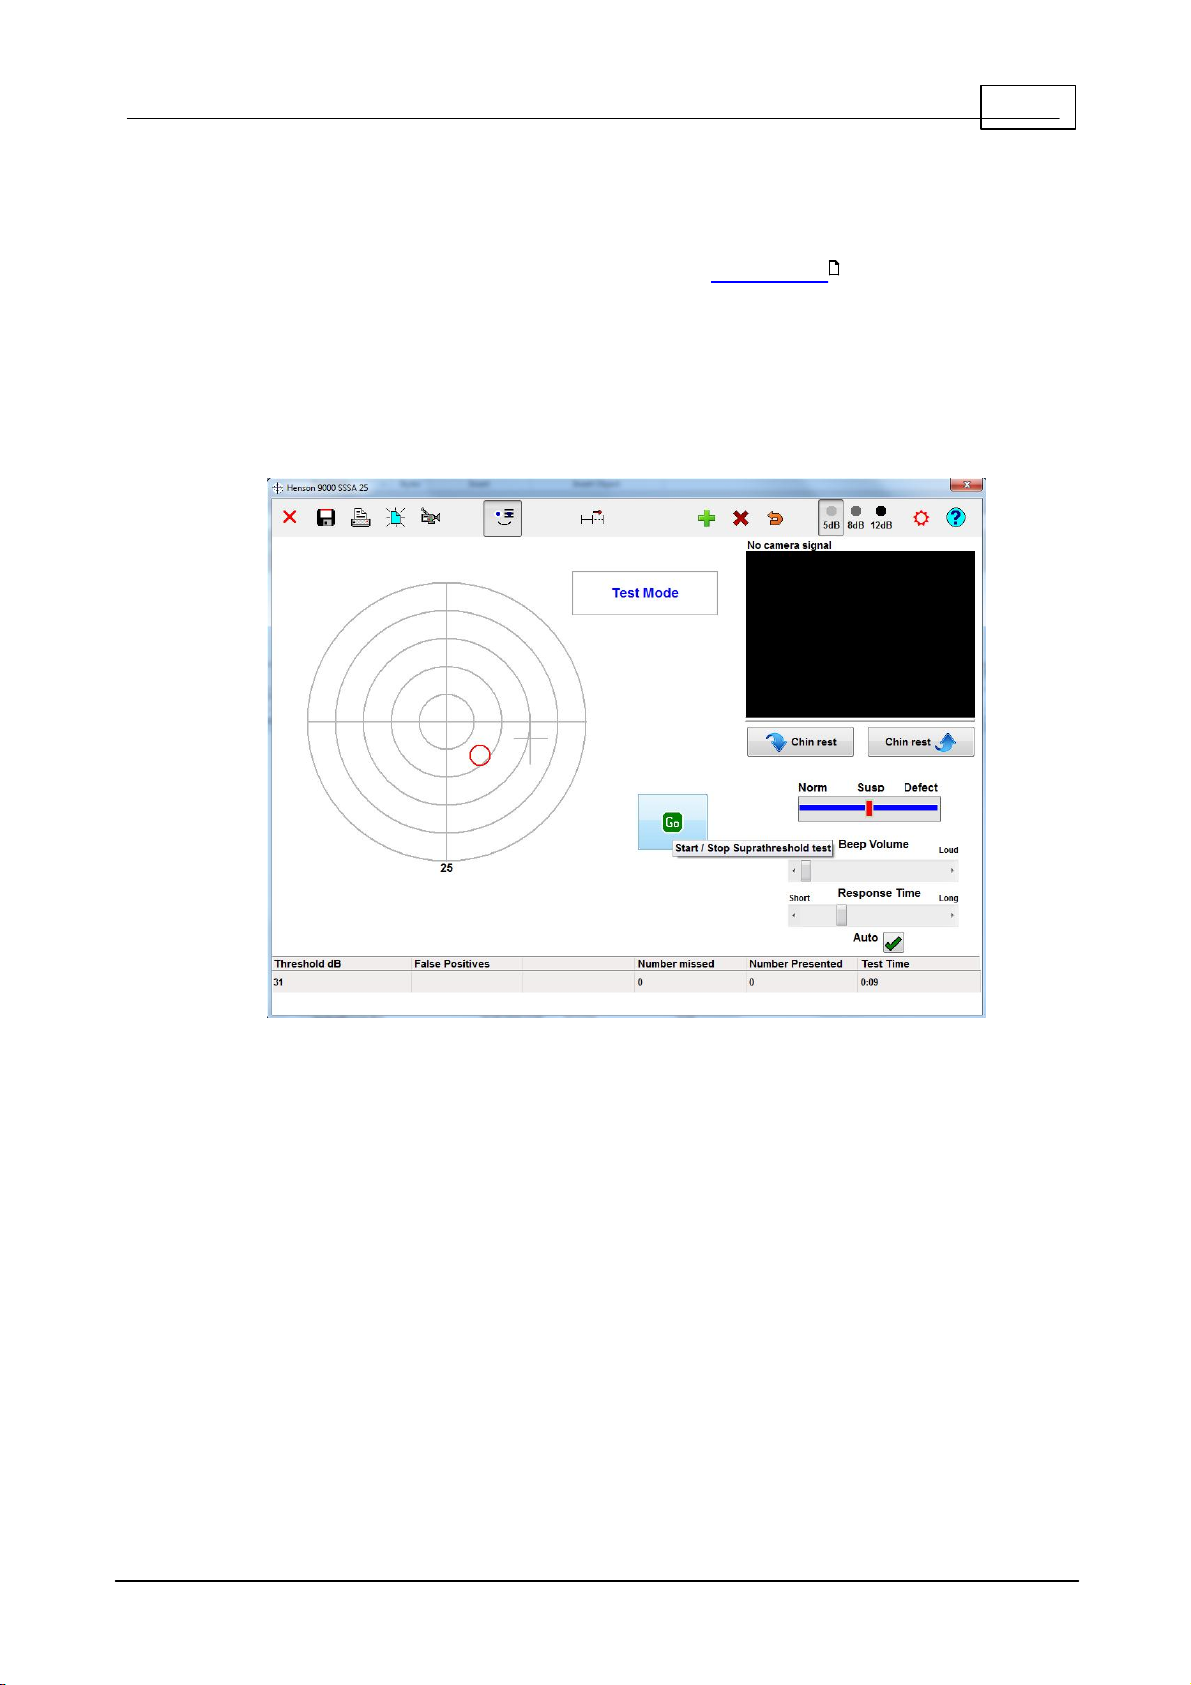
Single s timulus test
After selecting the test, and entering the patient's date of birth you will be
presented with the Single stimulus supra-threshold test screen below.
79
To g et mo re h e lp o n a te s t s cre e n ite m click o ve r th e it em in th e ima g e b elo w .
© 2017 Elektron Technology
Page 16
16
Henson Perimeter User Manual
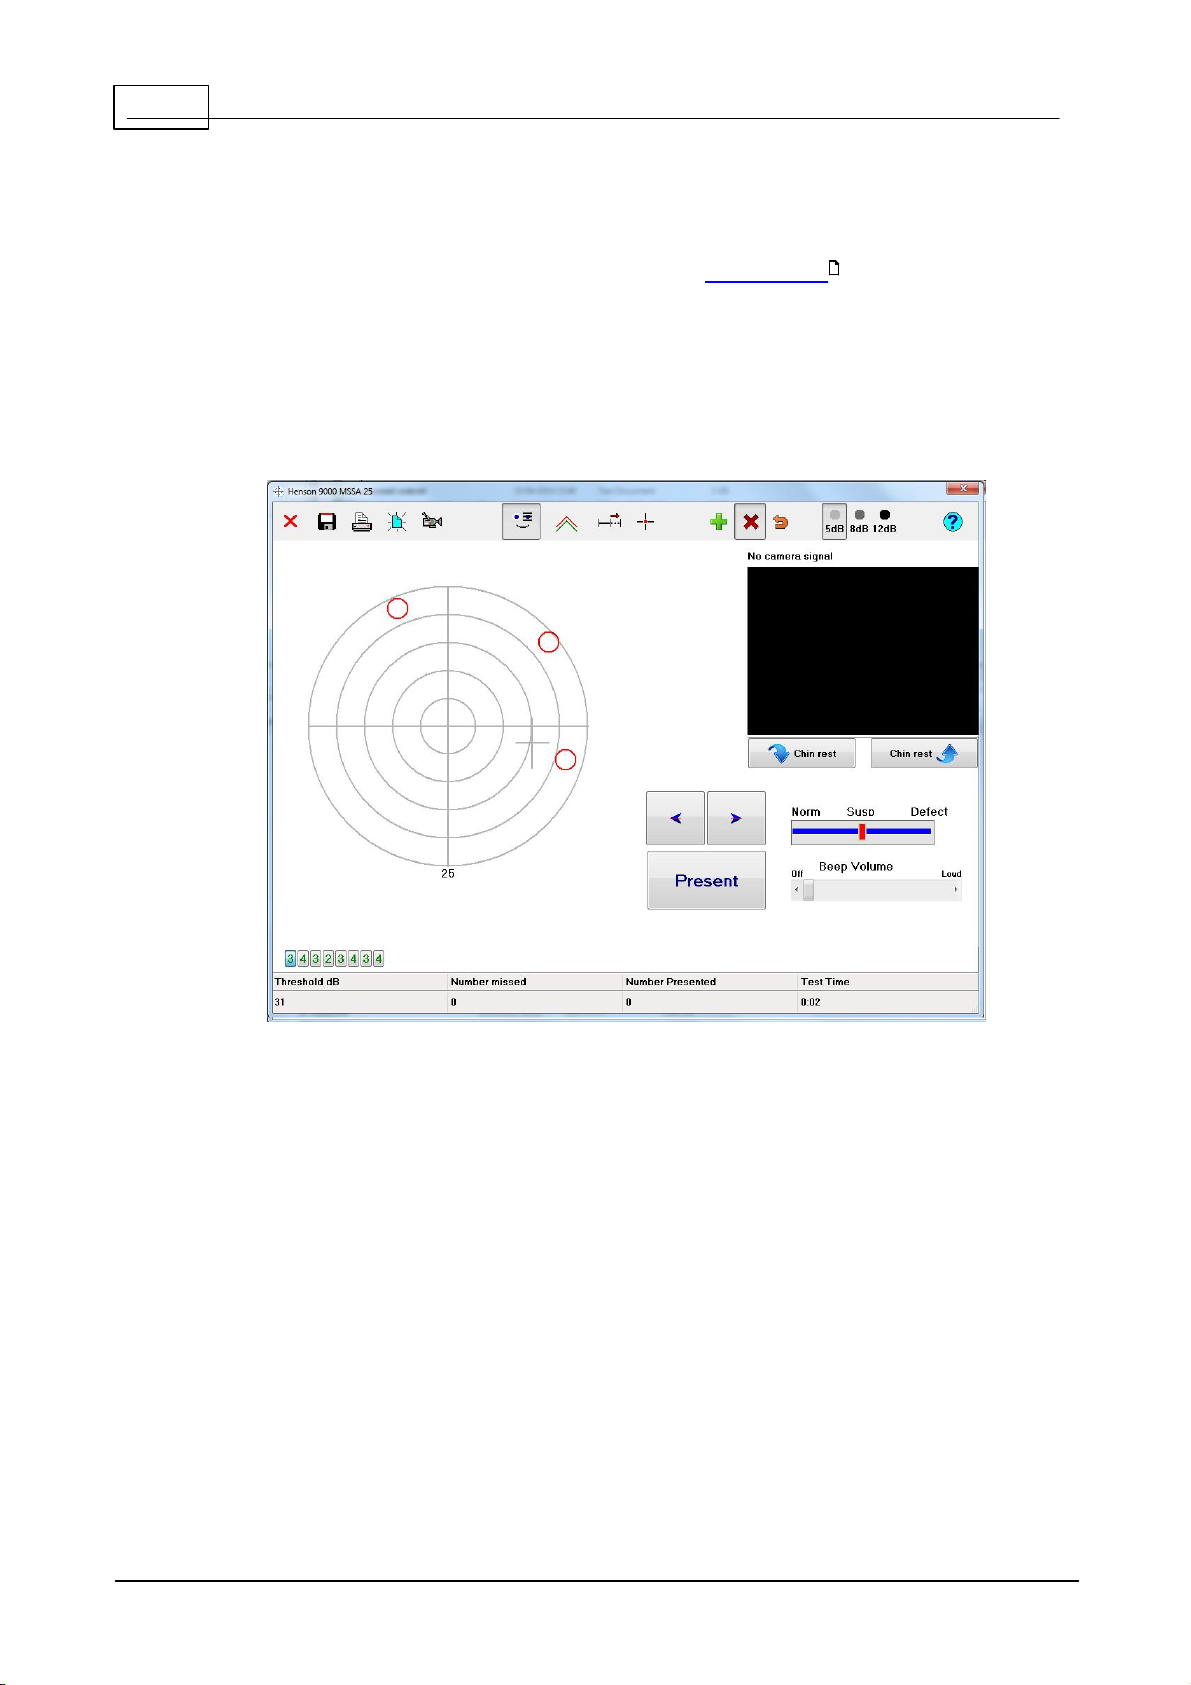
2. 2
Mult iple stimulus test
After selecting the test, and entering the patient's date of birth you will be
presented with the Multiple stimulus supra-threshold test screen below.
79
To g et mo re h e lp o n a te s t s cre e n ite m click o ve r th e it em in th e ima g e b elo w .
© 2017 Elektron Technology
Page 17
17Quick start
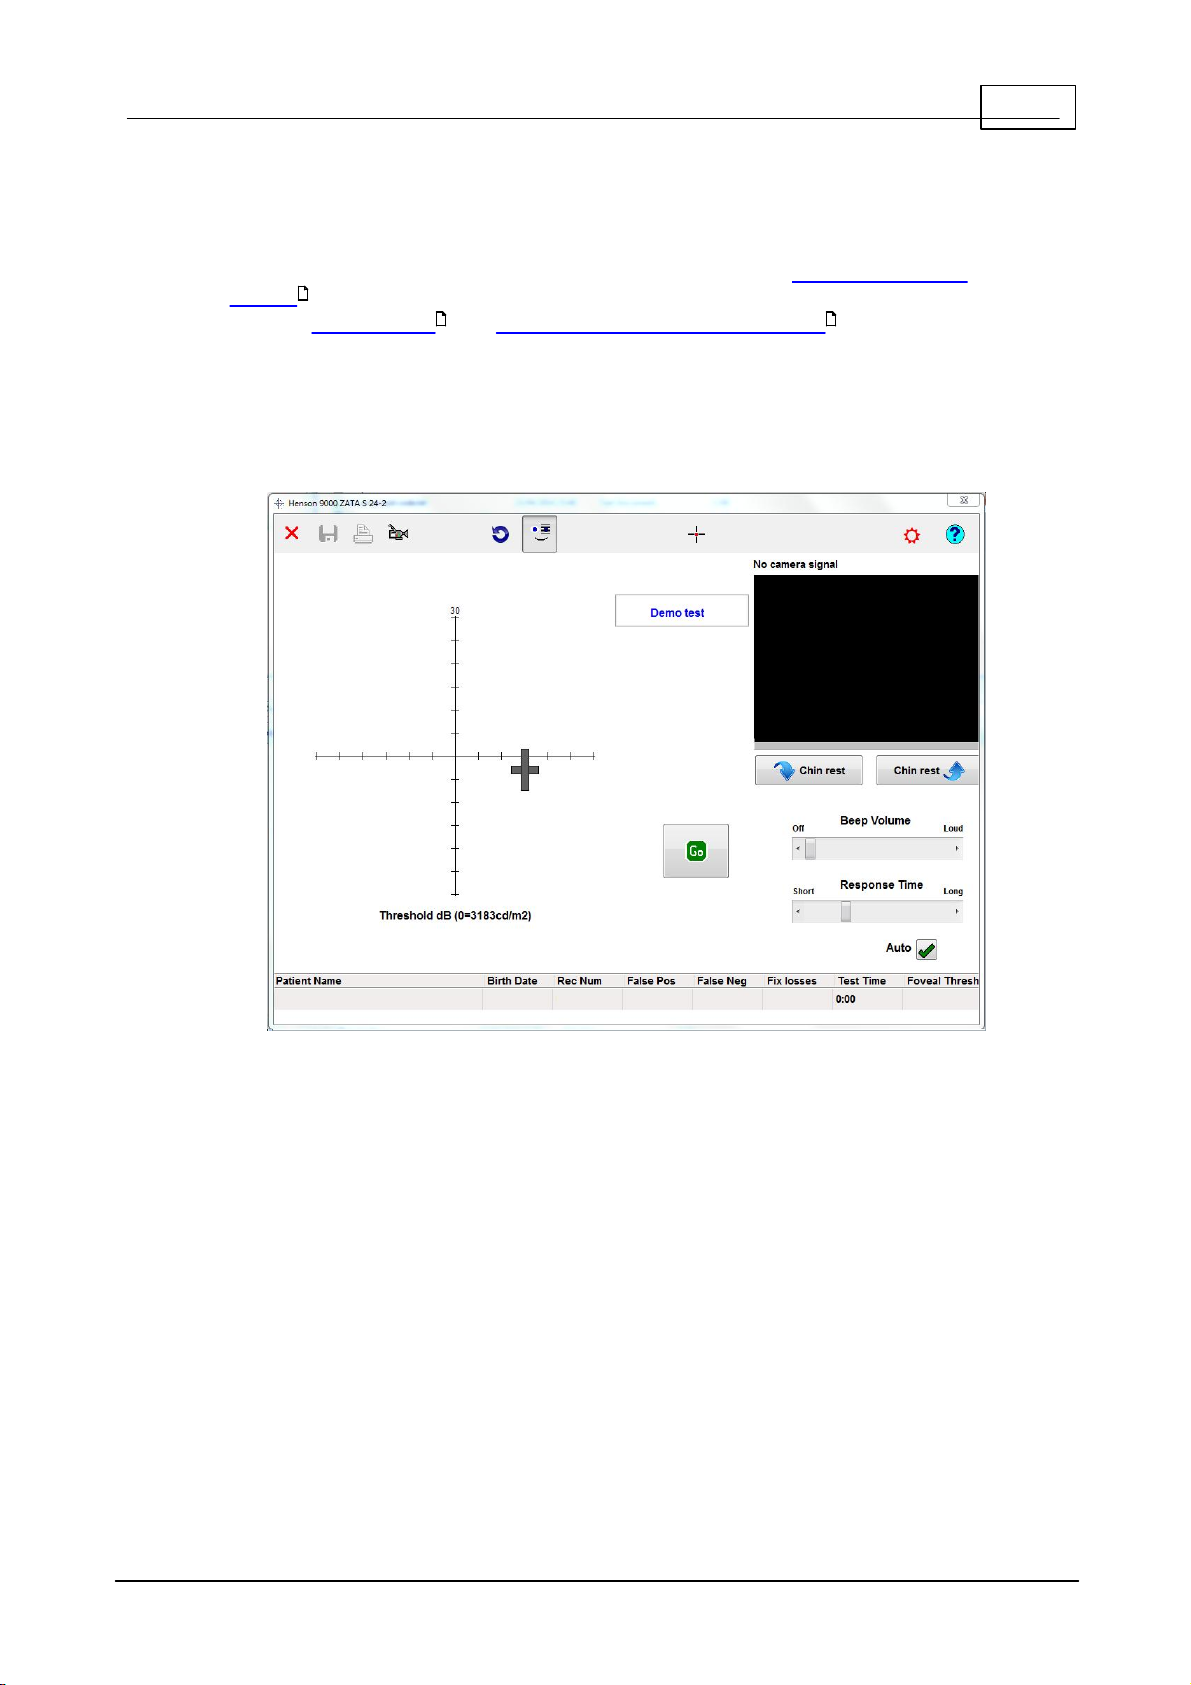
2. 3
ZAT A theshold tes t
After selecting the test, you will be asked whether this is a new or an existing
patient . Depending on your response you will then either need to enter the
patient's date of birth or select a patient from the database . Once this
61
79 61
has been done you will be presented with the ZATA test screen below.
To g et mo re h e lp o n a te s t s cre e n ite m click o ve r th e it em in th e ima g e b elo w .
© 2017 Elektron Technology
Page 18
18
Henson Perimeter User Manual
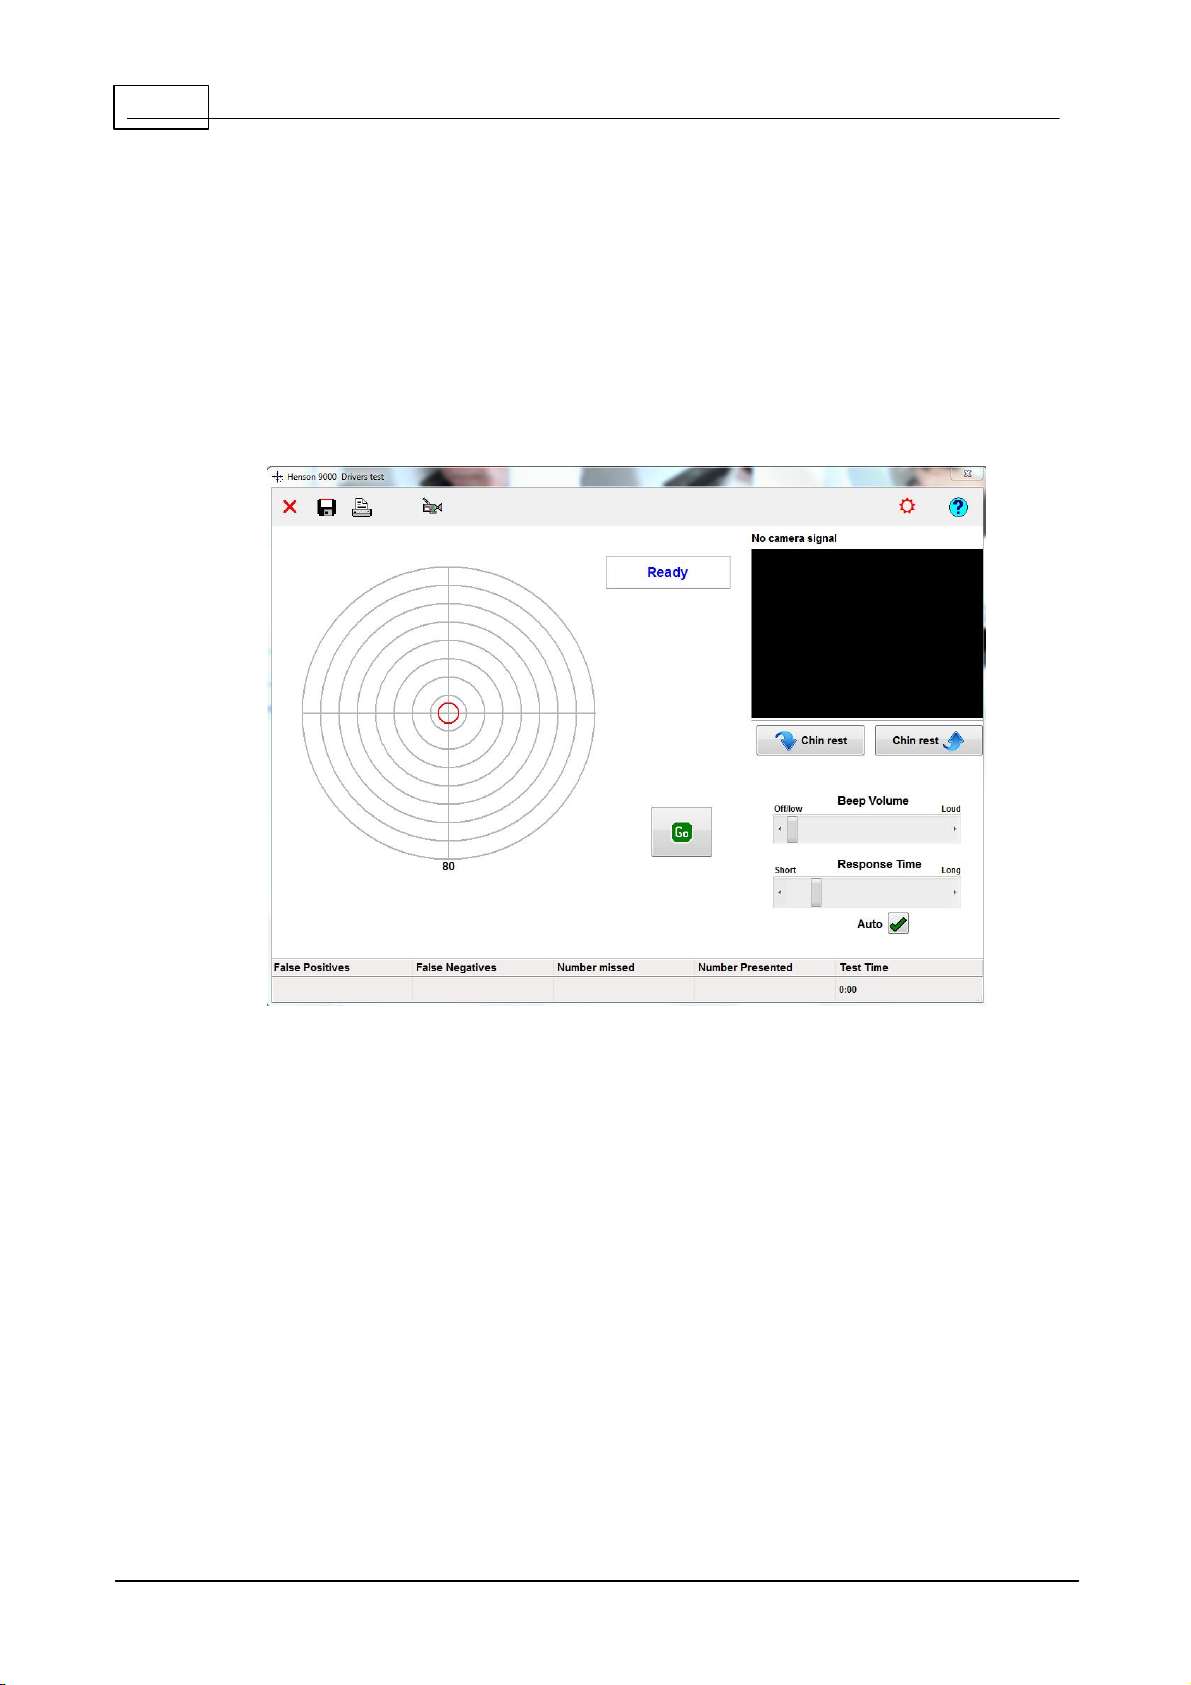
2. 4
Driv ers test
After selecting a Drivers test you will be presented with the Drivers test screen
below .
To obtain more help on a test screen item click over the item in the image
below .
© 2017 Elektron Technology
Page 19

19Visual field tests
3
Visual field tests
The following visual field tests are available with the Henson 9000:
Multiple Stimulus Supra-Threshold : Choose this if speed is
21
important. It is approximately twice as fast as the Single Stimulus suprathreshold strategy in patients with little or no defect. This is a SemiAutomated test.
Single Stimulus Supra-Thresho ld : Choose this test to
26
screen large numbers of patients. This is a fully automated test where
the patient presses a response button every time they see a
84
stimulus.
ZATA (Zippy Adaptive Threshold Algorithm): This strategy replaces
39
the classic Full threshold algorithm. It is much faster than the Full and
Fast Threshold programs and will normally be the program of choice for
monitoring visual field loss. The ZATA program uses a Bayesian algorithm
and adaptive terminating criteria to make the best use of prior data. This
is a fully automated test where the patient presses a response button
84
every time they see a stimulus.
Drivers : The Drivers Test program is designed to see whether or
64
not a patient meets the UK DVLA visual field requirements for Group 1
and Group 2 driving. Again, this is a fully automated test where the
patient presses a response button every time they see a stimulus.
84
© 2017 Elektron Technology
Page 20
20
Henson Perimeter User Manual
3. 1
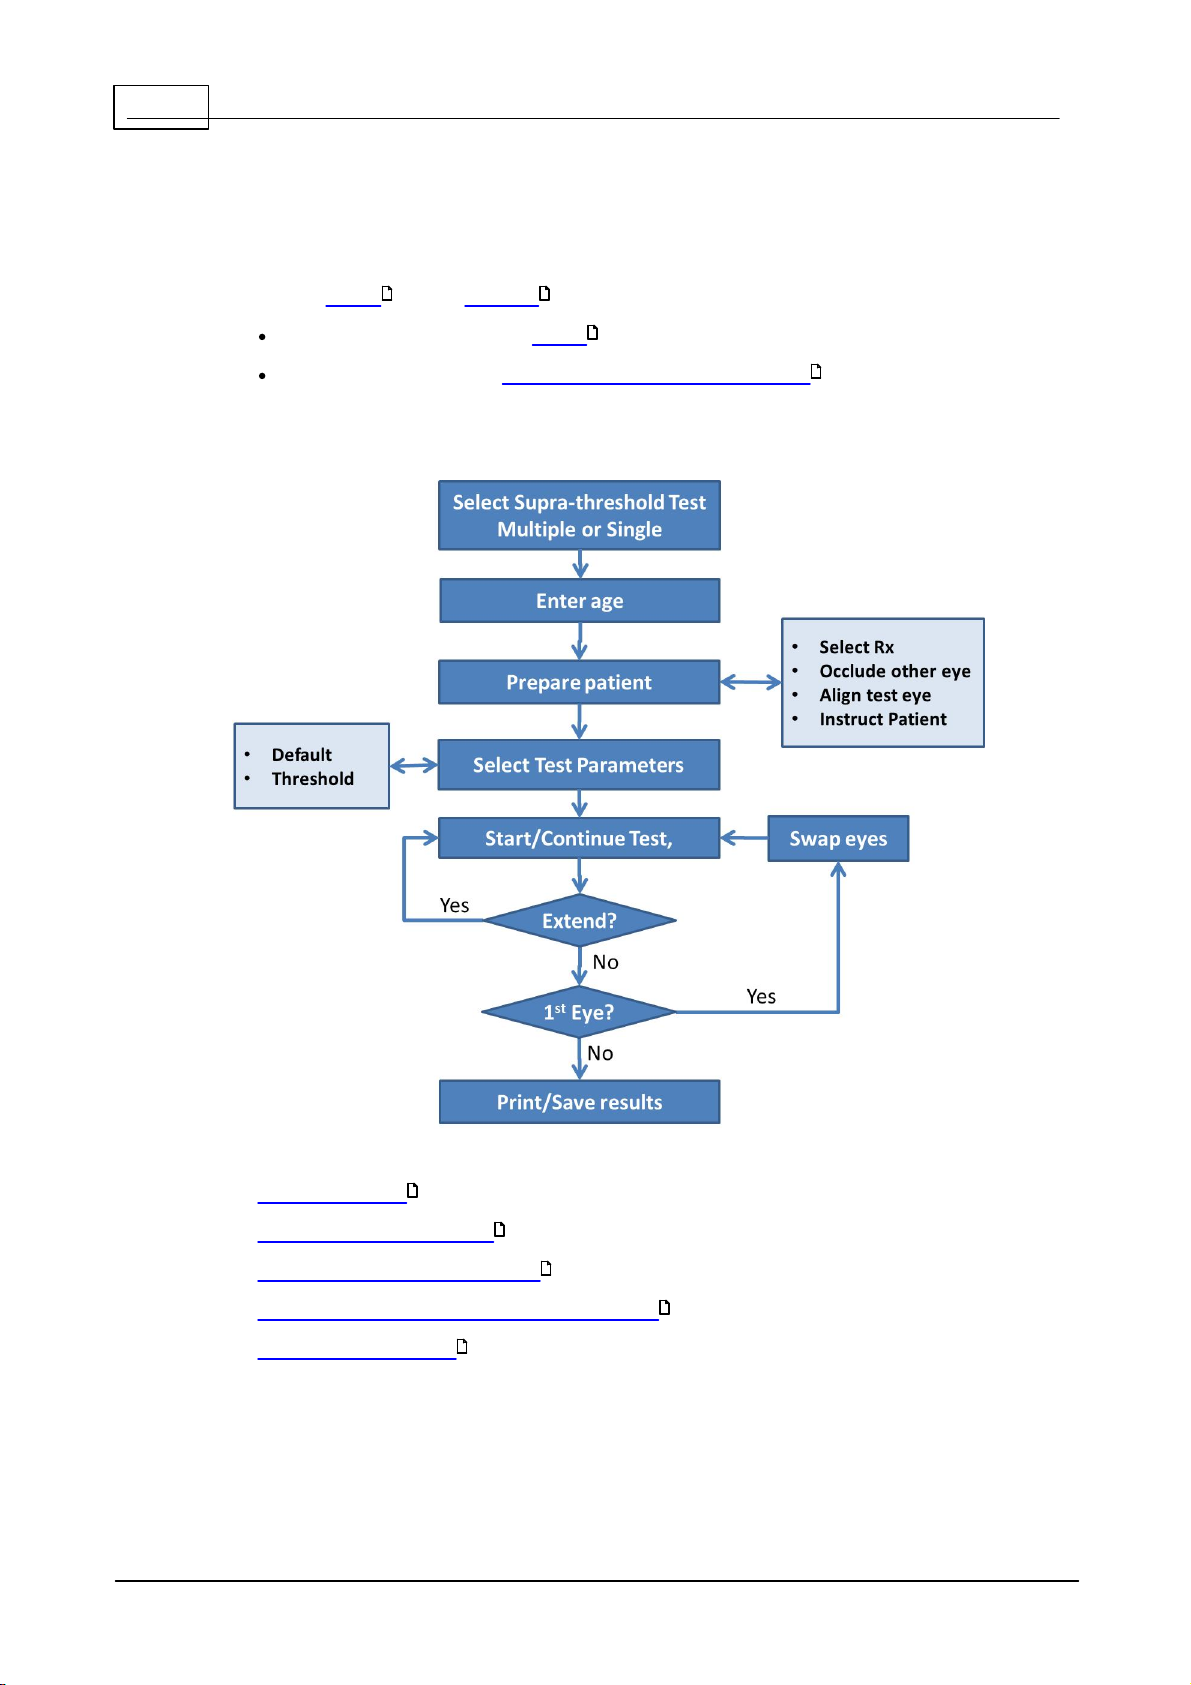
Supra- threshold t est s
There are two different supra-threshold tests provided with the Henson 9000
software, single and multiple stimulus:
Both incorporate several levels of testing.
Both can be run in an age-related or threshold-related mode.
The flow chart below gives the different stages of a supra-threshold test.
26 21
34
29
See also:
Fixation targets
Default threshold setting
Establishing the test intensity
80
29
29
Test Status indicator (single stimulus only)
Analysing the results
37
33
© 2017 Elektron Technology
Page 21
21Visual field tests
3.1.1
Mu ltip le s timulus
Multiple stimulus supra-threshold tests are used to rapidly screen the visual
field. Multiple stimulus tests are approximately twice as fast as a single stimulus
test. The multiple stimulus tests are semi-automated and require more
perimetrist involvement than the single stimulus tests. With a skilled perimetrist
this can result in more reliable results with less variability.
Each presentation is composed of a pattern of 2, 3 or 4 stimuli.
1. The patient tells the perimetrist how many stimuli they saw .
2. If they give the wrong number then the perimetrist should repeat the
presentation.
3. If on the second presentation the patient still reports the wrong
number, the perimetrist asks the patient where the stimuli they saw
were. Any missed stimuli are then marked as misses . It is often
35
useful when trying to establish which stimuli were missed to ask the
patient to report the clock hour positions of the seen stimuli.
4. If on the second presentation the patient reported the correct number
then the perimetrist should proceed to the next pattern. In this case it is
assumed that the error in the first presentation was a false one.
5. If there is some doubt, the perimetrist can re-present the pattern. There
is no limit to the number of times it can be presented.
Missed locations can be tested at higher intensity levels to quantify the
36
depth of any defect.
At the beginning of the test the threshold is determined. Stimuli are then
32
initially presented at 5dB above this threshold estimate.
The test has 3 levels , it starts testing just 26 points. It can be extended
34 34
to 68 and 136 locations.
The test can be customised with the addition of extra stimulus locations.
35
To g et mo re h e lp o n a te s t s cre e n ite m click o ve r th e it em in th e ima g e b elo w .
© 2017 Elektron Technology
Page 22
22
Henson Perimeter User Manual
© 2017 Elektron Technology
Page 23
3.1.1.1 Pa tie nt ins tructio ns
It is important that the patient understands what they need to do during the
test.
Below is a set of instructions that we have found to work well.
The eye not being tested should be occluded and the test eye must be
correctly aligned with the patient sitting comfortably.
Threshold set by age
The test is going to take about 2 minutes.
You must look at the central red light and keep your eye as still as possible
The technician is going to present patterns of 2, 3 or 4 light spots.
After each presentation he/she will ask you how many you saw.
The technician may ask you where you saw the lights.
Add when setting the threshold by measurement
23Visual field tests
To begin with the lights will be fairly bright.
They will then get dimmer and dimmer until they cannot be seen.
You should not guess. If unsure it is advisable to say "none".
© 2017 Elektron Technology
Page 24

24
Henson Perimeter User Manual
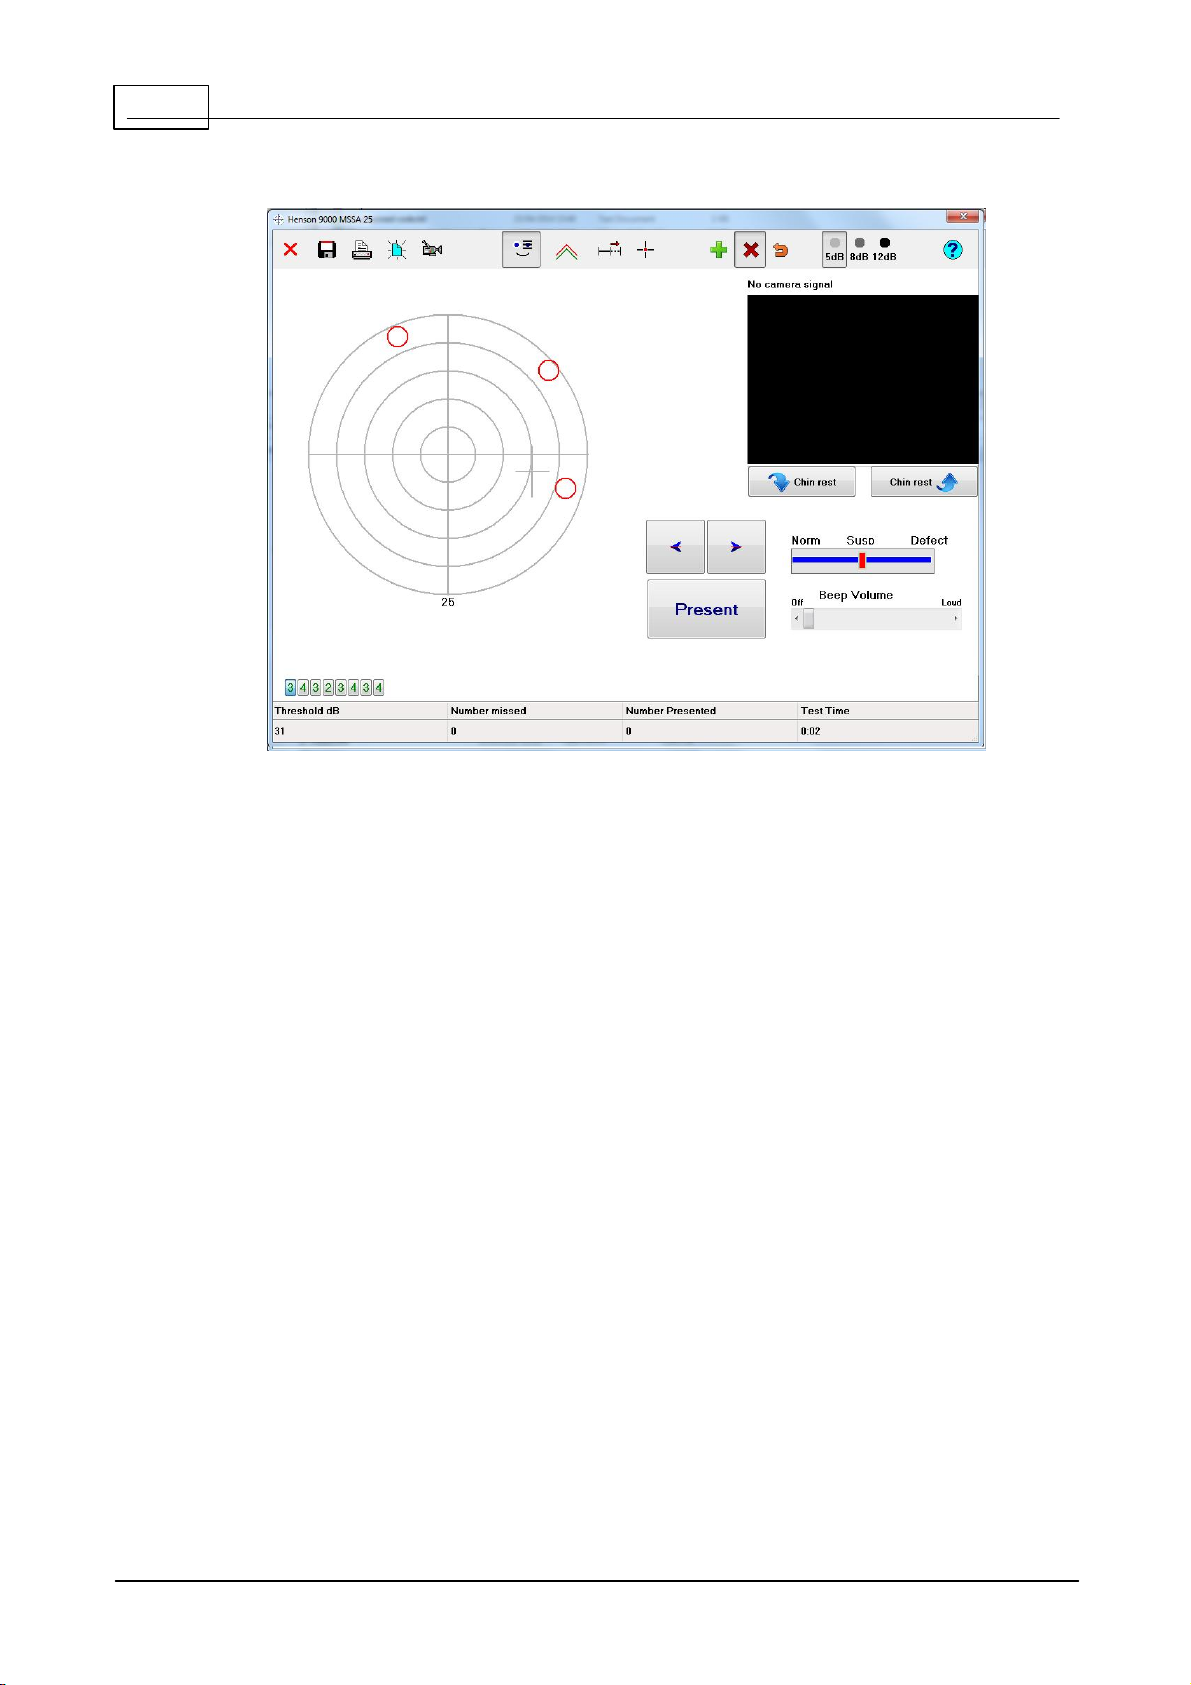
3.1.1.2 Pre se nt in g a nd s ele cting d iffere nt mu ltip le s timulus p att erns
The currently selected multiple stimulus pattern is displayed on the screen by
the red circles.
To present this pattern to the patient click Present or press the
space bar.
To go onto the next pattern click Fwd or press right arrow key on
keyboard.
To go back click Bwd or press left arrow key on keyboard.
All the patterns within the current test level are represented by a line of buttons
along the bottom of the screen:
To go to a specific pattern click the pattern button.
Each of the pattern buttons gives the number of stimuli in the pattern. This
number starts off in green and goes to black once the pattern has been
presented. If there is a missed stimulus in the selected pattern then the
number is shown in red.
When extending the test to a higher level , additional pattern buttons will
34
appear.
© 2017 Elektron Technology
Page 25
3.1.1.3 Mis se d s timuli in mu ltip le s timulus s upra thre sh old te st
It is not unusual for a patient with no visual field loss to miss the occasional
stimulus. To differentiate between these and misses due to genuine field loss,
the pattern should be presented a second time.
If the incorrect number is given twice then establish which stimuli were missed
by:
1. Asking the patient where they saw stimuli. It is often helpful at this
stage to tell the patient to consider the bow l as a clock face and to give
the hour positions of the stimuli.
2. With the Miss button selected (down) click over the location of the
missed stimulus, or click the right mouse button when the cursor is over
the missed location.
To correct mistakes (i.e. remove stimuli marked as missed) make sure the Rmv
25Visual field tests
button is selected (down) and touch or click over the mistake.
Stimuli missed at a 5dB increment should be tested at a higher intensity
level.
36
© 2017 Elektron Technology
Page 26
26
Henson Perimeter User Manual
3.1.2
Sin gle s timu lu s
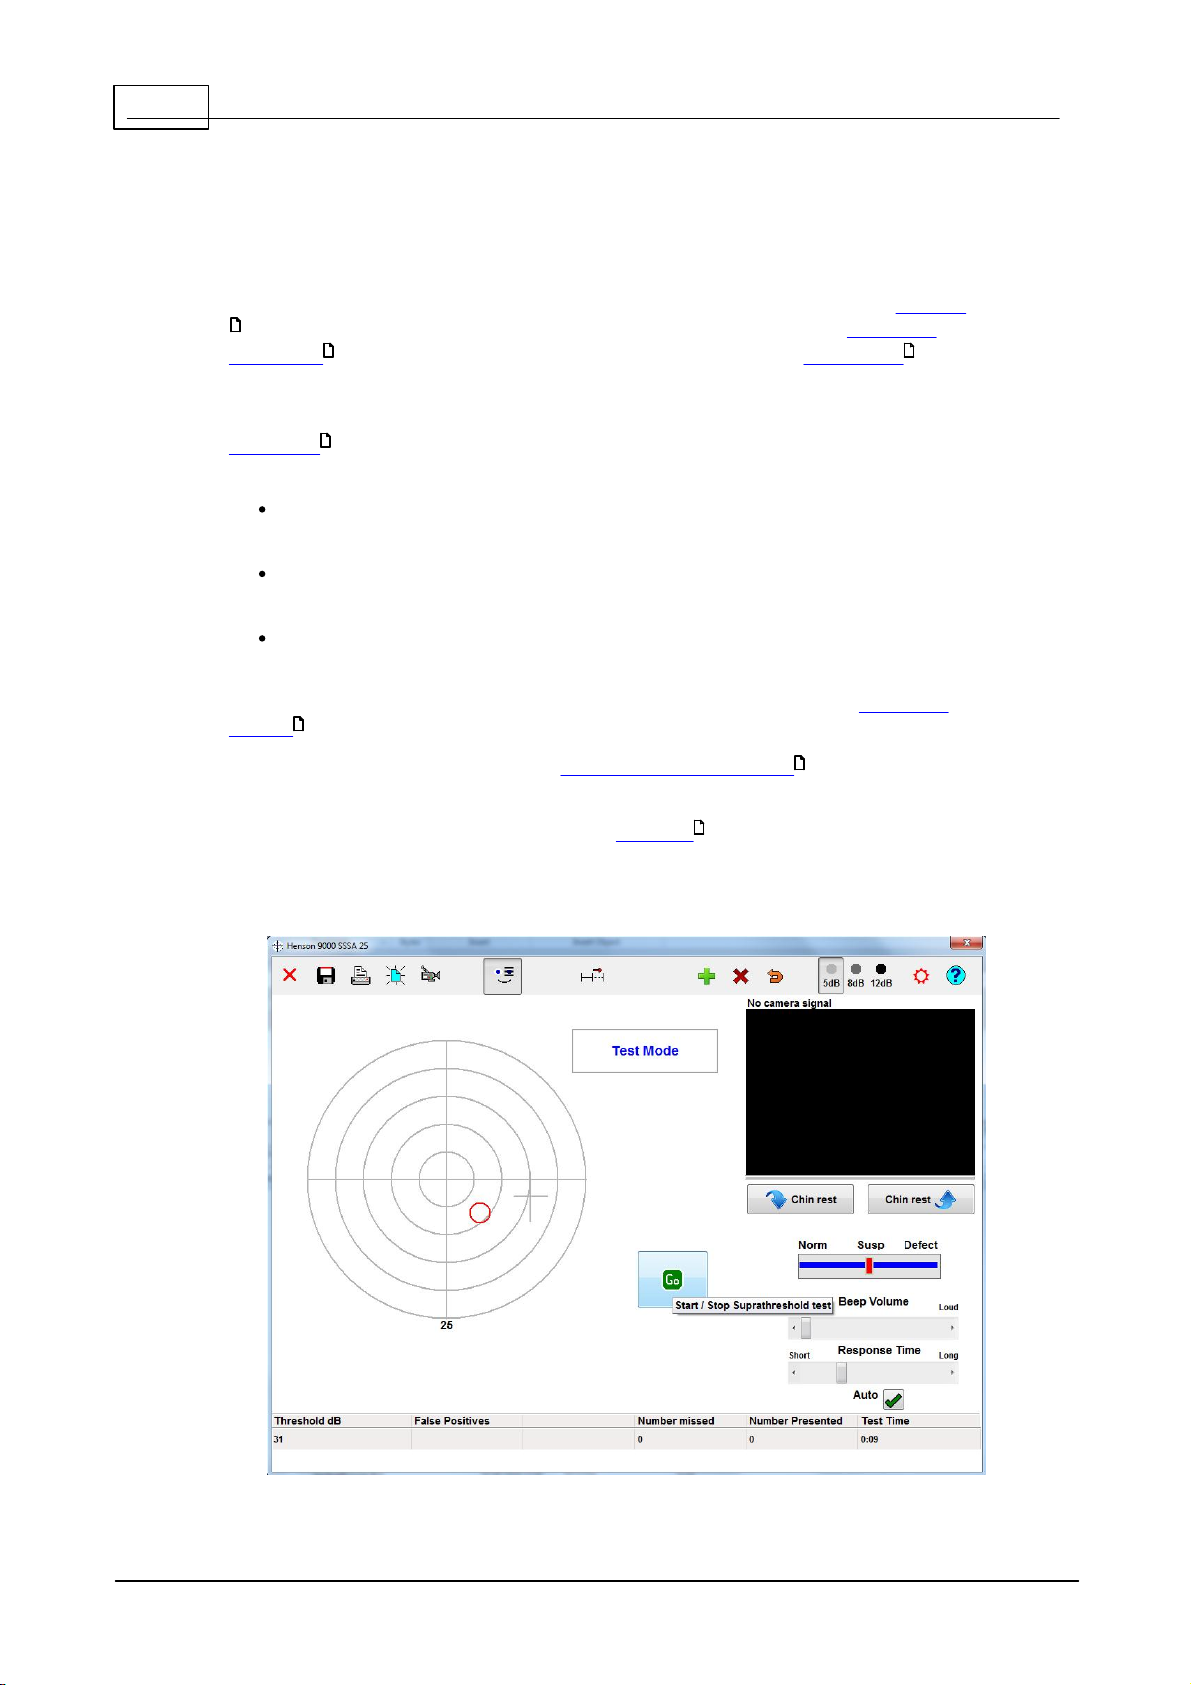
The Single Stimulus Supra-threshold test is ideal for screening the visual field.
The test is fully automated and requires no intervention other than to instruct
28
the patient on what to do, ensure that they have the correct refractive
correction in front of their eye and that they are correctly positioned and
74 71
comfortable.
The initial test intensity is set to 5dB above the patient's threshold. The
threshold is derived either from the patient's age or from a measurement
29
taken at the beginning of the test.
Stimuli that are not seen by the patient are presented a second time at
the same intensity.
If missed on both occasions, the stimulus is marked as a miss and
presented at 8dB above the threshold estimate.
If missed at 8dB it will be presented at 12dB above the estimate. A gray
scale indicates the depth of defect (5, 8 or 12dB).
The patient responds to each seen presentation by pressing their response
button .
This test incorporates a number of false positive catch trails . These help to
84
76
discourage the patient from predicting the next presentation.
The test can be customised the with the addition of extra stimulus locations.
35
To g et mo re h e lp o n a te s t s cre e n ite m click o ve r th e it em in th e ima g e b elo w .
© 2017 Elektron Technology
Page 27

27Visual field tests
© 2017 Elektron Technology
Page 28
28
3.1.2.1 Pa tie nt ins tructio ns
Henson Perimeter User Manual
It is important that the patient understands what they need to do during the
test.
Below is a set of instructions that we have found to work well.
The eye not being tested should be occluded and the test eye must be
correctly aligned with the patient sitting comfortably.
Threshold set by age
The test is going to take about 2 minutes.
You should press the response button when you see a light flash.
Some presentations are deliberately blank so do not press the button unless you
are sure you saw a light flash.
You must keep looking at the central red light and keep your eye as still as possible.
If you want to take a break, you can hold down the response button. The test will
pause until the response button is released.
The first few presentations are a demonstration, so do not worry if you make a
mistake at the beginning.
Add when setting the threshold by measurement
At the beginning of the test the light will be very dim.
Do not worry if you do not see many lights
Only press the button when you are sure.
The lights will brighten up later on.
© 2017 Elektron Technology
Page 29
29Visual field tests
3.1.3
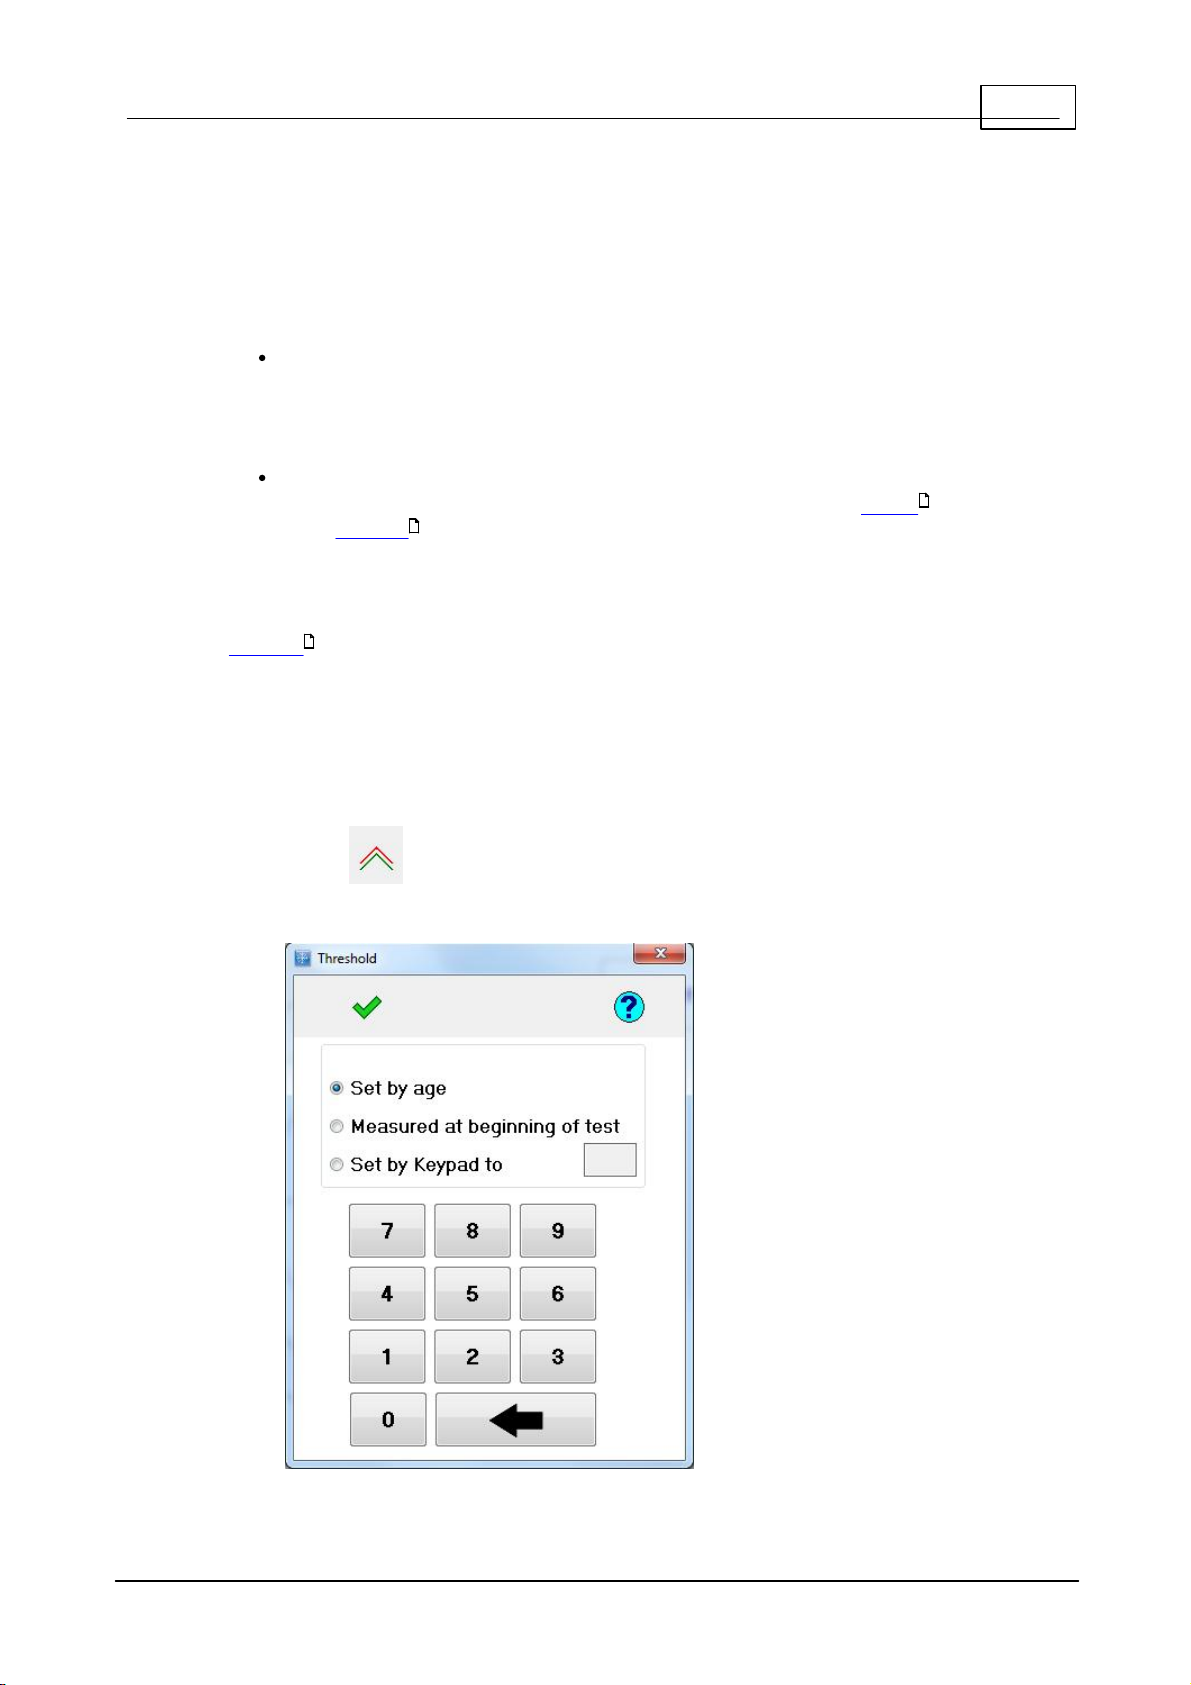
Se ttin g t he te s t int ens it y
The Supra-threshold tests present stimuli at intensities that are above the
patients estimated threshold. It uses one of 2 techniques to establish a
patients threshold:
Age related. The level is simply set by the age of the patient. This is
the fastest method but can lead to errors when a patient's threshold
departs from the average value for their age, e.g. when there are media
opacities.
Threshold related. The level is set by a series of measurements
taken at the onset of the test. The algorithm is different for Single
and Multiple stimulus tests.
32
When your machine was installed one of these techniques would have been
set as the default method, i.e. the method first selected when a suprathreshold test is undertaken. You can change the default method within the
Options program.
88
You can also opt to change the method at the onset of a test. For example, you
might want to regularly use the age setting method but then for a particular
patient, maybe one who has a cataract, want to set it according to their
threshold.
31
To select a different method at the onset of a test:
1. Click on the tool bar.
2. Select a method from the popup screen, see below, and then click OK.
No tes:
© 2017 Elektron Technology
Page 30

30
Henson Perimeter User Manual
You can set the threshold to a given value. You might want to do this to
match a previous setting.
The perimeter will revert to the default method when swapping to the
next eye or starting a new patient.
© 2017 Elektron Technology
Page 31

3.1.3.1 Sin gle s timu lu s a lg orithm
This algorithm is used to set the single stimulus test intensity when the
Threshold Related option is selected.
The threshold sensitivity is measured at four test locations, one in each
quadrant. The locations are displaced 9 degrees from the vertical and
horizontal meridians.
At each location the algorithm starts off 1dB brighter than the expected
threshold for the patient's age. It uses a repetitive bracketing procedure
with 1dB steps until six presentations have been made at all four
locations.
The average intensity of the last four presentations, at each of the four
test locations, is then taken as the threshold. To guard against the
inclusion of data from locations where the threshold is abnormally
depressed, the algorithm excludes data from locations where the
average of the last four presentations is below the 95% confidence
limits of the expected age setting. If all test locations are excluded, the
threshold is set at 4dB below the age setting.
Ten demonstration presentations are made prior to the collection of
78
Heart data.
31Visual field tests
© 2017 Elektron Technology
Page 32

32
3.1.3.2 Mu ltip le Stimu lus a lg orithm
Henson Perimeter User Manual
This algorithm is used in the multiple stimulus test to set the test intensity
when the Threshold Related option is selected.
What the perimetrist needs to do.
1. Present the current pattern by clicking Present.
2. Ask the patient how many stimuli they saw, the pattern can be repeated
if necessary.
3. Click either Yes or No depending on whether or not they saw any stimuli.
4. Keep repeating 1-3 until the threshold has been established when the
test will automatically jump to the supra-threshold testing mode.
No tes:
The algorithm starts by presenting a pattern that should be easily seen. At
each subsequent presentation it reduces the intensity until the patient reports
(twice) that none are seen.
If none w ere seen on the first presentation then the algorithm increases the
test intensity. This is repeated until some are seen.
It is important to tell the patient what is going to happen, i.e. that the patterns
are going to get dimmer and dimmer until they cannot see any of the stimuli.
This helps to put the patient at ease when they get too dim to see.
© 2017 Elektron Technology
Page 33

33Visual field tests
Ready to begin testing; Click Go to Start.
Paused; Click Go to resume.
At the start of single stimulus tests a
series of presentations are made where
the responses of the patient are not
saved.
Display when establishing the threshold
in a threshold related supra-threshold
test.
Testing in the supra-threshold mode.
The test has finished.
This is displayed during the test sequence in a Drivers
test to show that the fixation target is moving.
3.1.4
Te st s ta tu s in dica to r
All single stimulus supra-threshold tests have a status message at the top of
the test window , it indicates the current status of the test:
The following are the possible statuses.
29
© 2017 Elektron Technology
Page 34

34
Henson Perimeter User Manual
3.1.5
Exte nd ing th e te st
Each Supra-Threshold test is composed of three levels.
The first level is a quick screening test.
The second level is used when the first level gives a suspicious result, or
when there is some other reason why the clinician feels that more data
is needed (e.g. there is a family history of glaucoma).
The third level can be used to more accurately map the extent of any
visual field loss.
To go to the next level click on the tool bar.
The figure below shows the distribution of stimuli in the three levels of the
central visual field test (26, 68 and 136 Locations).
Additional stimuli can be presented manually .
35
One of the important benefits of having a multi-level test is that the perimetrist
does not have to decide on how many stimuli to test at the onset of the
examination. They can start off with a simple screening test and then Extend if
necessary.
If the auto-extend property is set in the Options program the test will
88
automatically extend if there is a non-blind spot miss.
© 2017 Elektron Technology
Page 35

35Visual field tests
3.1.6
Ad ding a nd co rre ct ing p re se nta tion s
In the supra-threshold tests it is possible to add extra test locations, re-test
locations, mark a location as missed or re-classify a missed location as seen.
This can be done at any stage of the test.
First, select the action you wish to perform by clicking the appropriate button,
see below.
Then simply click the location where you wish to make the change within the
displayed chart.
Add allows you to add or re-test a location.
Miss allow s you to mark an already tested location as missed.
Rmv allows you to re-classify a location marked as Missed.
With the Miss and Rmv actions the level post click is dependent upon the supratest increment (5, 8 or 12dB). The current value is given by the button that
appears down, (5dB on the figure below). This can be changed by clicking over
the required button.
Examples:
If the Miss and 8dB buttons are down the location will be marked as an 8dB
miss.
If the Rmv and 5dB buttons are down the location will change to a seen
location.
If the Rmv and 8dB buttons are down it will change to an 5dB miss (the
level below 8dB).
© 2017 Elektron Technology
Page 36

36
Henson Perimeter User Manual
3.1.7
Ch ang in g t he s up ra -t h re sh old incre men t
There are 3 different Supra-threshold test increments, 5, 8 and 12dB.
Each of the test increments has a button on the icon bar (see above). The
button that appears to be down gives the currently selected increment. The
increment can be changed by clicking over the required button or with the up/
down arrow keys.
Single stimulus
In the Single stimulus supra-threshold test the increment is adjusted
automatically. If a stimulus is missed the program will come back to the location
and re-test it at the same intensity. If it is missed a second time it will come
back to test it at 8dB above threshold and if missed at 8dB then at 12dB above
threshold.
Multiple stimulus
In the multiple stimulus supra-threshold test the program starts off testing at
5dB above the threshold estimate. If the patient reports less than the correct
number of stimuli then the pattern should be repeated. If they still report less
than the correct number then the patient is asked to report where they saw
the stimuli. The perimetrist then marks the location (s) they missed. The
perimetrist should then alter the supra-threshold increment in order to
measure the depth of the defect.
35
© 2017 Elektron Technology
Page 37

37Visual field tests
3.1.8
An alys ing th e re sults
The supra-threshold tests give the number of seen/missed stimuli in the status
bar at the bottom of the screen, see below.
The supra-threshold tests also give a measure of the probability that the result
comes from a normal eye. This is given in the form of a horizontal scale (see
below ) divided into 3 regions, normal, suspect and defect. The borders
correspond to 10% (normal/suspect) and 0.1% (suspect/defect) probability
values. The length of the blue bar represents the confidence of the estimate.
The length is dependent upon the number of tested locations, it shortens as
the number increases.
This calculation is based on a scoring system applied to the visual field data.
The score increases with the number, depth and clustering of any missed
stimuli. The score is then compared to a normal database of scores to derive a
probability value.
© 2017 Elektron Technology
Page 38

38
Exit the program and return to main menu.
Save current visual field data (both eyes).
Print results (both eyes).
Start new Patient (same test).
Open the help file (context-sensitive).
Swap eyes (without losing data).
Select method for establishing the threshold.
Extend test to the next level .
Fixation targets .
Action when clicking over chart area of screen.
Add point, mark as Miss, Remove previous mark
Supra-threshold increment .
patient Response button pressed (Single
Stimulus tests).
Henson Perimeter User Manual
3.1.9
To olba r
85
82
81
77
29
34
80
35
36
84
© 2017 Elektron Technology
Page 39

39Visual field tests
3. 2
Zat a t hreshold tes t
ZATA (Zippy Adaptive Threshold Algorithm) is a new threshold program that is
faster and more accurate than earlier threshold tests (Full Threshold, Fast
Threshold). Shorter test times are important in perimetry, as patients find it
hard to maintain their attention much beyond three minutes and loss of
attention is associated with increased variability.
When possible the ZATA program uses the data from a previous visual field
result to seed starting values. When no prior data is available it starts from
age-dependent normal values. Starting from prior threshold estimates not only
makes the test faster but also improves the accuracy of the threshold
estimates.
The ZATA test can use either the 30-2, 24-2 or 10-2 pattern of test stimuli.
60
ZATA F a s t a nd ZATA Sta nda rd . ZATA Fast differs from ZATA Standard in that
it has looser terminating criteria. The terminating criteria dictate how accurate
the threshold estimate must be before the program stops testing each location.
Looser terminating criteria mean that the ZATA Fast test will be quicker than
ZATA Standard, although the accuracy of each threshold estimate will be
reduced by a small amount. ZATA Fast is appropriate for patients where less
accurate estimates are acceptable. i.e. those with no established loss.
The ZATA program presents one stimulus at a time and the patient responds to
each seen presentation by pressing a response button.
84
61
At the end of the test the results can be viewed in a variety of different
47
ways.
The standard printout includes, threshold values (numeric and gray scale),
53
defect values (age and pattern related), probability values (age and pattern
related) along with a series of global indices (MD, PSD, Hemifield), test details
and patient demographics.
To g et mo re h e lp o n a te s t s cre e n ite m click o ve r th e it em in th e ima g e b elo w .
© 2017 Elektron Technology
Page 40

40
Henson Perimeter User Manual
© 2017 Elektron Technology
Page 41

41Visual field tests
3.2.1
Blind s po t
At the beginning of a ZATA test the Henson 9000 searches for the eye's blind
spot.
It starts off by presenting a Supra-Threshold stimulus at the most likely location
of the blind spot. If this is not seen, this location is stored as the blind spot. If it
is seen then a stimulus is presented at the next most likely location. This is
repeated until either the patient does not see one of the stimuli or until all the
potential blind spot locations have been tested.
The blind spot location is used throughout the test as a check of fixation. Every
now and again a stimulus is presented at the established blind spot location,
and if the patient sees this stimulus (presses the Response button) it is
assumed that they were not fixating accurately. The number of blind spot tests
and the number of times the stimulus was seen in the blind spot are displayed
as fixation losses on the status bar (see below) and printout .
53
In a reliable patient fixation losses should not exceed 20%.
Occasionally, the perimeter may fail to find the patient's blind spot, i.e. the
patient presses the response button for every potential blind spot location.
This is usually the result of a false positive response by the patient (they
pressed the response button in error when the stimulus was presented in their
blind spot).
When this occurs, a message will ask if you want to repeat the search
(relocate) or to continue without blind spot checks.
Click one of these options to continue testing.
It is possible to repeat a search for the blind spot during the test by clicking
© 2017 Elektron Technology
Page 42

42
Henson Perimeter User Manual
3.2.2
Fo ve a me as ure men t
In the ZATA threshold tests it is possible to measure the sensitivity of the eye
at the fovea. For this measurement the patient fixates the centre of a fourpoint pattern of fixation lights positioned below the normal central fixation light.
The software uses a 4-2 staircase algorithm to obtain three measurements of
the foveal threshold, and then takes the average of these three readings to
give the final estimate. The 3 measurements are intertwined to avoid any
obvious sequences.
1. Click and then Yes in the follow ing pop up window .
2. Instruct the patient to look at the centre of the four lights, and to press
their response key when they see a light flash at the centre of the
pattern. Emphasize that many of the presentations will be too dim. If
they are not sure they should not press their key.
3. Click Go to start testing.
© 2017 Elektron Technology
Page 43

43Visual field tests
3.2.3
Glo ba l Ind ice s
Global indices are single numbers that characterise the w hole visual field. They
are used to monitor the extent of loss over time.
There are 3 provided with the ZATA test:
Mean Defect.
Standard Deviation.
Hemifield Test.
© 2017 Elektron Technology
Page 44

44
Henson Perimeter User Manual
3.2.3.1 Me a n De fe ct
The Mean Defect score (which is given on the printout) gives the clinician an
estimate of the extent of damage.
A more negative value indicates a less sensitive eye. Mean Defect values are
sensitive to both scotomata and media opacities. The value w ill go down if a
patient has a glaucomatous field defect and if they have a cataract.
As the name implies, the Mean Defect score is based on the average of all the
defect values, excluding those from the blind spot area. However, as some
50
test locations are more variable than others, it is weighted to give more
importance to the less variable locations (those nearer the centre of the tested
field).
A P-value is given when the probability of the MD value coming from a normal
patient is below 10% (possible outputs are <10%; <5%; <2%; <1%; <0.5%).
When it is above 10% then the message
W ith in No rma l Lim its
will be displayed.
The f igu r e abo ve s h ow s the glo ba l i n d i c es a s a ppea r o n the s tand a rd pr i n t
out.
© 2017 Elektron Technology
Page 45

3.2.3.2 St and ard De via tio n
45Visual field tests
The Standard Deviation of the defect values is a measure of their variability.
50
Large values are indicative of localised scotoma. This global index can be used
to monitor progression where increases in the index indicate a deepening or
enlargement of localised loss.
The index is insensitive to overall shifts in sensitivity that may occur due to
cataract etc.
The index is, how ever, particularly sensitive to lens rim artifacts and droopy
lids.
A P-value is given when the probability of the SD value coming from a normal
patient is below 10% (possible outputs are <10%; <5%; <2%; <1%; <0.5%).
When it is above 10% then the message
W ith in No rma l Lim its
will be displayed.
The f igu r e abo ve s h ow s the glo ba l i n d i c es a s a ppea r o n the s tand a rd pr i n t
out.
© 2017 Elektron Technology
Page 46

46
Henson Perimeter User Manual
3.2.3.3 He mifie ld Tes t
The Hemifield test compares the defect values in the superior hemifield to those
in the inferior hemifield. It then tells you whether the difference is within normal
limits.
The test is very sensitive to the early changes that occur in glaucoma which are
often restricted to either the superior or inferior hemifields. The output from this
analysis is either Within Normal Limits, Borderline or Outside Normal Limits. In
cases where it is Borderline or Outside Normal Limits it also give a p-value
(<10, <5%, <2%, <1% <0.5%).
The f igu r e abo ve s h ow s the glo ba l i n d i c es a s a ppea r o n the s tand a rd pr i n t
out.
© 2017 Elektron Technology
Page 47

47Visual field tests
3.2.4
Ou tp uts
At the end of a ZATA test the following 3 buttons will appear on the menu bar.
The currently displayed format is represented by the button that appears to be
down (Defect). By clicking one of the alternative buttons you can change the
displayed format.
Gray displays the results in a gray scale format.
Thresh displays the threshold values (dB).
Defect displays the defect values (dB).
48
50
49
© 2017 Elektron Technology
Page 48

48
Henson Perimeter User Manual
3.2.4.1 Th re sh old
Threshold values are displayed on a chart. The value is given in decibels of
attenuation where 0 corresponds to 3183 cd/m2 (10000 asb).
The a bov e f igu r e sho w s the Th r esho l d (le ft) a n d G ray Sca l e ( r ig h t) v alues
fro m a 2 4 - 2 fie ld te st a s s een i n the s tand a rd pr i n to u t.
© 2017 Elektron Technology
Page 49

3.2.4.2 Gra y Sca le
The Gray Scale chart gives an interpolated plot of the threshold values which
makes it easier to see where there are areas of reduced sensitivity (dark
areas).
The a bov e f igu r e sho w s the Th r esho l d (le ft) a n d G ray Sca l e ( r ig h t) r esults
of the sta n d ar d pr intout.
49Visual field tests
© 2017 Elektron Technology
Page 50

50
Henson Perimeter User Manual
3.2.4.3 De fect
Defect values are the difference between the measured threshold and that
expected from an age-matched normal eye.
They are presented in tw o different forms:
Absolute values in decibels (dB).
Symbols representing the probability that the threshold measure comes
from a normal eye. The probability values take into account the
variability in threshold estimates at each test location.
Positive values indicate a higher than average sensitivity.
The a bov e f igu r e sho w s the Defe ct ( l e ft) a nd P atte rn de fe ct ( r ig h t) v alues
as s een in the s tan d a rd pr i n to u t. A b s olute v alue s a t the top an d
pro b ab ility s ymbo l s b elow.
Example:
If the measured threshold was 25dB in a person of 40 years of age and the
normal value for that location was 30dB, then the defect value would be -5dB.
Defect values appear on the standard printout and can be displayed on the
screen at the end of the test by pressing the defect button.
82
47
© 2017 Elektron Technology
Page 51

3.2.4.4 Pa tte rn de fe ct
Pattern defect values remove the effect of overall shifts in sensitivity to better
expose the pattern of any field loss.
At the end of each test the Henson software first calculates, for each test
location, the Defect values (the differences between the test result and that
of an age-matched normal). To then derive the Pattern defect values it offsets
the defect values according to the overall height of the patient's hill of vision. If
the patient has a less sensitive eye than that of an age-matched normal
(maybe they have some media opacities) then the Pattern Defect values w ill be
lower than the Total Defect values.
The offset is calculated from an analysis of the most sensitive regions of the
visual field and has a maximum amplitude of 6dB in either direction.
When there is a particularly large amount of visual field loss, the Pattern Defect
calculations become inaccurate and are not displayed.
The Pattern Defect values are presented in two different forms:
Absolute values in decibels (dB).
51Visual field tests
50
Symbols representing the probability that the threshold measure comes
from a normal eye. The probability values take into account the
variability in threshold estimates at each test location.
© 2017 Elektron Technology
Page 52

52
Henson Perimeter User Manual
The a bov e f igu r e sho w s the Defe ct ( l e ft) a nd P atte rn de fe ct ( r ig h t) v alues
as s een in the s tan d a rd pr i n to u t. A b s olute v alue s a t the top an d
pro b ab ility s ymbo l s b elow.
© 2017 Elektron Technology
Page 53

53Visual field tests
3.2.5
Print O ut
Below is a copy of a print out from a ZATA threshold test.
Patient demographics and details of the Field test are given at the top of the
chart.
You can get further help on the different elements of the print out by clicking
over that item in the image below.
© 2017 Elektron Technology
Page 54

54
Henson Perimeter User Manual
3.2.6
Pro gre ss io n: Ra t e o f ch an ge
You can monitor the rate of change in the visual field through the Database
program.
Below is an example of of what can be obtained through this route.
The progression screen below shows 2 graphs (one for each eye) that display
the global indices Mean Defect and Standard Deviation versus the age of the
patient. Each data point represents a visual field record (collected or imported).
When there are 4 or more data points a best fitting (least squares linear
regression) line is drawn through the points. As a visual field defect gets
worse the Mean Deviation will become more negative and the Standard
Deviation more positive.
The Mean Defect rate of change (dB/year) is given below the plots along with
its 95% confidence limits. In the example shown the rate of change is -0.49dB/
year in the RE while the confidence limits are +/-0.36dB/year. As the rate is
higher than the confidence limits the progression is significant at the 95% limit.
The 3 vertical lines on each plot represent the time points that correspond to
the 3 gray scale images shown above each graph. When first entering the
analysis these will be the last 3 visits. You can move to different visits by
clicking the left/right arrows to either side of the gray scales.
Outliers in the data series can have a large effect upon the gradient of the
regression lines. Outliers can, therefore, be removed from the regression
analysis by simply clicking over the data point. Clicking a second time reintroduces the data point.
The data can also be presented on a Glaucoma Staging System II (GSS)
115
chart by clicking The GSS2 chart plots Mean Defect versus Standard
Deviation and divides the plotted area into 7 stages (Normal, Borderline and 5
© 2017 Elektron Technology
Page 55

levels of loss).
You can exit the progression analysis and return to the database by clicking the
exit button .
On return to the database the normal visual field chart on the right hand side
of the screen will be replaced by an image of the last progression screen.
This can then be printed as per a visual field chart by pressing the print
117
button
Clicking any other record will revert the right hand display to a visual field
chart.
55Visual field tests
© 2017 Elektron Technology
Page 56

56
3.2.6.1 GSS2
Henson Perimeter User Manual
It is often helpful when reviewing visual field data to have a means to scale the
extent of loss. There are many scaling systems that have been proposed over
the years since computerised perimeters were developed. Some are highly
complex while others are simple.
For a review see Brusini P, Johnson CA. Staging functional damage in glaucoma:
Review of different classification methods. Survey of Opthalmology
2007:52:156-179.
The GSS II system is a relatively simple staging system that was developed by
Paolo Brusini. It is based upon the Mean Defect and Defect Standard Deviation
and simply plots these 2 global measures against each other. It then divides
the plot area in to 7 regions, Normal, Borderline and 5 stages of loss. Stage 1
being early loss while stage 5 is advanced loss.
Using both Mean Defect and Defect Standard Deviation has advantages over
using either index in isolation. Defect Standard Deviation is more sensitive than
Mean Defect to early localised loss while Mean Defect is more sensitive when
defects become advanced. By combining the 2 we have a grading system that
is both sensitive to early and advanced loss.
The progression softw are plots each visual field result as a point on a GSS
chart and connects the points together with a line. The first records point is
coloured blue while the last one is coloured red. In this way you can see how
the patient is changing over time. Ideally you would like to see all the points
clustered together indicating that there has been very little change, see
example below. Movement towards the low er right hand corner (towards stage
5) indicates progressive loss.
© 2017 Elektron Technology
Page 57

57Visual field tests
© 2017 Elektron Technology
Page 58

58
3.2.6.2 Print ing
Henson Perimeter User Manual
A print of the progression analysis can be obtained for your records.
On exiting the progression analysis the normal image shown to the right of the
list of records is replaced by one showing the results of the progression
analysis.
The image shows a maximum of 6 gray scale images. When there are more
than 6 data points the gray scales from the first 2 and last 3 will be displayed.
Any changes made while in the progression analysis (e.g. excluding an outlier)
will be duplicated in the iimage which will display either the line plot or GSS2
plot depending on which was active on exit.
To Print click the Printer symbol on the toolbar and the currently displayed
results will be opened as a PDF in your PDF reader ready for printing.
© 2017 Elektron Technology
Page 59

59Visual field tests
3.2.7
Pa tie nt ins tructio ns
It is important that the patient understands what they need to do during the
test.
Below is a set of instructions that we have found to work well.
The eye not being tested should be occluded and the test eye must be
correctly aligned with the patient sitting comfortably.
The test is going to take about 4 minutes.
Press the response button when a light flash is seen.
Some presentations are deliberately blank.
Do not guess. You must ONLY press when you are sure.
You must keep looking at the central red light and keep your eye as still as possible.
If you want to take a break you can hold down the response button. The test will
pause until you release the response button.
The first few presentations are a demonstration so do not worry if you make a
mistake at the beginning..
As the test proceeds, fewer and fewer lights can be seen; this is normal.
© 2017 Elektron Technology
Page 60

60
Stimulus lo c atio ns . Le f t 30-2 (24-2 e xcluding r ed lo c atio ns ) . Ri g ht
10-2.
Henson Perimeter User Manual
3.2.8
St imu lus lo ca tio ns
The ZATA test can use either the 30-2, 24-2 or 10-2 patterns of test stimuli.
The 30-2 and 24-2 test pattern presents stimuli on a 6 degree square matrix
displaced 3 degrees from the vertical and horizontal mid-lines and covers an
area of either 30 or 24 degrees (the 30-2 is an extension of the 24-2 test that
can be selected during or at the end of a 24-2 test). The 10-2 pattern presents
stimuli on a 3 degree square matrix within the central 10 degrees.
© 2017 Elektron Technology
Page 61

61Visual field tests
If you select Existing Pt the software will display a table of records within
your database.
1. Scroll through the table to find the patient, or use the Find
buttons.
2. Highlight the required record (usually the last record for the
patient) and then click Load.
3. The patient's name, record number, date of birth etc. will be
loaded and, if the selected test is a threshold test with the same
distribution of stimuli, the threshold data will be loaded ready to
start testing from prior values.
If you select a new patient the following data entry form will appear. You
must enter the patients name, date of birth and record number before
clicking Enter to continue.
3.2.9
Us ing e xis tin g pa tie nt d et a ils
All ZATA threshold tests start by asking the perimetrist if it is a new or existing
patient.
107
© 2017 Elektron Technology
Page 62

62
There are two important parameters of threshold tests:
The time they take to perform an examination
The precision of their threshold estimates.
Clearly, the objective of perimetric programs is to make the test as
accurate and as fast as possible.
One way of reducing the number of presentations is to start off
close to the patient's threshold. For a new patient, the best
estimate of their threshold is based on their age. However, when
the patient has already been examined with a Threshold test the
Prior values provide a much better estimate particularly when they
have a visual field defect.
In addition to speeding up the test, using prior values also
increases the accuracy of the result.
Henson Perimeter User Manual
The entered values will appear on any printed charts and will automatically
be added to the database entry form when saving the data.
85
Notes:
82
© 2017 Elektron Technology
Page 63

63Visual field tests
Exit the test program and return to main menu.
Save current visual field data (both eyes).
Print results (both eyes).
Video camera settings.
Open the help file (context-sensitive).
Repeat this eye (start again).
Swap eyes (can be done at any time without
losing data).
Blind Spot re-locate.
Extend test to the next level .
Test fovea .
Fixation targets .
Display format.
Indicates when patient Response button is
pressed.
3.2.10
ZATA t oo lba r
85
82
87
81
77
41
34
42
80
47
84
© 2017 Elektron Technology
Page 64

64
Henson Perimeter User Manual
3. 3
Driv ers tests
The Henson 8000/9000 provides 2 visual field tests for drivers. The first,
Group 1, meets the standard set by the UK Licensing Authority for drivers of
cars and motorcycles. The second, Group 2, is for drivers of lorries and buses.
The group 2 test is more stringent than the group 1 test and tests further into
the periphery.
Both Drivers Tests are binocular with a fixed intensity stimulus (10dB, 318.4cd/
m2) with the Goldmann equivalent background intensity (10cd/m2).
When performing a Drivers Test the patient's forehead should be placed in the
middle of the head rest and they should be allowed to turn their head slightly
to either side to follow the fixation point comfortably.
The Drivers Tests are single stimulus tests and the patient responds to each
seen presentation by pressing a response button.
84
The drivers tests incorporate a number of false positive and false negative
Catch Trials . These are used to give a measure of reliability.
76
67
To g et mo re h e lp o n a te s t s cre e n ite m click o ve r th e it em in th e ima g e b elo w .
© 2017 Elektron Technology
Page 65

65Visual field tests
The test is going to take about 4 minutes.
Press the response button when a light flash is seen.
Some presentations are deliberately blank and you will not see
a flash. If you repeatedly press the response button when
there is no flash you will fail the test.
Keep looking at the central red light.
On occasions the red light will move to a new position; you
must follow it with your eyes, turning your head slightly if
necessary.
You must keep your eyes as still as possible.
If you want to take a break hold dow n the response button.
The test will pause until the button is released.
The first few presentations are a demonstration only and do
not form part of the final result.
3.3.1
Pa tie nt Ins tructio ns
It is important that the patient understands what they need to do during the
test.
Below is a set of instructions that we have found to work well.
© 2017 Elektron Technology
Page 66

66
Henson Perimeter User Manual
3.3.2
Op tio ns
The options program has a Drivers Tests tab with an option to have a
88
minimum value for the beep volume. (Min volume On). The UK DVLA require a
beep so this option should be selected when testing patients within the UK. For
use in countries where there is no such requirement leave the check box
empty. This will allow the beep to be turned off when set to the extreme left.
© 2017 Elektron Technology
Page 67

67Visual field tests
3.3.3
St imu lus lo ca tio ns
The patterns of the stimuli in the Group 1 and group 2 Drivers Tests are shown
below :
Group 1-120 point test Group 2-124 point test
© 2017 Elektron Technology
Page 68

68
Henson Perimeter User Manual
4
General information
The Henso n visual field tests are very fast:
The Multiple Stimulus Supra-threshold test takes ~2 minutes to test both
eyes of most patients.
The Single Stimulus Supra-threshold test takes a little longer.
The ZATA Threshold test is one of the fastest threshold tests available
due to its use of prior data and variable terminating criteria.
The Supra-threshold tests use test locations that have been optimised to
detect early glaucoma to reduce the total number of presentations needed
when screening for glaucoma.
39
21
26
Other perimeter actio ns
The overall speed of a visual field test is further improved with:
A fast start-up time. The Henson uses LEDs which do not need to be
warmed up.
The printing and storage of both eyes as a single record. You do not need to
print and/or store each eye individually.
The use of multiple stimulus presentations in its Supra-threshold tests.
Rapid response times to operator commands.
Rapid access to records in its Database, with hot key options, a vertical
slider and a find facility.
Click and touch screen operation with hot keys.
Most commands requiring a single click not a whole series of selections, e.g.
when you have finished a test and wish to start a new test just click
Windows™ operating system
Henson perimeters use the latest Windows™ operating system. This menas
that most operators are already familiar with many of the screen layouts and
operations. It also means that printing of records can be handled by any
Windows enabled printer and provides unrivaled well understood netw orking
facilities.
External PC
By having an external PC you are not confined to having the operator on one
side of the perimeter.
© 2017 Elektron Technology
Page 69

Wi-Fi enabled
Hensons can be networked wirelessly using the wifi capabilities of the
attached PC/ laptop.
155
Extendable tests
69General information
All tests can be extended . You do not need to start a new test when early
34
results look suspicious. Supra-threshold tests can be extended from 26 to 68 to
136 stimulus locations. The Zata 24-2 test can be extended to a 30-2 test.
Repeating/adding new test lo cations
The supra-threshold tests allow stimuli to be re-presented to confirm a
response. You can also add new locations by placing the cursor over the
location you w ish to test and clicking the mouse button. Existing presentations
can be modified in the same way.
35
On-line Help
Advanced context sensitive help facility that gives fast feedback to users when
needed.
Advanced analysis ro utines
The results from a Supra-threshold test are continually analysed in a way
that tells you the likelihood of the result coming from a normal patient. The
analysis takes into account the number, depth and clustering properties of the
currently missed stimuli.
37
The ZATA Threshold test includes Total Defect, Pattern Defect and Probability
maps that match those of the Humphrey Perimeter. It also includes the global
indices, Mean Defect and Standard Deviation that again match those of the
Humphrey Perimeter. It includes a Hemi-field analysis for the early detection of
glaucomatous loss that gives a continuous output with probability measures.
© 2017 Elektron Technology
43
Page 70

70
Henson Perimeter User Manual
When you have a series of threshold tests from a patient, either collected or
imported, these can be analysed to see if there is any progression. An example
of this analysis is given below.
© 2017 Elektron Technology
Page 71

71General information
4. 1
Preparing t he pa tie nt
Before undertaking a visual field test the patient needs to be carefully
instructed on what the test is about and how they need to respond.
They need to have the correct refractive correction in front of the test eye
and an occluder in front of the other eye.
The patient also needs to be carefully positioned at the instrument.
73
74
72
© 2017 Elektron Technology
Page 72

72
Henson Perimeter User Manual
4.1.1
Align ing t he pa tie nt
The patient should be seated comfortably with their head as shown below.
The patient should be positioned so that they are seated upright comfortably,
their eye is centered on the fixation monitor and they are touching the brow
bar. The chin rest should then be raised to support their chin using the onscreen up/down buttons (see below). Do not try to lift a patient's head with the
chin rest as this can cause excessive loading of the mechanism.
The correct positions for Binocular (left picture) and Monocular test (of right
eye) are shown below.
NOTE: On single stimulus tests, the chin rest buttons are disabled when the
test is running
© 2017 Elektron Technology
Page 73

73General information
4.1.2
Pa tie nt Ins tructio ns
It is important that the patient fully understands what they need to do during
the test.
Suggested instructions for the different tests can be found by following the
links below:
a. Multiple stimulus supra-threshold .
b. Single stimulus supra-threshold .
c. ZATA .
d. Drivers .
59
65
23
28
© 2017 Elektron Technology
Page 74

74
Patient's age
Add
40-44
+1.50
45-49
+2.00
50-54
+2.50
55-59
+3.00
60-64
+3.50
>65
+4.00
Henson Perimeter User Manual
4.1.3
Re fra ct ive corre ct io n
It is important that the patient wears the correct refractive correction (suitable
for a 25cm test distance) during the visual field test.
The Henson 8000/9000 is designed to be used with a special perimetric lens
set. This uses large diameter lenses, which attach to a special frame. This set
overcomes the problem of lens rim artifacts that are common when trial case
lenses are used with a lens holder attached to the perimeter.
An occluder is placed in front of the eye not being tested.
Recommended additions (lens power to be added to the patient's current
distance prescription) are given in the table below.
© 2017 Elektron Technology
Page 75

75General information
4. 2
Aut o t iming
When the Auto timing box is checked (see below) the speed of presentations
will change according to how fast the patient presses the response button .
If the patient responds quickly, the inter-stimulus interval will be reduced
(the speed of presentations increases).
If they respond slowly, the inter-stimulus interval will increase (the
speed of presentations will decrease).
The perimetrist can manually adjust the speed of presentations at any stage of
the examination by dragging the Response Time slider or clicking the arrows at
either end.
The Auto timing can also be turned on or off at any stage of the examination by
clicking the Auto check box.
84
© 2017 Elektron Technology
Page 76

76
Henson Perimeter User Manual
4. 3
Cat ch Trials
The Single stimulus tests incorporate catch trials to give the clinician an
estimate of the patient's reliability.
False positives: when no stimulus is presented.
False negatives (o nly in threshold tests and drivers
tests): when a repeat presentation is made at an already seen location.
Catch trials occur at random intervals throughout an examination and the
results are given during the examination on the status bar at the bottom of the
test screen and on the printout.
The results are given as a fraction, the top number representing the number of
errors and the bottom number the number of catch trials. For example, False
positives 3/10 would indicate that the test had made 10 false positive catch
trials and the patient had, in error, responded to 3 of them.
Normally the number of false positives should be less than 15% and the
number of false negatives less than 30% of the total number of trials. False
negatives increase if there is a visual field defect. This is due to the increased
variability of the patient in areas of reduced sensitivity.
The relationship betw een catch trial responses and test-retest variability is not
very good and the results from these trials should only act as a guide.
Perimetrists can provide a more accurate estimate of the patient's reliability by
simply observing them during the test. Perimetrists should, therefore, be
encouraged to make comments on the visual field chart concerning the
reliability of the result, e.g. Fixation excellent, Fixation poor etc.
It is possible to display the catch trials as a percentage by setting the option in
the options tests section.
This will then display the fraction as a percentage.
90
© 2017 Elektron Technology
Page 77

77General information
Right eye being tested (Left eye is Occluded)
Left eye being tested (Right eye is Occluded)
4. 4
Changing eye s
You can change eyes at any time by clicking the eye button on the tool bar. The
icon shows which eye is currently being tested.
Note: Swapping from one eye to the other during a test will not result in any
loss of data.
This facility is particularly useful when screening the visual field with suprathreshold stimuli. If the first eye was OK and the second eye showed up a
defect then it is possible to go back to the first eye and test some more
locations now that the suspicion of a defect has been raised by the result from
the second eye.
© 2017 Elektron Technology
Page 78

78
Henson Perimeter User Manual
4. 5
Demonst rat ing t he t est
All the single stimulus tests begin with a demonstration. This consists of series
of presentations where the responses of the patient are not saved. During the
demonstration stage the test status indicator will show
It is a good idea to tell the patient not to be concerned if they make some
errors at the beginning of the test as the first first few presentations do not
count.
If further demonstration is required then the perimetrist should stop the test
and start again after re-instructing the patient.
© 2017 Elektron Technology
Page 79

79General information
4. 6
Ent ering the pat ient 's dat e o f birt h
The Henson 9000 requires the operator to enter the patient's Date of Birth at
the beginning of each test. Click over the correct day, month and year using the
vertical sliders when necessary and then click Enter.
The date of birth is used to establish the age normal threshold values.
© 2017 Elektron Technology
Page 80

80
Henson Perimeter User Manual
4. 7
Fixat ion t arget s
The Henson 9000 has two fixation targets:
A small central red spot.
Four peripheral spots located 6 degrees from the central point along the
0, 90, 180 and 270 meridians. The four peripheral spots are provided for
patients who have lost central vision. The patient should be instructed
to look at the centre of the four-point pattern.
You can switch betw een fixation targets at any stage of the examination by
clicking
The appearance of the button represents the current fixation target.
© 2017 Elektron Technology
Page 81

81General information
4. 8
Help fac ilit y
Clicking opens up the on-line help where you can get context sensitive
help while a program is running.
Opening and closing the Help facility will not affect the Henson program and
you can keep the help program open while continuing with a field test.
An example of a help page is shown below. On many pages clicking over an
item within an image will jump to a new help page where additional information
will be available.
© 2017 Elektron Technology
Page 82

82
Henson Perimeter User Manual
4. 9
Print ing t he result s of a field test
Henson perimeters enable the recording of field data by producing a PDF
document that you can then print, save (locally or to cloud storage) or email.
You have the option to enter the patient details on the PDF for printing, but if
this is not selected the PDF will be produced with spaces for you to write the
information in after printing.
1. To print the results of a field test click Print on the toolbar.
2. If you have not tested both eyes, you will be prompted to continue.
3. If you have the options set to enter patient information on the printout
91
then you will be presented with the window below where you can
enter the details.
4. Press print to continue or cancel to print without patient details.
5. The print will be generated as a PDF file which will be opened in your
default PDF viewer.
© 2017 Elektron Technology
Page 83

83General information
6. From here you have all of the common options available in the PDF view er, you
can print, save locally, save to cloud or attach to email.
7. Depending upon the PDF viewer and option chosen there may be additional
dialogs to complete the chosen task.
No tes:
Results for both eyes are printed at the same time.
In the Supra-Threshold tests, results for the right and left eyes are placed side
by side.
The Zata test results are printed one eye to a page.
The Practice name and address will appear on the printout, along with any
patient details entered when saving the visual field data in the database.
89
85
© 2017 Elektron Technology
Page 84

84
Response button down
Response button up
Henson Perimeter User Manual
4. 10
Response but ton
The Patient Response Button is used in the single stimulus tests.
The patient is instructed to click the response button each time they see a
stimulus.
When pressed and held down, the response button will pause further stimulus
presentations. This is useful if the patient needs to temporarily pause testing.
During a test, the status of the response button is given in the toolbar by
the indicator show n below.
it appears next to the Help icon when the button is pressed.
63
© 2017 Elektron Technology
Page 85

85General information
4. 11
Saving visual field dat a
Visual field data is saved in a powerful Windows database.
The Henson saves both eyes as a single database record. You should,
therefore, test both eyes before clicking save unless you are intending to test
only one eye. The Estermann Drivers test is binocular and can only be saved
after completion.
No te: If you save just one eye and then wish to test and save the other eye
you will need to start a new test by clicking New .
Clicking Save (or Edit within the database program) opens up the database
entry form, see below, in which you can Enter/edit the record.
Family name, record number and date of birth are required fields (these are
used for sorting and filing the data).
Other fields are optional.
Only use the following characters in the family name or record number- Letters
A-Z, Numbers 0-9 and hyphen -
Visual acuities are selected from Drop-Down boxes, refractive errors from Scroll
boxes (Sphere, Cylinder and Axis).
If working from prior data some of this information will be entered automatically
although it can still be edited/changed.
No tes:
The date of test, time of test, date of birth and type of test are automatically
entered by the software. The date and time of test come from the PCs
internal clock, which needs to be correctly set via the Windows Control Panel.
The Henson software saves a pdf file of the printout that can be used by
practice management systems. For details on the coding of file names please
contact your supplier.
© 2017 Elektron Technology
Page 86

86
Henson Perimeter User Manual
© 2017 Elektron Technology
Page 87

87General information
4. 12
Video c amera
The Henson 9000 is fitted with a video camera for monitoring a patient's
fixation.
To adjust the camera settings:
1.Click to display controls (Show n above with blue background).
2.Drag the brightness and contrast sliders to the desired level.
3.Click to remove controls.
The settings are saved for future use.
The settings can also be adjusted within the Video tab of the Options
program.
96
© 2017 Elektron Technology
Page 88

88
Henson Perimeter User Manual
5
Options program
The Options program allow s you to set certain parameters of the visual field
test and the associated programs.
First of all you need to close ALL Henson programs, including the Start-up
screen.
Run the Options program from the Windows desktop icon.
You will then be presented with the tabbed Options entry form shown below.
You can change as many items on different tabs as you wish and all of the
changes will be made when you click SAVE.
To g et mo re h e lp o n a n O p t io ns ite m click o ve r th at ite m o n th e im a g e b e lo w .
© 2017 Elektron Technology
Page 89

89Options program
5. 1
Address
In the Options program you can enter your practice name and address. This will
then appear at the bottom of any printed charts.
Use the on-screen keyboard or an external keyboard to make changes.
Note: Clicking Save will save all the changes you have made in this session (not
just those on the current tab).
© 2017 Elektron Technology
Page 90

90
Henson Perimeter User Manual
5. 2
T es ts
In the Options program there is a tests tab that allows you to set certain
characteristics of the tests.
You can select:
Su pra th re sh o ld
Whether the threshold is set by age or by measurement (you can
override this at the onset of a test).
29
Whether the program starts off at level 1 (26 points) or 2 (68 points).
31
Whether the program auto extends after level 1.
Drive rs t e s t
In the Drivers section of the tests tab there is a check box 'Min volume on'.
All test programs have an on-screen volume slider that allows the operator to
control the volume of the beep that occurs with each stimulus presentation.
The minimum setting is normally off. However, the UK DVLA requires Drivers
Visual Field tests to have an audible beep, i.e. you should not be able to turn it
off. To accommodate the DVLA requirements we have added a check box that
when checked meets this requirement. The minimum setting will be a quiet
beep rather than off.
Checking this box has no effect on the volume settings for other tests.
If you tick the Display percentage for catch trials box, it will give the catch trial
information as a percentage as well as a fraction. See the catch trials page
76
for more information
© 2017 Elektron Technology
Page 91

91Options program
5. 3
Computer
In the Computer tab of the options program you can customize certain
operations. This is where you select the perimeter's USB device. A list of
devices will appear in the box. Normally there will only be one device. if there
are multiple devices then click on the Hensons USB serial device.
When the software only box is ticked the software w ill no longer sends
messages to the bow l. This facility is available for those who wish to access the
database on a separate computer and to allow training and demonstration of
the softw are.
You can also change the displayed language here, select from the drop down
box.
Additional language files may be available to dow nload, check the website
www.elektron-healthcare.com/support for more details
© 2017 Elektron Technology
Page 92

92
Henson Perimeter User Manual
5. 4
Dat abas e
In the options program this tab specifies the name and path of the default
database . This is where:
By default the database will be set to store JPEG images, but if you require
Selecting Dicom will require additional licensing. please contact
To set the database path name:
1. Select the Drive letter. This will normally be the internal C: drive of the
100
Visual field records will be stored when you click Save at the end of a
85
visual field examination .
Records will be recalled when you open the database program from the
start-up screen.
Records for the selection of prior data will be recalled when opting to
start from existing data in the ZATA program.
Dicom images then you can select it here.
Info@elektroneyetechnology.com for details.
computer, but could be any other drive to which the computer has
access, e.g. a file server.
2. The directories available on the selected drive will be displayed in the
Directories list box. Select the one you wish to use.
3. Any database files within that directory will be listed in the Files list box.
Select the one you wish to use.
4. The selected path and file name will be displayed in the 'Selected
Database' box.
5. If you wish to reset to the default database, (C:\Henson9000\data
\fld8.db), press the Reset Default button.
© 2017 Elektron Technology
Page 93

The quality of the stored Jpeg image can be set. it can be any value between
75 and 300. the higher the number the better the image quality but it also
means the filesize is larger.
93Options program
If you do not use the database and only print test results then the software
has the ability to allow you to enter a patient's details on the printout.
If the "record details on printout" box is ticked, you will be prompted to enter
details when you press the print button.
The VA format used in the database record screen can be set here.
There is a setting for touch screen users that displays an on-screen keyboard
when the database search function is activated.
There is an option to auto create any image files that are missing. This is useful
if you have upgraded to this version of software and already had entries in the
database. The versions prior to 3.5 stored PDF files with the database and from
3.5 it stores jpeg images, which can be auto created for you.
© 2017 Elektron Technology
Page 94

94
Henson Perimeter User Manual
5. 5
Bac kup
In the Options program you can specify the database backup path. This is
where your database files are backed up. Normally this will be a network or
removable drive fitted to your computer.
If you have access to a network, then the backup location can be a mapped
drive on another computer/server.
The backup folder must be on a different drive to the default database and
can be any type of drive, except a CD-Rom drive.
For example:
E:\Henson_backups\
Only the location needs to be specified, the database name will be the same as
the current database.
You set the location by choosing the drive and folder in the boxes at the
bottom of the screen.
The database is automatically backed every time you save a visual field
record.
There is an option to include a copy of the image file(s) with the backup. This
used to be done by default, but if you do not want to do this due to space
requirements on the backup drive, you can untick the box and it will not backup
the image, only the database itself.
92
(The images can always be re-created at a later date from the database
information.)
When clicking Save within a test the softw are will try to access the backup
device, and if it is not present a warning will be displayed.
This warning is to tell you that the result was saved in the database but no
backup of the database was made.
© 2017 Elektron Technology
Page 95

A full backup will be made the next time you save a record and the backup drive
is available.
NOTE: From version 3.5 the backup system now uses a rolling 10 copy backup.
The backup file will be called <database name>_BKUPN.db where the N is an
increasing number from 1 to 10. After the 10th backup is made then the first
one will be overwritten. This means that any fault in the database that occurs
when saving will not propagate to the previous backups.
95Options program
You can make additional copies of the database using the Utilities program.
119
© 2017 Elektron Technology
Page 96

96
Henson Perimeter User Manual
5. 6
Video Set up
In the Options program the video tab allow s you to select the Henson camera and
optimise the image.
If the displayed image is not from the Henson camera then it will be necessary
to select the correct video device from the Video Input Device drop-down menu.
You can use the In/Out buttons to adjust the image zoom factor (note: this
is a digital zoom, so image quality is reduced at high magnification).
Use the up/down/left/right buttons to position the image in the video
window.
Adjust the Brightness and Contrast sliders to optimise the video image
display (these can also be adjusted when running a test program).
© 2017 Elektron Technology
Page 97

97Options program
5. 7
Int egrat ion
The integration tab lets you set the options for practice management
integration.(PMI)
PMI lets your practice management software start and run the Henson tests
taking patient data (name date of birth etc) from your practice mangement
system directly.
There are 2 methods of integration, passing parameters using programmable
buttons and text files.
The passing of parameters does not have any options and the test programs
will respond to the parameters if they are used.
The options program informs you of the date format that should be used when
passing the parameters - this is read from the regional settings of the PC that
the softw are is installed on.
The text file section lets you set the location and name of the text file that the
practice management software will write the patient details into. See Appendix
156
8 for details of the required contents of the file.
You should browse to the location where the Practice Management softw are
will place the text file. The folder will be shown in the path box.
Click on the filename box and using the keyboard that appears on screen (or a
real keyboard if you have one fitted) type the name of the file - remembering it
must end in ".txt"
See Appendix 8 - Practice management Integration for more details.
156
© 2017 Elektron Technology
Page 98

98
Henson Perimeter User Manual
5. 8
PDF
If your practice management or archiving software requires a PDF copy of the
printout to be saved then this can be achieved by setting a path in the PDF
section.
Use the drive and folder boxes at the bottom of the screen to browse to the
path required.
The path will be displayed in the box at the top of the screen.
You do not need to set the file name as this will be based on the patient
details.
© 2017 Elektron Technology
Page 99

99Options program
5. 9
Save/ Canc el
In the Options program each tab has a Save and Cancel button.
Once you have made the required changes click on any of the
tabbed pages. The changes made to all of the pages will be saved and the
options program will close.
To return without saving any changes click
To obtain help at any time regarding the options program, press the Help
button
© 2017 Elektron Technology
Page 100

100
Henson Perimeter User Manual
6
Database program
To access the Database program, and the records you have saved, exit any
test programs back to the main menu and click the Database button on the
menu bar.
You will then see the Database Screen below
The database has 2 views available, one is the traditional list view as in
previous versions of the software. the other is a tree view, where records are
grouped by patient surname.
The default view can be set in the options program and the view can be
92
changed by pressing the litview or treeview headings at the top of the list.
The Listview shows a list of records on the left hand side and a chart of the
currently selected record (Shown by an arrow > in the left-hand column) on
107
the right hand side.
Clicking over a record within the list will automatically select it for display. You
can move up and dow n the list with the arrow keys, page keys and by dragging
the vertical slider bar.
The treeview show s a list of surnames and by clicking on one will display all the
patient's first names. clicking on a first name will display all of the available
tests performed.
Where a ZATA test is selected, the data for each eye is shown on a separate
tab. You can swap images by clicking on the tabs at the top of the image.
To g et mo re h e lp o n a Da ta b a se ite m click o ve r th a t ite m o n th e ima g e b e lo w .
© 2017 Elektron Technology
 Loading...