

Page 1

Edwards SAPIEN XT
Transcatheter Heart Valve with the Ascendra+ Delivery System
Instructions for Use
Caution: Federal (USA) law restricts this device to sale by or on the order of a physician.
Implantation of the transcatheter heart valve should be performed only by physicians who
have received Edwards Lifesciences training. The implanting physician should be experienced
in balloon aortic valvuloplasty.
Please verify that you have the latest version of the instructions for use prior to using the
device by visiting http://THVIFU.edwards.com
or by calling 1.800.822.9837. In order to access
the instructions for use, an IFU Code will b e required.
STERILE: The valve is supplied sterilized with glutaraldehyde solution. The delivery system is
supplied sterilized with ethylene oxide gas.
_________________________________________________________________________________________
Edwards, Edwards Lifesciences, the stylized E logo, Ascendra, Ascendra+, Carpentier-Edwards,
Edwards SAPIEN, Edwards SAPIEN XT, PARTNER and PARTNER II, SAPIEN, SAPIEN XT, TFX, and
ThermaFix are trademarks of Edwards Lifesciences Corporation. All other trademarks are the property of their
respective owners.
1
Page 2

1.0 Device Description
2
2
Valve size recommendations are based on native valve annulus size, as measured by
Note: Risks associated with undersizing and oversizing should be considered.
Diameter
18-21 mm
23 mm
21-23.5 mm
26 mm
23.5-27 mm
29 mm
• Edwards SAPIEN XT Transcatheter Heart Valve – Model 9300TFX (Figure 1)
The Edwards SAPIEN XT transcatheter heart valve is comprised of a balloon-expandable,
radiopaque, cobalt-chromium frame, trileaflet bovine pericardial tissue valve, and a polyethylene
terephthalate (PET) fabric skirt. The leaflets are treated according to t he Car pe nti e r-Edwards
ThermaFix process.
Table 1
Valve Size Height
23 mm 14.3 mm
26 mm 17.2 mm
29 mm 19.1 mm
Table 2
Native Valve Annulus
Size
(TEE)
18-22 mm 314 – 415 mm
21-25 mm 415 – 530 mm
24-27 mm 530 – 660 mm
Native Valve Annulus Size
(CT)
Area
Area Derived
Diameter
20-23 mm 23 mm
23-26 mm 26 mm
2
26-29 mm 29 mm
Valve Size
transesophageal echocardiography (TEE) or computed tomography (CT). Patient anatomical
factors and multiple imaging modalities should be considered during valve size selection.
For transcatheter valve-in-surgical valve procedures, size recommendations for surgical
bioprostheses with internal orifice diameters are shown in Table 3.
Bioprosthesis Internal Orifice
Table 3
SAPIEN XT Valve Size
NOTE: The internal orifice diameter o f th e surgical bioprosthesis must be determi n ed so
that the appropriate valve size can be implanted. The bioprosthesis internal diameter of
the primary implanted device is best determined by using computed tomography,
magnetic resonance imaging, and/or tran sesophageal echocardiography to perfor m th e
necessary measurements. The internal orifice diameter is a directly measured or area
derived diameter measurement of the internal opening of the failed surgical valve.
NOTE: Exact volume required to deploy the valve may vary depending on the
bioprosthesis internal orifice diameter. Do not exceed the rated burst pressure .
See Table 4 for inflation parameters.
2
Page 3

• Ascendra+ Delivery System (Figures 2a, 2b, 2c)
Diameter
Volume
(RBP)
The Ascendra+ delivery system (useable length 55 cm) is used for delivery of the
Edwards SAPIEN XT transcatheter heart valve. The delivery system has radiopaque markers
for visualization under fluoroscopy and a balloon for deployment of the valve. A balloon inflation
hub, a guidewi re hub , and a pusher retraction feature are housed in the handle assembly. The
handle is labeled “BALLOON” at the balloon inflation hub and “WIRE 0.035"” at the guidewire
hub. The system also comes with a loader that is used to cover the valve during delivery. An
extension tube is supplied for use with the delivery system during inflation.
Table 4
Model
9355AS23 23 mm 16 mL 7 atm
9355AS26 26 mm 20 mL 7 atm
9355AS29 29 mm 30 mL 7 atm
Nominal
Balloon
Nominal
Inflation
Rated Burst
Pressure
2.0 Indications
The Edwards SAPIEN XT transcatheter heart valve, model 9300TFX, and accessories are indicated
for relief of aortic stenosis in patients with symptomatic heart disease due to severe native calcific
aortic stenosis who are judged by a Heart Team, including a cardiac surgeon, to be at intermediate or
greater risk for open surgical therapy (i.e., predicted risk of surgical mortality ≥ 3% at 30 days, based
on the Society of Thoracic Surgeons (STS) risk score and other clinical co-morbidities unmeasured by
the STS risk calculator).
3
Page 4

The Edwards SAPIEN XT transcatheter heart valve and accessories are also indicated for patients
with symptomatic heart disease due to failure (steno sed, insufficient, or combined) of a surgical
bioprosthetic aortic valve who are judged by a heart team, including a cardiac surgeon, to be at high or
greater risk for open surgical therapy (i.e., STS operative risk score ≥8% or at a ≥15% risk of mortality
at 30 days).
3.0 Contraindications
The valve and delivery system are contraindicated in patients who cannot tolerate an
anticoagulation/antiplatelet regimen or who have active bacterial endocarditis or other active
infections.
4.0 Warnings
• Observation of the pacing lead throughout the procedure is essential to avoid the potential risk
of pacing lead perforation.
• There may b e an increased risk of stroke in transcatheter aortic valve replacement
procedures, as compared to balloon aortic valvuloplasty or other standard treatments in high
or greater risk patients.
• The devices are designed, intended, and distributed for single use only. Do not resterilize or
reuse the devices. There are no data to support the sterility, nonpyrogenicity, and
functionality of the devices after reprocessing.
• Care should be exercised when sizing the native annulus or surgical valve; implanting a valve
that is too small may lead to paravalvular leak, migration or embolization, whereas implanting
a valve that is too large may lead to residual gradient (patient-prosthesis mismatch) or
annular rupture.
• Accelerated deterioration of the valve may occur in patients with an altered calcium
metabolism.
• Prior to delivery, the valve must remain hydrated at all times and cannot be exposed to
solutions other than its shipping storage solution and sterile physiologic rinsing solution. Valve
leaflets mishandled or damaged during any part of the procedure will require replacement of
the valve.
• Caution should be exercised in implanting a valve in patients with clinically significant coronary
artery disease.
• Patients with pre-existing mitral valve devices should be carefully assessed prior to
implantation of the valve to ensure proper valve positioning and deployment.
• Patients presenting with combination AV low flow, low gradient should undergo additional
evaluation to establish the degree of aortic stenosis.
• Do not use the valve if the tamper evident seal is broken, the storage solution does not
completely cover the valve, the temperature indicator has been activated, the valve is
damaged, or the expiration date has elapsed.
• Do not mishandle the Ascendra+ delivery system or use it if the packaging or any components
are not sterile, have been opened or are damaged (e.g. kinked or stretched), or the expiration
date has elapsed.
• Care should be exercised in patients with hypersensitivities to cobalt, nickel, chromium,
molybdenum, titanium, manganese, silicon, and/or polymeric materials.
• The procedure should be conducted under fluoroscopic guidance. Some fluoroscopically
guided procedures are associated with a risk of radiation injury to the skin. These injuries may
be painful, disfiguring, and long-lasting.
4
Page 5

• Valve recipients should be maintained on anticoagulant/antiplatelet therapy, except when
contraindicated, as determined by their physician. This device has not been tested for use
without anticoagulation.
• Do not add or apply antibiotics to the storage solution, rinse solutions, or to the valve.
5.0 Precautions
• Long-term durability has not been established for the valve. Regular medical follow-up is
advised to evaluate valve performance.
• Glutaraldehyde may cause irritation of the skin, eyes, nose and throat. Avoid prolonged or
repeated exposure to, or breathing of, the solution. Use only with adequate ventilation. If skin
contact occurs, immediately flush the affected area with water; in the event of contact with
eyes, seek immediate medical attention. For more information about glutaraldehyde exposure,
refer to the Material Safety Data Sheet available from Edwards Lifesciences.
• To maintain proper valve leaflet coaptation, do not overinflate the deployment balloon.
• Appropriate antibiotic prophylaxis is recommended post-procedure in patients at risk for
prosthetic valve infection and endocarditis.
• Safety, effectiveness, and durability have not been established for transcatheter valve in
transcatheter valve procedures.
• Safety and effectiveness have not been established for patients with the following
characteristics/comorbidities:
o Non-calcified aortic annulus
o Severe ventricular dysfunction with ejection fraction < 20%
o Congenital unicuspid or congenital bicuspid aortic valve
o Mixed aortic valve disease (aortic stenosis and aortic regurgitation with predominant
aortic regurgitation > 3+)
o Pre-existing prosthetic ring in any position
o Severe mitral annular calcification (MAC), severe (> 3+) mitral insufficiency, or Gorlin
syndrome
o Blood dyscrasias defined as: leukopenia (WBC < 3000 cells/mL), acute anemia
(Hb < 9 g/dL), thrombocytopenia (platelet count < 50,000 cells/mL), or history of bleeding
diathesis or coagulopathy
o Hypertrophic cardiomyopathy with or without obstruction (HOCM)
o Echocardiographic evidence of intracardiac mass, thrombus, or vegetation
o A known hypersensitivity or contraindication to aspirin, heparin, ticlopidine (Ticlid™), or
clopidogrel (Plavix™), or sensitivity to contrast media, which cannot be adequately
premedicated
o Excessive calci fication of vessel at acce ss site
o Bulky calcified aortic valve leaflets in close proximity to coronary ostia
o A concomitant paravalvular leak where the surgical bioprosthesis is not securely fixed in
the native annulus or is not struc tur all y intact (e.g. w iref or m frame fracture)
o A partially detached leaflet of the surgical bioprosthesis that in the aortic position may
obstruct a coronary ostium
5
Page 6

• The safety and effectiveness have not been established for implanting the transcatheter va lve
inside a stented bioprosthetic valve < 21 mm (labeled size) or an unstented bioprosthetic
aortic valve.
• Residual mean gradient may be higher in a "TAV-in-SAV" configuration than that observed
following implantation of the valve inside a native aortic annulus using the same size device.
Patients with elevated mean gradient post procedure should be carefully followed. It is
important that the manufacturer, model and size of the preexisting surgical bioprosthetic aortic
valve be determined, so that the appropriate valve can be implanted and a prosthesis-patient
mismatch be avoided. Additionally, pre-procedure imaging modalities must be employed to
make as accurate a determination of the internal orifice as possible.
6.0 Potential Adverse Events
Potential risks associated with the overall procedure including potential access complications
associated with standard cardiac catheterization, balloon valvuloplasty, the potential risks of
conscious sedation and/or general anesthesia, and the use of angiography:
• Death
• Stroke/transient ischemic attack, clusters or neurological deficit
• Paralysis
• Permanent disability
• Respiratory insufficiency or respiratory failure
• Hemorrhage requiring transfusion or intervention
• Cardiovascular injury including perforation or dissection of vessels, ventricle, myocardium or
valvular structures that may require intervention
• Pericardial effusion or cardiac tamponade
• Embolization incl ud ing air, c alcif ic valve material or thrombus
• Infection including septicemia and endocarditis
• Heart failure
• Myocardial infarc tion
• Renal insufficiency or renal failure
• Conduction system defect which may require a permanent pacemaker
• Arrhythmia
• Retroperitoneal bleed
• AV fistula or pseudoaneurysm
• Reoperation
• Ischemia or nerve injury
• Restenosis
• Pulmonary edem a
• Pleural effusion
• Bleeding
• Anemia
• Abnormal lab values (including electrolyte imbalance)
6
Page 7

• Hypertension or hypotension
• Allergic reaction to anesthesia, contrast media, or device materials
• Hematoma
• Syncope
• Pain or changes at the access site
• Exercise intolerance or weakness
• Inflammation
• Angina
• Heart murmur
• Fever
Additional potential risks associated with the use of the valve, delivery system, and/or accessories
include:
• Cardiac arrest
• Cardiogenic shock
• Emergency cardiac surgery
• Cardiac failure or low cardiac output
• Coronary flow obstruction/transvalvular flow disturbance
• Device thrombosis requiring intervention
• Valve thrombosis
• Device embolization
• Device migration or malposition requiring intervention
• Valve deployment in unintended location
• Valve stenosis
• Structural valve deterioration (wear, fracture, calcification, leaflet tear/tearing from the stent
posts, leaflet retraction, suture line disruption of components of a prosthetic valve, thickening,
stenosis)
• Device degeneration
• Paravalvular or transvalvular leak
• Valve regurgitation
• Hemolysis
• Device explants
• Nonstructural dysfunction
• Mechanical failure of delivery system, and/or accessories
• Non-emergent reoperation
7
Page 8

7.0 Directions for Use
7.1 Required Equipment
Table 5
23 mm System
Product Name
Edwards SAPIEN XT
Transcatheter Heart Valve
Ascendra+ Delivery System* 9355AS23 9355AS26 9355AS29
Ascendra+ Introducer Sheath
Set
Ascendra Balloon Aortic
Valvuloplasty Catheter
Edwards Crimper 9350CR
* Includes the Crimp Stopper
(9355ASP23A)
9300TFX (23 mm) 9300TFX (26 mm) 9300TFX (29 mm)
9350IS23 9350IS26 9350IS29
Inflation devices provided by Edwards Lifesciences
26 mm System
(9355ASP26A)
Model
9100BAVC
29 mm System
(9355ASP29A)
Additional Equipment:
• 20 cc syringe or larger (x2)
• 50 cc syringe or larger
• Standard cardiac catheterization lab equipment
• Fluoroscopy (fixed, mobile or semi-mobile fluoroscopy systems appropriate for use in
percutaneous coronary interventions)
• Transesophagea l or transthoracic echocardiography capabilities
• Exchange length 0.035 inch (0.89 mm) extra-stiff guidewire
• Temporary pacemaker (PM) and pacing lead
• Sterile rinsing basins, physiological saline, heparinized saline, 15% diluted radiopaque contrast
medium
• Sterile table for valve and device preparation
7.2 Valve Handling and Preparation
Follow sterile technique during device preparation and im plantat ion.
8
Page 9

7.2.1 Valve Rinsing Procedure
to come into contact with the bottom or sides of the rinse bowl
Flush loader through the distal end with heparinized saline and insert the delivery system (with proximal
Before opening the valve jar, carefully examine for evidence of damage (e.g., a cracked jar or lid,
leakage, or broken or missing seals).
CAUTION: Valves from containers found to be damaged, leaking, without adequate sterilant,
or missing intact seals must not be used for implantation.
Step Procedure
Set up two (2) sterile bowls with at least 500 mL of sterile physiological saline to thoroughly rinse the
1
glutaraldehyde sterilant from the valve.
Carefully remove the valve/holder assembly from the jar without touching the tissue. Verify the valve
2
serial identification number with the number on the jar lid and record in the patient information
documents. Inspect the valve for any signs of damage to the frame or tissue.
Rinse the valve as follows: Place the valve in the first bowl of sterile, physiological saline. Be sure the
saline solution completely covers the valve and holder. With the valve and holder submerged, slowly
agitate (to gently swirl the valve and holder) back and forth for a minimum of 1 minute. Transfer the
valve and holder to the second rinsing bowl of physiological saline and gently agitate for at least one
more minute. Ensure the rinse solution in the first bowl is not used. The valve should be left in the final
3
rinse solution until needed to prevent the tissue from drying.
CAUTION: Do not allow the valve
during agitation or swirling in the rinse solution. Direct contact between the identification tag
and valve is also to be avoided during the rinse procedure. No other objects should be placed in
the rinse bowls. The valve should be kept hydrated to prevent the tissue from drying.
7.2.2 Prepare the Components
Step Procedure
1
Visually inspect all components for damage.
Refer to Ascendra+ Introducer Sheath Set and Crimper instructions for use on device preparation and
2
handling.
Ensure the delivery system pusher is in the distal locked position using the slider cap. I f the sto p co ck i s
3
not attached to the delivery system, attach st opc oc k to the flush port. Flush delivery system at the flush
port with heparinized saline and close stopcock to delivery system.
4
Carefully remove distal balloon cover.
5
balloon cover on) into loader until loader is completely proximal.
6
Fully retract slider cap and rotate into proximal slot.
Slide the proximal balloon cover onto the balloon shaft and carefully peel off the proximal balloon cover
7
from the delivery system.
8
Flush and attach balloon extension tube to the balloon inflation hub.
Prepare a 50 cc or larger luer-lock syringe with diluted contrast solution (15:85 contrast to heparinized
9
saline) and attach to the extension tubing.
Completely fill the inflation device provided by Edwards with diluted contrast and attach to the
10
extension tubing stopcock. Ensure there are no air bubbles in the balloon. If an air bubble is detected,
eliminate it while deflating the balloon. Close the stopcock to the delivery system.
9
Page 10

Step Procedure
Note: Correct balloon sizing is critical to successful valve deployment and valve function.
deployment.
Remove excess contrast medium from the inflation device provided by Edwards into the syringe to
achieve the appropriate volume required to deploy the valve per the following. Then lock the inflation
device:
Delivery System Valve Inflation
11
12
Model 9355AS23 23 mm 16 mL
Model 9355AS26 26 mm 20 mL
Model 9355AS29 29 mm 30 mL
Close the stopcock to the 50 cc or larger syringe and remov e the syringe.
CAUTION: Maintain the inflation device provided by Edwards in the locked position until valve
Volume
7.2.3 Mount and Crimp the Valve onto the Delivery System
Step Procedure
1
Rotate the crimper until the aperture is fully opened.
2
Remove the valve from the holder and remove ID tag using sterile scissors.
3
Place valve into crimper aperture and partially crimp so that it fits loosely over the prepared balloon.
Remove the valve from the crimper and place it on the delivery system with the inflow (fabric cuff end)
of the valve proximally towards the pusher if accessing antegrade. If accessing retrograde, place the
4
valve on the delivery system with the inflow (fabric cuff end) of the valve towards the distal end away
from the pusher. Ensure that the valve is aligned between the radiopaque markers.
Place the valve/balloon assembly in crimper aperture and gradually crimp. Periodically open crimper to
verify correct placement of valve during crimping. Completely crimp until the handle contacts the crimp
stopper.
5
CAUTION: The implanting physician must verify correct mounting/orientation of the valve prior
to its implantation.
Advance the slider cap distally to allow the tip of the pusher to align with the proximal end of the
6
crimped valve.
Advance the loader onto crimped valve until it reaches the balloon shoulder and the valve is full y
7
covered.
While holding the loader in place, fully retract the slider cap and rotate into locked position. Flush
through the flush port to fill the loader and hydrate the valve. Once the valve is hydrated, advance the
slider cap and rotate into distal locked position. Be sure to maintain position of the crimped valve
between the radiopaque markers during hydration. Close the flush port stopcock to the delivery system.
8
Note: To facilitate flushing, keep the delivery system straight.
CAUTION: To prevent possible leaflet damage, the valve should not remain in the loader over 30
minutes.
Ensure the slider cap is locked in the distal position and that the valve is still centered between
radiopaque markers and fully inside the loader.
9
Note: Keep valve hydrated until ready for implantation.
10
Page 11

Step Procedure
Minimum Required
Annulus to Sheath Tip
Model 9355AS23
23 mm
5.0 cm
Model 9355AS26
26 mm
5.5 cm
Model 9355AS29
29 mm
6.0 cm
Remove the stylet and flush the guidewire lumen of the delivery system.
10
CAUTION: The implanting physician must verify correct orientation of the valve prior to its
implantation.
7.3 Valvuloplasty and Valve Delivery
Valvuloplasty and valve delivery should be performed under general anesthesia with hemodynamic
monitoring in a catheterization lab/hybrid operating room with fluoroscopic and echocardiographic
imaging capabilities.
The following table shows the minimum required distances from the native valve annulus to the distal
tip of the Ascendra+ sheath to allow the Ascendra+ delivery system balloon to inflate properly during
valve deployment. These distances should be considered during the transaortic approach when
selecting the access site on the ascending aorta and determining the insertion depth of the
Ascendra+ sheath into the aorta.
Delivery System Valve
Distance From
Administer heparin to maintain the ACT at ≥ 250 sec.
CAUTION: Contrast media use should be monitored to reduce the risk of renal injury.
7.3.1 B asel ine Par am ete rs
Step Procedure
1
Perform an angiogram with fluoroscopic view perpendicular to the valve.
Evaluate the height between the inferior aspect of the annulus and the inferior aspects of the lowest
2
coronary ostium for subsequent prosthetic aortic valve implantation.
3
Introduce a pacemaker (PM) lead until its distal end is positioned in the right ventricle.
4
Set the stimulation parameters, and test pacing.
7.3.2 Valvuloplasty
Refer to Ascendra Balloon Aortic Valvuloplasty Catheter Instructions for Use (IFU) for information on
device preparation and handling for a stenotic aortic valve.
Note: Rapid ventricular pacing s h o u ld be performed when using the Ascendra balloon aortic
valvuloplasty catheter for valvuloplasty prior to transcatheter valve implantation.
After placement of the balloon at the intended site, begin rapid ventricular pacing. Once the blood
pressure has decreased to 50 mmHg or below, balloon inflation can commence.
CAUTION: Valve implantation should no t b e carried out if the balloon cannot be fully inflated
during valvuloplasty.
11
Page 12

7.3.3 Valve Delivery
Retract pusher by rotating slider cap out of distal locked position and moving it proximally to ensure that
Step Procedure
Insert the introducer sheath. Refer to the Ascendra+ Introducer Sheath Set IFU for additional
1
information on device preparation and handling.
Advance delivery system over guidewire. Engage loader into introducer sheath housing while
2
maintaining a firm grip. Tap lightly on the introducer sheath housing to release air to the proximal end of
the loader. Lightly depress button valves on loader to aspirate the loader.
3
Cross the native aortic valve or bioprosthesis and position the transcatheter valve within the valve.
the tip of the pusher is retracted completely on to the balloon shaft.
4
CAUTION: The pusher must be pulled back completely on the balloon shaft for proper balloon
inflation and valve deployment.
5 Verify the correct position of the valve with respect to the valve.
Begin valve deployment:
• Unlock the inflation device.
• Begin rapid pacing; once arterial blood pressure has decreased to 50 mmHg or below,
balloon inflation can commence.
6
• Deploy the valve by inflating the balloon with the entire volume in the Inflation device provided by
Edwards Lifesciences, hold for 3 seconds and confirm that the barrel of the inflation device is empty to
ensure complete inflation of the balloon. When the balloon catheter has been completely deflated, turn
off the pacemaker.
• Retract the delivery system into the introducer sheath.
7
Disengage loader from sheath and remove delivery system and loader.
8
Remove sheath when the ACT level is appropriate (e.g. reaches < 150 sec). Close access site.
8.0 How Supplied
STERILE: The valve is supplied sterilized with glutaraldehyde solution. The delivery system is
supplied sterilized with ethylene oxide gas.
8.1 Storage
The valve must be stored at 10 °C to 25 °C (50 °F to 77 °F). Each jar is shipped in an enclosure
containing a temperature indicator to detect exposure of the valve to extreme temperature.
The delivery system should be stored in a cool, dry place.
9.0 MR Safety
MR Conditional
Non-clinical testing has demonstrated that the Edwards SAPIEN XT transcatheter heart valve is MR
Conditional. A patient with this device, when implanted in the native valve or a failed surgical
bioprosthesis, can be scanned safely, immediately after placement of this device under the following
conditions:
• Static magnetic field of 1.5 tesla or 3 tesla
• Maximum spatial gradient field of 2500 gauss/cm (25 T/m) or less
• Maximum MR system reported, whole body averaged specific absorption rate (SAR) of 2 W/kg
(Normal Operating Mode)
Under the scan conditions defined above, the SAPIEN XT transcatheter heart valve is expected to
produce a maximum temperature rise of 2.6 °C after 15 minutes of continuous scanning.
12
Page 13

In non-clinical testing, the image artifact caused by the device extends as far as 14.5 mm from the
implant for spin echo images and 30 mm for gradient echo images when scanned in a 3.0 T MRI
system. The artifact obscures the device lumen in gradient echo images.
The implant has not been evaluated in MR systems other than 1.5 or 3.0 T.
For valve-in-surgical valve implantation or in the presence of other implants, please refer to MRI
safety information for the surgical valve or other devices prior to MR imaging.
10.0 Patient Information
Patient education brochures are provided to each site and should be given to the patient to inform
them of the risks and benefits of the procedure and alternatives in adequate time before the
procedure to be read and discussed with their physician. A copy of this brochure may also be
obtained from Edwards Lifesciences by calling 1.800.822.9837. A patient implant card request form is
provided with each transcatheter heart valve. After implantation, all requested information should be
completed on this form. The serial number may be found on the package and on the identification tag
attached to the transcatheter heart valve. The original form should be returned to the
Edwards Lifesciences address indicated on the form and upon receipt, Edwards Lifesciences will
provide an identification card to the patient.
11.0 Recovered valve and Device Disposal
The explanted valve should be placed into a suitable histological fixative such as 10% formalin or 2%
glutaraldehyde and returned to the company. Refrigeration is not necessary under these
circumstances. Contact Edwards Lifesciences to request an Explant Kit.
Used delivery system may be disposed of in the same manner that hospital waste and biohazardous
materials are handled. There are no special risks related to the disposal of these devices.
12.0 Clinical Studies
The PARTNER II Cohort B Registries
Cohort B of The Placement of Aortic Transcatheter Valves Trial II (PARTNER II) included registries
for the transapical and transaortic delivery of the SAPIEN XT valve. These registries include the
following:
• NR1: Inoperable Transapical (TA) Registry – transapical delivery of the 23 mm or
26 mm SAPIEN XT valve.
• NR3: Registry for Transcatheter Heart Valve in Aortic Surgical Valve Implantation (THV-
SV). Patients with failing aortic bioprosthetic surgical valve with a surgical mortality or major
morbidity ≥ 50% and meeting the sizing requirements for 23 mm or 26 mm SAPIEN XT valve.
• NR4: Inoperable Transaortic (TAo) Registry – transaortic delivery of the 23 mm or 26 mm
SAPIEN XT valve.
• NR6: Inoperable Transapical Registry for the delivery of 29 mm SAPIEN XT valve in patients
that did not have eligible transfemoral access.
Following completion of enrollment in the nested registries, the FDA approved continued access
enrollment in the nested registries (CANRs).
SOURCE Registry XT:
SOURCE Registry XT is an international multi-center prospective, consecutively enrolled,
observational registry. Consecutive patient data have been collected at discharge, 30 days, and 12
months post-implant, and will be collected annually thereafter up to 5 years post-implant.
Results of PARTNER II Cohort B Registries (NR1, NR4 and NR6)
A total of 265 patients were treated in PARTNER II Cohort B Nested Registries 1, 4, and 6. The
primary safety and effectiveness endpoint was freedom from all-cause mortality at 1 year. The KM
estimate at 30 days involving freedom from all-cause mortality was 92.0 ± 1.7%.
13
Page 14

There were 1.9% major strokes, no incidence of endocarditis, 1.5% myocardial infarction, 5.7% major
vascular complications, 11.3% disabling bleeding events, 3.0% cardiac intervention, and 4.5% new
pacemaker at 30 days.
NYHA went from 3.2 ± 0.61 at baseline to 1.9 ± 0.88 at 30 days. The mean change was -1.3 ± 1.10.
Device success was observed in 69.6% of patients (165/237). The mean hospitalization stay was
11.1 ± 8.96 days which included 4.5 ± 7.12 days in the ICU. The mean EOA was 0.7 ± 0.19 cm
baseline and 1.6 ± 0.43 cm
2
at 30 days, and the average mean gradient decreased from
2
at
41.2 ± 12.17 mmHg at baseline to 8.6 ± 3.59 mmHg at 30 days. The mean peak gradient decreased
from 73.2 ± 21.51 mmHg at baseline to 17.7 ± 7.30 mmHg at 30 days.
Results of SOURCE XT
A total of 2688 patients were enrolled. The vast majority of patients (96%) were treated with either the
transapical (TA) or transfemoral (TF) approach. Only a small proportion of patients were treated with
transaortic (TAo) or subclavian approaches. The implant approach was 62.7% for TF, 33.3% for TA,
3.76% for TAo and 0.3% for subclavian. The results only include the TF, TA and TAo approaches
(n = 2680).
Using K-M event rates at 30 days post implant for the TF, TA/TAo population, 6.2% of patients had
died, 3% due to a cardiac death, 3.6% of patients had suffered a stroke, and 6.6% had a major
vascular complication. Major/life threatening bleeding had occurred in 14.9% of patients, major
bleeding in 10.2%, and renal failure or AKI in 17.8%. Permanent pacemakers were implanted in 9.5%
of patients. Using K-M event rates at 1 year post implant for the TF, TA/TAo population, 19.5% of
patients had died, 9.5% of these from cardiac death, and 6.3% of patients had suffered a stroke.
Major/life-threatening bleeding had occurred in 17.3% of patients, major bleeding in 12%, major
vascular complications in 7.2%, renal failure or AKI in 20.5% and 11% of patients had a new
pacemaker implanted.
Of the 2688 patients that were enrolled, fifty-seven (57) of these patients had the SAPIEN XT valve
implanted into a failing surgical prosthesis. The TF approach was used in 23 patients, and the
TA/TAo approach was used in 34 patients. The implanted valve size was 23 mm in 38 patients
(66.7%), 26 mm in 14 patients (24.6%), and 29 mm in 5 patients (8.8%).
No deaths, no strokes, no major vascular complications, no life threatening bleedings, one (1) renal
failure, and no new permanent pacemakers were reported at 30 days post implant for the TF
population. At 1 year post implant, 3 deaths were reported for the TF population.
In the TA/TAo population, 3 deaths, 1 (major) stroke, 2 major vascular complications, 3 life
threatening bleedings, and 4 new perm anent pacemakers were reported at 30 days. At 1 year post
implant, 4 additional deaths, 1 additional (minor) stroke, 1 additional major vascular complication, and
1 additional new permanent pacemaker were reported for the TA/TAo population.
The PARTNER II Cohort B Aortic Valv e-in-Valve Registry (NR3/CANR3)
A clinical study was performed to establish a reasonable assurance of safety and effectiveness of
transcatheter aortic valve replacement with the Edwards SAPIEN XT valve in patients with a failing
surgical bioprosthetic aortic valve (i.e., “TAV-in-SAV”). The study was carried out as a single-arm
registry nested (i.e., the PARTNER II Trial), which was designated as “NR3.” NR3 was originally
approved for 100 patients and later expanded under a Continued Access Protocol (CAP). Data from
the original NR3 cohort and the NR3 CAP (CANR3) cohort were pooled at 30 days and 1 year data
was available for the NR3 cohort only.
Patients were treated at 40 investigational sites between June 12, 2012 and December 10, 2013. The
database for this PMA supplement reflected data collected through February 26, 2015 and included
199 patients (2 patients withdrew prior to treatment). By the last database extract performed on
February 26, 2015, all of these patients were included in the 30-day data analysis, and 97 patients
were included in the 1-year analysis.
The NR3 study was a single arm, prospective, observational, descriptive study without formal
hypothesis testing. The patients were limited to those who were deemed by a heart team to have a
14
Page 15

mortality or major morbidity rate of ≥ 50% for replacement of a failing surgical aortic valve and met the
sizing requirements for the 23 mm or 26 mm SAPIEN XT valve. The specific sizing requirements
were imposed because the 29 mm SAPIEN XT valve was not available whe n the study was initiated.
Contractors were utilized for analysis and interpretation of the clinical data, including an independent
Data Safety Monitoring Board (DSMB) that was instructed to notify the applicant of any safety or
compliance issues, a Clinical Event Committee (CEC) that was responsible for adjudicating endpointrelated events reported during the trial per definitions established a priori, an Electrocardiography
(ECG) Core Lab for independent analysis of rhythm and occurrence of myocardial infarction, and an
Echocardiography Core Lab for independent analysis of all echocardiograms.
Results of PARTNER II Cohort B Aortic Valve-in-Valve Registry (NR3/CANR3)
Since identical protocols were used in the pivotal and CAP cohort investigations, data from the two
cohorts were pooled.
The “Attempted Implant” population consisted of all screen success patients for whom the index
procedure was started. The “Valve Implant” population consisted of those patients for whom the valve
implant process was completed. A total of 199 patients were screened for study participation. Two
patients withdrew consent prior to treatment; therefore, there were 197 “Attempted Implant” patients.
Two “Attempted Implant” patients were excluded from the “Valve Implant” population, because in one
patient, intra-procedural TEE demonstrated a low transvalvular jet velocity (2.6 m/s) and gradient of
24 mmHg which did not meet the inclusion criteria, and in the other patient, the procedure was
aborted due to inability to place the purse string sutures for transapical access. The patient
disposition is summarized in Table 12.
The demographics of the pooled study population are summarized in the Table 13. The mean age
was 78.5 years, and 60.4% were male. A high proportion of patients had significant comorbidities,
frailty, and prior cardiac interventions. The mean STS score was 9.7, and 95.4% of all patients were
in NYHA classes III or IV.
Table 14 provides a summary of the failed surgical valves treated, which consisted of 94.4%
bioprosthesis, 4.6% homografts, and 1.0% other valve types. Aortic stenosis was the predominant
cause of prosthetic failure (54.2%), followed by mixed lesion (23.4%) and insufficiency/regurgitation
(22.4%).
The primary endpoint of all-cause mortality, all stroke, moderate or severe obstruction, or moderate or
severe paravalvular leak was 16.9% at 30 days and 38.0% at 1 year, as shown in Table 15.
No unanticipated adverse device effects (UADEs) were reported throughout the trial. Three explants
have been reported to date; one explant occurred at autopsy, and two during surgical aortic valve
replacement due to severe aortic insufficiency on postoperative day 5 and day 18, respectively. No
CEC adjudicated endocarditis was reported.
The key safety outcomes adjudicated by the CEC for this study are presented in Table 16 through
Table 18.
Valve hemodynamics as assessed by echocardiography is summarized in Table 19 and Figure 11
through Figure 15. The mean DVI increased from 0.27 ± 0.10 at baseline to 0.37 ± 0.09 at 30 days
and 0.39 ± 0.11 at 1 year. The mean gradient decreased from 36.1 ± 16.38 mmHg at baseline to 17.4
± 7.37 mmHg at 30 days, which was maintained at 1 year. The mean peak gradient decreased from
65.0 ± 26.76 mmHg at baseline to 32.7 ±
12.90 mmHg at 30 days, which was maintained at 1 year. Moderate/severe aortic regurgitation was
present in 43.7% of subjects at baseline, which decreased to 2.5% at 30 days and 1.9% at 1 year.
Moderate/severe paravalvular leak was present in 6.8% of subjects at baseline, 2.5% at 30 days, and
1.9% at 1 year.
It is important to note that although mean and peak gradients were significantly reduced as compared
to baseline for the “TAV-in-SAV” procedure, the residual mean and peak gradients were numerically
higher than those observed for TAVR procedures performed for native valve stenosis.
15
Page 16

The NYHA class by visit is shown in Figure 16. About 89% of subjects were in NYHA I/II at 30 days
and 84% at
1 year as compared to 5% at baseline.
The mean improvement in 6MWD among the Attempted Implant population was 49.8 ± 169.9 meters
from baseline to 30 days and 86.1 ± 142.0 meters from baseline to 1 year.
The mean hospitalization stay among the Attempted Implant population was 7.9 ± 7.0 days, which
included 2.9 ± 5.0 days in the ICU.
The QoL at different time points as measured by the Kansas City Cardiomyopathy Questionnaire
(KCCQ) clinical summary score is shown in Figure 17. The mean KCCQ summary score among the
Attempted Implant population improved from 45.5 ± 21.8 at baseline to 68.0 ± 22.0 at 30 days and
70.4 at 1 year.
Device success was defined as successful vascular access, delivery and deployment and retrieval of
delivery system; correct positioning, intended performance (aortic valve area > 1.2 cm
2
and mean
aortic valve gradient < 20 mmHg or peak velocity < 3 m/s, without moderate or severe prosthetic
valve aortic regurgitation. It was achieved in 61.5 % of patients. In the vast majority of device failure
subjects, the failure was due to unintended performance of the valve; specifically, mean gradient ≥ 20
mmHg or peak velocity ≥ 3 m/s was observed in 62 cases and moderate/severe aortic regurgitation in
5 cases.
16
Page 17

PARTNER II Cohort B Registries Clinical Data
Table 6:
Baseline Characteristics and Echocardiographic Findings for NR1, NR4 and NR6 (AT Population)*
SAPIEN XT Valve (TA/TAo)
Characteristic
(N = 265)
Age - yr
82.0 ± 7.79
Male sex — no. (%)
141/265 (53.2%)
STS score†
10.3 ± 5.51
Logistic EuroSCORE‡
13.2 ± 11.96
NYHA class — no. (%):
I/II
24/264 (9.1%)
III/IV
240/264 (90.9%)
Coronary artery disease — no./total no. (%)
194/265 (73.2%)
Previous myocardial infarctio n — no./total no. (%)
56/265 (21.1%)
Previous intervention — no./total no. (%)
CABG
118/265 (44.5%)
PCI
107/265 (40.4%)
Balloon aortic valvuloplasty
72/265 (27.2%)
Peripheral vascular disease — no./total no. (%)
150/265 (56.6%)
COPD — no./total no. (%):
Any
101/265 (38.1%)
Oxygen-dependent
41/265 (15.5%)
Creatinine > 2 mg/dL (177 μmol/liter) — no./total no. (%)
28/265 (10.6%)
Atrial fibrillation — no./total no. (%)
95/265 (35.8%)
Permanent pacemaker — no./tot al no. (%)
43/265 (16.2%)
Pulmonary hypertension — no./total no. (%)
34/254 (13.4%)
Frailty§ — no./total no. (%)
97/254 (38.2%)
Extensively calcified aorta — no./total no. (%)
42/254 (16.5%)
Chest-wall deformity — no./total no. (%)
6/254 (2.4%)
Liver disease — no./total no. (%)
9/265 (3.4%)
Echocardiographic findings
Aortic-valve area — cm2
0.7 ± 0.19
Mean aortic-valve gradient — mmHg
41.2 ± 12.17
Mean LVEF — %
52.5 ± 13.37
Moderate or severe mitral regurgitation** — no./total no. (%)
70/232 (30.2%)
* Plus–minus values are mean ± SD. To convert the value for creatinine to micromoles per liter, multiply by 88.4.
** Moderate or severe mitral regurgitation was defined as regurgitation of grade 3+ or higher.
Cohort B (Inoperable)
AT denotes As Treated population, CABG denotes coronary-artery bypass grafting, COPD chronic obstructive
pulmonary disease, LVEF left ventricular ejection fraction, NYHA New York Heart Association, PCI percutaneous
coronary intervention, and TAVR transcatheter aortic-valve implantation.
†
The Society of Thoracic Surgeons (STS) score measures patient risk at the time of cardiovascular surgery on a
scale that ranges from 0% to 100%, with higher numbers indicating greater risk. An STS score higher than 10%
indicates very high surgical risk.
‡
The logistic European System for Cardiac Operative Risk Evaluation (EuroSCORE), which measures patient
risk at the time of cardiovascular surgery, is calculated with the use of a logistic-regression equation. Scores
range from 0% to 100%, with higher scores indicating greater risk. A logistic EuroSCORE higher than 20%
indicates very high surgical risk.
§
Frailty was determined by the surgeons according to prespecified criteria.
17
Page 18

Table 7:
Cohort B (Inoperable) Clinical Outcomes at 30 days for NR1, NR4 and NR6
(AT Population)*
Death from any cause
21/265 (7.9%)
Major Stroke
5/265 (1.9%)
Repeat hospitalizationb
8/265 (3.0%)
Death from any cause or major stroke or repeat hospitalization
31/265 (11.7%)
Myocardial Infarction
4/265 (1.5%)
Major Vascular Complications
15/265 (5.7%)
Renal Failurec
7/265 (2.6%)
Disabling Bleeding Eventd
30/265 (11.3%)
Cardiac Reinterventione
8/265 (3.0%)
Endocarditis
0/265 (0.0%)
New Atrial Fibrillationf
9/167 (5.4%)
New pacemaker
12/265 (4.5%)
* AT = As Treated, NA = not applicable, TAVR = transcatheter aortic valve replacement. Dat a prese nted as n/N
f. Based on 167 patients at 30 days.
Table 8:
Population)
SAPIEN XT Valve
(N = 265)
Patients with
Event
12
12/265 (4.5%)
12
12/222 (5.4%)
1
Subjects with pacemaker or ICD at baseline are included (all patients included in denominator).
denominators.
Outcomea
SAPIEN XT Valve
(N = 265)
(%) of patients.
a. CEC adjudicated.
b. Repeat hospitalizations were included if they were due to aortic stenosis or complications of the valve
procedure (e.g., TAVR).
c. Renal failure is defined as stage III acute kidney injury: Increase in serum creatinine to ≥ 300% (3 x increase
compared with baseline) or serum creatinine of ≥ 4 mg/d (≥ 354 μmol/L) with an acute increase of at least 0.5
mg/dl (44 μmol/L).
d. Disabling bleeding: Fatal bleeding OR bleeding in a critical area or organ, such as intracranial, intraspinal,
intraocular, or pericardial necessitating pericardiocentesis, or intramuscular with compartment syndrome OR
bleeding causing hypovolemic shock or severe hypotension requiring vasopressors or surgery OR overt source
of bleeding with drop in hemoglobin of ≥ 5 g/dL or whole blood of packed red blood cells (RBC) transfusion ≥ 4
units.
e. Cardiac reintervention includes any intervention that repairs, alters or replaces a previously operated valve
OR balloon aortic valvuloplasty OR Surgical aortic valve replacement OR valve in valve
Conduction Disturbance Requiring Pacemaker to 30 Days for NR1, NR4 and NR6 (CEC Adjudicated) (AT
Event Events
New Permanent Pacemaker- All Patients1
0-30 Days
New Permanent Pacemaker – Patients without pre-procedural pacemaker2
0-30 Days
2
Subjects with pacemaker or ICD at baseline are excluded (patients with baseline pacemaker/ICD subtracted
from denominator).
Note: The patients who received a new pacemaker in both rows are the same patients. The only difference is the
18
(TA/TAo)
Page 19

Figure 3:
0%
10%
20%
30%
40%
50%
60%
70%
0 5 10 15 20 25 30
All-Cause Mortality or M ajor Str oke or
Rehospitalization
Days Post-Procedure
SAPIEN XT
11.8%
No. at Risk
SAPIEN XT
265
250
247
245
241
240
234
All-Cause Mortality, Major Stroke or Re-Hospitalization to
30 Days, NR1, NR4, and NR6 – TA/TAo
(AT Population)
19
Page 20

Figure 4:
0%
10%
20%
30%
40%
50%
60%
70%
0 5 10 15 20 25 30
All-Cause Mortality
Days Post-Procedure
SAPIEN XT
8.0%
No. at Risk
SAPIEN XT
265
254
251
250
248
247
241
0%
5%
10%
15%
20%
0 5 10 15 20 25 30
Major Stroke
Days Post-Procedure
SAPIEN XT
1.9%
No. at Risk
SAPIEN XT
265
250
247
247
246
245
239
All-Cause Mortality to 30 Days, NR1, NR4, and NR6 –
TA/TAo
Figure 5:
Major Stroke at 30 Days, NR1, NR4, and NR6 – TA/TAo
(AT Population)
20
Page 21

Figure 6:
0%
5%
10%
15%
20%
0 5 10
15
20 25 30
Rehospitalization
Days Post-Procedure
SAPIEN XT
3.2%
No. at Risk
SAPIEN XT
265
254
251
248
243
242
236
0.7
1.6
0
0.5
1
1.5
2
2.5
Baseline
30 Days
Effective Orifice Area (cm²)
SAPIEN XT
No. of Echos
SAPIEN XT
231
193
Re-Hospitalization at 30 Days, NR1, NR4, and NR6 –TA/TAo
(AT Population)
Figure 7:
Effective Orifice Area, NR1, NR4, and NR6 – TA/TAo
(Valve Implant Population)
21
Page 22

41.2
8.6
0
10
20
30
40
50
60
Baseline
30 Days
Gradient (mmHg)
SAPIEN XT
No. of Echos
SAPIEN XT
244
200
Table 9:
(AT Population)
Figure 8:
Mean Gradient, NR1, NR4, and NR6 – TA/TAo
(Valve Implant Population)
NYHA Functional Class By Visit for NR1, NR4 and NR6
SAPIEN XT Valve (N = 265)
Visit I II III IV Total
Baseline 1 23 158 82 264
30 Days 84 88 45 12 229
22
Page 23

Figure 9:
0.4%
37.0%
10.1%
38.8%
58.1%
19.4%
31.3%
4.8%
0%
20%
40%
60%
80%
100%
Percent
IIIIII
IV
Baseline
TA/TAo
227
30 Days
TA/TAo
227
50.0
56.6
0
20
40
60
80
100
Baseline
30 Days
Mean Scores
SAPIEN XT
No. of Pts
SAPIEN XT
249
213
NYHA Class by Visit, NR1, NR4, and NR6 – TA/TAo
(Intent-to-Treat Population)
Figure 10:
KCCQ Clinical Summary Score, NR1, NR4, and NR6 – TA/TAo
(AT Population)
23
Page 24

SOURCE XT Clinical Data
Table 10:
(AT Population)*
Transfemoral
TA/TAo Pooled
Characteristic
(N = 1685)
(N = 995)
Age - yr
82.0 ± 6.5
80.3 ± 6.5
Male sex — no. (%)
600 / 1685 (35.6%)
536 / 995 (53.9%)
STS score†
8.0 ± 6.8
7.9 ± 6.2
Logistic EuroSCORE‡
19.8 ± 11.6
21.6 ± 13.7
NYHA class
I/II — no./tot al no. (%)
377 / 1676 (22.5%)
242 / 992 (24.4%)
III/IV — no./total no. (%)
1299 / 1676 (77.5%)
750 / 992 (75.6%)
Coronary artery disease — no./total no. (%)
667 / 1685 (39.6%)
518 / 995 (52.1%)
Previous myocardial infarctio n — no./total no. (%)
205 / 1685 (12.2%)
197 / 995 (19.8%)
Previous intervention
CABG — no./total no. (%)
204 / 1685 (12.1%)
226 / 995 (22.7%)
PCI — no./total no. (%)
460 / 1685 (27.3%)
355 / 995 (35.7%)
Balloon aortic valvuloplasty — no./total no. (%)
128 / 1685 (7.6%)
66 / 995 (6.6%)
Cerebral vascular disease — no./tot al no. (%)
191 / 1685 (11.3%)
143 / 995 (14.4%)
Peripheral vascular disease — no./total no. (%)
248 / 1684 (14.7%)
320 / 995 (32.2%)
COPD
Pulmonary Artery Disease COPD — no./total no. (%)
327 / 1684 (19.4%)
218 / 995 (21.9%)
Pulmonary Artery Disease Oxygen Dependent — no./total no. (%)
31 / 1684 (1.8%)
11 / 995 (1.1%)
Creatinine > 2 mg/dL (177 μmol/liter) — no./total no. (%)
104 / 1681 (6.2%)
114 / 994 (11.5%)
Atrial fibrillation — no./total no.
395 / 1678 (23.5%)
289 / 990 (29.2%)
Permanent pacemaker — no./tot al no. (%)
170 / 1685 (10.1%)
134 / 995 (13.5%)
Pulmonary hypertension — no./total no. (%)
440 / 1684 (26.1%)
204 / 995 (20.5%)
Frailty§ — no./total no. (%)
896 / 932 (96.1%)
548 / 579 (94.6%)
Extensively calcified aorta — no./total no. (%)
71 / 1684 (4.2%)
103 / 995 (10.4%)
Chest-wall deformity — no./total no. (%)
18 / 1684 (1.1%)
6 / 995 (0.6%)
Liver disease — no./total no. (%)
52 / 1685 (3.1%)
27 / 995 (2.7%)
Echocardiographic findings
Aortic-valve area — cm2
0.7 ± 0.21
0.7 ± 0.21
Mean aortic-valve gradient — mmHg
49.2 ± 16.54
45.0 ± 15.43
Mean LVEF — %
55.1 ± 12.48
53.2 ± 12.50
Moderate or severe mitral regurgitation** — no./total no. (%)
345 / 1633 (21.1%)
174 / 976 (17.8%)
* Plus–minus values are means ± SD. To conv ert the v alue for cr eatinine to m icromo les per li t er, multiply by 88.4. AT
** Moderate or severe mitral regurgitation was defined as regurgitation of grade 3+ or higher.
SOURCE XT (High Risk) Baseline Characteristics of the Patients and Echocardiographic Findings
denotes as treated population, CA BG denotes coronar y -artery bypass grafting, COPD chronic obstructive pul monary
disease, LVEF left ventricular ejection fracti on, N Y H A New Y ork Heart Associati on, P CI percut aneous coron ar y
intervention, and TAVR transcatheter aortic-valve implantation.
†
The Society of Thoracic Surgeons (ST S) score measures pa tient risk at the time of cardiovascular surgery on a scale that
ranges from 0% to 100%, with higher numbers indicating gr ea ter risk. An S T S score higher th an 10% indicates very high
surgical risk.
‡
The logistic European System for Car diac Oper ativ e Risk Evaluation ( Eur oSC OR E) , w hich measures patient ris k at the
time of cardiovascular surgery, is calculated with the use of a logistic-regression eq uation. S c ores range fr om 0% to 100%,
with higher scores indicating greater risk. A logistic EuroSCORE higher than 20% indicate s v ery high sur gical ris k.
§
Frailty was determined by the surgeons a ccording t o pr espe ci fied criter ia.
24
Page 25

Table 11:
(AT Population)*
30 Days
1-Year
Transfemoral
TA/TAo
Transfemoral
TA/TAo
Outcome
(N = 1685)
(N = 995)
(N = 1685)
(N = 995)
All Cause Death
71 (4.2%)
96 (9.7%)
248 (15.0%)
266 (27.0%)
Cardiac Death
28 (1.7%)
51 (5.2%)
106 (6.7%)
132 (14.4%)
Stroke
All Stroke
56 (3.4%)
39 (4.1%)
90 (5.6%)
66 (7.6%)
Major Stroke
34 (2.0%)
27 (2.8%)
55 (3.5%)
44 (5.0%)
Repeat hospitalizationb
80 (4.9%)
83 (9.0%)
396 (25.5%)
314 (36.7%)
Myocardial Infarction
7 (0.4%)
9 (0.9%)
23 (1.5%)
21 (2.5%)
Major Vascular Complications
132 (7.9%)
43 (4.4%)
139 (8.3%)
52 (5.5%)
Renal Failured/AKI
197 (11.9%)
270 (28.0%)
240 (14.7%)
292 (30.6%)
Life-threatening bleedingc
63 (3.8%)
84 (8.6%)
74 (4.5%)
101 (10.6%)
Endocarditis
2 (0.1%)
2 (0.2%)
15 (1.0%)
10 (1.2%)
New Atrial Fibrillation
54 (3.3%)
83 (8.8%)
89 (5.6%)
109 (12.0%)
New pacemaker
145 (8.7%)
105 (10.8%)
165 (10.0%)
120 (12.7%)
* AT = As Treated, TAVR = transcatheter aortic valve replacement. Data presented as n (%) of patients where % is
(44 μmol/L)
Table 12:
1
Attempted Implant: All screen success patients for whom the Index Procedure
consisting of those patients for whom the valve implant process was completed.
SOURCE XT (High Risk) Clinical Outcomesa at 30 days and 1 year
the Kaplan-Meier event rate at 30-days and 1-year respectively.
a. CEC adjudicated
b. Repeat hospitalizations were included if they were due to aortic stenosis or complications of the valve procedure
(e.g., TAVR).
c. Disabling bleeding: Fatal bleeding OR bleeding in a critical area or organ, such as intracranial, intraspinal,
intraocular, or pericardial necessitating pericardiocentesis, or intramuscular with compartment syndrome OR bleeding
causing hypovolemic shock or severe hypotension requiring vasopressors or surgery OR overt source of bleeding
with drop in hemoglobin of ≥ 5 g/dL or whole blood of packed red blood cells (RBC) transfusion ≥ 4 units
d. Renal failure is defined as stage III acute kidney injury: Increase in serum creatinine to ≥ 300% (3 x increase
compared with baseline) or serum creatinine of ≥ 4 mg/d (≥ 354 μmol/L) with an acute increase of at least 0.5 mg/dl
PARTNER II Nested Registry 3/ Continued Access Nested Registry 3 (NR3/CANR3) (Aortic
Valve-in-Valve)
Patient Disposition
Attempted Implant1 Valve Implant2
Number of Patients 197 195
was started. Patients were analyzed according to the valve used in the initial
implant attempt.
2
Valve Implant: This population was a subset of the Attempted Implant group,
25
Page 26

Table 13:
Demographic and Baseline Characteristics
Results1 (N=197)
Age – yr
78.5 ± 11.001
Male sex
119/197 (60.4%)
STS score
9.7 ± 5.09
New York Heart Association (NYHA) class
I/II
9/197 (4.6%)
III/IV
188/197 (95.4%)
Coronary artery disease
139/197 (70.6%)
Previous myocardial infarctio n
25/197 (12.7%)
Previous intervention
Coronary artery bypass grafting (CABG)
97/197 (49.2%)
Percutaneous coronary intervention (PCI)
39/197 (19.8%)
Prior aortic valvuloplasty
17/197 (8.6%)
Cerebral vascular accident (CVA)
29/197 (14.7%)
Peripheral vascular disease
49/197 (24.9%)
Chronic obstructive pulmonary disease (COPD)
Any
65/197 (33.0%)
Oxygen-dependent
14/197 (7.1%)
Creatinine > 2 mg/dL (177 µmol/liter)2
25/197 (12.7%)
Atrial fibrillation
98/197 (49.7%)
Permanent pacemaker
51/197 (25.9%)
Pulmonary hypertension
26/197 (13.2%)
Frailty3
65/197 (33.0%)
Extensively calcified aorta
12/197 (6.1%)
Chest-wall deformity
4/197 (2.0%)
Liver disease
14/197 (7.1%)
Reason for Valve Replacement
Mixed Lesion
45/192 (23.4%)
Insufficiency/regur gita t ion O nly
43/192 (22.4%)
Stenosis Only
104/192 (54.2%)
Echocardiographic findings
Doppler Velocity Index (DVI)4
0.27 ± 0.10
Mean aortic-valve gradient — mmHg
35.9 ± 16.42
Mean left ventricular ejection fraction (LVEF) — %
49.8 ± 13.87
Moderate or severe mitral regurgitation5
62/171 (36.3%)
1
Moderate or severe mitral regurgitation was defined as regurgitation of grade 3+ or higher.
Attempted Implant Population
Characteristic
Quantitative data are expressed as mean ± SD (n). Categorical data are expressed as no./total no. (%).
2
To convert the value for creatinine to micromoles per liter, multiply by 88.4.
3
Frailty was determined by the surgeons according to pre-specified criteria.
4
DVI is a flow-dependent measure of orifice stenosis. A DVI < 0.25 suggests significant stenosis.
5
26
Page 27

Table 14:
Summary of Failed Bioprosthetic Surgical Valves
Results1 (N=197)
Type of Failed Surgical Valve
Bioprosthesis
184 / 195 (94.4%)
Homograft
9 / 195 (4.6%)
Other 2
2 / 195 (1.0%)
Reason for Valve Replacement
Mixed Lesion
45/192 (23.4%)
Insufficiency/regurgitation Only
43/192 (22.4%)
Stenosis Only
104/192 (54.2%)
1
Table 15:
Valve Implant Population
1
Composite of all-cause mortality, all stroke, moderate or severe obstruction, moderate or severe paravalvular leak . Mortal i t y and
ion at
the 30-day follow-up visit.
2
Doppler velocity index (DVI) < 0.25 per the echo core lab read.
3
Confidence intervals calculated using exact binomial calculations. The confidence intervals are calc ul ated without multiplicity
illustrate the variability only and should not be used to draw any statistical conclusion.
Attempted Implant Population
Categorical data are expressed as no./total no. (%).
2
Other includes an unidentified manufactured tissue valve and a St. Jude mechanical composite.
All-Cause Mortality, All Str ok e, Moderate o r Severe Obstruction, or Moderate or Severe
Paravalvular Leak
Events
30 Days
(N=195)
Patients with
Event
95% Confidence
Interval3
Patients with
Event
1 Year
(N=96)
95% Confidence
Interval
Composite Event1 28/166 (16.9%) [11.5%, 23.4%] 27/71 (38.0%) [26.8%, 50.3%]
All-Cause Mortality 8/195 (4.1%) [1.8%, 7.9%] 19/96 (19.8%) [12.4%, 29.2%]
All Stroke 5/195 (2.6%) [0.8%, 5.9%] 3/96 (3.1%) [0.6%, 8.9%]
Moderate or Severe Obstruction2 12/169 (7.1%) [3.7%, 12.1%] 6/54 (11.1%) [4.2%, 22.6%]
Moderate or Severe PV Leak 4/162 (2.5%) [0.7%, 6.2%] 1/53 (1.9%) [0.0%, 10.1%]
stroke are calculated at 30 days. The moderate or severe obstruction and paravalvular leak use the Echo core lab’s determinat
adjustment. The adjusted confidence intervals could be wider than presented here. As such, confidence intervals are provided to
27
Page 28

Table 16:
CEC Adjudicated Adverse Events
Attempted Implant Population
Rate (no./total no. (%))
30 Days
(N=197)
1 Year
(N=97)
Death1
From any cause
8/197 (4.1%)
19/97 (19.6%)
From cardiovascular cause
7/197 (3.6%)
15/97 (15.5%)
Major Stroke
5/197 (2.5%)
3/97 (3.1%)
Myocardial Infarction
5/197 (2.5%)
3/97 (3.1%)
Major Vascular Complications
8/197 (4.1%)
6/97 (6.2%)
Acute Kidney Injury, Stage III2
2/197 (1.0%)
N/A
Disabling Bleeding3
19/197 (9.6%)
16/97 (16.5%)
Cardiac Reintervention4
4/197 (2.0%)
2/97 (2.1%)
Endocarditis
0/197 (0.0%)
0/97 (0.0%)
New Atrial Fibrillation
4/135 (3.0%)
2/45 (4.4%)
New Pacemaker
3/197 (1.5%)
1/97 (1.0%)
1
Deaths from unknown causes were assumed to be deaths from cardiovascular causes.
2
least 0.5 mg/dl (44 µmol/L) within 72 hours of the procedure (per the VARC-1 definition).
3
Disabling bleeding: Fatal bleeding OR bleeding in a critical area or organ, such as intracranial,
blood of packed red blood cells (RBC) transfusion ≥ 4 units (Life-threatening per VARC-1 definitions).
4
Cardiac reintervention includes any intervention that repairs, alters or replaces a previously operated
valve OR balloon aortic valvuloplasty OR Surgical aortic valve replacement OR valve in valve.
Adverse Events
Acute kidney injury, stage III is defined as an increase in serum creatinine to ≥ 300% (3 x increase
compared with baseline) or serum creatinine of ≥ 4 mg/d (≥ 354 µmol/L) with an acute increase of at
intraspinal, intraocular, or pericardial necessitating pericardiocentesis, or intramuscular with
compartment syndrome OR bleeding causing hypovolemic shock or severe hypotensi on requi ri ng
vasopressors or surgery OR overt source of bleeding with drop in hemoglobin of ≥ 5 g/dL or whole
28
Page 29

Table 17:
Kaplan-Meier (KM) Event Rate for CEC Adjudicated Major Vascular Complications, Major Stroke, Minor
Attempted Implant Population
Patients
Estimate
1
Standardized endpoint definitions for transcatheter aortic valve im plantation cli nic al tri als cons ensus from t he Valve Academic
2
Kaplan-Meier estimates used the first event per patient. Events occurring after day 30 and day 365 were not included in the
Table 18:
Attempted Implant Population
30 Days
(N=197)
1 Year
(N=97)
Patients
with Event
Patients
with Event
New Permanent
Patients
3
3/197 (1.5%)
1
1/97 (1.0%)
New Permanent
pacemaker
3
3/146 (2.1%)
1
1/70 (1.4%)
1
Subjects with pacemaker or ICD at baseline were included (all patients included in denominator).
denominators.
Stroke, TIA, and Acute Kidney Injury
30 Days
(N=197)
1 Year
(N=97)
Patients
VARC Event1 Events
Major Vascular
15 14 0.071 (0.043, 0.117) 14 12 0.127 (0.074, 0.213)
with
Event
KM
Estimate2 95% CI3 Events
with
Event
KM
95% CI
Complications
and/or Major Stroke
and/or Minor Stroke
and/or TIA and/or
Acute Kidney Injury,
Stage III
Major Vascular
8 8 0.041 (0.021, 0.080) 6 6 0.062 (0.029, 0.134)
Complications
Major Stroke 5 5 0.025 (0.011, 0.060) 5 3 0.032 (0.010, 0.096)
Minor Stroke 0 0 0.000 N/A 0 0 0.000 N/A
TIA 0 0 0.000 N/A 1 1 0.013 (0.002, 0.089)
Acute Kidney Injury,
2 2 0.010 (0.003, 0.040)
Stage III
Research Consortium (VARC). Events with missing or incomplete onset dates were excluded from the analysis.
analysis of the 30-day and 1-year results, respectively.
3
Confidence intervals calculated using Greenwood’s formula. The confidence intervals are calculated without multiplicity
adjustment. The adjusted confidence intervals could be wider than presented here. As such, confidence intervals are provided to
illustrate the variability only and should not be used to draw any statistical conclusion.
Conduction Disturbance Requiring New Permanent Pacemaker
Events
Pacemaker- All
1
Pacemaker – Patients
without preexisting
2
Subjects with pacemaker or ICD at baseline were excluded (patients with baseline pacemaker/ICD
2
subtracted from denominator).
Note: The patient who received a new pacemaker in both rows is the same patient. The only difference is the
Events
29
Page 30

Table 19:
Valve Hemodynamics Measured by Echocardiography
Valve Implant Population
Baseline
(N=195)
Discharge
(N=195)
30 Days
(N=195)
1 Year
(N=96)
Doppler Velocity Index - mean ± SD (n)
All Valve Sizes 0.27 ± 0.10 (173) 0.37 ± 0.09 (161) 0.37 ± 0.09 (169) 0.39 ± 0.11 (54)
23 mm (N=140) 0.26 ± 0.09 (123) 0.36 ± 0.10 (114) 0.36 ± 0.09 (118) 0.38 ± 0.11 (38)
26 mm (N=55) 0.29 ± 0.13 (50) 0.40 ± 0.08 (47) 0.41 ± 0.11 (51) 0.44 ± 0.11 (16)
Mean Gradient (mmHg) - mean ± SD (n)
All Valve Sizes 36.1 ± 16.38 (179) 18.2 ± 7.79 (168) 17.4 ± 7.37 (176) 17.3 ± 8.76 (56)
23 mm (N=140) 37.2 ± 16.86 (129) 19.5 ± 8.19 (120) 19.0 ± 7.64 (125) 18.8 ± 9.32 (40)
26 mm (N=55) 33.2 ± 14.84 (50) 15.0 ± 5.51 (48) 13.4 ± 4.79 (51) 13.7 ± 5.91 (16)
Peak Gradient (mmHg) - mean ± SD (n)
All Valve Sizes 65.0 ± 26.76 (179) 34.3 ± 13.67 (168) 32.7 ± 12.90 (176) 32.8 ± 15.58 (56)
23 mm (N=140) 66.9 ± 27.49 (129) 36.5 ± 14.36 (120) 35.4 ± 13.30 (125) 35.2 ± 16.80 (40)
26 mm (N=55) 60.1 ± 24.34 (50) 29.0 ± 10.05 (48) 26.2 ± 9.09 (51) 26.7 ± 10.04 (16)
Total Aortic Regurgitation - no./total no. (%)
All Valve Sizes
None 22/174 (12.6%) 74/164 (45.1%) 86/163 (52.8%) 34/53 (64.2%)
Trace 34/174 (19.5%) 64/164 (39.0%) 58/163 (35.6%) 15/53 (28.3%)
Mild 42/174 (24.1%) 21/164 (12.8%) 15/163 (9.2%) 3/53 (5.7%)
Moderate 47/174 (27.0%) 4/164 (2.4%) 3/163 (1.8%) 1/53 (1.9%)
Severe 29/174 (16.7%) 1/164 (0.6%) 1/163 (0.6%) 0/53 (0.0%)
23 mm
None 21/124 (16.9%) 55/116 (47.4%) 63/115 (54.8%) 23/37 (62.2%)
Trace 29/124 (23.4%) 43/116 (37.1%) 39/115 (33.9%) 12/37 (32.4%)
Mild 32/124 (25.8%) 14/116 (12.1%) 10/115 (8.7%) 2/37 (5.4%)
Moderate 29/124 (23.4%) 3/116 (2.6%) 2/115 (1.7%) 0/37 (0.0%)
Severe 13/124 (10.5%) 1/116 (0.9%) 1/115 (0.9%) 0/37 (0.0%)
26 mm
None 1/50 (2.0%) 19/48 (39.6%) 23/48 (47.9%) 11/16 (68.8%)
Trace 5/50 (10.0%) 21/48 (43.8%) 19/48 (39.6%) 3/16 (18.8%)
Mild 10/50 (20.0%) 7/48 (14.6%) 5/48 (10.4%) 1/16 (6.3%)
Moderate 18/50 (36.0%) 1/48 (2.1%) 1/48 (2.1%) 1/16 (6.3%)
Severe 16/50 (32.0%) 0/48 (0.0%) 0/48 (0.0%) 0/16 (0.0%)
Paravalvular Leak - no./total no. (%)
All Valve Sizes
None 121/162 (74.7%) 76/164 (46.3%) 91/162 (56.2%) 35/53 (66.0%)
Trace 18/162 (11.1%) 66/164 (40.2%) 56/162 (34.6%) 15/53 (28.3%)
Mild 12/162 (7.4%) 17/164 (10.4%) 11/162 (6.8%) 2/53 (3.8%)
30
Page 31

Table 19:
Valve Hemodynamics Measured by Echocardiography
Valve Implant Population
Baseline
(N=195)
Discharge
(N=195)
30 Days
(N=195)
1 Year
(N=96)
Pooled NR3/CANR3
NR3 Only
DVI
0.1
0.2
0.3
0.4
0.5
0.6
Baseline 30 Day 1 Year
0.26
0.36 0.38
0.29
0.41 0.44
0.27
0.37 0.39
Study Valve Size 23 26 All
Moderate 8/162 (4.9%) 4/164 (2.4%) 3/162 (1.9%) 1/53 (1.9%)
Severe 3/162 (1.9%) 1/164 (0.6%) 1/162 (0.6%) 0/53 (0.0%)
23 mm
None 92/121 (76.0%) 55/116 (47.4%) 68/114 (59.6%) 24/37 (64.9%)
Trace 15/121 (12.4%) 47/116 (40.5%) 36/114 (31.6%) 11/37 (29.7%)
Mild 10/121 (8.3%) 10/116 (8.6%) 7/114 (6.1%) 2/37 (5.4%)
Moderate 2/121 (1.7%) 3/116 (2.6%) 2/114 (1.8%) 0/37 (0.0%)
Severe 2/121 (1.7%) 1/116 (0.9%) 1/114 (0.9%) 0/37 (0.0%)
26 mm
None 29/41 (70.7%) 21/48 (43.8%) 23/48 (47.9%) 11/16 (68.8%)
Trace 3/41 (7.3%) 19/48 (39.6%) 20/48 (41.7%) 4/16 (25.0%)
Mild 2/41 (4.9%) 7/48 (14.6%) 4/48 (8.3%) 0/16 (0.0%)
Moderate 6/41 (14.6%) 1/48 (2.1%) 1/48 (2.1%) 1/16 (6.3%)
Severe 1/41 (2.4%) 0/48 (0.0%) 0/48 (0.0%) 0/16 (0.0%)
Figure 11:
Doppler Velocity Index by Visit
Valve Implant Population
31
Page 32

Figure 12:
Pooled NR3/CANR3
NR3 Only
Pooled NR3/CANR3
NR3 Only
Mean Gradient (mmHg)
0
10
20
30
40
50
60
70
Baseline 30 Day 1 Year
37.2
19.0
18.8
33.2
13.4 13.7
36.1
17.4
17.3
Study Valve Size 23
26 All
Peak Gradient (mmHg)
0
10
20
30
40
50
60
70
80
90
100
110
Baseline 30 Day 1 Year
66.9
35.4 35.2
60.1
26.2 26.7
65.0
32.7 32.8
Study Valve Size 23 26 All
Mean Gradient by Visit
Valve Implant Population
Figure 13:
Peak Gradient by Visit
Valve Implant Population
32
Page 33

Figure 14:
None Trace Mild Moderate Severe
Percent
0
20
40
60
80
100
Study Valve Size23 26 All
Baseline 30 Day
1 Year
Baseline 30 Day 1 Year Baseline 30 Day 1 Year
17%
13%
23%
10%
20%
26%
20%
24%
23%
36%
27%
10% 32% 17%
55%
48%
53%
34%
40%
36%
9%
10%
9%
62%
69%
64%
32%
19%
28%
5%
6%
6%
6%
None Trace Mild Moderate Severe
Percent
0
20
40
60
80
100
Study Valve Size23
26
All
Baseline 30 Day 1 Year Baseline 30 Day 1 Year Baseline 30 Day 1 Year
76%
71%
75%
12%
7%
11%
8%
5%
7%
15%
5%
60%
48%
56%
32%
42%
35%
6%
8%
7%
65%
69%
66%
30%
25%
28%
5% 6%
Total Aortic Regurgitation by Visit
Valve Implant Population
Figure 15:
Paravalvular Leak by Visit
Valve Implant Population
33
Page 34

Figure 16:
I II III IV
Percent
0
20
40
60
80
100
Pooled NR3/CANR3 NR3 Only
Baseline 30 Day 6 Month 1 Year
5%
58%
38%
48%
41%
10%
66%
21%
13%
45%
39%
12%
4%
Mean Score
0
10
20
30
40
50
60
70
80
90
100
Baseline 30 Day 1 Year
45.5
68.0
70.4
NYHA Class by Visit
Attempted Implant Population
Figure 17:
KCCQ Clinical Summary Score
Attempted Implant Population
34
Page 35

Table 20:
Device Success and Reason for Device Failure
Valve Implant Population
Device Success
1
Rate
2
Success
115/187 (61.5%)
Failure
72/187 (38.5%)
Factor 1: Unsuccessful access, delivery, deployment, or retrieval of delivery
system
Factor 2: Position - Too Aortic or Too Ventricular
2/72 (2.8%)
Factor 3a: mean gradient ≥ 20 mmHg or peak velocity ≥ 3 m/s
62/70 (88.6%)
Factor 3b: Moderate/ Severe Aortic Regurgitation
5/71 (7.0%)
Factor 4: More than 1 valve implanted
3/72 (4.2%)
1
Device success was defined as successful vascular access, delivery and deployment and retrieval of delivery
with an overall failure and non-missing data for that factor.
system; correct positioning of the valve, intended performance (mean aortic valve gradient < 20 mmHg or
peak velocity < 3 m/s, without moderate or severe prosthetic valve AR), only one valve implanted. Each
participant who failed could experience a failure in more than one factor. If a patient failed one factor, the
device was considered a failure even if other factors were undetermined due to missing data.
2
The results are expressed as no. / total no. (%). The denominator for each factor was equal to the patients
The PARTNER IIA Study Design
PIIA was a 1:1 randomized, controlled study independently powered to compare the
results of TAVR with the SAPIEN XT valve t o traditional, open-heart aortic valve surgery
(i.e., surgical aortic valve replacement or SAVR). The SAPIEN XT valve was available in
sizes 23 mm, 26 mm, and 29 mm.
Patients were enrolled from December 2011 to November 2013. The database reflected
data collected through February 1, 2016 and included 1,011 patients in the SAPIEN XT
arm and 1,021 patients in the SAVR arm at 57 investigational sites in the U.S. and
Canada.
The study used an independent Data Safety Monitoring Board (DSMB) that was
instructed to notify Edwards Lifesciences of any safety or compliance issues and a
Clinical Events Committee (CEC) that was responsible for adjudicating endpoint related
events reported during the trial. The CEC adjudicated the events per definitions
established a priori, which were primarily VARC-1 definitions with the following
exceptions:
• AKI was adjudicated with a modified VARC-1 definition in which the CEC
identified the peak creatinine within 30 days of the index procedure, 30 days to 1
year, and 1 year to 2 years to determine if it met the definition of AKI.
• Aortic valve reintervention, hemolysis, and pericarditis were adjudicated per
Protocol definition.
• Rehospitalization f or symptoms of AS and/or complications of the valve
procedure were adjudicated using the Protocol and VARC-1 as guidelines.
• Bleeding events were adjudicated irrespective of whether there was an
identifiable, overt source of bleeding and could be adjudicated based on
transfusion or hemoglobin drop alone.
Also, an ECG core laboratory was used for independent analysis of rhythm, and an
echocardiographic core laboratory for independently analyzing all echocardiograms.
11/72 (15.3%)
35
Page 36

A. Accountability of the PMA Cohor t
Populationa
Populationb
Populationc
Table 22:
All
(N = 1011)
TF only
(N = 775)
Non-TF Only
(N = 236)
Age (Years)
81.5±6.7
81.8±6.7
80.6±6.6
81.7±6.7
(54.8%)
Society of Thoracic
New York Heart Association (NYHA) class
(23.9%)
776/1020
Coronary Artery Disease
700/1011 (69.2%)
531/775 (68.5%)
169/236 (71.6%)
679/1021
Table 21 presents patient accountability in the PIIA trial. The SAPIEN XT patients had either a
transfemoral (TF) or non-transfemoral (non-TF) access.
Table 21:
Patient Accountability
Intent to Treat
As Treated
Valve Implant
SAPIEN XT 1011 994 974
Transfemoral 775 762 749
Non-Transfemoral 236 232 225
SAVR 1021 944 936
a. Intent to Treat (ITT): All randomized patients
b. As Treated (AT): All enrolled/randomized patients for whom the Index Procedure is started. Patients were
analyzed according to the valve used in the initial implant attempt.
c. Valve Implant (VI): All As Treated patients whose valve implant process is completed.
In the SAPIEN XT ITT population, 187 patients exited the study prior to the 2-year visit. Of the
remaining 824 patients who were due for the 2-year visit, 784 patients (95.1%) completed the 2year visit, and 40 patients (4.9%) missed the 2-year visit.
In the SAVR ITT population, 216 patients exited the study prior to the 2-year visit. Of the
remaining 805 patients who were due for the 2-year visit, 710 patients (88.2%) completed the 2year visit, and 95 patients (11.8%) missed the 2-year visit.
B. Study Population Demographics and Base l ine Parameters
The demographics and baseline characteristics of the ITT population are presented in
Table 22. Among the SAPIEN XT population, 775 patients were implanted via the
transfemoral (TF) access route and 236 patients via the non-TF access route, including
transapical (TA) or transaortic (TAo) access.
Demographics &
Characteristic
Male Sex 548/1011 (54.2%) 426/775 (55.0%) 122/236 (51.7%)
Surgeons (STS) score
I/II 229/1011 (22.7%) 174/775 (22.5%) 55/236 (23.3%)
III/IV 782/1011 (77.3%) 601/775 (77.5%) 181/236 (76.7%)
Demographics and Baseline Characteristics
(ITT Population)
SAPIEN XT
5.8±2.1 5.8±2.1 6.0±2.1 5.8±1.9
36
SAVR
(N = 1021)
560/1021
244/1020
(76.1%)
Page 37

Table 22:
Demographics and Baseline Characteristics
All
(N = 1011)
TF only
(N = 775)
Non-TF Only
(N = 236)
(66.5%)
Previous Myocardial
Infarction
179/1021
(17.5%)
Previous Reintervention
Grafting
(25.6%)
Percutaneous coronary
282/1021
(4.9%)
104/1021
(10.2%)
Peripheral vascular
disease
336/1021
(32.9%)
Chronic obstructive pulmonary disease
306/1021
(30.0%)
32/1021
(3.1%)
359/1021
(35.2%)
123/1021
(12.0%)
(2.5%)
15/1019
(1.5%)
(0.1%)
Chest deformities that
procedure
5/1019
(0.5%)
Echocardiographic findings (VI Population)
Effective orifice area
(EOA) - cm2
Mean aortic valve gradient
- mmHg
Moderate or severe mitral
regurgitation
153/841
(18.2%)
Continuous measures – M ean ± SD; Categorical measures – n/Total no. (%)
(ITT Population)
Demographics &
Characteristic
185/1011 (18.3%) 137/775 (17.7%) 48/236 (20.3%)
Coronary Artery Bypass
intervention
Prior aortic valvuloplasty 51/1011 (5.0%) 35/775 (4.5%) 16/236 (6.8%)
Cerebral vascular accident 103/1011 (10.2%) 67/775 (8.6%) 36/236 (15.3%)
Any 321/1011 (31.8%) 228/775 (29.4%) 93/236 (39.4%)
Oxygen-dependent 34/1011 (3.4%) 20/775 (2.6%) 14/236 (5.9%)
Atrial fibrillation 313/1011 (31.0%) 245/775 (31.6%) 68/236 (28.8%)
239/1011 (23.6%) 179/775 (23.1%) 60/236 (25.4%)
274/1011 (27.1%) 202/775 (26.1%) 72/236 (30.5%)
282/1011 (27.9%) 167/775 (21.5%) 115/236 (48.7%)
SAPIEN XT
SAVR
(N = 1021)
261/1021
(27.6%)
50/1021
Permanent pacemaker 118/1011 (11.7%) 91/775 (11.7%) 27/236 (11.4%)
Pulmonary hypertension 29/1011 (2.9%) 25/775 (3.2%) 4/236 (1.7%)
Frailty 12/1011 (1.2%) 11/775 (1.4%) 1/236 (0.4%)
Porcelain aorta 0/1011 (0.0%) 0/775 (0.0%) 0/236 (0.0%)
preclude an open chest
Cirrhosis 0/1011 (0.0%) 0/775 (0.0%) 0/236 (0.0%)
0/1011 (0.0%) 0/775 (0.0%) 0/236 (0.0%)
0.7±0.2 0.7±0.2 0.7±0.2 0.7±0.2
45.0±13.3 45.0±13.6 44.7±12.3 44.7±12.6
146/875 (16.7%) 116/677 (17.1%) 30/198 (15.2%)
25/1019
1/1019
0/1019
(0.0%)
37
Page 38

(ITT Population)
SAPIEN XT (N = 1011)
SAVR (N = 1021)
Patients
Patients
Patients
Point
Estimate
Standard
Error
Point
Estimate
Standard
Error
All-cause
2 years
All-cause
2 years
Disabling
2 years
*
Events with missing or inc omplete onset dates are excluded from the analysis.
†
days are not included in the analysis.
C. Safety and Effectiveness Results
a. Primary Endpoint
The results of the composite primary endpoint of all-cause death or disabling (major)
stroke at 2 years and each component are presented for the ITT population in Table 23
and Figures 18-20. The K-M estimate of the composite event for SAPIEN XT was found
to be non-inferior to that for SAVR (19.3% vs. 21.1%; p=0.0014).
Table 23:
All-Cause Death or Disabling (Major) Stroke at 2 Years
Event
death or
disabling
stroke at
death at
stroke at
K-M estimates are provided at 2 years (day 730) and use the first event per patient. Events occurring after 730
No. of
Events
229 192 774 19.3% 1.3% 235 202 695 21.1% 1.3%
166 166 798 16.7% 1.2% 170 170 719 18.0% 1.3%
63 59 774 6.2% 0.8% 65 61 695 6.4% 0.8%
*
with
Event
No.
at Risk
K-M Estimate†
No. of
Events
Patients
with
*
Event
No.
at Risk
K-M Estimate†
38
Page 39

Figure 18:
All-Cause Death or Disabling (Major) Stroke through 2 Years
Figure 19:
provided to illustrate the variability only and should not be used to draw any statistical conclusion.
(ITT Population)
Note: The confidence intervals at 30 days and 12 months were calculated without multiplicity
adjustment. The adjusted confidence intervals could be wider than presented here. As such,
confidence intervals are provided to illustrate the variability only and should not be used to draw
any statistical conclusion.
All-Cause Death through 2 Years
(ITT Population)
Note: The confidence intervals were calculated without multiplicity adjustment. The adjusted
confidence intervals could be wider than presented here. As such, confidence intervals are
39
Page 40

Table 24:
TF
(N = 775)
Patients
Point
Estimate
Standard
Error
Point
Estimate
Standard
Error
2 years
All-cause
at 2
year
Figure 20:
Disabling (Maj or) Stroke through 2 Years
(ITT Population)
Note: The confidence intervals were calculated without multiplicity adjustment. The adjusted
confidence intervals could be wider than presented here. As such, confidence intervals are
provided to illustrate the variability only and should not be used to draw any statistical conclusion.
The results for the primary endpoint and its components for the SAPIEN XT ITT population by access
approach are presented in Table 24. The TF access had clinically lower all-cause death and disabling
(major) stroke rates than did the non-TF access.
All-Cause Death or Disabling (Major) Stroke to 2 Years by Access Approach
(SAPIEN XT ITT Population)
Event
All-cause
death or
disabling
stroke at
death
No. of
Events
151 128 612 16.8% 1.4% 78 64 162 27.7% 3.0%
108 108 630 14.2% 1.3% 58 58 168 25.2% 2.9%
Patients
with
*
Event
No.
Patients
at Risk
K-M Estimate†
No. of
Events
*
with
Event
Non-TF
(N = 236)
No.
Patients
at Risk
K-M Estimate†
40
Page 41

Table 24:
All-Cause Death or Disabling (Major) Stroke to 2 Years by Access Approach
TF
(N = 775)
Non-TF
Patients
Point
Estimate
Standard
Error
Point
Estimate
Standard
Error
All-cause
2 years
2 years
*
†
730 days are not included in the analysis.
(SAPIEN XT ITT Population)
Event
No. of
Events
Patients
with
*
Event
No.
Patients
at Risk
K-M Estimate†
No. of
Events
*
with
Event
(N = 236)
No.
Patients
at Risk
K-M Estimate†
death or
disabling
151 128 612 16.8% 1.4% 78 64 162 27.7% 3.0%
stroke at
Disabling
stroke at
43 39 612 5.3% 0.8% 20 20 162 9.1% 1.9%
Events with missing or incomplete onset dates are excluded from the analysis.
Kaplan-Meier estimates are provided at 2 years (day 730) and use the first event per patient. Events occurring after
b. Key Secondary Endpoints for Labeling
The results for the six key secondary endpoints for labeling using the Hochberg’s step-up
method for multiple tests are presented for the ITT population in Table 25 and for the astreated (AT) population in Table 26. SAPIEN XT was found to be non-inferior to SAVR in
NYHA class at 2 years, DAOH to 2 years, 6MWT distance at 2 years, and EOA at 2 years.
The 6MWT distance at 2 years was superior to that at baseline in the SAPIEN XT patients.
41
Page 42

Table 25:
Summary Statistics*
Reference
SAPIEN XT
SAVR
Fail to reject null
Change in 6MWT
distance from baseline to
only; I TT)
Reject null hypothesis
of endpoints
637.5±203.2
619.0±223.1
18.6
6MWT distance at 2
years (ITT)
203.2±132.4
(615)
209.8±153.5
(513)
-6.6
(-23.5, 10.3)
*
Mean ± SD (n)
†
§
severe=4. It was treated as a continuous variable and compared using the t-test.
Table 26:
(AT/VI Population)
Summary Statistics*
Reference
SAPIEN XT
SAVR
Fail to reject null
on to next line
Change in 6MWT
distance from baseline to
Reject null hypothesis
NYHA at the 2-year visit
1.5±0.7
1.4±0.6
0.1
201.5 (958)
222.4 (883)
(-0.2, 38.7)
6MWT distance at the 2-
203.2±132.4
209.8±153.5
-6.6
1.5±0.4
1.4±0.4
0.14
*
Mean ± SD (n)
†
§
severe=4. It was treated as a continuous variable and compared using the t-test.
Key Secondary Endpoints Comparisons Using the Hochberg Method
(ITT/VI Population)
Endpoint
Total AR at 2 years§ (VI)
2 years (SAPIEN XT
NYHA class at 2 years
(ITT)
DAOH to 2 years (ITT)
1.2±1.0
(606)
14.5±128.7
(604)
1.5±0.7
(737)
(960)
0.5±0.7
(520)
NA NA 0.0057 0.025
1.4±0.6
(649)
(885)
Difference† p-value
0.8
(0.67, 0.86)
0.1
(0.0, 0.2)
(-1.0, 38.1)
>0.9999 0.05
<0.0001
<0.0001
α
Statistical Inference
hypothesis and move
on to next line
and conclude noninferiority for the rest
<0.0001
EOA at 2 years (VI)
1.5±0.4
(567)
1.4±0.4
(488)
0.1
(0.09, 0.19)
<0.0001
Difference (95% CI)
Total AR was graded as: none=0, trace=1, mild and mild-moderate=2, moderate and moderate-severe=3, and
Key Secondary Endpoints Comparisons Using the Hochberg Method
Endpoint
Total AR at 2 years (VI)
2 years (SAPIEN XT
only; AT)
(AT)
DAOH to 2 years (AT)
year visit (AT)
EOA at 2 years (VI)
1.2±1.0
(606)
14.5±128.7
(604)
(737)
638.8 ±
(615)
(567)
0.5±0.7
(520)
NA NA 0.0057 0.025
(649)
619.5 ±
(513)
(488)
Difference† p-value
0.8
(0.7, 0.9)
(0.0, 0.2)
19.2
(-23.5, 10.3)
(0.09, 0.20)
>0.9999 0.05
<0.0001
<0.0001
<0.0001
<0.0001
α
Statistical Inference
hypothesis and move
and conclude noninferiority for the rest
of endpoints
Difference (95% CI)
Total AR was graded as: none=0, trace=1, mild and mild-moderate=2, mo der at e and moderate-severe=3, and
42
Page 43

Adjunctive Secondary Endpoints
Table 27:
Relative Risk
SAVR
Composite event to 30
days or discharge†
378/994
(38.0%)
493/944
(52.2%)
*
Imputed dates are used for events with incomplete onset dates.
insufficiency.
Table 28:
Events/Patients
at Risk*
Events/Patients
at Risk*
K-M Estimate
Error)
years†
*Events with missing or incomplete onset dates and those occurring before day 31 or after day 730 are excluded
insufficiency.
Table 29:
The results for the first adjunctive secondary composite endpoint of 14 pre-specified site-reported
events are presented in Tables 27 and 28.
Composite Endpoint of 14 Pre-specified Site-Reported Events to 30 Days or Discharge
(AT Population)
SAPIEN XT (N = 994) SAVR (N = 944)
Adverse Event
†
The composite event consi sts of all stroke and TIA; myocardial infarction; vascular complications; lifethreatening bleeding; reoperation for catheter-based intervention for valve thrombosis, valve displacement, or
other valve- or procedure-related complication; pericarditis; hemolysis; mediastinitis; endocarditis; aortic
insufficiency; aortic stenosis; permanent pacemaker implantation; mi tral valve injury or insufficiency; or renal
Events*
573
Patients with
Event
Events*
714
Patients with
Event
SAPIEN XT
versus
0.73
Composite Endpoint of 14 Pre-specified Site-Reported Events from Day 31 to 2 Years
(AT Population)
Adverse
Event
Composite
event from
day 31 to 2
SAPIEN XT (N = 994) SAVR (N = 944)
with Event/No.
428/284/594 31.0% (1.53%) 344/225/568 26.5% (1.52%) 1.17
K-M Estimate
(Standard Error)
with Event/No.
(Standard
Relative Risk
SAPIEN XT
versus
SAVR
from the analysis.
†
The composite event consi sts of all stroke and TIA; myocardial infarction; vascular complications; lifethreatening bleeding; reoperation for catheter-based intervention for valve thrombosis, valve displacement, or
other valve- or procedure-related complication; pericarditis; hemolysis; mediastinitis; endocarditis; aortic
insufficiency; aortic stenosis; permanent pacemaker implantation; mi tral valve injury or insufficiency; or renal
The result for the second adjunctive secondary composite endpoint of CEC-adjudicated all stroke,
major vascular complications, or aortic valve reinterventions at 2 years is presented in Table 29 for
the AT population.
All Stroke, Major Vascular Complications, or Aortic Valve Reintervention to 2 Years
(AT Population)
43
Page 44

SAPIEN XT (N = 994) SAVR (N = 944)
Relative Risk
Events/Patients
with Event/No. at
Events/Patients
with Event/No. at
K-M Estimate
*
Events with missing or incomplete onset dates and those occurring before day 31 or after day 730 are excluded
from the analysis.
Table 30:
Relative Risk
Events/Patients
Risk*
K-M Estimate
Error)
Events/Patients
Risk*
K-M Estimate
Error)
years
*
from the analysis.
Event
All stroke, major
vascular
complications, or
reinterventions at 2
years
K-M Estimate
Risk*
210/176/684 18.1% (1.24%) 156/132/644 14.4% (1.16%) 1.26
(Standard Error)
Risk*
(Standard
Error)
SAPIEN XT
vs SAVR
The result for the third adjunctive secondary composite endpoint of all-cause mortality, disabling
stroke, or rehospitalization at 2 years is presented in Table 30 for the AT population.
All-Cause Death, Disabling (Major) Stroke, or Rehospitalization to 2 Years
(AT Population)
SAPIEN XT (N = 994) SAVR (N = 944)
Event
All-cause death,
disabling stroke, or
rehospitalization at 2
with Event/No. at
486/313/655 31.7% (1.48%) 428/298/600 32.0% (1.53%) 0.99
(Standard
with Event/No. at
(Standard
SAPIEN XT
vs SAVR
Events with missing or incomplete onset dates and those occurring before day 31 or after day 730 are excluded
44
Page 45

c. Adverse Events
Table 31:
Overall
(N = 1011)
TF Access
(N = 775)
Non-TF Access
(N = 236)
30 Days
Acute kidney injury
192 (19.0)
106 (13.7)
86 (36.4)
327 (32.0)
Cardiac death
33 (3.3)
21 (2.7)
12 (5.1)
32 (3.1)
Non-cardiac death
6 (0.6)
2 (0.3)
4 (1.7)
9 (0.9)
Stroke
55 (5.4)
32 (4.1)
23 (9.7)
61 (6.0)
Disabling stroke
32 (3.2)
18 (2.3)
14 (5.9)
43 (4.2)
Non-disabling stroke
23 (2.3)
14 (1.8)
9 (3.8)
18 (1.8)
Myocardial infarction
12 (1.2)
5 (0.6)
7 (3.0)
19 (1.9)
Major vascular complication
80 (7.9)
66 (8.5)
14 (5.9)
51 (5.0)
Life threatening/disabling
bleeding
Aortic valve reintervention
4 (0.4)
3 (0.4)
1 (0.4)
0 (0.0)
Endocarditis
0 (0.0)
0 (0.0)
0 (0.0)
0 (0.0)
Rhythm disturbance requiring
permanent pacemaker
2 Years
Acute kidney injury
326 (32.2)
206 (26.6)
120 (50.8)
404 (39.6)
Stage III
36 (3.6)
18 (2.3)
18 (7.6)
57 (5.6)
Death
166 (16.4)
108 (13.9)
58 (24.6)
170 (16.7)
Cardiac death
97 (9.6)
67 (8.6)
30 (12.7)
105 (10.3)
Non-cardiac death
69 (6.8)
41 (5.3)
28 (11.9)
65 (6.4)
Stroke
91 (9.0)
62 (8.0)
29 (12.3)
85 (8.3)
Disabling stroke
59 (5.8)
39 (5.0)
20 (8.5)
61 (6.0)
Non-disabling stroke
33 (3.3)
24 (3.1)
9 (3.8)
27 (2.6)
Myocardial infarction
33 (3.3)
21 (2.7)
12 (5.1)
37 (3.6)
Major vascular complication
86 (8.5)
69 (8.9)
17 (7.2)
55 (5.4)
bleeding
Aortic valve reintervention
13 (1.3)
9 (1.2)
4 (1.7)
5 (0.5)
Endocarditis
11 (1.1)
10 (1.3)
1 (0.4)
6 (0.6)
Rhythm disturbance requiring
permanent pacemaker
n/Total no. (%); (2) Events with missing or incomplete onset dates are excluded
from the analysis.
Results for some key CEC-adjudicated adverse events through 2 years are
presented in Table 31 for the ITT population.
Key CEC-Adjudicated Adverse Events
(ITT Population)
SAPIEN XT
Stage III 13 (1.3) 4 (0.5) 9 (3.8) 31 (3.0)
Death 39 (3.9) 23 (3.0) 16 (6.8) 41 (4.0)
105 (10.4) 52 (6.7) 53 (22.5) 442 (43.3)
85 (8.4) 62 (8.0) 23 (9.7)
SAVR
(N = 1021)
68 (6.7)
Life threatening/disabling
Note: (1) Categorical measures -
169 (16.7) 101 (13.0) 68 (28.8) 471 (46.1)
114 (11.3) 85 (11.0) 29 (12.3)
45
96 (9.4)
Page 46

d. Other Results
Procedural Information
Overall, in the SAPIEN XT AT population the mean duration in the catheterization
laboratory was 209.0 ± 59.5 min, the mean total procedure time was 102.7 ± 51.4
min, and the mean total anesthesia time was 207.1 ± 64.7 min. These duration times
were slightly shorter in the TF group. General anesthesia was used in the vast
majority of cases; 7.8% of the TF patients had conscious sedation. Correct
positioning of the valve was achieved in 98.5% of the patients. Nineteen patients
(1.7% of TF patients and 2.6% of non-TF patients) were implanted with a second
valve. Two patients (0.5%) experienced valve dislodgement. Three patients (0.3%)
experienced annular rupture.
In the SAVR AT population, the mean duration in the operating room was 332.3 ±
96.9 min, the mean total procedure time was 236.8 ± 86.9 min, and the mean
anesthesia time was 333.0 ± 108.6 min. General anesthesia was used in all patients.
It was difficult to wean 26 patients (2.8%) from cardiopulmonary bypass, which was
terminated in the majority of cases with intra-aortic balloon pump and/or inotropes.
Valve Performance
The measurements of EOA, mean gradient, peak gradient, total aortic regurgitation
(AR), and aortic paravalvular leak (PVL) are presented in Figures 21-25. The
increase in EOA and decrease in gradient were sustained at 2 years. In the SAPIEN
XT arm, the proportion of patients with total AR ≥ moderate was 11.0% at baseline,
3.8% at 30 days, 4.0% at 1 year, and 9.4% at 2 years, while in the SAVR arm, the
proportion of patients with total AR ≥ moderate was 12.0% at baseline, 0.7% at 30
days, 0.3% at 1 year, and 0.8% at 2 years. The proportion of patients with aortic PVL
≥ moderate was 3.8% at 30 days, 3.4% at 1 year, and 8.0% at 2 years in the
SAPIEN XT arm, as compared to 0.5% at 30 days, 0.3% at 1 year, and 0.6% at 2
years in the SAVR arm.
46
Page 47

Figure 21:
Effective Orifice Area
Figure 22:
(VI Population)
Mean Gradient
(VI Population)
47
Page 48

Figure 23:
Peak Gradient
Figure 24:
None Trace Mild
Mild-Moderate Moderate Moderate-Severe
Severe
Percentage
0
20
40
60
80
100
SAPIEN XT
SAVR
Baseline 30 Day 1 Year 2 Years Baseline 30 Day 1 Year 2 Years
14%
21%
26%
26%
15%
61%
62%
63%
34%
52% 47%
35%
31%
36%
33%
30%
40%
19%
18%
24%
42%
6%
4%
5%
5%
11%
7%
11%
(VI Population)
Total Aortic Regurgitation
(VI Population)
48
Page 49

Figure 25:
Aortic Paravalvular Leak
None Trace Mild
Mild-Moderate Moderate Moderate-Severe
Severe
Percentage
0
20
40
60
80
100
SAPIEN XT
SAVR
30 Day 1 Year 2 Years 30 Day 1 Year 2 Years
22%
29%
32%
77%
81%
83%
52%
44%
33%
20%
15% 13%
18%
18%
23%
4%
5%
4%
6%
(VI Population)
49
Page 50

NYHA
1 2 3 4
Percent
0
20
40
60
80
100
TF Non-TF
Baseline 30 Day 6 M onth 1 Year 2 Y ears Baseline 30 Day 6 Mont h 1 Y ear 2 Years
22%
60%
18%
58%
35%
8%
68%
27%
4%
66%
27%
6%
61%
29%
9%
24%
59%
18%
44%
37%
16%
4%
56%
34%
10%
52%
35%
11%
50%
41%
7%
The NYHA classifications by visit are presented in Figure 26. In the SAPIEN XT AT
population, 78% of the patients were in NYHA Class III or IV at baseline, which
reduced to 11% at 30 days, 8% at 1 year, and 10% at 2 years, while in the SAVR AT
population, the percentage of patients in NYHA Class III or IV was 76% at baseline,
14% at 30 days, 7% at 1 year, and 7% at 2 years. A side-by-side comparison of the
results by access approach is presented in Figure 27.
Figure 26:
NYHA Class
(AT Population)
Figure 27:
NYHA Class- TF versus non-TF Access
(AT Population)
50
Page 51

Length of Stay (LoS)
Table 32:
(AT Population)
SAPIEN XT
All
TF
Non-TF
Overall
7.4±5.6
6.5±4.6
10.3±7.3
11.9±7.6
ICU
3.4±3.5
2.9±2.4
4.9±5.5
5.6±6.1
Plus–minus values are means ± SD.
The results for LoS are presented in Table 32. Overall, the SAPIEN XT patients had shorter
LoS' than the SAVR patients.
Length of Stay
Length of
Stay (days)
SAVR
Quality of Life (QoL)
The QoL measurements using the Kansas City Cardiomyopathy Questionnaire (KCCQ) clinical
summary score are presented in Figure 28. Improvements were observed in all sub-scores at
30 days and were sustained at 1 and 2 years in the SAPIEN XT AT population. A side-by-side
comparison of the results by access approach is presented in Figure 29. In general,
improvements in the TF group were slightly larger compared to those observed in the non-TF
group. Among the SAVR patients, improvements were observed in most sub-scores at 30 days
and were sustained at 1 and 2 years, except decreases from baseline to 30 days in KCCQ
physical limitations and social limitations.
51
Page 52

Figure 28:
KCCQ Clinical Summary Score
(AT Population)
Note: Line Plot with mean and standard deviation
Figure 29:
KCCQ Clinical Summary Score – TF versus non-TF Access
(AT Population)
52
Page 53
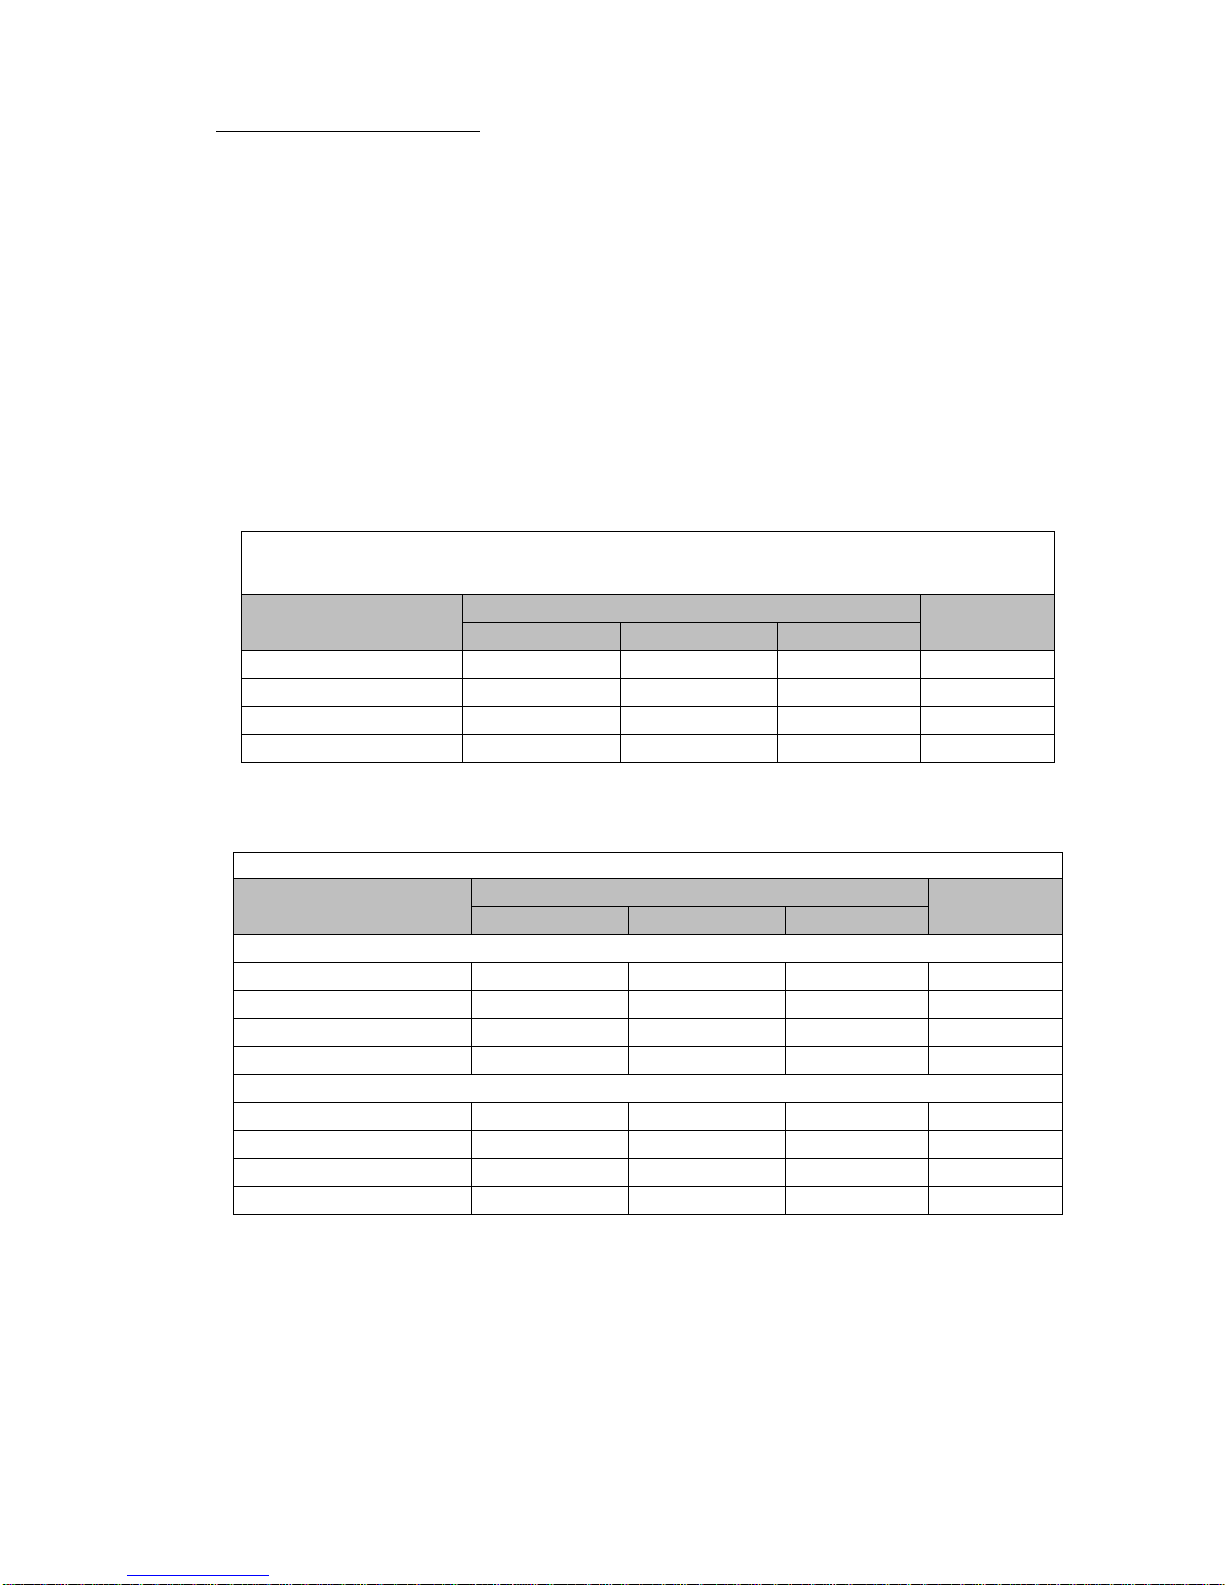
Additional QoL instruments
Table 33:
(AT Population)
SAPIEN XT
All
TF
Non-TF
Baseline
0.7±0.2
0.7±0.2
0.7±0.2
0.7±0.2
30 days
0.8±0.2
0.8±0.2
0.7±0.2
0.7±0.2
1 year
0.8±0.2
0.8±0.2
0.8±0.2
0.8±0.2
2 years
0.8±0.2
0.8±0.2
0.8±0.2
0.8±0.2
Plus–minus values are means ± SD.
Table 34: SF-36 Health Status Questionnaire Score (AT Population)
SAPIEN XT
All
TF
Non-TF
Physical Component Score
Baseline
36.1±8.9
36.3±9.0
35.6±8.7
35.9±8.7
30 days
40.0±9.3
41.0±9.2
36.5±8.6
36.1±8.0
1 year
40.6±9.8
40.8±9.9
39.8±9.2
41.0±9.9
2 years
39.4±9.8
39.8±9.8
37.8±9.4
39.1±10.0
Mental Component Score
Baseline
48.8±11.3
48.7±11.2
49.0±11.7
47.7±11.8
30 days
50.4±11.7
51.4±11.2
46.7±12.6
45.5±12.8
1 year
52.2±10.9
52.4±10.5
51.4±11.9
51.6±10.8
2 years
51.5±10.9
51.5±10.8
51.7±11.3
51.6±10.8
Plus–minus values are means ± SD.
QoL was also measured using the utility score of the EuroQoL (EQ-5D) measure and the SF-36
Health Status Questionnaire. The EQ-5D is a measure of self-reported health outcomes that is
applicable to a wide range of health conditions and treatments. It consists of 2 parts: a
descriptive system and a visual analogue scale (Part II). Part I of the scale consists of 5 singleitem dimensions including: mobility, self care, usual activities, pain/discomfort, and
anxiety/depression. Each dimension has a 3 point response scale designed to indicate the level
of the problem. The overall EQ-5D score from Part I may be converted into a single index value
(also known as utilities score) between 0.0 (i.e., death) and 1.0 (perfect health). SF-36 uses 36
questions to measure functional health and well-being from the patient’s point of view and is
generally reported in two summary scores on a scale from 0 to 100 which evaluate physical (the
Physical Summary Score) and mental (the Mental Summary Score) health, with higher scores
representing better functional health and well-being. The results of the VAS and SF-36
measures are presented in Tables 33 and 34, respectively.
EQ-5D Utilities Score
EQ-5D Utilities Score
SF-36 Health Status
Questionnaire Score
SAVR
SAVR
53
Page 54

13.0 References
Manufacturer
Edwards Lifesciences LLC
Telephone 949.250.2500
Web IFU
One Edwards Way
800.424.3278
158501004 A
Irvine, CA 92614
USA
FAX 949.250.2525
Made in USA
Bapat, V., I. Mydin, et al. (2013). “A guide to fluoroscopic identification and design of bioprosthetic valves: A reference for
valve-in-valve procedure.” Catheter Cardiovasc Interv. 81:853-861.
Ferrari, E. (2011). “Transapical aortic 'valve-in-valve' procedure for degenerated stented bioprosthesis.” Eur J Cardiothorac
Surg 41(3): 485-490.
Gurvitch, R., A. Cheung, et al. (2011). “Transcatheter valve-in-valve implantation for failed surgical bioprosthetic valves.” J Am
Coll Cardiol 58(21): 2196-2209.
Leon MB, Piazza N, Nikolsky E, Blackstone EH, Cutlip DE, Kappetein AP, et al. Standardized endpoint definitions for
transcatheter aortic valve implantation clinical trials: a consensus report from the Valve Academic Research Consortium. J Am
Coll Cardiol 2011;57(3):253-69.
Piazza, N., et al. (2011). “Transcatheter aortic valve implantation for failing surgical aortic bioprosthetic valve from concept to
clinical application and evaluation (part 1).” JACC Cardiovasc Interv 4(7): 721-732.
These products are manufactured and sold under one or more of the following US patent(s): US Patent No. 6,214,054;
6,547,827; 6,908,481; 7,214,344; 7,510,575; 7,530,253; 7,895,876; 7,993,394; 8,439,970; 8 ,475, 5 22; 8,76 4,820; and
8,945,208; and corresponding foreign patents. Additional patents are pending.
07/2016
©Copyright 2016, Edwards Lifesciences LLC
All rights reserved.
z
54
Page 55

Edwards SAPIEN XT
Transcatheter Heart Valve with the NovaFl ex+ Delivery System
Instructions for Use
CAUTION: Federal (USA) law restricts these devices to sale by or on the order of a physician.
Implantation of the transcatheter heart valve should be performed only by physicians who have
received Edwards Lifesciences training. The implanting physician should be experienced in
balloon aortic valvuloplasty.
Please verify that you have the latest version of the instructions for use prior to using the devic e
by visiting http://THVIFU.edwards.com or by calling 1.800.822.9837. In order to access the
instructions for use, an IFU Code will be required.
STERILE: The valve is supplied sterilized with glutaraldehyde solution. The delivery system is
supplied sterilized with ethylene oxide gas.
_______________________________________________________
Edwards, Edwards Lifesciences, the stylized E logo, Carpentier-E d wards , Ed wards SAPIEN,
Edwards SAPIEN XT, NovaFlex, NovaFlex+, PARTNER, PARTNER II, Qualcrimp, RetroFlex,
RetroFlex 3, SAPIEN, SAPIEN XT, TFX, and ThermaFix are trademarks of Edwards Lifesciences
Corporation. All other trademarks are the property of their respective owners.
1
Page 56

1.0 Device Description
2
2
• Edwards SAPIEN XT Transcatheter Heart Valve – Model 9300TFX (Figure 1)
The Edwards SAPIEN XT Transcatheter Heart Valve is comprised of a balloon-expandable, radiopaque,
cobalt-chromium frame, trileaflet bovine pericardial tissue valve, and polyethylene terephthalate (PET)
fabric skirt. The leaflets are treated according to the Carpentier-Edwards ThermaFix process.
Table 1
Valve Size Height
23 mm 14.3 mm
26 mm 17.2 mm
29 mm 19.1 mm
Table 2
Native Valve Annulus Size
(TEE)
(CT)
Valve Size
Area Area Derived Diameter
Native Valve Annulus Size
18-22 mm 314-415 mm
21-25 mm 415-530 mm
24-27 mm 530-660 mm
2
20-23 mm 23 mm
23-26 mm 26 mm
26-29 mm 29 mm
Valve size recommendations are based on native valve annulus size, as measured by transesophageal
echocardiography (TEE) or computed tomography (CT). Patient anatomical factors and multiple imaging
modalities should be considered during valve size selection. Note: Risks associated with undersizing and
oversizing should be considered.
For transcatheter valve-in-surgical valve procedures, size recommendations for surgical bioprostheses
with internal orifice diameters are shown in Table 3.
Table 3
Bioprosthesis Internal Orifice Diameter SAPIEN XT Valve Size
18-21 mm 23 mm
21-23.5 mm 26 mm
23.5-27 mm 29 mm
NOTE: The internal orifice diameter o f th e surgical bioprosthesis must be determi n ed so that the
appropriate valve size can be implanted. The bioprosthesis internal diameter of the primary
implanted device is best determined by using computed tomography, magnetic resonance
imaging, and/or transesophageal echocardiography to perform the necessary measurements. The
internal orifice diameter is a directly measured or area derived diameter measurement of the
internal opening of the failed surgical valve.
NOTE: Exact volume required to deploy the valve may vary depending on the bioprosthesis internal
orifice diameter. Do not exceed the rated burst pressure. See Table 4 for inflation parameters.
• NovaFlex+ Delivery System (Figures 2a, 2b, 2c)
The NovaFlex+ delivery system (usable length 105 cm) is used for delivery of the Edwards SAPIEN XT
transcatheter heart valve. The delivery system includes a flex wheel for articulation of the flex catheter, a
tapered tip at the distal end of the delivery system to facilitate crossing the valve, and a balloon catheter
for deployment of the valve. The flex tip (distal portion of the flex shaft) is hydrophilically coated. The
handle also contains a flex indicator depicting articulation of the flex catheter, a valve alignment wheel for
fine adjustment of the valve during valve alignment, a button that enables movement between handle
positions, and a flush port to flush the flex catheter. The balloon catheter has radiopaque markers
2
Page 57

defining the valve alignment position and the working length of the balloon. A radiopaque double marker
proximal to the balloon indicates flex catheter position during deployment. The inflation parameters for
valve deployment are:
Table 4
Model
Nominal Balloon
Diameter
Nominal Inflation
Volume
Rated Burst
Pressure (RBP)
9355FS23 23 mm 17 mL 7 atm
9355FS26 26 mm 22 mL 7 atm
9355FS29 29 mm 33 mL 7 atm
Figure 2a. NovaFlex+ Delivery System
Figure 2b. Default Position
Figure 2c. Valve Alignment Position
• Qualcrimp Crimping Accessory (Figure 3)
The Qualcrimp crimping accessory (packaged with the NovaFlex+ delivery system and manufactured in
laminated or cloth covered foam) is used during crimping of the valve.
Figure 3
Laminated Qualcrimp Cloth Qualcrimp
3
Page 58

2.0 Indications
The Edwards SAPIEN XT transcatheter heart valve, model 9300TFX, and accessories are indicated for
relief of aortic stenosis in patients with symptomatic heart disease due to severe nativ e calcific aortic
stenosis who are judged by a Heart Team, including a c ardiac surgeon, to be at intermediate or greater
risk for open surgical therapy (i.e., predicted risk of surgical mortality ≥ 3% at 30 days, based on the
Society of Thoracic Surgeons (STS) risk score and other clinical co-morbidities unmeasured by the STS
risk calculator).
The Edwards SAPIEN XT transcatheter heart valve and accessories are also indicated for patients with
symptomatic heart disease due to failure (stenosed, insufficient, or combined) of a surgical bioprosthe tic
aortic valve who are judged by a heart team, including a cardiac surgeon, to be at high or greater risk for
open surgical therapy (i.e., STS operative risk score ≥8% or at a ≥15% risk of mortality at 30 days).
3.0 Contraindications
The valve and delivery systems are contraindicated in patients who can not tol erate an
anticoagulation/anti pla tel et r egim en or who have active bacterial endocarditis or other active infections.
4.0 Warnings
• Observation of the pacing lead throughout the procedure is essential to avoid the potential risk of
pacing lead perforation.
• There may be an increased risk of stroke in transcatheter aortic valve replacement procedures, as
compared to balloon aortic valvuloplasty or other standard treatments in high or greater risk patients.
• The devices are designed, intended, and distributed for single use only. Do not resterilize or reuse
the devices. There are no data to support the sterility, nonpyrogenicity, and functionality of the
devices after reprocessing.
• Care should be exercised when sizing the native annulus or surgical valve; implanting a valve that is
too small may lead to paravalvular leak, migration or embolization, whereas implanting a valve that is
too large may lead to residual gradient (patient-prosthesis mismatch) or annular rupture.
• Accelerated deterioration of the valve may occur in patients with an altered calcium metabolism.
• Prior to delivery, the valve must remain hydrated at all times and cannot be exposed to solutions
other than its shipping storage solution and sterile physiologic rinsing solution. Valve leaflets
mishandled or damaged during any part of the procedure will require replacement of the valve.
• Caution should be exercised in implanting a valve in patients with clinically significant coronary artery
disease.
• Patients with pre-existing mitral valve devices should be carefully assessed prior to implantation of
the valve to ensure proper valve positioning and deployment.
• Do not use the valve if the tamper evident seal is broken, the storage solution does not completely
cover the valve, the temperature indicator has been activated, the valve is damaged, or the
expiration date has elapsed.
• Do not mishandle the NovaFlex+ delivery system or use it if the packaging or any components are
not sterile, have been opened or are damaged (e.g. kinked or stretched), or the expiration date has
elapsed.
• Use of excessive contrast media may lead to renal failure. Measure the patient’s creatinine level
prior to the procedure. Contrast media usage should be monitored.
• Patient injury could occur if the delivery system is not un-flexed prior to removal.
• Care should be exercised in patients with hypersensitivities to cobalt, nickel, chromium,
molybdenum, titanium, manganese, silicon, and/or polymeric materials.
• The procedure should be conducted under fluoroscopic guidance. Some fluoroscopically guided
procedures are associated with a risk of radiation injury to the skin. These injuries may be painful,
disfiguring, and long-lasting.
• Valve recipients should be maintained on anticoagulant/antiplatelet therapy, except when
4
Page 59

contraindicated, as determined by their physician. This device has not been tested for use without
anticoagulation.
• Do not add or apply antibiotics to the storage solution, rinse solutions, or to the valve.
5.0 Precautions
• Long-term durability has not been established for the valve. Regular medical follow-up is advised to
evaluate valve performance.
• Glutaraldehyde may cause irritation of the skin, eyes, nose and throat. Avoid prolonged or repeated
exposure to, or breathing of, the solution. Use only with adequate ventilation. If skin contact occurs,
immediately flush the affected area with water; in the event of contact with eyes, seek immediate
medical attention. For more information about glutaraldehyde exposure, refer to the Mater ia l Safet y
Data Sheet available from Edwards Lifesciences.
• To maintain proper valve leaflet coaptation, do not overinflate the deployment balloon.
• Appropriate antibiotic prophylaxis is recommended post-procedure in patients at risk for prosthetic
valve infection and endocar ditis .
• Safety, effectiveness, and durability have not been established for transcatheter valve in
transcatheter valve procedures.
• Safety and effectiveness have not been established for patients with the following
characteristics/comorbidities:
o Non-calcified aortic annulus
o Severe ventricular dysfunction with ejection fraction < 20%
o Congenital unicuspid or congenital bicuspid aortic valve
o Mixed aortic valve disease (aortic stenosis and aortic regurgitation with predominant aortic
regurgitation > 3+)
o Pre-existing pros thet ic ring in an y positio n
o Severe mitral annular calcification (MAC), severe (> 3+) mitral insufficiency, or Gorlin syndrome
o Blood dyscrasias defined as: leukopenia (WBC < 3000 cells/mL), acute anemia (Hb < 9 g/dL),
thrombocytopenia (platelet count < 50,000 cells/mL), or history of bleeding diathesis or
coagulopathy
o Hypertrophic cardiomyopathy with or without obstruction (HOCM)
o Echocardiographic evidence of intracardiac mass, thrombus, or vegetation
o A known hypersensitivity or contraindication to aspirin, heparin, ticlopidine (Ticlid™), or
clopidogrel (Plavix™), or sensitivity to contrast media, which cannot be adequately premedicated
o Significant aortic disease, including abdominal aortic or thoracic aneurysm defined as maximal
luminal diameter 5 cm or greater; marked tortuosity (hyperacute bend), aortic arch atheroma
(especially if thick [> 5 mm], protruding, or ulcerated) or narrowing (especially with calcification
and surface irregularities) of the abdominal or thoracic aorta, severe “unfolding” and tortuosity of
the thoracic aorta
o Access characteristics that would preclude safe placement of 16F, 18F, or 20F Edwards
Expandable Introducer Sheath Set, such as severe obstructive calcification, severe tortuosity or
diameter less than 6 mm, 6.5 mm, or 7 mm, respectively
o Bulky calcified aortic va lve leaflets in close proximity to coronary ostia
o A concomitant paravalvular leak where the surgical bioprosthesis is not securely fixed in the
native annulus or is not structurally intact (e.g. wireform frame fracture)
o A partially detached leaflet of the surgical bioprosthesis that in the aortic position may obstruct a
coronary ostium
• The safety and effectiveness have not been established for implanting the transcatheter valve inside
a stented bioprosthetic valve < 21 mm (labeled size) or an unstented bioprosthetic aortic valve.
5
Page 60

• Residual mean gradient may be higher in a “TAV-in-SAV” configuration than that observed following
implantation of the valve inside a native aortic annulus using the same size device. Patients with
elevated mean gradient post procedure should be carefully followed. It is important that the
manufacturer, model and size of the preexisting surgical bioprosthetic aortic valve be determined, so
that the appropriate valve can be implanted and a prosthesis-patient mismatch be avoided.
Additionally, pre-procedure imaging modalities must be employed to make as accurate a
determination of the internal orifice as possible.
6.0 Potential Adverse Events
Potential risks associated with the overall procedure including potential access complications associated
with standard cardiac catheterization, balloon valvuloplasty, the potential risks of conscious sedation
and/or general anesthesia, and the use of angiography:
• Death
• Stroke/transient ischemic attack, clusters or neurological deficit
• Paralysis
• Permanent disability
• Respiratory insufficiency or respiratory failure
• Hemorrhage requiring transfusion or intervention
• Cardiovascular injury including perforation or dissection of vessels, ventricle, myocardium or valvular
structures that may require intervention
• Pericardial effusion or cardiac tamponade
• Embolization including air, calcific valve mater ial or thrombus
• Infection including septicemia and endocarditis
• Heart failure
• Myocardial infarction
• Renal insufficiency or renal failure
• Conduction system defect which may require a permanent pacemaker
• Arrhythmia
• Retroperitoneal bleed
• AV fistula or pseudoaneurysm
• Reoperation
• Ischemia or nerve injury
• Restenosis
• Pulmonary edema
• Pleural effusion
• Bleeding
• Anemia
• Abnormal lab values (including electrolyte imbalance)
• Hypertension or hypotension
• Allergic reaction to anesthesia, contrast media, or device materials
• Hematoma
• Syncope
• Pain or changes at the access site
• Exercise intolerance or weakness
• Inflammation
6
Page 61

• Angina
23 mm System
(9355NF23A)
26 mm System
(9355NF26A)
29 mm System
(9355NF29A)
Model
Edwards SAPIEN XT
Transcatheter Heart Valve
NovaFlex+ Delivery System*
9355FS23
9355FS26
9355FS29
Edwards Dilator Kit
9100DKS
Inflation devices provided by Edwards Lifesciences
Edwards Crimper
9350CR
* Includes the Qualcrimp Crimping Accessory and 2-piece Crimp Stopper
** Or other compatible sheath provided by Edwards Lifesciences
• Heart murmur
• Fever
Additional potential risks associated with the use of the valve, delivery system, and/or accessories
include:
• Cardiac arrest
• Cardiogenic shock
• Emergency cardiac surgery
• Cardiac failure or low cardiac output
• Coronary flow obstruction/transvalvular flow disturbance
• Device thrombosis requiring intervention
• Valve thrombosis
• Device embolization
• Device migration or malposition requiring intervention
• Valve deployment in unintended location
• Valve stenosis
• Structural valve deterioration (wear, fracture, calcification, leaflet tear/tearing from the stent posts,
leaflet retraction, suture line disruption of components of a prosthetic valve, thickening, stenosis)
• Device degeneration
• Paravalvular or transvalvular leak
• Valve regurgitation
• Hemolysis
• Device explants
• Nonstructural dysfunction
• Mechanical failure of delivery system, and/or accessories
• Non-emergent reoperation
7.0 Directions for Use
7.1 Required Equipment
Table 5
Product Name
9300TFX (23 mm) 9300TFX (26 mm) 9300TFX (29 mm)
Edwards Expandable
Introducer Sheath Set**
Edwards Balloon Catheter 9350BC20 9350BC23 9350BC25
916ES23 918ES26 920ES29
7
Page 62

Additional Equipment:
Step
Procedure
• 20 cc syringe or larger (x2)
• 50 cc syringe or larger
• High-pressure 3-way stopcock (x2)
• Standard cardiac catheterization lab equipment
• Fluoroscopy (fixed, mobile or semi-mobile fluoroscopy systems appropriate for use in percutaneous
coronary interventions)
• Transesophageal or transthoracic echocardiography capabilities
• Exchange length 0.035 inch (0.89 mm) extra-stiff guidewire
• Temporary pacemaker (PM) and pacing lead
• Sterile rinsing basins, physiological saline, heparinized saline, 15% diluted radiopaque contrast
medium
• Sterile table for valve and device preparation
7.2 Valve Handling and Preparation
Follow sterile technique during device preparation and im plantat ion.
7.2.1 Valve Rinsing Procedure
Before opening the valve jar, carefully examine for evidence of damage (e.g. a cracked jar or lid, leakage,
or broken or missing seals).
CAUTION: Valves from containers found to be damaged, leaking, without adeq u ate sterilant, or
missing intact seals must not be used fo r implantation.
Set up two (2) sterile bowls with at least 500 mL of sterile physiological saline to thoroughly rinse the
1
glutaraldehyde sterilant from the valve.
Carefully remove the valve/holder assembly from the jar without touching the tissue. Verify the valve
2
serial identification number with the number on the jar lid and record in the patient information
documents. Inspect the valve for any signs of damage to the frame or tissue.
Rinse the valve as follows: Place the valve in the first bowl of sterile, physiological saline. Be sure the
saline solution completely covers the valve and holder. With the valve and holder submerged, slowly
agitate (to gently swirl the valve and holder) back and forth for a minimum of 1 minute. Transfer the
valve and holder to the second rinsing bowl of physiological saline and gently agitate for at least one
more minute. Ensure the rinse solution in the first bowl is not used. The valve should be left in the final
3
rinse solution until needed to prevent the tissue from drying.
CAUTION: Do not allow the valve to come into contact with the bottom or sides of the rinse bowl
during agitation or swirling in the rinse solution. Direct contact between the identification tag and
valve is also to be avoided during the rinse procedure. No other objects should be placed in the rinse
bowls. The valve should be kept hydrated to prevent the tissue from drying.
7.2.2 Prepare the Components
Refer to the Edwards Dilator Kit, Edwards Expandable Introducer Sheath Set, Edwards Crimper and
Edwards Balloon Catheter instructions for use for device preparation.
Step Procedure
Visually inspect all components for damage. Ensure the NovaFlex+ delivery system is fully unflex ed and
1
the valve alignment wheel is adjacent to the handle.
2 Flush the flex catheter.
Carefully remove the distal balloon cover from the delivery system.
3
8
Page 63

Step Procedure
back into the guidewire lumen may result in damage to the lumen duri ng
Remove the stylet from the distal end of the guidewire lumen and set aside. Flush the guidewire lumen
with heparinized saline and insert the stylet back into the distal end of the guidewire lumen.
4
Note: Failure to insert the stylet
crimping process.
Place the delivery system into the default position and make sure that the flex catheter tip is covered by
the proximal balloon cover. Unscrew the loader cap from the loader tube and flush the loader cap. Place
5
the loader cap over the proximal balloon cover and onto the flex catheter with the inside of the cap
oriented towards the dis tal tip.
Press button on handle and bring the device handle adjacent to the Y-connector.
6
Peel off the proximal ball oon cover over the blue section of the balloon shaft.
Attach a 3-way stopcock to the balloon inflation port. Partially fill a 50 cc or larger syringe with
7
15-20 mL diluted contrast medium and attach to the 3-way stopcock.
Fill the inflation device provided by Edwards Lifesciences with excess volum e relative to the indicated
8
inflation volume. Lock the inflation device and attach to the 3-way stopcock.
Close the 3-way stopcock to the Inflation device provided by Edwards Lifesciences and de-air the system
9
using the 50 cc or larger syringe. Slowly release the plunger and leave zero-pressure in the system.
Close the stopcock to the delivery system. By rotating the knob of the inflation device provided by
Edwards Lifesciences, transfer the contrast medium into the syringe to achieve the appropriate volume
required to deploy the valve, per the following:
10
Delivery System Valve Size Inflation Volume
Model 9355FS23 23 mm 17 mL
Model 9355FS26 26 mm 22 mL
Model 9355FS29 29 mm 33 mL
Close the stopcock to the 50 cc or larger syringe. Remove the syringe. Verify that the inflation volume is
correct and lock the Inflation device provided by Edwards Lifesciences.
11
CAUTION: Maintain the Inflation device provided by Edwards Lifesciences in the locked position
until valve deployment.
7.2.3 Mount and Crimp the Valve on the Delivery System
Step Procedure
1
2
3
4 Attach the 2-piece crimp stopper to the base of the crimper and click into place.
5
6
7
8
9
Set up two (2) additional sterile bowls with at least 100 mL of sterile physiological saline to thoroughly
rinse the Qualcrimp crimping accessory.
Completely submerge the Qualcrimp crimping accessory in the first bowl and gently compress it to
ensure complete saline absorption. Slowly swirl the Qualcrimp crimping accessory for a minimum of
1 minute. Repeat this process in the second bowl.
Remove the valve from the holder and remove the ID tag.
With the crimper in the open position, gently place the valve into the crimper aperture. Gradually crimp
the valve until it fits into the Qualcrim p crimping accessory.
Place the Qualcrimp crimping accessory over the valve making sure the valve is parallel to the edge of
the Qualcrimp crimping ac cessory.
Place the valve and Qualcrimp crimping accessory in crimper aperture. Insert the delivery system
coaxially within the valve on the Valve Crimp Section (2-3 mm dis tal to the balloon shaft) with the inflow
(fabric cuff end) of the valve towards the distal end of the delivery system.
Crimp the valve until it reaches the Qualcrimp stop located on the 2-piece Crimp Stopper.
Gently remove the Qualcrimp crimping accessory from the valve. Remove the Qualcrimp stop from the
Final Stop, leaving the Final Stop in place.
9
Page 64

Step Procedure
10
11
12
13
14
Fully crimp the valve until it reaches the Final Stop.
NOTE: Ensure that the Valve Crimp Section remains coaxial within the valve.
Repeat the full crimp of the valve for a total of two full crimps.
Pull the balloon shaft until it is locked in the default position.
Flush the loader with heparinized saline. Immediately advance the valve into the loader until the tapered
tip of the delivery system is exposed.
CAUTION: To prevent possible leaflet damage, the valve should not remain fully crimped and/or
in the loader for over 15 minutes.
Attach the loader cap to the loader, re-flush the delivery system through the flush port and close the
stopcock to the delivery system.
Remove the stylet and flus h the guidewire lumen of the delivery system.
CAUTION: Keep the valve hydrated until ready for implantation.
CAUTION: The physician must verify correct orientation of the valve prior to its implantation; its
inflow (fabric cuff end) should be oriented distally tow a rds the tapered tip.
7.3 Valvuloplasty and Valve Delivery
Valvuloplasty and valve delivery should be performed under conscious sedation and/or general
anesthesia with hemodynamic monitoring in a catheterization lab/hybrid operating room with fluoroscopic
and echocardiographic imaging capabilities.
Administer heparin to maintain the ACT at ≥ 250 sec during the procedure.
CAUTION: Use of excessive contrast media may lead to renal failure. Measure the patient’s
creatinine level prior to the procedure. Contrast media usage should be monitored.
CAUTION: Procedure may require an arterial cut-down with surgical closure of the puncture si te
due to the size of the arteriotomy.
7.3.1 Baseline Parameters
Step Procedure
1
2
3
4
Perform an angiogram with fluoroscopic vi ew perpendicular to the valve.
Evaluate the distance of the left and right coronary ostia from the aortic annulus in relation to the valve
frame height.
Introduce a pacemaker (PM) lead until its distal end is positioned in the right ventricle.
Set the stimulation parameters to obtain 1:1 capture, and test pacing.
7.3.2 Valvuloplasty
Refer to Edwards Balloon Catheter Instructions for Use (IFU) for information on device
preparation and handling.
Note: Rapid ventricular pacing s h o u ld be performed when using the Edwards Balloon Catheter for
valvuloplasty prior to aortic transcatheter valve implantation.
After placement of the balloon at the intended site, begin rapid ventricular pacing. Once the systolic blood
pressure has decreased to 50 mmHg or below, balloon inflation can commence.
CAUTION: Valve implantation should not be carried out if the balloon cannot be fully inflated
during valvuloplasty.
7.3.3 Valve Delivery
Step Procedure
Dilate the access site using the Edwards Dilator Kit, if needed. Refer to the Edwards Dilator Kit IFU for
1
information on device preparation and handling.
10
Page 65

Step Procedure
Alignment Wheel if the delivery system is not locked in the Valve
blood pressure has decreased to 50 mmHg or below, balloon
Prepare and insert the Edwards Expandable Introducer Sheath Set. Refer to the Edwards Expandable
2
Introducer Sheath Set IFU for information on device preparation and handling.
3 Insert the loader into the sheath until the loader stops.
Advance the NovaFlex+ delivery system, with the Edwards logo facing up, through the sheath until the
valve exits the sheath. Retract the loader to the proximal end of the delivery system.
NOTE: Maintain the proper orientation of the flex catheter (with the Edwards logo facing up)
throughout the procedure.
4
CAUTION: If accessing femorally or via the iliac, the valve should not be advanced through the
sheath if the sheath tip is not past the aortic bifurcation.
CAUTION: To prevent possible leaflet damage, the valve should not remain in the sheath for ove r
2 minutes.
In a straight section of the aorta, initiate valve alignment by pressing the button, begin pull back of the
balloon catheter, and release the button.
Continue pulling back the balloon catheter until the delivery system locks into the valve alignment
position (Refer to Figure 2c).
Use the Valve Alignment Wheel to position the valve between the valve ali gnm ent markers.
5
CAUTION: Do not turn the Valve
Alignment Position.
WARNING: Do not position the valve past the distal Valve Alignment Marker. This will prevent
proper valve deployment.
CAUTION: Maintain guidewire position in the left ventricle during valve alignment.
Advance the catheter and use the flex wheel, if needed, and cross the aortic valve.
6
NOTE: Verify the Edwards logo is facing up. The delivery system articula tes in a direction
opposite from the flush port.
If additional working length is needed, remove the loader by unscrewing the loader cap and peeling the
7
loader tubing from the delivery system.
Press the button and retract the Flex Catheter to the Double Marker and position the valve within the
8
aortic annulus.
9 Verify the correct position of the valve with respect to the valve.
Begin valve deployment:
• Unlock the Inflation device provided by Edwards Lifesciences.
• Begin rapid pacing; once systolic
10
inflation can commence.
• Deploy the valve by inflating the balloon with the entire volume in the Inflation device provided by
Edwards Lifesciences, hold for 3 seconds and confirm that the barrel of the inflation device is empty
to ensure complete inflation of the balloon. Deflate the balloon. When the balloon catheter has been
completely deflated, turn off the pacemaker.
7.3.4 System Removal
Step Procedure
Unflex the delivery system while retracting the device, if needed. Retract the flex catheter until it locks in
1
the default position and remove it from the sheath.
CAUTION: Patient injury could occur if the delivery system is not unflexed prior to removal.
2
3
Remove all devices when the ACT level is appropriate. Refer to the Edwards Expandable Introducer
Sheath Set instructions for use for device removal.
Close the access site.
11
Page 66

8.0 How Supplied
STERILE: The valve is supplied sterilized with glutaraldehyde solution. The delivery system is supplied
sterilized with ethylene oxide gas.
8.1 Storage
The valve must be stored at 10 °C to 25 °C (50 °F to 77 °F). Each jar is shipped in an enclosure
containing a temperature indicator to detect exposure of the valve to extreme temperature.
The delivery system should be stored in a cool, dry place.
9.0 MR Safety
MR Conditional
Non-clinical testing has demonstrated that the Edwards SAPIEN XT transcatheter heart valve is
MR Conditional. A patient with this device, when implanted in the native valve or a failed surgical
bioprosthesis, can be scanned safely, immediately after placement of this device under the following
conditions:
• Static magnetic field of 1.5 tesla or 3 tesla
• Maximum spatial gradient field of 2500 gauss/cm (25 T/m) or less
• Maximum MR system reported, whole body averaged specific absorption rate (SAR) of 2 W/kg
(Normal Operating Mode)
Under the scan conditions defined above, the SAPIEN XT transcatheter heart valve is expected to
produce a maximum temperature rise of 2.6 °C after 15 minutes of continuous scanning.
In non-clinical testing, the image artifact caused by the device extends as far as 14.5 mm from the implant
for spin echo images and 30 mm for gradient echo im ages when scann ed in a 3.0 T MRI system. The
artifact obscures the device lumen in gradient echo images.
The implant has not been evaluated in MR systems other than 1.5 or 3.0 T.
For valve-in-surgical valve implantation or in the presence of other implants, please refer to MRI safety
information for the surgical valve or other devices prior to MR imaging.
10.0 Patient Infor mation
Patient education brochures are provided to each site and should be given to the patient to inform them of
the risks and benefits of the procedure and alternatives in adequate time before the procedure to be read
and discussed with their physician. A copy of this brochure may also be obtained from
Edwards Lifesciences by calling 1.800.822.9837. A patient implant card request form is provided with each
transcatheter heart valve. After implantation, all requested information should be completed on this form.
The serial number may be found on the package and on the identification tag attached to the transcatheter
heart valve. The original form should be returned to the Edwards Lifesciences address indicated on the
form and upon receipt, Edwards Lifesciences will provide an identification card to the patient.
11.0 Recovered Valve and Device Disposal
The explanted valve should be placed into a suitable histological fixative such as 10% formalin or 2%
glutaraldehyde and returned to the company. Refrigeration is not necessary under these circumstances.
Contact Edwards Lifesciences to request an Explant Kit.
Used delivery system may be disposed of in the same manner that hospital waste and biohazardous
materials are handled. There are no special risks related to the disposal of these devices.
12.0 Clinical Studies
The PARTNER II Trial Overview
Cohort B of The Placement of Aortic Transcatheter Valves Trial II (PARTNER II) was a 1:1 randomized,
controlled study independently powered to compare transcatheter valve therapy with the first generation
(SAPIEN valve) system to transcat heter va l ve t herapy with the second generation (Edwards SAPIEN XT
valve) system in patients who cannot undergo surgery (inoperable). Patients in the control cohort of
Cohort B received an Edwards SAPIEN valve with the RetroFlex 3 delivery system (transfemoral
12
Page 67

approach). Patients in the treatment cohort of Cohort B received an Edwards SAPIEN XT valve with the
NovaFlex+ delivery system (transfemoral). The randomized sample size was set to 500 patients.
Enrollment is complete and patients have reached at least 1 year of follow-up.
Cohort B of The Placement of Aortic Transcatheter Valves Trial II (PARTNER II) included registries for the
transfemoral delivery of the SAPIEN XT valve. These registries include the following:
• NR3: Registry for Transcatheter Heart Valve in Aortic Surgical Valve Implantation (THV-SV).
Patients with failing aortic bioprosthetic surgical valve with a surgical mortality or major morbidity
≥ 50% and meeting the sizing requirements for 23 mm or 26 mm SAPIEN XT valve.
• NR5 (29 mm / Transfemoral / Inoperable) is an Inoperable Transfemoral Registry for the delivery
of 29 mm SAPIEN XT valve in ≥ 7 mm femoral arteries.
Following completion of enrollment in the nested registries, the FDA approved continued access
enrollment in the nested registries (CANRs).
SOURCE Registry XT
The SOURCE Registry XT is an international multi-center prospective, consecutively enrolled,
observational registry. Consecutive patient data have been collected at discharge, 30 days, and
12 months post-implant, and will be collected annually thereafter up to 5 years post-implant.
Results of Cohort B
The primary endpoint of Cohort B of the PARTNER II trial was met. At 1 year the non-hierarchical composite
of all-cause mortality, disabling strokes, and re-hospitalizations was similar (p non-inferiority = 0.0037). At
30 days, all-cause mortality and major strokes were similar (mortality: SAPIEN valve 5.1% vs. SAPIEN XT
valve 3.5%; major strokes: SAPIEN valve 3.0% vs. SAPIEN XT valve 3.2%, p>0.9999).
The Edwards SAPIEN XT cohort was associated with a reduction in anesthesia time (p=0.0196), cath lab
time (p=0.0094), multiple valve implants (p=0.1534), aborted procedures (p=0.0585), and the need for
hemodynamic support (p=0.0637).
The trial showed that there was a reduction in the Edwards SAPIEN XT cohort as compared to
Edwards SAPIEN cohort for the following complications: major vascular complications in volv ing diss ec ti on
(from 9.2% to 4.3%, p=0.0195), perforation (from 4.8% to 0.7%, p=0.0031), and infection (from 5.5% to
1.8%, p=0.0163).
Secondary endpoints for the study included days alive and out of the hospital (DAOH), NYHA, 6MWT,
valve area (EOA), an d total aortic re gurg itat ion at one year as well as 6MWT improvement from baseline
to 1 year and device success.
Mean adjusted days alive and out of the hospital (DAOH) at 1 year: In the ITT population, the mean
adjusted days alive and out of the hospital (DAOH) was 299.2 ± 111.4 days for the SAPIEN cohort and
302.7 ± 108.7 days for the SAPIEN XT cohort at 1 year. The difference between cohorts was 3.5 days
(two sided 95% CI 1.8, 5.2), p< 0.0001.
NYHA at 1 year: In the SAPIEN cohort, mean NYHA was 3.5 ± 0.6 at baseline and 1.8 ± 0.8 at 1 year
which constituted a reduction of 1.7 ± 0.9. In the SAPIEN XT cohort, mean NYHA was 3.4 ± 0.6 at
baseline and 1.7 ± 0.7 at 1 year which was a mean decrease of 1.8 ± 0.9. The difference between cohorts
was -0.13, (two sided 95% CI -0.32, 0.06), p< 0.0001. Figure 14 illustrates the NYHA classification by visit
for the ITT population.
6MWT at 1 year: Hypothesis testing was based on a difference of 70 meters which is considered clinically
relevant. The mean 6 minute walk distance (6MWD) at 1 year was 132.3 ± 136.3 meters in the SAPIEN
cohort, and 159.0 ± 138.5 meters in the SAPIEN XT cohort. The difference between cohorts was
26.7 meters (95% CI 24.2, 29.2), p<0.00 01.
2
EOA at 1 year (hypothesis testing was based on a difference of 0.2 cm
EOA was 0.6 ± 0.17 cm
0.9 ± 0.38 cm
2
. In the SAPIEN XT cohort, mean EOA was 0.6 ± 0.18 cm2 at baseline and 1.5 ± 0.43 cm2
at 1 year, a mean increase of 0.9 ± 0.41 cm
2
at baseline and 1.5 ± 0.40 cm2 at 1 year, which was an improvement of
2
. The difference between cohorts in change from baseline to
): In the SAPIEN cohort, mean
1 year was -0.01 (95% CI -0.15, 0.13), p=0.0038.
Device success: Device success was defined as successful vascular access, delivery and deployment
and retrieval of delivery system; correct positioning, intended performance (aortic valve area > 1.2 cm
13
2
Page 68

and mean aortic valve gradient < 20 mmHg or peak velocity < 3 m/s, without moderate or severe
prosthetic valve AR), and only one valve implanted. The proportion of device success was 45.3% in the
SAPIEN cohort and 58.5% in the SAPIEN XT cohort. The relative risk ratio of SAPIEN XT cohort vs.
SAPIEN cohort was 0.759 (95% CI 0.582, 0.990), p<0.0001.
6MWT improvement in the SAPIEN XT cohort from baseline to 1 year was assessed as a superiority
comparison. The improvement for each subject was computed, and the superiority comparison was
evaluated by a two-sided paired sample t-test. In the SAPIEN XT cohort, the mean improvement in
6MWD from baseline to 1 year was 52.7 ± 111.5 meters, which was statistically significant (p<0.0001).
Total regurgitation at 1 year was analyzed in the valve implant population. Total aortic regurgitation was
assessed by the core lab as 0 = None, 1+ = Trace, 2+ = Mild, 3+ = Moderate, and 4+ = Severe. T he
change in mean total aortic regurgitation from baseline to 1 year was 0.1 ± 1.23 in the SAPIEN cohort,
and 0.2 ± 1.38 in the SAPIEN XT cohort. The difference between cohorts in change from baseline to
1 year was 0.09 (95% CI -0.16, 0.34), p=0.1027.
In conclusion, there were significant improvements from baseline in NYHA class, echo valve performance
(EOA and gradients), and Quality of Life (QOL) for patients in both the Edwards SAPIEN cohort and
Edwards SAPIEN XT cohort.
In the inoperable cohort of the PARTNER II trial, the new lower profile Edwards SAPIEN XT valve system
was associated with improved procedural outcomes, similar low 30-day mortality and strokes, reduced
vascular complications, and similar 1-year major clinical events and valve performance.
The Edwards SAPIEN XT valve has demonstrated objective evidence of safety, efficacy and clinical utility
for patients in whom transcatheter heart valve therapy is indicated and represents an advance with
incremental clinical value.
Results of NR5 (29 mm / Transfemoral / Inoperable)
A total of 61 patients were enrolled. The primary safety and effectiveness endpoint was freedom from
all-cause mortality at 1 year. The KM estimate at 30 days involving freedom from all-cause mortality was
94.9 ± 2.8%.
There were no reported major strokes or incidence of renal failure, cardiac intervention or endocarditis,
1.6% myocardial infarction, 8.2% major vascular complications, 11.5% disabling bleeding events, 2.7%
new atrial fibrillation and 4.9% new pacemaker.
The mean change (negative value = improvement) in NYHA from baseline at 30 days was -1.6 ± 0.9.
Device success was observed in 82.5%. The mean hospitalization stay was 6.1 ± 6.3 days which included
2.4 ± 3.4 days in the ICU.
2
The mean EOA was 0.8 ± 0.16 cm
at baseline and 2.2 ± 0.53 cm2 at 30 days, and the average mean
gradient decreased from 40.3 ± 11.8 mmHg at baseline to 7.7 ± 2.8 mmHg at 30 days. The mean peak
gradient decreased from 71.7 ± 20.8 mmHg at baseline to 15.5 ± 5.7 mmHg at 30 days.
Results of SOURCE XT
A total of 2688 patients were enrolled. The vast majority of patients (96%) were treated with either the
transapical (TA) or transfemoral (TF) approach. Only a small proportion of patients were treated with
transaortic (TAo) or subclavian approaches. The implant approach was 62.7% for TF, 33.3% for TA,
3.76% for TAo and 0.3% for subclavian. The results only include the TF, TA and TAo approaches
(n=2680).
Using K-M event rates at 30 days post implant for the TF, TA/TAo population, 6.2% of patients had died,
3% due to a cardiac death, 3.6% of patients had suffered a stroke, and 6.6% had a major vascular
complication. Major/life threatening bleeding had occurred in 14.9% of patients, major bleeding in 10.2%,
and renal failure or AKI in 17.8%. Permanent pacemakers were implanted in 9.5% of patients. Using K-M
event rates at 1 year post implant for the TF, TA/TAo population, 19.5% of patients had died, 9.5% of
these from cardiac death, and 6.3% of patients had suffered a stroke. Major/life-threatening bleeding had
occurred in 17.3% of patients, major bleeding in 12%, major vascular complications in 7.2%, renal failure
or AKI in 20.5% and 11% of patients had a new pacemaker implanted.
Of the 2688 patients that were enrolled, fifty-seven (57) of these patients had the SAPIEN XT valve
implanted into a failing surgical prosthesis. The TF approach was used in 23 patients, and the TA/TAo
14
Page 69

approach was used in 34 patients. The implanted valve size was 23 mm in 38 patients (66.7%), 26 mm in
14 patients (24.6%), and 29 mm in 5 patients (8.8%).
No deaths, no strokes, no major vascular complications, no life threatening bleedings, one (1) renal
failure, and no new permanent pacemakers were reported at 30 days post implant for the TF population.
At 1 year post implant, 3 deaths were reported for the TF population.
In the TA/TAo population, 3 deaths, 1 (major) stroke, 2 major vascular complications, 3 life threatening
bleedings, and 4 new permanent pacemakers were reported at 30 days. At 1 year post implant,
4 additional deaths, 1 additional (minor) stroke, 1 additional major vascular complication, and 1 additional
new permanent pacemaker were reported for the TA/TAo population.
The PARTNER II Cohort B Aortic Valve-in-Valve Registry (NR3/CANR3)
A clinical study was performed to establish a reasonable assurance of safety and effectiveness of
transcatheter aortic valve replacement with the Edwards SAPIEN XT valve in patients with a failing
surgical bioprosthetic aortic valve (i.e., “TAV-in-SAV”). The study was carried out as a single-arm registry
nested (i.e., the PARTNER II trial), which was designated as “NR3.” NR3 was originally approved for
100 patients and later expanded under a Continued Access Protocol (CAP). Data from the original NR3
cohort and the NR3 CAP (CANR3) cohort were pooled at 30 days and 1 year data was available for the
NR3 cohort only.
Patients were treated at 40 investigational sites between June 12, 2012 and December 10, 2013. The
database for this PMA supplement reflected data collected through February 26, 2015 and included
199 patients (2 patients withdrew prior to treatment). By the last database extract performed on
February 26, 2015, all of these patients were included in the 30-day data analysis, and 97 patients were
included in the 1-year analysi s.
The NR3 study was a single arm, prospective, observational, descriptive study without formal hypothesis
testing. The patients were limited to those who were deemed by a heart team to have a mortality or major
morbidity rate of ≥ 50% for replacement of a failing surgical aortic valve and met the sizing requirements
for the 23 mm or 26 mm SAPIEN XT valve. The specific sizing requirements were imposed because the
29 mm SAPIEN XT valve was not availab le whe n the study was initiated.
Contractors were utilized for analysis and interpretation of the clinical data, including an independent Data
Safety Monitoring Board (DSMB) that was instructed to notify the applicant of any safety or compliance
issues, a Clinical Event Committee (CEC) that was responsible for adjudicating endpoint-related events
reported during the trial per definitions established a priori, an Electrocardiography (ECG) Core Lab for
independent analysis of rhythm and occurrence of myocardial infarction, and an Echocardiography Core
Lab for independent analysis of all echocardiograms.
Results of PARTNER II Cohort B Aortic Valve-in-Valve Registry (NR3/CANR3)
Since identical protocols were used in the pivotal and CAP cohort investigations, data from the two
cohorts were pooled.
The “Attempted Implant” population consisted of all screen success patients for whom the index procedure
was started. The “Valve Implant” population consisted of those patients for whom the valve implant process
was completed. A total of 199 patients were screened for study participation. Two patients withdrew consent
prior to treatment; therefore, there were 197 “Attempted Implant” patients. Two “Attempted Implant” patients
were excluded from the “Valve Implant” population, because in one patient, intra-procedural TEE
demonstrated a low transvalvular jet velocity (2.6 m/s) and gradient of 24 mmHg which did not meet the
inclusion criteria, and in the other patient, the procedure was aborted due to inability to place the purse
string sutures for transapical access. The patient disposition is summarized in Table 14.
The demographics of the pooled study population are summarized in Table 15. The mean age was
78.5 years, and 60.4% were male. A high proportion of patients had significant comorbidities, frailty, and
prior cardiac interventions. The mean STS score was 9.7, and 95.4% of all patients were in NYHA
classes III or IV.
Table 16 provides a summary of the failed surgical valves treated, which consisted of 94.4%
bioprosthesis, 4.6% homografts, and 1.0% other valve types. Aortic stenosis was the predominant cause
of prosthetic failure (54.2%), followed by mixed lesion (23.4%) and insufficiency/regurgitation (22.4%).
The primary endpoint of all-cause mortality, all stroke, moderate or severe obstruction, or moderate or
severe paravalvular leak was 16.9% at 30 days and 38.0% at 1 year, as shown in Table 17.
15
Page 70

No unanticipated adverse device effects (UADEs) were reported throughout the trial. Three explants have
been reported to date; one explant occurred at autopsy, and two during surgical aortic valve replacement
due to severe aortic insufficiency on postoperative day 5 and day 18, respectively. No CEC adjudicated
endocarditis was reported.
The key safety outcomes adjudicated by the CEC for this study are presented in Table 18 through
Table 20.
Valve hemodynamics as assessed by echocardiography is summarized in Table 21 and Figure 18
through Figure 22. The mean DVI increased from 0.27 ± 0.10 at baseline to 0.37 ± 0.09 at 30 days and
0.39 ± 0.11 at 1 year. The mean gradient decreased from 36.1 ± 16.38 mmHg at baseline to
17.4 ± 7.37 mmHg at 30 days, which was maintained at 1 year. The mean peak gradient decreased from
65.0 ± 26.76 mmHg at baseline to 32.7 ± 12.90 mmHg at 30 days, which was maintained at 1 year.
Moderate/severe aortic regurgitation was present in 43.7% of subjects at baseline, which decreased to
2.5% at 30 days and 1.9% at 1 year. Moderate/severe paravalvular leak was present in 6.8% of subjects
at baseline, 2.5% at 30 days, and 1.9% at 1 year.
It is important to note that although mean and peak gradients were significantly reduced as compared to
baseline for the “TAV-in-SAV” procedure, the residual mean and peak gradients were numerically higher
than those observed for TAVR procedures performed for native valve stenosis.
The NYHA class by visit is shown in Figure 23. About 89% of subjects were in NYHA I/II at 30 days and
84% at 1 year as compared to 5% at baseline.
The mean improvement in 6MWD among the Attempted Implant population was 49.8 ± 169.9 meters from
baseline to 30 days and 86.1 ± 142.0 meters from baseline to 1 year.
The mean hospitalization stay among the Attempted Implant population was 7.9 ± 7.0 days, which
included 2.9 ± 5.0 days in the ICU.
The QoL at different time points as measured by the Kansas City Cardiomyopathy Questionnaire (KCCQ)
clinical summary score is shown in Figure 24. The mean KCCQ summary score among the Attempted
Implant population improved from 45.5 ± 21.8 at baseline to 68.0 ± 22.0 at 30 days and 70.4 at 1 year.
Device success was defined as successful vascular access, delivery and deployment and retrieval of
delivery system; correct positioning, intended performance (aortic valve area > 1.2 cm
2
and mean aortic
valve gradient < 20 mmHg or peak velocity < 3 m/s, without moderate or severe prosthetic valve aortic
regurgitation. It was achieved in 61.5 % of patients. In the vast majority of device failure subjects, the
failure was due to unintended performance of the valve; specifically, mean gradient ≥ 20 mmHg or peak
velocity ≥ 3 m/s was observed in 62 cases and moderate/severe aortic regurgitation in 5 cases.
16
Page 71

PARTNER II Cohort B Clinical Data
Age - yr
84.0 ± 8.68
84.5 ± 8.65
STS score†
10.3 ± 5.40
11.0 ± 5.72
I/II — no./total no. (%)
9/282 (3.2%)
11/271 (4.1%)
Previous myocardial infarctio n — no./total no. (%)
55/282 (19.5%)
57/271 (21.0%)
PCI — no./total no. (%)
89/282 (31.6%)
98/271 (36.2%)
Cerebral vascular disease — no./tot al no. (%)
31/282 (11.0%)
35/271 (12.9%)
Peripheral vascular disease — no./total no. (%)
88/282 (31.2%)
73/271 (26.9%)
Oxygen-dependent — no./total no. (%)
38/282 (13.5%)
43/271 (15.9%)
Atrial fibrillation — no./total no. (%)
102/282 (36.2%)
108/271 (39.9%)
Frailty§ — no./total no. (%)
168/282 (59.6%)
162/271 (59.8%)
Liver disease — no./total no. (%)
12/282 (4.3%)
13/271 (4.8%)
Mean aortic-valve gradient — mmHg
45.1 ± 13.67
45.2 ± 14.36
pulmonary disease, LVEF left ventricular ejection fraction, NYHA New York Heart Association, PCI percutaneous
Table 6:
Cohort B (Inoperable) Baseline Characteristics of the Patients and Echocardiographic Findings
(AT Population)*
Characteristic
Male sex — no./total no. (%) 140/282 (49.6%) 138/271 (50.9%)
Logistic EuroSCORE‡ 18.8 ± 14.66 21.0 ± 16.78
NYHA class
III/IV — no./total no. (%) 273/282 (96.8%) 260/271 (95.9%)
Coronary artery disease — no./total no. (%) 184/282 (65.2%) 183/271 (67.5%)
Previous intervention
CABG — no./total no. (%) 76/282 (27.0%) 72/271 (26.6%)
Balloon aortic val vuloplasty — no./total no. (%) 51/282 (18.1%) 53/271 (19.6%)
SAPIEN XT Valve SAPIEN Valve
(N = 282) (N = 271)
COPD
Any — no./total no. (%) 83/282 (29.4%) 71/271 (26.2%)
Creatinine > 2 mg/dL (177 μmol/liter) — no./total no. (%) 31/282 (11.0%) 30/271 (11.1%)
Permanent pacemaker — no./tot al no. (%) 57/282 (20.2%) 47/271 (17.3%)
Pulmonary hypertension — no./total no. (%) 72/282 (25.5%) 56/271 (20.7%)
Extensively calcified aorta — no./total no. (%) 19/282 (6.7%) 11/271 (4.1%)
Chest-wall deformity — no./total no. (%) 10/282 (3.5%) 10/271 (3.7%)
Echocardiographic findings
Aortic-valve area — cm2 0.6 ± 0.18 0.6 ± 0.17
Mean LVEF — % 52.5 ± 13.39 52.9 ± 13.61
Moderate or severe mitral regurgitation** — no./total no. (%) 71/264 (26.9%) 77/251 (30.7%)
* Plus–minus values are means ± SD. To convert the value for creatinine to micromoles per liter, multiply by 88.4.
AT denotes as treated population, CABG denotes coronary-artery bypass grafting, COPD chronic obstructive
coronary intervention, and TAVR transcatheter aortic-valve implantation.
† The Society of Thoracic Surgeons (STS) score measures patient ris k at the time of cardiov ascular sur g ery on a
scale that ranges from 0% to 100%, with higher numbers indicating greater risk. An STS score higher than 10%
indicates very high surgical risk.
‡ The logistic European System for Cardiac Operative Risk Evaluation (Eu roSCORE), which measures patient risk
at the time of cardiovas cular surgery, is calculated with the use of a logistic-regression equation. Scores range
from 0% to 100%, with higher scores indicating greater risk. A logistic EuroSCORE higher than 20% indicates
very high surgical risk.
§ Frailty was determined by the surgeons according to prespecified criteria.
** Moderate or severe mitral regurgitation was defined as regurgitation of grade 3+ or higher.
17
Page 72

Table 7:
SAPIEN XT
Valve
SAPIEN
Valve
SAPIEN XT
Valve
SAPIEN
Valve
(N = 282)
(N = 271)
(N = 282)
(N = 271)
Repeat hospitalizationc
32/282 (11.3%)
28/271 (10.33%)
61/282 (21.63%)
61/271 (22.51%)
Myocardial Infarction
All
Disabling Bleeding Evente
Cohort B (Inoperable) Clinical Outcomes at 30 days and 1 year
(AT Population)*
30 Days 1 Year
Outcomea
Deathb
From any cause 10/282 (3.5%) 12/271 (4.42%) 63/282 (22.34%) 61/271 (22.50%)
From cardiovascular cause
Major Stroke
9/282 (3.2%) 10/271 (3.69%) 46/282 (16.31%) 46/271 (16.97%)
9/282 (3.2%) 8/271 (2.95%) 13/282 (4.61%) 14/271 (5.17%)
Death from any cause or major
stroke or repeat hospitalization
Peri-procedural
Major Vascular Complications
Renal Failured
Cardiac Reinterventionf
Endocarditis
New Atrial Fibrillation
New pacemakerg
* AT= As Treated, NA= not applicable, TAVR = transcatheter aortic valve replacement. Data presented as n/N (%)
of patients.
a. CEC adjudicated
b. Deaths from unknown causes were assumed to be deaths from cardiovascular causes.
c. Repeat hospitalizations were included if they were due to aortic stenosis or complications of the valve procedure
(e.g. TAVR).
d. Renal failure is defined as stage III acute kidney injury: Increase in serum creatinine to ≥ 300% (3 x increase
compared with baseline) or serum creatinine of ≥ 4 mg/d (≥ 354 μmol/L) with an acute increase of at least
0.5 mg/dl (44 μmol/L)
e. Disabling bleeding: Fatal bleeding OR bleeding in a critical area or organ, such as intracranial, intraspinal,
intraocular, or pericardial necessitating pericardiocentesis, or intramuscular with compartment syndrome OR
bleeding causing hypovolemic shock or severe hypotension requiring vasopressors or surgery OR overt source
of bleeding with drop in hemoglobin of ≥ 5 g/dL or whole blood of packed red blood cells (RBC) transfusion
≥ 4 units
f. Cardiac reintervention includes any intervention that repairs, alters or replaces a previously operated valve OR
balloon aortic valvuloplasty OR Surgical aortic valve replacement OR valve in valve
g. Refer to Table 3 for breakdown of subjects with and without pacemaker or ICD at baseline.
48/282 (17.0%) 43/271 (15.87%) 105/282 (37.23%) 100/271 (36.90%)
5/282 (1.8%) 2/271 (0.74%) 19/282 (6.74%) 8/271 (2.95%)
4/282 (1.4%) 1/271 (0.37%) NA NA
32/282 (11.3%) 43/271 (15.87%) 35/282 (12.41%) 47/271 (17.34%)
10/282 (3.5%) 5/271 (1.85%) 16/282 (5.67%) 10/271 (3.69%)
22/282 (7.8%) 34/271 (12.55%) 38/282 (13.48%) 52/271 (19.19%)
9/282 (3.2%) 13/271 (4.80%) 10/282 (3.55%) 13/271 (4.80%)
0/282 (0.00%) 0/271 (0.00%) 1/282 (0.35%) 2/271 (0.74%)
6/186 (3.2%) 7/190 (3.68%) 10/154 (6.49%) 9/144 (6.25%)
19/282 (6.7%) 16/271 (5.90%) 22/282 (7.80%) 21/271 (7.75%)
18
Page 73

Table 8:
(N = 271)
(N = 282)
SAPIEN
271
227
205
190
175
164
SAPIEN XT
282
234
220
202
193
175
0%
10%
20%
30%
40%
50%
60%
70%
0 1 2 3 4 5 6 7 8 9 10 11 12
All-Cause Morta lity or Major Stroke or
Rehospitalization
Months
Post-Procedure
SAPIEN
SAPIEN XT
17.0%
15.2%
37.4%
37.3%
No. at Risk
p (log rank) = 0.9781
Conduction Disturbance Requiring Pacemaker (CEC Adjudicated)
Pooled AT Population)
SAPIEN Valve
SAPIEN XT Valve
Event
Events
Patients with
Event Events
Patients with
Event
New Permanent Pacemaker – All Patients1
0-30 Days 16 16/271 (5.9%) 19 19/282 (6.7%)
0-12 Months 21 21/271 (7.7%) 22 22/282 (7.8%)
New Permanent Pacemaker – Patients
without pre-procedural pac emaker2
0-30 Days 16 16/224 (7.1%) 19 19/225 (8.4%)
0-12 Months 21 21/224 (9.4%) 22 22/225 (9.8%)
1
Subjects with pacemaker or ICD at baseline are included (all patients included in denominator).
2
Subjects with pacemaker or ICD at baseline are excluded (patients with baseline pacemaker/ICD subtracted from
denominator).
Note: The patients who received a new pacemaker in both rows are the same patients. The only difference is the
denominators
Figure 4:
All-Cause Mortality or Major Stroke or Re-Hospitalization at One Year
(AT Population)
19
Page 74

Figure 5:
SAPIEN
271
256
246
227
213
202
SAPIEN XT
282
272
255
243
234
216
0%
10%
20%
30%
40%
50%
60%
70%
0 1 2 3 4 5 6 7 8 9 10
11 12
All-Cause Mortality
Months Post
-Procedure
SAPIEN
SAPIEN XT
4.5%
3.6%
22.8%
22.4%
No. at Risk
p (log rank) = 0.8844
STS <8
8682787370
67
STS 8-15
142
135
130
120
112
104
STS >15
4840383431
31
0%
10%
20%
30%
40%
50%
60%
70%
0 1
2
3 4 5 6 7 8
9
10 11
12
All-Cause Mortality
Months Post-Procedure
STS <8
STS 8-15
STS >15
2.4%
2.8%
18.0%
22.4%
No. at Risk
p (log rank) = 0.0336
16.7%
35.4%
All-Cause Mortality at One Year
(AT Population)
K-M curves for all-cause mortality by STS scores up to 1-Year for the pooled valve implant populations for
the SAPIEN cohort and the SAPIEN XT cohort are presented in Figures 6 and 7 respectively. The p-value
for each log-rank test for the SAPIEN cohort shows a statistically significant difference among the 3 STS
score groups (p-value=0.0336).
All-Cause Mortality by STS Score to One Year - SAPIEN Valve
This difference between STS risk groups was not present in the SAPIEN XT valve (p-value=0.0647).
(Intent-to-Treat Population)
Figure 6:
20
Page 75

Figure 7:
STS <8
103
100
969491
87
STS 8-15
133
127
119
111
105
95
STS >15
4845403838
34
0%
10%
20%
30%
40%
50%
60%
70%
0 1 2 3 4 5 6 7 8 9 10 11 12
All-Cause Mortality
Months Post-Procedure
STS <8
STS 8-15
STS >15
2.9%
3.1%
14.6%
26.7%
No. at Risk
p (log rank) = 0.0647
6.3%
27.2%
STS <8
8279767269
63
STS 8-15
135
131
125
116
111
103
STS >15
4039373431
30
0%
10%
20%
30%
40%
50%
60%
70%
0 1 2 3 4 5 6 7 8 9 10 11 12
All-Cause Mortality
Months Post-Procedure - 1
STS <8
STS 8-15
STS >15
2.5%
3.0% 18.6%
20.2%
No. at Risk
p (log rank) = 0.6885
2.5%
25.0%
All-Cause Mortality by STS Score to One Year – SAPIEN XT Valve
(Intent-to-Treat Population)
Figures 8 and 9 show the results of a landmark analysis of all-cause mortality by STS scores for SAPIEN
cohort and SAPIEN XT cohort respectively. In this analysis the overall mortality at day 30 was reset to
0 for patients still at risk at day 30 and day 30 was relabeled as day 0. The Kaplan-Meier plots were
produced based on the re-zeroed data, and all-cause mortality was analyzed to one year from the new
day 0. Any events that occurred before day 30 were not included in this analysis. There were no
statistically significant differences in overall mortality among the STS score groups in either cohorts.
Figure 8:
All-Cause Mortality by STS Score Rezeroing at 30-Days – SAPIEN Valve
(Intent-to-Treat Population)
21
Page 76

Figure 9:
STS <8
100
98
969290
84
STS 8-15
127
122
115
108
99
92
STS >15
45
42
393837
34
0%
10%
20%
30%
40%
50%
60%
70%
0 1 2
3
4 5 6 7 8 9 10 11 12
All-Cause Mortality
Months Post-Procedure
- 1
STS <8
STS 8-15
STS >15
2.0%
3.9%
13.1%
25.2%
No. at Risk
p (log rank) = 0.0718
6.7%
22.4%
SAPIEN
271
251
241
223
209
197
SAPIEN XT
282
264
250
239
229
214
0%
10%
20%
30%
40%
50%
60%
70%
0 1 2 3 4 5 6 7 8 9 10 11 12
Major Stroke
Months Post-Procedure
SAPIEN
SAPIEN XT
3.0%
3.2%
5.6%
4.9%
No. at Risk
p (log rank) = 0.7467
All-Cause Mortality by STS Score Rezeroing at 30-Days – SAPIEN XT Valve
(Intent to Treat Population)
Figure 10:
Major Stroke to One Year
(AT Population)
22
Page 77

Figure 11:
SAPIEN
271
230
207
192
177
166
SAPIEN XT
282
240
224
205
195
175
0%
10%
20%
30%
40%
50%
60%
70%
0 1 2 3 4 5 6 7 8 9 10 11 12
Rehospitalization
Months Post-Procedure
SAPIEN
SAPIEN XT
10.7%
11.6%
24.2%
23.1%
No. at Risk
p (log rank) = 0.7558
0.6
1.5
1.5
0.6
1.6
1.5
0
0.5
1
1.5
2
2.5
Baseline
30 Days
1 Year
Effective Orifice Area (cm²)
SAPIEN
SAPIEN XT
P = 0.6405
No. of Echos
SAPIEN
244
221
162
SAPIEN XT
266
237
171
P = 0.2827
Rehospitalization to One Year
(AT Population)
Figure 12:
Effective Orifice Area
(Valve Implant Population)
23
Page 78

Figure 13
45.2
10.4
11.0
45.2
10.0
11.4
0
10
20
30
40
50
60
70
Baseline
30 Days
1 Year
Gradient (mmHg)
SAPIEN
SAPIEN XT
No. of Echos
SAPIEN
252
230
163
SAPIEN XT
273
241
174
P = 0.5694
P = 0.9700
:
Mean Gradient
(Valve Implant Population)
SAPIEN Valve
Visit I II III IV Total I II III IV Total
Baseline 0 11 129 131 271 0 9 137 136 282
30 Days 90 99 55 5 249 97 107 51 8 263
6 Months 90 86 27 4 207 111 80 21 5 217
1 Year 80 82 26 4 192 99 81 20 4 204
Table 9:
NYHA Functional Class by Visit
AT Population
(N=271)
24
SAPIEN XT Valve
(N=282)
Page 79

Figure 14:
0%
20%
40%
60%
80%
100%
%
Baseline
30 Days 1 Year
96%
12%
97%
24%
15%
22%
276 204192263249284
I
II
III
IV
16%
12%
6 Months
217207
SAPIEN
SAPIEN
XT
SAPIEN
SAPIEN
XT
SAPIEN
SAPIEN
XT
SAPIEN
SAPIEN
XT
t=0.8007 t=0.7975 t=0.3810 t=0.4791
43.64
62.45
64.49
44.18
63.02
67.53
0
20
40
60
80
100
Baseline
30 Days
1 Year
Mean Scores
SAPIEN
SAPIEN XT
NYHA Class by Visit
(Intent-to-Treat Population)
Figure 15:
KCCQ Clinical Summary Score
(AT Population)
25
Page 80

(N= 61)
Age - yr
83.3 ± 7.89
Logistic EuroSCORE‡
11.3 ± 13.75
NYHA class — no. (%)
Coronary artery disease — no. (%)
48 (78.7%)
PCI
19/61 (31.1%)
Cerebral vascular disease — no./tot al no. (%)
10/61 (16.4%)
Peripheral vascular disease — no./total no. (%)
16/61 (26.2%)
Any
19 (31.1%)
Atrial fibrillation — no./total no. (%)
30/61 (49.2%)
Permanent pacemaker — no./tot al no. (%)
18/61 (29.5%)
Frailty§ — no./total no. (%)
30/61 (49.2%)
Liver disease — no./total no. (%)
2/61 (3.3%)
Echocardiographic findings
Mean LVEF — %
46.1 ± 14.52
Table 10:
Cohort B (29 mm / Transfemoral / Inoperable)
Baseline Characteristics of the Patients and Echocardiographic Findings
(Intent to Treat Population)
Characteristic
Male sex — no. (%) 61 (100.0%)
STS score† 8.3 ± 4.39
I/II 6 (9.8%)
III/IV 55 (90.2%)
Previous myocardial infarctio n — no./total no. (%) 14/61 (23.0%)
Previous intervention — no./total no. (%)
CABG 34/61 (55.7%)
Balloon aortic valvuloplasty 20/61 (32.8%)
SAPIEN XT Valve
COPD — no. (%)
Oxygen-dependent 6 (9.8%)
Creatinine > 2 mg/dL (177 μmol/liter) — no./total no. (%) 8/61 (13.1%)
Pulmonary hypertension — no./total no. (%) 13/61 (21.3%)
Extensively calcified aorta — no. (%) 3 (4.9%)
Chest-wall deformity — no. (%) 5 (8.2%)
Aortic-valve area — cm2 0.8 ± 0.16
Mean aortic-valve gradient — mmHg 40.3 ± 11.67
Moderate or severe mitral regurgitation** — no./total no. (%) 15/56 (26.8%)
Note: Plus–minus values are means ± SD. To convert the value for creatinine to micromoles per liter, multiply by
88.4. ITT denotes intent to treat population, CABG denotes coronary-artery bypass grafting, COPD chronic
obstructive pulmonary disease, LVEF left ventricular ejection fraction, NYHA New York Heart Association, PCI
percutaneous coronary intervention, and TAVR transcatheter aortic-valve implantation.
† The Society of Thoracic Surgeons (STS) score measures patient ris k at the time of cardiovascular surgery on a
scale that ranges from 0% to 100%, with higher numbers indicating greater risk. An STS score higher than 10%
indicates very high surgical risk.
‡ The logistic European System for Cardiac Operative Risk Evaluation (EuroSCORE), which measures patient risk
at the time of cardiovas cular surgery, is calculated with the use of a logistic-regression equation. Scores range
from 0% to 100%, with higher scores indicating greater risk. A logistic EuroSCORE higher than 20% indicates
very high surgical risk.
§ Frailty was determined by the surgeons according to prespecified criteria.
** Moderate or severe mitral regurgitation was defined as regurgitation of grade 3+ or higher.
26
Page 81

Table 11:
N=61
Deathb
From cardiovascular cause
3/61 (4.9%)
Major Vascular Complications
5/61 (8.2%)
Renal Failurec
0/61 (0.0%)
Cardiac Reinterventione
0/61 (0.0%)
New pacemaker
3/61 (4.9%)
40.3
7.7
0
10
20
30
40
50
60
Baseline
30 Days
Gradient (mmHg)
SAPIEN XT
No. of Echos
SAPIEN XT
59
50
Cohort B (29 mm / Transfemoral / Inoperable) – CEC Adjudicated Adverse Events at 30 days
(AT Population)*
Outcome
a
From any cause 3/61 (4.9%)
Major Stroke 0/61 (0.0%)
Myocardial Infarction 1/61 (1.6%)
Disabling Bleeding Eventd 7/61 (11.5%)
Endocarditis 0/61 (0.0%)
New Atrial Fibrillation 1/37 (2.7%)
* AT= As Treated. Data presented as n/N (%) of patients.
a. CEC adjudicated
b. Deaths from unknown causes were assumed to be deaths from cardiovascular causes.
c. Renal failure is defined as stage III acute kidney injury: Increase in serum creatinine to ≥ 300% (3 x increase
compared with baseline) or serum creatinine of ≥ 4 mg/d (≥ 354 μmol/L) with an acute increase of at least
0.5 mg/dl (44 μmol/L)
d. Disabling bleeding: Fatal bleeding OR bleeding in a critical area or organ, such as intracranial, intraspinal,
intraocular, or pericardial necessitating pericardiocentesis, or intramuscular with compartment syndrome OR
bleeding causing hypovolemic shock or severe hypotension requiring vasopressors or surgery OR overt source of
bleeding with drop in hemoglobin of ≥ 5 g/dL or whole blood of packed red blood cells (RBC) transfusion ≥ 4 units
e. Cardiac reintervention includes any intervention that repairs, alters or replaces a previously operated valve OR
balloon aortic valvuloplasty OR Surgical aortic valve replacement OR valve in valve
SAPIEN XT Valve
Figure 16:
Cohort B (29 mm / Transfemoral / Inoperable) – Mean Gradient
(Valve Implant Population)
Gradient data for this figure only contains data from 29 mm valve sizes and does not include 23 or 26 mm.
27
Page 82

Figure 17:
0.8
2.2
0
0.5
1
1.5
2
2.5
3
Baseline
30 Days
Effective Orifice Area (cm²)
SAPIEN XT
No. of Echos
SAPIEN XT
55
47
Cohort B (29 mm / Transfemoral / Inoperable) – Effect iv e O ri fice A rea
(Valve Implant Population)
Effective orifice area data for this figure only contains data from 29 mm valve sizes and does not include
23 or 26 mm.
28
Page 83

SOURCE XT Clinical Data
Baseline Characteristics of the Patients and Echocardiographic Findings (AT Population)
Transfemoral
TA/TAo Pooled
(N = 1685)
(N = 995)
Age - yr
82.0 ± 6.5
80.3 ± 6.5
Male sex — no./total no. (%)
600/1685 (35.6%)
536/995 (53.9%)
STS score†
8.0 ± 6.8
7.9 ± 6.2
Logistic EuroSCORE‡
19.8 ± 11.6
21.6 ± 13.7
NYHA class — no./t otal no. (%)
I/II
377/1676 (22.5%)
242/992 (24.4%)
III/IV
1299/1676 (77.5%)
750/992 (75.6%)
Coronary artery disease — no./total no. (%)
667/1685 (39.6%)
518/995 (52.1%)
Previous myocardial infarctio n — no./total no. (%)
205/1685 (12.2%)
197/995 (19.8%)
Previous intervention — no./total no. (%)
CABG
204/1685 (12.1%)
226/995 (22.7%)
PCI
460/1685 (27.3%)
355/995 (35.7%)
Balloon aortic valvuloplasty
128/1685 (7.6%)
66/995 (6.6%)
Cerebral vascular disease — no./tot al no. (%)
191/1685 (11.3%)
143/995 (14.4%)
Peripheral vascular disease — no./total no. (%)
248/1684 (14.7%)
320/995 (32.2%)
COPD — no./total no. (%)
Any — no./total no. (%)
327/1684 (19.4%)
218/995 (21.9%)
Oxygen-Dependent — no./total no. (%)
31/1684 (1.8%)
11/995 (1.1%)
Creatinine > 2 mg/dL (177 μmol/liter) — no./total no. (%)
104/1681 (6.2%)
114/994 (11.5%)
Atrial fibrillation — no./total no. (%)
395/1678 (23.5%)
289/990 (29.2%)
Permanent pacemaker — no./tot al no. (%)
170/1685 (10.1%)
134/995 (13.5%)
Pulmonary hypertension — no./total no. (%)
440/1684 (26.1%)
204/995 (20.5%)
Frailty§ — no./total no. (%)
896/932 (96.1%)
548/579 (94.6%)
Extensively calcified aorta — no./total no. (%)
71/1684 (4.2%)
103/995 (10.4%)
Chest-wall deformity — no./total no. (%)
18/1684 (1.1%)
6/995 (0.6%)
Liver disease — no./total no. (%)
52/1685 (3.1%)
27/995 (2.7%)
Echocardiographic findings
Aortic-valve area — cm2
0.7 ± 0.21
0.7 ± 0.21
Mean aortic-valve gradient — mmHg
49.2 ± 16.54
45.0 ± 15.43
Mean LVEF — %
55.1 ± 12.48
53.2 ± 12.50
Moderate or severe mitral regurgitation** — no./total no. (%)
345/1633 (21.1%)
174/976 (17.8%)
Characteristic
Table 12:
SOURCE XT (High Risk)
Note: Plus–minus values are means ± SD. To convert the value for creatinine to micromoles per liter, multiply by
88.4. AT denotes as treated population, CABG denotes coronary-artery bypass grafting, COPD chronic obstructive
pulmonary disease, LVEF left ventricular ejection fraction, NYHA New York Heart Ass ociation, PCI percutaneous
coronary intervention, and TAVR transcatheter aortic-valve implantation.
† The Society of Thoracic Surgeons (STS) score measures patient ris k at the time of cardiovascular surgery on a
scale that ranges from 0% to 100%, with higher numbers indicating greater risk. An STS score higher than 10%
indicates very high surgical risk.
‡ The logistic European System for Cardiac Operative Risk Evaluation (EuroSCORE), which measures patient risk
at the time of cardiovas cular surgery, is calculated with the use of a logistic-regression equation. Scores range
from 0% to 100%, with higher scores indicating greater risk. A logistic EuroSCORE higher than 20% indicates
very high surgical risk.
§ Frailty was determined by the surgeons according to prespecified criteria.
** Moderate or severe mitral regurgitation was defined as regurgitation of grade 3+ or higher.
29
Page 84

Transfemoral
TA/TAo
Transfemoral
TA/TAo
(N = 1685)
(N = 995)
(N = 1685)
(N = 995)
All Cause Death
71 (4.2%)
96 (9.7%)
248 (15.0%)
266 (27.0%)
All Stroke
56 (3.4%)
39 (4.1%)
90 (5.6%)
66 (7.6%)
Major Stroke
34 (2.0%)
27 (2.8%)
55 (3.5%)
44 (5.0%)
Renal Failured/AKI
197 (11.9%)
270 (28.0%)
240 (14.7%)
292 (30.6%)
Life-threatening bleedingc
63 (3.8%)
84 (8.6%)
74 (4.5%)
101 (10.6%)
Patient Disposition
Table 13:
SOURCE XT (High Risk) Clinical Outcomesa at 30 days and 1 year
(AT Population)*
30 Days 1-Year
Outcome
Cardiac Death 28 (1.7%) 51 (5.2%) 106 (6.7%) 132 (14.4%)
Stroke
Repeat hospitalizationb 80 (4.9%) 83 (9.0%) 396 (25.5%) 314 (36.7%)
Myocardial Infarction 7 (0.4%) 9 (0.9%) 23 (1.5%) 21 (2.5%)
Major Vascular Complications 132 (7.9%) 43 (4.4%) 139 (8.3%) 52 (5.5%)
Endocarditis 2 (0.1%) 2 (0.2%) 15 (1.0%) 10 (1.2%)
New Atrial Fibrillation 54 (3.3%) 83 (8.8%) 89 (5.6%) 109 (12.0%)
New pacemaker 145 (8.7%) 105 (10.8%) 165 (10.0%) 120 (12.7%)
* AT= As Treated, TAVR = transcatheter aortic valve replacement. Data presented as n (%) of patients where % is
the Kaplan-Meier event rate at 30-days and 1-year respectively.
a. CEC adjudicated
b. Repeat hospitalizations were included if they were due to aortic stenosis or complications of the valve procedure
(e.g. TAVR).
c. Disabling bleeding: Fatal bleeding OR bleeding in a critical area or organ, such as intracranial, intraspinal,
intraocular, or pericardial necessitating pericardiocentesis, or intramuscular with compartment syndrome OR
bleeding causing hypovolemic shock or severe hypotension requiring vasopressors or surgery OR overt source of
bleeding with drop in hemoglobin of ≥ 5 g/dL or whole blood of packed red blood cells (RBC) transfusion ≥ 4 units
d. Renal failure is defined as stage III acute kidney injury: Increase in serum creatinine to ≥ 300% (3 x increase
compared with baseline) or serum creatinine of ≥ 4 mg/d (≥ 354 μmol/L) with an acute increase of at least
0.5 mg/dl (44 μmol/L)
PARTNER II Nested Registry 3/ Continued Access Nested Registry 3 (NR3/CANR3) (Aortic
Valve-in-Valve)
Attempted Implant1 Valve Implant2
Number of Patients 197 195
1
Attempted Implant: All screen success patients for whom the Index
Procedure was started. Patients were analyzed according to the valve
used in the initial implant attempt.
2
Valve Implant: This popul ation was a subset of the Attempted Implant
group, consisting of thos e patients for whom the valve implant process
was completed.
Table 14:
30
Page 85

Table 15:
Characteristic
Results1 (N=197)
STS score
9.7 ± 5.09
III/IV
188/197 (95.4%)
Previous intervention
Prior aortic valvuloplasty
17/197 (8.6%)
Peripheral vascular disease
49/197 (24.9%)
Chronic obstructive pulmonary disease (COPD)
Oxygen-dependent
14/197 (7.1%)
Permanent pacemaker
51/197 (25.9%)
Extensively calcified aorta
12/197 (6.1%)
Reason for Valve Replacement
Stenosis Only
104/192 (54.2%)
Mean aortic-valve gradient — mmHg
35.9 ± 16.42
Moderate or severe mitral regurgitation5
62/171 (36.3%)
Demographic and Baseline Characteristics
Attempted Implant Population
Age – yr 78.5 ± 11.001
Male sex 119/197 (60.4%)
New York Heart Association (NYHA) class
I/II 9/197 (4.6%)
Coronary artery disease 139/197 (70.6%)
Previous myocardial infarctio n 25/197 (12.7%)
Coronary artery bypass grafting (CABG) 97/197 (49.2%)
Percutaneous coronary intervention (PCI) 39/197 (19.8%)
Cerebral vascular accident (CVA) 29/197 (14.7%)
Any 65/197 (33.0%)
Creatinine > 2 mg/dL (177 µmol/liter)2 25/197 (12.7%)
Atrial fibrillation 98/197 (49.7%)
Pulmonary hypertension 26/197 (13.2%)
Frailty3 65/197 (33.0%)
Chest-wall deformity 4/197 (2.0%)
Liver disease 14/197 (7.1%)
Mixed Lesion 45/192 (23.4%)
Insufficiency/regurgitation Only 43/192 (22.4%)
Echocardiographic findings
Doppler Velocity Index (DVI)4 0.27 ± 0.10
Mean left ventricular ejection fraction (LVEF) — % 49.8 ± 13.87
1
Quantitative data are expressed as mean ± SD (n). Categorical data are expressed as no./total no. (%).
2
To convert the value for creatinine to micromoles per liter, multiply by 88.4.
3
Frailty was determined by the surgeons according to pre-specified criteria.
4
DVI is a flow-dependent measure of orifice stenosis. A DVI < 0.25 suggests significant stenosis.
5
Moderate or severe mitral regurgitation was defined as regurgitation of grade 3+ or higher.
31
Page 86

Table16:
Type of Failed Surgical Valve
Bioprosthesis
184/195 (94.4%)
Other2
2/195 (1.0%)
Reason for Valve Replacement
Insufficiency/regurgitation Only
43/192 (22.4%)
(N=195)
(N=96)
All-Cause Mortality
8/195 (4.1%)
[1.8%, 7.9%]
19/96 (19.8%)
[12.4%, 29.2%]
Moderate or Severe PV Leak
4/162 (2.5%)
[0.7%, 6.2%]
1/53 (1.9%)
[0.0%, 10.1%]
mortality, all stroke, moderate or severe obstruction, moderate or severe paravalvular leak.
From any cause
8/197 (4.1%)
19/97 (19.6%)
Myocardial Infarction
5/197 (2.5%)
3/97 (3.1%)
Disabling Bleeding3
19/197 (9.6%)
16/97 (16.5%)
Summary of Failed Bioprosthetic Surgical Valves
Attempted Implant Population
Results1 (N=197)
Homograft 9/195 (4.6%)
Mixed Lesion 45/192 (23.4%)
Stenosis Only 104/192 (54.2%)
1
Categorical data are expressed as no./total no. (%).
2
Other includes an unidentified manufactured tissue valve and a St. Jude mechanical composite
Table 17:
All-Cause Mortality, All Stroke, Moderat e or Severe Obstructi on, or Moderate or Sever e Paravalvular Leak
Valve Implant Population
30 Days
1 Year
Events
Patients with
Event
95% Confidence
Interval3
Patients with
Event
95% Confidence
Interval
Composite Event1 28/166 (16.9%) [11.5%, 23.4%] 27/71 (38.0%) [26.8%, 50.3%]
All Stroke 5/195 (2.6%) [0.8%, 5.9%] 3/96 (3.1%) [0.6%, 8.9%]
Moderate or Severe Obstruction2 12/169 (7.1%) [3.7%, 12.1%] 6/54 (11.1%) [4.2%, 22.6%]
1
Composite of all-cause
Mortality and stroke are calculated at 30 days. The moderate or severe obstruction and paravalvular leak use the
Echo core lab’s determination at the 30-day follow-up visit.
2
Doppler velocity index (DVI) < 0.25 per the echo core lab read.
3
Confidence intervals calculated using exact binomial calculations. The confidence intervals are calculated without
multiplicity adjustment. The adjusted confidence intervals could be wider than presented here. As such, confidence
intervals are provided to illustrate the variability only and should not be used to draw any statistical conclusion.
Table 18:
CEC Adjudicated Adverse Events
Attempted Implant Population
Rate (no./total no. (%))
Adverse Events
Death1
30 Days
(N=197)
1 Year
(N=97)
From cardiovascular cause 7/197 (3.6%) 15/97 (15.5%)
Major Stroke 5/197 (2.5%) 3/97 (3.1%)
Major Vascular Complications 8/197 (4.1%) 6/97 (6.2%)
Acute Kidney Injury, Stage III2 2/197 (1.0%) N/A
32
Page 87

Rate (no./total no. (%))
Cardiac Reintervention4
4/197 (2.0%)
2/97 (2.1%)
Endocarditis
0/197 (0.0%)
0/97 (0.0%)
1
Adverse Events
30 Days
(N=197)
1 Year
(N=97)
New Atrial Fibrillation 4/135 (3.0%) 2/45 (4.4%)
New Pacemaker 3/197 (1.5%) 1/97 (1.0%)
Deaths from unknown causes were assumed to be deaths from cardiovascular causes.
2
Acute kidney injury, stage III is defined as an increase in serum creatinine to ≥ 300% (3 x increase compared with
baseline) or serum creatinine of ≥ 4 mg/d (≥ 354 µmol/L) with an acute increase of at least 0.5 mg/dl (44 µmol/L)
within 72 hours of the procedure (per the VARC-1 definition).
3
Disabling bleeding: Fatal bleeding OR bleeding in a critical area or organ, such as intracranial, intraspinal,
intraocular, or pericardial necessitating pericardiocentesis, or intramuscular with compartment syndrome OR
bleeding causing hypovolemic shock or severe hypotension requiring vasopressors or surgery OR overt source of
bleeding with drop in hemoglobin of ≥ 5 g/dL or whole blood of packed red blood cells (RBC) transfusion ≥ 4 units
(Life-threatening per VARC-1 defin itio ns) .
4
Cardiac reintervention includes any intervention that repairs, alters or replaces a previously operated valve OR
balloon aortic valvuloplasty OR Surgical aortic valve replacement OR valve in valve.
Table 19:
Kaplan-Meier (KM) Event Rate for CEC Adjudicated Major Vascular Complications, Major Stroke, Minor
Stroke, TIA, and Acute Kidney Injury
Attempted Implant Population
VARC Event1 Events
Major Vascular
15 14 0.071 (0.043,
Complications
30 Days
(N=197)
Patients
with
Event
KM
Estimate2 95% CI3 Events
14 12 0.127 (0.074,
0.117)
1 Year
(N=97)
Patients
with
Event
KM
Estimate 95% CI
0.213)
and/or Major Stroke
and/or Minor Stroke
and/or TIA and/or
Acute Kidney Injury,
Stage III
Major Vascular
Complications
Major Stroke 5 5 0.025 (0.011,
8 8 0.041 (0.021,
0.080)
0.060)
6 6 0.062 (0.029,
0.134)
5 3 0.032 (0.010,
0.096)
Minor Stroke 0 0 0.000 N/A 0 0 0.000 N/A
TIA 0 0 0.000 N/A 1 1 0.013 (0.002,
0.089)
Acute Kidney Injury,
Stage III
1
Standardized endpoint definitions for transcatheter aortic valve implantation clinical trials consensus from the
2 2 0.010 (0.003,
0.040)
Valve Academic Research Consortium (VARC). Events with missing or incomplete onset dates were excluded
from the analysis.
2
Kaplan-Meier estimates used the first event per patient. Events occurring after day 30 and day 365 were not
included in the analysis of the 30-day and 1-year results, respectively.
3
Confidence intervals calculated using Greenwood’s formula. The confidence intervals are calculated without
multiplicity adjustment. The adjusted confidence intervals could be wider than presented h ere. As such, con fid enc e
intervals are provided to illustrate the variability only and should not be used to draw any statistical conclusion.
33
Page 88

Table 20:
(N=197)
(N=97)
Pacemaker- All Patients
preexisting pacemaker
1
denominators.
Baseline
Discharge
30 Days
1 Year
Conduction Disturbance Requiring New Permanent Pacemaker
Attempted Implant Population
30 Days
1 Year
Events
New Permanent
New Permanent Pacemaker
– Patients without
Subjects with pacemaker or ICD at baseline were included (all patients included in denominator).
2
Subjects with pacemaker or ICD at baseline were excluded (patients with baseline pacemaker/ICD subtracted
from denominator).
Note: The patient who received a new pacemaker in both rows is the same patient. The only difference is the
1
2
3 3/197 (1.5%) 1 1/97 (1.0%)
3
Patients
with Event
3/146 (2.1%)
Events
1
Patients
with Event
1/70 (1.4%)
Table 21:
Valve Hemodynamics Measured by Echocardiography
Valve Implant Population
Doppler Velocity Index - mean ± SD (n)
All Valve Sizes 0.27 ± 0.10 (173) 0.37 ± 0.09 (161) 0.37 ± 0.09 (169) 0.39 ± 0.11 (54)
23 mm (N=140) 0.26 ± 0.09 (123) 0.36 ± 0.10 (114) 0.36 ± 0.09 (118) 0.38 ± 0.11 (38)
26 mm (N=55) 0.29 ± 0.13 (50) 0.40 ± 0.08 (47) 0.41 ± 0.11 (51) 0.44 ± 0.11 (16)
Mean Gradient (mmHg) - mean ± SD (n)
All Valve Sizes 36.1 ± 16.38 (179) 18.2 ± 7.79 (168) 17.4 ± 7.37 (176) 17.3 ± 8.76 (56)
23 mm (N=140) 37.2 ± 16.86 (129) 19.5 ± 8.19 (120) 19.0 ± 7.64 (125) 18.8 ± 9.32 (40)
26 mm (N=55) 33.2 ± 14.84 (50) 15.0 ± 5.51 (48) 13.4 ± 4.79 (51) 13.7 ± 5.91 (16)
Peak Gradient (mmHg) - mean ± SD (n)
All Valve Sizes 65.0 ± 26.76 (179) 34.3 ± 13.67 (168) 32.7 ± 12.90 (176) 32.8 ± 15.58 (56)
23 mm (N=140) 66.9 ± 27.49 (129) 36.5 ± 14.36 (120) 35.4 ± 13.30 (125) 35.2 ± 16.80 (40)
26 mm (N=55) 60.1 ± 24.34 (50) 29.0 ± 10.05 (48) 26.2 ± 9.09 (51) 26.7 ± 10.04 (16)
Total Aortic Regurgitation - no./total no. (%)
All Valve Sizes
None 22/174 (12.6%) 74/164 (45.1%) 86/163 (52.8%) 34/53 (64.2%)
Trace 34/174 (19.5%) 64/164 (39.0%) 58/163 (35.6%) 15/53 (28.3%)
Mild 42/174 (24.1%) 21/164 (12.8%) 15/163 (9.2%) 3/53 (5.7%)
Moderate 47/174 (27.0%) 4/164 (2.4%) 3/163 (1.8%) 1/53 (1.9%)
Severe 29/174 (16.7%) 1/164 (0.6%) 1/163 (0.6%) 0/53 (0.0%)
23 mm
None 21/124 (16.9%) 55/116 (47.4%) 63/115 (54.8%) 23/37 (62.2%)
Trace 29/124 (23.4%) 43/116 (37.1%) 39/115 (33.9%) 12/37 (32.4%)
Mild 32/124 (25.8%) 14/116 (12.1%) 10/115 (8.7%) 2/37 (5.4%)
Moderate 29/124 (23.4%) 3/116 (2.6%) 2/115 (1.7%) 0/37 (0.0%)
Severe 13/124 (10.5%) 1/116 (0.9%) 1/115 (0.9%) 0/37 (0.0%)
(N=195)
(N=195)
(N=195)
(N=96)
34
Page 89

(N=195)
(N=195)
(N=195)
(N=96)
26 mm
None 1/50 (2.0%) 19/48 (39.6%) 23/48 (47.9%) 11/16 (68.8%)
Trace 5/50 (10.0%) 21/48 (43.8%) 19/48 (39.6%) 3/16 (18.8%)
Mild 10/50 (20.0%) 7/48 (14.6%) 5/48 (10.4%) 1/16 (6.3%)
Moderate 18/50 (36.0%) 1/48 (2.1%) 1/48 (2.1%) 1/16 (6.3%)
Severe 16/50 (32.0%) 0/48 (0.0%) 0/48 (0.0%) 0/16 (0.0%)
Paravalvular Leak - no./total no. (%)
All Valve Sizes
None 121/162 (74.7%) 76/164 (46.3%) 91/162 (56.2%) 35/53 (66.0%)
Trace 18/162 (11.1%) 66/164 (40.2%) 56/162 (34.6%) 15/53 (28.3%)
Mild 12/162 (7.4%) 17/164 (10.4%) 11/162 (6.8%) 2/53 (3.8%)
Moderate 8/162 (4.9%) 4/164 (2.4%) 3/162 (1.9%) 1/53 (1.9%)
Severe 3/162 (1.9%) 1/164 (0.6%) 1/162 (0.6%) 0/53 (0.0%)
23 mm
None 92/121 (76.0%) 55/116 (47.4%) 68/114 (59.6%) 24/37 (64.9%)
Trace 15/121 (12.4%) 47/116 (40.5%) 36/114 (31.6%) 11/37 (29.7%)
Mild 10/121 (8.3%) 10/116 (8.6%) 7/114 (6.1%) 2/37 (5.4%)
Moderate 2/121 (1.7%) 3/116 (2.6%) 2/114 (1.8%) 0/37 (0.0%)
Severe 2/121 (1.7%) 1/116 (0.9%) 1/114 (0.9%) 0/37 (0.0%)
26 mm
None 29/41 (70.7%) 21/48 (43.8%) 23/48 (47.9%) 11/16 (68.8%)
Trace 3/41 (7.3%) 19/48 (39.6%) 20/48 (41.7%) 4/16 (25.0%)
Mild 2/41 (4.9%) 7/48 (14.6%) 4/48 (8.3%) 0/16 (0.0%)
Moderate 6/41 (14.6%) 1/48 (2.1%) 1/48 (2.1%) 1/16 (6.3%)
Severe 1/41 (2.4%) 0/48 (0.0%) 0/48 (0.0%) 0/16 (0.0%)
Baseline
Discharge
30 Days
1 Year
35
Page 90

Figure 18:
Pooled NR3/CANR3
NR3 Only
Pooled NR3/CANR3
NR3 Only
DVI
0.1
0.2
0.3
0.4
0.5
0.6
Baseline 30 Day 1 Year
0.26
0.36 0.38
0.29
0.41 0.44
0.27
0.37 0.39
Study Valve Size 23 26 All
Mean Gradient (mmHg)
0
10
20
30
40
50
60
70
Baseline 30 Day 1 Year
37.2
19.0 18.8
33.2
13.4 13.7
36.1
17.4 17.3
Study Valve Size
23 26 All
Doppler Velocity Index by Visit
Valve Implant Population
Figure 19:
Mean Gradient by Visit
Valve Implant Population
36
Page 91

Figure 20:
Pooled NR3/CANR3
NR3 Only
Peak Gradient (mmHg)
0
10
20
30
40
50
60
70
80
90
100
110
Baseline 30 Day 1 Year
66.9
35.4 35.2
60.1
26.2 26.7
65.0
32.7 32.8
Study Valve Size 23 26 All
None Trace Mild Moderate Severe
Percent
0
20
40
60
80
100
Study Valve Size23
26 All
Baseline 30 Day 1 Year Baseline 30 Day 1 Year Baseline 30 Day 1 Year
17%
13%
23%
10%
20%
26%
20%
24%
23%
36%
27%
10% 32% 17%
55%
48%
53%
34%
40%
36%
9%
10%
9%
62%
69%
64%
32%
19%
28%
5%
6%
6%
6%
Peak Gradient by Visit
Valve Implant Population
Figure 21:
Total Aortic Regurgitation by Visit
Valve Implant Population
37
Page 92

Figure 22:
None Trace Mild Moderate Severe
Percent
0
20
40
60
80
100
Study Valve Size23
26
All
Baseline 30 Day 1 Year Baseline 30 Day 1 Year Baseline 30 Day 1 Year
76%
71%
75%
12%
7%
11%
8%
5%
7%
15%
5%
60%
48%
56%
32%
42%
35%
6%
8%
7%
65%
69%
66%
30%
25%
28%
5% 6%
I II III
IV
Percent
0
20
40
60
80
100
Pooled NR3/CANR3 NR3 Only
Baseline 30 Day 6 Month 1 Year
5%
58%
38%
48%
41%
10%
66%
21%
13%
45%
39%
12%
4%
Paravalvular Leak by Visit
Valve Implant Population
Figure 23:
NYHA Class by Visit
Attempted Implant Population
38
Page 93

Figure 24:
Device Success
1
Rate
2
Success
115/187 (61.5%)
Factor 1: Unsuccessful access, delivery, deployment, or retrieval of delivery system
11/72 (15.3%)
Factor 3b: Moderate/ Severe Aortic Regurgitation
5/71 (7.0%)
Mean Score
0
10
20
30
40
50
60
70
80
90
100
Baseline 30 Day 1 Year
45.5
68.0
70.4
KCCQ Clinical Summary Score
Attempted Implant Population
Table 22:
Device Success and Reason for Device Failure
Valve Implant Population
Failure
Factor 2: Position - Too Aortic or Too Ventricular 2/72 (2.8%)
Factor 3a: mean gradient ≥ 20 mmHg or peak velocity ≥ 3 m/s
Factor 4: More than 1 valve implanted 3/72 (4.2%)
1
Device success was defined as successful vascular access, delivery and deployment and retrieval of delivery
system; correct positioning of the valve, intended performance (mean aortic valve gradient < 20 mmHg or peak
velocity < 3 m/s, without moderate or severe prosthetic valve AR), only one valve implanted. Each participant
who failed could experience a failure in more than one factor. If a patient failed one factor, the device was
considered a failure even if other factors were undetermined due to missing data.
2
The results are expressed as no. / total no. (%). The denominator for each factor was equal to the patients with
an overall failure and non-missing data for that factor.
72/187 (38.5%)
62/70 (88.6%)
39
Page 94

The PARTNER IIA Study Design
PIIA was a 1:1 randomized, controlled study independently powered to compare the results of TAVR
with the SAPIEN XT valve to traditional, open-heart aortic valve surgery (i.e., surgical aortic valve
replacement or SAVR). The SAPIEN XT valve was available in sizes 23 mm, 26 mm, and 29 mm.
Patients were enrolled from December 2011 to November 2013. The database reflected data collected
through February 1, 2016 and included 1,011 patients in the SAPIEN XT arm and 1,021 patients in the
SAVR arm at 57 investigational sites in the U.S. and Canada.
The study used an independent Data Safety Monitoring Board (DSMB) that was instructed to notify
Edwards Lifesciences of any safety or compliance issues and a Clinical Events Committee (CEC) that
was responsible for adjudicating endpoint related events reported during the trial. The CEC
adjudicated the events per definitions established a priori, which were primarily VARC-1 definitions
with the following exceptions:
• AKI was adjudicated with a modified VARC-1 definition in which the CEC identified the peak
creatinine within 30 days of the index procedure, 30 days to 1 year, and 1 year to 2 years to
determine if it met the definition of AKI.
• Aortic valve reintervention, hemolysis, and pericarditis were adjudicated per Protocol
definition.
• Rehospitalization for symptoms of AS and/or complications of the valve procedure were
adjudicated using the Protocol and VARC-1 as guidelines.
• Bleeding events were adjudicated irrespective of whether there was an identifiable, overt
source of bleeding and could be adjudicated based on transfusion or hemoglobin drop alone.
Also, an ECG core laboratory was used for independent analysis of rhythm, and an
echocardiographic core laboratory for independently analyzing all echocardiograms.
A. Accountability of the PMA Cohort
Table 23 presents patient accountability in the PIIA trial. The SAPIEN XT patients had either a
transfemoral (TF) or non-transfemoral (non-TF) access.
Table 23:
Patient Accountability
Intent to Treat
Populationa
As Treated
Populationb
Valve Implant
Populationc
SAPIEN XT 1011 994 974
Transfemoral 775 762 749
Non-Transfemoral 236 232 225
SAVR 1021 944 936
a. Intent to Treat (ITT): All randomized patients
b. As Treated (AT): All enrolled/randomized patients for whom the Index Procedure is started. Patients were
analyzed according to the valve used in the initial implant attempt.
c. Valve Implant (VI): All As Treated patients whose valve implant process is completed.
In the SAPIEN XT ITT population, 187 patients exited the study prior to the 2-year visit. Of the
remaining 824 patients who were due for the 2-year visit, 784 patients (95.1%) completed the 2-year
visit, and 40 patients (4.9%) missed the 2-year visit.
In the SAVR ITT population, 216 patients exited the study prior to the 2-year visit. Of the remaining
805 patients who were due for the 2-year visit, 710 patients (88.2%) completed the 2-year visit, and
95 patients (11.8%) missed the 2-year visit.
B. Study Population De mo graphics and Baseline Paramete rs
The demographics and baseline characteristics of the ITT population are presented in Table 24.
Among the SAPIEN XT population, 775 patients were implanted via the transfemoral (TF) access
route and 236 patients via the non-TF access route, including transapical (TA) or transaortic (TAo)
access.
40
Page 95

Table 24:
All
(N = 1011)
TF only
(N = 775)
Non-TF Only
(N = 236)
Age (Years)
81.5±6.7
81.8±6.7
80.6±6.6
81.7±6.7
548/1011
(54.2%)
560/1021
(54.8%)
Surgeons (STS) score
New York Heart Association (NYHA) class
(22.7%)
(23.9%)
782/1011
(77.3%)
776/1020
(76.1%)
700/1011
(69.2%)
679/1021
(66.5%)
Infarction
(18.3%)
(17.5%)
Previous Reintervention
Coronary Artery Bypass
Grafting
239/1011
(23.6%)
261/1021
(25.6%)
intervention
(27.1%)
(27.6%)
50/1021
(4.9%)
Cerebral vascular
accident
103/1011
(10.2%)
104/1021
(10.2%)
Peripheral vascular
disease
282/1011
(27.9%)
336/1021
(32.9%)
Chronic obstructive pulmonary disease
321/1011
(31.8%)
306/1021
(30.0%)
(3.1%)
313/1011
(31.0%)
359/1021
(35.2%)
118/1011
(11.7%)
123/1021
(12.0%)
(2.5%)
(1.5%)
1/1019
(0.1%)
Chest deformities that
procedure
Demographics and Baseline Characteristics
(ITT Population)
Demographics &
Characteristic
Male Sex
Society of Thoracic
I/II
III/IV
Coronary Artery Disease
Previous Myocardial
Percutaneous coronary
SAPIEN XT
SAVR
(N = 1021)
426/775 (55.0%) 122/236 (51.7%)
5.8±2.1 5.8±2.1 6.0±2.1 5.8±1.9
229/1011
174/775 (22.5%) 55/236 (23.3%)
244/1020
601/775 (77.5%) 181/236 (76.7%)
531/775 (68.5%) 169/236 (71.6%)
185/1011
137/775 (17.7%) 48/236 (20.3%)
179/1021
179/775 (23.1%) 60/236 (25.4%)
274/1011
202/775 (26.1%) 72/236 (30.5%)
282/1021
Prior aortic valvuloplasty 51/1011 (5.0%) 35/775 (4.5%) 16/236 (6.8%)
67/775 (8.6%) 36/236 (15.3%)
167/775 (21.5%) 115/236 (48.7%)
Any
228/775 (29.4%) 93/236 (39.4%)
Oxygen-dependent 34/1011 (3.4%) 20/775 (2.6%) 14/236 (5.9%)
Atrial fibrillation
Permanent pacemaker
245/775 (31.6%) 68/236 (28.8%)
91/775 (11.7%) 27/236 (11.4%)
Pulmonary hypertension 29/1011 (2.9%) 25/775 (3.2%) 4/236 (1.7%)
Frailty 12/1011 (1.2%) 11/775 (1.4%) 1/236 (0.4%)
Porcelain aorta 0/1011 (0.0%) 0/775 (0.0%) 0/236 (0.0%)
preclude an open chest
0/1011 (0.0%) 0/775 (0.0%) 0/236 (0.0%)
32/1021
25/1019
15/1019
0/1019
(0.0%)
41
Page 96

Table 24:
Demographics and Baseline Characteristics
All
(N = 1011)
TF only
(N = 775)
Non-TF Only
(N = 236)
5/1019
(0.5%)
Echocardiographic findings (VI Population)
Effective orifice area
(EOA) - cm2
Mean aortic valve
gradient - mmHg
mitral regurgitation
(18.2%)
Continuous measures – Mean ± SD; Categorical measures – n/Total no. (%)
(ITT Population)
SAPIEN XT (N = 1011)
SAVR (N = 1021)
Point
Estimate
Standard
Error
Point
Estimate
Standard
Error
All-cause
2 years
All-cause
at 2
years
Disabling
2 years
*
Events with missing or incomplete onset dates are excluded from the analysis.
†
are not included in the anal ysis.
(ITT Population)
Demographics &
SAPIEN XT
Characteristic
Cirrhosis 0/1011 (0.0%) 0/775 (0.0%) 0/236 (0.0%)
0.7±0.2 0.7±0.2 0.7±0.2 0.7±0.2
45.0±13.3 45.0±13.6 44.7±12.3 44.7±12.6
Moderate or severe
146/875 (16.7%) 116/677 (17.1%) 30/198 (15.2%)
C. Safety and Effectiveness Result
a. Primary Endpoint
The results of the composite primary endpoint of all-cause death or disabling (major) stroke at 2
years and each component are presented for the ITT population in Table 25 and Figures 25-27.
The K-M estimate of the composite event for SAPIEN XT was found to be non-inferior to that for
SAVR (19.3% vs. 21.1%; p=0.0014).
Table 25:
All-Cause Death or Disabling (Major) Stroke at 2 Years
SAVR
(N = 1021)
153/841
Event
death or
disabling
stroke at
death
stroke at
K-M estimates are provided at 2 years (day 730) and use the first event per patient. Events occurring after 730 days
No. of
Events
Patients
with
*
Event
229 192 774 19.3% 1.3% 235 202 695 21.1% 1.3%
166 166 798 16.7% 1.2% 170 170 719 18.0% 1.3%
63 59 774 6.2% 0.8% 65 61 695 6.4% 0.8%
No.
Patients
at Risk
K-M Estimate†
No. of
Events
Patients
with
*
Event
No.
Patients
at Risk
K-M Estimate†
42
Page 97

Figure 25:
All-Cause Death or Disabling (Major) Stroke through 2 Years
Figure 26:
provided to illustrate the variability only and should not be used to draw any statistical conclusion.
(ITT Population)
Note: The confidence intervals at 30 days and 12 months were calculated without multiplicity
adjustment. The adjusted confidence intervals could be wider than presented here. As such,
confidence intervals are provided to illustrate the variability only and should not be used to draw
any statistical conclusion.
All-Cause Death through 2 Ye ars
(ITT Population)
Note: The confidence intervals were calculated without multiplicity adjustment. The adjusted
confidence intervals could be wider than presented here. As such, confidence intervals are
43
Page 98

Figure 27:
Disabling (Maj or) Stroke through 2 Years
Table 26:
TF
(N = 775)
Non-TF
Point
Estimate
Standard
Error
Point
Estimate
Standard
Error
All-cause
2 years
at 2
year
Disabling
2 years
*
Events with missing or incomplete onset dates are excluded from the analysis.
†
730 days are not included in the analysis.
(ITT Population)
Note: The confidence intervals were calculated without multiplicity adjustment. The adjusted
confidence intervals could be wider than presented here. As such, confidence intervals are
provided to illustrate the variability only and should not be used to draw any statistical conclusion.
The results for the primary endpoint and its components for the SAPIEN XT ITT population by access
approach are presented in Table 26. The TF access had clinically lower all-cause death and disabling
(major) stroke rates than did the non-TF access.
All-Cause Death or Disabling (Major) Stroke to 2 Years by Access Approach
(SAPIEN XT ITT Population)
Event
death or
disabling
stroke at
All-cause
death
No. of
Events
Patients
with
*
Event
151 128 612 16.8% 1.4% 78 64 162 27.7% 3.0%
108 108 630 14.2% 1.3% 58 58 168 25.2% 2.9%
No.
Patients
at Risk
K-M Estimate†
No. of
Events*
Patients
with
Event
(N = 236)
No.
Patients
at Risk
K-M Estimate†
stroke at
Kaplan-Meier estimates are provided at 2 years (day 730) and use the first event per patient. Events occurring after
43 39 612 5.3% 0.8% 20 20 162 9.1% 1.9%
44
Page 99

b. Key Secondary Endpoints for Labeling
Table 27:
Summary Statistics*
Reference
SAPIEN XT
SAVR
on to next line
Change in 6MWT
distance from baseline to
Reject null hypothesis
NYHA class at 2 years
(ITT)
1.5±0.7
(737)
1.4±0.6
(649)
0.1
(0.0, 0.2)
6MWT distance at 2
203.2±132.4
209.8±153.5
-6.6
1.5±0.4
(567)
1.4±0.4
(488)
0.1
(0.09, 0.19)
*
Mean ± SD (n)
†
§
severe=4. It was treated as a continuous variable and compared using the t-test.
Table 28:
(AT/VI Population)
Summary Statistics*
Reference
SAPIEN XT
SAVR
Fail to reject null
distance from baseline to
only; AT)
Reject null hypothesis
of endpoints
NYHA at the 2-year visit
1.5±0.7
1.4±0.6
0.1
638.8 ±
619.5 ±
19.2
year visit (AT)
(615)
(513)
(-23.5, 10.3)
1.5±0.4
1.4±0.4
0.14
*
Mean ± SD (n)
†
§
severe=4. It was treated as a continuous variable and compared using the t-test.
The results for the six key secondary endpoints for labeling using the Hochberg’s step-up method
for multiple tests are presented for the ITT population in Table 27 and for the as- treated (AT)
population in Table 28. SAPIEN XT was found to be non-inferior to SAVR in NYHA class at 2
years, DAOH to 2 years, 6MWT distance at 2 years, and EOA at 2 years. The 6MWT distance at 2
years was superior to that at baseline in the SAPIEN XT patients.
Key Secondary Endpoints Comparisons Using the Hochberg Method
(ITT/VI Population)
Endpoint
Total AR at 2 years§ (VI)
2 years (SAPIEN XT
only; I TT)
1.2±1.0
(606)
14.5±128.7
(604)
0.5±0.7
(520)
NA NA 0.0057 0.025
Difference† p-value
0.8
(0.67, 0.86)
>0.9999 0.05
α
Statistical Inference
Fail to reject null
hypothesis and move
and conclude noninferiority for the rest
of endpoints
<0.0001
DAOH to 2 years (ITT)
years (ITT)
EOA at 2 years (VI)
637.5±203.2
(960)
(615)
619.0±223.1
(885)
(513)
18.6
(-1.0, 38.1)
(-23.5, 10.3)
<0.0001
<0.0001
<0.0001
Difference (95% CI)
Total AR was graded as: none=0, trace=1, mild and mild-moderate=2, moderate and moderate-severe=3, and
Key Secondary Endpoints Comparisons Using the Hochberg Method
Endpoint
Total AR at 2 years (VI)
1.2±1.0
(606)
0.5±0.7
(520)
Difference† p-value
(0.7, 0.9)
Change in 6MWT
2 years (SAPIEN XT
(AT)
DAOH to 2 years (AT)
6MWT distance at the 2-
EOA at 2 years (VI)
14.5±128.7
(604)
(737)
201.5 (958)
203.2±132.4
(567)
NA NA 0.0057 0.025
(649)
222.4 (883)
209.8±153.5
(488)
(0.0, 0.2)
(-0.2, 38.7)
-6.6
(0.09, 0.20)
Difference (95% CI)
Total AR was graded as: none=0, trace=1, mild and mild-moderate=2, moderate and moderate-severe=3, and
45
0.8
α
>0.9999 0.05
<0.0001
<0.0001
<0.0001
<0.0001
Statistical Inference
hypothesis and move
on to next line
and conclude noninferiority for the rest
Page 100

Adjunctive Secondary Endpoints
Table 29:
Relative Risk
SAVR
Composite event to 30 days
or discharge†
*
Imputed dates are used for events with incomplete onset dates.
stenosis; permanent pacemaker implantation; mitral valve injury or insufficiency; or renal insufficiency.
Table 30:
Events/Patients
Risk*
Events/Patients
Risk*
K-M Estimate
Error)
years†
*Events with missing or incomplete onset dates and those occurring before day 31 or after day 730 are excluded
stenosis; permanent pacemaker implantation; mitral valve injury or insufficiency; or renal insufficiency.
The results for the first adjunctive secondary composite endpoint of 14 pre-specified site-reported events
are presented in Tables 29 and 30.
Composite Endpoint of 14 Pre-specified Site-Reported Events to 30 Days or Discharge
(AT Population)
SAPIEN XT (N = 994) SAVR (N = 944)
Adverse Event
Events*
Patients with
Event
Events*
Patients with
Event
SAPIEN XT
versus
573 378/994 (38.0%) 714 493/944 (52.2%) 0.73
†
The composite event cons i sts of all stroke and TIA; myocardial infarction; vascular complications; life-threatening
bleeding; reoperation for cathe ter -based intervention for valve thrombosis, valve displacement, or other valve- or
procedure-related complicat io n; pericar diti s; hem oly si s; med iast init is; endocar ditis; aortic insufficiency; aortic
Composite Endpoint of 14 Pre-specified Site-Reported Events from Day 31 to 2 Years
(AT Population)
Adverse
Event
Composite
event from
day 31 to 2
SAPIEN XT (N = 994) SAVR (N = 944)
with Event/No. at
K-M Estimate
(Standard Error)
with Event/No. at
(Standard
428/284/594 31.0% (1.53%) 344/225/568 26.5% (1.52%) 1.17
Relative Risk
SAPIEN XT
versus
SAVR
from the analysis.
†
The composite event consi sts of all stroke and TIA; myocardial infarction; vascular complications; life-threatening
bleeding; reoperation for cathe ter -based intervention for valve thrombosis, valve displacement, or other valve- or
procedure-related complicat io n; per icar diti s; hem oly si s; med iast init is; endocar dit is; aortic insufficiency; aortic
46
 Loading...