

Page 1

WaveRIDER
Hardware & Software Users Guide
WaveRIDER
Wave Solder Machine Analyzer
A36-9283-00 Rev 2.1
Page 2

SINCE 1964
ECD
4287-B S.E. International Way
Milwaukie, Oregon 97222-8825
Telephone: (800) 323-4548
(503) 659-6100
FAX: (503) 659-4422
Technical Support: (800) 323-4548
Email: ecd@ecd.com
Internet: http://www.ecd.com
Copyright © 1996-2008 ECD. All Rights Reserved, Printed in U.S.A. Foreign and U.S. Products of ECD. are covered by Foreign and
U.S. patents or patents pending. No part of this Publication may be translated and/or reproduced or stored in a data retrieval system, or
transmitted in any form or by any means without the express written permission of ECD Information in this publication supersedes all
previously published material. Specification and price change privileges reserved.
The trapezoidal ECD logo M.O.L.E.(Multichannel Occurrent Logger Evaluator) and WaveRIDEare registered trademarks of
ECD Windows is a registered trademark of Microsoft Corporation.
The WaveRIDER product is covered by U.S. Patent No. 5767424
Page 3

WaveRIDER Users Guide
TABLE OF CONTENTS
Introduction .................................................................................................................. vi
y Terms used in this Manual.....................................................................................vii
y Fonts Used in this Manual.....................................................................................viii
y Computer Hardware Requirements.......................................................................viii
Operators Safety Information...................................................................................... ix
1.0 System Description................................................................................................. 1
1.1 Rider Description ................................................................................................. 2
1.2 Coupon Description .............................................................................................4
1.3 Software Description............................................................................................ 5
1.3.1 WR SPC Workbook Features...................................................................... 5
1.4 Standard WR SPC Worksheet functions.............................................................. 7
1.4.1 Worksheet tabs............................................................................................ 7
1.4.2 Selecting Worksheets.................................................................................. 7
1.4.3 Split-bar.......................................................................................................7
1.4.4 Worksheet Tab Scroll Arrows......................................................................7
1.4.5 Scrollbars..................................................................................................... 8
2.0 Setup........................................................................................................................9
2.1 Charging the Power Pack Battery........................................................................9
2.2 Software Installation........................................................................................... 11
2.2.1 Starting the Software................................................................................. 11
2.3 Communications Setup...................................................................................... 12
2.4 M.O.L.E. Installation........................................................................................... 16
3.0 Operation ............................................................................................................... 17
3.1 Data Collection................................................................................................... 17
3.2 Transferring Data............................................................................................... 22
3.3 Expert Matrix......................................................................................................23
3.4 Cleaning the Rider............................................................................................. 27
3.5 Storing the RIDER ............................................................................................. 28
WaveRIDER i
Page 4

4.0 Worksheet Descriptions ....................................................................................... 29
4.1 The Welcome Worksheet................................................................................... 29
4.1.1 Welcome Worksheet Menus and Toolbar..................................................30
4.1.2 Company/Report Name............................................................................. 31
4.2 WaveRIDER Data Worksheet............................................................................ 32
4.2.1 WaveRIDER Data Worksheet Menus and Toolbar Buttons.......................33
4.2.2 Interpreting the WaveRIDER Data Sheet .................................................. 34
4.2.3 Data Coloring and LSL / USL .................................................................... 35
4.3 Spreadsheet Worksheet .................................................................................... 36
4.3.1 Spreadsheet Menus and Toolbar Buttons ................................................. 37
4.3.2 Parameter Groups..................................................................................... 38
4.3.3 Parameter Labels......................................................................................40
4.3.4 Parameter Units......................................................................................... 40
4.3.5 Data Run Rows .........................................................................................41
4.3.6 Selected Run............................................................................................. 41
4.3.7 Filters.........................................................................................................42
4.3.8 Statistics.................................................................................................... 45
4.4 Profile Worksheet............................................................................................... 46
4.4.1 Profile Menus and Toolbar Buttons ...........................................................47
4.4.2 M.O.L.E. Status......................................................................................... 48
4.4.3 Tool Status Box.........................................................................................49
4.4.4 Magnify Map.............................................................................................. 50
4.4.5 The Data Table.......................................................................................... 51
4.4.6 Sensor Locations....................................................................................... 56
4.4.7 Channel Check Boxes............................................................................... 57
4.4.8 Status Bar..................................................................................................58
4.4.9 Data Tabs.................................................................................................. 60
4.4.10 The Data Graph....................................................................................... 68
4.5 Administration Worksheet.................................................................................. 76
4.5.1 Administration Menus and Toolbar Buttons............................................... 77
4.5.2 Spreadsheet Parameters........................................................................... 78
4.5.3 Parameter check boxes............................................................................. 78
4.5.4 Specification and Control Limit Cells ......................................................... 79
4.5.5 SPC Sheet Boxes...................................................................................... 83
4.6 Guide Worksheet............................................................................................... 88
4.7 SPC Worksheet ................................................................................................. 89
4.7.1 Menus & Toolbar....................................................................................... 90
4.7.2 X-Bar Chart................................................................................................ 91
4.7.3 R Chart...................................................................................................... 92
4.7.4 Statistics Box............................................................................................. 93
4.7.5 Renaming SPC Worksheets...................................................................... 94
ii WaveRIDER
Page 5

5.0 Menu and Tool Commands .................................................................................. 95
5.1 File Menu........................................................................................................... 95
5.1.1 New Workbook.......................................................................................... 95
5.1.2 Open Workbook......................................................................................... 97
5.1.3 Close Workbook........................................................................................ 97
5.1.4 Import ........................................................................................................ 98
5.1.5 Save Workbook.........................................................................................99
5.1.6 Save Workbook As.................................................................................... 99
5.1.7 Save As Text...........................................................................................100
5.1.8 Save as Text Archive............................................................................... 100
5.1.9 Load Text Archive.................................................................................... 101
5.1.10 Configuration......................................................................................... 102
5.1.11 Preferences...........................................................................................103
5.1.12 Page Setup............................................................................................ 111
5.1.13 Print Options.......................................................................................... 112
5.1.14 Page Header / Footer............................................................................ 113
5.1.15 Print Preview ......................................................................................... 114
5.1.16 Print....................................................................................................... 115
5.1.17 Report Setup ......................................................................................... 116
5.1.18 Print Report ........................................................................................... 116
5.1.19 Send to Mail Recipients......................................................................... 117
5.1.20 Recent Files 1, 2, 3, etc......................................................................... 118
5.1.21 Exit......................................................................................................... 118
5.1.22 Language............................................................................................... 118
5.2 Edit Menu......................................................................................................... 119
5.2.1 Undo........................................................................................................ 119
5.2.2 Redo........................................................................................................ 119
5.2.3 Copy........................................................................................................ 119
5.2.4 Paste ....................................................................................................... 119
5.2.5 Remove Row........................................................................................... 120
5.2.6 Hide Row................................................................................................. 120
5.3 View Menu....................................................................................................... 121
5.3.1 Zoom In ................................................................................................... 121
5.3.2 Zoom Out................................................................................................. 121
5.3.3 100% ....................................................................................................... 121
5.3.4 Data Table Tabs...................................................................................... 121
5.4 Format Menu.................................................................................................... 122
5.4.1 Bold ......................................................................................................... 122
5.4.2 Italic......................................................................................................... 122
5.4.3 Underline.................................................................................................122
5.4.4 Alignment (Left, Center, Right)................................................................ 122
5.5 Window Menu.................................................................................................. 123
5.5.1 Cascade .................................................................................................. 123
5.5.2 Tile........................................................................................................... 124
5.5.3 Open File................................................................................................. 124
WaveRIDER iii
Page 6

5.6 WaveRIDER Menu........................................................................................... 125
5.6.1 Configuration Wizard............................................................................... 125
5.6.2 Set M.O.L.E. Clock.................................................................................. 127
5.6.3 WaveRIDER Settings .............................................................................. 128
5.6.4 Read WaveRIDER Data..........................................................................129
5.7 Profile Menu ..................................................................................................... 130
5.7.1 Part.......................................................................................................... 130
5.7.2 Process.................................................................................................... 131
5.7.3 Scaling.....................................................................................................132
5.7.4 X-Axis Units............................................................................................. 133
5.7.5 Temp Ref Lines (Temperature Reference Lines) .................................... 134
5.7.6 Profile Colors........................................................................................... 135
5.8 Tools Menu...................................................................................................... 136
5.8.1 Magnify Tool............................................................................................ 136
5.8.2 Slope Tool ............................................................................................... 138
5.8.3 Peak Difference Tool............................................................................... 140
5.8.4 Overlay Tool............................................................................................141
5.8.5 3-D View.................................................................................................. 143
5.8.6 Measure Tool........................................................................................... 145
5.8.7 Notes Tool............................................................................................... 146
5.8.8 Erase Object(s)........................................................................................ 147
5.8.9 Erase All.................................................................................................. 147
5.9 Navigate Menu.................................................................................................148
5.10 Help Menu...................................................................................................... 149
5.10.1 Help....................................................................................................... 149
5.10.2 ECD on the Web.................................................................................... 149
5.10.3 About WaveRIDER................................................................................ 149
6.0 Service and Calibration ...................................................................................... 150
6.1 Service Troubleshooting .................................................................................. 150
6.1.1 RIDER Troubleshooting Steps................................................................. 151
6.2 RIDER Coupon Replacement..........................................................................152
6.3 Checking the Coupon Thermocouples............................................................. 153
6.4 How to Get Additional Help.............................................................................. 153
iv WaveRIDER
Page 7

APPENDIX A: Specifications.................................................................................... 154
APPENDIX B: Statistical Process Control (SPC) Background Information ......... 155
APPENDIX C: Measurement Definitions.................................................................. 161
APPENDIX D: WR SPC Parameter Definitions........................................................ 168
APPENDIX E: WaveRIDER Accuracy and the Influencing Factors....................... 181
APPENDIX F: Pull-Down Menus & Toolbar Buttons............................................... 188
APPENDIX G: WaveRIDER Accessories ................................................................. 191
WaveRIDER v
Page 8

Introduction
This User’s Guide explains how to use ECD’s (Electronic Controls Design Inc.)
WaveRIDER Wave Solder machine analyzer.
You do not need to be a computer expert to use this manual or the WaveRIDER
software.
The manual assumes you are familiar with Microsoft Windows.
The hardware portions of this manual are written to reflect SuperM.O.L.E. Gold
firmware versions 9.08 and higher. The software portions reflect versions 5.22
and higher.
vi WaveRIDER
Page 9

y Terms used in this Manual
ECD. introduced the original M.O.L.E. (Multichannel Occurrent Logger Evaluator) in
1986. Over the years ECD has produced several models of the M.O.L.E. for use in a
wide variety of applications. In this manual, we may refer to the SuperM.O.L.E. Gold
data recording device as the M.O.L.E..
Informs the user that the note includes important information.
Informs the user that the note includes a handy tip.
The following statements describe special terms that will be used in this manual.
Hardware Terms:
Informs the user that the note identifies conditions or practices that
could result in damage to the equipment.
Informs the user that the note identifies conditions or practices that
could result in personal injury or damage to property other than the
equipment.
WARNING – Surfaces may be Hot!
SuperM.O.L.E. Gold, may be referred as the M.O.L.E..
WaveRIDER Ready refers to the M.O.L.E. being configured to collect wave solder
data when used with the WaveRIDER kit.
Thermocouple, may be referred to as T/C.
Software Terms:
WaveRIDER SPC software may be referred to as WR SPC.
Workbook, contains all of the worksheets and the uploaded data set saved with file
extension (.MWR).
Worksheet, the individual pages or sheets in the workbook file.
Data Set, multiple data runs uploaded into the workbook file.
Data Run / Experiment, the data uploaded from the M.O.L.E..
WaveRIDER vii
Page 10

y Fonts Used in this Manual
This manual uses a special font to indicate terms or words that can be found directly on
the PC display.
For Example: Select the Open Workbook command from the File menu to open a new
workbook file. This font indicates the words Open Workbook and File are actually found
in the PC display.
y Computer Hardware Requirements
CPU, RAM, Hardware: 300mhz processor or equivalent
128 megabytes of RAM (minimum).
50 megabytes of free disk space.
Operating System: Windows XP & 2000.
Disk Drive: CD Rom drive.
Mouse: Windows compatible mouse.
Communication Port: Serial Port, USB (with port replicator).
Video: Color VGA or better video card and appropriate video
monitor. (SVGA is highly recommended)
It is recommended that the minimum computer display area be set to 800 x 600.
For best performance set the display to 1024 X 768 (Refer to your Microsoft
Windows documentation for details).
Printer: Color printer is recommended.
viii WaveRIDER
Page 11

Operators Safety Information
The safety information in this summary is for the benefit of operating personnel.
Warnings and Cautions will also be found throughout the manual where they apply.
Hardware changes or modifications to the components are not expressly
approved by ECD could void the product’s warranty.
For protection of the kit components, observe the following:
Do not subject the components to sharp impacts.
Do not expose the components to corrosive environments.
Do not expose the RIDER, above the specified maximum temperature.
The warranty will not cover damage caused by neglect or abuse of this product.
To maintain the safety features incorporated in this product, operation must be in
strict compliance with the requirements specified herein.
WaveRIDER ix
Page 12

1.0 System Description
The main WaveRIDER hardware component is called the RIDER. The RIDER is a
solder machine data collection pallet with ECD’s SuperM.O.L.E. Gold at the heart of it.
When the M.O.L.E. is connected to the RIDER it takes on a special WaveRIDER
configuration for proper data interpretation. While riding on the solder machine,
conveyor data from the solder machine is collected by the RIDER and stored in the
internal memory of the M.O.L.E. After the RIDER has completed the data collection, it is
then connected to a PC and the data is uploaded into the WR SPC software for
analysis.
RIDER
PC
1
2
COUPON TEMP.
SENSORS
DISTANCE/TIME SENSORS
3
4
5
6
B
A
C
M.O.L.E.
Figure 1- 1: System Block Diagram
WaveRIDER 1
Page 13

1.1 Rider Description
This section covers brief descriptions for the external and internal features of
WaveRIDER.
External features:
Barrier box: This is the thermal protective barrier for the M.O.L.E..
Barrier locking latch: This latch secures the cover of the barrier to prevent it
from opening.
Coupon: Sensors that record temperature data from the solder machine. (Refer
to section 1.2 Coupon Description for more information).
BARRIER BOX
COUPON
COVER LATCH
Figure 1- 2: WaveRIDER
2 WaveRIDER
Page 14

Internal Features:
Connector bridge: This is where the M.O.L.E. plugs into the WaveRIDER so it
can collect data from the RIDER sensors.
Extractor handle: This handle assists in the removal of the M.O.L.E..
Configuration plug: This plug configures the M.O.L.E. to operate in
“WaveRIDER” mode.
CONNECTOR BRIDGE
EXTRACTOR HANDLE
CONFIGURATION PLUG
Figure 1- 3: WaveRIDER Internal Features
WaveRIDER 3
Page 15

1.2 Coupon Description
Temperature data about a solder machine is taken from three type "K" thermocouples
(T/C) attached to the Coupon. Their purpose is to sense the impact of a solder machine
setup on circuit board "like" material, as opposed to the RIDER pallet material.
THREE TYPE “K”
THERMOCOUPLES
“TOP FOIL” T/C
COUPON
“SOLDER” T/C
“BOTTOM FOIL” T/C
Figure 1- 4: Coupon Description
The "Bottom Foil" T/C is inserted into the coupon as close to the bottom surface as
possible without breaking through. The "Solder" T/C is exposed below the bottom
surface of the coupon so it will contact the solder. The "Top Foil" T/C is inserted into the
coupon near the top surface.
“BOTTOM FOIL”
THERMOCOUPLE
“SOLDER”
THERMOCOUPLE
“TOP FOIL”
THERMOCOUPLE
Figure 1- 5: Coupon Cross section
4 WaveRIDER
Page 16

1.3 Software Description
This section presents an overview of a workbook management window. When the
software is started, it will automatically load the previously saved workbook file.
The first time the software is started a sample file (i.e. WRSample.mwr) will be
opened for users to familiarize themselves with the program. It is recommended
when the user starts collecting process data, a new or existing workbook should
be used.
1.3.1 WR SPC Workbook Features
The workbook has several features as described in the following section.
TITLE BAR
MENUS
TOOLBAR
STATUS BAR
WORKSHEET TAB
SCROLL ARROWS
WORKSHEET TABS
SPLIT BAR
Figure 1- 6: Workbook Features
VERTICAL SCROLL BAR
HORIZONTAL
SCROLL BAR
WaveRIDER 5
Page 17

Title Bar: This bar contains the program name, version, and the active workbook
file name.
Menus: These menus contain the commands and tools for each worksheet.
Each worksheet may contain different commands that supply specific support for
each worksheet. Individual worksheet menus are described in detail in their
specified sections of this manual.
Toolbar: The Toolbar has buttons to serve as shortcuts to the menu commands.
Individual worksheet toolbar buttons are described in detail in their specified
sections of this manual. Each worksheet may have different items on the toolbar
because of the different features offered by each worksheet.
Worksheet Tabs: These tabs are used to gain access to each worksheet.
Tab Scroll Arrows: These arrows are used to view other worksheet tabs if the
Horizontal scroll bar is covering them.
Split-bar: This bar slides the Horizontal Scroll bar to the left or right so all or part
of the worksheet tabs can be viewed.
Status Bar: This bar on the bottom of the worksheet display, shows the available
Help information, mouse pointer X-Y position, current date and time.
Horizontal Scroll Bar: This bar scrolls the worksheet display horizontally left
and right.
Vertical Scroll Bar: This bar scrolls the worksheet display vertically up and
down.
6 WaveRIDER
Page 18

1.4 Standard WR SPC Worksheet functions
1.4.1 Worksheet tabs
There are six standard worksheets and up to nine optional SPC sheets. These tabs are
located on the bottom left of the display.
Figure 1- 7: Worksheet Tabs
1.4.2 Selecting Worksheets
To a view worksheet, use the mouse pointer to click on a worksheet tab. The worksheet
tab will then become highlighted, and the worksheet will now be visible.
The keyboard does not allow access to the worksheets. The only way to select
the worksheet is by using the mouse pointer.
Figure 1- 8: Selecting a Worksheet
1.4.3 Split-bar
The Split-bar on the tab bar lets the user slide the Horizontal scroll bar to the left or
right, so all of the worksheet tabs can be viewed. This feature is located on the left edge
of the Horizontal scroll bar.
1.4.4 Worksheet Tab Scroll Arrows
Worksheet tabs may be hidden behind the horizontal scroll bar. To view them, the user
can either use the Tab Scroll Arrows located on the left of the worksheet tabs, or use
the Split-bar.
WaveRIDER 7
Page 19

1.4.5 Scrollbars
The worksheets have both Horizontal and Vertical screen scroll bars so the non-visible
areas of the worksheet can be scrolled into view. The Horizontal scroll bar is located in
the lower right corner and can be scrolled left or right by pressing the left or right arrows
located on each end of the scroll bar. The user may also scroll the display by sliding the
center scroll bar left or right. The Vertical scroll bar located on the right side of the
screen has the same features as the Horizontal scrollbar except it scrolls the worksheet
display up and down.
CLICK TO
CLICK HERE TO SCROLL WORKSHEET TABS
CLICK AND DRAG TO VIEW
WORKSHEET TABS
CLICK AND DRAG TO SLIDE
THE VIEW HORIZONTALLY
Figure 1- 9: Worksheet Options
SINGLE STEP
WORKSHEET
VIEW LEFT OR
RIGHT
It is recommended that the minimum PC display area be set to 800 x 600. For best
performance set the display to 1024 X 768 (Refer to your Microsoft Windows
documentation for details).
8 WaveRIDER
Page 20
2.0 Setup
This section provides the necessary information to setup M.O.L.E. components for data
collection.
2.1 Charging the Power Pack Battery
Because the M.O.L.E. is powered by a rechargeable Power Pack battery, it is important
that it is charged and operating properly prior to performing every experiment. A spare
Power Pack battery may be ordered so the one battery is charging while the other one
is being used.
Charging:
1) Remove the Power Pack battery by separating from the unit.
Figure 2- 1: Removing the Power Pack Battery
WaveRIDER 9
Page 21

2) Plug the transformer end of the charger into a (60Hz 120VAC, in North America)
or (230VAC) wall outlet and the connector end into the Power Pack.
POWER PACK BATTERY
POWER PACK CHARGER
Figure 2- 2: Power Pack Charger
A completely discharged Power Pack takes about 14 hours to be fully charged.
3) When the charging cycle is complete, connect the Power Pack to the M.O.L.E..
When the Power Pack is first connected, the LED will flash once to indicate that
the M.O.L.E. is ready to collect data. If the LED flashes more than once, a
complete reset has occurred and the M.O.L.E. will need to be re-configured.
(Refer to the software manual for detailed configuration information).
The Power Pack battery can be charged continously whenever the M.O.L.E. is not
being used, however, if the M.O.L.E. is going to sit idle for five days or more, you
may want to remove it from the charger.
10 WaveRIDER
Page 22

2.2 Software Installation
1) Insert the CD in the drive.
2) Select Run from the Start menu.
3) Select the Browse command button and navigate to the software CD. Double-
click the installation .EXE file.
4) Select the OK command button to start the installation.
Figure 2- 3: Run Dialog Box
5) Closely follow the setup instructions provided with the software.
2.2.1 Starting the Software
Prior to starting, click the README icon from the WaveRIDER sub-menu in the
documentation program menu to read the latest release notes
After the software is installed, start the software program by double-clicking the
WaveRIDER SPC icon from the desktop.
Figure 2- 4: Program Icon
Once the software installation is complete, it is important to start the software
and configure the software to communicate with the M.O.L.E. (refer to section 2.3
Communications Setup).
WaveRIDER 11
Page 23

2.3 Communications Setup
1) Locate the PC Interface cable and plug the 9-pin connector into a PC COM port
and the other end into the M.O.L.E. Data Port.
If no Serial port exists, use the included USB adaptor to connect the interface
cable to the computer.
COMPUTER
REAR PANEL
RS232 COM PORT
PC INTERFACE CABLE
M.O.L.E.
DATA PORT
Figure 2- 5: PC to M.O.L.E. Connection
2) After the Computer interface cable is connected to a computer and Station, the
Communication (COM) port must be configured in the software to match the
same COM port as the oven computer so they can communicate.
12 WaveRIDER
Page 24

3) Start the software program by either double-clicking the WaveRIDER SPC icon
A
or selecting it from the program sub-menu.
Figure 2- 6: Program Icon
4) Once the software is running, select the Admin worksheet tab.
DMIN WORKSHEET TAB
Figure 2- 7: Admin Worksheet
WaveRIDER 13
Page 25

5) Select the Configuration command from the File menu on the Admin worksheet
and the Configuration dialog box appears.
CONFIGURATION
COMMAND
Figure 2- 8: Configuration Command
14 WaveRIDER
Page 26

6) Click the Auto command button to have the software automatically find the COM
port the M.O.L.E. is connected. If the M.O.L.E. is not detected, there is a
communication problem (Refer to section 6.0 Service and Calibration for help).
Figure 2- 9: Port Configuration Dialog Box
7) Click the OK command button to finish.
WaveRIDER 15
Page 27

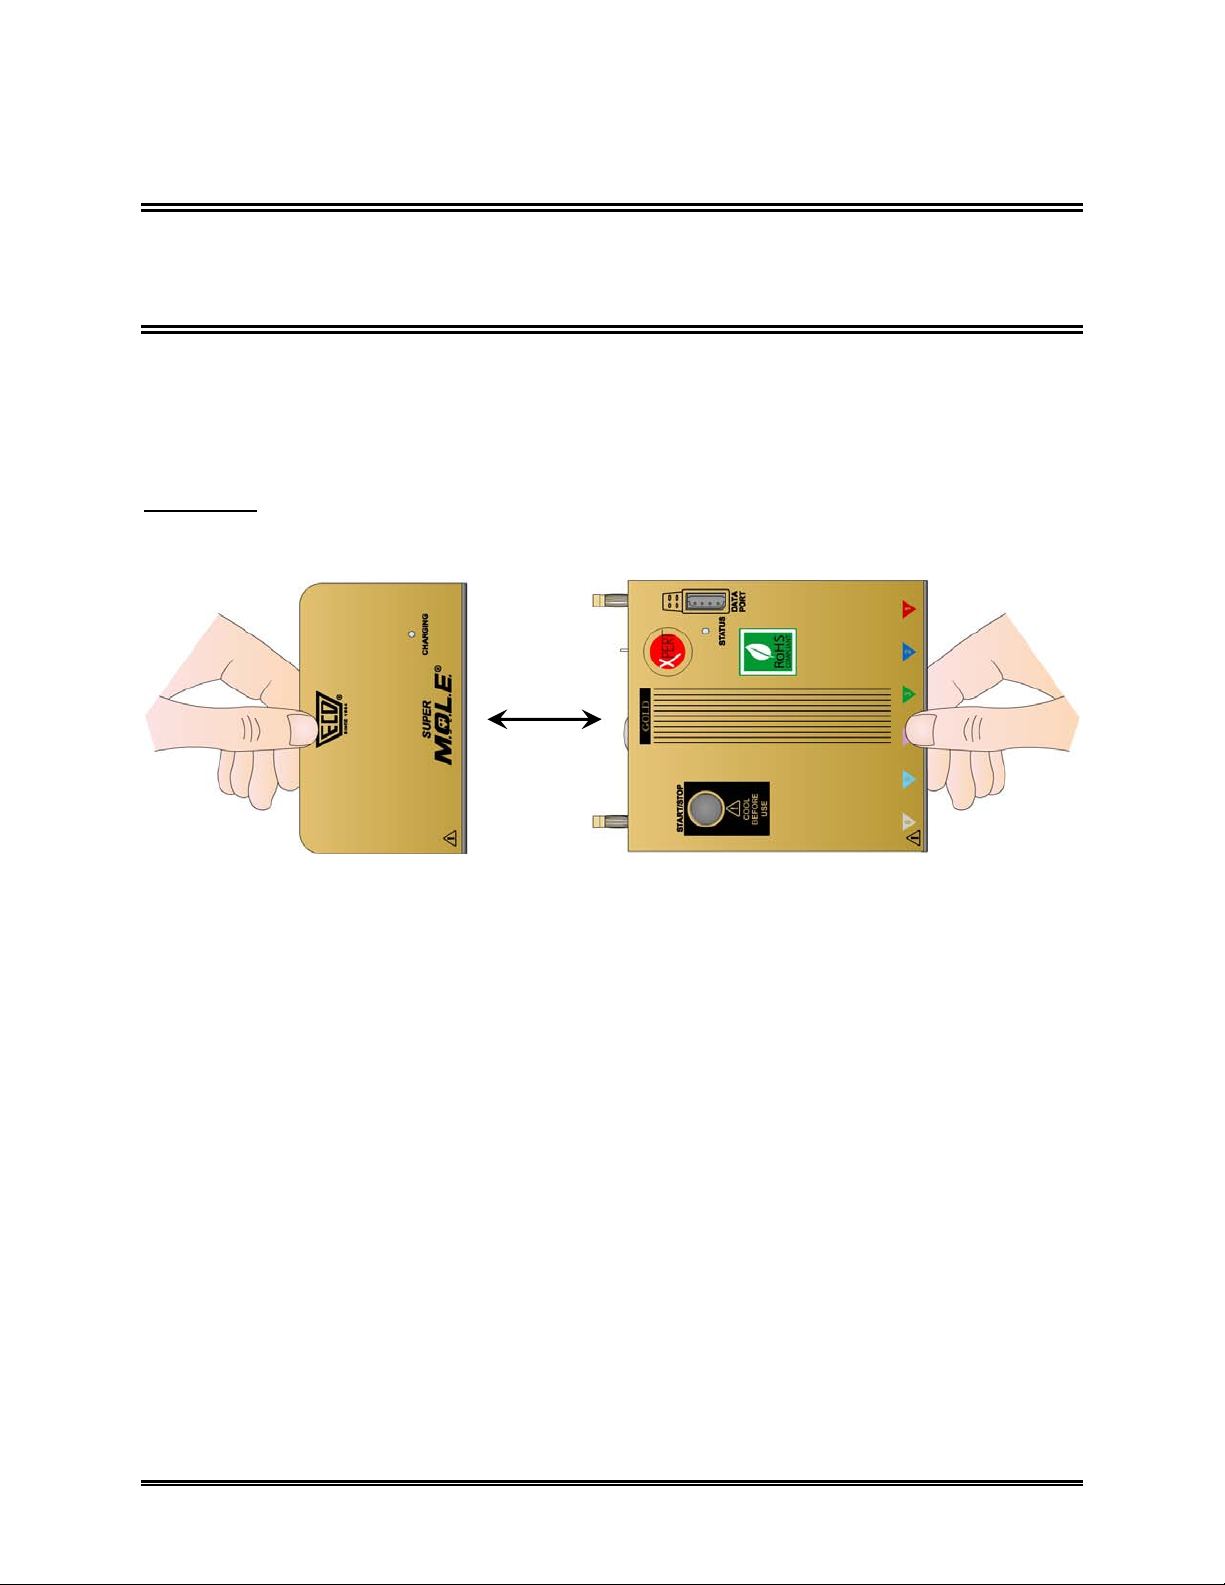
2.4 M.O.L.E. Installation
When inserting the M.O.L.E. into the WaveRIDER, make sure it is properly connected to
the RIDER thermocouple bridge and the configuration plug is secure.
CONNECTOR BRIDGE
EXTRACTOR HANDLE
M.O.L.E.
CONFIGURATION PLUG
Figure 2- 10: M.O.L.E. Installation
To remove, pull the extractor handle up and slide the M.O.L.E. away from the connector
bridge.
16 WaveRIDER
Page 28

3.0 Operation
The following section will guide the user through a typical data collection process. These
steps may vary depending on the process your company uses.
Prior to data collection, the M.O.L.E. must be “WaveRIDER Ready” as indicated
by a “WaveRIDER Ready” or “Xpert” sticker on the front of the M.O.L.E..
3.1 Data Collection
1) To start collecting data, the width of the conveyor must be set to match the width
of the RIDER.
2) Set the solder wave, pre-heat temperatures and conveyor speed, as a common
product would be processed.
If the Wave solder machine has an in-line conveyor washer, it must be turned
“OFF” or the RIDER must be removed before it reaches the washer. Washing the
RIDER with the M.O.L.E. installed may cause damage.
WaveRIDER 17
Page 29

3) Open the barrier box and make sure the configuration plug is in place and the
M.O.L.E. is connected to the Connector Bridge.
4) Press the start/stop button once to start the M.O.L.E.. When the M.O.L.E. turns
“ON” the activity light will flash and then illuminate and stay constant for the
duration of the run.
5) Close the barrier box cover and latch securely.
Figure 3- 1: Starting the M.O.L.E.
18 WaveRIDER
Page 30

6) Place the RIDER on to the Wave solder machine conveyor. Make sure the
A
RIDER is being fed into the machine in the proper direction. There are two
arrows on the RIDER barrier that indicates the proper direction. If a manual feed
wave solder machine is being used, hold the RIDER until the conveyor fingers
have completely grabbed the RIDER.
CONVEYOR
DIRECTION
RROW
Figure 3- 2: Proper RIDER Loading
WaveRIDER 19
Page 31

7) Retrieve the RIDER when it has traveled completely through the wave solder
machine. The bottom of the RIDER will be HOT so using protective gloves,
retrieve the RIDER from the conveyor. The best way to handle the RIDER when
retrieving from the solder machine is to place one hand under the RIDER and
use the other hand to grab the barrier box cover.
8) Now that the data collection is complete, it is important to open the barrier box
cover to prevent the internal temperature of the M.O.L.E. to rise above operating
temperature specification. To turn the M.O.L.E. “OFF”, press and HOLD the
Start/Stop button until the M.O.L.E. indicator light turns off, then release the
button.
9) Remove the M.O.L.E. from the barrier by removing the configuration plug and
pulling the extractor handle up. Allow the RIDER and M.O.L.E. cool to room
temperature before collecting data again.
EXTRACTOR HANDLE
M.O.L.E.
CONFIGURATION PLUG
Figure 3- 3: Removing the M.O.L.E.
20 WaveRIDER
Page 32

Data Collection Tips:
When turning the WaveRIDER “OFF” after the data collection process is
complete, do not release the button until the light goes off. Pressing the
Start/Stop button briefly will restart the data collection process and erase all the
data in memory.
The WaveRIDER continues to capture data until its memory is full or until it is
turned “OFF". It is recommended to turn RIDER “ON” after it is placed on the
wave solder machine conveyor, then turn it “OFF” as soon as possible after it
exits the solder machine.
If the production process uses pallets, the WaveRIDER sensors may not come in
contact with the solder wave. If this condition occurs, try the following options:
a) Install the RIDER into one of the pallets, which can adjust to fit the RIDER.
b) Raise the solder wave(s) height. (This does not represent actual machine use so
this option should be avoided).
WaveRIDER 21
Page 33

3.2 Transferring Data
When the data collection process is complete, data can then be analyzed using the WR
SPC software.
To read WaveRIDER data:
1) Connect the M.O.L.E. to the PC (refer to section 2.3 Communications Setup for
more information).
2) Start the software and select the Read WaveRIDER Data command from the
WaveRIDER menu. A status bar dialog box appears indicating that data retrieval
from the M.O.L.E. has begun.
Figure 3- 4: Read WaveRIDER Dialog Box
Once data transfer is complete, the dialog box will disappear and will return to the
current worksheet.
If the WaveRIDER has not collected enough data to create a complete profile a
message box appears.
Figure 3- 5: Communication Error Dialog box
22 WaveRIDER
Page 34

3.3 Expert Matrix
If the WaveRIDER has detected a problem during the data collection process, the
Expert Matrix is designed to guide the Operator (Expert) to trouble-shoot potential
causes that may have been discovered while interpreting the data printout. The kit
includes an Expert Matrix to be used in conjunction with the WaveRIDER Data
worksheet in the software to help diagnose and correct soldering problems caused by
solder machine setup or malfunction.
There are three main areas on the expert guide:
Problem (1): This column is used to indicate the wave solder machine problem.
Potential Cause (2): This is a list of potential machine causes.
WaveRIDER Parameter (3): This column is a list of information the WaveRIDER
supplies on the printout that correlates to the potential
cause.
The numbers assigned to the Potential Causes are on a scale of 1-3. (1) Low impact on
that particular cause and (3) would mean that it has a High impact.
WaveRIDER 23
Page 35

WaveRIDER Parameter (3) Problem (1)
A36-9283-06 Rev 1.2
Solder Wave Parallelism
Solder Wave Immersion Depth
Solder Wave Contact Lengths (A, B, C)
Solder Wave Dwell Times (A, B, C)
Solder Wave Temp
Delta Temp at Solder Wave
Chip Wave Parallelism
Chip Wave Immersion Depth
Chip Wave Contact Lengths (A, B, C)
Chip Wave Dwell Times (A, B, C)
Chip Wave Temp
Delta Temp at Chip Wave
Conveyor Speed
Maximum Preheat Slope
Minimum Preheat Temperature
Maximum Preheat Temp.
Potential Cause (2)
1
1
2
3
312
1
333
333
333
3
233
2.0 inches
< 0.3 sec
0.062
2
2
3
3 sec
3
1
1
1
495°F
100°F
2
3
333
333
333
2
2
3
.062 inches
< 0.3 sec
1
1
1
0.5 inches
2
2
3
3
3
2
1 sec
1
3
1
1
1
495°F
N/A
3
Conveyor speed too fast….Reduces dwell time in wave and forces preheat t o be to high
2
3
Preheat temp low….Solder pads not within 100°F of solder wave temperature
3
Conveyor speed too low….increases dwell time in solder wave
Carrier bent or damaged….Board must run parallel (flat ) over wave
Conveyor fingers bent….Board may not b e parallel over solder wave
Vibrator, 2nd wave OFF….Solder is not evenly distributed
Flux applied is insufficient….Spotty application or weak activity flux
Rails not parallel (flat) over nozzles….One side of board deeper in solder wave than the other
Wave or nozzles not level….Must be parallel to conveyor
Wave temperature too high….Solder and components are getting cooked
Conveyor width too tight….May warp board up or down while in wave
2
3
Preheat too high….Heating slope is too steep
Assembly too heavy….Weight or components bending board
Board too wide….Wide boards lack strength to support their weight
3
Conveyor jerky or vibrating….Disturbs solder joints whil e cool ing
Flux not uniform across bottom of board….Spotty application of flux
3
3
Preheat slope too steep….Heats components faster than recommended
Chip wave OFF….Solder is not evenly distribut ed
Chip wave activity too low….Solder is not evenly distributed
Wave height/exit incorrectly set….Exit speed of solder should match conveyor speed
Wave solder splash….Too active wave splashes solder on exit
3
Assembly removed too early….Solder not hardened before distributed
Carrier too tight….May warp board up or down while in wave
Conveyor too low….Boards below wave
Chip nozzle clogged….Solder is not evenly distributed
Vibrator, 2nd wave too low
Wave height too high….Wave height greater than thickness of board
Flux air knife too strong….Blows flux off board
Board not run in best direction….Component shadowing
Flux activator low….Low flux density
Flux activity too low….Flux not aggressive enough
2
3
Cooling rate too slow….Solder not hardened bef ore distributed
Dross recirculating from pot to wave….Excessive dross build up
Pallet center support missing or poor
Vibrator, 2nd wave too high….Causes splashing of liquid solder
Chip wave lower in spots….Solder is not evenly distributed
Air knife after wave set incorrectly….Air knife not effectively blowing off excess solder
Flux liquid in holes….Flux density too high or too much flux applied to board
Room Temp
5°F/Sec
4 ft/Min
225°F
Cracked Components
Solder Balls on Assembly
3
3
3
3
2
3
3
2
2
1
Cold Solder Joints
Grainy or Disturbed Joints
Solder Wave Over Flooding Board
Unfiltered Via Holes
Solder Bridges
Solder Skips
3
331
3
3
3
2
3
233
222
3
3
1
2
122
112
2
3
1
2
3
3
3
3
3
3
3
3
3
3
3
3
3
1
1
2
1
1
1
1
1
1
2 = Moderate Impact
3 = High Impact
1 = Low Impact
Typical Values
24 WaveRIDER
Page 36

Interpreting the Expert Guide:
Example problem: Use the troubleshooting Expert’s Guide shown below.
PROBLEM (1)
In the example, Solder Bridges is the problem that has been detected.
 The next step is, follow the row to the right. Now determine the potential cause that
best fits the problem. In the columns, there are impact numbers rated 1,2 or 3.
These impact numbers help the user to decide which potential cause is most
important to the problem. There is a legend on the Expert Guide, 3 = High Impact, 2
= Moderate Impact, and 1 = Low Impact. Now read and sort out the potential
causes that best fit the problem. In the example, the solder bridges row has several
columns with impact numbers. All the probable causes should be read and the
highest potential cause that was selected is in the next step.
POTENTIAL CAUSE (2)
Conveyor speed to slow…….Increases dwell time in solder wave.
 Once the potential cause has been determined, continue following the column down
to the rows with impact numbers.
If there are no impact numbers in the WaveRIDER parameter rows, the
WaveRIDER cannot assist the user in this area.
 Now read all the WaveRIDER parameters that have impact numbers. Once the
problem WaveRIDER parameter has been determined, correct adjustments can be
made. In the example, there are several impact numbers and the one that has been
selected is in the next step.
WaveRIDER® PARAMETER (3)
It is determined that the Conveyor Speed best indicates the likely cause and the
proper adjustments should be made.
WaveRIDER 25
Page 37

WaveRIDER Parameter (3 ) Problem (1)
A36-9283-06 Rev 1.2
Solder Wave Contact Lengths (A, B, C)
Solder Wave Dwell Times (A, B, C)
Chip Wave Contact Lengths (A, B, C)
Chip Wave Dwell Times (A, B, C)
Conveyor Speed
Potential Cause (2)
Solder Bridges
Conveyor speed too fast….Reduces dwell time in wave and forces preheat to be to high
1
2
1
2
Preheat temp low….Solder pads not within 100°F of solder wave tempe rature
3
Conveyor speed too low….increases dwell time in solder wave
Carrier bent or damaged….Board must run parallel ( flat) over wave
Conveyor fingers be nt….Board may not be parallel over solder wave
Flux applied is insufficient….Spott y application or weak activity flux
Rails not parallel (fl at ) ov e r noz zles….One side of board deeper in s ol der wav e th an th e ot her
Wave or nozzles not level….Must be parallel to conveyor
Wave height/exit inc or rec t l y s et … . E x i t s pee d of s ol der s hou ld mat ch conveyor speed
Board not run in best direction….Component shadowing
Dross recirculating from pot to wave….Excessive dross build up
3
3
3
3
2
2
2
1
3
1
1
1
2 = Moderate Impact
3 = High Impact
1 = Low Impact
< 0.3 sec
0.062
2.0 inches
495°F
100°F
3 sec
Typical Values
Air knife after wave set incorrectly….Air knife not effectively blowing off excess solder
495°F
N/A
5°F/Sec
4 ft/Min
Room Temp
225°F
.062 inches
0.5 inches
< 0.3 sec
1 sec
Figure 3- 6: Troubleshooting Process
26 WaveRIDER
Page 38

3.4 Cleaning the Rider
After completing the data collection process, cleaning the RIDER is very important
because some types of flux tend to build up on the RIDER very quickly. The following
information will discuss various cleaning machines and methods used to clean the
RIDER, and how to get it ready for the data run.
The M.O.L.E. must be removed before the RIDER is cleaned because it may be
damaged or destroyed by water or solvents.
1) Turn the locking latch and the raise barrier box cover until it comes to a rest.
Remove the configuration plug, and pull the extractor handle to remove the
M.O.L.E..
p
o
n
Figure 3- 7: SuperM.O.L.E. Gold Removal
q
2) Using a brass wire brush with fine bristles, clean the contact sensors on the
bottom of the RIDER pallet. When cleaning the sensors, use enough force to get
them cleaned and free from debris but not too much that they will be damaged.
3) Once the M.O.L.E. is removed, make sure that the configuration plug is tucked
under the cover while it is closed and rotate the locking latch to secure.
4) Open the barrier box cover allowing inside completely dry. Once the RIDER is
dry and insert the M.O.L.E. into the RIDER.
WaveRIDER 27
Page 39

3.5 Storing the RIDER
The operator has several options when deciding how to store the RIDER. Deciding
where and how to store the RIDER will depend on how the work area is set up. The
RIDER has two holes on the left and right side so the operator can hang the RIDER in a
place that is out of the way of normal production flow. If there is not an available area to
hang the RIDER, put it back into the packaging case.
If the RIDER is not going to be used for a long period of time, the Power pack
battery may lose its charge and may need to be recharged.
Figure 3- 8: Proper RIDER Storage
STORAGE
HOLES
28 WaveRIDER
Page 40

4.0 Worksheet Descriptions
The following sections offer brief explanations for the worksheet functions, and how they
benefit the user. Refer to section 5.0 Menu and Tool Commands for information on the
menu commands.
4.1 The Welcome Worksheet
The Welcome worksheet is the introductory worksheet. This worksheet contains a
WaveRIDER introductory illustration and a text box for entering a company or workbook
name.
Welcome worksheet features:
Menus and Toolbar
Company/Report Name Text Box
MENUS
TOOLBAR
COMPANY NAME TEXT BOX
Figure 4- 1: Welcome Worksheet
WaveRIDER 29
Page 41

4.1.1 Welcome Worksheet Menus and Toolbar
Menus: File, View, WaveRIDER, Navigate, and Help.
Toolbar Buttons: Print, Zoom In, Zoom Out, 100%, Read WaveRIDER Data,
and About.
Figure 4- 2: Welcome Worksheet Menus and Toolbar Buttons
30 WaveRIDER
Page 42

4.1.2 Company/Report Name
The text box located on the bottom half of the Welcome worksheet allows the user enter
a company or report name.
To enter a name:
1) Using the mouse pointer, click in the text box.
2) Type a desired name and then hit the [enter] key to accept or [esc] to cancel.
Figure 4- 3: Entering a Company Name
WaveRIDER 31
Page 43

4.2 WaveRIDER Data Worksheet
The WaveRIDER Data worksheet is where individual data runs are viewed in single
page format.
WaveRIDER Data worksheet features:
MENUS
TOOLBAR
DATA SHEET
Menus and Toolbar
Data sheet
Figure 4- 4: WaveRIDER Data Worksheet
32 WaveRIDER
Page 44

4.2.1 WaveRIDER Data Worksheet Menus and Toolbar Buttons
Menus: File, View, WaveRIDER, Navigate, and Help.
Toolbar buttons: Print, Zoom In, Zoom Out, 100%, Read WaveRIDER Data,
About, First (data run of the data set), Back (to previous data run), Forward (to
the next data run), and Last (data run of the data set).
Figure 4- 5: WaveRIDER Data Worksheet Menus and Toolbar Buttons
WaveRIDER 33
Page 45

4.2.2 Interpreting the WaveRIDER Data Sheet
(1)
2
)
(3)
(4)
(6)
(5)
The following section defines the features of the WaveRIDER Data sheet. The Group
Parameters on the data sheet are color coded so when they are viewed on other
worksheets they can be easily associated with the Label Parameters.
(
Figure 4- 6: Document View
(1) Company Name, Machine Name, and Part Number configured by user.
(2) Pre-heat Parameters and Conveyor speed.
(3) Chip Wave Parameters (Blank column if there is no chip wave).
(4) Solder Wave Parameters.
(5) M.O.L.E. Internal Status.
(6) Overall Coupon Parameters.
Refer to APPENDIX C: Measurement Definitions for Parameter defintions
If a parameter has no value (blank) that means that there was insufficient
contacts detected to give a complete reqort.
34 WaveRIDER
Page 46

4.2.3 Data Coloring and LSL / USL
The parameter data and the user specified LSL (Lower Specification Limit) and USL
(Upper Specification Limit) text fields on the Admin (Administration) worksheet are
linked to indicate that a parameter has exceeded a user specified specification limit. If a
USL has been exceeded, that parameter will be underlined and appear on the Data
sheet in Red (indicating it is above the specification limit). If a parameter is less than the
user specified LSL, that parameter will be underlined and appear in the Data sheet in
Blue (indicating below the specification limit).
EXCEEDED USL
PARAMETER (RED)
EXCEEDED LSL
PARAMETER (BLUE)
Figure 4- 7: Data Coloring
See section 4.5.4 Specification and Control Limit Cells for information on how to
enter user LSL and USL values.
WaveRIDER 35
Page 47

4.3 Spreadsheet Worksheet
The Spreadsheet worksheet contains data that is collected by the WaveRIDER, and is
put into standard spreadsheet format. Each row in the spreadsheet represents one data
run. Using the Admin worksheet in conjunction with the Spreadsheet worksheet the user
can select parameters to be displayed on the worksheet.
Spreadsheet Worksheet features:
Menus and Toolbar Statistics
Parameter Group (color coded) User Definable Columns
Parameter Labels Parameter Units
Data Run Rows Filters
MENUS
TOOLBAR
PARAMETER
GROUPS
DATA RUN
ROWS
SELECTED
DATA RUN
PARAMETER
LABELS
PARAMETER
UNITS
FILTERS
USER DEFINABLE
COLUMNS
Figure 4- 8: Spreadsheet Worksheet
36 WaveRIDER
Page 48

4.3.1 Spreadsheet Menus and Toolbar Buttons
Menus: File, Edit, View, Format, Window, WaveRIDER, and Help.
Toolbar buttons: New, Open, Save Workbook, Print, Undo, Redo, Zoom In,
Zoom Out, 100%, Align left, Center, Align right, Bold, Italic, Underline, Read
WaveRIDER Data, Dock Printout Settings, and About.
Figure 4- 9: Spreadsheet Worksheet Menus and Toolbar Buttons
WaveRIDER 37
Page 49

4.3.2 Parameter Groups
S
Parameter Groups are the headers for a specific group of data parameters collected by
the M.O.L.E.. They are color coded with the associated Parameter Labels so they can
be easily identified together.
The width of each parameter column can be adjusted to be larger or smaller by
placing the mouse pointer over a split line dividing the parameter columns and
sliding it to the desired width.
PARAMETER GROUP
PLIT-LINE POINTER.
Figure 4- 10: Parameter Group
38 WaveRIDER
Page 50

The Parameter Groups are defined as the following:
User Defined Parameter Group: These parameter columns can be used to
enter text to help identify the row with unique
information about that run (i.e. shift, operator,
line number, part number). This information will
also appear in the Tool Status box on the
Profile worksheet.
General Parameter Group: This group contains file information associated
with the run such as; date and time, (of profile)
and the data file tag.
Preheat Parameter Group: This group contains Pre-heat Temperature
Data.
M.O.L.E. Parameter Group: This group contains the physical condition of
the M.O.L.E. at the end of the run.
Chip Wave Parameter Group: This group contains the thermal and
mechanical data from the Chip Wave (first of
two waves).
Solder Wave Parameter Group: This group contains the thermal and
mechanical data from the Solder Wave.
Coupon Parameter Group: This group contains the coupon temperature,
and Slope data.
WaveRIDER 39
Page 51

4.3.3 Parameter Labels
The Parameter Labels are where all of the specific parameters for each group are listed.
The user can decide which parameters will be shown on the Spreadsheet worksheet
from the Admin worksheet as discussed in section 4.5.3 Parameter check boxes.
PARAMETER LABEL
Figure 4- 11: Parameter Label
4.3.4 Parameter Units
The Parameter Units are the units of measurement for that parameter. For example, in
the Preheat Group Parameter, the Parameter Label Temp: is in F.
PARAMETER UNITS
Figure 4- 12: Parameter Units
40 WaveRIDER
Page 52

4.3.5 Data Run Rows
All of the data runs uploaded into a workbook file are listed on the Spreadsheet
worksheet as individual rows. The first data run uploaded into the workbook file is on the
bottom and the most recent data run uploaded is on the top.
When any data run row is selected, all of the cells in the entire row are highlighted in
purple and blue. The purple cells indicate that the cells can be modified and the blue
cells indicate the data cannot be modified.
When any individual data cell in a data run row is selected, all of the cells in the entire
row are highlighted in green and yellow. The green cells indicate that the cells can be
modified and the yellow cells indicate the data cannot be modified.
The data run rows can also be moved into any order desired. This is useful when the
user wants to place similar data runs together.
To change the order of the data run:
1) Select the number cell of a data run row with the mouse pointer. The row will
then become highlighted in purple and blue.
2) Drag the row and drop it to a desired location.
Figure 4- 13: Drag and Drop Data Rows
4.3.6 Selected Run
When a data run row is selected, the data for that row will be shown in the Sel= row
located at the bottom of the data run rows. This row also allows the user to easily
compare the selected data row to the statistics calculations located below the selected
run row.
Entire selected rows and columns can be “copied” by pressing keys (CTRL + C)
and then “pasted” (Ctrl + V) into other spreadsheet applications.
WaveRIDER 41
Page 53

4.3.7 Filters
There are Filters for each parameter label that filter specific data out of runs listing.
Filtering more than one column at a time acts as a Logical AND Function. All
conditions of all set filters must be met for data row(s) to remain visible.
How to use the Filter function:
1) Click the Filter button to reveal the unique data as populated in that column
under that particular parameter label.
2) Select a desired data value to filter, or the two standard filters All and Special.
FILTER ARROW BUTTON
Figure 4- 14: Filter Function
42 WaveRIDER
Page 54

To use the All option:
1) Select All to reset the filter for that column and view all of the data run rows that
meet the other column filters.
To use the Special option:
1) Select Special to select data run rows within a range of values. There are multiple
options to select information to filter by clicking the appropriate relational
operators option button (See Figure 4- 15). The user can either select data from
a populated list or type it in the text box on the top of the column.
= equal to >= greater than or equal to
> Greater than <= less than or equal to
< less than <> Not equal to
Figure 4- 15: filter option buttons
WaveRIDER 43
Page 55

2) Select a data filter by:
Clicking the greater than relational operator option button beside the left data
column.
Click a parameter value from the list or type it in the text box.
Click the AND logical operator option button.
Click the less than relational operator option button beside the right data column.
Click a parameter value from the list or type it in the text box.
The Clear command button can be selected at any time to clear the selections and
the new values can be selected.
3) Click the OK command button to accept the selected data filters or Cancel to
return to the worksheet without executing the filter request.
Figure 4- 16: Special Filter Feature Dialog Box
In this example, the data filtered would be all times between, but not including 06:25:33
and 14:08:00.
To reset all of the data set rows to restore the entire set of collected data, click
the Filter Reset button on the Spreadsheet worksheet.
44 WaveRIDER
Page 56

4.3.8 Statistics
There are rows located on the bottom of the Spreadsheet worksheet, which are the
combined calculations for all the data runs that are currently being viewed in the
Spreadsheet worksheet display. The following information is the definitions for each
Statistics row:
N = Number of samples included in the calculations
Min. = The lowest value in the parameter column.
Max. = The highest value the parameter column.
Avg = The average of all values in the parameter column.
Std. Dev. = The standard deviation of the values in that column.
WaveRIDER 45
Page 57

4.4 Profile Worksheet
The Profile worksheet is where a selected data run is represented graphically. The
software allows the user to analyze the data and to compute statistics based on the
data.
Profile worksheet features:
y Menus and Toolbar y Data Tabs
y M.O.L.E. Status y Status Bar
y Tool Box Status y Data Table
y Magnify Map y Scale
y Sensor Locations y Data Graph
y Channel Check Boxes
MENUS
TOOLBAR
M.O.L.E.
STATUS
TOOL
STATUS
BOX
MAGNIFY
MAP
CHANNEL
CHECK
BOXES
DATA TABS
STATUS BAR
SENSOR LOCATIONS
Figure 4- 17: Profile Worksheet
DATA
GRAPH
DATA TABLE
46 WaveRIDER
Page 58

4.4.1 Profile Menus and Toolbar Buttons
Menus: File, Edit, Window, WaveRIDER, Profile, Tools, Navigate, and Help.
Toolbar buttons: New, Open, Save Workbook, Print, Magnify, Slope, Peak
Difference, Overlay, 3-D, Notes, Erase Object(s), Erase All, Read WaveRIDER
Data, Dock Printout Settings, About, First (data run of the data set), Back (to
previous data run), Forward (to the next data run), and Last (data run of the data
set).
Figure 4- 18: Profile Worksheet Menus and Toolbar Buttons
WaveRIDER 47
Page 59

4.4.2 M.O.L.E. Status
The M.O.L.E. STATUS box contains information about the status of the M.O.L.E. while it
collected the data the selected run.
MOLE STATUS
Figure 4- 19: M.O.L.E. Status Window
Max Internal T: This is the highest internal temperature logged during the displayed
profile and is displayed in degrees Celsius. If the highest temperature logged is in
the specified internal operating temperature range of is 0-54C, it appears in
BLACK. When the internal temperature is 55-64C, it appears in YELLOW
indicating that the M.O.L.E. has reached the Warning zone and is approaching
the maximum recommended operating temperature of 65C. If the internal
operating temperature is above 65C, it appears in RED indicating that the
maximum internal operating range has been reached.
Battery: The battery voltage measured during the upload of that run. The nominal
range for normal operation is 5.1 to 4.7V.
Points: The number of data samples recorded at the configured interval.
Active: Indicates which channels were active during the experiment. A number
means an active channel; a “O” is an inactive channel. An "X" means an open or
out of range T/C was detected on that channel during the data run.
Interval: Time between data shown in hours, minutes, seconds, and tenths of
seconds data points: hh:mm:ss.t.
Date: Date of last data point logged.
Time: Time of last data point logged.
V: Firmware Version displays the operating code of the M.O.L.E. (This is where
customer service will ask you to find the version number for the M.O.L.E.)
48 WaveRIDER
Page 60

4.4.3 Tool Status Box
The Tool Status box displays information on how to use a selected tool command and
other information during tool use. Prior to using a tool command, the Tool Status box
displays the Spreadsheet worksheet User definable column information that is
associated with the selected data run.
When a Tool command, such as Magnify, is selected, a message appears in the box
stating “Click and drag to select area”.
TOOL
STATUS
Figure 4- 20: Tool Status Message
Once the user has completed the tool command, the user data will be displayed again.
WaveRIDER 49
Page 61

4.4.4 Magnify Map
The Magnify Map displays a small map of the entire profile and indicates the area
currently magnified with a red crosshatched box.
MAGNIFIED
AREA
Figure 4- 21: Magnify Map
50 WaveRIDER
Page 62

4.4.5 The Data Table
The Data Table includes various values depending on which Data Tab is selected. The
rows always indicate the channel and the columns vary depending on which data tab is
active.
DATA TABLE
Figure 4- 22: Data Table
WaveRIDER 51
Page 63

4.4.5.1 Value Pop-up
Each value in the Data Table can be displayed as a Value Pop-up. A Value Pop-up is
graphically illustrated on the Data Graph showing how and where that value was
extracted from the profile.
Only one Value Pop-up can be displayed on the Data Graph at a time.
VALUE POP-UP
SELECTED VALUE
Figure 4- 23: Value Pop-up
To display a Value Pop-up:
1) Select the Profile worksheet.
2) Move the mouse cursor and pause over a desired value in the Data Table. That
value will automatically be displayed on the Data Graph where that value was
extracted.
The last displayed Value Pop-up will remain on the Data Graph until the user
selects a different worksheet.
52 WaveRIDER
Page 64

4.4.5.2 Show/Hide Columns
Data Table parameter columns on the Profile worksheet can be hidden. This is useful
when an operator wants to focus attention to the most important parameter columns.
Figure 4- 24: Show/Hide Columns
To display Show/Hide columns:
1) Select the Profile worksheet.
2) Right click a parameter column header.
3) Clear a parameter check box to hide or select to display.
Hidden Parameter columns do not affect the data being collected for that
parameter. If all Parameter columns are hidden, right-click the Sensor locations
column header to open the Show/Hide column dialog box.
WaveRIDER 53
Page 65

4.3.5.3 Change Summary Stats Settings
When creating a new workbook, a dialog box appears allowing the user to specify
Summary Statistics settings based on user selected values.
If the process changes or an operator wishes to perform test experiments, these
settings can be changed by clicking a parameter column header on the Profile
worksheet.
Figure 4-25: Modify Summary Stat Settings
To Change Summary Stats Settings:
1) Select the Profile worksheet.
2) Select the Summary Stats tab.
3) Click the Time Above or Time between column header.
4) Change the desired Summary Stats settings and select the OK command to
accept.
5) Once the new settings have been accepted, the software prompts the user to
decide if these new settings should be applied to future data run profiles.
54 WaveRIDER
Page 66

4.3.5.4 Change Slope Calculator
Positive and negative slope profile parameter calculator allows the user to calculate
straight line slopes between any two temperatures. (Default to liquidous and liquidous to
peak).
If the process changes or an operator wishes to perform test experiments, these
settings can be changed by clicking a parameter column header on the Profile
worksheet.
Figure 4- 26: Modify Summary Stat Settings
To Change Slope Calculator:
1) Select the Profile worksheet.
2) Select the Summary Stats tab.
3) Click a Peak Slope column header.
4) Change the desired settings and select the OK command to accept.
5) Once the new settings have been accepted, the software prompts the user to
decide if these new settings should be applied to future data run profiles.
WaveRIDER 55
Page 67

4.4.6 Sensor Locations
The location for each sensor labeled in the Data Table. The color and description
indicates which Data Plot on the Data Graph it designates. The top three sensor
location descriptions are the Coupon Top, Coupon Solder, and Coupon Bottom sensors.
The bottom three are the A, B and C speed sensors.
SENSOR
DESCRIPTIONS
Figure 4- 27: Sensor Location Descriptions
56 WaveRIDER
Page 68

4.4.7 Channel Check Boxes
The Channel check boxes control whether the associated Data Plot is displayed on the
Data Graph and whether the data for that channel are included in the data table. To
view or remove a Data Plot, click the channel check box beside a sensor location
description to turn it “ON” or “OFF”.
CHANNEL CHECK BOXES
Figure 4- 28: Channel Check Boxes
WaveRIDER 57
Page 69

4.4.8 Status Bar
The Status Bar shows the available Help information, X-Y position of the mouse pointer,
current date and time.
HELP INFORMATION
Figure 4- 29: Status Bar Features
58 WaveRIDER
X-Y READOUT
DATE & TIME
Page 70

Help Information
When the mouse pointer is placed over a Toolbar button the left side of the Status bar
will display the action that button performs.
X/Y Readout
It is easy to find the exact X and Y-values of any point on the Data Graph using the
mouse pointer. The X/Y Readout continuously displays the X and Y-axes values of the
mouse pointer location.
The units displayed for X and Y-values are the same as those displayed on the graph.
The user can select between F and C for the Y-value units. The X-value units can be
a data point number, time, or distance. Units can be changed on the X and Y-axes at
any time by selecting the Units command in the Profile menu.
While using the Magnify tool, the X/Y Readout displays the size of the selected
area of interest.
Other ways to view exact X- and Y-coordinates of a data point is to select the
Value Tab.
y Date and Time
This area of the Status bar displays the current time and date of the PC.
WaveRIDER 59
Page 71

4.4.9 Data Tabs
Data Tabs is where the user can view a variety of sensor information in the Data Table.
The Data Tabs are:
Value
Time to Ref
T above Ref
Statistics
Summary Statistics
KPI (Key Process Indicators)
Only one data tab can be active at a time. Each is described below.
When the Magnify tool is used to zoom in on a portion of the Data Graph, the Data
Table displays the statistics for those values that are displayed. (This feature
does not apply to the Summary Stats Data Tab).
60 WaveRIDER
Page 72

4.4.9.1 Value
When the Value Tab is selected, the Data Table lists the temperature at the point where
an X-cursor intersects a Data Plot. There are four X-cursors and the positions can be
changed at any time by moving the X-cursor (Refer to the descriptions in section
4.4.10.5 X-Cursors). As an X-cursor is moved, the values in the Data Table are
automatically updated.
Figure 4- 30: Value Data Tab
Values in the Data Table depend on the units of the X and Y-axis.
WaveRIDER 61
Page 73

4.4.9.2 Time to Reference
When the Time to Reference Tab is selected, the Data Table displays the time it takes
the channels to reach fixed Temperature Reference Line(s). Times are expressed as
HH:MM:SS (H=hours, M=minutes, S=seconds). Up to three Temperature Reference
Lines can be added to the Data Graph that are used in this statistic by using the Temp
Ref Lines command in the Profile menu.
Figure 4- 31: Time to Ref Data Tab
62 WaveRIDER
Page 74

4.4.9.3 T Above Ref
When the T Above Ref Tab is selected, the Data Table shows the amount of time each
sensor measured data above the Temperature Reference Lines. Times are expressed
as HH:MM:SS (H=hours, M=minutes, S=seconds) and are the total time above
reference line regardless of when the value was above.
Figure 4- 32: T Above Ref Data Tab
Temperature Reference Lines can be added, deleted, or moved at any time using
the Temp Ref Lines command in the Profile menu.
WaveRIDER 63
Page 75

4.4.9.4 Statistics
When the Statistics Tab is selected, the first four columns of the Data Table displays the
minimum and maximum temperature found for each Data Plot and the value of X (time,
distance, or point number) at which it occurred.
The last two columns of the Data Table displays the Average (Mean) and Standard
Deviation of the temperature values recorded for each sensor.
Figure 4- 33: Statistics Data Tab
If a portion of the Data Graph is magnified using the Magnify tool, the Data Table
displays the Mean and Standard Deviation of the values currently displayed.
64 WaveRIDER
Page 76

4.4.9.5 Summary Statistics
When the Summary Stats Tab is selected, the Data Table displays a summary of primary
statistics from the entire data set. These summary statistics always display the statistics
derived from the entire profile regardless of the level the Data Graph is zoomed.
Figure 4- 34: Summary Statistics
WaveRIDER 65
Page 77

4.4.9.6 KPI (Key Process Indicators)
When KPI is the active data tab, the Data Table displays statistics from the Profile
configured by the user. This is useful so the user can display the most important
information that best suits their needs or application.
Figure 4- 35: KPI Data Tab
66 WaveRIDER
Page 78

Key Process Indicators Setup:
1) Make sure the KPI Data Tab is active.
2) Click the KPI Setup button above the Sensor Locations descriptions.
The KPI Setup can also be activated by right-clicking a column header.
Figure 4- 36: KPI Setup
3) Click the desired parameters to display in the Data Table. The parameters are
grouped by Temperature, Cursor data with slope between, and Time. The user
can also select to display Range, Average and Standard Deviation rows for each
of the columns.
4) When finished select the OK button to display the new settings or Cancel to return
to the worksheet without making any changes.
A maximum of 12-16 parameter columns can be displayed at one time. As
columns populate the Data Table, they are automatically sized to fit. It is
recommended that the most beneficial column information is displayed to
achieve the best results.
WaveRIDER 67
Page 79

4.4.10 The Data Graph
The Data Graph is a display that shows the data collected from the data run overlaid on
a graph. The user can analyze and highlight various process features with the tools
listed below.
X and Y-Axes and Labels
Autoscaling
Data Plots
Process Origin
X-Cursors
X-axis Units
Temperature Reference Lines
The Data Graph features are described in the sections that follow. Some of these
features described are also controlled using the appropriate menu options. Refer to
section 5.0 Menu and Tool Commands for more information.
68 WaveRIDER
Page 80

4.4.10.1 X and Y-Axes and Labels
The Y-axis (vertical) displays the scale of the measured temperature. Lower values are
at the bottom and higher values at the top.
The Y-axis includes temperature labels on the left side of the graph. These four
temperatures divide the vertical axis into four equal parts and are automatically scaled
to fit the current Y-axis limits. These units can be displayed in Celsius or Fahrenheit
using the Units command in the Preferences sub-menu on the Admin worksheet.
The X-axis (horizontal) displays values data points collected. The X-axis can be
converted from data points to time or distance using the X-Axis Units command in the
Profile menu.
To see the X-value of any location on the Data Graph, the software provides two
different methods:
The X/Y Readout in the Status bar continuously displays both X and Y-values at
the location of the mouse pointer. Details of this feature are described in section
4.4.8 Status Bar.
The X-value at the position of each X-Cursor is displayed in the Data Table when
the Value statistic is active.
4.4.10.2 Autoscaling
The software includes a powerful Autoscaling option to automatically scale the Data
Graph so the data will always be visible and easy to work with. The software will
automatically select a range of values for both the X and Y-axes to ensure that all the
data fits on the screen. The user can change the range of Y-values displayed in Manual
mode by entering a manual mode using the Scaling command in the Profile menu.
Another way to scale the graph’s X and Y-axes is to use the Magnify tool
described in section 5.8.1 Magnify Tool.
WaveRIDER 69
Page 81

4.4.10.3 Data Plots
The Data Plots in the Data Graph represent the data for each of the WaveRIDER
sensors. Each sensor is represented by a different color that corresponds to the color of
its sensor location description in the Data Table.
DATA PLOTS
Figure 4- 37: Data Plots
A Data Plot in the Data Graph can be suppressed or restored at any time by clicking the
check box with the corresponding sensor description in the Data Table. This allows the
user to view any combination of the Data Plots or individually.
When two or more Data Plots overlap the same values, the Data Plots overwrite
each other. For example, if the Data Plot that represents the Coupon Top sensor
and Coupon Bottom have the same value, the Coupon Top Data Plot will only
appear unless the user suppresses it.
When printing a Data Graph in black and white, suppressing one or more Data Plots is
useful for clearing a view of a Data Plot that is obscured by others near it.
When printing the Data Graph in black and white, the Notes tool can be used to
help identify each Data Plot.
70 WaveRIDER
Page 82

4.4.10.4 Process Origin
The Process Origin is a gray vertical line at the left edge of the Data Graph to indicate
where the process starts. The Process Origin is automatically set by the software when
the data is uploaded from the M.O.L.E.. When Points or Distance units are being used
for the X-values, the X-values to the left of the Process Origin are displayed as negative
and those to the right as positive.
PROCESS
ORIGIN
Figure 4- 38: Process Origin
To move the Process Origin:
1) Select the Process Origin line by positioning the mouse pointer anywhere on the
line.
2) Press and hold the left mouse button.
3) Move the line by dragging it left or right.
4) Release the mouse button when the Process Origin is at the desired location.
The X/Y Readout in the Status Bar indicates the true position of the Process Origin
while it is being moving. After the mouse button is released, the X-Readout changes to
zero at the Process Origin and displays negative numbers for X when the mouse pointer
is moved to the left of the Process Origin.
X-Cursor values are automatically adjusted when the Process Origin is moved.
WaveRIDER 71
Page 83

4.4.10.5 X-Cursors
The Data Graph has four X-cursors that indicate the temperature values at the
intersection of a Data Plot with each X-cursor. When the Value Data Tab is selected,
these values are displayed in the Data Table in four data columns labeled C1, C2, C3,
and C4, representing X-cursor 1 through X-cursor 4 respectively.
VALUE STATISTICS TAB
Figure 4- 39: X-Cursors
72 WaveRIDER
X-CURSORS
Page 84

To move an X-cursor:
1) Select the Value Data Tab.
2) Position the mouse pointer over the X-cursor grip (the small triangle below a Xcursor) then press and hold the left mouse button and drag it left or right
releasing the mouse button when the X-cursor is at the desired location.
The user can also press the [tab] key to toggle select an X-cursor. When the
desired X-cursor is selected, the small triangle will turn red. Then pressing either
the left or right arrow keys will step the X-cursors. Each step is one pixel or one
degree which ever is larger. This feature achieves cursor positions that are more
precise.
Moving the selected cursor can be pushed into other cursors causing them to
move them ahead of it.
The position of an X-cursor controls the values displayed in the Data Table. When an Xcursor is moved, values in the Data Table are automatically updated.
The Data Table includes a row for each of the sensors on the WaveRIDER. The
numbers in the four columns indicate the Y-values at the intersection of a Data Plot with
an X-cursor. (Refer to section 4.4.9 Data Tabs)
When an X-cursor is dragged to a new position, it automatically snaps to the closest
real X-value. Notice on highly magnified graphs that the cursor jumps from point to
point. In an extreme case, if the graph is so highly magnified that there are no real Xvalues to move to, the X-cursors cannot be moved at all.
The Process Origin is the initial point from which all X-axis position data is
calculated. After releasing the Process Origin at the appropriate point on the
graph, X-cursor values are recalculated and displayed.
WaveRIDER 73
Page 85

4.4.10.6 X-axis Units
The user can select three different types of X scales for the X-axis. The scales are
Point, Time (time measure from process origin), and Distance. To change, select the X-
axis Units command in the Profile menu.
The scale is displayed only when a data tab other than Value is selected.
Figure 4- 40: Scale Types
LOGGED
POINT
SCALE
TIME
DISTANCE
SCALE
74 WaveRIDER
Page 86

4.4.10.7 Temperature Reference Lines
Temperature Reference Lines are colored horizontal lines that are positioned within the
range of Y-values in the graph. Up to three Temperature reference lines can be added
to the Data Graph using the Temp Ref Lines command in the Profile menu.
TEMP REF
LINE
Figure 4- 41: Temp Ref Lines
Temperature Reference Lines are used in analysis when the T Above Ref (Time above
the Reference Line) statistic is active. (T Above Ref statistic is described in section
4.4.9.3 T Above Ref).
WaveRIDER 75
Page 87

4.5 Administration Worksheet
The Administration worksheet is where all of the WaveRIDER parameters are
controlled. The parameters collected by the M.O.L.E. are in the Spreadsheet parameter
column located on the left side of the worksheet. Each parameter has a check box for
viewing (or not) on the Spreadsheet worksheet. The right side of the Admin worksheet
contains SPC sheet setup boxes, for defining the SPC charts. There is also an option to
specify LSL (Lower Specification Limits), USL (Upper Specification Limits), LCL (Lower
Control Limits), and UCL (Upper Control Limits) in the cells located to the right of each
parameter.
Admin Worksheet features:
y Menus and Toolbar buttons Spec and Control Limit Cells
y Spreadsheet Parameters SPC Sub-Group Size
y Parameter check boxes SPC Sheet Parameter Boxes
SPREADSHEET
PARAMETERS
MENUS
TOOLBAR
PARAMETER
CHECK
BOXES
SPEC LIMIT
CELLS
CONTROL LIMIT
CELLS
SPC SHEET
PARAMETER
BOXES
SPC SUB-GROUP SIZE
Figure 4- 42: Administration Worksheet
76 WaveRIDER
Page 88

4.5.1 Administration Menus and Toolbar Buttons
Menus: File, Edit, View, Format, Window, WaveRIDER, and Help.
Toolbar buttons: New, Open, Save, Print, Undo, Redo, Zoom In, Zoom Out,
100%, Align left, Center, Align right, Bold, Italic, Underline, Read WaveRIDER
Data, Dock Printout Settings, and About.
Figure 4- 43: Admin Worksheet Menu Bar and Tool Buttons
WaveRIDER 77
Page 89

4.5.2 Spreadsheet Parameters
The Spreadsheet Parameters are arranged in a column that contains all of the
parameters that the WaveRIDER collects during a data run. The parameters are
arranged by colors as described in section 4.3.2 Parameter Groups. Each cell has the
Group Parameter listed first and the Label Parameter listed second.
LABEL PARAMETERS
GROUP PARAMETERS
Figure 4- 44: Spreadsheet Parameters Defined
4.5.3 Parameter check boxes
The Admin worksheet has a corresponding check box located on the left of each
Spreadsheet parameter. To display a parameter on the Spreadsheet worksheet, click
the corresponding check box. Similarly if you do not want to view the parameter,
remove the check mark by clicking the check box. When a parameter check box is
colored, this indicates these parameters are typically more significant and are helpful to
analyze.
78 WaveRIDER
Page 90

4.5.4 Specification and Control Limit Cells
There are cells to the right of each parameter for specifying an LSL (lower specification
limit) and an USL (upper specification limit) for each parameter. The user can also
specify an LCL (upper control limit) and UCL (upper control limit) to be applied to a SPC
chart.
LSL and USL Cells
These limits notify the user if the parameter is above or below the LSL or USL during a
data run. When a parameter is below the user specified LSL, it appears on the
WaveRIDER Data worksheet in blue and will be underlined. When a parameter is
above the user specified USL it appears on the WaveRIDER Data worksheet in red and
will be underlined.
USER
CONTROLLED
LSL & USL
LSL & USL
CELLS
Figure 4- 45: User Specified Specification Limits
WaveRIDER 79
Page 91

User Controlled LSL and USL
The user can automatically set a LSL and USL for each parameter by using a drop
down list box that contains options to set the LSL to -3, -2, -1, standard deviation or –
10% and –5%. The USL can be set to +3, +2, +1 standard deviation or +10% and +5%.
Figure 4- 46: User Controlled LSL and USL
The values calculated are taken from the current data viewed on the Spreadsheet
worksheet.
80 WaveRIDER
Page 92

LCL and UCL Cells
Lower and Upper control limits are automatically calculated from the Spreadsheet
parameter data and displayed on the SPC control charts when an SPC worksheet is
created. The LCL and UCL cells allow the user to override the calculated limits and
manually set them.
USER
CONTROLLED
LCL & UCL
LCL & UCL
CELLS
Figure 4- 47: User Specified Control Limits
WaveRIDER 81
Page 93

User Controlled LCL and UCL
The user can automatically set a LCL and UCL for each parameter by using a drop
down list box that contains options to set the LCL to -3, -2, -1, standard deviation or –
10% and –5%. The UCL can be set to +3, +2, +1 standard deviation or +10% and +5%.
Figure 4- 48: User Controlled LCL and UCL
The values calculated are taken from the current data viewed on the Spreadsheet
worksheet.
82 WaveRIDER
Page 94

4.5.5 SPC Sheet Boxes
The right side of the Admin worksheet contains nine SPC sheet boxes. These boxes are
used to create the SPC worksheets.
Figure 4- 49: SPC Sheet Boxes
An SPC worksheet can be created by dragging and dropping a parameter or by using
the drop down list box.
WaveRIDER 83
Page 95

To create a SPC Worksheet:
Drag and Drop:
1) Select a parameter and drag it from the Spreadsheet Parameter column and
drop it into a SPC Sheet cell. Up to three parameters per SPC Sheet can be
selected.
CHECK TO ACTIVATE SPC
WORKSHEET(S)
Figure 4- 50: Drag and Drop Parameter
2) When finished, click the check box in the SPC Sheet Label to activate the SPC
sheet.
3) To view the SPC Sheet, click the new SPC worksheet tab (See section 4.7 SPC
Worksheet for more details).
84 WaveRIDER
Page 96

Parameter list:
1) All of the SPC sheet boxes have drop down list boxes located on the right side of
the parameter cell. To select a parameter click the drop down list box arrow
button and a list of parameter groups appears.
Figure 4- 51: Drop Down List Box
WaveRIDER 85
Page 97

2) Select the group from the drop down list that includes the desired parameter. A
dialog box will then appear listing all of the parameters in that particular group.
3) Select the desired parameter from the list and click the OK command button.
Figure 4- 52: Parameter Dialog Box
4) When finished, click the check box in the SPC Sheet Label to activate the sheet.
5) To view the SPC Sheet, click the new SPC worksheet tab (See section 4.7 SPC
Worksheet for more details).
86 WaveRIDER
Page 98

Replacing and Deleting SPC Parameters:
To change the parameters in the SPC Sheet boxes, drag and drop a different parameter
over of the existing parameter or repeat the drop down list method of selecting a
parameter.
To delete a parameter, click and drag the parameter off the SPC Sheet box to remove.
Figure 4- 53: Erase Bar
WaveRIDER 87
Page 99

4.6 Guide Worksheet
The Guide worksheet is a quick reference guide to assist new and experienced users
through basic operation steps.
Figure 4- 54: Guide Worksheet
88 WaveRIDER
Page 100

4.7 SPC Worksheet
The SPC worksheets display the assembled Spreadsheet parameters using the Admin
worksheet. Each SPC worksheet can display three X-bar and R charts and up to a
maximum of nine SPC worksheets can be created.
SPC worksheet features:
Menus and Toolbar buttons
X-Bar Chart
R Chart
Statistics box
STATISTICS BOX
MENUS
TOOLBAR
X-BAR CHART
R CHART
Figure 4- 55: SPC Worksheet
WaveRIDER 89
 Loading...