

Page 1

QUICK REFERENCE GUIDE
Page 2

1
Welcome: 2
Equipment:
Features/Functions 3
Setup:
Charging the Power Pack 5
Software Installation 6
Communications 7
Operation:
Introduction 9
Step 1: Setup Instrument 10
Step 2: Data Collection 15
Step 3: Download Data 18
CONTENTS
Page 3
2
WELCOME
This Quick Reference Guide is designed to help the user to familiarize themselves with
the equipment, perform basic hardware setup/communications and operation. For
detailed information on both Hardware & Software components, please refer to the Help
system accessible in the M.O.L.E.
®
MAP Software.
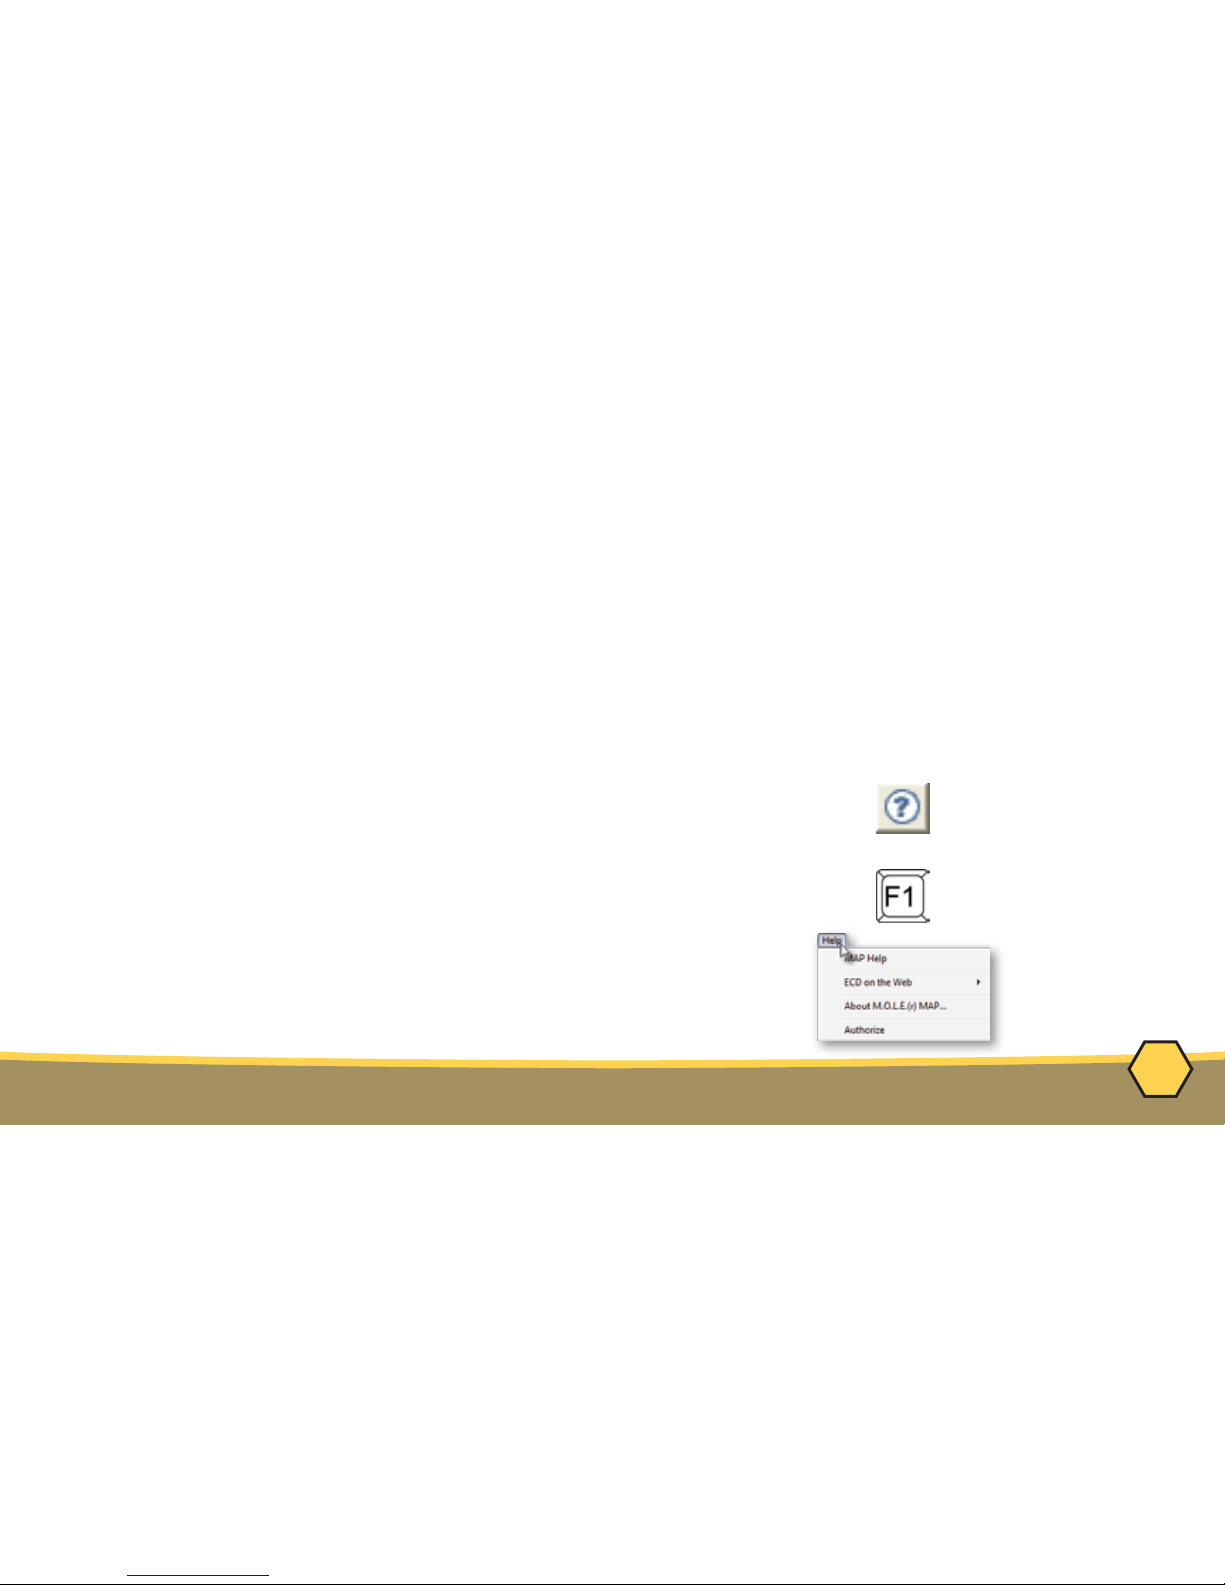
To access the help system start the software and use any of the methods listed:
1) Select the Help Button on the Toolbar.
2) Pressing the shortcut key [F1]
3) On the Help menu, click MAP Help.
Page 4
3
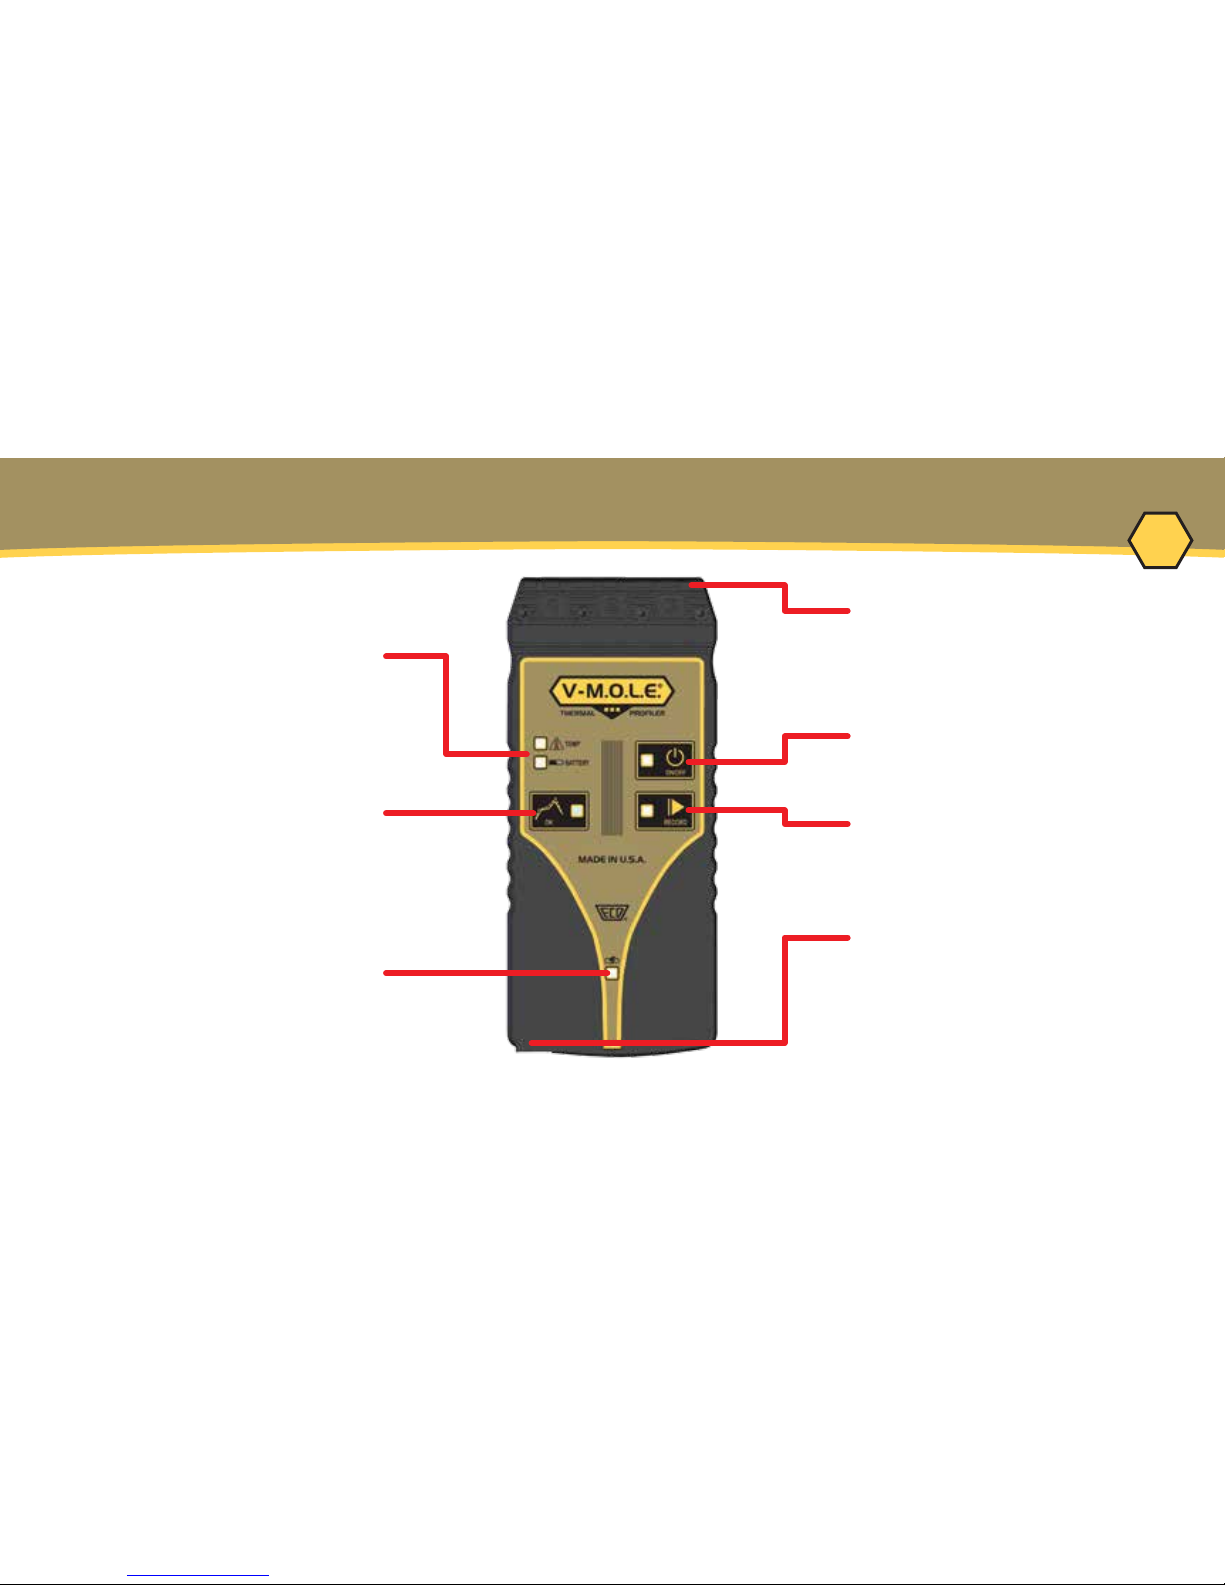
EQUIPMENT - FEATURES/FUNCTIONS
Activity Indicators:
Indicates state of the
M.O.L.E. Thermal Proler
OK Button:
Invokes "OK" process resulting
in a GO-NO GO decision
Thermocouple/Inputs:
Type “K” Thermocouple
sensor connection
ON/OFF Button:
Turns the Proler "ON/OFF"
Data/Charging Port:
Transfers data to/from a
computer & charges the
internal Power Pack
Record Button:
Starts/Stops recording data.
Charging LED:
Indicates when the internal
Power Pack is charging
Page 5
4
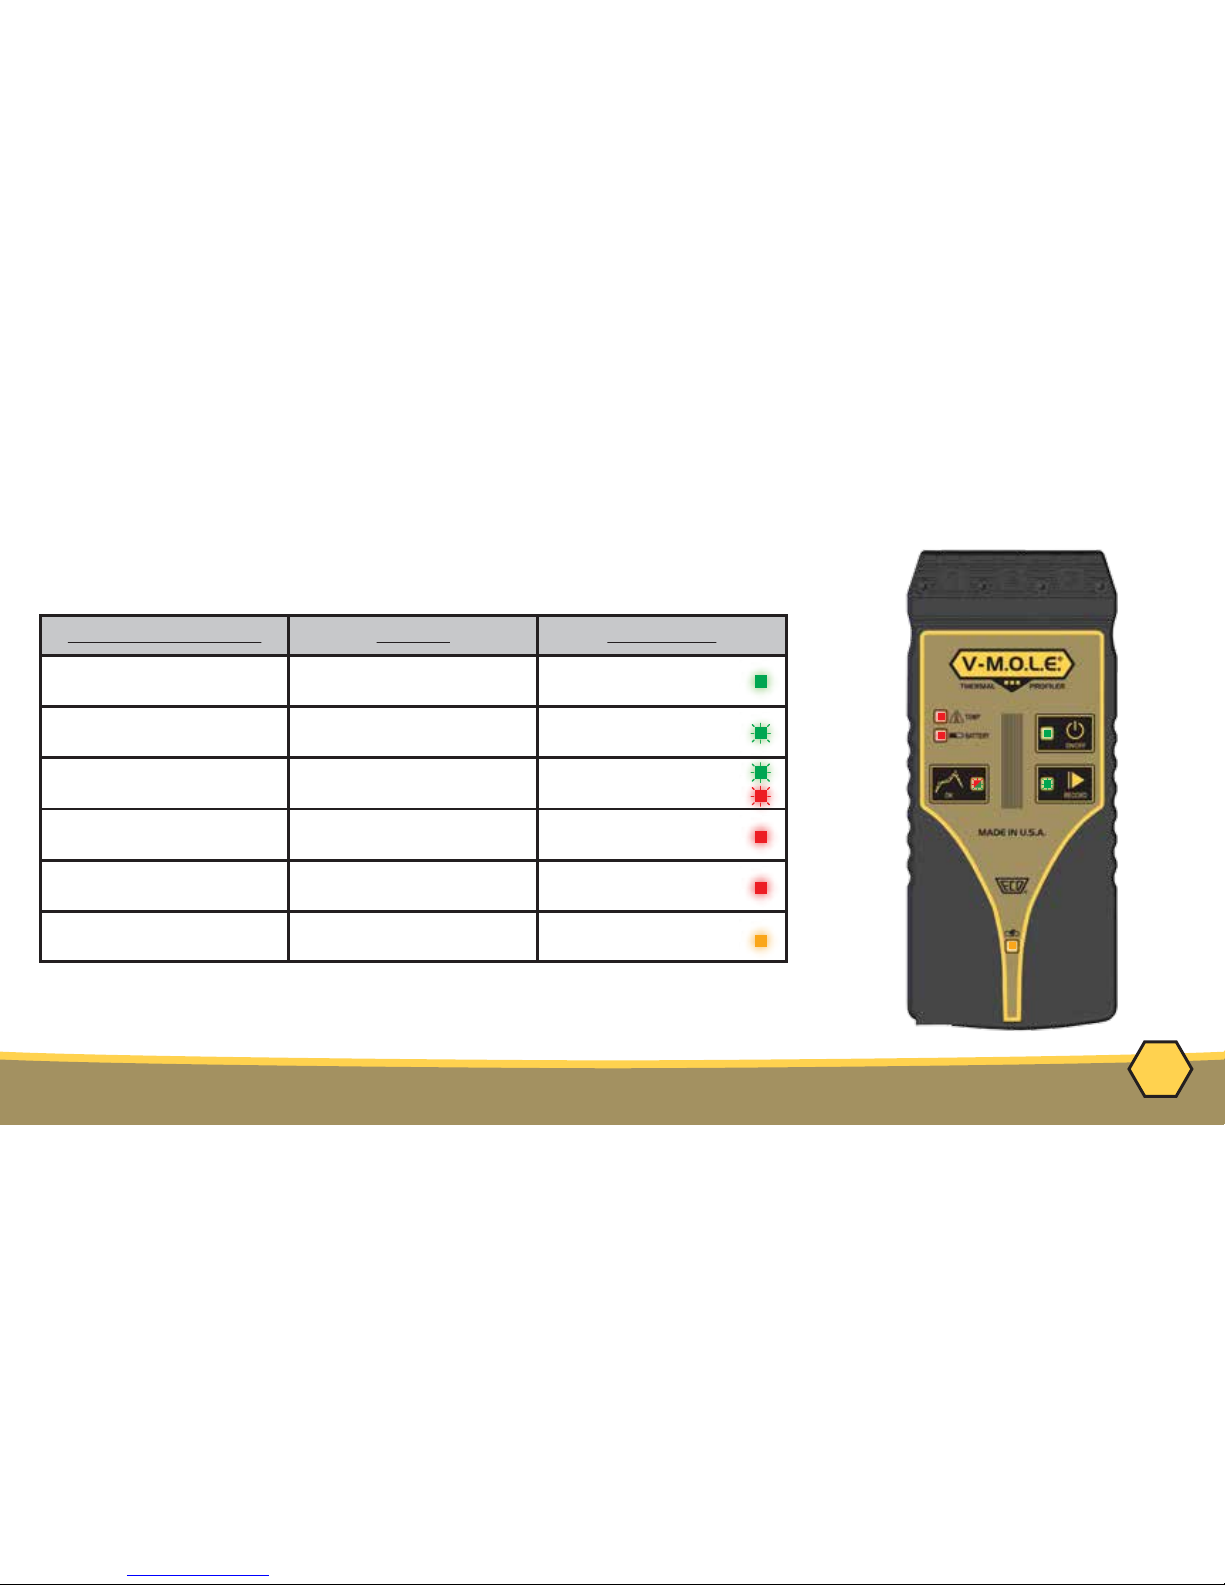
EQUIPMENT - STATUS ACTIVITY LED
Activity Indicator
Action
LED Color
ON/OFF Indicates Proler is "ON"
and idle
Green (Solid)
Record Indicates Proler is
recording data
Green (Flashing)
OK
Indicates recorded prole
passes pre-congured criteria
Green - Pass (Solid)
Red - Fail (Solid)
Temp(erature)
Indicates if internal temp is
at or above a max
Red (Solid) >40°C
Battery
Indicates when the internal
Power Pack voltage is low
Red (Solid) <3.0V
Charge
Indicates when the internal
Power Pack is charging
Yellow (Solid)
Page 6
1
2
5
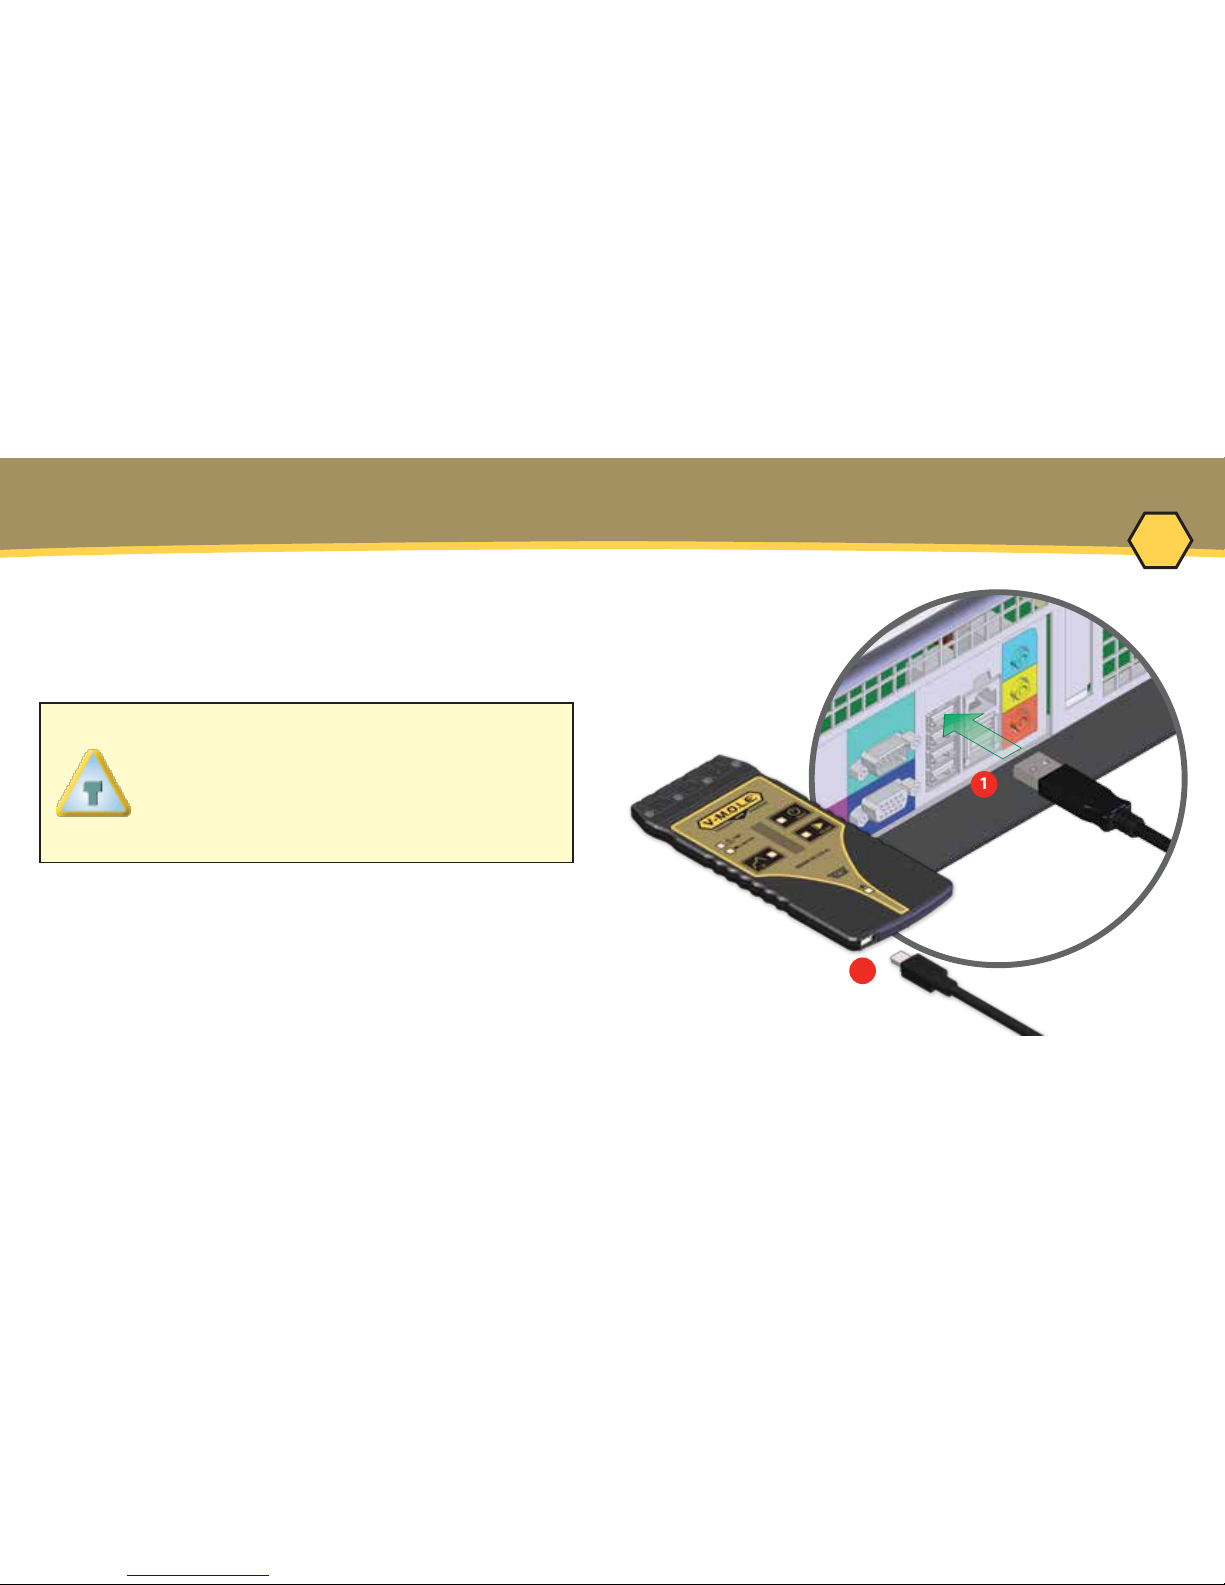
SETUP - CHARGING THE POWER PACK
1. Insert the USB computer interface cable into
a computer USB Port
2. Insert the other end into the Data/Charging
Port.
A completely discharged Power Pack
takes about 8 hours to be fully
charged. For quick charges, it can be
charged for 15 minutes allowing one
10 minute data run to be performed.
Page 7
2
6
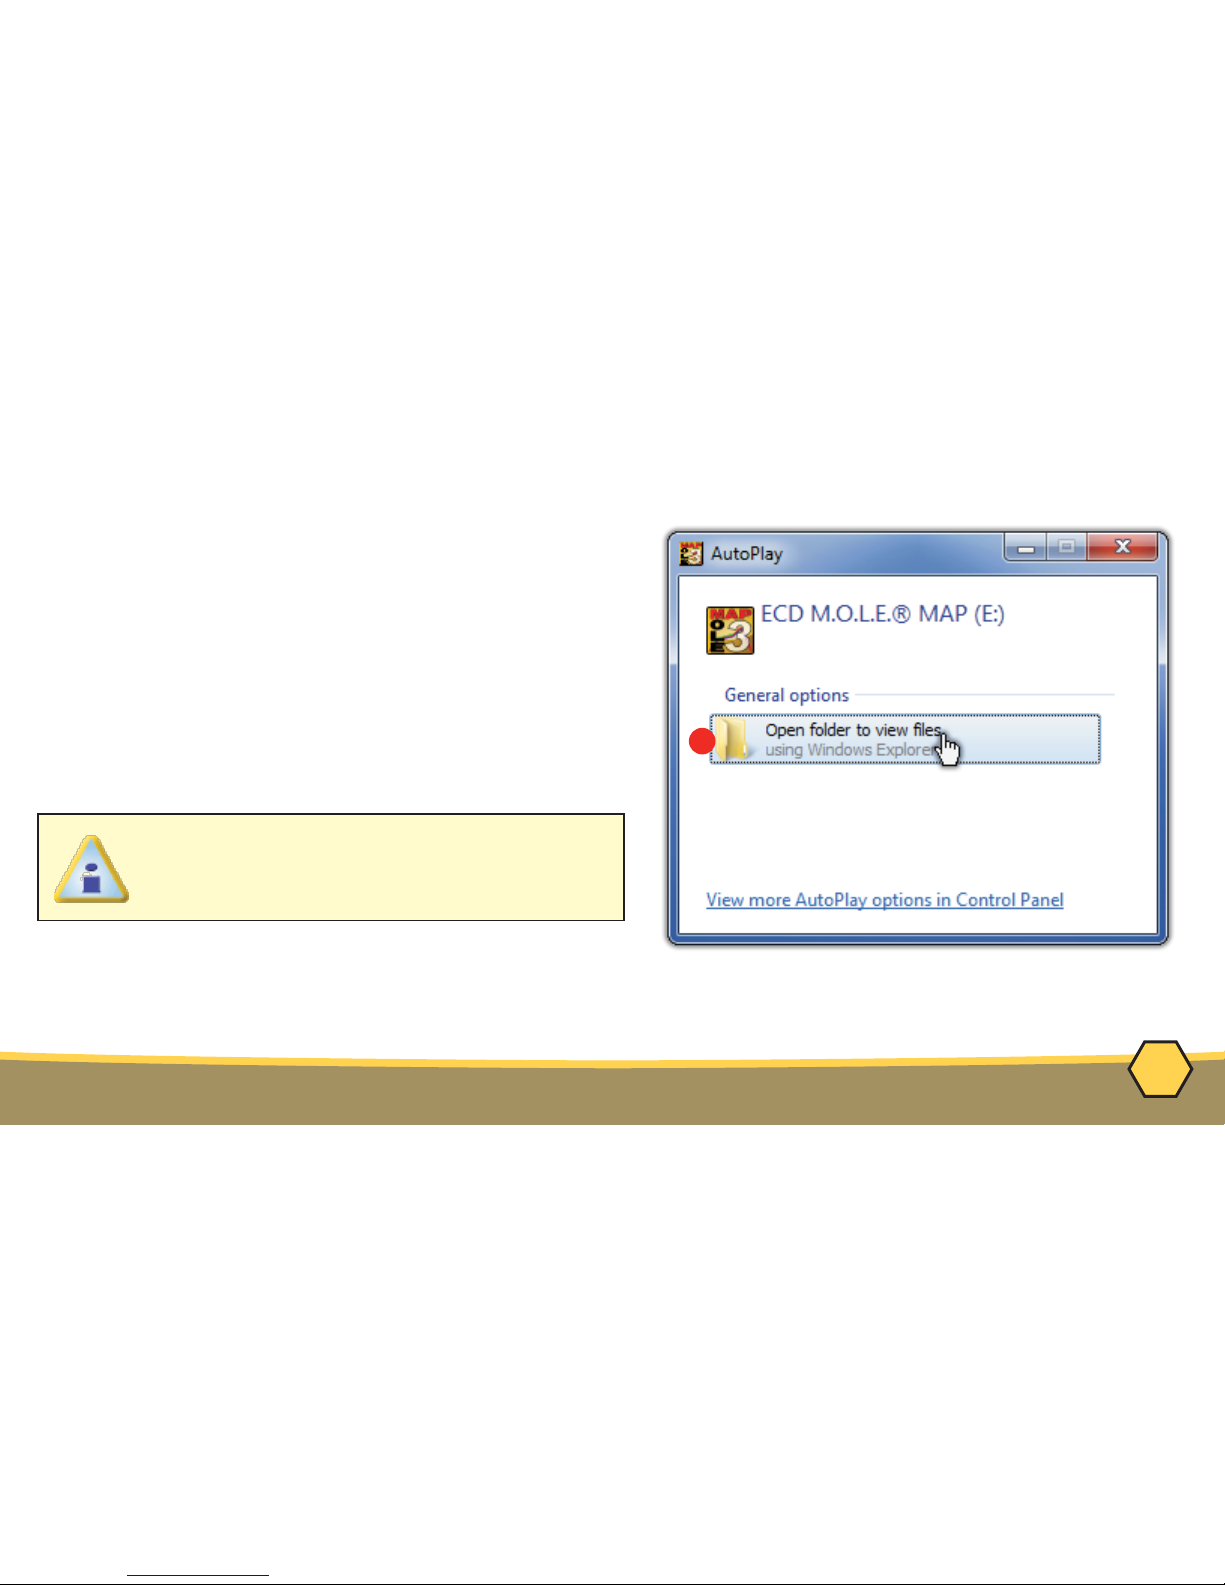
SETUP - SOFTWARE INSTALLATION
The user must have administrator permissions for the computer to install the software
1. Insert the Flash Drive in a USB Port and the
AutoPlay menu appears.
2. Select Open folder to view files button on the
AutoPlay menu to launch Windows® Explorer.
Closely follow the instructions for your operating
system. For detailed information view the
Installation Help file on the Flash Drive.
Page 8

1
2
3
7
1. Insert the USB computer interface cable into
a computer USB Port
2. Insert the other end into the Data/Charging
Port.
3. Start M.O.L.E.® MAP
SETUP - COMMUNICATIONS
Page 9

4
5
6
8
SETUP - COMMUNICATIONS
4. On the M.O.L.E.® menu, click the
Select Instrument command.
5. Select the desired instrument from the dialog
box. If there are none displayed, click the
Scan for Instruments command button to
detect all available instruments.
6. Click the OK command button to accept.
Page 10

9
OPERATION - INTRODUCTION
This operation procedure guides you through a typical process on how to set a
M.O.L.E.
®
Profiler up for performing a data run. For additional detail, consult the Help
System in the software.
The M.O.L.E.® Thermal Profiler depends on the MAP (Machine-Assembly-Process)
software to control how it collects and interprets data. Several kinds of data runs may
need to be performed to achieve desired information, or the same data run may be
performed repeatedly over time to monitor one process. Either way, each data run must
be set up at least once.
The MAP software includes wizards that help you get started quickly, even if you are a
beginner or infrequent user.
Page 11

4
1
10
OPERATION - SETUP INSTRUMENT
Step 1: Setup Instrument
1. Double-click the M.O.L.E.® MAP application icon to
start the software.
2. Connect the M.O.L.E.® Thermal Profiler to a computer.
3. Make sure the M.O.L.E.® Power Pack battery is fully
charged. When a M.O.L.E.® Thermal Profiler is
selected, the software status bar displays the current
battery voltage.
4. Set an Environment. Either open an existing
Environment Folder or create a new one.
Page 12
6
7
11
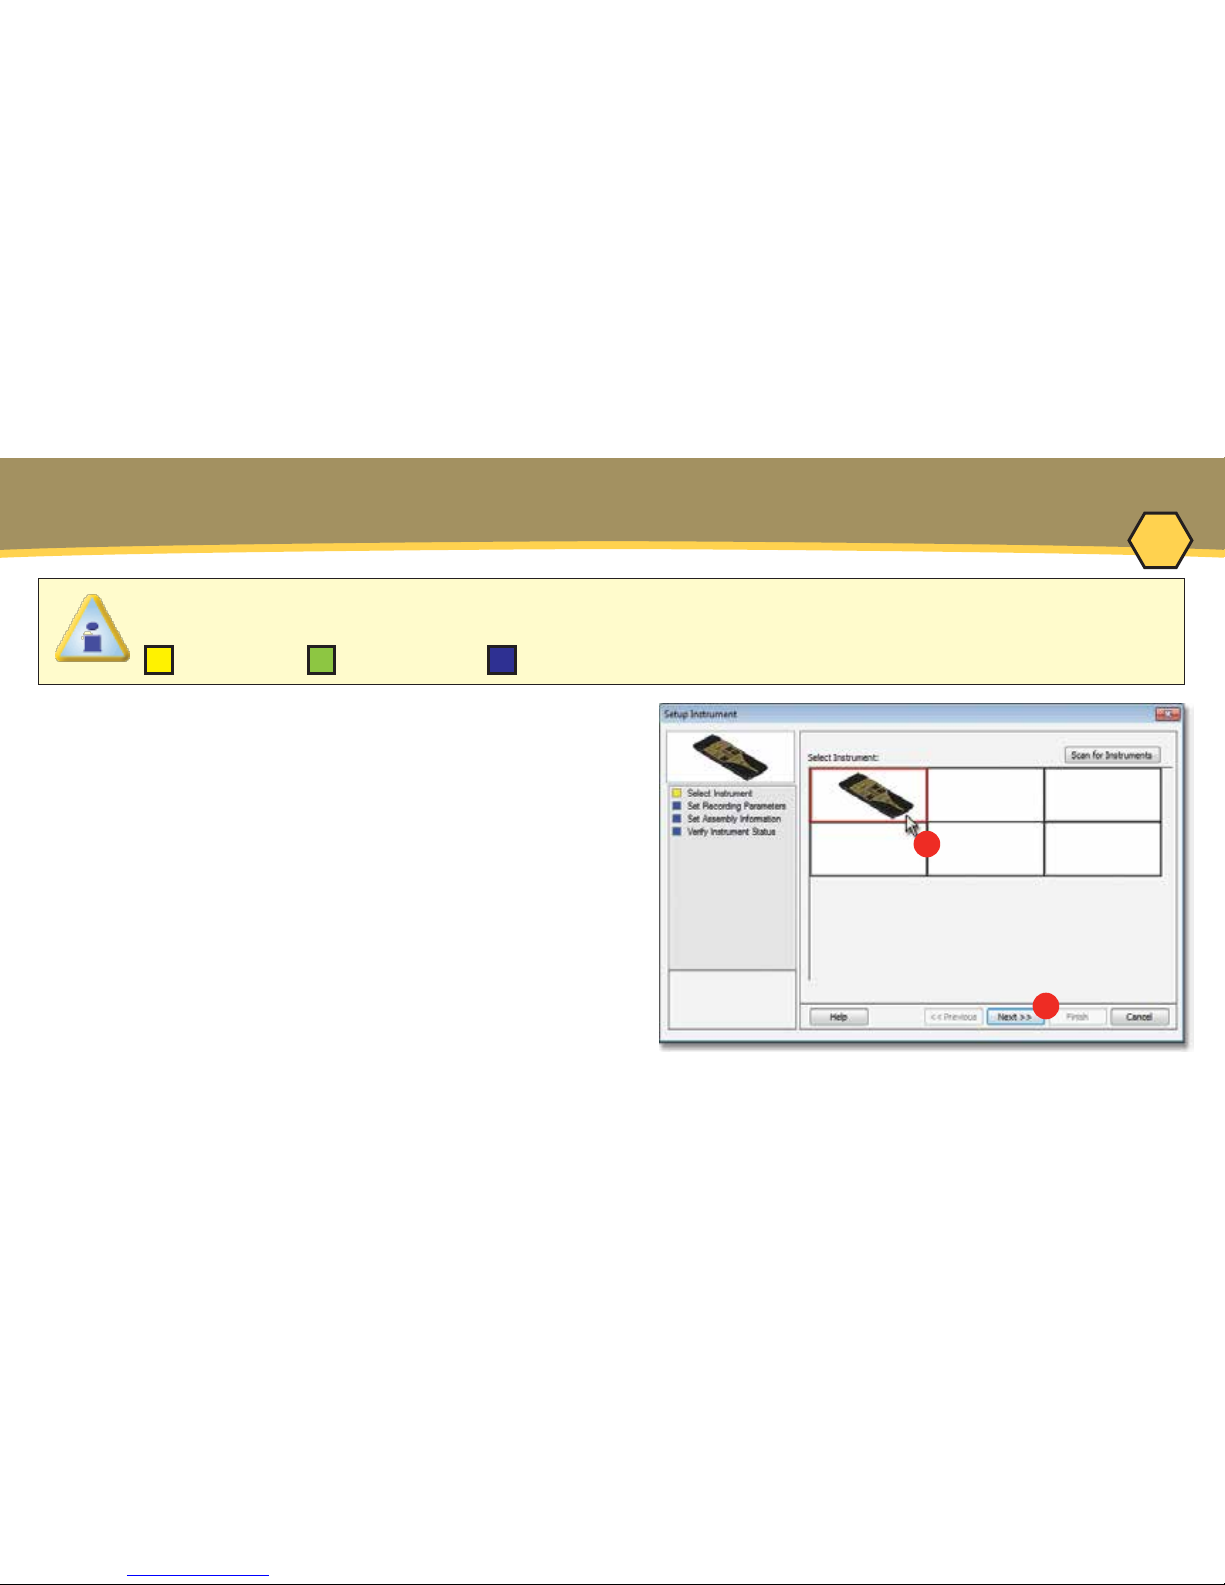
When navigating through the wizard, the step list on the left of the dialog box uses a color key to
inform the user of the progression through the wizard.
Completed RemainingCurrent
OPERATION - SETUP INSTRUMENT
5. On the M.O.L.E.® menu, select Setup
Instrument and the workflow wizard appears.
6. Select the desired M.O.L.E.® Thermal
Profiler from the dialog box. If a M.O.L.E.®
Thermal Profiler has already been selected
during a different process, the software
automatically selects the M.O.L.E.® Thermal
Profiler connected to the COM port previously
used.
7. Click the Next command button.
Page 13
9
8
11
10
10
12
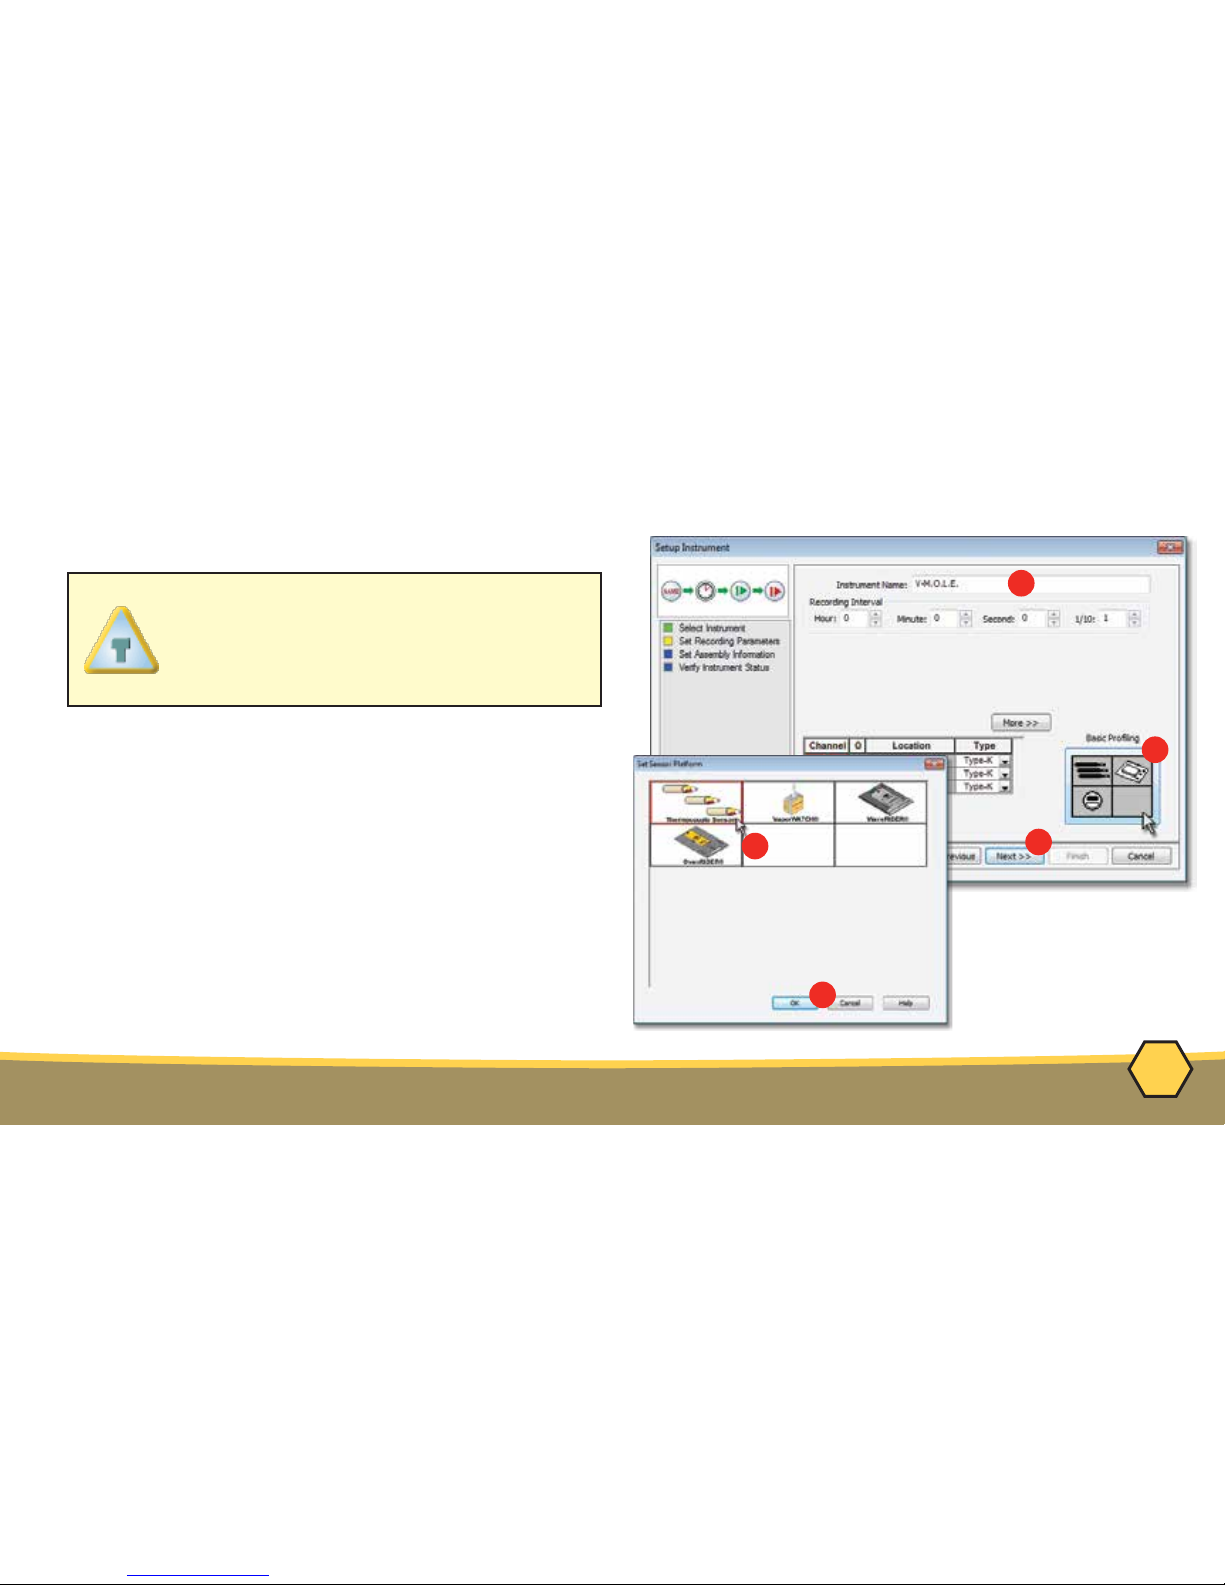
OPERATION - SETUP INSTRUMENT
8. Set the Instrument Name.
9. Select the Sensor Platform button.
10. Select the desired sensor type then the
OK command button to proceed.
11. Confirm the settings and then, select the
Next command button to send the data
listed in the dialog box to the instrument.
For settings such as Start Parame-
ters and Stop Parameters, select the
More>> command button.
Page 14

11
12
13
OPERATION - SETUP INSTRUMENT
11. Confirm the assembly information such as the
test Product Description, size, sensor
locations and a image.
12. Click the Next command button.
Page 15

13
14
14
13. Verify the instrument status. This dialog box
displays the health of the M.O.L.E.® Profiler
such as battery charge, internal temperature,
thermocouple temperatures. If the user selects
the Show Critical command button the dialog
box will only display items that will prevent the
user from completing a successful data run.
1
4. Select the Finish command button to complete
the Setup Instrument wizard.
If everything is OK, the dialog box displays a
GREEN sign. If there are any items that may
prevent the user from collecting good data,
they are highlighted and a RED sign is
displayed.
OPERATION - SETUP INSTRUMENT
Page 16

1
15
OPERATION - DATA COLLECTION
Step 2: Data Collection
1. Attach the Thermocouple sensors into the test
product.
Never permit the M.O.L.E.® Thermal Profiler to
exceed the absolute maximum warranteed
internal temperature, as permanent damage may
result. The warranty will not cover damage
caused by exceeding the maximum specified
internal temperature.
Page 17

2
3
4
16
When retrieving the M.O.L.E.® Profiler and
test product use caution as it may be warm.
2. Connect the M.O.L.E Profiler to the sensors.
3. Press the M.O.L.E. Profiler "ON" button.
4. Place the M.O.L.E. Profiler in the appropriate
Thermal Barrier and press the "Record" button.
5. Close the Thermal Barrier making sure the sensor
wires do not get pinched.
6. Pass the thermally protected M.O.L.E.® Profiler,
and test product through the process.
OPERATION - DATA COLLECTION
Page 18

8
17
If you remove sensors before the M.O.L.E.® Profiler
has stopped collecting data, it may cause the data to
become distorted.
7. As the M.O.L.E.® and test product emerge from the
process, remove the sensors from and lay the Thermal
Barrier on a table or flat surface.
8. Open the Thermal barrier and if the Record button is
still flashing this means the M.O.L.E.® Profiler is still logging
and it should be stopped.
9. Remove the M.O.L.E.® Profiler from the Thermal Barrier
and wait a few minutes for the M.O.L.E.® Profiler to cool.
Handle it carefully, as the case may still be warm.
10. Disconnect M.O.L.E.® Profiler from the sensors and
place it near the PC that has the MAP installed.
OPERATION - DATA COLLECTION
Page 19

3
1
18
OPERATION - DOWNLOAD DATA
Step 3: Download Data
1. Double-click the M.O.L.E.® MAP application
icon to start the software.
2. Connect the M.O.L.E.® Thermal Profiler to
a computer.
3. Select the Read Instrument command from the
M.O.L.E.® menu or toolbar and the workflow
wizard appears.
Page 20

4
5
19
OPERATION - DOWNLOAD DATA
4. Select the instrument from the dialog box
that was used with during the experiment. If a
M.O.L.E.® Profiler has already been selected
during a different process, the software
automatically selects the M.O.L.E.® Profiler
connected to the COM Port previously used.
5. Click the Next command button.
Page 21
6
6
20
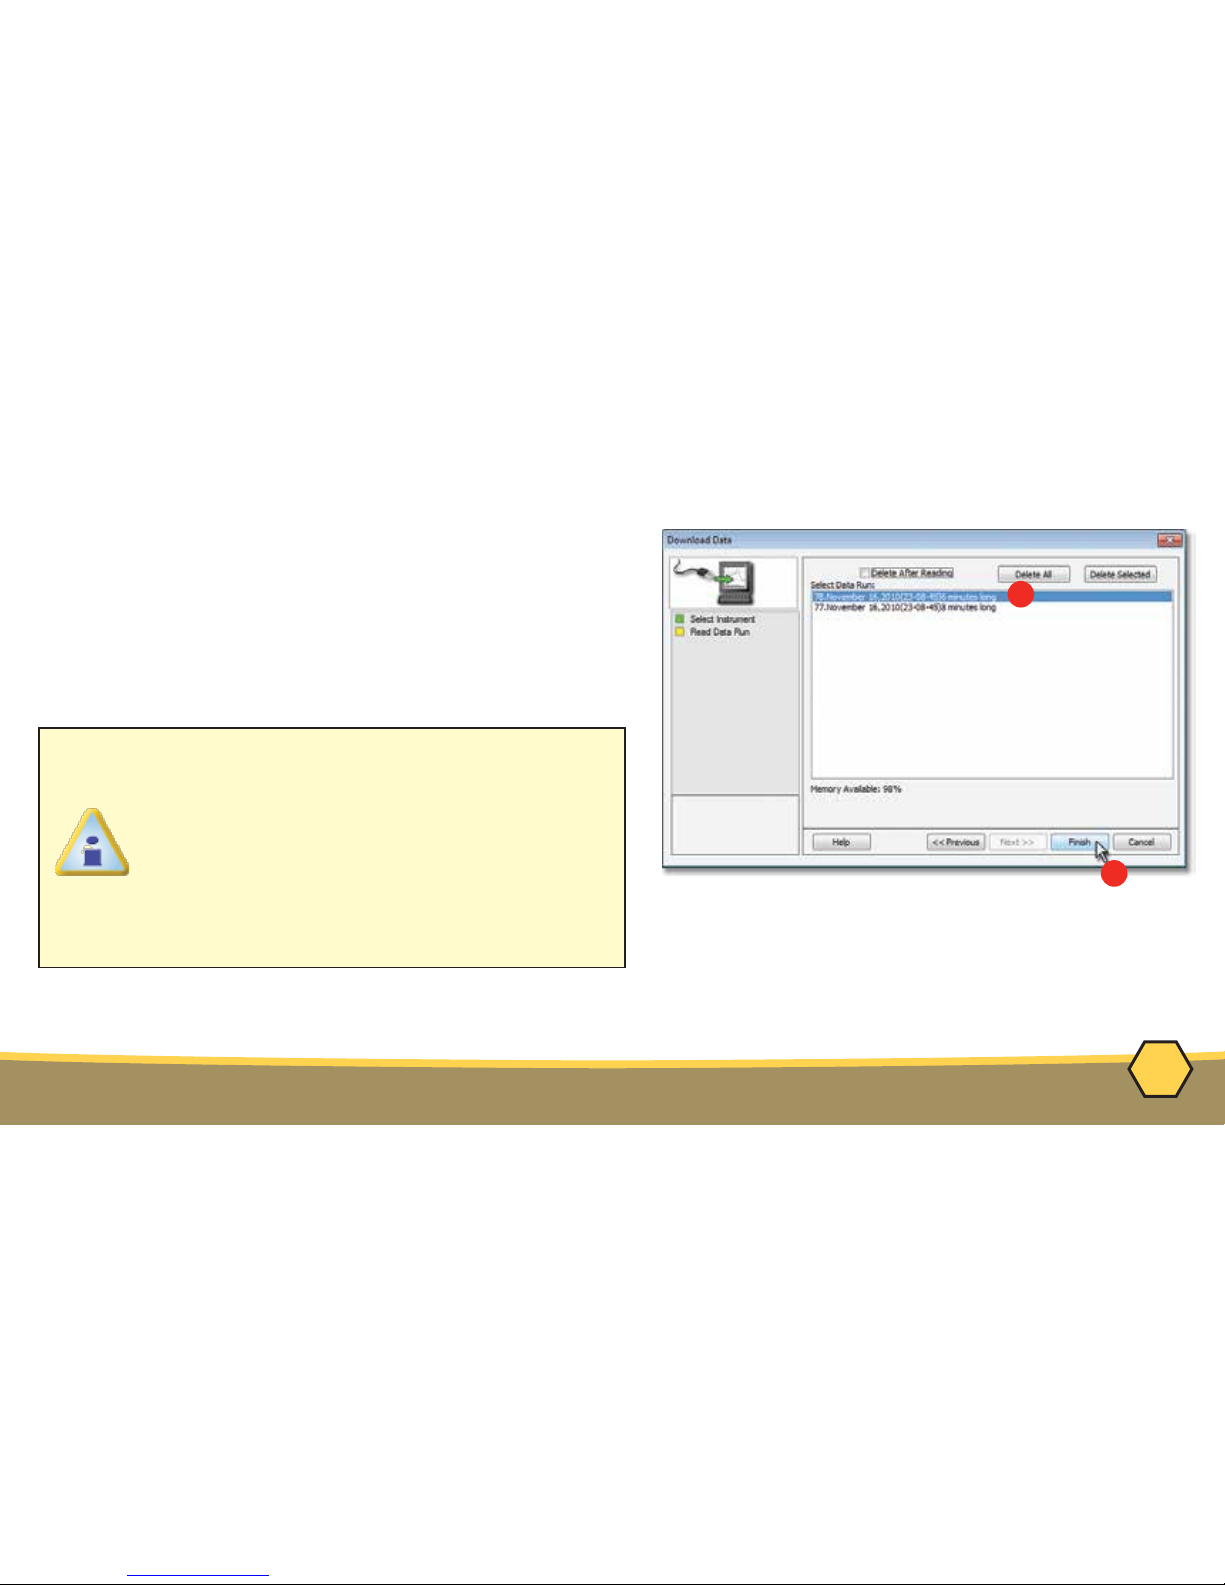
OPERATION - DOWNLOAD DATA
6. Select the desired data run and then click the
Finish command button to complete the wizard
and read the data run from the M.O.L.E.® Profiler.
When the data run has been downloaded, the
software will prompt the user to name and save
the data run file (*.XMG).
The information is automatically saved in the data run file (*.XMG) and the experiment data can
now be analyzed with the software tools.
If a data run (*.XMG) is saved in a different
Environment Folder other than the currently
selected, the software automatically
activates the new Environment Folder. This
process does not delete any data run files in
the previously set Environment Folder and
can be quickly accessed using the Recent
Environment Folders on the File menu.
Page 22

A48-0509-16 Rev-2.1
© 2007-2016 ECD. All Rights Reserved. Foreign and US Products of ECD are covered by US Patents and Patents Pending.
The trapezoidal ECD logo®, and M.O.L.E.® (Multi-Channel Occurrent Logger Evaluator) are registered trademarks of ECD.
World Headquarters
North & South America, Europe
4287-B S.E. International Way
Milwaukie, Oregon 97222-8825 U.S.A.
Tel: +1 503 659 6100 | +1 800 323 4548
Fax: +1 503 659 4422
Email: sales@ecd.com
Website: www.ECD.com
ECD Asia/Pacific
Singapore
Moble: +65 9692 6822
Email: ecd.asia@ecd.com
ECD Europe/Africa/Middle East
Warsaw Poland Office
Mobile: +48 512 659 100
E-Mail: ecd.europe@ecd.com
 Loading...