

Page 1
Bulletin F-DPW
Series DPW Digital Paddle Wheel Flow Meter
Specifications - Installation and Operating Instructions
DWYER INSTRUMENTS, INC.
P.O. BOX 373 • MICHIGAN CITY, INDIANA 46360, U.S.A. Fax: 219/872-9057 e-mail: info@dwyer-inst.com
Phone: 219/879-8000 www.dwyer-inst.com
Page 2

ABLE OF CONTENTS
T
. Unpacking the DPW Flow Meter . . . . . . . . . . . . . . . . . . . . . . . . . . . . . . . . . . . . .3
1
.1 Inspect Package for External Damage . . . . . . . . . . . . . . . . . . . . . . . . . . . . . .3
1
1.2 Unpack the DPW meter . . . . . . . . . . . . . . . . . . . . . . . . . . . . . . . . . . . . . . . . .3
1.3 Returning Merchandise for Repair . . . . . . . . . . . . . . . . . . . . . . . . . . . . . . . . .3
. DPW Flow Meters Technical Data . . . . . . . . . . . . . . . . . . . . . . . . . . . . . . . . . . .3
2
.1 Principles of Operation . . . . . . . . . . . . . . . . . . . . . . . . . . . . . . . . . . . . . . . . . .3
2
.2 Electrical Connections . . . . . . . . . . . . . . . . . . . . . . . . . . . . . . . . . . . . . . . . . .3
2
.2.1 Power Supply Connections . . . . . . . . . . . . . . . . . . . . . . . . . . . . . . . . . .3
2
2.2.2 Analog Output Signals Connections . . . . . . . . . . . . . . . . . . . . . . . . . . .4
2.2.3 Flow Sensor Pulse Output Signals Connections . . . . . . . . . . . . . . . . . .4
2.2.4 Programmable Optically Isolated Output Signals Connections . . . . . . .4
.2.5 Communication Parameters and Connections . . . . . . . . . . . . . . . . . . .4
2
.3 DPW Flow Meter Specification . . . . . . . . . . . . . . . . . . . . . . . . . . . . . . . . . . . .4
2
.4 DPW Maintenance . . . . . . . . . . . . . . . . . . . . . . . . . . . . . . . . . . . . . . . . . . . . .5
2
2.4.1 Sensors . . . . . . . . . . . . . . . . . . . . . . . . . . . . . . . . . . . . . . . . . . . . . . . . .5
2.4.2 DPW Paddle Wheel Disassembly . . . . . . . . . . . . . . . . . . . . . . . . . . . . .5
3. LCD Keypad Operation: Data Entry and Configuration . . . . . . . . . . . . . . . . . .5
.1 Display Indications (applicable for LCD options only) . . . . . . . . . . . . . . . . . .5
3
.1.1 DPW with RTD Option Process Information Screens . . . . . . . . . . . . . .5
3
.1.2 DPW without RTD Option Process Information Screens . . . . . . . . . . .6
3
3.2 Menu Sequence . . . . . . . . . . . . . . . . . . . . . . . . . . . . . . . . . . . . . . . . . . . . . . .6
3.3 Parameter Summary and Data Entry . . . . . . . . . . . . . . . . . . . . . . . . . . . . . . .7
4. Parameter Entry . . . . . . . . . . . . . . . . . . . . . . . . . . . . . . . . . . . . . . . . . . . . . . . . . .9
.1 Submenu Program Protection . . . . . . . . . . . . . . . . . . . . . . . . . . . . . . . . . . . .9
4
.2 Submenu Flow Meter Info . . . . . . . . . . . . . . . . . . . . . . . . . . . . . . . . . . . . . . .9
4
.2.1 Full Scale Flow . . . . . . . . . . . . . . . . . . . . . . . . . . . . . . . . . . . . . . . . . . .9
4
4.2.2 Communication Interface . . . . . . . . . . . . . . . . . . . . . . . . . . . . . . . . . . . .9
4.2.3 RTD Hardware Option . . . . . . . . . . . . . . . . . . . . . . . . . . . . . . . . . . . . . .9
4.2.4 Analog Flow Output Settings . . . . . . . . . . . . . . . . . . . . . . . . . . . . . . . . .9
4.2.5 Analog Temperature Output Settings . . . . . . . . . . . . . . . . . . . . . . . . . . .9
4.2.6 Flow Meter EEPROM Data Base Version . . . . . . . . . . . . . . . . . . . . . . .9
4.2.7 Flow Meter Firmware Version . . . . . . . . . . . . . . . . . . . . . . . . . . . . . . . .9
4.2.8 Flow Meter Serial Number . . . . . . . . . . . . . . . . . . . . . . . . . . . . . . . . . .10
4.2.9 Flow Meter Model Number . . . . . . . . . . . . . . . . . . . . . . . . . . . . . . . . .10
4.2.10 Fluid Name . . . . . . . . . . . . . . . . . . . . . . . . . . . . . . . . . . . . . . . . . . . . .10
4.2.11 Flow Meter Calibration Date . . . . . . . . . . . . . . . . . . . . . . . . . . . . . . .10
4.2.12 Flow Meter Calibration Date Due . . . . . . . . . . . . . . . . . . . . . . . . . . .10
4.2.13 Flow Meter User Tag Name . . . . . . . . . . . . . . . . . . . . . . . . . . . . . . . .10
4.3 Submenu Measuring Units . . . . . . . . . . . . . . . . . . . . . . . . . . . . . . . . . . . . . .10
4.3.1 User Defined Measuring Unit . . . . . . . . . . . . . . . . . . . . . . . . . . . . . . . .10
4.3.1.a User Defined Unit Factor Numeric Entry . . . . . . . . . . . . . . . . . . . . .10
4.3.1.b User Defined Unit Time Base Tabular Entry . . . . . . . . . . . . . . . . . . .10
4.3.1.c User Defined Unit Density Support Tabular Entry . . . . . . . . . . . . . . .11
4.4 Submenu Flow Alarm . . . . . . . . . . . . . . . . . . . . . . . . . . . . . . . . . . . . . . . . . .11
4.4.1 Flow Alarm Mode Tabular Entry . . . . . . . . . . . . . . . . . . . . . . . . . . . . . .11
4.4.2 Low Flow Alarm Numerical Entry . . . . . . . . . . . . . . . . . . . . . . . . . . . . .11
4.4.3 High Flow Alarm Numerical Entry . . . . . . . . . . . . . . . . . . . . . . . . . . . .11
4.4.4 Flow Alarm Action Delay Numerical Entry . . . . . . . . . . . . . . . . . . . . . .11
4.4.5 Flow Alarm Action Latch Tabular Entry . . . . . . . . . . . . . . . . . . . . . . . .11
4.5 Submenu Temperature Alarm (*optional) . . . . . . . . . . . . . . . . . . . . . . . . . . .11
4.5.1 Temperature Alarm Mode Tabular Entry . . . . . . . . . . . . . . . . . . . . . . .11
4.5.2 Low Temperature Alarm Numerical Entry . . . . . . . . . . . . . . . . . . . . . .12
4.5.3 High Temperature Alarm Numerical Entry . . . . . . . . . . . . . . . . . . . . . .12
4.5.4 Temperature Alarm Action Delay Numerical Entry . . . . . . . . . . . . . . . .12
4.5.5 Temperature Alarm Action Latch Tabular Entry . . . . . . . . . . . . . . . . . .12
4.6 Submenu Main Totalizer . . . . . . . . . . . . . . . . . . . . . . . . . . . . . . . . . . . . . . .12
4.6.1 Main Totalizer Mode Tabular Entry . . . . . . . . . . . . . . . . . . . . . . . . . . .12
4.6.2 Main Totalizer Flow Start Numerical Entry . . . . . . . . . . . . . . . . . . . . . .12
4.6.3 Main Totalizer Event Volume Numerical Entry . . . . . . . . . . . . . . . . . . .12
4.6.4 Main Totalizer Reset Tabular Entry . . . . . . . . . . . . . . . . . . . . . . . . . . .13
.7 Submenu Pilot Totalizer . . . . . . . . . . . . . . . . . . . . . . . . . . . . . . . . . . . . . . . .13
4
.7.1 Pilot Totalizer Mode Tabular Entry . . . . . . . . . . . . . . . . . . . . . . . . . . . .13
4
.7.2 Pilot Totalizer Flow Start Numerical Entry . . . . . . . . . . . . . . . . . . . . . .13
4
.7.3 Pilot Totalizer Event Volume Numerical Entry . . . . . . . . . . . . . . . . . . .13
4
4.7.4 Pilot Totalizer Reset Tabular Entry . . . . . . . . . . . . . . . . . . . . . . . . . . . .13
4.8 Submenu Optical Outputs Numerical Entry . . . . . . . . . . . . . . . . . . . . . . . .13
4.9 Submenu Flow Meter Configuration . . . . . . . . . . . . . . . . . . . . . . . . . . . . . .13
.9.1 Submenu Flow Meter Low Flow Cut–off Numerical Entry . . . . . . . . . .13
4
.9.2 Submenu Pulse Number Measure Interval Numerical Entry . . . . . . . .13
4
.9.3 Submenu Flow Meter Calibration Factor Numerical Entry . . . . . . . . .14
4
.9.4 Submenu Flow Meter Measure Mode Tabular Entry . . . . . . . . . . . . . .14
4
4.9.5 Submenu Noise Reduction Filter Damping Time Numerical Entry . . .14
4.9.6 Submenu Noise Reduction Filter Sample Number Numerical Entry . .14
4.9.7 Submenu Flow Linearizer Tabular Entry . . . . . . . . . . . . . . . . . . . . . . .14
.9.8 Submenu Fluid Density Numerical Entry . . . . . . . . . . . . . . . . . . . . . . .14
4
.9.9 Submenu Pilot Calibration timer Tabular Entry . . . . . . . . . . . . . . . . . .14
4
.10 Submenu LCD Back Light Numerical Entry . . . . . . . . . . . . . . . . . . . . . . . .14
4
4.11 Submenu Alarm Events Log . . . . . . . . . . . . . . . . . . . . . . . . . . . . . . . . . . . .15
4.11.1 Submenu Alarm Events Log Status . . . . . . . . . . . . . . . . . . . . . . . . . .15
4.11.2 Submenu Alarm Events List . . . . . . . . . . . . . . . . . . . . . . . . . . . . . . . .15
4.11.3 Submenu Alarm Events Log Mask . . . . . . . . . . . . . . . . . . . . . . . . . . .15
.12 Submenu Diagnostic . . . . . . . . . . . . . . . . . . . . . . . . . . . . . . . . . . . . . . . . .15
4
.12.1 Submenu Raw Pulses Count . . . . . . . . . . . . . . . . . . . . . . . . . . . . . . .15
4
.12.2 Submenu Pulse Frequency . . . . . . . . . . . . . . . . . . . . . . . . . . . . . . . .15
4
4.12.3 Submenu Raw RTD reading (RTD option only) . . . . . . . . . . . . . . . .15
4.12.4 Submenu DAC_A Flow Output . . . . . . . . . . . . . . . . . . . . . . . . . . . . .16
4.12.5 Submenu DAC_B Temperature Output . . . . . . . . . . . . . . . . . . . . . . .16
4.12.6 Submenu CPU Temperature . . . . . . . . . . . . . . . . . . . . . . . . . . . . . . .16
.12.7 Submenu Raw VCC Reading . . . . . . . . . . . . . . . . . . . . . . . . . . . . . .16
4
. Analog Output Signals . . . . . . . . . . . . . . . . . . . . . . . . . . . . . . . . . . . . . . . . . . .16
5
5.1 Analog Output Signals Configuration . . . . . . . . . . . . . . . . . . . . . . . . . . . . . .16
5.2 Analog Output Signals Calibration . . . . . . . . . . . . . . . . . . . . . . . . . . . . . . . .16
5.2.1 Initial Setup . . . . . . . . . . . . . . . . . . . . . . . . . . . . . . . . . . . . . . . . . . . . .16
5.2.2 Flow 0 to 5 Vdc Analog Output Calibration . . . . . . . . . . . . . . . . . . . . .16
5.2.3 Flow 4 to 20 mA Analog Output Calibration . . . . . . . . . . . . . . . . . . . . .16
5.2.4 Temperature 0 to 5 Vdc Analog Output Calibration* . . . . . . . . . . . . . .17
5.2.5 Temperature 4 to 20 mA Analog Output Calibration* . . . . . . . . . . . . . .17
6. DPW Flow Calibration Procedures . . . . . . . . . . . . . . . . . . . . . . . . . . . . . . . . . .17
6.1 Connections and Initial Warm Up . . . . . . . . . . . . . . . . . . . . . . . . . . . . . . . . .17
6.2 Flow Meter Span Calibration . . . . . . . . . . . . . . . . . . . . . . . . . . . . . . . . . . . .17
6.3 Flow Meter Linearization Table Calibration . . . . . . . . . . . . . . . . . . . . . . . . .17
7. RS-485/RS-232 Software Interface Commands . . . . . . . . . . . . . . . . . . . . . . . .18
7.1 General . . . . . . . . . . . . . . . . . . . . . . . . . . . . . . . . . . . . . . . . . . . . . . . . . . . . .18
7.2 Commands Structure . . . . . . . . . . . . . . . . . . . . . . . . . . . . . . . . . . . . . . . . . .18
7.3 ASCII Commands Set . . . . . . . . . . . . . . . . . . . . . . . . . . . . . . . . . . . . . . . . .18
8. Troubleshooting . . . . . . . . . . . . . . . . . . . . . . . . . . . . . . . . . . . . . . . . . . . . . . . . .22
8.1 Common Conditions . . . . . . . . . . . . . . . . . . . . . . . . . . . . . . . . . . . . . . . . . . .22
Appendix I DPW EEPROM Variables . . . . . . . . . . . . . . . . . . . . . . . . . . . . . . .23
Appendix II Component Diagram Top Side . . . . . . . . . . . . . . . . . . . . . . . . . .24
Appendix III Dimensional Drawing . . . . . . . . . . . . . . . . . . . . . . . . . . . . . . . . .25
Appendix IV Warranty . . . . . . . . . . . . . . . . . . . . . . . . . . . . . . . . . . . . . . . . . . . .25
Component Diagram Bottom Side . . . . . . . . . . . . . . . . . . . . . . .24
Page 2
Page 3
. UNPACKING THE DPW
1
.1 - Inspect Package for External Damage
1
our DPW Digital Paddle Wheel was carefully packed in a sturdy cardboard carton,
Y
ith antistatic cushioning materials to withstand shipping shock. Upon receipt,
w
inspect the package for possible external damage. In case of external damage to
the package contact the shipping company immediately.
.2 - Unpack the DPW meter
1
pen the carton carefully from the top and inspect for any sign of concealed
O
hipping damage. In addition to contacting the shipping carrier please forward a
s
opy of any damage report to your distributor or Dwyer
c
®
irectly. When unpacking
d
the instrument please make sure that you have all the items indicated on the
Packing List. Please report any shortages promptly.
.3 - Returning Merchandise for Repair
1
AINTENANCE/REPAIR
M
pon final installation of the Series DPW, no routine maintenance is required. The
U
Series DPW is not field serviceable and should be returned if repair is needed. Field
repair should not be attempted and may void warranty.
WARRANTY/RETURN
efer to “Terms and Conditions of Sales” in our catalog and on our website. Contact
R
ustomer service to receive a Return Goods Authorization number before shipping
c
he product back for repair. Be sure to include a brief description of the problem
t
plus any additional application notes
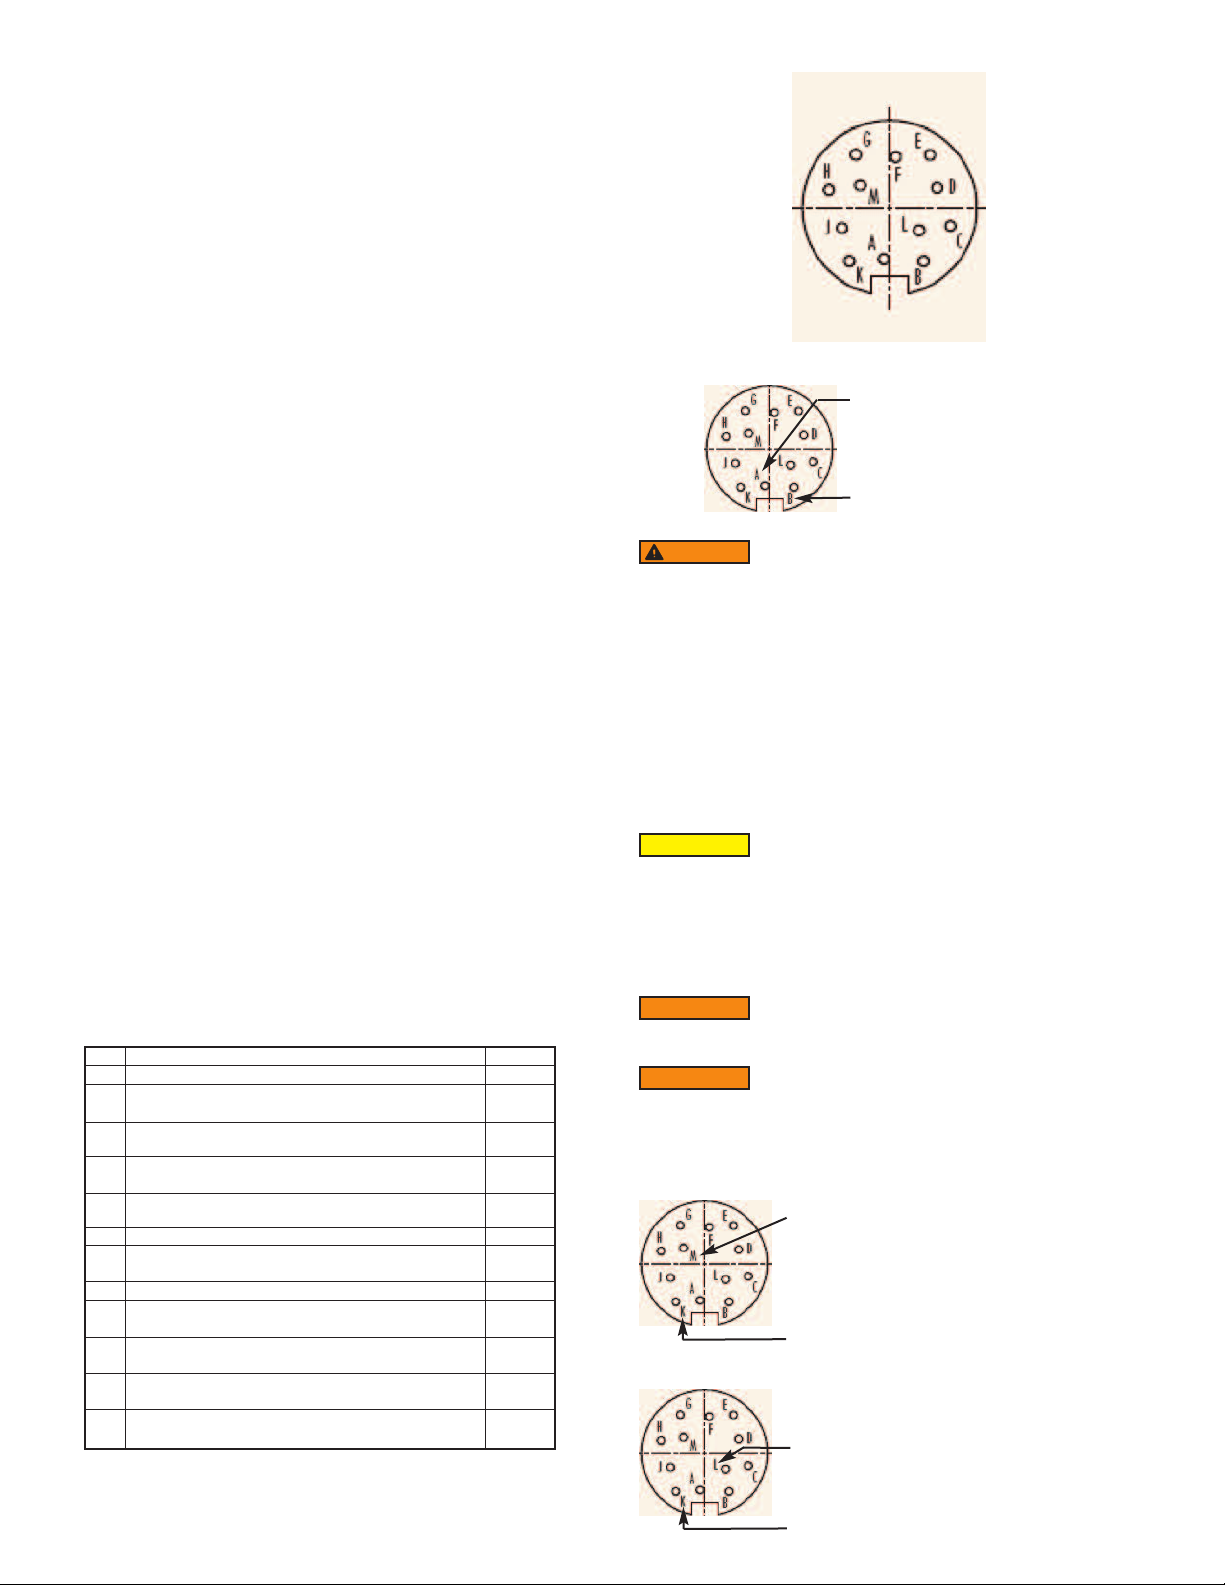
igure - 1: DPW 12 Pin "M16" Connector Configuration
F
Pin A ------------- DC Power (+)
in B ------------- DC Power (-)
P
2. DPW FLOW METERS TECHNICAL DATA
2.1 - Principles of Operation
PW liquid flow meters consist of a meter body that is installed in-line in a conduit
D
ystem. Inside, between the inlet and the outlet connections is a rotary wheel with
s
ermanent magnets embedded at 180 degrees in paddles.
p
Fluid flowing through the meter causes the paddle to spin. A magnetic sensor picks
up the frequency of pulses, and the readings are proportional to the liquid flow
taking place. The number of pulses per unit time interval and a K-factor (pulses/unit
of flow) facilitate determining the volumetric rate of flow through the meter.
Additionally, the DPW Flow Meter incorporates a Microcontroller driven circuitry
and non-volatile memory that stores all hardware specific variables. The flow rate
can be displayed in 29 different volumetric or mass flow engineering units. Flow
meter parameters and functions can be programmed remotely via the RS-232/RS485 interface or locally via optional LCD/KeyPad. DPW flow meters support various
functions including: two programmable flow totalizers, low, high or range flow and
temperature alarms, 2 programmable optically isolated outputs, 0 to 5 Vdc / 4 to 20
mA analog outputs (jumper selectable) for each process (flow and temperature)
variable, self diagnostic alarm. Optional local 2x16 LCD readout with adjustable
back light provides flow rate, temperature, total volume reading in currently
selected engineering units, diagnostic events indication and feature a password
protected access to the process parameters to ensure against tampering or
resetting.
2.2 - Electrical Connections
DPW flow meter is supplied with “M16” cylindrical 12 pin connector. Pin diagram is
presented in Figure b-1.
DPW FUNCTION
PIN
Plus Power Supply (+ DC power 11 to 26 Vdc)
A
Minus Power Supply, (- DC power 11 to 26 Vdc),
B
Digital Common
Flow Sensor Pulse Output (active), 3.3Vdc 3K min.
C
load impedance
Digital Communication interface, RS485 (-)
D
(Optional RS232 TX)
Digital Communication interface, RS485 (+)
E
(Optional RS232 RX)
Optical Output No.1 Plus (+) (passive)
F
Optical Output No.1 Minus (-) (passive)
G
TYPE
+Power
-Power,
Common
Output
Only
Input
/Output
Input
/Output
Input
Return
for Pin F
Optical Output No.2 Plus (+) (passive)
H
Optical Output No.2 Minus (-) (passive)
J
Input
Return
for Pin H
Common, Analog Signal Ground For Pins L & M,
K
(4 to 20 mA return)
Temp. Analog Output Plus (+) 0 to 5 Vdc or 4 to 20 mA,
L
jmp. selectable
Flow Analog Output Plus (+), 0 to 5 Vdc or 4 to 20 mA,
M
jmp. selectable
Signal
Common
Output
Only
Output
Only
ARNING
W
o avoid risk of serious injury or death, make sure power is OFF when connecting
T
r disconnecting any cables in the system.
o
Do not apply power voltage above 2 Vdc. Doing so will cause
PW damage or faulty operation.
D
The (+) and (-) power inputs are each protected by a 300 mA M (medium time-lag)
resettable fuse. If a shorting condition or polarity reversal occurs, the fuse will cut
power to the flow transducer circuit. Disconnect the power to the unit, remove the
faulty condition, and reconnect the power. The fuse will reset once the faulty
condition has been removed.
Use of the DPW flow meter in a manner other than that specified in this manual or
in writing from Dwyer
®
, may impair the protection provided by the equipment.
2.2.2 Analog Output Signals Connections
CAUTION
When connecting the load to the output terminals, do not
exceed the rated values shown in the specifications. Failure to
do so might cause damage to this device. Be sure to check if the wiring and the
polarity of the power supply is correct before turning the power ON. Wiring error
may cause damage or faulty operation.
DPW series Flow Meters are equipped with either calibrated 0 to 5 or calibrated 4
to 20 mA output signals (jumper selectable). This linear output signal represents
0 to 100% of the flow meter’s full scale range.
WARNING
The 4 to 20 mA current loop output is self-powered (sourcing
type, non-isolated). Do NOT connect an external voltage source
to the output signals.
WARNING
Observe jumper configuration before connecting 4 to 20 mA
current loop load. Failure to make proper jumper configuration
(see Figure 5-1) may cause damage for output circuitry. Do NOT connect an
external voltage source to the output signals.
Flow 0 to 5 VDC or 4 to 20 mA output signal connection:
Pin M ------------ (+) Plus Flow Analog Output
Pin K ------------ (-) Minus Flow Analog Output
Temperature 0 to 5 VDC or 4 to 20 mA output signal connection (optional):
Pin L ------------(+) Plus Temperature Analog Output
Page 3
Pin K ------------ (-) Minus Temperature Analog Output
Page 4
o eliminate the possibility of noise interference, use a separate cable entry for the
T
C power and analog signal lines (pins L, M, K on “M16” connector).
D
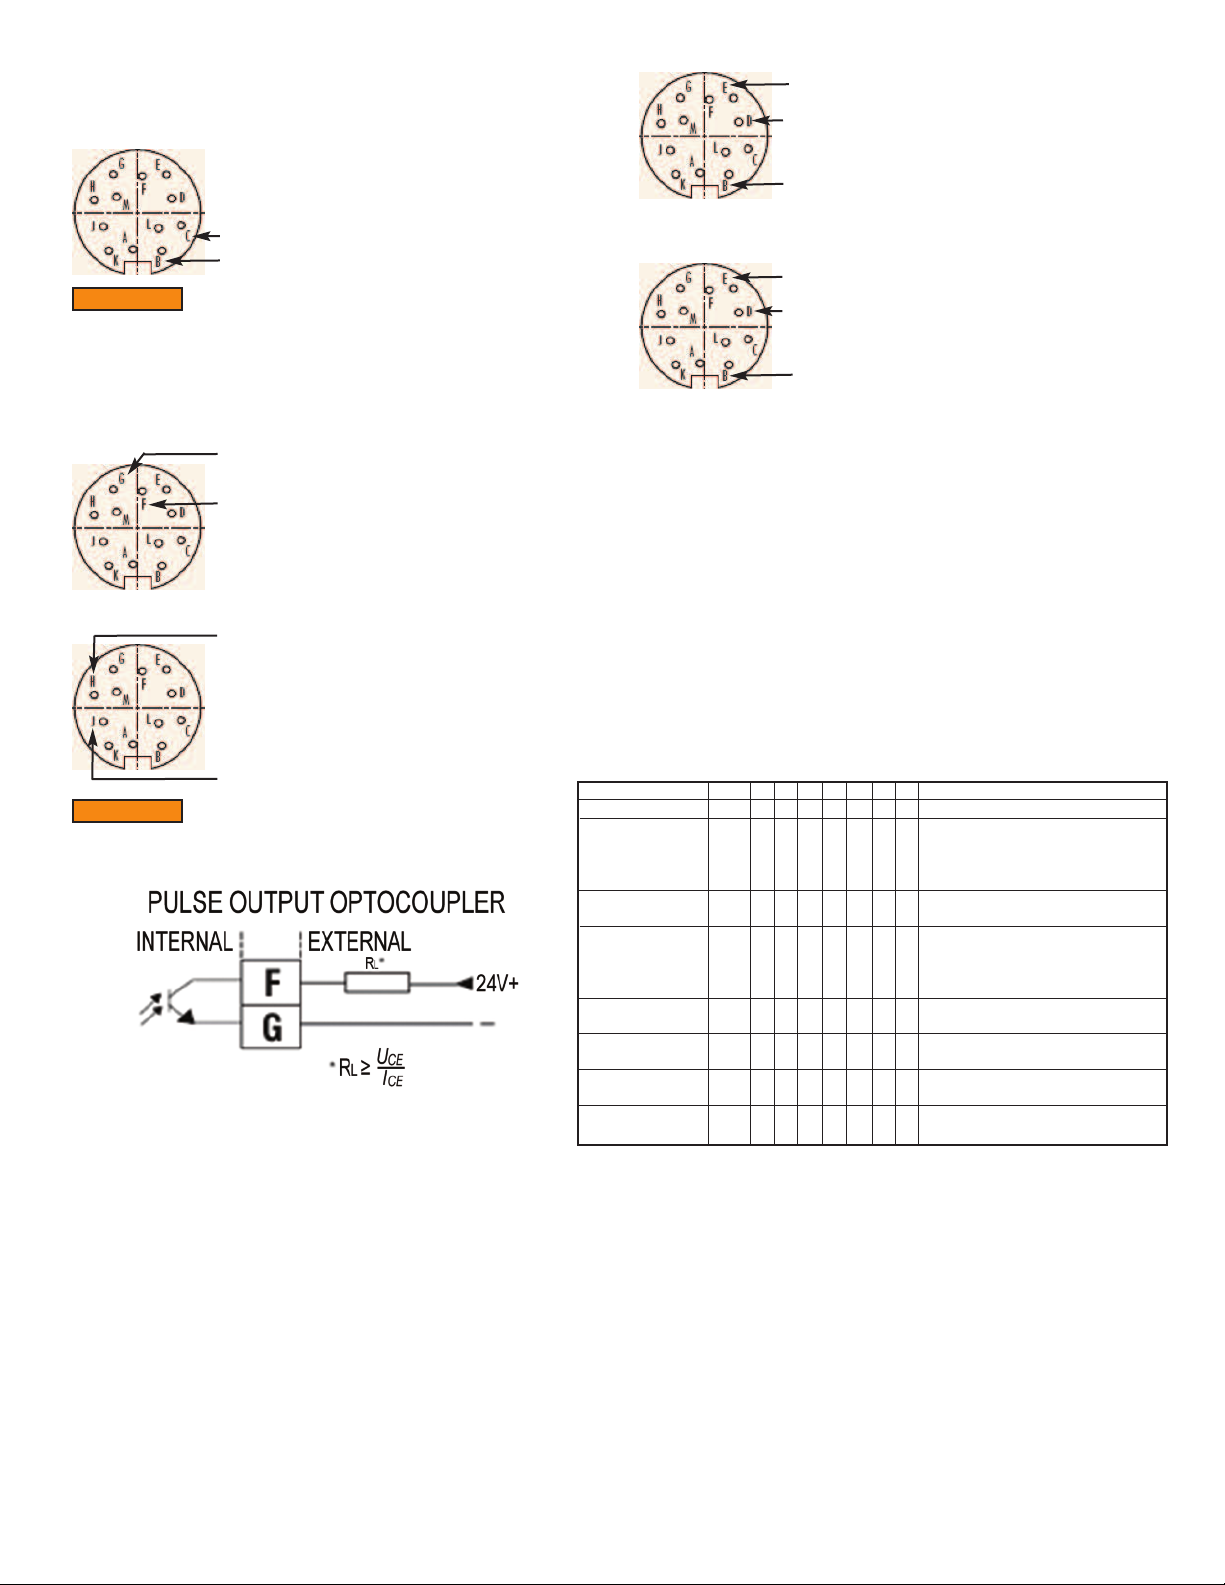
.2.3 Flow Sensor Pulse Output Signals Connections
2
in C -------- (+) Flow Sensor Pulse Output (active), 3.3Vdc
P
in B ------------ DC Power (-), Digital Common
P
WARNING
onnect an external voltage source to the pulse output signals. Use load with
c
nput impedance more than 30K is recommended.
i
2.2.4 Programmable Optically Isolated Output Signals Connections
Optocoupler #1 (pins F and G):
ptocoupler #2 (pins H and J):
O
WARNING
voltage and current provided below:
2.2.5 Communication Parameters and Connections
The digital interface operates via RS485 (optional RS-232) and provides access to
applicable internal data including: flow, temperature, totalizers and alarm settings,
flow linearizer table, fluid density and engineering units selection.
The flow sensor pulse output is self-powered (open drain,
ulled up with 10K resistor to internal 3.3Vdc rail). Do NOT
p
Pin G ------------ Plus (-) (passive)
in F ------------ Plus (+) (passive)
P
in H ------------ Plus (+) (passive)
P
Pin J ------------ Plus (-) (passive)
Optically isolated outputs require application of DC voltage
across terminals. Do not exceed maximum allowed limits for
in E ------------ RS-485 T(+) or R(+)
P
in D ------------ RS-485 T(-) or R(-)
P
Pin B ------------ RS-485 GND (if available)
S-232 communication interface connection:
R
rossover connection has to be established:
C
Pin E ------------ RS-232 TX
Pin D ------------ RS-232 RX
in B ------------ RS-232 SIGNAL GND
P
2.3 - SPECIFICATIONS
Service: Liquids compatible with wetted materials.
etted Materials:
W
PW-XP: Polypropylene and fluoroelastomer O-rings, PVDF and nickel
D
DPW-XT: PVDF and fluoroelastomer O-rings, PVDF and zirconia ceramic
Accuracy: ±1% FS.
Repeatability: ±0.25% FS.
esponse Time: 1 second above 10% of FS, 2 seconds below 10% of FS.
R
utput Signal: Linear 0 to 5 VDC (3000 Ω min. load impedance); 4 to 20 mA (500
O
max. loop resistance).
Ω
Pulse Output: 3.3 VDC, 3K min. load impedance.
Digital Interface: RS-232; RS-485.
Temperature Limits: 14 to 140°F (-10 to 60°C).
Pressure Limit: 10 bar (150 psig).
Power Requirements: 11 to 26 VDC.
Display: 2 row, 16 character LCD with backlight (optional).
Process Connections: Female NPT.
Weight: 1.60 lb (0.73 kg).
Example
Series
Orifice Size
(Flow Range)
Material Lower
Block
Seals
Display/Keypad
RTD Option
Output Signal
Digital Interface
ungsten carbide paddlewheel, acrylic lid.
t
paddlewheel, PVDF lid; Bearings: PVDF sapphire.
P
E
L
DPW
DPW
05
05
10
17
35
P
T
N
E
T
B
V
N
L
N
R
(pin 3 on the DB9 connector)
pin 2 on the DB9 connector)
(
(pin 5 on the DB9 connector)
2
A
DPW-05-ELN-A2
Flow Transmitter
0.04 to 5 gal/min (0.15 to 18.9 L/min)
0.08 to 10 gal/min (0.3 to 37.6 L/min)
0.15 to 17 gal/min (0.6 to 64.4 L/min)
0.35 to 35 gal/min (1.3 to 132.5 L/min)
Polypropylene
PVDF
EPDM
PTFE
Buna-N
Fluorelastomer
No Display/No Keypad
LCD/Keypad
No RTD
RTD
0 to 5 VDC
A
4 to 20 mA
B
RS-232
2
RS-485
5
Communication Settings for RS-485/RS-232 communication interface:
Baud rate: ------------ 9600 baud
Stop bit: ------------ 1
Data bits: ------------ 8
Parity: ------------ None
Flow Control: ------------ None
RS-485 communication interface connection:
The RS485 converter/adapter must be configured for: multidrop, 2 wire, half duplex
mode. The transmitter circuit must be enabled by TD or RTS (depending on which
is available on the converter/adapter). Settings for the receiver circuit should follow
the selection made for the transmitter circuit in order to eliminate echo
.
Page 4
Page 5

.LCD KEYPAD OPERATION: DATA ENTRY AND CONFIGURATION
3
applicable for LCD options only)
(
.1 - Display Indications
3
Initially, after the power is first turned on, the flow meter model number is shown in
the first line of the display and the revisions for EPROM table and firmware in the
econd line. Subsequently the actual process information is displayed. The
s
nstantaneous flow rate is displayed on the first line in percent or in direct reading
i
nits with flow alarm status indication. For flow meters without RTD option, the
u
ain totalizer value, up to 9 digits (including decimal), is displayed in the second
m
line with its corresponding units.
For flow meters with RTD option, the temperature reading value in deg C, is
isplayed in the second line with temperature alarm status indication. This display
d
s designated as process information (PI) screen throughout the remainder of this
i
anual.
m
The temperature value (applicable for RTD option only) in deg F can be displayed
in the PI screen by pressing the ENT pushbutton. The temperature indication can
be switched from deg C to deg F and back by pressing ENT push button.
Fw: A001 Tbl: A001
ction: Keypad UP
A
i
5.001 Gl/min AD
20.1 C *******Gal
igure 3.6: DPW with RTD Option PI Screen with Flow Range,
F
emperature and Main Totalizer
T
Action: Keypad UP
i
MT: 60639.38 Gal
20.1 C 65.81 Gal
ction: Keypad UP
A
igure 3.7: DPW with RTD Option PI Screen with Main Totalizer,
F
Temperature and Pilot Totalizer
i
Figure 3.1: DPW First Banner Screen
5.001 Gl/min AD
20.1 C TA: D
Figure 3.2: DPW with RTD Option Initial Process Information Screen
Note: Actual content of the LCD screen may vary depending on the model and
device configuration.
5.001 Gl/min AD
MT: 60639.38 Gal
Figure 3.3: DPW without RTD option initial Process Information Screen
Based on flow meter configuration (with or without RTD option), different
parameters may be displayed in the PI screen by pressing the UP or DN
pushbuttons.
3.1.1 - DPW with RTD option Process Information Screens
Pressing UP and DN buttons from initial PI screen will switch display as following:
[Initial PI screen]
Action: Keypad UP
i
Action: Keypad UP
i
MT: 60639.38 Gal
PT: 65.81 Gal
Figure 3.8: DPW with RTD Option PI Screen with Main and Pilot Totalizers
Action: Keypad UP
i
5.001 Gl/min AD
20.1 C TA: D
Figure 3.9: DPW with RTD Option Initial Process Information Screen
Pressing UP button, pages through the PI screens in the forward direction.
Pressing DN button, pages through the PI screens in the reverse direction. When
the last PI screen is reached, the firmware "wraps around" and scrolls to the initial
PI screen once again.
5.001 Gl/min AD
MT: 60639.38 Gal
Figure 3.4: DPW with RTD Option Process Information
Screen with Main Totalizer
Action: Keypad UP
i
5.001 Gl/min AD
PT: 65.81 Gal
Figure 3.5: DPW with RTD Option Process Information
Screen with Pilot Totalizer
Page 5
Page 6
.1.2 - DPW without RTD option Process Information Screens
3
ressing UP and DN buttons from initial PI screen will switch display as following:
P
[Initial PI screen]
Action: Keypad UP
i
5.001 Gl/min AD
PT: 65.81 Gal
Figure 3.10: DPW Without RTD option PI Screen with Main and Pilot Totalizer
ction: Keypad UP
A
i
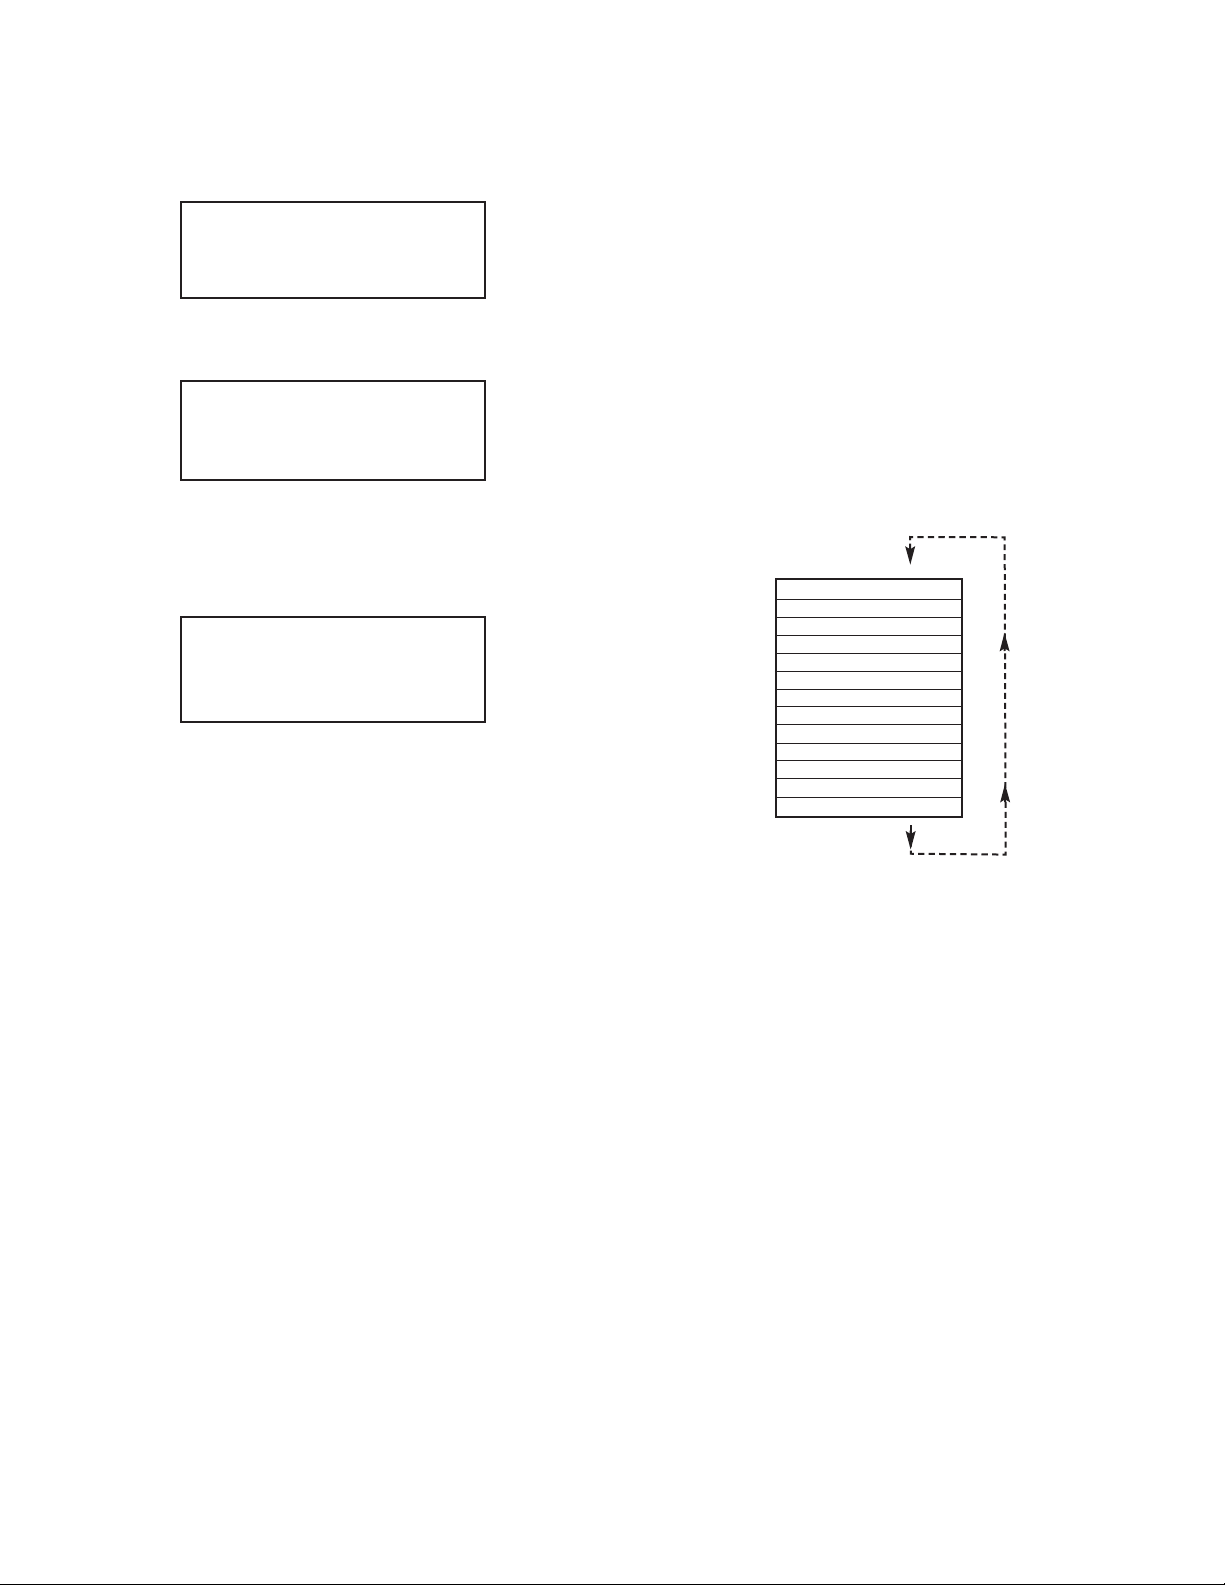
.2 Menu Sequence
3
he listing below gives a general overview of the standard top-level display menu
T
equence when running firmware version A002. The ESC pushbutton is used to
s
oggle between the process mode (PI screens) and the menu.
t
The listing in Section 3.2 shows the standard display menu sequence and
submenus using the UP button to move through the menu items. The first message
isplayed the first time the ESC button is pressed after the converter is powered up
d
s "Prog. Protection ON". Thereafter, pressing the ESC button while the flow meter
i
s in monitoring mode (PI screens) will display the parameter that was last exited.
i
Program Protection may be turned "off" by pressing the ENT button when the Prog.
Protection menu is displayed. The firmware will prompt with "Change Prog Prot”.
Pressing UP or DN button will toggle current protection status. If password is set to
ny value more than zero, the firmware will prompt with "Enter Prot Code". User
a
as to enter up to 3 digits program protection code, in order to be able to access
h
assword protected menus. Once correct password is entered, program protection
p
id turned off until unit is powered up again.
MT: 60639.38 Gal
PT: 65.81 Gal
igure 3.11: DPW Without RTD Option Initial PI Screen with
F
Main and Pilot Totalizer
ction: Keypad UP
A
i
5.001 Gl/min AD
MT: 60639.38 Gal
Figure 3.12: DPW Without RTD Option Initial PI Screen
With Flow Rate and Main Totalizer
When the last menu item is reached, the firmware "wraps around" and scrolls to the
first item on the menu once again (see Figure 3.12). The menu items in the first
olumn are upper-level configuration mode functions. Submenu selections (shown
c
ndented in the second column) only appear if the associated upper level is
i
elected by pressing the ENT push button. The allowable selections of sub-menu
s
items which are selected by tabular means are shown in detail in Section 3.3.
Configuration Data
rog. Protection on/off
P
rog. Prot. Code old/new
P
ubmenu Flow Meter Info
S
Submenu Measuring Units
Submenu Flow Alarm
Submenu Temp. Alarm
Submenu Main Totalizer
Submenu Pilot Totalizer
Submenu Optical Outputs
Submenu FlowMeter Config
LCD Back Light 50% FS
Submenu Alarm Events Log
Submenu Diagnostic
Figure 3.12 Upper Level Menu Structure
Page 6
Page 7
.3 Parameter Summary and Data Entry
3
Low Flow Alarm
10.0% FS
Low Flow Alarm
90.0% FS
Page 7
MT Flow Start
5.0% FS
Page 8
PT Flow Start
10.0% FS
LCD Back Light
0% FS
7
LCD Back Light
70% FS
Low Flow Cut-Off
.000% FS
1
Page 8
Page 9

. PARAMETER ENTRY
4
here are two methods of data entry:
T
Direct numerical number entry
•
• Tabular Input from a table menu.
If menu with direct numerical entry is selected use Up button to increment digit
alue from 0 to 9. Use Dn button to move cursor to another digit position. When
v
esired value is entered use ENT button to accept (save in the EEPROM) new
d
alue.
v
If menu with tabular entry is selected, the available menu options can be set with
the Up and Dn buttons and are accepted by pressing ENT button.
ote: During data entry the input values are checked for acceptability. If data is not
N
cceptable, it is rejected and a message is generated indicating that the new data
a
as not been accepted.
h
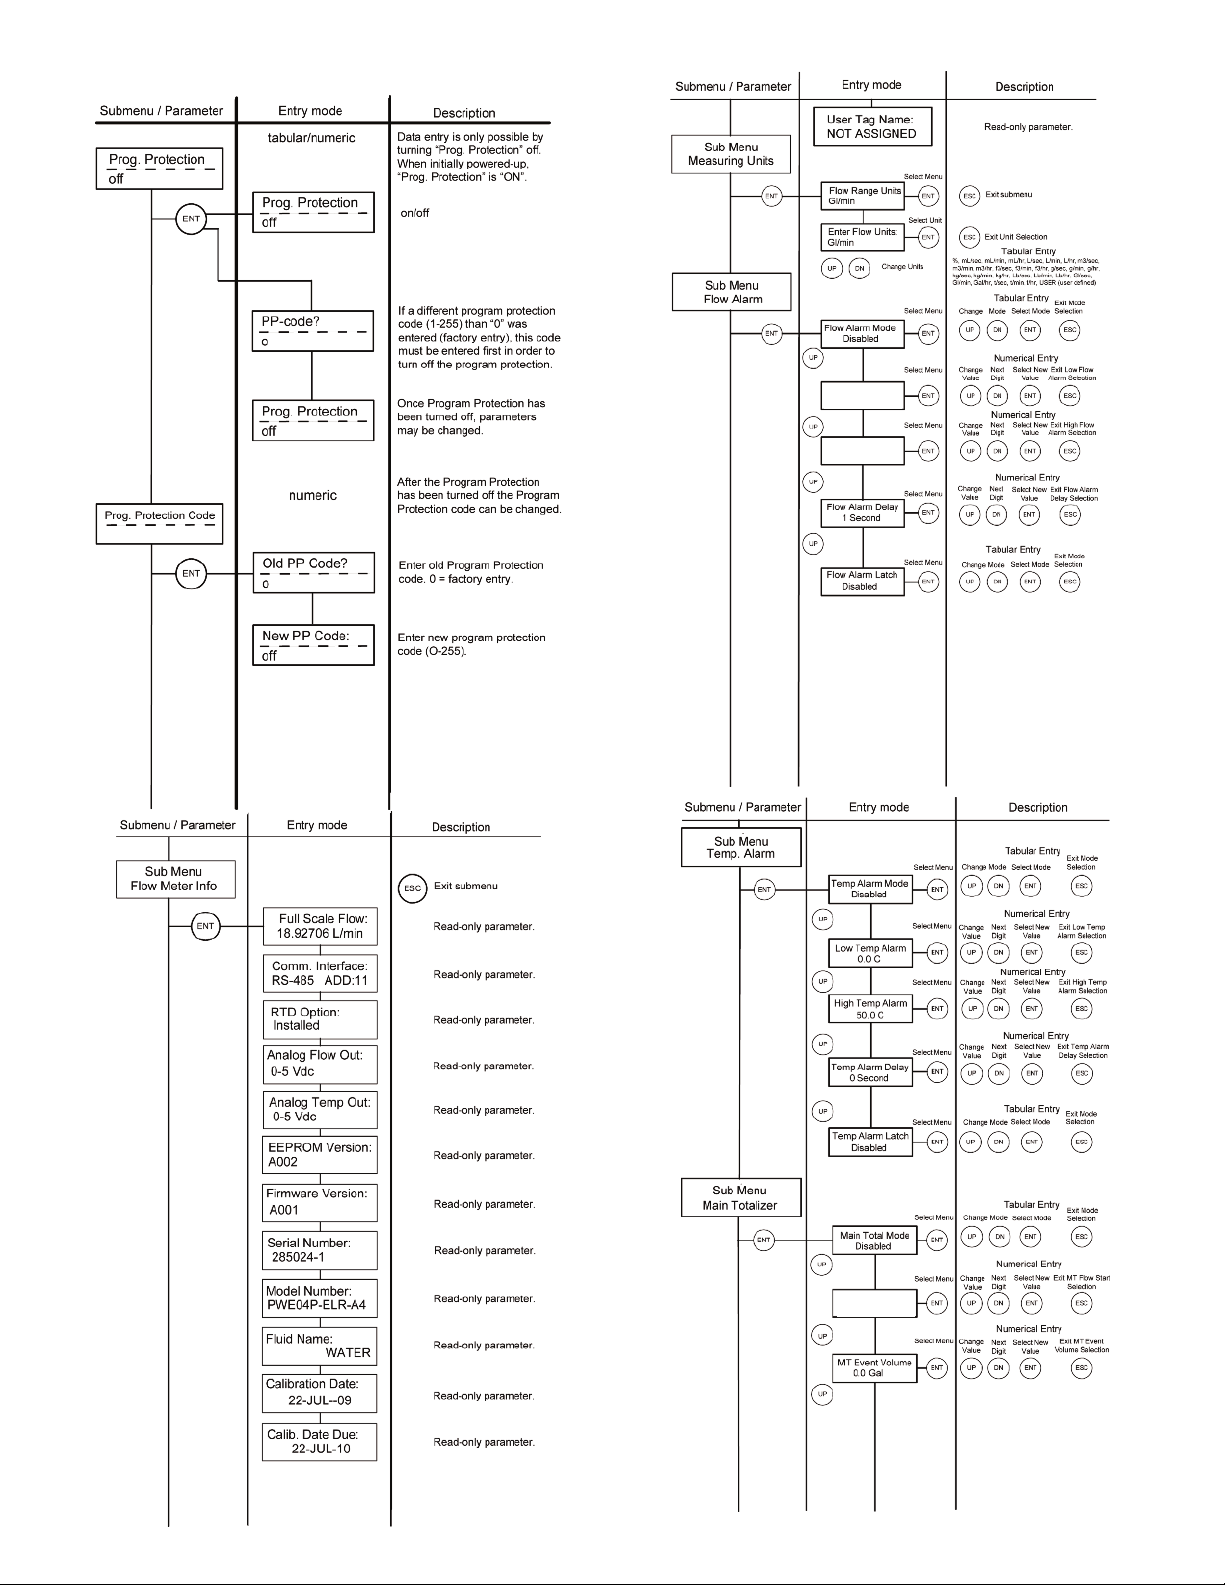
4.1 - Submenu Program Protection
After power has been turned on, programming parameters may only be changed
by turning program protection "OFF". There are two ways to turn off the
rogram protection:
p
. If program protection code (PP-code) is on "0" (factory default), the program
1
protection is turned off by pressing ENTER key.
2. If a PP-code (1 to 255) other than "0" has been entered, this code must be
entered in order to turn the program protection "OFF".
he PP-code can be changed after the program protection has been turned off.
T
.2.2 - Communication Interface
4
his display indicates type of the digital communication interface (RS-232 or RS-
T
85) and device address (two hexadecimal characters of the address will be
4
isplayed only for RS-485 interface option). All flow meters are shipped from the
d
factory with default address 11. A typical display for device with RS-485 option is
shown below.
Comm. Interface:
RS-485 ADD: 11
4.2.3 - RTD Hardware Option
his display indicates presence of the RTD hardware. If second line of the screen
T
ndicates “Installed”, then flow meter is equipped with RTD with signal processing
i
ircuitry and ready for temperature measurement. A typical display for device with
c
RTD option is shown below.
RTD Option:
Installed
4.2.4 - Analog Flow Output Settings
This display indicates which type of the jumper selectable Flow analog output is
currently active. The device can be set for 0 to 5 Vdc or 4 to 20 mA output. A typical
display for device with jumper configuration for 0 to 5 Vdc Flow output is shown
elow.
b
Prog. Protection code
-----------------------------
In order to protect device configuration parameters when changing the PP-code the
old PP-code must be entered after ENTER has been pressed.
Old PP-code?
----------------------------0
Press ENTER key after entry of old PP-code.
New PP-code
----------------------------0
Now enter the new PP-code (0-255) and press ENTER key. The new PP-code is
now valid to turn off the program protection. If the PP-code is forgotten, it can be
restored only via digital communication interface.
4.2 - Submenu Flow Meter Info
This submenu contains information about the meter main configuration parameters.
These items are informational only and may not be changed (read only).
4.2.1 - Full Scale Flow
This display indicates the full scale range of the meter in L/min. The full scale range
of the flow meter is related to the lower block inside diameter. It is set on the factory
during calibration procedure. The full scale range of the meter is not user
changeable. A typical display is shown below.
Full Scale Flow:
18.92706 L/min
Analog Flow Out:
0-5 Vdc
4.2.5 - Analog Temperature Output Settings
This display indicates which type of the jumper selectable Temperature analog
output is currently active. The device can be set for 0 to 5 Vdc or 4 to 20 mA output.
A typical display for device with jumper configuration for 0 to 5 Vdc Temperature
output is shown below.
Analog Temp Out:
0-5 Vdc
Note: Analog Temperature Output settings screen will be available on the devices
which are not equipped with RTD option as well. In this case user should not be
under impression that unit supports temperature measurement.
4.2.6 - Flow Meter EEPROM Data Base Version
This display indicates current version of the EEPROM data base. The EEPROM
stores all flow meter configuration parameters. The Flow Meter EEPROM data
base version is not user changeable. A typical display with EEPROM version is
shown below.
EEPROM Version:
A001
4.2.7 - Flow Meter Firmware Version
This display indicates current version of the flow meter firmware. The Flow Meter
Firmware version is not user changeable. A typical display with firmware version is
shown below.
Firmware Version
A002
Page 9
Page 10

.2.8 - Flow Meter Serial Number
4
his display indicates the serial number of the flow meter. This number is generated
T
y the factory and is unique to the instrument. The flow meter serial number is not
b
ser-changeable. A typical display with flow meter serial number is shown below.
u
Serial Number:
245893-1
4.2.9 - Flow Meter Model number
This display indicates the model number of the flow meter. The flow meter model
number is not user-changeable. A typical display with flow meter model number is
hown below.
s
Model Number:
XXXXXXXX
.2.10 - Fluid Name
4
his display indicates the name of the fluid the flow meter was calibrated for. The
T
fluid name may be changed by user via digital communication interface. A typical
display with fluid name is shown below.
Fluid Name:
WATER
4.2.11 - Flow Meter Calibration Date
This display indicates the date when most recent calibration of the flow meter was
performed. The calibration date may be changed by user via digital communication
interface. A typical display with flow meter calibration date is shown below.
Calibration Date:
08/01/2009
4.2.12 - Flow Meter Calibration Date Due
This display indicates the date when next calibration of the flow meter has to be
performed. The calibration date due may be changed by user via digital
communication interface. A typical display with flow meter calibration date due is
shown below.
Calib. Date Due:
08/01/2010
4.2.13 - Flow Meter User Tag Name
Flow meter Tag is the quickest and shortest way of identifying and distinguishing
between multiple flow meters. Flow meters can be tagged according to the
requirements of your application. The tag may be up to 16 characters long and is
user-defined. A typical display with flow meter Tag Name is shown below.
nits of Measure
U
Number
1
2
3
4
5
6
7
8
9
1
1
1
1
14
15
16
17
18
1
2
2
22
23
2
25
26
27
28
2
The listed units in the table above can be set with the Up and Dn buttons and are
accepted by pressing ENT button.
4.3.1 - User Defined Measuring Unit
This function enables user defined configuration of any engineering unit in the
converter. The following three parameters are available for this function:
Note: The entry of the listed parameters a), b) and c) is only necessary in case the
required engineering unit is not available in the table above, (see Section 4.3).
4.3.1.a - User Defined Unit Factor Numeric Entry
This parameter indicates the factor of the new unit with respect to one liter. The
default entry is 1.00 Liter.
Index
0
1
2
3
4
5
6
7
8
9
0
1
2
3
9
0
1
4
9
0
1
1
1
2
1
13
14
15
16
17
8
1
9
1
0
2
21
22
3
2
24
25
26
27
8
2
a) Unit volume factor (defined in Liters)
b) Unit time base (defined in Seconds)
c) Unit with or without density support
low Rate
F
ngineering
E
Units
%
mL/sec
L/min
m
L/hr
m
/sec
L
/min
L
L/hr
3
m
/sec
3
m
/min
3
hr
m
/
3
t
sec
f
/
3
t
min
f
/
3
t
hr
f
/
Gl/sec
Gl/min
Gl/hr
g/sec
g/min
/hr
g
g/sec
k
g/min
k
kg/hr
Lb/sec
b/min
L
Lb/hr
t/sec
t/min
t/hr
ser
U
otalizer
T
ngineering
E
Units
%s
mL
L
m
L
m
tr
L
tr
L
Ltr
3
m
3
m
3
m
3
t
f
3
t
f
3
t
f
Gal
Gal
Gal
g
g
g
g
k
g
k
kg
Lb
b
L
Lb
Ton
Ton
Ton
D
U
Description
Percent of full scale
Mililiter per second
ililiter per minute
M
ililiter per hour
M
iter per second
L
iter per minute
L
Liter per hour
Cubic meter per second
Cubic meter per minute
ubic meter per hour
C
ubic feet per second
C
ubic feet per minute
C
ubic feet per hour
C
Gal per second
Gal per minute
Gal per hour
Grams per second
Grams per minute
rams per hour
G
ilograms per second
K
ilograms per minute
K
Kilograms per hour
Pounds per second
ounds per minute
P
Pounds per hour
Ton (metric) per second
Ton (metric) per minute
Ton (metric) per hour
ser Defined
U
UD Unit Factor
1.00 Liter
4.3.1.b - User Defined Unit Time Base Tabular Entry
This parameter indicates the time base for User Defined Unit. The following
selections are available: 1 second, 60 seconds (1 minute), 3600 seconds (1 Hour).
The default entry is 60 seconds.
User Tag Name:
NOT ASSIGNED
4.3 Submenu Measuring Units
This submenu allows selection of units for flow rate and Totalizer reading. Units
should be selected to meet your particular metering needs.
Note: Once Flow Unit of Measure is changed the Totalizer’s Volume based Unit of
Measure will be changed automatically.
UDU Time Base
60 Seconds
The listed time based selections above can be set with the Up and Dn buttons and
are accepted by pressing ENT button.
Page 10
Page 11

.3.1.c - User Defined Unit Density Support Tabular entry
4
his function determines whether the newly entered user defined engineering unit
T
s a mass unit (with density) or a volumetric unit (without density). The following
i
selections are available: Enabled or Disabled. The default entry is Disabled.
typical display with flow meter High Flow Alarm settings is shown below.
A
High Flow Alarm
90.0% FS
UDU Use Density
Disabled
The listed above density support selections can be set with the Up and Dn buttons
and are accepted by pressing ENT button. If density was selected, also refer to
ection 4.9.8.
s
.4 Submenu Flow Alarm
4
DPW provides the user with a flexible alarm/warning system that monitors the fluid
flow for conditions that fall outside configurable limits as well as visual feedback for
the user via the LCD (only for devices with LCD option) or via an optically isolated
outputs.
he flow alarm has several attributes which may be configured by the user via
T
ptional LCD/keypad or digital communication interface. These attributes control
o
the conditions which cause the alarm to occur and to specify actions to be taken
when the flow rate is outside the specified conditions.
Flow alarm conditions become true when the current flow reading is equal or
igher/lower than corresponding values of high and low flow alarm levels. Alarm
h
ction can be assigned with preset delay interval (0 to 3600 seconds) to activate
a
he optically isolated output (separate for high and low alarm). Latch mode control
t
feature allows each optical output to be latched on or follow the corresponding
alarm status.
4.4.1 Flow Alarm Mode Tabular Entry
This function determines whether flow alarm is Enabled or Disabled. The following
selections are available: Enabled or Disabled. The default entry is Disabled.
Flow Alarm Mode
Disabled
f a High Alarm occurs, and one of the two optical outputs is assigned to the High
I
larm Event (see Section 4.8) the optically isolated output will be activated when
A
he flow is more than the High Flow Alarm value. The Flow Alarm condition is also
t
indicated on the display Process Information Screen by displaying H character. A
typical display with flow meter Process Information Screen and activated High Flow
Alarm settings is shown below.
4.641 Gl/min AH
MT: 67.81 Gal
.4.4 - Flow Alarm Action Delay Numerical Entry
4
he Flow Alarm Action Delay is a time in seconds that the Flow rate value must
T
emain above the high limit or below the low limit before an alarm condition is
r
indicated. Valid settings are in the range of 0 to 3600 seconds. A typical display with
flow meter Flow Alarm Delay settings is shown below.
Flow Alarm Delay
1 Second
4.4.5 - Flow Alarm Action Latch Tabular Entry
The Flow Alarm Action Latch settings controls Latch feature when optically isolated
outputs are assigned to Flow Alarm event. Following settings are available: Disable
or Enabled.
By default, flow alarm is non-latching. That means the alarm is indicated only while
the monitored flow value exceeds the specified set conditions. If optically isolated
output is assigned to the Flow Alarm event, in some cases, the Flow Alarm Latch
feature may be desirable.
The listed above alarm mode selections can be set with the Up and Dn buttons and
are accepted by pressing ENT button.
4.4.2 - Low Flow Alarm Numerical Entry
The limit of required Low Flow Alarm value can be entered in increments of 0.1%
from 0 to 100% FS.
Note: The value of the Low Flow Alarm must be less than the value of the High
Flow Alarm.
A typical display with flow meter Low Flow Alarm is shown below.
Low Flow Alarm
10.0% FS
If a Low Alarm occurs, and one of the two optical outputs is assigned to the Low
Alarm Event (see Section 4.8) the optically isolated output will be activated when
the flow is less than the Low Flow Alarm value. The Flow Alarm condition is also
indicated on the display Process Information Screen by displaying L character. A
typical display with flow meter Process Information Screen and activated Low Flow
Alarm is shown below.
0.401 Gl/min AL
MT: 65.81 Gal
4.4.3 - High Flow Alarm Numerical Entry
The limit of required High Flow Alarm value can be entered in increments of 0.1%
from 0 to 100% FS.
Note: The value of the High Flow Alarm must be more than the value of the Low
Flow Alarm.
Flow Alarm Latch
Disabled
The listed above Flow Alarm Action Latch selections can be set with the Up and Dn
buttons and are accepted by pressing ENT button.
4.5 - Submenu Temperature Alarm (*optional)
DPW with RTD option provides the user with a flexible alarm/warning system that
monitors the fluid temperature for conditions that fall outside configurable limits as
well as visual feedback for the user via the LCD (only for devices with LCD option)
or via an optically isolated outputs.
The temperature alarm has several attributes which may be configured by the user
via optional LCD/keypad or digital communication interface. These attributes
control the conditions which cause the alarm to occur and to specify actions to be
taken when the temperature value is outside the specified conditions. Temperature
Alarm conditions become true when the current temperature reading is equal or
higher/lower than corresponding values of high and low temperature alarm levels.
Alarm action can be assigned with preset delay interval (0 to 3600 seconds) to
activate the optically isolated output (separate for High and Low alarm). Latch
Mode control feature allows each optical output to be latched on or follow the
corresponding alarm status.
4.5.1 - Temperature Alarm Mode Tabular Entry
This function determines whether Temperature Alarm is Enabled or Disabled. The
following selections are available: Enabled or Disabled. The default entry is
Disabled.
Temp Alarm Mode
Disabled
The listed above Temperature Alarm Mode selections can be set with the Up and
Dn buttons and are accepted by pressing ENT button.
Page 11
Page 12

.5.2 - Low Temperature Alarm Numerical Entry
4
he limit of required Low Temperature Alarm value can be entered in increments of
T
.1°C from -9.9 °C to 99.9°C.
0
A typical display with flow meter Low Temperature Alarm is shown below.
y default, flow alarm is non-latching. That means the alarm is indicated only while
B
he monitored Temperature value exceeds the specified set conditions. If optically
t
solated output is assigned to the Temperature Alarm event, in some cases, the
i
emperature Alarm Latch feature may be desirable.
T
Note: The value of the Low Temperature Alarm must be less than the value of the
igh Temperature Alarm. The value of the temperature can be entered only in °C
H
nits.
u
typical display with flow meter Low Temperature Alarm is shown below.
A
Low Temp Alarm
0.0 C
If a Low Temperature Alarm occurs, and one of the two optical outputs is assigned
to the Low Alarm Event (see Section 4.8) the optically isolated output will be
activated when the temperature is less than the Low Temperature Alarm value.
he Temperature Alarm condition is also indicated on the display Process
T
nformation Screen by displaying L character. A typical display with flow meter
I
rocess information screen and activated Low Temperature Alarm is shown below.
p
5.001 Gl/min AD
-0.5 C TA: L
.5.3 - High Temperature Alarm Numerical Entry
4
The limit of required High Temperature Alarm value can be entered in increments
of 0.1°C from -9.9 °C to 99.9 °C.
Note: The value of the High Temperature Alarm must be more than the value of the
Low Temperature Alarm.
A typical display with flow meter High Temperature Alarm settings is shown below
Note: The value of the Low Temperature Alarm must be less than the value of the
High Temperature Alarm. The value of the temperature can be entered only in °C
units.
High Temp Alarm
50.0 C
If a High Temperature Alarm occurs, and one of the two optical outputs is assigned
to the High Alarm Event (see Section 4.8) the optically isolated output will be
activated when the flow is more than the High Temperature Alarm value.
The Temperature Alarm condition is also indicated on the display Process
Information Screen by displaying H character. A typical display with flow meter
Process Information Screen and activated High Temperature Alarm settings is
shown below.
5.001 Gl/min AD
51.4 C TA: H
Temp Alarm Latch
Disabled
The listed above Temperature Alarm Action Latch selections can be set with the Up
and Dn buttons and are accepted by pressing ENT button.
.6 - Submenu Main Totalizer
4
he total volume of the liquid is calculated by integrating the actual liquid flow rate
T
ith respect to time. The Main Totalizer value is stored in the EEPROM and saved
w
every 1 second. In case of power interruption the last saved Totalizer value will be
loaded on the next power on cycle, so Main Totalizer reading will not be lost. The
optional LCD/keypad and digital communication interface commands are provided
to:
reset the totalizer to ZERO
start the totalizer at a preset flow rate
assign action at a preset total volume
-
- start/stop totalizing the flow
Note: Before enabling the Main Totalizer, ensure that all totalizer settings are
configured properly. Totalizer Start values have to be entered in % FS engineering
nit. The Totalizer will not totalize until the flow rate becomes equal to or more than
u
he Totalizer Start value. Totalizer Stop values must be entered in currently active
t
olume / mass based engineering units. If the Totalizer Stop at preset total volume
v
feature is not required, then set Totalizer Stop value to zero (default settings).
4.6.1 - Main Totalizer Mode Tabular entry
This function determines whether Main Totalizer is Enabled or Disabled. The
following selections are available: Enabled or Disabled. The default entry is
Disabled.
Main Total Mode
Disabled
The listed above Main totalizer Mode selections can be set with the Up and Dn
buttons and are accepted by pressing ENT button.
4.6.2 - Main Totalizer Flow Start Numerical Entry
The Main Totalizer Start Flow value can be entered in increments of 0.1% from 0.0
– 100.0% FS. A typical display with flow meter Main totalizer Start Flow settings is
shown below.
MT Flow Start
5.0% FS
4.6.3 - Main Totalizer Event Volume Numerical Entry
Main Totalizer Event Volume value must be entered in currently active volume /
mass based engineering units. Totalizer action event become true when the
totalizer reading and preset "Event Volume" values are equal.
If the Totalizer Event at preset total volume feature is not required, then set Totalizer
Event Volume value to zero (default settings).
4.5.4 - Temperature Alarm Action Delay Numerical Entry
The Temperature Alarm Action Delay is a time in seconds that the Temperature
value must remain above the high limit or below the low limit before an alarm
condition is indicated. Valid settings are in the range of 0 to 3600 seconds. A typical
display with flow meter Temperature Alarm Delay settings is shown below.
Temp Alarm Delay
1 Second
4.5.5 - Temperature Alarm Action Latch Tabular Entry
The Temperature Alarm Action Latch settings controls Latch feature when optically
isolated outputs are assigned to Temperature Alarm event. Following settings are
available: Disable or Enabled.
A typical display with flow meter Main Totalizer Event Volume settings is shown
below.
MT Event Volume
0.0 Gal
Page 12
Page 13

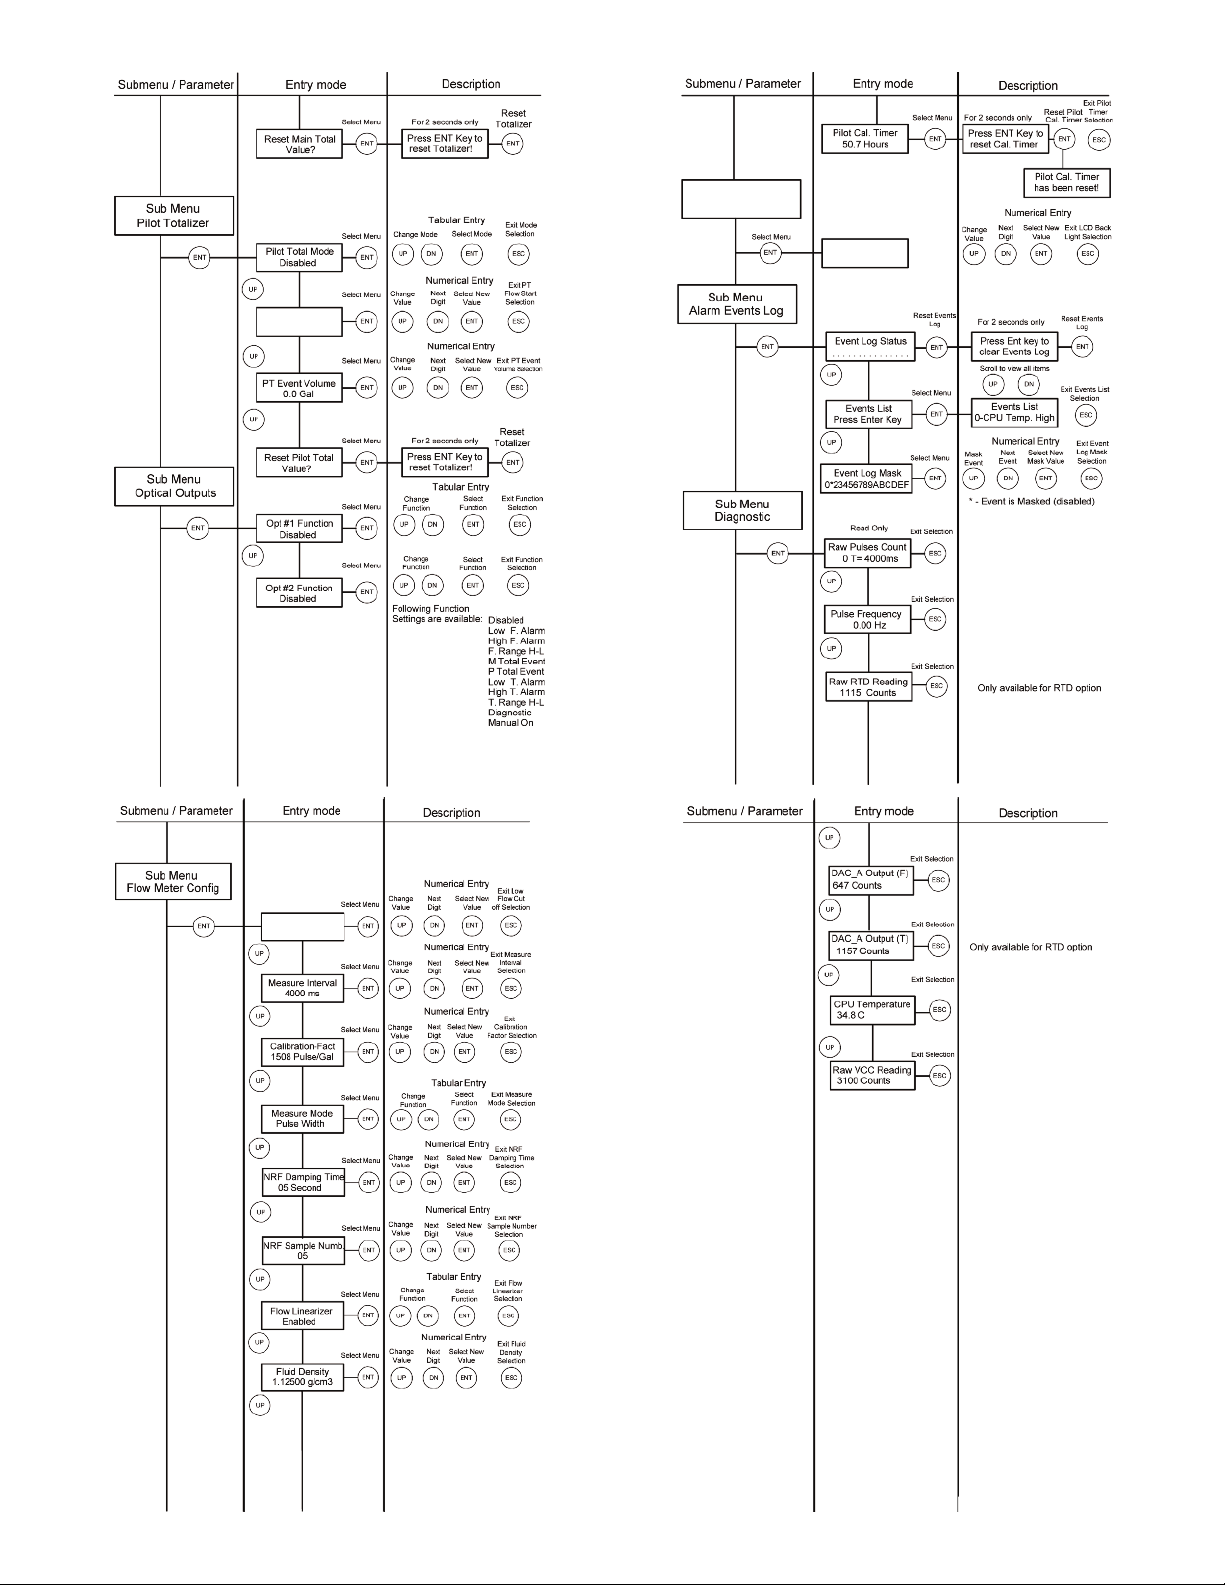
.6.4 - Main Totalizer Reset Tabular Entry
4
he Main Totalizers reading can be reset by pressing ENTER button. A typical
T
isplay with flow meter Main Totalizer Reset screen is shown below.
d
.7.4 - Pilot Totalizer Reset Tabular Entry
4
he Pilot Totalizers reading can be reset by pressing ENTER button. A typical
T
isplay with flow meter Pilot Totalizer Reset screen is shown below.
d
Reset Main Total
Value?
he next conformation screen will appear only for 2 seconds.
T
Press Ent key to
reset Totalizer!
f during these 2 seconds user will press ENTER button again, the Main Totalizer
I
volume will be reset to 0. Following screen will appear for 2 seconds.
The Totalizer has
been reset!
4.7 - Submenu Pilot Totalizer
The total volume of the liquid is calculated by integrating the actual liquid flow rate
with respect to time. The Pilot Totalizer value is stored in the flow meter volatile
memory (SRAM) and saved every 100 ms. In case of power interruption the Pilot
otalizer volume will be lost (reset to zero). The optional LCD/keypad and digital
T
ommunication interface commands are provided to:
c
- reset the totalizer to ZERO
- start the totalizer at a preset flow rate
- assign action at a preset total volume
- start/stop totalizing the flow
Note: Before enabling the Pilot Totalizer, ensure that all totalizer settings are
configured properly. Totalizer Start values have to be entered in % FS engineering
unit. The Totalizer will not totalize until the flow rate becomes equal to or more than
the Totalizer Start value. Totalizer Stop values must be entered in currently active
volume / mass based engineering units. If the Totalizer Stop at preset total volume
feature is not required, then set Totalizer Stop value to zero (default settings).
4.7.1 - Pilot Totalizer Mode Tabular Entry
This function determines whether Pilot Totalizer is Enabled or Disabled. The
following selections are available: Enabled or Disabled. The default entry is
Disabled.
Pilot Total Mode
Disabled
The listed above Pilot totalizer Mode selections can be set with the Up and Dn
buttons and are accepted by pressing ENT button.
4.7.2 - Pilot Totalizer Flow Start Numerical Entry
The Pilot Totalizer Start Flow value can be entered in increments of 0.1% from 0.0
to 100.0% FS. A typical display with flow meter Pilot totalizer Start Flow settings is
shown below.
PT Flow Start
10.0% FS
4.7.3 - Pilot Totalizer Event Volume Numerical Entry
Pilot Totalizer Event Volume value must be entered in currently active volume /
mass based engineering units. Totalizer action event become true when the
totalizer reading and preset "Event Volume" values are equal.
If the Totalizer Event at preset total volume feature is not required, then set Totalizer
Event Volume value to 0 (default settings). A typical display with flow meter Pilot
Totalizer Event Volume settings is shown below.
Reset Pilot Total
Value?
he next confirmation screen will appear only for 2 seconds.
T
Press Ent key to
reset Totalizer!
f during these two seconds user will press ENTER button again, the Pilot Totalizer
I
volume will be reset to 0. Following screen will appear for 2 seconds.
The Totalizer has
been reset!
4.8 - Submenu Optical Outputs Numerical Entry
Two sets of optically isolated outputs are provided to actuate user supplied
equipment. These are programmable via digital interface or optional LCD/keypad
such that the outputs can be made to switch when a specified event occurs (e.g.
hen a low or high flow alarm limit is exceeded or when the totalizer reaches a
w
pecified value) or may be directly controlled by user.
s
The user can configure each optical output action from 11 different options:
- Disabled: No Action (output is not assigned to any events and not energized)
- Low Flow Alarm
- High Flow Alarm
- Range between H&L Flow alarm settings
- Main Totalizer reading exceed set limit
- Pilot Totalizer reading exceed set limit
- Low Temperature alarm (*RTD option only)
- High Temperature alarm (*RTD option only)
- Range between High and Low Temperature alarm (*RTD option only)
- Diagnostic: Output will be energized when any of the Diagnostic events are active
- Manual On Control: Output will be energized until Disabled option will be
selected.
A typical display with Optical Output Function selection is shown below.
Opt #1 function
Disabled
The listed above Optical Output selections can be set with the Up and Dn buttons
and are accepted by pressing ENT button.
4.9 - Submenu Flow Meter Configuration
4.9.1 - Submenu Flow Meter Low Flow Cut–off Numerical Entry
The Low Flow Cut-off can be selected between 0.0 and 10.0 % of the FS range.
Flows less than the cut-off value are internally driven to zero and not totalized. The
analog 0 to 5 vdc or 4 to 20 mA current outputs are set to 0.0 Vdc and 4.00 mA
correspondently. The switching threshold for the low flow cut-off has 1.0% FS
hysteresis. A typical display with Low Flow Cut–off selection is shown below.
Low Flow Cut–off
1.000% FS
4.9.2 - Submenu Pulse Number Measure Interval Numerical Entry
Signal Processing software algorithm can be set to calculate flow rate based on two
different methods (see Section 4.9.4):
a) number of pulses over preset measure interval
b) pulse width measurement
PT Event Volume
0.0 Gal
Both methods calculates frequency of the pulses from the flow meter sensor. The
number of pulses over preset measure interval method convenient when pulsating
flow or especially noisy signals are encountered.
Page 13
Page 14

his method allows to get stable average flow rate if pulse measure interval is set
T
o values more than 4000 ms. This parameters effects the flow update rate. With
t
igher value of the pulse measure interval, the resolution and stability of the flow
h
easurement improves, but response time become longer. A suggested pulse
m
measure interval value of 4000 seconds is a good starting point for most applicable
process fluids. With lower settings the response time of the meter will be shorter,
but resolution and stability will degrade.
he pulse measure interval settings are only related to the number of pulses over
T
reset measure interval method. Pulse measure interval can be selected between
p
00 and 60000 ms. A typical display with pulse measure interval selection is shown
5
below.
Measure Interval
4000 ms
4.9.3 - Submenu Flow Meter Calibration Factor Numerical Entry
alibration Factor is defined as the number of pulses from flow sensor per one
C
allon of fluid passing through the meter. This is the parameter by which the factory
g
alibrates the flow meter. Change of this parameter is rarely needed by customers.
c
It is only necessary if you believe the DPW flow meter is no longer accurate.
Note: Your DPW Flow Meter was calibrated at the factory for the specified fluid and
full scale flow range (see device’s label or calibration data sheet). There is no need
o adjust the Flow Meter calibration factor, unless adjustment for specific installation
t
r fluid is needed. Any alteration of the flow meter calibration factor will VOID
o
alibration warranty supplied with instrument.
c
A typical display with Calibration Factor selection is shown below.
Calibration-Fact
1366 Pulse/Gal
4.9.4 - Submenu Flow Meter Measure Mode Tabular Entry
Signal Processing software algorithm can be set to calculate flow rate based on two
different methods:
a) number of pulses over preset measure interval
b) pulse width measurement
First method (a) was explained earlier (see Section 4.9.2). Second method (b)
allows get quick response time and best resolution of the flow rate, but with
pulsating or especially noisy flow environment the stability of the flow rate reading
may be compromised. A digital filter (noise reduction algorithm) is available in
the flow meter when pulsating flow or especially noisy signals are encountered (see
Sections 4.9.5 and 4.9.6). The digital filter improves the displayed instantaneous
flow values.
The digital filter only works with pulse width measurement method and is not
applicable for flow measurement mode (a) – “number of pulses over measure
interval”. A typical display with Measure Mode selection is shown below. By default
unit shipped from the factory with Measure Mode set to “Pulse Width”.
Measure Mode
Pulse Width
.9.6 - Submenu Noise Reduction Filter Sample Number Numerical Entry
4
his is the second parameter that makes up noise reduction filter algorithm. The
T
ample number value can be selected between 1 and 32. The number of samples
s
alue represents the number of previous individual inputs used to calculate the
v
average value. Eventually the number of samples in the running average also
affects the response time. The more samples are used, the more inertial flow output
reading will be to the actual flow change. A suggested nominal number of 5
amples is a good starting point for most applicable process fluids. A typical display
s
ith Sample Number selection is shown below.
w
NRF Sample Numb.
05
.9.7 - Submenu Flow Linearizer Tabular Entry
4
he Flow Linearization algorithm may be used to improve linearity of the flow
T
measurement. The Flow Linearization table is built during factory calibration
procedure and stored in the device EEPROM. The Flow Linearizer can be used
with both flow measurement algorithms. By default unit shipped from the factory
with enabled Flow Linearizer. A typical display with Flow Linearizer selection is
hown below.
s
Flow Linearizer
Enabled
he listed above Flow Linearizer selections can be set with the Up and Dn buttons
T
nd are accepted by pressing ENT button.
a
4.9.8 - Submenu Fluid Density Numerical Entry
When the flow is displayed in gravimetric (mass based) units (e.g: g, kg, t, pound)
a density value of the actual fluid must be entered for the flow rate and total
calculation. The translation conversion to mass flow is settable between 0.01 and
5.00000 g/cm3. A typical display with Fluid Density selection is shown below.
Fluid Density
1.12500 g/cm3
4.9.9 - Submenu Pilot Calibration Timer Tabular Entry
The Pilot Calibration timer accumulates operational hours since last time unit was
calibrated. The value of the timer may be reset by the user by pressing Ent button.
A typical display with Calibration timer selection is shown below.
Pilot Cal. Timer
70.0 Hours
Once Ent button is pressed the next conformation screen will appear only for 2
seconds.
Press Ent key to
reset Cal. Timer
If during these 2 seconds user will press ENTER button again, the Calibration Timer
value will be reset to zero.
4.9.5 - Submenu Noise Reduction Filter Damping Time Numerical Entry
A noise reduction filter algorithm (running average of the individual flow inputs) is
available in the flow meter when pulsating flow or especially noisy signals are
encountered. There are two parameters that make up Signal Processing Control:
Damping Time and Number of Samples. They are described individually below.
Damping Time: The damping value can be selected between 0 and 99 seconds.
The value represents the response time of the running average flow rate change.
The higher the damping value the longer the response time of the filter. If noise
reduction filter is not desired it may be disabled by setting Damping Time parameter
to zero. By default unit shipped from the factory with Damping Time value set to 5.
A typical display with Damping Time selection is shown below.
NRF Damping Time
05 Seconds
4.10 - Submenu LCD Back Light Numerical Entry
This parameter indicates the level (intensity) of the LCD back light. The value of the
LCD back light level can be entered in increments of 1% from 0 to 80% FS. If LCD
back light is not desired, it can be turn off by setting back light level to zero. A typical
display with LCD Back Light selection is shown below.
LCD Back Light
50% FS
Page 14
Page 15

.11 - Submenu Alarm Events Log
4
PW series Flow Meters are equipped with a self-diagnostic alarm event log which
D
s available via digital interface and on screen LCD indication (for devices with
i
ptional LCD). A typical display with Alarm Events Log selection is shown below.
o
.11.2 - Submenu Alarm Events List
4
his menu selection provides list of the descriptions and corresponding code for all
T
upported events.
s
Sub Menu
Alarm Events Log
The following diagnostic events are supported:
CD bit
vent
E
Number
1
2
3
4
5
6
7
8
9
10
1
1
1
14
1
1
A
nternal register. All detected events remain stored until the register is manually
i
reset (by pressing ENTER key or by means of the digital communication interface).
The Alarm Event Log register is mapped to the SRAM (volatile memory). In case of
power interruption the Alarm Event Log register will be automatically reset.
4.11.1 - Submenu Alarm Events Log Status
Each alarm event has fixed designated position on the LCD screen. Most
significant event code (F) is set on the right side of the LCD and least significant
event code (0) is set on the left side of the LCD. If event is not present (not active)
it is represented on the LCD as dot (.) character. If event is present (or was
detected in the past) it is represented on the LCD with corresponding character. A
typical display with Alarm Events Log Status without any detected events is shown
below.
Diagnostic Alarm Event Description
CPU Temperature Too High
Flow Rate More Than 125% FS
igh Flow Alarm
H
ow Flow Alarm
L
igh Fluid Temperature Alarm
H
Low Fluid Temperature Alarm
Fluid Temperature Above Measurement Limit
Fluid Temperature Below Measurement Limit
Main Totalizer Exceed Set Event Volume Limit
Pilot Totalizer Exceed Set Event Volume Limit
EPROM Failure
E
1
2
3
5
6
ny alarm events that may have occurred (Event 0 to Event F) are stored in the
C/DC Converter Voltage Too High
D
C/DC Converter Voltage Too Low
D
Communication Error
eserved
R
ATAL ERROR (Reset or Maintenance Service is
F
Required for Return in to the Normal Operation)
L
Code
0
1
2
3
4
5
6
7
8
9
0
1
1
1
2
1
13
4
1
5
1
Events List
Press Enter Key
f ENTER is pressed again, the description for each error is displayed:
I
Events List
0-CPU Temp. High
The shown above Event List selections can be scrolled with the Up and Dn buttons.
By pressing ENT or Esc buttons user may exit from scrolling mode.
.11.3 - Submenu Alarm Events Log Mask
4
ith this menu selection user may individually mask (disable) any Alarm Event. A
W
ypical display with Alarm Events Mask selection is shown below.
t
Event Log Mask
0*23456789ABCDEF
In the example shown above, event 1 (Flow rate more than 125% FS) is masked
with asterisk. In order to change event mask settings user should press Ent button.
The flashing cursor will appear on the left of the LCD screen (on the 0 event
position). Use Dn button to move to desired event code. Use Up button to change
mask status (asterisk represent masked event). Use Ent button to accept and save
new mask settings.
4.12 - Submenu Diagnostic
This submenu provides troubleshooting information about the meter internal
variables. These items are informational only and may not be changed (read only).
4.12.1 - Submenu Raw Pulses Count
This menu selection provides number of pulses from the flow sensor within specific
measurement interval.
Event Log Status
. . . . . . . . . . . . . . . .
In the example shown below, event 1 (Flow rate more than 125% FS) and event 2
(High Flow Alarm) have occurred since the last reset.
Event Log Status
. . 23 . . . . . . . . . . . .
Note: Each Alarm Event can be individually masked (disabled) using Event Log
Mask menu selection (see Section 4.11.3) If alarm event is masked (disabled) it will
not be registered in the Event Status Log even actual event has occurred.
In order to reset (clear) Event Log press Ent button. Following screen will appear
just for two seconds.
Press Ent key to
Clear events Log
If during these two seconds user will press Ent button again, the Alarm Event Log
will be cleared.
Raw Pulses Count
400 T= 4000mS
In the example shown above the raw pulses count is 400 within 4000 ms measuring
interval, which represents pulse frequency of 100 Hz.
4.12.2 - Submenu Pulse Frequency
This menu selection provides raw value of the frequency from the pulse width
measurement circuitry.
Pulse Frequency
100.00 Hz
4.12.3 - Submenu Raw RTD reading (RTD option only)
This menu selection provides raw value of the ADC counts for RTD circuitry. The
reading only applicable for DPW meters with optional RTD functionality.
Raw RTD Reading
1250 Counts
Page 15
Page 16
.12.4 - Submenu DAC_A Flow Output
4
his menu selection provides current value of the DAC register for analog flow
T
utput circuitry.
o
ote: It is recommended to use the Dwyer Instruments, Inc. supplied calibration
N
nd maintenance software for analog output calibration. This software includes an
a
utomated calibration procedure which may radically simplify calculation of the
a
ffsets and spans variables and, the reading and writing for the EEPROM table.
o
DAC_A Output (F)
3125 Counts
.12.5 - Submenu DAC_B Temperature Output
4
This menu selection provides current value of the DAC register for analog
temperature output circuitry.
DAC_B Output (T)
1358 Counts
4.12.6 - Submenu CPU Temperature
This menu selection provides current value of the PCB and CPU temperature in °C.
CPU Temperature
35.8 C
4.12.7 - Submenu Raw VCC Reading
his menu selection provides current normalized value of the DC/DC converter
T
utput in counts. The typical values are in the range between 2800 and 3200
o
ounts.
c
Raw VCC Reading
3065 Counts
5. Analog Output Signals
The DPW analog output calibration involves calculation and storing of the offset
and span variables in the EEPROM for each available output. The 0 to 5 Vdc output
as only scale variable and 20 mA output has offset and scale variables. The
h
ollowing is a list of the EEPROM variables used for analog output computation:
f
nalog Flow Output variables
A
Index Name Description
39 FoutScaleV - DAC 0 to 5 Vdc Flow Analog Output Scale
1 FoutScale_mA - DAC 4 to 20mA Flow Analog Output Scale
4
2 FoutOffset_mA - DAC 4 to 20mA Flow Analog Output Offset
4
Analog Temperature Output variables*
Index Name Description
43 ToutScaleV - DAC 0 to 5 Vdc Temperature Analog Output Scale
5 ToutScale_mA - DAC 4 to 20mA Temperature Analog Output Scale
4
6 ToutOffset_mA - DAC 4 to 20mA Temperature Analog Output Offset
4
5.2.1 - Initial Setup
Power up the DPW Flow Meter for at least 15 minutes prior to commencing the
calibration procedure. Make sure absolutely no flow takes place through the meter.
Establish digital RS-485/RS-232 communication between PC (communication
erminal) and DPW. The commands provided below assume that calibration will be
t
erformed manually (w/o Dwyer
p
nd the device has RS-485 address 11. If Dwyer
a
maintenance software is used, skip the next section and follow the software
prompts.
Enter Backdoor mode by typing: !11,MW,1000,1[CR]
Unit will respond with: !11,BackDoorEnabled: Y
Disable DAC update by typing: !11,WRITE,4,Y[CR]
Unit will respond with: !11,DisableUpdate: Y
®
upplied calibration and maintenance software)
s
®
upplied calibration and
s
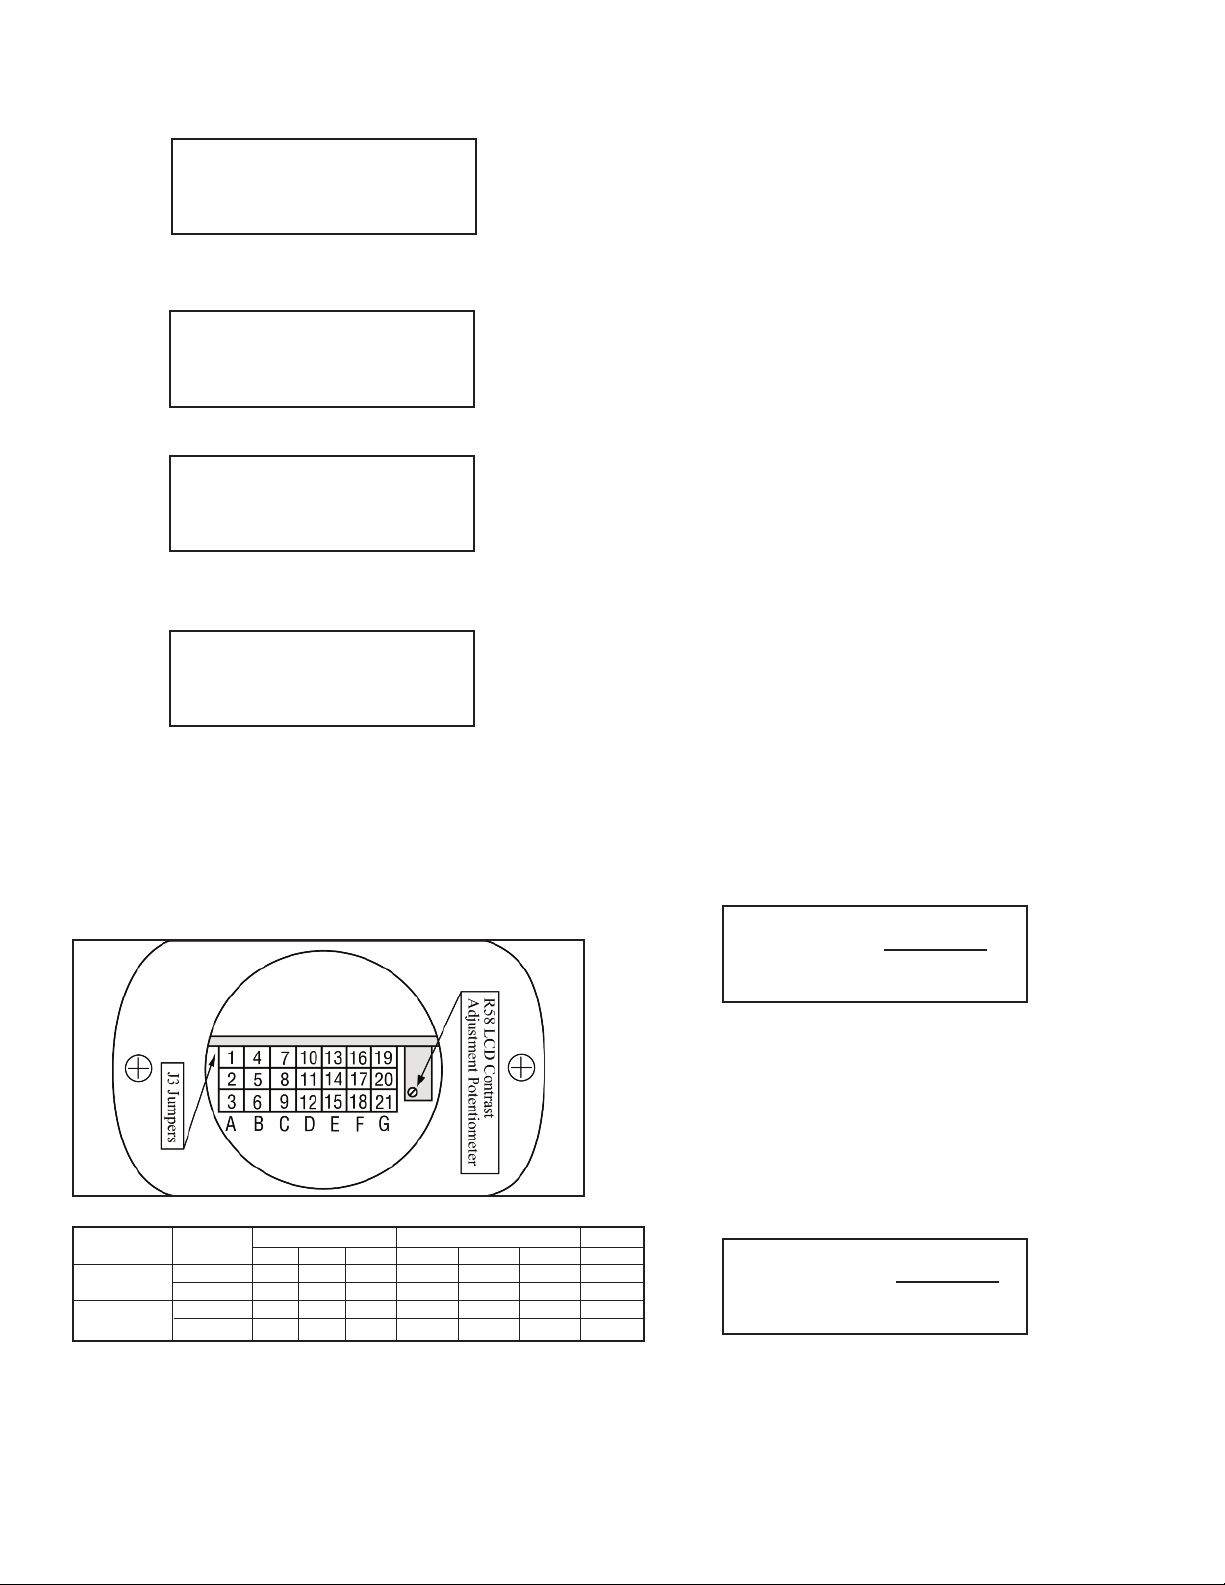
5.1 - Analog Output Signals Configuration
DPW series Flow Meters are equipped with calibrated 0 to 5 Vdc and/or 4 to 20 mA
output signals for flow and temperature* process variables. The set of the jumpers
(J3A, J3B, J3C, J3D, J3E, J3F) located on the top of the flow meter, inside of the
maintenance access window (see Figure 5-1 “DPW configuration jumpers”) are
used to switch between 0 to 5 Vdc or 4 to 20 mA output signals. Jumpers J3A, J3B,
J3C are used to set flow analog output type and jumpers J3D, J3E, J3F are used
to set temperature* analog output type (see Table 5-1). Jumper J3G is used to
configure RS-485 termination resistor (by default is off).
Figure 5-1 DPW Configuration Jumpers
Analog
Output
RS-485 220 Ω
Termination
Resistor
5.2 - Analog Output Signals calibration
Note: The analog output available on the DPW Flow Meter was calibrated at the
factory for the specified fluid and full scale flow range (see the device’s front label).
There is no need to perform analog output calibration unless the EEPROM IC was
replaced or offset/span adjustment is needed. Any alteration of the analog output
scaling variables in the EEPROM table will VOID calibration warranty supplied with
instrument.
Function
0 to 5 VDC
4 to 20 mA
OFF
ON
Analog Flow Output Analog Temp. Output* RS-485
J3A
J3B
J3C
J3D
2 to 3
1 to 2
5 to 6
4 to 5
8 to 9
7 to 8
11 to 12
10 to 11
J3E
14 to 15
13 to 14
J3F
17 to 18
16 to 17
5.2.2 - Flow 0 to 5 VDC analog output calibration
1. Install jumpers J3A, J3B and J3C on the PC board for 0 to 5 Vdc output
(see Table 5-1).
2. Connect a certified high sensitivity multi meter set for the voltage measurement
to the pins M (+) and K (-) of the DPW 12 Pin "M16" connector.
3. Write 4000 counts to the DAC_A channel: !11,WRITE,0,4000[CR]
4. Read voltage with the meter and calculate FOutScaleV value:
FoutScaleV=
5. Save FOutScaleV in to the EEPROM: !11,MW,39,X[CR]
Where: X – the calculated FoutScaleV value.
5.2.3 Flow 4 to 20 mA analog output calibration
1. Install jumpers J3A, J3B and J3C on the PC board for 4-20 mA output
output (see Table 5-1).
2. Connect a certified high sensitivity multimeter set for the current
measurement to pins M (+) and K (-) of the DPW 12 Pin "M16" connector.
3. Write 4000 counts to the DAC_A channel: !11,WRITE,0,4000[CR]
4. Read current with the meter and calculate FoutScale_mA value:
J3G
FoutScale_mA =
20 to 21
19 to 20
5. Write zero counts to the DAC_A channel: !11,WRITE,0,0CR]
6. Read offset current with the meter and calculate FoutOffset_mA value:
7. Save FoutScale_mA in to the EEPROM: !11,MW,41,Y[CR]
Save FoutOffset_mA in to the EEPROM: !11,MW,42,Z[CR]
Where: Y – the calculated FoutScale_mA value.
Z – the calculated FoutOffset_mA value.
Page 16
20000
Reading[V]
4000
Reading[mA]
Page 17

.2.4 - Temperature 0 to 5 VDc Analog Output Calibration*
5
. Install jumpers J3D, J3E and J3F on the PC board for 0 to 5 Vdc output (see
1
able 5-1).
T
. Connect a certified high sensitivity multimeter set for the voltage measurement
2
to the pins L (+) and K (-) of the DPW 12 Pin "M16" connector.
3. Write 4000 counts to the DAC_B channel: !11,WRITE,1,4000[CR]
4. Read voltage with the meter and calculate TOutScaleV value:
ToutScaleV=
5. Save TOutScaleV in to the EEPROM: !11,MW,43,X[CR]
here: X – the calculated ToutScaleV value.
W
5.2.5 - Temperature 4 to 20 mA Analog Output Calibration
1. Install jumpers J3D, J3E and J3F on the PC board for 4 to 20 mA output (see
Table 5-1).
2. Connect a certified high sensitivity multimeter set for the current measurement
o pins L (+) and K (-) of the DPW 12 Pin "M16" connector.
t
. Write 4000 counts to the DAC_B channel: !11,WRITE,1,4000[CR]
3
. Read current with the meter and calculate ToutScale_mA value:
4
ToutScale_mA=
5. Write zero counts to the DAC_B channel: !11,WRITE,1,0CR]
6. Read offset current with the meter and calculate ToutOffset_mA value:
20000
Reading[V]
4000
Reading[mA]
ToutOffset_mA=-TOutScale_mA*Offset_Reading[mA]
.2 - Flow Meter Span Calibration
6
ote: Your DPW Flow Meter was calibrated at the factory for the specified fluid and
N
ull scale flow range (see device’s front label). There is no need to adjust the
f
alibration Factor or Flow linearization table unless linearity adjustment is needed,
C
flow range has to be changed. Any alteration of the Calibration Factor or flow
linearization table will VOID calibration warranty supplied with instrument.
sing Dwyer Instruments, Inc. supplied calibration and maintenance software start
U
et Span procedure by navigating to the Tools/Set Span/PulseCounts menu. The
S
oftware will display screen with current frequency and calculated Calibration
s
actor. Using the installation flow regulator, adjust the flow rate to 100% of FS flow.
F
Check the flow rate indicated against the flow calibrator. Once required flow rate is
established click Save button. The new Calibration Factor will be saved in to the
EEPROM table (index 61) and device linearization table (EEPROM indexes 62-83)
ill be initialized with default linear values.
w
ote: Described above procedure will reinitialize entire linearization table. If it is
N
desirable to keep existing linearization table and only minor adjustment of the
calibration curve is required it is recommended perform linearization table
adjustment starting from 90% FS (see Section 6.3).
alibration Factor also can be adjusted using local LCD/keypad interface (see
C
ection 4.9.3).
S
6.3 - Flow Meter Linearization Table Calibration
The DPW flow linearization table calibration involves building a table of the actual
flow values (EEPROM indexes 62, 64, 66, 68, 70, 72, 74, 76, 78, 80, 82) and
corresponding sensor readings (EEPROM indexes 63, 65, 67, 69, 71, 73, 75, 77,
9, 81, 83). Actual flow values are entered in normalized fraction format: 100.000%
7
S corresponds to 1.000000 flow value and 0.000% FS corresponds to 0.000000
F
low value. The valid range for flow values is from 0.000000 to 1.000000 (note:
f
DPW will accept up to 6 digits after decimal point). Sensor readings are entered in
pulses and should always be in the range of 10 to 4000. There are 11 elements in
the table so the data should be obtained at an increment of 10.0% FS (0.0, 10.0,
20.0, 30.0, 40.0, 50.0, 60.0, 70.0, 80.0, 90.0 and 100.0% FS).
7. Save ToutScale_mA in to the EEPROM: !11,MW,45,Y[CR]
Save ToutOffset_mA in to the EEPROM: !11,MW,46,Z[CR]
Where: Y – the calculated ToutScale_mA value.
Note: When done with the analog output calibration make sure the DAC update is
enabled and the BackDoor is closed (see command below).
Enable DAC update by typing: !11,WRITE,4,N[CR]
Unit will respond with: !11,DisableUpdate: N
Close BackDoor access by typing: !11,MW,1000,0[CR]
Unit will respond with: !11,BackDoorEnabled: N
6. DPW FLOW CALIBRATION PROCEDURES
NOTE: REMOVAL OF THE FACTORY INSTALLED CALIBRATION SEALS
AND/OR ANY ADJUSTMENTS MADE TO THE METER, AS DESCRIBED IN THIS
SECTION, WILL VOID ANY CALIBRATION WARRANTY APPLICABLE.
Note: All adjustments in this section are made from the outside of the meter via
digital communication interface between a PC (terminal) and DPW or via local
LCD/keypad. There is no need to disassemble any part of the instrument or perform
internal PCB component (potentiometers) adjustment.
6.1 - Connections and Initial Warm Up
Power up the DPW Flow Meter for at least 1 minute prior to commencing the
calibration procedure. Establish digital RS-485/RS-232 communication between
PC (communication terminal) and the DPW. Start Dwyer
maintenance software on the PC.
Z – the calculated ToutOffset_mA value.
®
supplied calibration and
Note: Do not alter memory index 62 (must be 0.0) and 63 (must be 0 counts).
These numbers represent zero flow calibration points and should not be changed.
If a new calibration table is going to be created, it is recommended to start
calibration from 100% FS. If only linearity adjustment is required, calibration can be
started in any intermediate portion of the gas table.
Using the flow regulator, adjust the flow rate to 100% FS flow. Check the flow rate
indicated against the flow calibrator. Observe the flow reading on the DPW. If the
difference between calibrator and DPW flow reading is more than 0.5% FS, make
a correction in the sensor reading in the corresponding position of the linearization
table (see Index 83).
If the DPW flow reading is more than the calibrator reading, the number of counts
in the index 83 must be decreased. If the DPW flow reading is less than the
calibrator reading, the number of counts in the index 83 must be increased. Once
Index 83 is adjusted with a new value, check the DPW flow rate against the
calibrator and, if required, perform additional adjustments for Index 83.
If a simple communication terminal is used for communication with the DPW, then
“MW” (Memory Write) command from the software interface commands set may be
used to adjust sensor value in the linearization table (see section 8.3 for complete
software interface commands list). Memory Read “MR” command can be used to
read the current value of the index.
Assuming the DPW is configured with RS-485 interface and has address “11”, the
following example will first read the existing value of Index 83 and then write a new
adjusted value:
!11,MR,83[CR] - reads EEPROM address 83
!11,MW,83,1200[CR] - writes new sensor value (1200 counts) in to the index 83
Once 100% FS calibration is completed, the user can proceed with calibration for
another 9 points of the linearization table by using the same approach.
Note: Once memory index 83 is changed the device firmware will automatically
update Calibration Factor (EEPROM index 61).
Note: It is recommended to use Dwyer
software for linearization table calibration. This software includes an automated
calibration procedure which may radically simplify reading and writing for the
EEPROM linearization table.
Page 17
®
supplied calibration and maintenance
Page 18

. RS-485/RS-232 SOFTWARE INTERFACE COMMANDS
7
.1 - General
7
he standard DPW comes with an RS-485 interface. For the optional RS-232
T
interface, the start character (!) and two hexadecimal characters for the address
must be omitted. The protocol described below allows for communications with the
unit using either a custom software program or a “dumb terminal.” All values are
ent as printable ASCII characters. For RS-485 interface, the start character is
s
lways (!). The command string is terminated with a carriage return (line feeds are
a
utomatically stripped out by the DPW). See Section 2.2.5 for information regarding
a
ommunication parameters and cable connections.
c
7.2 - Commands Structure
he structure of the command string:
T
<Addr>,<Cmd>,Arg1,Arg2,Arg3,Arg4<CR>
!
everal examples of commands for RS-485 option follow. All assume that the DPW
S
eter has been configured for address 18 (12 hex) on the RS485 bus:
m
. To get a flow reading: !12,F<CR>
1
The device will reply: !12,50.0<CR> (Assuming the flow is at 50.0% FS)
2. To get current Flow Alarm status: !12,FA,R<CR>
he device will reply: !12,FA,N<CR>
T
Assuming no alarm conditions)
(
. To get a Main Totalizer reading: !12,MT,R<CR>
3
The device will reply: !12,MT:93.05<CR>
. Set the flow high alarm limit to 85% FS flow rate:
4
he device will reply: !12,FA,H:85.0<CR>
T
12,FA,H,85.0<CR>
!
(Assuming the Main totalizer reading is 93.5)
Where:
! Start character **
Addr RS485 device address in the ASCII representation of
md The one or two character command from the table below.
C
rg1 to Arg4 The command arguments from the table below.
A
CR Carriage Return character.
** - OMIT FOR RS232 INTERFACE.
7.3 ASCII Commands Set
DPW METER ASCII SOFTWARE INTERFACE COMMANDS
Note: An * indicates power up default settings.
An ** indicates optional feature not available on all models.
Command
Name
Flow
Temperature
**
Diagnostic
Events
Diagnostic
Mask
Meter Info
Description
Requests the current flow sensor
reading in current EU.
Requests the current temperature
reading in current EU (°C or °F).
Read/reset current status of
Diagnostic Events log register.
Display/Set Diagnostic Events
mask register.
See list of the Diagnostic Events
below.
Requests meter configuration
info:
- full scale range (L/min)
- RTD option support(Y,N)
- Analog Flow Output
- Analog Temp. Output
exadecimal (00 through FF are valid).**
h
Multiple arguments are comma delimited.
configuration (V,C)
configuration (V,C)
No.
1
2
3
4
5
Command
F
T
DE
DM
MI
Argument 1
No Argument
(read status)
R (reset Event Log
register to 0x00)
No Argument
(read current
Diagnostic Events
Mask register)
<Value>
0x0000 to 0xFFFF
Note: All 6
characters are
required.
Several examples of commands for RS-232 option follow.
1. To get a flow reading: F<CR>
he device will reply: 50.0<CR>
T
2. To get current Flow Alarm status: FA,R<CR>
The device will reply: FA,N<CR> >
. To get a Main Totalizer reading: MT,R<CR>
3
he device will reply: MT:93.05<CR>
T
4. Set the flow high alarm limit to 85% FS flow rate:
The device will reply: FA,H:85.0<CR
Argument 2 Argument 3 Argument 4 Response
A,H,85.0<CR>
Assuming the flow is at 50.0% FS)
(
(Assuming no alarm conditions)
Assuming the Main totalizer reading is 93.5)
(
>
<Value> (Actual flow in
current engineering
units)
<Value> (Actual temp.
in current engineering
units)
DE:0x10
0x10 - diagnostic word
(16 bits wide)
DE: 0x0
DM: 0x9FFF diagnostic mask (16 bits
wide).
Set bit - Enable
Clear bit - Disable
DM: 0x9FFF
MI: 18.92706,Y,V,V
Y - RTD support
N - No RTD support
V - 0 to 5 VDC output
C - 4 to 20 mA output
Page 18
Page 19

ommand
C
ame
N
Flow Alarms
Temperature
Alarms**
Optical
Outputs
Main
Totalizer
escription
D
Sets / reads the status of the
flow alarms.
Note: High and Low limits have to
e entered in the % FS. High
b
larm value has to be more than
a
ow alarm value.
L
Alarm conditions:
Flow > High Limit = H
Flow < Low Limit = L
ow < Flow < High = N
L
Sets/reads the status of the
temperature alarms.
Note: High and low limits have to
be entered in the °C. High alarm
value has to be more than Low
alarm value.
larm conditions:
A
emp. > High Limit = H
T
Temp. < Low Limit = L
Low < Temp. < High
Assigns action of the two
optical outputs. The optical
output becomes active when
the condition specified by an
Argument 2 becomes true.
Argument 2:
D - no action, disabled*
FL - low flow alarm
FH - high flow alarm
FR - Range between High &
Low alarms
MT - main tot. reading > limit
PT - pilot tot. reading > limit
TL - low temp. alarm
TH - high temp. alarm
TR - Range between High &
Low temp. alarms
MC - Manual On Control
DE - Diagnostic Events
Sets and controls action of the
Main flow totalizer.
Note:
Main Totalizer reading is
stored in EEPROM (non
volatile) memory. Power cycle
will not affect Main Totalizer
reading.
o.
N
ommand
C
6
A
F
7
TA
8
0
9
MT
rgument 1
A
(high flow limit)
H
L (low flow limit)
A (action delay in
econds)
s
(enable alarm)
E
(disable alarm)*
D
(read current
R
status)
S (read current
tatus)
s
B Block (latch)
mode
H (high flow limit)
(low flow limit)
L
A (action delay in
seconds)
E (enable alarm)
(disable alarm)*
D
(read current
R
tatus)
s
S (read current
settings)
B Block (Latch)
mode
1 (output #1)
2 (output #2)
Z (reset to zero)
F(start totalizer at
flow % FS)
L (limit gas volume
in current E.U.)
D (disable
totalizer)*
E (enable totalizer)
R (read current
totalizer volume)
S (setting status)
rgument 2
A
Value> (0 to
<
00% FS)
1
<Value> (0 to
100% FS)
<Value> (0 to 3600
ec)
s
<Value>
(0 to disabled*)
1 to enabl’d L)
(
to enabl’d H)
2
e to both L, H)
(
<Value>
(-10.1 to 100°C)
Value>
<
(-10.1 to 100°C)
<Value>
(0 to 3600 sec.)
<Value>
(0 to disabled*)
(1 to enabl’d L)
(2 to enabl’d H)
(3 to both L, H)
D*
FL
FH
FR
MT
PT
TL
TH
TR
DE
MC
S (read current
settings)
rgument 3 Argument 4 Response
A
AH: <Value (% FS)>
F
FAL: <Value (% FS)>
FAA: <Value (sec)>
A:E
F
A:D
F
A:N (no alarm)
F
FA:H (high alarm)
FA:L (low alarm)
FAS:M,L,H.D,B where:
- mode (E/D)
M
- low settings (%FS)
L
- high settings (%FS)
H
D - Action delay (sec)
B - Latch mode (0 to 3)
FAB:<Value> where:
Value = 0 to 3
TAH: <Value (°C)>
AL: <Value (°C)>
T
TAA: <Value (sec)>
TA:E
A:D
T
A:N (no alarm)
T
A:H (high alarm)
T
TA:L (low alarm)
TAS:M,L,H.D,B where:
M - mode (E/D)
L - low settings (°C)
H - high settings (°C)
D - Action delay (sec)
B - Latch mode (0 to 3)
TAB: <Value> where:
Value = 0 to 3
01:D or 02:D
01:FL or 02:FL
01:FH or 02:FH
01:FR or 02:FR
01:MT or 02:MT
01:PT or 02:PT
01:TL or 02:TL
01:TH or 02:TH
01:TR or 02:TR
01:DE or 02:DE
01:MC or 02:MC
0x:D
MTZ
MTF: <value>
MTL: <value>
MT:D
MT:E
MTR: <value>
(in current EU)
MTS: Mode, Start, Limit
Page 19
Page 20

Command
Name
Pilot
otalizer
T
ow Flow
L
Cut Off
luid Density
F
nits
U
Maintenance
Timer
Pulse
Measure
Interval
Flow
Measure
Mode
Description
Sets and controls action of the
ilot flow totalizer.
P
OTE:
N
ilot Totalizer reading is stored in
P
RAM (volatile) memory. Power
S
cycle will reset Pilot Totalizer
reading to zero.
isplay /Change Meter Low Flow
D
Cut Off settings in % FS.
isplay /Change Meter Low Flow
D
Cut Off settings in % FS.
Set the units of measure for gas
low and totalizer reading.
f
ote: The units of the totalizer
N
output are not per unit time.
For user defined units: k-factor
value represents conversion value
from L/min.
Time base argument:
S – seconds
M – minutes
H – hours
Density argument:
Y–use density
N–do not use density
Hours since last time unit was
calibrated.
Note: Has to be reset to zero after
calibration.
Display/change meter pulse
measure interval settings.
Note: Pulse measure interval has
to be in the range: 500 mS ≤ MI ≤
60000 mS
Display/change meter flow
measuring mode
Following measurement modes are
supported:
W - Pulse width
C - Number of pulses per measure
interval
No.
10
1
1
1
14
15
16
1
2
3
Command
PT
O
C
D
F
U
C
I
MM
Argument 1
Z (reset to zero)
(start totalizer at
F
low % FS)
f
(limit gas volume
L
n current E.U.)
i
D (disable
totalizer)*
E (enable totalizer)
(read current
R
otalizer volume)
t
(setting status)
S
Cut off Value>
<
(0 to 10.0%)
No Argument
(Returns current
ut off value
c
ettings)
s
New Density
(
Value) 0.01 ≤
Density ≤ 5.0 g/cm
No Argument
Returns Current
(
ensity in g/cm
D
(% FS)*
%
3
)
mL/sec
L/min
m
L/hr
m
/sec
L
L/min
L/hr
3
m
/sec
3
m
/min
3
m
/hr
3
ft
/sec
3
ft
/min
3
ft
/hr
g/sec
g/min
g/hr
kg/sec
kg/min
kg/hr
Lb/sec
Lb/min
Lb/hr
Gl/sec
Gl/min
Gl/hr
t/sec
t/min
t/hr
USER
(user defined)
No Argument
(status)
R (read timer)
Z (set timer to
zero)
<new value> in mS
No Argument
(Returns current MI
settings in mS)
<New Mode>
W - Pulse Width*
C - # of Pulses
No Argument
(Returns Current
settings)
Argument 2
Value> (flow
<
FS)
%
value> (gas
<
olume)
v
3
Argument 3 Argument 4 Response
PTZ
TF: <value>
P
TL: <value>
P
PT:D
PT:E
TR: <value>
P
in current EU)
(
TS: Mode, Start, Limit
P
O: <Cut off Value>
C
Example: CO:2:0
CO: <Cut off Value>
Example: CO:2:0
D: <value>
F
FD: <value>
xample: FD:1.000
E
:%
U
U:mL/sec
:mL/min
U
:mL/hr
U
:L/sec
U
U:L/min
U:L/hr
3
U:m
/sec
3
U:m
/min
3
U:m
/hr
3
U:ft
/sec
3
U:ft
/min
3
U:ft
/hr
U:g/sec
U:g/min
U:g/hr
U:kg/sec
U:kg/min
U:kg/hr
U:Lb/sec
U:Lb/min
U:Lb/hr
U:Gl/sec
U:Gl/min
U:Gl/hr
U:t/sec
U:t/min
U:t/hr
U:USER,<F>,<T>,<D>
U,<EU name>
CR:<value>
CZ
I:<value>
Example: I:2000
I:<value>
Example: I:2000
MM:<value>
Example: MM:W
MM:<value>
Example: MM:W
Page 20
Page 21

Command
Name
low Meter
F
inearizer
L
LCD Back
Light**
Noise
Reduction
Filter
Read
EEPROM
Memory
rite
W
ERPROM
E
emory
M
UART Error Codes:
1-Not Supported Command or Back Door is not enabled.
2-Wrong # of Arguments.
3-Address is Out of Range (MR or MW commands).
4-Wrong # of the characters in the Argument.
5-Attempt to Alter Write Protected Area in the EEPROM.
6-Proper Command or Argument is not found.
7-Wrong value of the Argument.
8-Reserved.
9-Manufacture specific info EE KEY (wrong key or key is disabled).
Description
nable/disable flow meter
E
inearizer
l
Display/change LCD back light
settings
ote: LCD back light settings has
N
o be in the range: )% ≤ BL ≤ 80%
t
Noise Reduction Filter parameter
settings. Following arguments
supported:
- Running Average Time
T
nterval (0-99 seconds)
I
-Running Average Number
N
of samples (1-32)
Reads the value in the specified
memory location.
Writes the specified value to the
pecified memory location. Use
s
arefully, can cause unit to
C
malfunction.
Note: Some addresses are
(
rite protected!)
w
No.
17
1
1
2
21
8
9
0
Command
FL
L
B
R
N
R
M
MW
Argument 1
<New Value>
E or D
o Argument
N
Returns current
(
inearizer settings)
l
New LCD back
(
light value) 0 to 80%
No Argument
(Returns current
CD back light
L
ettings)
s
(time interval)
T
(number of
N
samples)
S (status)
to 100 (memory
0
index table)
20 to 100 (memory
index table)
Argument 2
Value
Diagnostic events codes and bit position:
1. CPU Temp. High 0
2. Flow > 125% FS 1
. High Flow Alarm 2
3
4. Low Flow Alarm 3
5. High Temperature Alarm 4
6. Low Temperature Alarm 5
7. Temperature Above Limit 6
8. Temperature Below Limit 7
9. Main Totalizer ≥ Limit 8
10. Pilot Totalizer ≥ Limit 9
11. EEPROM Failure A
12. DC/DC converter Voltage too High B
13. DC/DC converter Voltage too Low C
14. Communication Error D
15. Reserved E
16. Fatal ERROR F
Argument 3 Argument 4 Response
FL:<value>
Example: FL:E
L:<value>
F
xample: FL:E
E
L:<value>
B
Example: BL:50
BL:<value>
Example: BL:50
RT:5
N
RN:5
N
NR:5,5
memory value>
<
MW,XXX,<value>
where:
XX = table index
X
xample:
E
MW,100,”Meter#6”
Page 21
Page 22

. Troubleshooting
8
.1 - Common Conditions
8
our DPW Flow Meter was thoroughly checked at numerous quality control points
Y
during and after manufacturing and assembly operations. It was calibrated
according to your desired flow and pressure conditions for a given fluid. It was
carefully packed to prevent damage during shipment. Should you feel that the
nstrument is not functioning properly, please check for the following common
i
onditions first:
c
re all cables connected correctly? Are there any leaks in the installation? Is the
A
power supply correctly selected according to requirements? When several meters
are used a power supply with appropriate current rating should be selected. Were
the connector pinouts matched properly? When interchanging with other
anufacturers' equipment, cables and connectors must be carefully wired for
m
orrect pin configurations. Is the pressure differential across the instrument
c
ufficient?
s
ikely Reason
No.
Indication
1
LCD display remains blank when unit is powered
up. No response when flow is introduced from
analog outputs 0 to 5 Vdc or 4 to 20 mA.
2
CD display reading and/or flow analog output 0
L
to 5 Vdc signal fluctuate in wide range during
flow measurement.
3
CD display reading or /and temperature analog
L
output 0 to 5 Vdc signal fluctuate in wide range
during flow measurement.
4
LCD display reading does correspond to the
correct flow range, but 0 to 5 Vdc output signal
oes not change (always the same reading or
d
round zero).
a
5
LCD display flow reading and 0 to 5 Vdc output
voltage do correspond to the correct flow range, but
4 to 20 mA output signal does not change (always
the same or reading around 4.0 mA).
6
LCD display temperature reading and 0 to 5 Vdc
output voltage do correspond to the correct flow
range, but 4 to 20 mA output signal does not
change (always the same or reading around 4.0
mA).
7
Fluid flows through the DPW meter and Paddle
Wheel is turning, but LCD Display reading and the
flow output voltage 0 to 5 Vdc signal do not respond
to flow.
8
Fluid flows through the DPW meter and Paddle
Wheel is turning, but LCD Display reading and
the flow output voltage 0 to 5 Vdc signal do not
respond to flow. There is no pulse output signals
from pin C of the 12 pin M16 connector.
9
The Temperature reading on the LCD and analog 0
to 5 Vdc or 4 to 20 mA is not correct (out of the
device measurement range: -10 to 70C).
10
The DPW Diagnostic Alarm Event with code
0 – “CPU Temp. High” is active.
11
The DPW Diagnostic Alarm Event with code F “Fatal Error” is active.
L
Power supply is bad or polarity is
reversed
C board is defective.
P
low output 0 to 5 Vdc signal (pin L of
F
he 12 pin M16 connector) is shorted on
t
the GND or overloaded.
Temperature output 0 to 5 Vdc signal (pin
M of the 12 pin M16 connector) is
shorted on the GND or overloaded.
utput 0 to 5 Vdc schematic is burned
O
ut or damaged.
o
nalog flow output scale and offset
A
variable are corrupted.
External loop is open or load resistance
more than 500 Ω.
Flow output 4 to 20 mA schematic is
burned out or damaged.
External loop is open or load resistance
more than 500 Ω.
Temperature output 4 to 20 mA
schematic is burned out or damaged.
The fluid flow rate is below set Low flow
cut-off value.
Sensor or PC board is defective.
DPW magnetic sensor is defective.
Paddle Wheel magnets are defective.
RTD connector got loose and is not
connected to the PCB board.
RTD sensor is defective.
MCU temperature is too high (overload).
Fatal Error (EEPROM or SRAM
corrupted).
olution
S
Measure voltage on pins A and B of the 12 pin M16 connector. If
voltage is out of specified range, then replace power supply with a
new one. If polarity is reversed (reading is negative) make correct
connection.
eturn DPW to factory for repair.
R
heck external connections to pin L of the 12 pin M16 connector.
C
ake sure the load resistance of the equipment connected to the
M
flow 0 to 5 Vdc output is more than 1000 Ω.
heck external connections to pin M of the 12 pin M16 connector.
C
ake sure the load resistance of the equipment connected to the
M
flow 0 to 5 Vdc output is more than 1000 Ω.
Return DPW to factory for repair.
Restore original EEPROM scale and offset variable or perform analog
utput recalibration (see section 5.2).
o
Check external connections to pins L and K of the 12 pin M16
connector. Make sure the loop resistance is less than 500 Ω.
Return DPW to factory for repair.
Check external connections to pins M and K of the 12 pin M16
connector. Make sure the loop resistance is less than 500 Ω.
Return DPW to factory for repair.
Check settings for Low flow cut-off value and make required
adjustment.
Return DPW to factory for repair.
Replace DPW magnetic sensor.
Replace DPW Paddle Wheel.
Check RTD connector, make sure it is firmly attached to the header
J2 on the PCB.
Replace RTD sensor.
Disconnect power from the DPW. Make sure the ambient
temperature is within specified range (below 70° C). Let the device
cool down for at least 15 minutes. Apply power to the DPW and
check Diagnostic Alarm Event. If overload condition will be indicated
again the unit has to be returned to the factory for repair.
Cycle the power on the DPW. If Diagnostic Alarm Event with code
F indicating again the unit has to be returned to the factory for
repair.
Page 22
Page 23

o.
N
ndication
I
0
lankEEPROM[10]
B
1
erialNumber[20]
S
2
odelNumber[20]
M
3
SoftwareVer[10]
4
ManufReservedF1
5
ManufReservedF2
6
eterCalFactorM
M
7
eterSize
M
8
eservedText[12]
R
9
anufReservedF3
M
10
ManufReservedF4
11
ManufReservedF5
12
ManufReservedF6
3
1
anufReservedUI1
M
4
1
anufReservedUI2
M
5
1
anufReservedUI3
M
16
ManufReservedUI4
17
ManufReservedSI1
18
ManufReservedSI2
19
ManufReservedSI3
0
2
imeSinceCalHr
T
1
2
rotectionCode
P
22
ackLight
B
23
BackLightMode
4
2
LCD_Diagnostic
5
2
Address485
6
2
FlowUnits
27
larmMode
A
28
owAlarmPFS
L
29
HiAlarmPFS
30
AlmDelay
31
RelaySetting
32
TotalMode
33
TotalFlowStart
34
TotalVolStop
35
TotalConfLock
36
UDUnitKfactor
37
UDUnitTimeBase
38
UDUnitDensity
39
FoutScaleV
40
FoutOffsetV
41
FoutScalet_mA
42
FoutOffset_mA
43
ToutScaleV
44
ToutOffsetV
45
ToutScalet_mA
46
ToutOffset_mA
47
FlowMeasureMode
48
OptOut1_Config
49
OptOut2_Config
50
RTD_LinearMode
51
AlarmLatch
52
PTotalMode
53
Reserved
54
PTotalVolStop
55
PTotalFlowStart
56
MeterFSRange
57
LowFlowCutOff
58
Damping
59
Density
60
PulseMeasInt
61
MeterCalFactor
62
FlowTbl[0].FlowPFS
63
FlowTbl[0].LinCounts
64
FlowTbl[1].FlowPFS
65
FlowTbl[1].LinCounts
66
FlowTbl[2].FlowPFS
67
FlowTbl[2].LinCounts
68
FlowTbl[3].FlowPFS
69
FlowTbl[3].LinCounts
70
FlowTbl[4].FlowPFS
71
FlowTbl[4].LinCounts
72
FlowTbl[5].FlowPFS
73
FlowTbl[5].LinCounts
®
wyer
PW Flow Meter EEPROM Variables Rev:A002 [10/01/2009]
D
ote: indexes 0-19 are write protected (manufacture and calibration specific data)
N
D
Data Type
char[10]
har[20]
c
har[20]
c
har[10]
c
float
float
float
loat
f
har[12]
c
loat
f
loat
f
float
float
uint
int
u
int
u
int
u
int
int
int
float
int
u
int
int
uint
har[4]
c
nt
i
int
u
float
float
uint
char[4]
uint
float
float
uint
float
int
uint
float
float
float
float
float
float
float
float
uint
uint
uint
uint
uint
uint
uint
float
float
float
float
uint
float
uint
uint
float
uint
float
uint
float
uint
float
uint
float
uint
float
uint
APPENDIX I
otes
N
Do not modify. Table Revision [PROTECTED]
Serial Number [PROTECTED]
Model Number [PROTECTED]
irmware Version [PROTECTED]
F
anufacture Specific float data [PROTECTED]
M
anufacture Specific float data [PROTECTED]
M
anufacture Assigned Number of Pulses per Gallon [PROTECTED]
M
Size of the meter ’s flow tube [mm] [PROTECTED]
Reserved for Manufacture Specific Text Info [PROTECTED]
Manufacture Specific float data [PROTECTED]
anufacture Specific float data [PROTECTED]
M
anufacture Specific float data [PROTECTED]
M
anufacture Specific float data [PROTECTED]
M
Manufacture Specific uint data [PROTECTED]
Manufacture Specific uint data [PROTECTED]
Manufacture Specific uint data [PROTECTED]
Manufacture Specific uint data [PROTECTED]
Manufacture Specific int data [PROTECTED]
anufacture Specific int data [PROTECTED]
M
anufacture Specific int data [PROTECTED]
M
ime elapsed since last calibration in hours
T
Program Parameters Protection Code [0-255]
ack Light Level [0-4095]**
B
ack Light Mode (E-Enable/D-Disable)**
B
LCD Diagnostic Mode: [0, 1]
Two hexadecimal characters address for RS485 only [01-FF]
Current Units of Measure [0-28]
Flow Alarm Mode (0=Disabled, 1=Enabled)
ow Flow Alarm Setting [%FS] 0-Disabled
L
High Flow Alarm Setting [%FS] 0-Disabled
Flow Alarm Action Delay [0-3600sec] 0-Disabled
Relays Assignment Setting**
Totalizer Mode [1- Enabled, 0 - Disabled]
Start Main Totalizer at flow [%FS] 0 - Disabled
Main Totalizer Action Limit Volume [%*s] 0- Disabled
Key Pad Totalizer reset access Lock [0 – Disabled, 1 – Enabled]
K-Factor for User Defined Units of Measure
K-Factor = UDUnit/(L/min)
User Defined Unit Time Base [1, 60, 3600 sec]
User Defined Unit Density Flag [0-not used, 1 - used]
Flow Analog 0 to 5 Vdc Out Scale
Flow Analog 0 to 5 Vdc Out Offset
Flow Analog 4 to 20 mA Out Scale
Temperature Analog 0 to 5 Vdc Out Scale**
Temperature Analog 0 to 5 Vdc Out Offset**
Temperature Analog 4 to 20 mA Out Scale**
Temperature Analog 4 to 20 mA Out Offset**
0-Pulse width measure, 1 - Number of Pulses per measure interval
Optical Output #1 Configuration (function) [0-10]
Optical Output #2 Configuration (function) [0-10]
RTD Linearizer (0-Disabled, 1-Enabled)**
Alarm Latch settings [0-3]
Pilot Totalizer mode (0-Disabled, 1-Enabled)
Reserved
Start Pilot Totalizer at flow [%FS] 0 - Disabled
Pilot Totalizer Action Limit Volume [%*s] 0-Disabled
Meter Full Scale range in L/min
Low Flow cut off. Must be between 0 and 10.0 %FS
Flow Reading Damping 1-99 seconds
Fluid Density g/cm3 [0.01 - 5.00000 g/cm3]
Flow Pulse Measure Interval in mS [500-60000]
Calibration Factor:Number of Pulses per Gallon
Flow Linearizer Index 0 PFS (must be 0.0)
Flow Linearizer Index 0 Counts (must be 0)
Flow Linearizer Index 1 PFS [0.0 – 1.0]
Flow Linearizer Index 1 Counts
Flow Linearizer Index 2 PFS [0.0 – 1.0]
Flow Linearizer Index 2 Counts
Flow Linearizer Index 3 PFS [0.0 – 1.0]
Flow Linearizer Index 3 Counts
Flow Linearizer Index 4 PFS [0.0 – 1.0]
Flow Linearizer Index 4 Counts
Flow Linearizer Index 5 PFS [0.0 – 1.0]
Flow Linearizer Index 5 Counts
Page 23
Page 24

o.
N
ndication
I
4
7
lowTbl[6].FlowPFS
F
5
7
lowTbl[6].LinCounts
F
76
FlowTbl[7].FlowPFS
77
FlowTbl[7].LinCounts
78
FlowTbl[8].FlowPFS
9
7
lowTbl[8].LinCounts
F
0
8
lowTbl[9].FlowPFS
F
1
8
lowTbl[9].LinCounts
F
2
8
lowTbl[10].FlowPFS
F
83
FlowTbl[10].LinCounts
84
T_InScale
85
T_InOffset
6
8
_Mode
T
7
8
iagEventMask
D
8
8
lowLinearizer
F
89
T_AlarmMode
90
T_AlarmDelay
91
T_AlarmLatch
2
9
T_LowAlarm_C
3
9
_HiAlarm_C
T
4
9
eservedF3
R
95
luidName[20]
F
96
CalibratedBy[20]
97
CalibratedAt[20]
98
DateCalibrated[12]
99
DateCalibrationDue[12]
100
UserTagName
101
EEMagicNumber
** Not supported in some hardware configurations
Data Type
loat
f
int
u
loat
f
int
u
float
uint
float
int
u
loat
f
int
u
loat
f
float
float
uint
int
u
int
u
uint
uint
float
float
loat
f
har[20]
c
har[20]
c
char[20]
char[12]
char[12]
char[12]
int
u
otes
N
Flow Linearizer Index 6 PFS [0.0 – 1.0]
Flow Linearizer Index 6 Counts
Flow Linearizer Index 7 PFS [0.0 – 1.0]
low Linearizer Index 7 Counts
F
low Linearizer Index 8 PFS [0.0 – 1.0]
F
low Linearizer Index 8 Counts
F
low Linearizer Index 9 PFS [0.0 – 1.0]
F
Flow Linearizer Index 9 Counts
Flow Linearizer Index 10 PFS [0.0 – 1.0]
Flow Linearizer Index 10 Counts
emperature RTD input Scale**
T
emperature RTD input Offset**
T
eserved**
R
ask for Diagnostic Events: Clear bit-> mask corresponding event.
M
Default mask is 0xFFFFh
Flow Linearizer (0-Disabled, 1-Enabled)
Temp. Alarm Mode (0=Disabled, 1=Enabled)**
elay in seconds 0-3600 for Tem.Alarm action**
D
emp Alarm Latch 0-3**
T
ow Temperature Alarm in %FS [-.1-1]**
L
High Temperature Alarm in %FS [-.1-1]**
Reserved
Name of the Liquid used for Calibration
Name of person, meter was calibrated by
ame of the Calibration Lab
N
alibration date
C
Date calibration due
ser Defined Device Tag Name or Number
U
umber used to verify EEPROM integrity
N
PPENDIX II
A
Component Diagram Top Side
Component Diagram Bottom Side
Page 24
Page 25

FLOWFLOW
2X PROCESS CONNECTIONS
PADDLEWHEEL BEHIND ACRYLIC,
O
-RING SEALED, COVER
15/32
[
11.99]
1-19/32
[
40.39]
DPW
D
IGITAL LIQUID
FLOW METER
4-1/2
[
114.30]
2
-1/16
[52.37]
CABLE
C
ONNECTION
2
[
50.80]
4-13/32
[
111.76]
AUTION
C
RADEMARKS
T
®
wyer
s a registered trademark of Dwyer Instruments, Inc..
D
i
®
Buna
is a registered trademark of DuPont Dow Elastometers.
®
Kalrez
is a registered trademark of DuPont Dow Elastomers.
®
VCR
is a registered trademark of Swaglok Marketing Co.
®
Viton
is a registered trademark of Dupont Dow Elastometers L.L.C.
his product is not intended to be used in life support applications!
T
PPENDIX III
A
Dimensional Drawing
PPENDIX IV
A
Page 25
Page 26

Page 26
©Copyright 2013 Dwyer Instruments, Inc. Printed in U.S.A. 5/13 FR# RA-444053-00
DWYER INSTRUMENTS, INC.
Phone: 219/879-8000 www.dwyer-inst.com
P.O. BOX 373 • MICHIGAN CITY, INDIANA 46360, U.S.A. Fax: 219/872-9057 e-mail: info@dwyer-inst.com
 Loading...