

Page 1
| 1
Mini-Manual
Electrical Impedance Tomography (EIT)
Device handling, application tips and examples
D-30766-2017
Christian Bozsak
Eckhard Teschner
Page 2

Page 3

| 3
© 2018 Drägerwerk AG & Co. KGaA
Moislinger Allee 53–55 · 23558 Lübeck
All rights, in particular the right of
reproduction, distribution and translation, reserved.
Printed in Germany
This manual is intended to provide additional guidance for the use of PulmoVista
®
500.
The information and data provided in this manual are subject to technical changes.
For the use of the Dräger products, the instructions for use enclosed with the products
always apply and are not in any way replaced or otherwise superseded by this manual.
Medical knowledge is subject to constant change due to research and clinical experience.
The authors of this publication have taken utmost care to ensure that all information
provided, in particular concerning applications and effects, is current at the time of
publication. This does not, however, absolve readers of the obligation to take clinical
measures on their own responsibility.
The use of registered names, trademarks, etc. in this publication does not imply, even
in the absence of a specific statement, that such names are exempt from the relevant
protective laws and regulations.
Page 4

4 |
Table of Contents
Page
INTRODUCTION 6
1. PREPARE THE DEVICE FOR THE CLINICAL USE 7
1.1. Start and Device Check
1.2. Selection and application of the electrode belt
1.2.1. Choosing the right belt size
1.2.2. Attach patient cable to electrode belt
1.2.3. Prepare the patient
1.2.4. Prepare the electrode belt
1.2.5. Positioning of the electrode belt on the thorax
1.2.6. General procedure when attaching the belt
1.3. Signal Check
1.4. Settings before starting an EIT measurement
1.5. Start the EIT session
1.6. Check the correct electrode belt position
1.7. Special Case: 15-electrode mode
7
8
8
10
11
12
12
12
16
17
17
18
20
2. DIFFERENT VIEWS AND THEIR SPECIAL PROPERTIES 21
2.1. Main and Fullscreen view
2.1.1. Referencing
2.1.2. Regions of Interest (ROIs)
2.2. Trend views – End-inspiratory and End-expiratory
2.3. Diagnostic View
2.3.1. Conduct analysis dialogue window
2.3.2. Results of the analysis
21
23
24
26
28
28
30
Page 5

Table of Contents
| 5
Page
3. USEFUL TOOLS AND TIPS 32
3.1. Contour of ventilated area
3.2. Negative impedance changes
3.3. Filtration
3.4. Save screenshot and record EIT data
3.5. Coupling of a Dräger ventilator with Pulmovista® 500
3.6. Frame rate
32
34
35
37
38
39
4. CLINICAL APPLICATION
4.1. Identify responder or non-responder to a recruitment-maneuver (RM)
4.2. Identify possible de-recruitment and overdistension
4.3. Influence of positioning on the distribution of ventilation
4.4. Patient proning
4.5. Intubation Check
4.6. Patient with pleural effusion
4.7. ΔEELI-trend after suction
5. EIT-TERMINOLOGY
6. CONTRAINDICATIONS
39
40
43
45
46
47
47
48
49
51
Page 6
6 |
Introduction
Welcome to the world of Electrical Impedance Tomography (EIT).
PulmoVista
®
500 is the first clinical EIT device which up to date has been used
in several thousand patients. EIT is a non-invasive imaging technique that gives
you a special view inside the lungs. In a cross-sectional projection, the distribution
of the tidal volume in the thorax is shown. This illustration shows ventilated and
non-ventilated areas of the lungs as well as their changes as a function of time.
The device can be used in various situations in everyday clinical practice. You
have the ability to examine at the bedside the status of your patients' lung, track
and assess therapeutic measures in real time.
This manual is intended to assist you in the use of this device and to provide
tips and special features in order to implement the presented information in a
practical way.
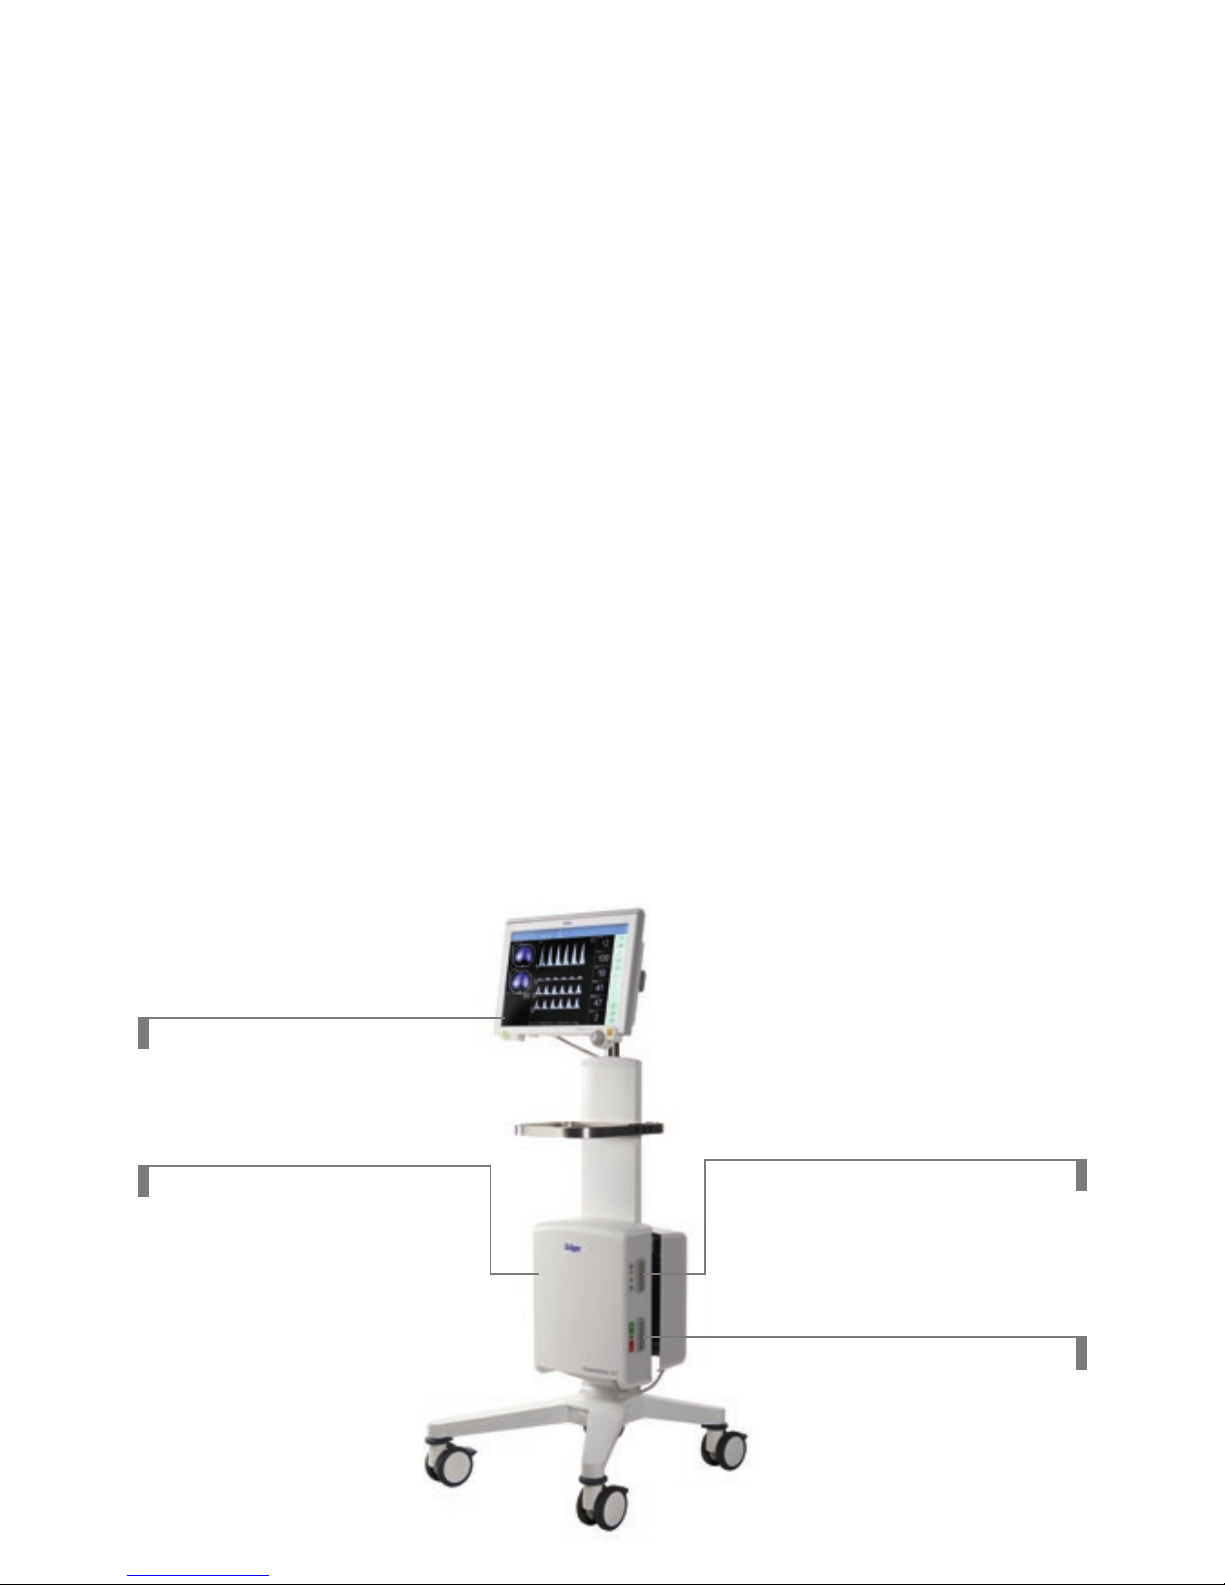
D-4671-2017
Trunk cable port
Test connector
Cockpit
EIT-Module
PulmoVista® 500
Page 7
Prepare the device for the clinical use
| 7
1. Prepare the device for the clinical use
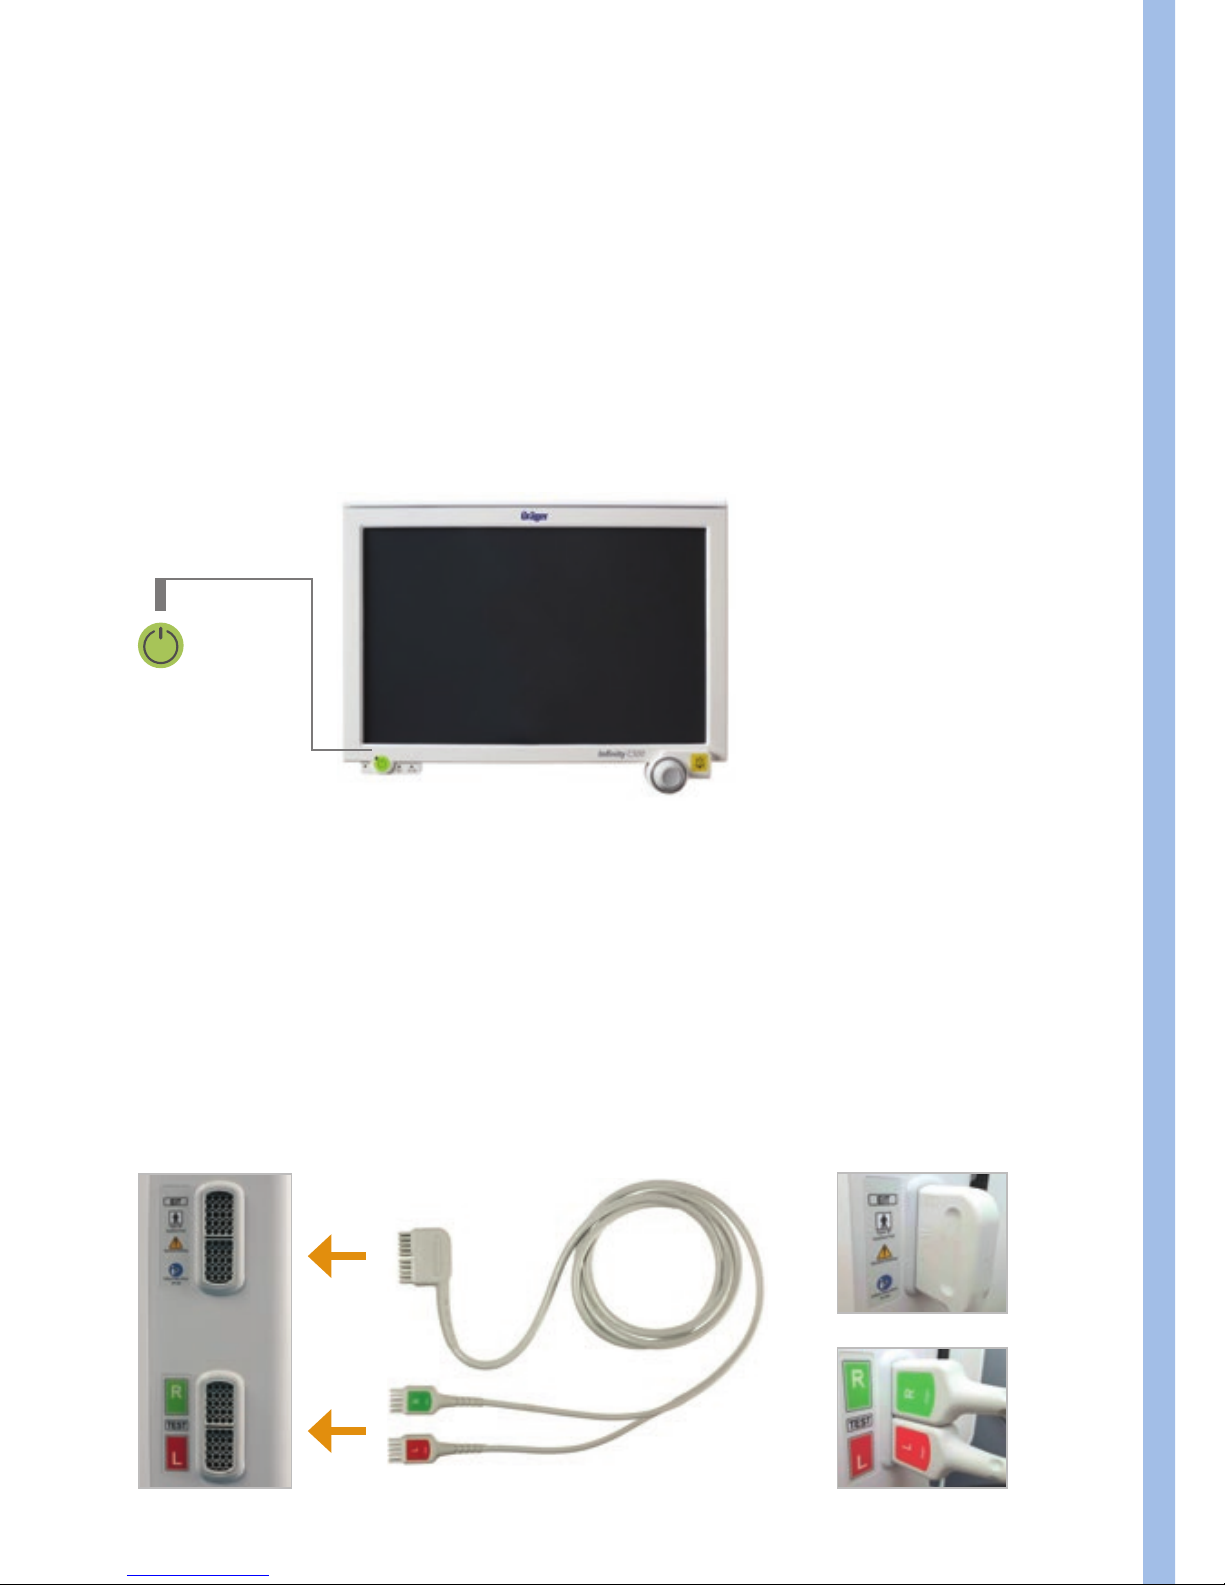
1.1. START AND DEVICE CHECK
Press the green power button in the lower left corner of the screen to turn on
the device. The device check ensures that all components of the device and the
trunk cable (cable from the device to the patient) function properly.
1. Make sure the device is in standby mode (Start / Standby).
2. Plug-in the trunk cable into the trunk cable port and insert the patient
cable plugs into their respective test connectors → match label and color.
D-2280-2010 | D-2281-2010
D-11961-2017
D-11960-2017
D-15487-2017
Page 8
8 |
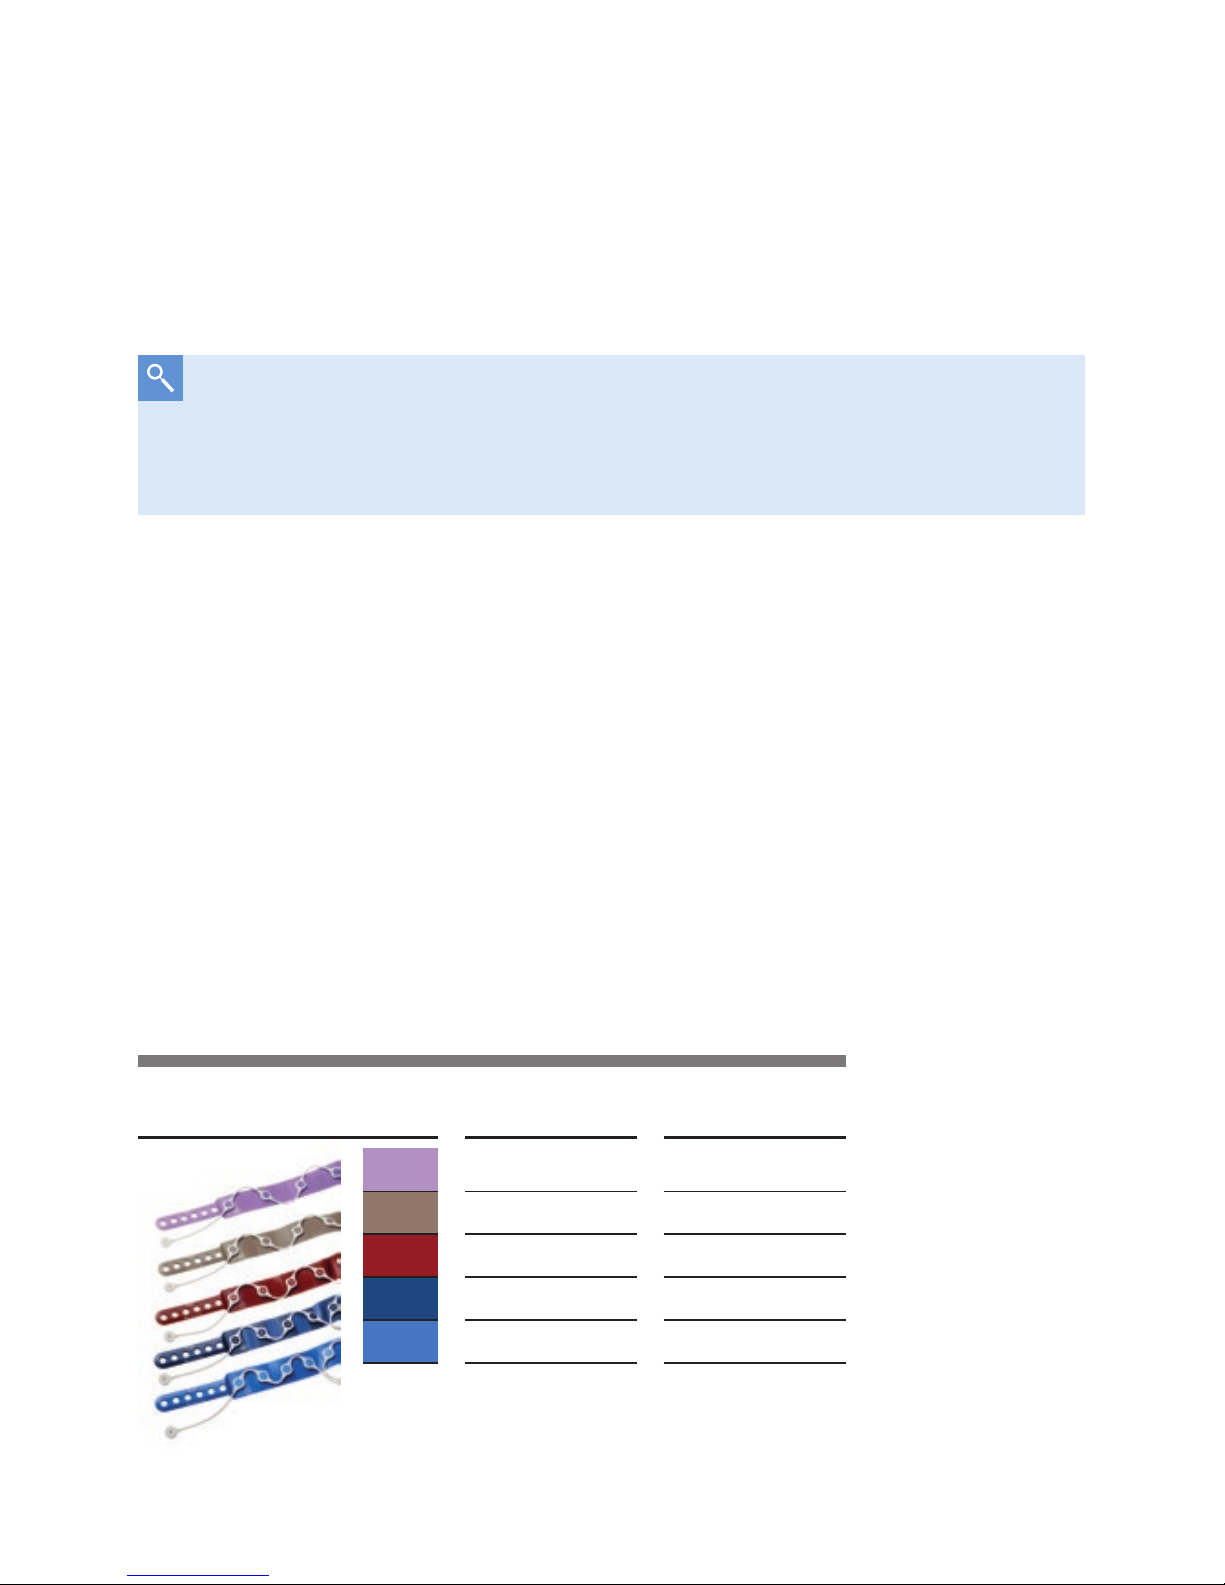
Size table
Size in cm Size in inch
XXL 124 – 150 49 – 59
XL 106 – 127 42 – 50
L 92 – 110 36 – 43
M 80 – 96 31 – 38
S 70 – 85 28 – 33
3. Select ›Device Check‹.
4. Select
›Start‹ and confirm with the
Rotary Knob
.
5. The device check is running automatically. Wait for the test phase to finish.
The device will announce the test result.
D-6061-2014
1.2. SELECTION AND APPLICATION OF THE ELECTRODE BELT
If the device check fails, check the message and, if necessary, the
connectors. If the problem persists, stop using the device and contact
customer service.
1.2.1. Choose the right belt size
The application requires an EIT patient interface. This consists of an elastic
electrode belt (16 electrodes) and an attachable patient cable. In order to cover
a wide patient spectrum, there are five belt sizes, from 70 cm to 150 cm chest
circumference. Electrode belt and patient cable are marked in size and color.
Both the electrode belt and the patient cable are reusable and can be disinfected
with wipes.
Page 9
Prepare the device for the clinical use
| 9
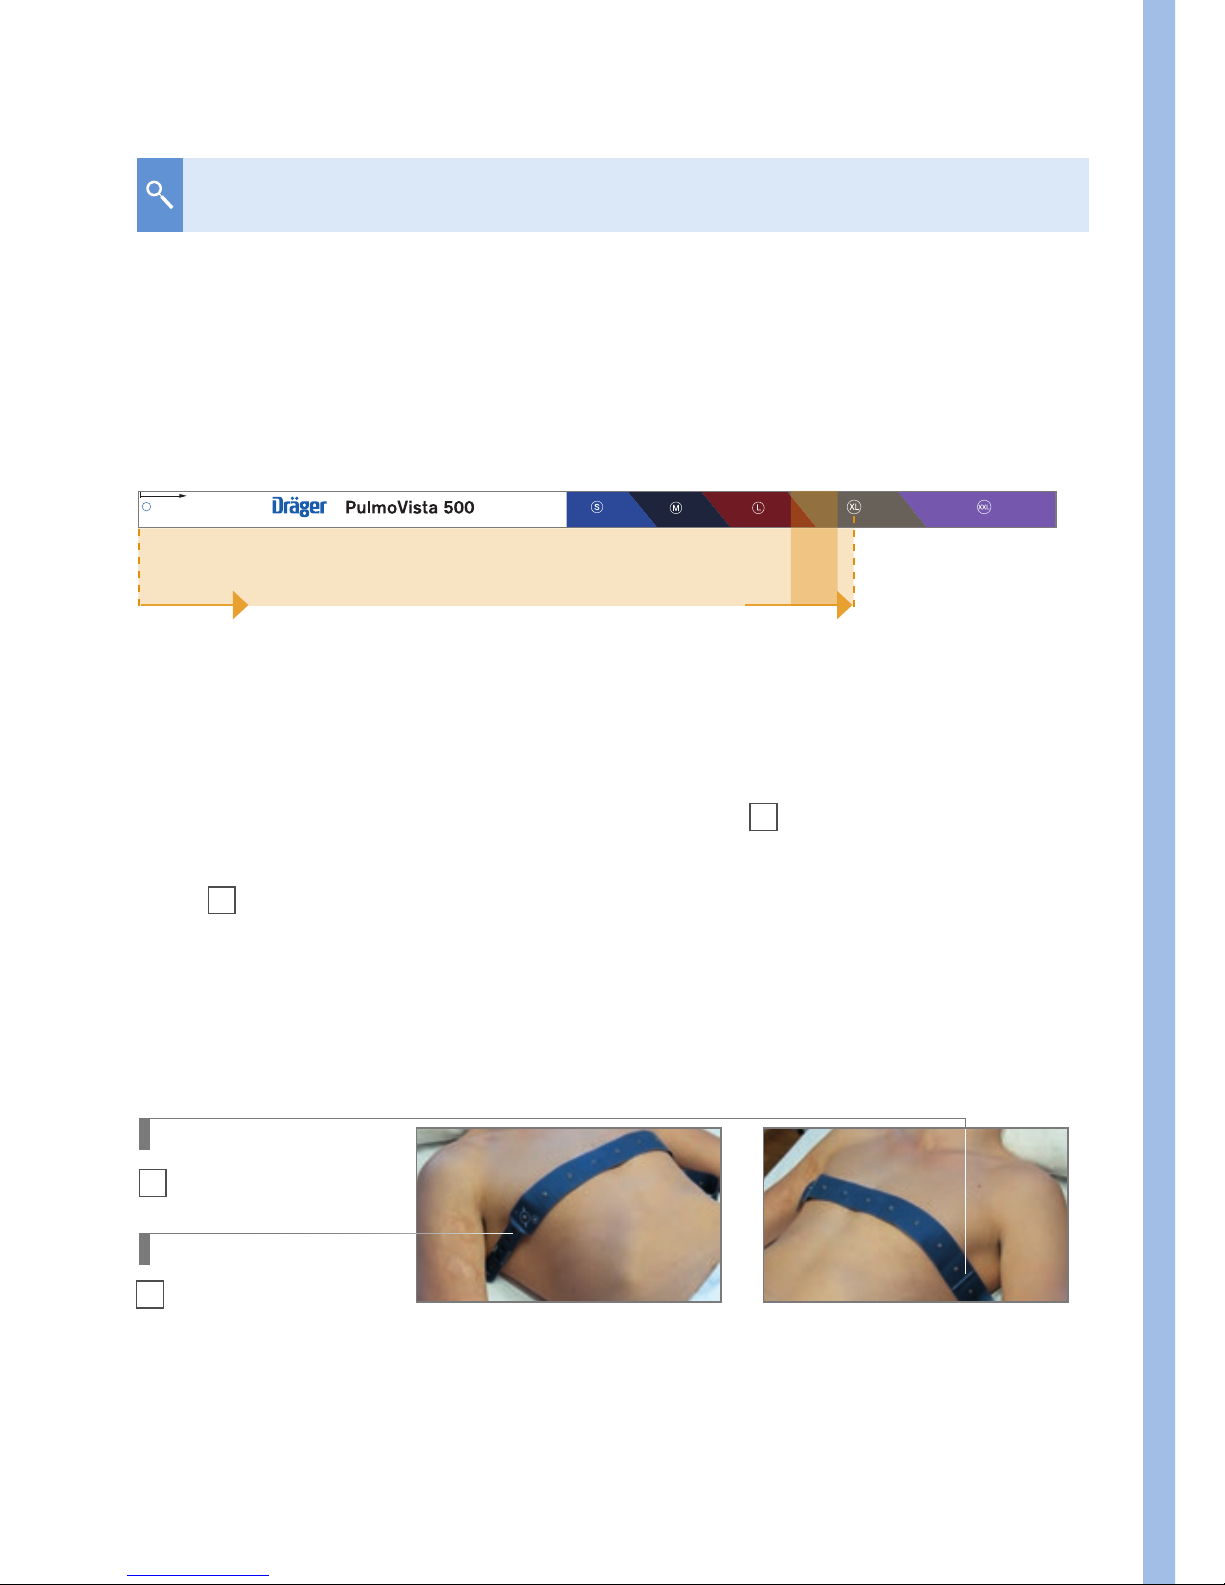
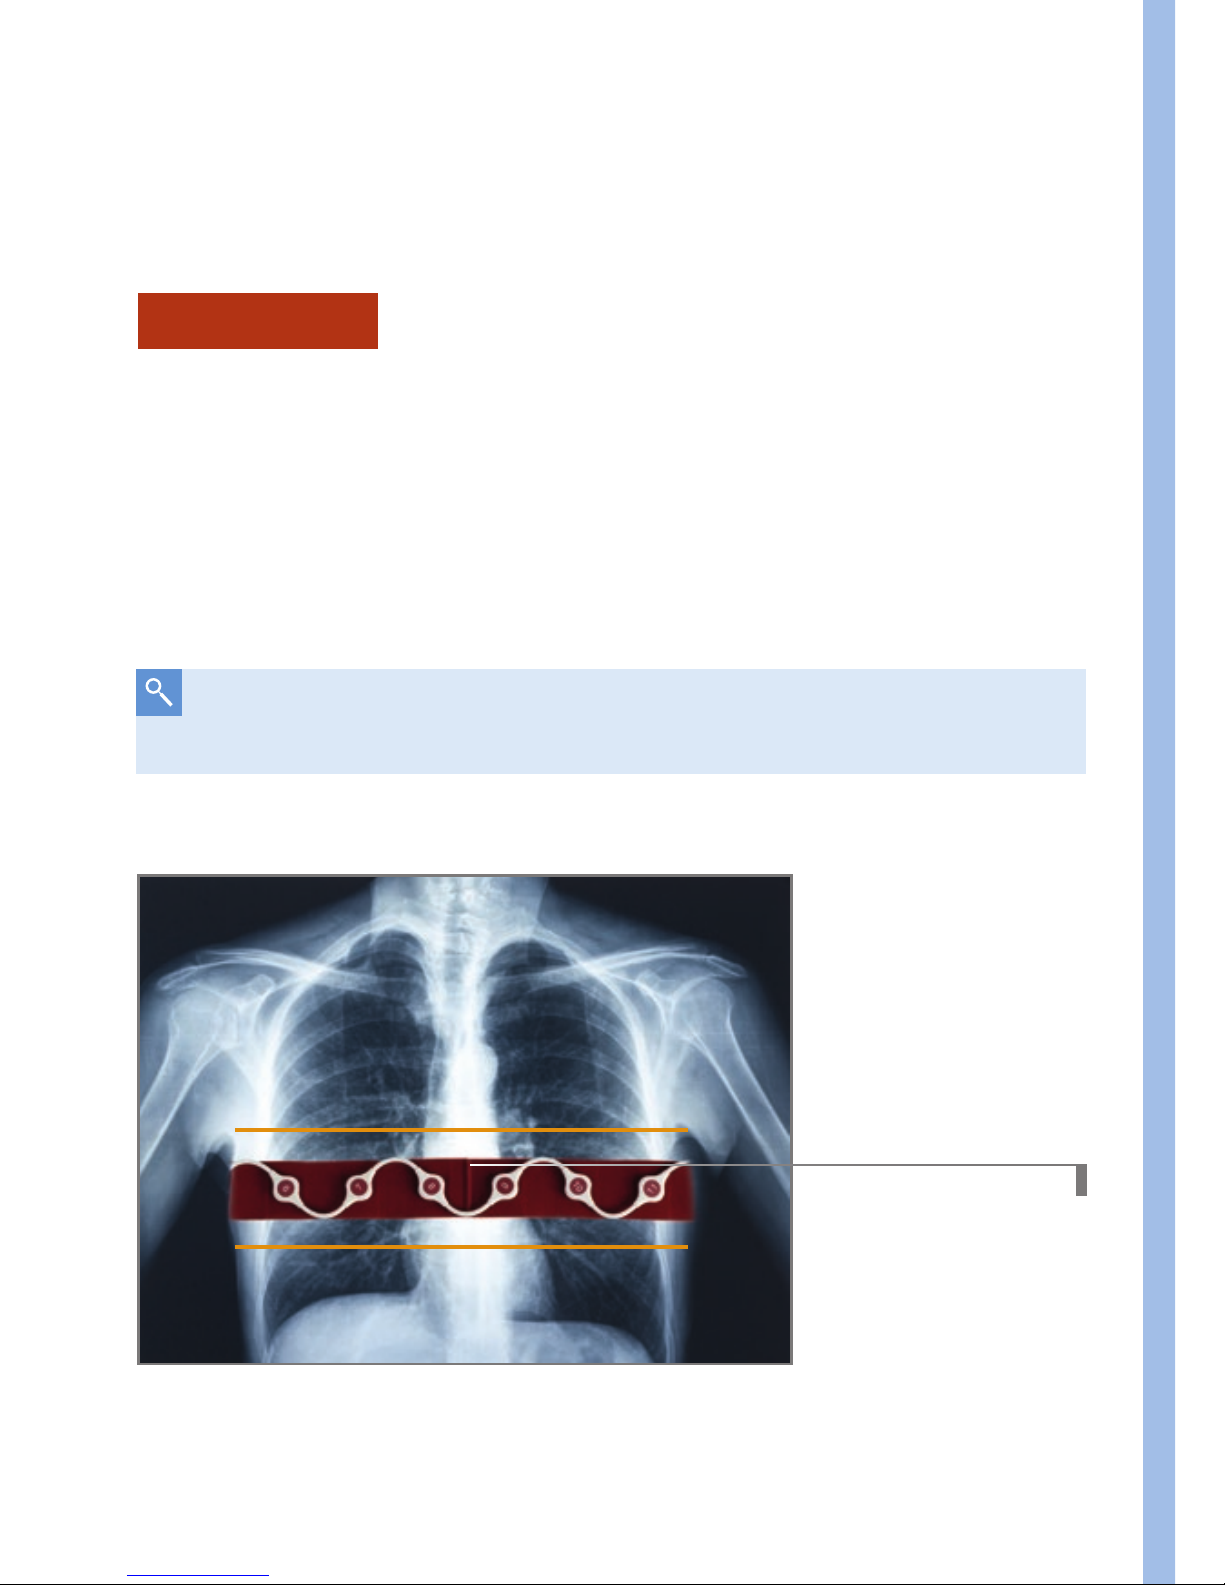
a. Determine the proper belt size with the help of the measurement tape
– Measure about 5 cm (two inches) below the armpit from axilla to axilla
(4
th
to 6th ICS).
– If the area is in the transition zone between two sizes, the next larger belt
is recommended.
Start here to measure from the left to
the right mid axilla to estimate belt size
Making ventilation visible™
www.draeger.com
measurement range 4th–6th ICS
Right Axilla Left Axilla
1
Mid position marker
2
Closure holes
D-11923-2017
D-11924-2017
Applying an EIT electrode belt to estimate the right fit.
This EIT electrode belt has the correct size.
How to find the right belt size
b. Determine the size with the electrode belt
– Choose the electrode belt which you think might possibly fit
– The electrode belt has a
mid position marker
1. Hold it approx.
5 cm below the right or left axilla and place the end with the belt closure
2
over the thorax to the opposite side.
– The belt should fit when the closure holes, preferably the one in the
middle, are below the opposite axilla.
– Otherwise, choose the next smaller or larger belt.
Page 10
10 |
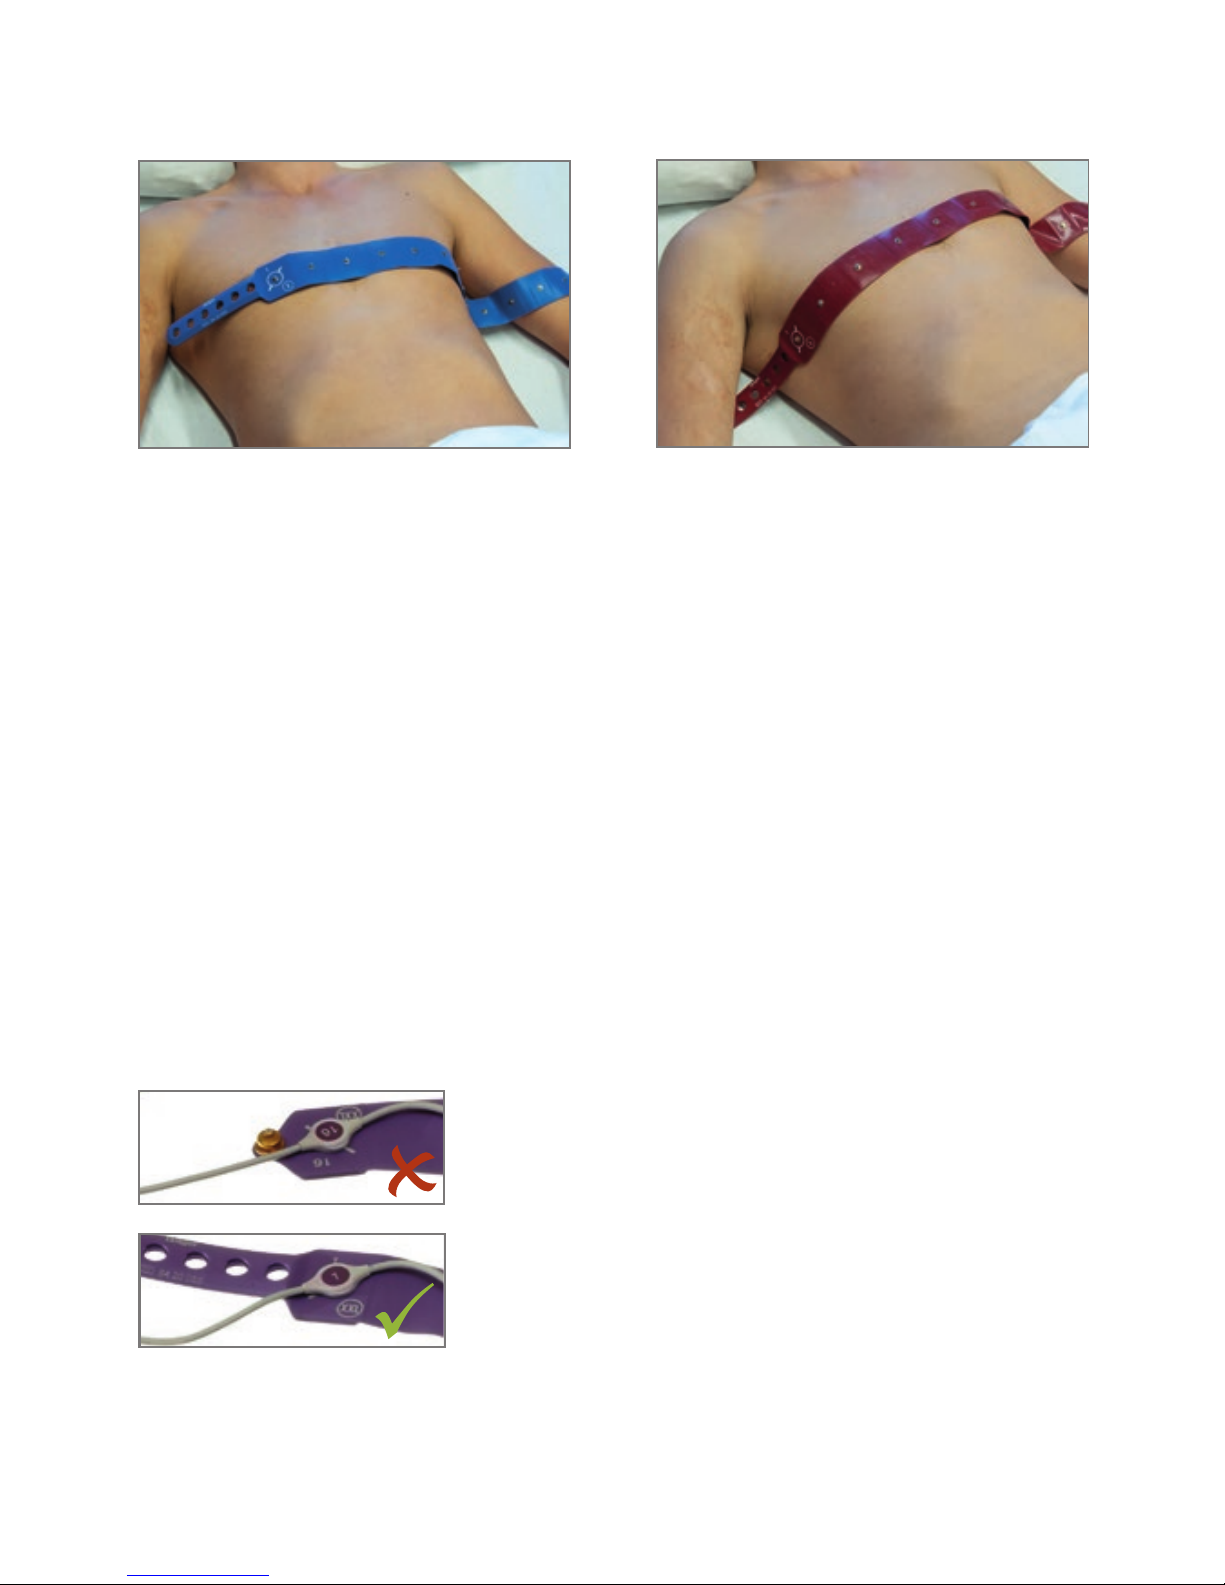
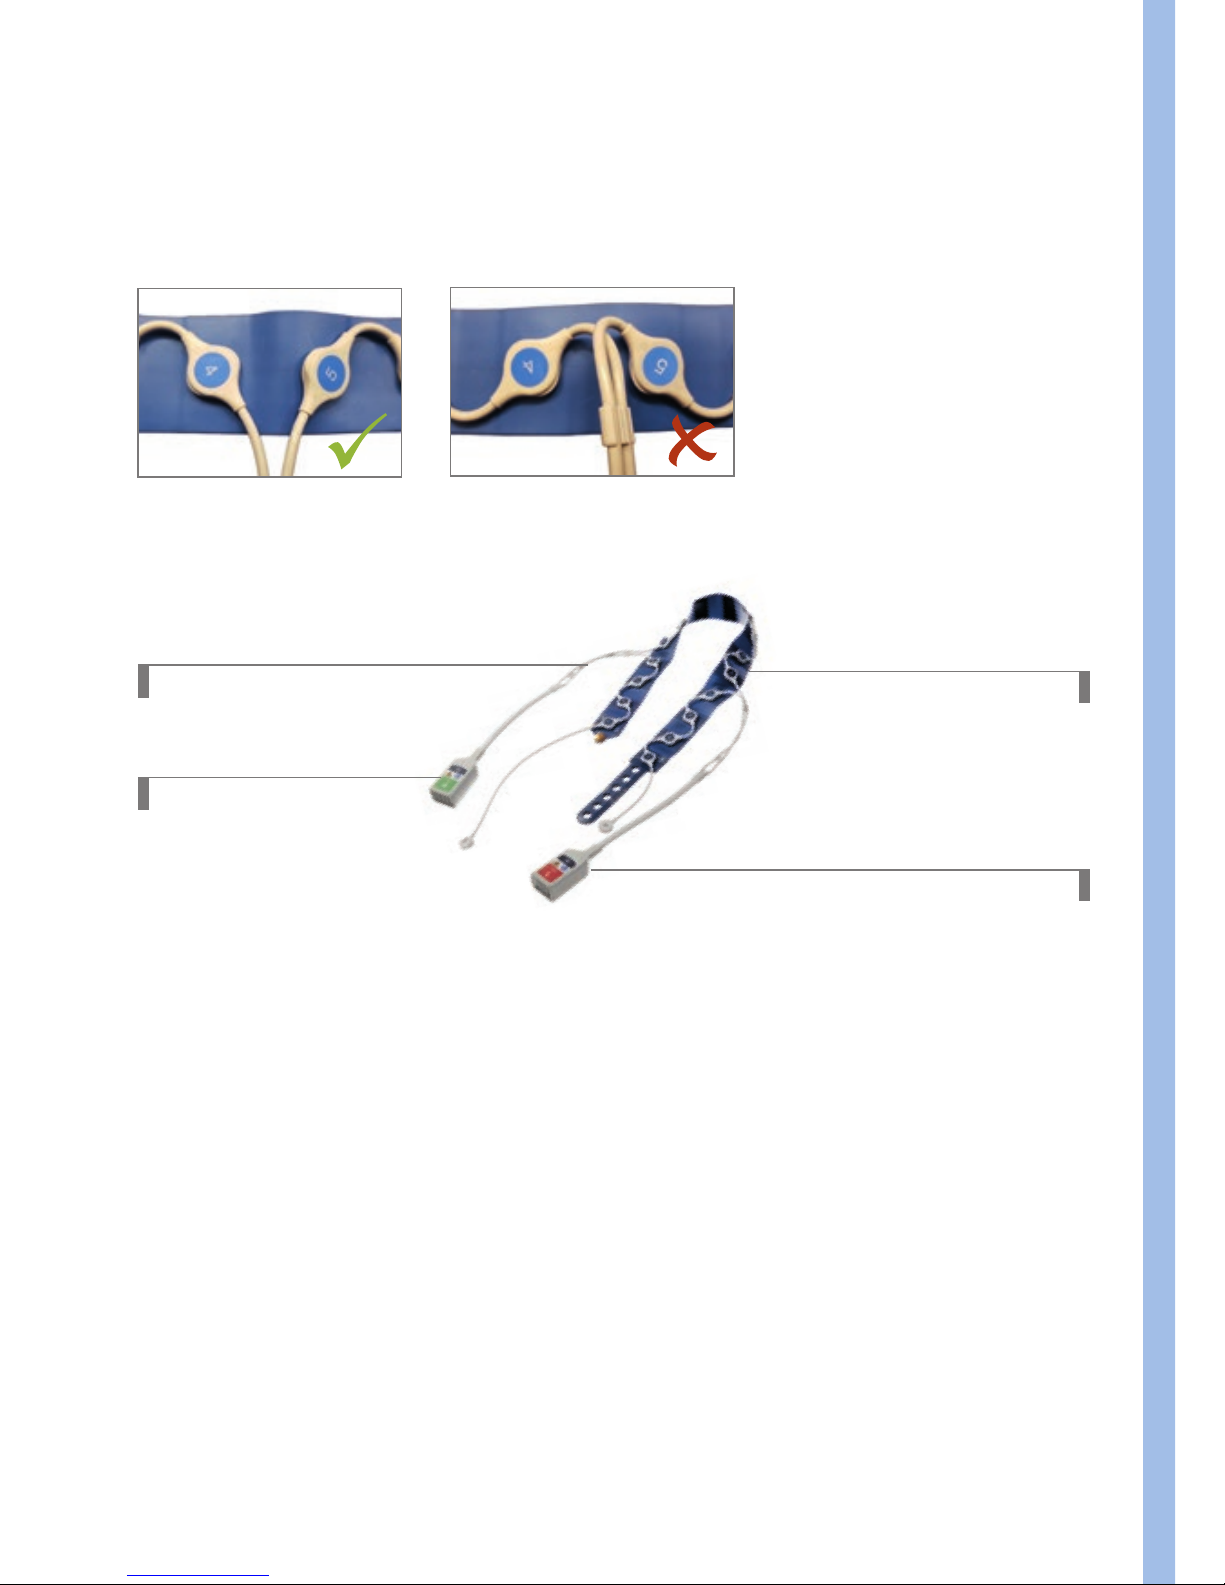
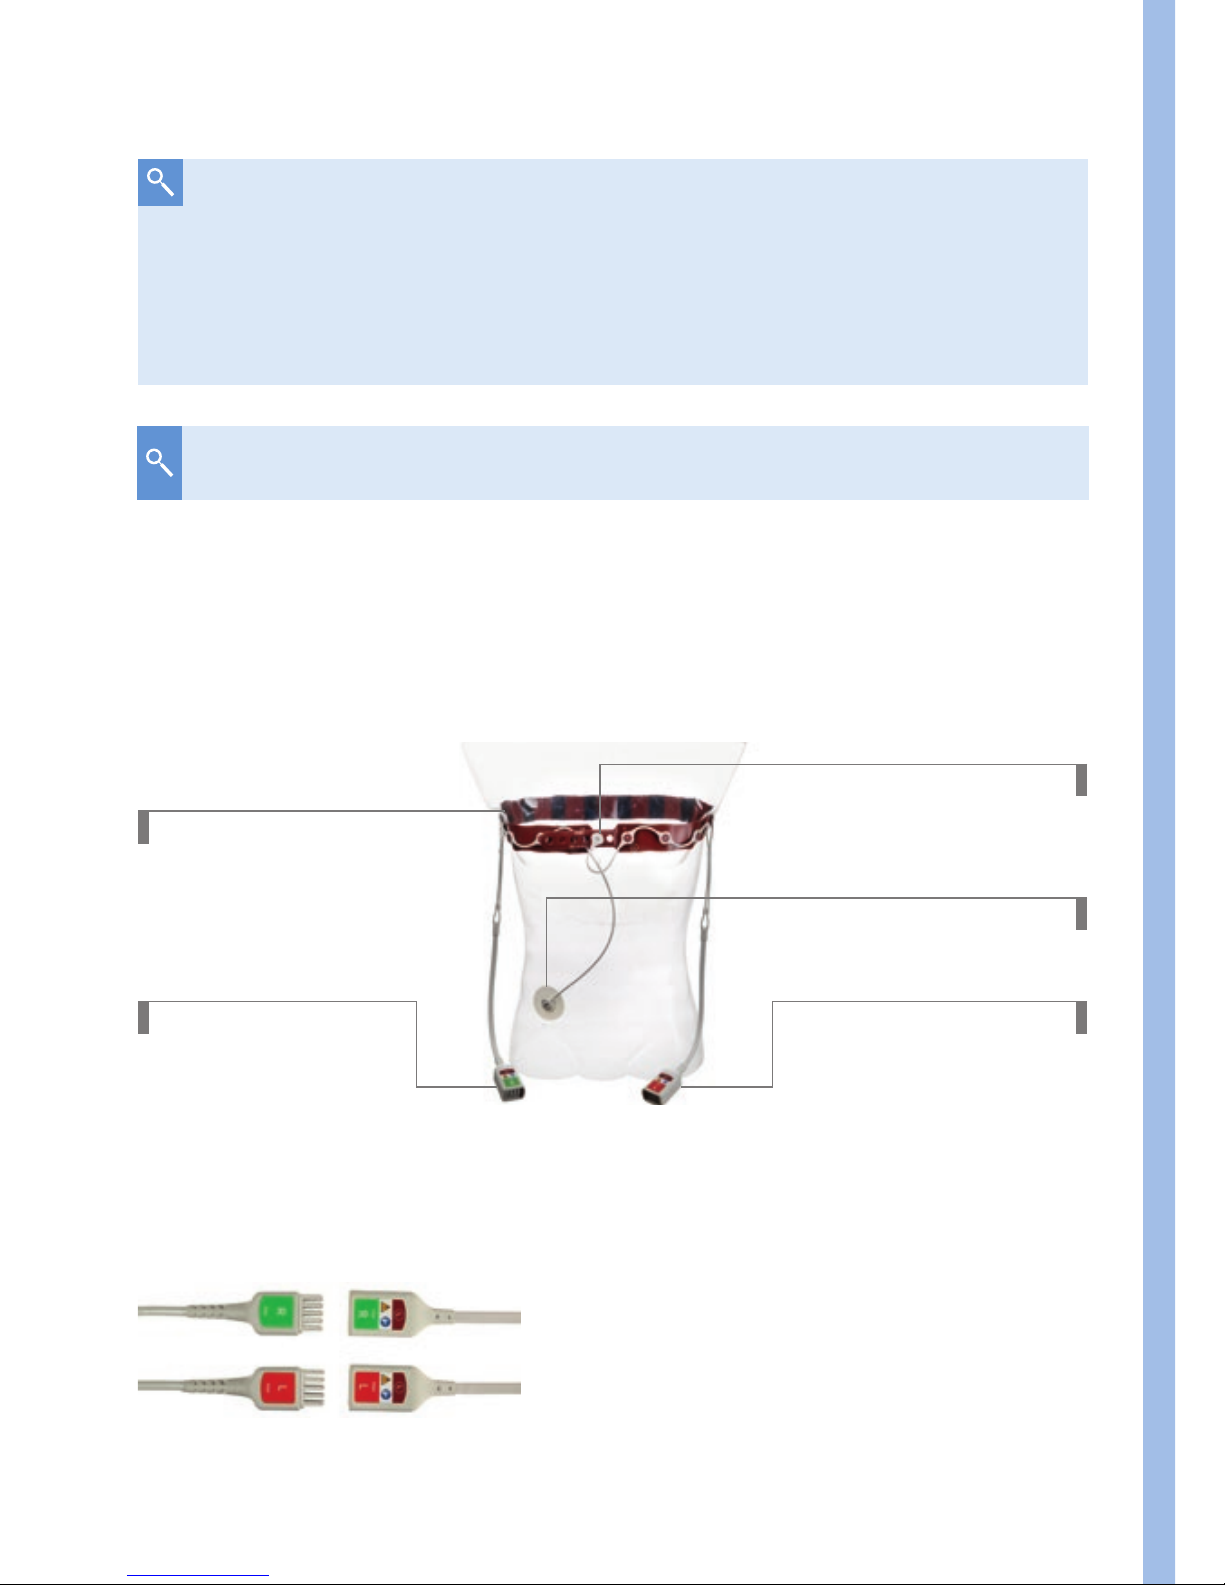
1.2.2. Attach patient cable to electrode belt
Take the electrode belt and the corresponding patient cable and attach the
patient cable to the electrodes in a zigzag pattern. Attach snap 1 of the patient
cable to stud 1 of the electrode belt.
Pay attention to the correct orientation of the patient cable. At the electrodes 1
and 16 there are lines that serve as a guide. Ensure the orientation of the cable
over the stud is maintained as illustrated and as marked on the electrode belt.
Electrode belt too short
Electrode belt too long
D-11922-2017
D-11925-2017
Orientation of the patient cable and electrode belt
D-1254-2010
›correct‹
›wrong‹
Page 11
Prepare the device for the clinical use
| 11
Patient cable
Right port
Electrode belt
Left port
D-6058-2014
1.2.3. Prepare the patient
Before the electrode belt is put on, check the potential necessary preparations
to position it well. For example, wound dressings, drainages, ECG electrodes,
catheters, strong hair growth or surgical and disease-related problem areas
may impair the placement of the belt or electrodes. If possible, the contact
area should be exposed to improve skin contact. However, if one electrode has
insufficient skin contact, the EIT measurement can also be started in the so-called
15-electrode mode. Further information can be found in the chapter
›Checking
signal quality
‹.
D-11932-2017
D-11931-2017
When attaching the electrode cable avoid too tight bending radii, especially at
the transition points between electrodes 4/5 and 12/13 (port left/right).
Page 12
12 |
1.2.4. Prepare the electrode belt
To be ready for use as quickly as possible, it is advisable to moisten the
electrodes of the electrode belt with a small amount of liquid (e.g. sterile saline
solution, water or electrode gel), in particular with dry skin.
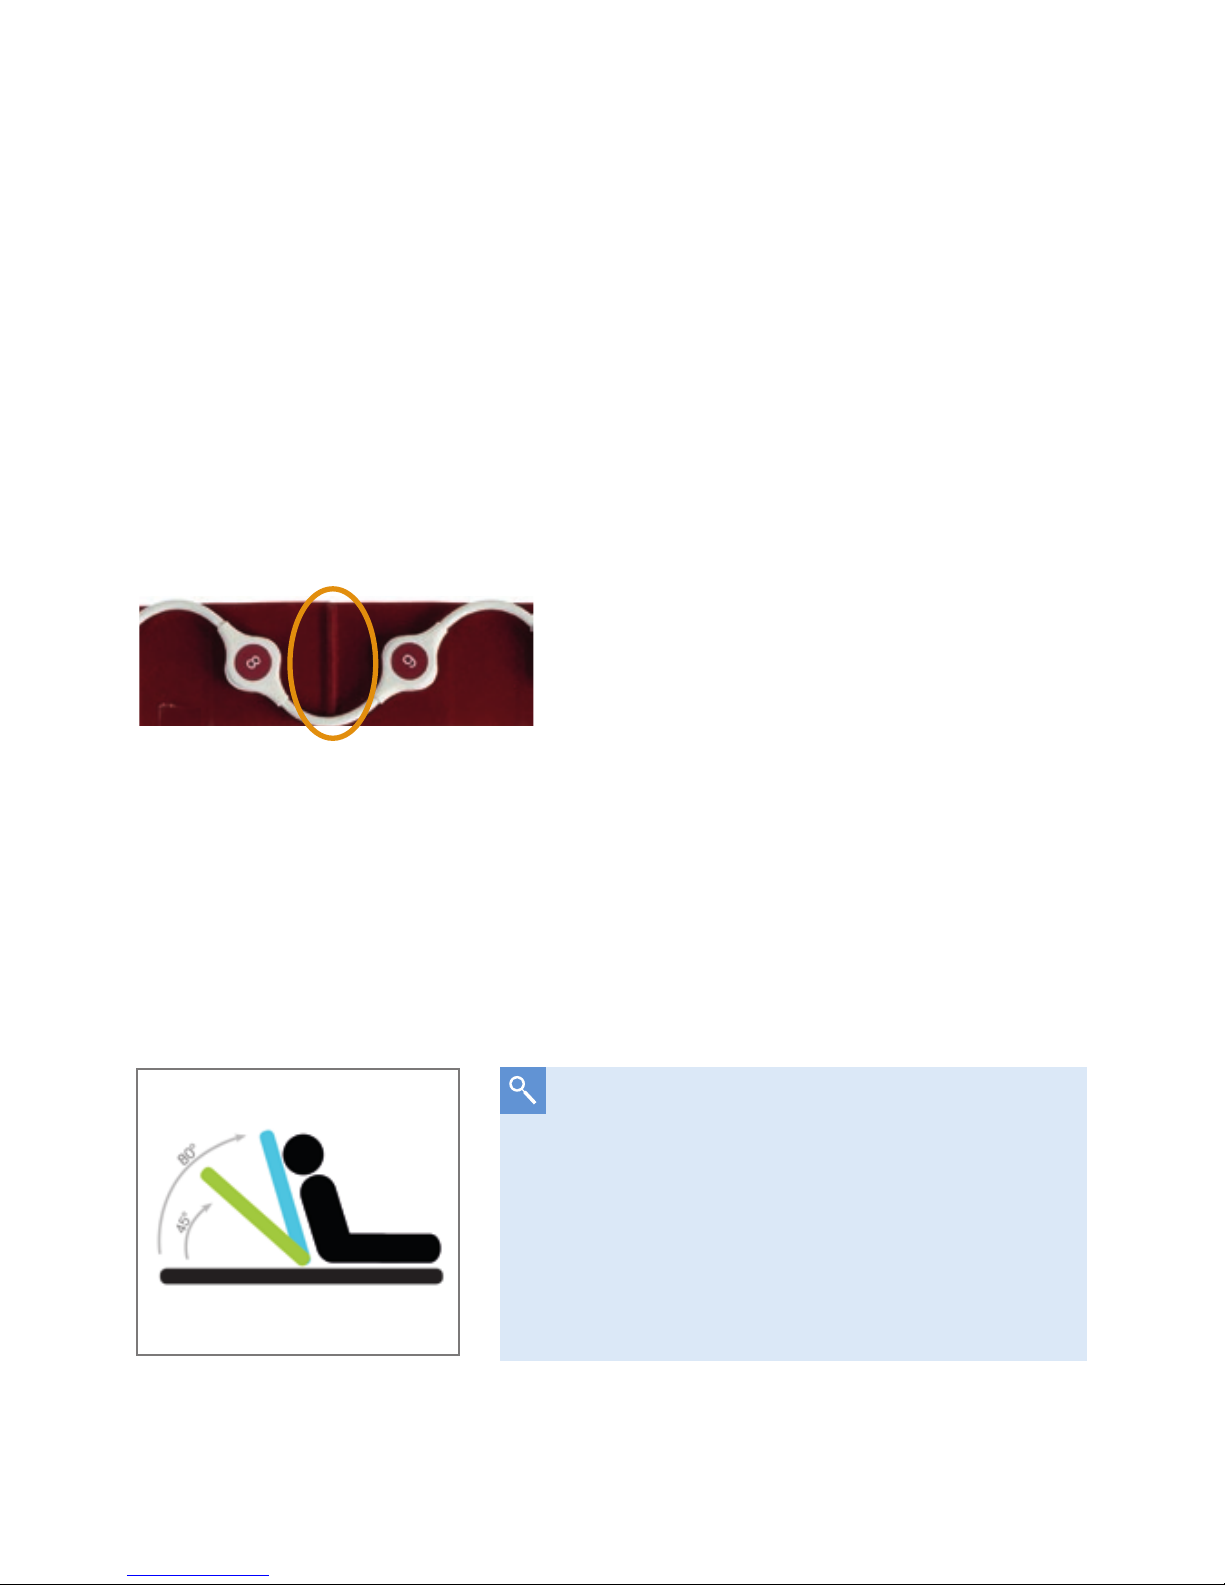
1.2.5. Positioning of the electrode belt on the thorax
For orientation and easier alignment there is a noticeable silicone marking on the
electrode belt. This
mid position marker
is located between the 8th and 9th
electrode and should be positioned on the spine between the 4
th
and 6th ICS.
1.2.6. General procedure when attaching the electrode belt
Apply the belt to the supine patient by
– lifting the patient’s upper body or
– rolling the patient to the side.
D-2284-2010
Mid position marker
If the patient condition allows it, it may
also be advisable to bring the bed in an
elevated position. This makes it easier to put
on the belt. The EIT measurement can be
performed regardless of the position, e.g.
in seated, supine, prone or lateral position.
45° to 80°
D-11942-2017
Page 13
Prepare the device for the clinical use
| 13
If tilting the bed or an upright patient position is not possible, the
following methods for applying the electrode belt are available:
Lifting method
1. Lift the patient’s head and put the
mid position marker
of the belt to the
cervical spine.
2. Lift the upper body a bit to move the belt downwards to place it between
the 4
th
and 6th intercostal space.
3. Ensure that the
mid position marker
is still on the spine.
4. Close the belt
DL-18858-2015
Mid position marker
4th to 6th ICS
If access from the head is restricted, lift the upper body and put on the
electrode belt from the side.
Page 14

14 |
Rolling method
1. Turn the patient on one side, place one half of the belt around the chest
(electrode on the left side of the patient) and hold the
mid position
marker
on the spine in the area of the 4th to 6th ICS.
2. Turn the patient over to the other side while holding the marker. Gently
push the free end of the belt under the patient and place it on the chest.
3. Check the position of the
mid position marker
and the alignment of the
belt and turn the patient back to the starting position.
Close the belt:
1. The belt ends are brought together in the area of the sternum and
connected to each other via one of the six closure positions. If possible,
use one of the middle closure holes.
Note: The electrode 1 is located on the left side of the patient (end with
closure holes), the two connector ports from the patient cable point
caudally to the right and left sides of the patient.
D-28332-2009
1
16
Electrode orientation:
If possible, place the electrodes 1 and
16 symmetrically (equidistant) to the
sternum (see picture). If possible,
place the electrodes 8 and 9
symmetrically to the spine.
D-11898-2017
Mid position marker
Page 15
Prepare the device for the clinical use
| 15
2. Connect the closure snap (C) to the closure stud (sternum).
3. Apply an ECG electrode on the abdomen and attach the reference electrode
snap to it.
Ready for use belt on
the thorax
Closure snap C
Left port
Right port
4. Plug-in the trunk cable into the trunk cable port and insert the patient
cable plugs into their respective connectors.
Match label and color
Reference electrode
The belt does not have to sit too tight, it is crucial that there is
sufficient contact between the electrodes and the skin. An offset of
the electrodes or an asymmetrically arranged belt can lead to image
rotation.
D-2282-2010
D-6063-2014
For female patients the belt should be placed onto the breast.
Page 16
16 |
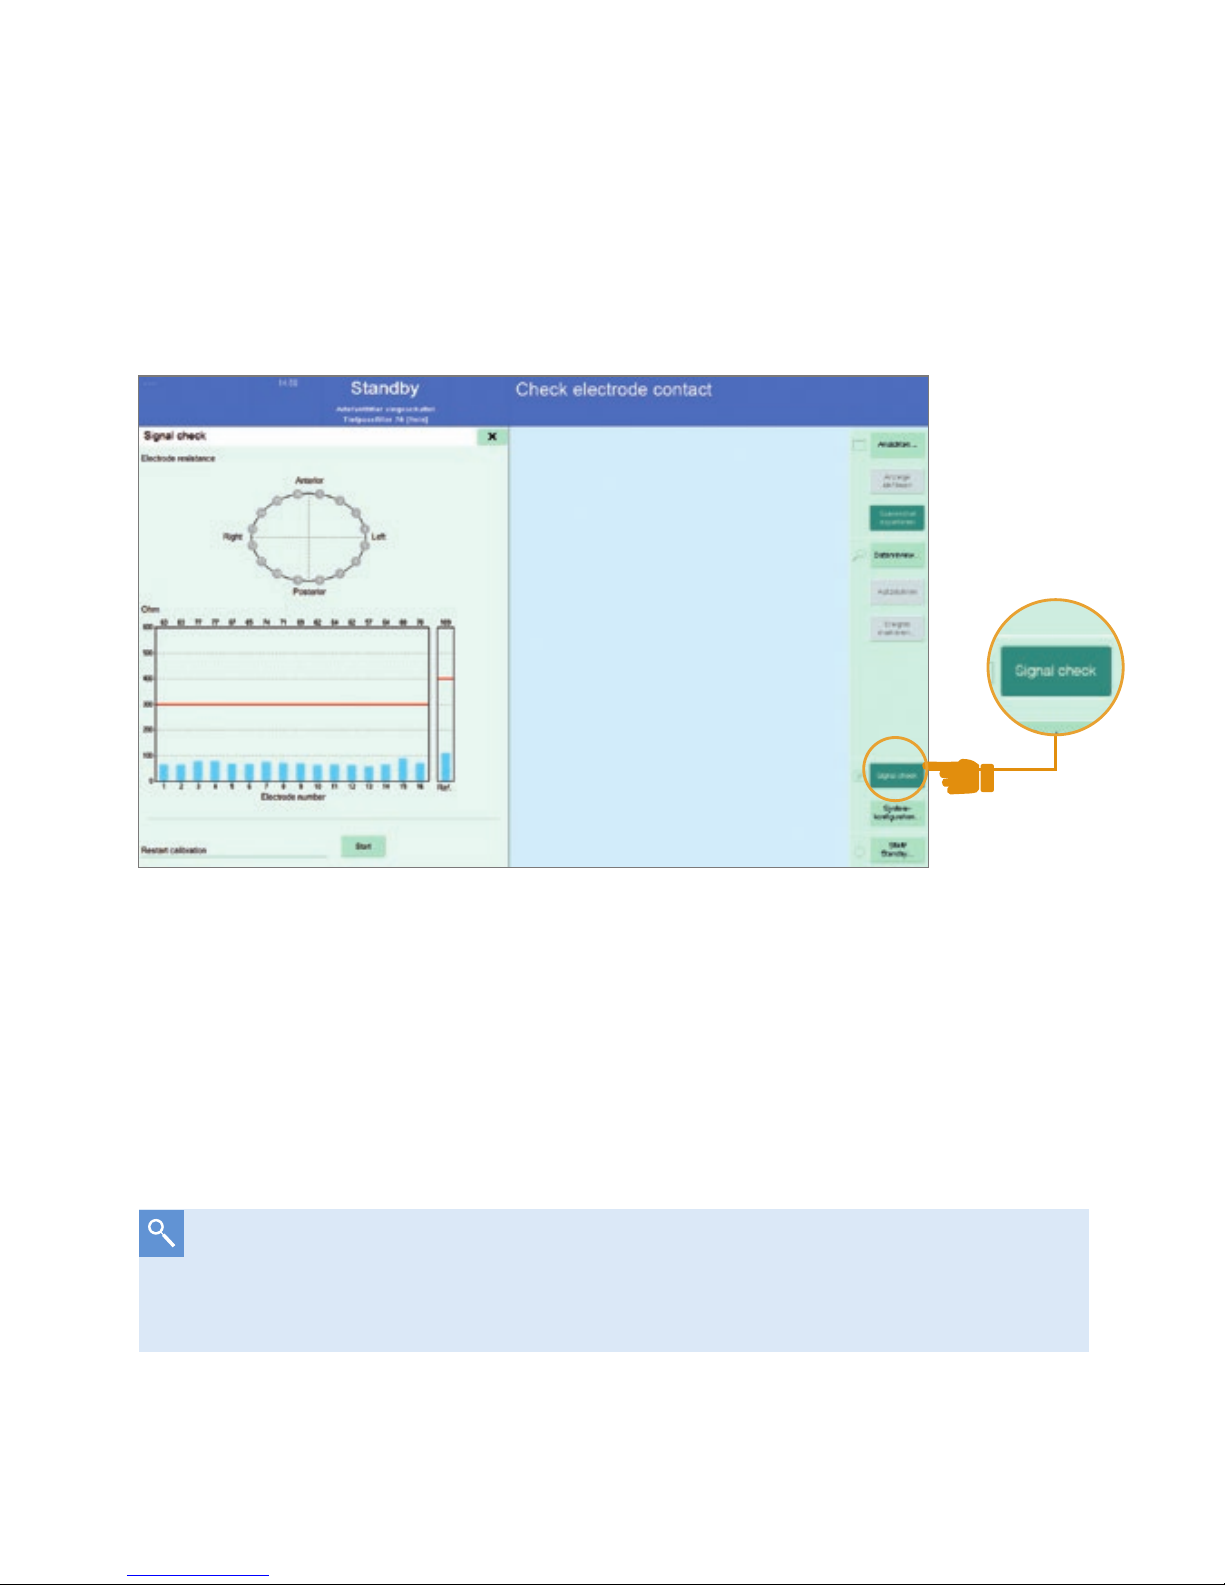
1.3. SIGNAL CHECK
1. Select Start / Stand-by screen and choose ›New patient‹.
2. Go to ›Signal check‹ page: the graph shows the skin electrode resistance
for each electrode.
The Signal check page. The electrode skin resistance is shown for
every electrode.
Each electrode should have sufficient skin contact: Blue bars for every
electrode have to be below the red line. If one electrode has bad skin contact
(skin electrode resistance > 300 Ω) the respective electrode is highlighted
in red.
If the skin electrode impedance is not appropriate add tap water, use
electrode gel or wait a few minutes for moisture from the skin to improve
the contact. This also applies for the reference ECG electrode.
D-15489-2017
Page 17
Prepare the device for the clinical use
| 17
1.4. SETTINGS BEFORE STARTING AN EIT MEASUREMENT
Before starting the EIT session, it is recommended to go through
these steps:
1. Choose ›New Patient‹.
2. Enter patient data.
3. Set frame rate and filter.
4. Select recording mode.
5. Turn on artifact filter.
6. Switch on the contour of the ventilated area.
7. For coupling with a Dräger ventilator configure the Medibus interface.
More detailed information can be found in the instructions for use.
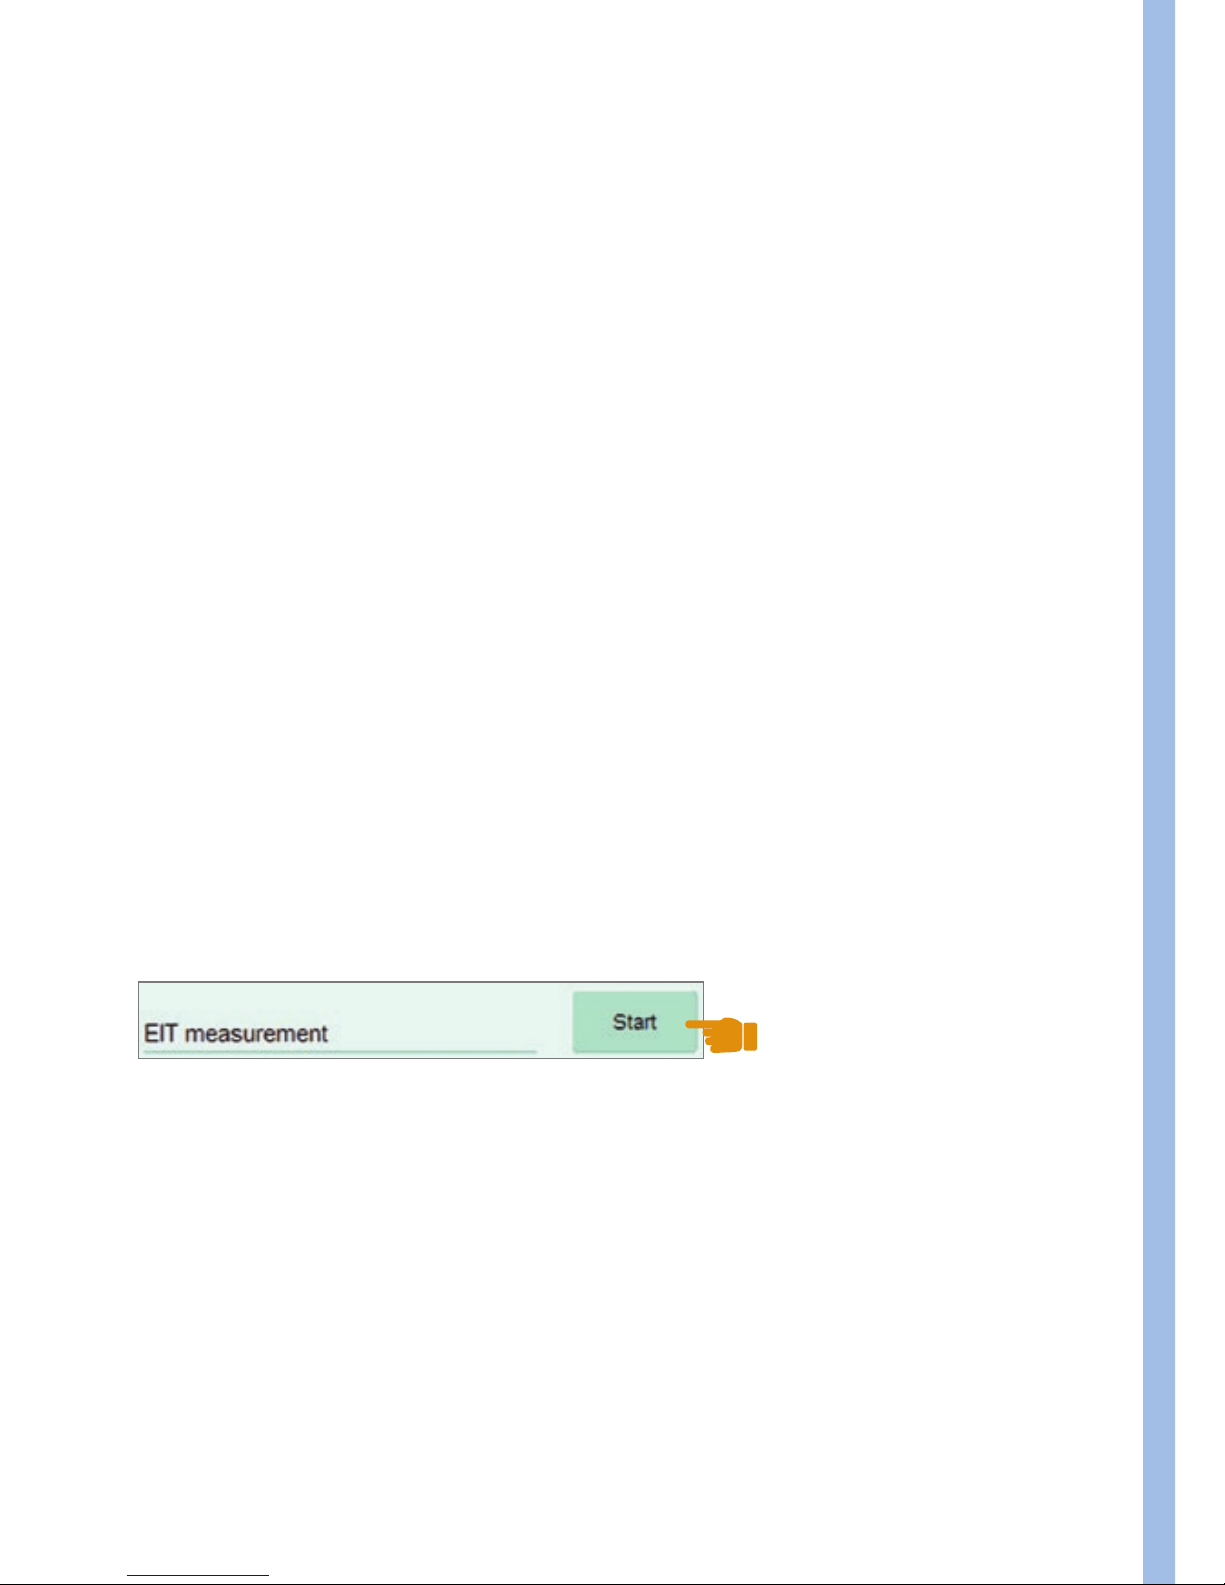
1.5. START THE EIT SESSION
Press the start button. After that the system performs a short calibration
(about 30 s) and is then ready for the measurement.
D-15488-2017
Page 18

18 |
1.6. CHECK THE CORRECT ELECTRODE BELT POSITION
The following procedure will help you to check the belt position or to find the
correct position.
The belt is to be placed between the 4
th
and 6th ICS. For women, the belt
should be placed onto the breast.
Case A:
If the belt is placed too far caudally, movements of the diaphragm affect
the imaging.
Effect: Negative impedance changes (see page 34) become visible
laterally in the Tidal Image. This is an indicator that the belt is
too low.
Case B:
If the belt is placed too far cranially, the ventilated lung regions may
appear smaller.
Effect: Due to the low spatial resolution, it is no longer possible to
clearly distinguish between the left and right lungs, especially
if the mediastinum can no longer be localized in the apical
region of the lungs.
Page 19

Prepare the device for the clinical use
| 19
Steps to identify whether the belt was placed too low:
1. Go to the
Main View
.
2. Click the ›Enhance contrast button‹.
3. If you can see purple regions (negative impedance changes) left and right
of the lung regions (blue and white) it is very likely that the belt has been
placed too low.
4. Reattach the electrode belt in a more cranial position.
5. Verify, that the purple regions dissappeared.
D-30762-2017
1
Enhance contrast
2
Negative impedance changes
2
1
2
Page 20

20 |
If one electrode fails, the message ›Check electrode contact‹
appears, but the measurement can nevertheless be carried out
without difficulty
In the so-called 15-electrode mode, the inactive electrode in the virtual
thorax contour is marked in yellow. If an electrode fails after starting the
measurement, recalibration is required. Then the message ›Electrode contact
impaired‹ is displayed, but this does not pose a significant limitation for the
measurement.
1.7. SPECIAL CASE: 15-ELECTRODE MODE
In the special case that one electrode does not have enough skin contact,
the measurement can nevertheless be carried out reliably. The device uses a
special mode for this purpose.
D-15490-2017
Page 21

Different views and their special properties
| 21
Measurement in 15-electrode mode
2. Different views and
their special properties
Different views are available for displaying and evaluating the EIT images and
image information.
– Main view
– Fullscreen view
– End-inspiratory trend view
– End-expiratory trend (∆EELI) view
– Diagnostics view
2.1. MAIN AND FULLSCREEN VIEW
After starting the measurement, you are in the main view. This view provides an
overview of the distribution of the tidal volume in the transverse EIT sensitivity
region. In the dynamic image, the volume distribution is displayed in real time at
up to 50 fps, inspiratory and expiratory, so inhomogeneities of the lungs can be
quickly identified. The
Tidal Image
captures the volume distribution of the last
detected breath. To assess regional ventilation during spontaneous breathing
D-15491-2017
Page 22

22 |
you can change this to
Minute Image
(Setup). Real-time impedance curves
represent ventilation over time. Changes in the overall cross-section are reflected
by the
Global Impedance Curve
. This curve strongly correlates with the volume
curve of the ventilator and with the applied/inhaled total volume. The regional
impedance changes (i.e. tidal variations) serve to compare different lung regions.
The numerical values indicate the volume distribution, which together add up to
100 % of the global value unless the overall window size (ROI setting) is changed.
1
Dynamic Image
2
Tidal Image / Minute Image
3
Regions of Interest
4
Global Impedance Curve
5
Regional Impedance Curves
6
Enhance Contrast Button
1
6
4
5
2
3
D-15492-2017
Page 23

Different views and their special properties
| 23
2.1.1. REFERENCING
The reference function is useful, if you want to capture the current condition for
comparability prior to a ventilation change or therapeutic intervention. This is
activated in the main view by the button ›Ref.‹, above and to the right of the
Global Impedance Curve
.
D-11911-2017
Distribution of the tidal volume in a crosssectional fullscreen view of the patient
thorax in the caudal-cranial direction
D-11903-2017
Regions with ≤ 10 % of max. ventilation
Regions with max. ventilation
Regions with > 10 % of max. ventilation
When looking at EIT images, it should be noted that these are, analogous
to CT images, displayed in caudo-cranial projection. We are looking ›from
the feet‹ into the lungs.
Ventral
Dorsal
R
L
Page 24

24 |
2.1.2. REGIONS OF INTEREST (ROI)
You have the possibility to adjust the ROIs to the current ventilation conditions.
Depending on the type of analysis you can choose between layers, quadrants
and free arrangements of ROIs. This overview shows typical examples:
ROI Type Layers Quadrants Free
Examination
• Ventral to dorsal
distribution of
ventilation
• Effects of gravity
• Localized lung
pathologies
• Left vs. right lung
• Heart region
• Non-adjacent
regions
• Single pixels
Examples
• Dorsal collapse
• Ventral
overdistension
• Positioning
• Pleural effusions
• Pneumothorax
• Bronchoscopic
mucus removal
• Analysis of cardiac
activity
• Detection of fluids
Orange = Loss of ventilation
Blue = Gain of ventilation
Differential Image with positive and
negative changes.
D-30759-2017
After activation, a new window, the
Differential Image
, appears instead of the
Tidal Image. At the time of referencing, the reference Tidal Image is
captured and moved under the Differential Image. Subsequent changes,
however, will not be visible until the ›View Change‹ window is activated. In the
Differential Image, the current status is compared with the reference status and
the differences are displayed. This allows to quickly see areas with an increase
or decrease in ventilation. These are illustrated by the following color coding:
Page 25

Different views and their special properties
| 25
In obese patients the size of the ROIs should be adapted to the smaller tidal
image.
Healthy patient with
normal weight
Window size unchanged,
distribution of ventilation in %.
Obese patient
Adjust the window size to the
smaller Tidal Image. The sum
of the 4 regional tidal variations
(TV) should be 100 %.
When comparing the right and left lung the use of ROI quadrants is
recommended. As an example, the following image sequence shows the
recruitment of the right lung and the percentage increase in tidal volume over
time.
Before Recruitment Maneuver
(RM)
10 Minutes after RM 4 hours after RM
The fullscreen view hides the regional impedance curves and enlarges either
the dynamic or status EIT image. This view serves to improve the visualization
of ventialtion.
D-11902-2017 D-11900-2017
D-11901-2017
Page 26

26 |
2.2. TREND VIEWS –
END-INSPIRATORY AND END-EXPIRATORY
The PulmoVista® 500 trend views can be used to compare two different points
in time. The End-inspiratory trend view is used to compare two different
tidal images and their regional tidal volume distribution. It helps you identify
inhomogeneities, recruitment, de-recruitment, overdistension and the
redistribution of Vt. A trend table shows the regional ventilation distributions
(i.e. tidal variations) in % with associated parameters of the ventilator.
1
Differential image
2
Trend table
3
Tidal image Ref
Set Cursor
Ref
as a reference point and move Cursor C to your point of
interest to immediately see changes.
Orange
→ Decrease of regional ventilation
Light Blue
→ Increase of regional ventilation
D-30757-2017
4
Tidal image C
5
Global impedance curve
6
Trend Parameters
from ventilator
1
2
3 4
5
6
Page 27

Different views and their special properties
| 27
The End-expiratory trend view or ΔEELI-trend view is used to monitor
regional changes of End Expiratory Lung Impedance (∆EELI). ∆EELI is
strongly correlated with changes in End Expiratory Lung Volume (∆EELV).
The ∆EELI trend is useful to asses changes in lung volume for example after
changing the PEEP and after recruitment maneuvers for the re-opening of dorsal
atelectases as well as for the detection of de-recruitment of individual lung areas.
Ref
and C can be positioned along the time axis. Changes can be seen in
the ∆EELI differential image. Areas in orange show a regional decrease
(e.g. caused by de-recruitment), areas in light blue a regional increase in
EELV (e.g. caused by recruitment).
In the above example, a ∆EELI value of -0.62 x TVglobal
Ref
means a
decrease in end-expiratory lung impedance or EELV by the amount of
global tidal variation at
Ref
, i.e. 0.62 x Vt at location
Ref
(in this
example, this would be 0.62 x 447 ml). The regional impedance curves
show regional changes and the numerical values.
D-30758-2017
1
Differential image
2
Trend table
3
ΔEELI global
1
2
3
4
4
Global impedance
waveform
5
Regional impedance
waveforms
6
Regional quantification
of ΔEELI changes
7
Trend parameter
from ventilator
5
6
7
Page 28

28 |
2.3. DIAGNOSTIC VIEW
2.3.1. CONDUCT ANALYSIS DIALOGUE WINDOW
The Diagnostic View allows the analysis of regional compliance changes
and delays in regional ventilation in addition to the evaluation of ventilation
distribution. Every selected time period is called a “section”.
The ›Conduct analysis‹ dialog window is displayed first and should be
used to prepare the analysis of a therapeutic maneuver. ›The PEEP trial
analysis‹ function enables the automatic analysis of incremental or decremental
PEEP maneuvers. In contrast, the ›Customized analysis‹ function enables the
evaluation of any other ventilation related intervention.
1
2
3 4
5
6
7
8
D-30760-2017
Page 29

Different views and their special properties
| 29
Section settings: Please make sure that one section does not spread
over multiple PEEP levels or different interventions. One section always
represents the average value of the selected breaths.
1
Global impedance waveform. If available, trend parameters from the ventilator are
displayed: PEEP in green and EIP in pink.
2
Sections with alphabetically sorted labels (incl. the respective PEEP if available).
3
Automatic section selection.
4
Manual section selection (add or remove sections and position them using the
touchscreen or rotary knob).
5
Define section length (1-10 breaths).
6
For the customized analysis you need to define a reference section.
The ensuing analysis quantifies changes in comparison to this section.
7
Regional Ventilation Delay (RVD) settings: The RVD is a parameter which displays
regional inspiration delays in comparison with global inspiration and may indicate
the cyclical collapse and re-opening of lung regions as well as display regionally
varying time constants.
8
Starting the analysis.
Page 30

30 |
2.3.2. RESULTS OF THE ANALYSIS
The results of the PEEP trial analysis support the selection and
personalization of PEEP. Regional compliance images show the influence
of PEEP on lung mechanics. The ›Customized analysis‹ can be used to
evaluate various therapeutic interventions.
At constant driving pressures an increase/decrease in ventilation can be
interpreted as an increase/decrease of regional compliance (C).
1
2
3
4
5
6
1
Global impedance waveform and sections. If available, trend parameters are
displayed: PEEP in green and EIP (or PIP) in pink.
2
Tidal Image for every displayed section.
3
Compliance loss image for every displayed section.
4
Areas in which a regional ventilation delay was detected and corresponding
RVD parameter, displayed in yellow.
5
Diagram with the numeric values of all sections depending on the settings and
analysis type.
6
Create report: An image and a text file are created containing the entered
parameters, the event list, all available analysis parameters and MEDIBUS values,
and a screenshot of the analysis. (Only active if a USB mass storage device is
connected). This report is meant to be used for documentation purposes.
D-30761-2017
Page 31

Different views and their special properties
| 31
Colour maps – PEEP trial analysis
Dark Grey: Pixels with highest compliance.
Orange: Decrease of compliance towards higher PEEP levels – This typically
occurs in ventral regions at high PEEP levels and may be interpreted
as overdistension. The parameter CL HP of 10 means, that there was a
cumulative decrease of 10 % in those (orange) regions, while the highest
compliance was identified at a lower PEEP value.
White: Decrease of compliance towards lower PEEP levels – This typically
occurs in dorsal regions at low PEEP levels and may be interpreted as
collapse or derecruitment. The parameter CL LP of 5 means, that in this
image there was a cumulative decrease of 5 % in those (white) regions,
while the highest compliance was identified at a higher PEEP value.
D-30763-2017
The RVD parameter can be displayed in 2 different configurations: as the
standard deviation of the RVD (RVD SD) for every section or as the RVD
Ratio. RVD SD, indicated as % of Ti, describes how inhomogeneous the
regional inspiration within the contour of the ventilated area is. RVD
Ratio, indicated as % of the total number of pixels, describes the ratio
of the pixels with RVD to the total number of pixels within the contour
of the ventilated area.
Page 32

32 |
Colour maps – Customized analysis
Compliance Loss /Compliance Win
Dark Grey: Pixels with no change against Reference.
Orange: CL - Decrease of compliance against Reference
CL = 13 means, that in this image there was a cumulative decrease of
13 % in those (orange) regions.
Turquoise: CW - Increase of compliance against Reference
CW = 21 means, that in this image there was a cumulative increase of 5 %
in those (turquoise) regions.
3. Useful Tools and Tips
3.1. CONTOUR OF VENTILATED AREA
With the help of the ›contour of ventilated area‹, it is possible to track the
ventilated lung regions in form of a virtual footprint. The contour allows the
delimitation of the ventilated regions per breath and the identification of lung
regions with e.g. restricted ventilation or delayed inspiratory procedures. The
setting of the contour of ventilated area is located in the setup menu ›Display‹.
The contour is displayed in the dynamic image (main view, fullscreen) as well
as in the end-inspiratory trend. In the dynamic image the contour represents
the area of the last detected breath. In the end-inspiratory trend view, this
contour marks all the ventilated lung regions in the selected observation period
(1 min - 120 min). Depending on the cursor position (
Ref, C
), non-ventilated
areas are marked in grey.
D-30764-2017
Page 33

Useful Tools and Tips
| 33
Grey areas indicate lung regions that are not ventilated at time
Ref
or
C
but have been ventilated at a different time within the selected
observation period. In the picture above, the grey area at time
Ref
identifies the recruitable lung area at time
C
.
D-11905-2017
Page 34

34 |
3.2. NEGATIVE IMPEDANCE CHANGES
Negative impedance changes (in black/purple) represent inverted waveforms
and are often caused by fluid accumulations inside the thorax.
The following conditions might cause negative impedance changes:
– Heart activity
– Pleural effusion
– Movement of the diaphragm (belt placed too low, see page 18)
– Artifacts (e.g. body movement, repositioning of the belt, strong
electromagnetic fields)
– Deeper expiration than inspiration
– Pendelluft
Heart / Mediastinum Pleural effusion Movement of the diaphragm
D-11906-2017
Page 35

Useful Tools and Tips
| 35
3.3. FILTRATION
By default, PulmoVista® 500 processes unfiltered raw data and
displays it accordingly. Since even smallest changes are detected with this
technology, it is also possible to display simultaneous superimposed effects.
Thus, e.g. pulmonary function as well as cardiac or perfusion related impedance
changes are displayed. A functional pulmonary EIT might be better interpreted if
superimposed effects, such as those caused by the cardiac function, are
filtered out. For this purpose, the device has filter options such as
low-pass and
band-pass filters
, with which a targeted suppression of impedance signals is
possible. This option can be set in the menu under ›Display‹.
Low pass filter: Display of impedance changes below a certain frequency
Example: Only respiratory signals are of interest, i.e. signals
with a frequency in the rage of the respiratory rate but below
the heart rate, e.g. HR – 20.
Band pass filter: Display of impedance changes within a certain frequency
range
Example: Only cardiac-related impedance signals are of
interest, e.g. signals with a frequency of HR ± 20.
Electromagnetic radiation causes artifacts that make it difficult or even
impossible to qualitatively evaluate EIT images. Artifacts can negatively affect
the baseline at the end of expiration that interpretation of the tidal images is
no longer possible.
Special filter techniques of PulmoVista
®
500 allow the elimination of image
artifacts, making EIT images interpretable again. The setting can be found in
the menu item ›Display‹.
Recommendation: Leave the artifact filter turned on.
Page 36

36 |
Please note that
low-pass and band-pass filtering
may cause a phase
shift and thus a delayed display of impedance curves. With activated
bandpass filtering the tidal rate will no longer be displayed. Filter
and boundary frequency settings only affect the display of data,
not on the data recording.
Unfiltered EIT data Filtered EIT data with low pass
filter at HR -20
Filter menu
D-11962-2017 D-30754-2017
D-11930-2017
Page 37

| 37
Useful Tools and Tips
3.4. SAVE SCREENSHOT AND RECORD EIT DATA
You can take screenshots and record entire EIT measurements (EIT data).
For creating screenshots, insert a USB flash drive into one of the side USB
ports in the C500 monitor. After pressing the key ›Export Screenshot‹ the
current view will be transferred directly onto the flash drive. If you want to make
sure that a specific image is captured you can freeze the image by using the
function ›Freeze display‹. A recording of EIT files (option ADAP required) is
possible with the following options:
The recording file length is between 30 s and 10 min. To record, press the
button ›Record‹. You can cancel the recording at any time by pressing this
button again. The recorded files can be analyzed by using the function
›Data Review‹ or by loading them as a simulation file. Via the menu ›Data
recording
/File handling‹, the data can be deleted or transferred to a USB
flash drive. In the menu ›File‹ the free hard disk space as well as the
available USB storage space is indicated.
D-30755-2017
Single file or continuous recording
Page 38

38 |
3.5. COUPLING OF A DRÄGER VENTILATOR
WITH PULMOVISTA
®
500
PulmoVista® 500 allows a synchronous import of EIT information and the current
ventilation settings, waveforms, and trends. Data is imported via the Medibus /
Medibus.X interface. The necessary settings can be found in the menu under
›Screen layout / Data Import‹. For data transmission, the following settings must
be made at the ventilator:
Baudrate: 19200
Parity: non
Stopbit: 1
The data cable is connected to the COM1 port of PulmoVista® 500.
After successful pairing, the ventilator name is displayed in the menu.
D-30756-2017
Data import menu with configuration of curves and
parameters for trend views
Page 39

Cllinical Application
| 39
3.6. FRAME RATE
The dynamic EIT image continuously shows relative impedance changes. The
high temporal resolution of this method allows for very precise analysis of
individual phases during inspiration and expiration as well as the detection of
rapid changes in intrathoracic processes. This is useful for assessing regional
ventilation even at high respiratory rates, such as HF ventilation, as well as for
measuring higher-frequency processes, such as cardiac activity. In the ›EIT
Settings‹ menu, you can adjust the frame rate, i.e. the number of EIT images
generated per second.
By default, the frame rate is 20 Hz
Adjustable frame rate = 10 – 50 Hz (pictures /s)
4. Clinical Application
Chest EIT opens up new possibilities for everyday clinical practice in addition
to already established technologies. For more than 10 years, the significance
of EIT has been demonstrated by numerous clinical studies. In this regard,
after years of research the next logical step is the transfer of EIT into the
clinical routine. EIT provides new and additive information and allows the
personalization of ventilation.
Page 40

40 |
4.1. IDENTIFY RESPONDER OR NON-RESPONDER TO A
RECRUITMENT-MANEUVER (RM)
Step 1: Perform a RM
Open the Main View: Set the Regions of Interest to ›layers‹ (adjust their height
if required: in obese patients, adjust the height of the ROIs, so that ROI 1
properly represents ventral ventilation)
– Check if RM might improve homogeneity of ventilation: Is dorsal TV in
ROI 4 < 5 %?
– If TV in ROI 4 suggests collapse: Perform a recruitment maneuver
according to hospital standards
TV ROI 4 < 5 %?
D-11945-2017
As the individual response of each patient might vary a lot, RMs should
be assessed in every single patient!
Look out for:
− Volemic status of the patient
− Cardiac function
− Other side effects / complications
Page 41

Cllinical Application
| 41
40 s
40 mbar
Recruitment-Maneuver
Objective:
– Re-expand collapsed lung tissue
– Maintain sufficient PEEP to prevent de-recruitment after RM
How-to:
– Increase end-inspiratory pressure (Pinsp) for a short time
– Impose sufficient pressure to exceed the critical opening pressure
of the affected lung region and to recruit non ventilated or poorly
ventilated lung tissue
Inspiratory hold:
Inspiratory pressure of 40 mbar for 40 s
Step 2: Assess with PulmoVista® 500 if maneuver could open
the lung
1. Open the End-inspiratory Trend View:
Compare the status before (
Cursor Ref
) and during the RM (
Cursor C
).
REF C
D-11946-2017
D-11916-2017D-11917-2017
< 5 % ?
> 10 % ?
EXAMPLE: 40:40 MANEUVER
Page 42

42 |
2. Identify responder or non-responder:
What to look for in the End-inspiratory Trend View?
The following table shows two different results of a recruitment maneuver.
The first case shows a responder with a PIP of 34 mbar to open the dorsal areas
in ROI 4 (TV 1 % => 13 %). The differential image highlights this increase of
ventilation in the blue areas.
In contrast, the second case, a non-responder, shows only a minimal increase in
dorsal ventilation in ROI 4 (TV 4 % => 5 %), despite the relatively high PIP of 41
mbar. A significant increase in ventilation can be seen in ROI 3, due to a significant
increase in tidal volume from 434 ml to 861 ml.
In both cases a PEEP of 15 mbar was applied.
Responder:
TV in ROI 4 is significantly higher during the RM than before (e.g. TV ROI
4 – 10 %, and the differential image shows light blue color in ROI 4.
Non-Responder:
Small or no change in ROI 4 (± 0 – 2 %)
D-11947-2017
Page 43

Cllinical Application
| 43
4.2. IDENTIFY POSSIBLE DE-RECRUITMENT AND
OVERDISTENSION
Principle: Comparison of regional compliance at different
PEEP levels
Use the PEEP trial analysis to interpret the loss of compliance.
Step 1: Perform a decremental PEEP trial
According to hospital standards.
EXAMPLE: DECREMENTAL PEEP TRIAL
– Initial recruitment maneuver
– PEEP steps of 2 mbar
– Driving pressure ∆P (P
Plat
- PEEP) should remain constant
RM
PEEP trial
14 mbar
6 mbar
2 mbar
Definition of derecruitment:
A loss of ventilation towards lower PEEP levels indicates the onset of
derecruitment. This reduced ventilation can be caused by going below the
alveoli’s closing pressure and the subsequent collapse of alveoli. This
phenomenon is often accompanied by a low end-expiratory lung volume in
these regions.
Page 44

44 |
Definition of overdistension:
The term overdistension describes an excessive expansion of the
alveoli, which is very often caused by either high tidal volumes and / or high
end-expiratory lung volumes resulting from high PEEP levels.
In EIT, overdistension can be expected whenever a major loss of
ventilation is observed during PEEP trials in the non-dependent lung
areas towards higher airway pressures. During pressure controlled
ventilation this loss of ventilation can also be interpreted as reduction of
regional compliance.
Step 2: Perform PEEP trial analysis
1. Prepare analysis
Make sure that every PEEP level is represented by one section of appropriate
length. Manually adjust section positions if necessary.
D-30760-2017
Page 45

Cllinical Application
| 45
2. Perform analysis
Compliance changes during PEEP trials are conveniently displayed as a
series of images and a diagram. At lower PEEP levels, those compliance
changes may indicate collapse, at higher PEEP levels overdistension,
respectively. Based on this information, an individualized PEEP level can be
chosen, where the loss of compliance and the underlying adverse effects
are minimized.
4.3. INFLUENCE OF POSITIONING ON THE DISTRIBUTION
OF VENTILATION
The positioning of a body has an influence on the ventilation of the
lungs. The change in ventilation can be visualized with PulmoVista
®
500. Whether and to what extent patient positioning promises success
depends on the individual status of the patient, but the effect can be seen
immediately after the situation at EIT has changed. Here is an example of a
healthy lung during natural spontaneous breathing. The ventilation
distribution of a mechanically ventilated patient with impaired respiratory
function will be exactly reversed. The arrows represent the gravity vectors, the
numbers represent the regional distribution of ventilation.
D-30765-2017
Page 46

46 |
Supine position Gravity vector
Lateral position right
Lateral position left
D-11957-2017
4.4. PATIENT PRONING
PulmoVista® 500 allows the visualization of ventilated and non-ventilated
lung areas. It is therefore also suitable for visualizing and tracking changes in
ventilation following the application of any therapeutic intervention, such as after
patient proning.
Initial Condition
20 min. after 1
st
proning trial
20 min. after 2
nd
proning trial
Kotani T et al, J Anesth 2016 Feb 7;30(1):161-5. Epub 2015 Oct 7.
D-11909-2017
Page 47

Cllinical Application
| 47
4.5. INTUBATION CHECK
PulmoVista® 500 can help to detect a faulty tube position. Real-time
information helps EIT identify the correct tube position during the intervention.
D-11910-2017
Example: ET tube inserted too
deeply ventilation visible only
in right lung
4.6. PATIENT WITH PLEURAL EFFUSION
The following example shows the effect of an area with fluid accumulation in the
lungs, here in the case of a pleural effusion. The marked area is not ventilated and
as long as there are no changes, this region remains ›black‹.
Pleural effusion in CT-Image Pleural effusion in EIT-Image
D-54-2011
D-3430-2011
Page 48

48 |
4.7. ∆EELI-TREND AFTER SUCTION
The ∆EELI trend is predestined to visualize and evaluate end-expiratory events in
the lungs. In this case, a secretion suction was performed, which initially resulted
in a sharp drop in end-expiratory lung impedance (EELI) (-2,58 x TV
glob. C1).
D-11912-2017
After about 5 minutes, there is a significant increase in EELI globally and
regionally, but the original state has not yet been reached again (-0,5 x TV
glob.
Ref).
D-11913-2017
Page 49

EIT-Terminology
| 49
5. EIT-Terminology
Baseline:
Sets the reference for the next breath or sequence of breaths (changes in
impedance). The virtual baseline EIT image in the different views is black.
∆EELI = Changes of EELI:
Changes in end-expiratory lung impedance in the EIT sensitivity region.
Absolute impedance measurements cannot be directly related to endexpiratory lung impedance. Nevertheless, ∆EELI is strongly correlated to
changes in the end-expiratory lung volume within the EIT sensitivity region.
The PulmoVista
®
500 parameter ∆EELI expresses regional end-expiratory
lung impedance variations compared to the global tidal variation of Cursor
Ref
.
EELV = end-expiratory lung volume:
EELV is often used interchangeably with the term FRC. However, mechanically
ventilated patients exhale against PEEP and not against ambient pressure.
Therefore, physicians use the term EELV instead of FRC.
Globale Impedance Curve
D-11958-2017
Page 50

50 |
FRC = functional residual capacity:
FRC is a physiological parameter that describes the residual volume of lung
capacity at the end of passive expiration (against ambient pressure). EELV (or
FRC) describes the volume of air that can contribute to gas exchange between
breaths.
Negative impedance change:
Negative impedance changes are displayed in black or purple. They represent
inverted waveforms and are often caused by fluid accumulations inside the
thorax.
ROI = Region of Interest:
Arrangement of regions for quantitative analysis of EIT images.
Tidal image:
The Tidal Image represents the tidal volume distribution of one entire breath
from the end of expiration to the end of inspiration.
TV = Tidal Variation:
Increase in impedance during inspiration, correlates to the tidal volume VT.
TV global represents the tidal variation between the minimum value and the
maximum value in the global impedance curve for each breath. Regardless of
the tidal volume, this value is always 100 %, it merely serves as a reference for
the tidal variations of the ROI.
TV ROI:
Regional tidal variations indicate the percentage of the ventilation-related
impedance change that occur in the corresponding ROI.
Page 51

Contraindications
| 51
6. Contraindications
– Patients with pacemakers, defibrillators or other electrically active
implants
– Patients with damaged skin or impaired skin contact of the electrodes
due to wound dressings (PulmoVista 500 could also work in
“15-electrode mode”)
– Patients where the attachment of the patient belt could pose a risk to
the patient, e.g. patients with spinal lesions or fractures
– Patients with uncontrolled body movements
– Use during electricity-based therapies, such as electrosurgery or
electrocautery
– Use in the presence of strong magnetic fields, e.g. MRI
– Use the in conjunction with other bioimpedance measurement devices
– Safety and effectiveness have not been established in pregnancy
– Not validated for patients with tidal volumes smaller than 1 ml/kg
bodyweight or a body mass index above 50
– Images from extremely obese patients or those with massive lung
edema must be interpreted with care as signal quality may be affected
Page 52

52 |
Page 53

| 53
Notes
Page 54

54 |
Page 55

| 55
Notes
Page 56

9105279 | 18.03-1 | CR | LE | Subject to modifications | © 2018 Drägerwerk AG & Co. KGaA
CORPORATE HEADQUARTERS
Drägerwerk AG & Co. KGaA
Moislinger Allee 53–55
23558 Lübeck, Germany
www.draeger.com
REGION ASIA PACIFIC
Draeger Singapore Pte. Ltd.
25 International Business Parl
#04-20/21 German Centre
Singapore 609916
Tel +65 6308 9400
Tel +65 6308 9401
asia.pacific@draeger.com
REGION MIDDLE EAST, AFRICA
Drägerwerk AG & Co. KGaA
Branch Office
P.O. Box 505108
Dubai, United Arab Emirates
Tel +971 4 4294 600
Fax +971 4 4294 699
contactuae@draeger.com
REGION CENTRAL
AND SOUTH AMERICA
Dräger Panama S. de R.L.
59 East Street, Nuevo Paitilla
House 30, San Francisco Town
Panama City, Panama
Tel +507 377 9100
Fax +507 377 9130
servicioalcliente@draeger.com
Manufacturer:
Drägerwerk AG & Co. KGaA
Moislinger Allee 53–55
23558 Lübeck, Germany
Locate your Regional Sales
Representative at:
www.draeger.com/contact
Not all products, features, or services are for sale in all countries.
Mentioned Trademarks are only registered in certain countries and
not necessarily in the country in which this material is released. Go to
www.draeger.com/trademarks to find the current status.
REGION EUROPE
Drägerwerk AG & Co. KGaA
Moislinger Allee 53–55
23558 Lübeck, Germany
Tel +49 451 882 0
Fax +49 451 882 2080
info@draeger.com
 Loading...