

Page 1
POWER INSTRUMENTS
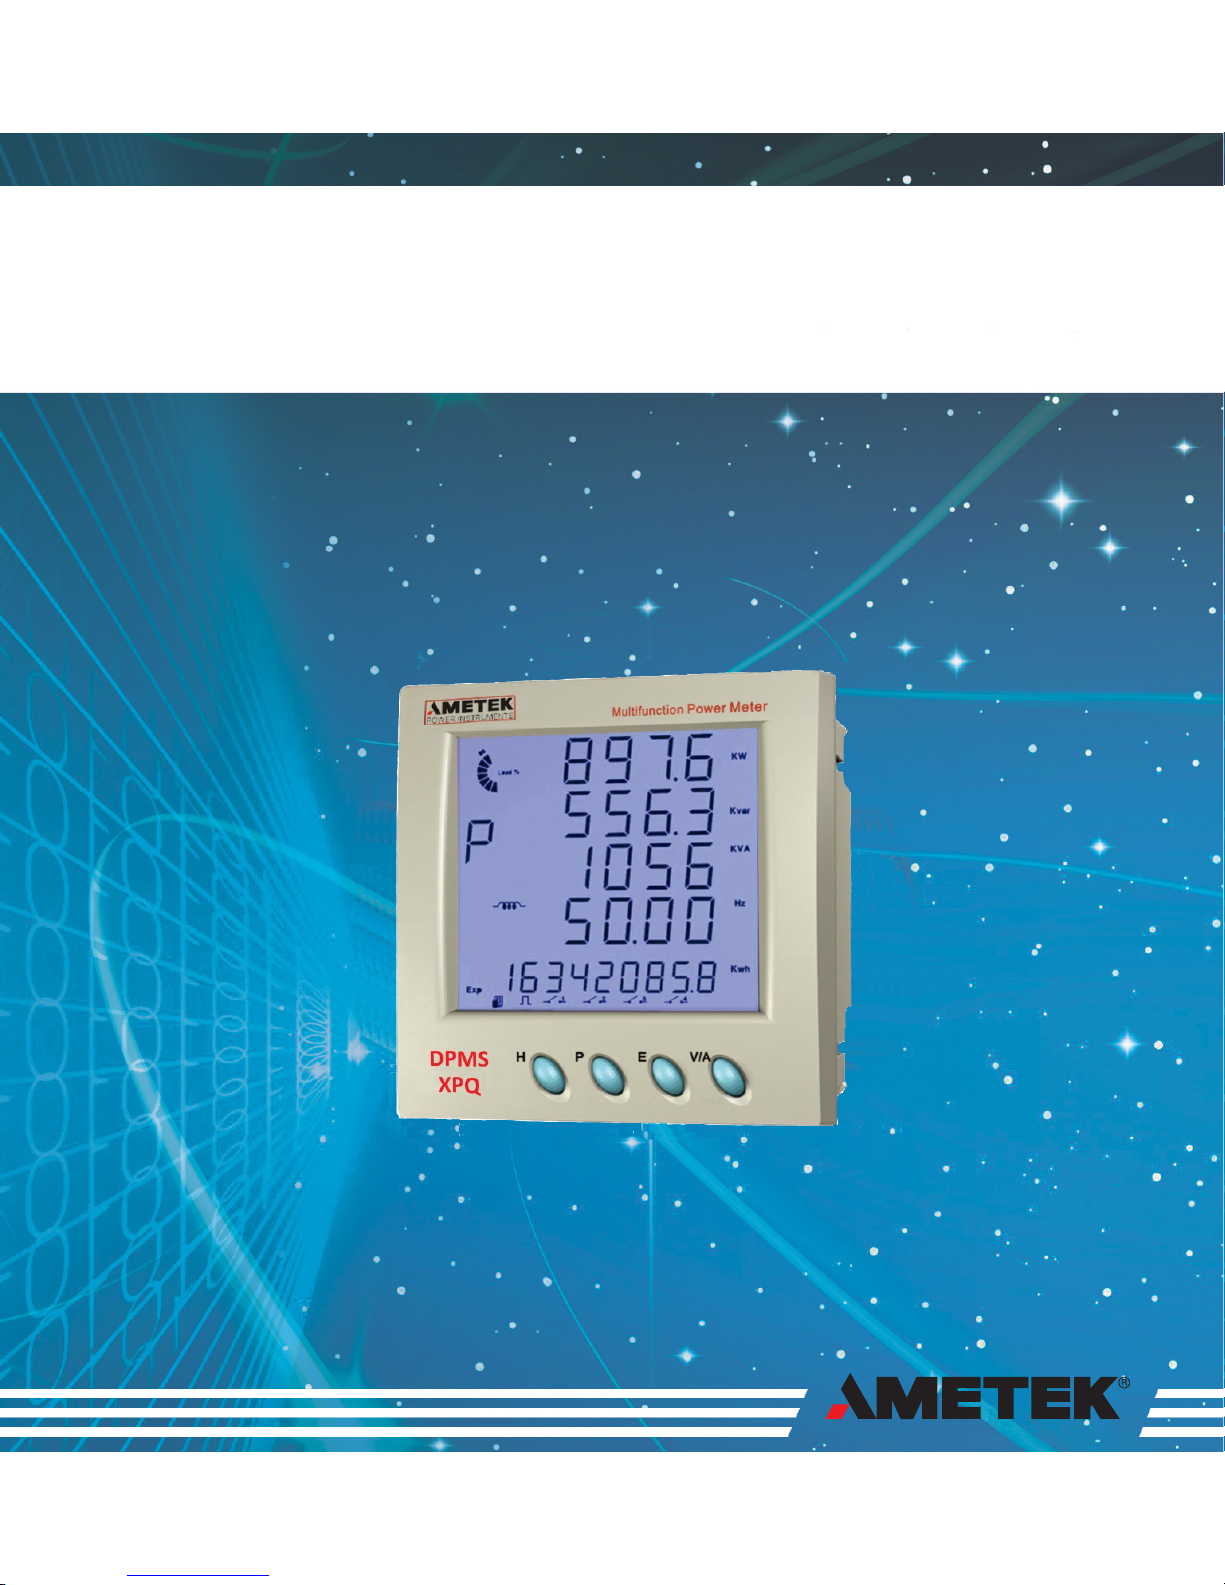
DPMS XPQ Multi-Function Power Meter
User Manual 1087-332
Page 2

Page 3

I
POWER INSTRUMENTS
Copyright 2008© V1.0
This manual may not be reproduced in whole or in part by any means,
without the expressed written consent of AMETEK.
The information contained in this document is believed to be accurate at
the time of publication, however, AMETEK assumes no responsibility for any
errors which may appear here and reserves the right to make changes without
notice. Please ask your local representative for the latest product specications
before ordering.
Page 4
II
DPMS XPQ User Manual
Please read this manual carefully before installation, operation and
maintenance of the DPMS XPQ meter.
The following symbols are used in this user’s manual and on the DPMS
XPQ meter to alert the danger or to prompt in the operating or setting process.
Danger symbol, Failure to observe the information may result in
injury or death.
Alert symbol, Alert to potential danger. Observe the information
after the symbol to avoid possible injury or death.
Installation and maintenance of the DPMS XPQ meter should only be
performed by qualied, competent personnel that have appropriate training and
experience with high voltage and current devices.
AMETEK is not liable for any problems that occur under proper operation.
Page 5

III
POWER INSTRUMENTS
content
Chapter 1 Introduction……………………………………………………………………………6
Purpose..................................………………………………………………………7
Application Area..............................………………………………………………………9
Function......................................………………………..……………………………9
Comparison......................................………………………………………….………10
Chapter 2 Installation……………………………………………………………………………12
Appearance and Dimensions……………………..……………………………………13
Installation Method…………………………………………………….……….….……14
Wiring.......................………………………………………………...……………………17
Chapter 3 Meter Operation and Parameter Setting…………….…………………………36
Display Panel and Key………………………………….………………………………37
Metering Data Reading…………………………………...……………….……………39
Statistics Display……………………...…………………………………………………43
Meter Parameter Setting…………….………………….…....…………………………44
Energy Parameter Setting……………………………….………………………..……51
Voltage Eligibility Parameter Setting…………….……….……………………………53
Chapter 4 Function and Software…………………………….………………………..……56
Basic Analog Measurements……………………………....…………………….………57
Event Alarming…………………………………………………………..………………74
Chapter 5 Communication……………………………………………………..…….…………86
Introducing Modbus Protocol…………………….….….………………..………………87
Format of the communication………………………………….….……………………..90
Data Address Table and Application Details........................…..………………………96
Appendix……………………………………………………..……………………..……………122
Appendix A Technical Data and Specication………………………………………123
Appendix B Ordering Information………………………………………………..……127
Page 6

IV
DPMS XPQ User Manual
Getting Started!
Congratulations!
You have received an advanced, versatile, multifunction power meter, also
known as a Remote terminal unit (RTU), which will greatly benet your power
system.
When you open the package, you will nd the following items.
1. DPMS XPQ meter 1
2. 14-Pin terminal 2
3. Installation clips 4
4. User’s operation manual 1
5. Maintenance guarantee card 1
Please read this manual carefully before operating or setting the meter to
avoid unnecessary results. You can read only part of this manual depending on
how you use the meter.
Chapter 1 helps you to understand the fundamental function, specication
and application area.
Chapter 2 describes detailed installation and wiring.
Chapter 3 describes the data display and parameter setting method.
Chapter 4 outlines the functions of the meter and the way to use them.
Chapter 5 gives the address table.
Appendix lists the technical data and specifications and ordering
information.
Page 7

Chapter 1 Introduction
Purpose
Application Area
Functions
DPMS XPQ Series
5
Page 8

6
DPMS XPQ User Manual
Purpose
Powerful Multifunction Power Meter
The DPMS XPQ series multifunction power meter is the new generation of
the very popular DPMS. It has more functions and higher accuracy. It not only
integrates three-phase energy measuring and displaying, energy accumulating,
harmonic measuring, malfunction alarm, statistics and records, digital input /
output and network communication, but also contains the following functions:
four quadrant energy measuring, time-of-use (TOU), auto-freezing, waveform
and over range waveform capture, programmable over range alarming,
schedule of events, trending records etc. Graceful and high-lighted back light
makes it easy to check the measuring data. Simple HMI interface makes it easy
to master. The multi-row display lets you observe various data without touching
any keys.
Ideal Choice for Electric Automation SCADA System
The DPMS XPQ can be used to replace all traditional electric meters.
It also can be used as a Remote Terminal Unit (RTU) for monitoring and
controlling in a SCADA system. All the measured data is available via digital
RS485 communication ports running the ModbusTM protocol.
Energy Management
The DPMS XPQ can measure double direction four quadrant kWh and
kVARh with accuracy up to class 0.5S of IEC60253-22. It can provide maximum/
minimum energy data and energy demand data. With the help of software, you
can easily know how the load and energy are running. It also gives you all kinds
of measurement tables.
Page 9
7
POWER INSTRUMENTS
Remote Power Control
The main function of the DPMS XPQ is measurement, but it also has some
exible I/O functions. This makes the meter very useful as a distributed RTU
(metering, monitoring, remote controlling in one unit).
Power Quality Analysis
With the powerful digital signal processing ability, the DPMS XPQ intelligent
power meter can be used as an online power quality analysis instrument. It can
simultaneously and continuously give out the analysis results such as THD of
voltage and current, harmonics up to the 31st order and an unbalance factor of
voltage and current, etc. Main functions of the DPMS XPQ are listed in table 1.1.
Metering Energy
VLN, VLN average, VLL, VLL average.
I, I average, IN.
Power, Reactive Power, Apparent Power and Power
factor of each phase and total.
Frequency.
Bidirectional, four quadrants and system Energy,
Reactive Energy, Apparent Energy
Programmable energy freezing.
Period Energy, Reactive Energy, Apparent Energy
Four time zone schedules.
Statistics and Records Energy and Demand
Max/Min value of statistics with time stamp
Maximum of Demand
SOE, Waveform capture and records
kWh, kVARh of 4 quadrants:
Import, Export, Total, Net
Demand of Power and Reactive Power
Power Quality Analysis Over range Alarming
THD, Even THD and Odd THD of Voltage, Current
Harmonics and Crest factor of Voltage
Telephone Harmonic waveform Factor (THFF).
Harmonics and K Factor.
Unbalance Factor of Voltage and Current.
Statistics of Voltage Eligibility.
Monitor up to 240 parameters.
Programmable parameter limitations.
Programmable alarming logic.
Alarming outputs combined with DO or Relays.
Auto-recording of alarming events.
Alarming-trigger waveform recording.
Communication I/O port and Control
RS485 Communication port.
Modbus RTU Protocol
4 Digital Input (DI) (Wet or Dry)
2 Relay Output and 2 Digital Output (DO)
Table 1.1 Main functions of the DPMS XPQ series
Page 10

8
DPMS XPQ User Manual
Application Area
Power Distribution Automation Intelligent Electric Switch Gear
Industry Automation Building Automation
Energy Management System Large UPS System
Function
Multifunction, High Accuracy
The DPMS XPQ sSeries multifunction Intelligent power meter is powerful
in data collecting and processing. Electric power parameters; metering,
energy accumulating ,harmonic measuring, malfunction alarming, statistics
and records, digital input /output and network communication, four quadrant
energy measuring, time-of-use(TOU), auto-freezing, waveform and over range
waveform capture, programmable over range alarming, schedule of events,
trending records etc.
Accuracy of Voltage and Current is 0.2%, True-RMS
Accuracy of Power and Energy is 0.5%, four quadrants metering.
Small Size and Easy Installation
With the size of DIN96 ×96 and 55mm depth after mounting, the DPMS
XPQ can be installed in a small cabin. The fixing clips are used for easy
installation and removal.
Easy to Use
With a large high density LCD screen, the display of the DPMS XPQ is
easy to read and use. All the setting parameters can be accessed by using
panel keys or a communication port. The setting parameters are protected in
Page 11

9
POWER INSTRUMENTS
EEprom, which will maintain its content after the meter is powered off. With the
backlight of the LCD, the display can be easily read in a dim environment. The
back light “on” time is selectable.
Multiple Wiring Modes
The DPMS XPQ can easily be used in either: high voltage, low voltage,
three phase three wires, three phase four wires or a single phase system.
High safety, high stability, the DPMS XPQ was designed according to industrial
standards. It can run stably under high power disturbance conditions as it has
passed IEC and CE.
Comparison
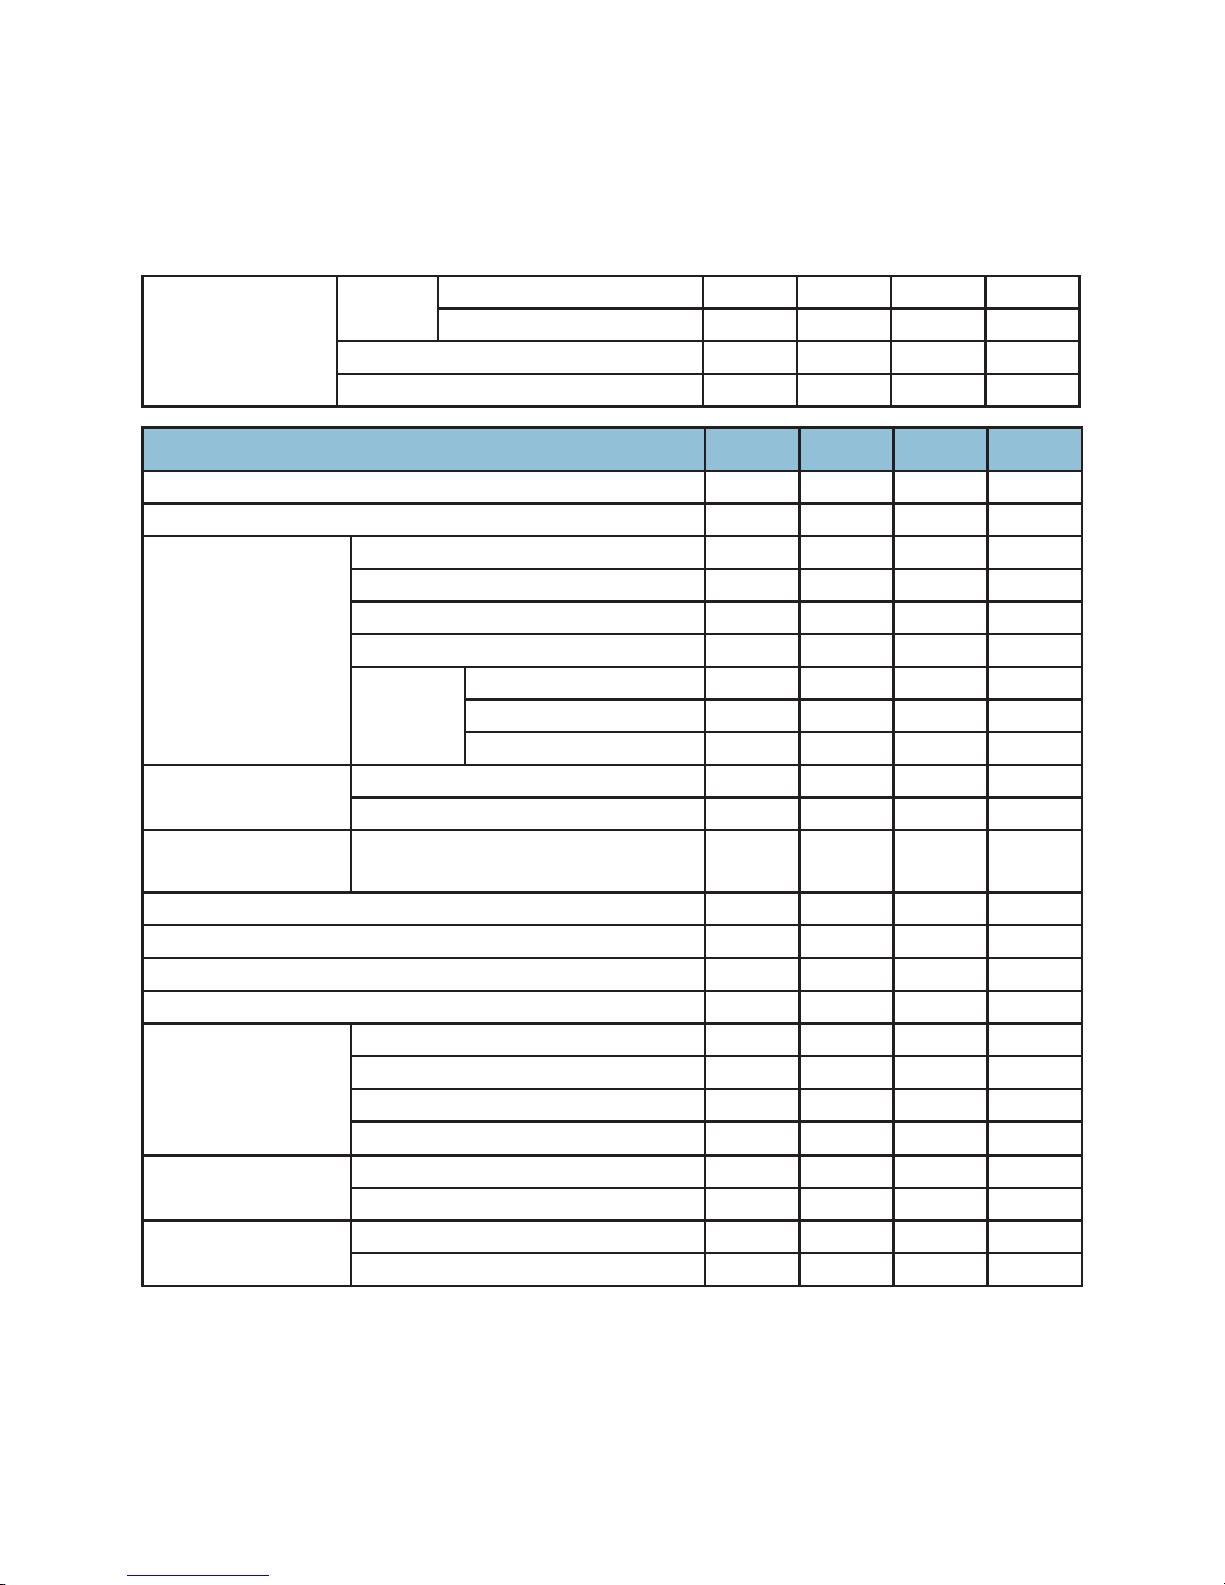
To meet different demands of customers, the DPMS XPQ series consists
of four types: DPMS XPQ-D (time-of-use pattern), DPMS XPQ-E (power quality
pattern), DPMS XPQ-F (waveform and alarming pattern) and DPMS XPQ-G
(general function pattern). In order to introduce them all, this manual is based
on the DPMS XPQ-G. Other patterns may not contain some functions so please
refer to the following table carefully.
Table 1.2 Comparison of the DPMS XPQ series
Function
D E F G
Basic parameters ● ● ● ●
Digital I/O ● ● ● ●
Demand ● ● ● ●
Basic settings ● ● ● ●
Device property ● ● ● ●
Page 12
10
DPMS XPQ User Manual
Harmonics THD Phases and all ● ● ●
phase ● ●
Voltage harmonic analysis ● ●
current harmonic analysis ● ●
Function
D E F G
Sequence ● ● ●
phase angle ● ● ●
Energy Real time ● ● ● ●
Current month TOU ● ●
Previous month TOU ● ●
Accumulative TOU ● ●
Frozen Real time ● ●
Current month TOU ● ●
Accumulative TOU ● ●
MAX/MIN Current ● ●
Previous ● ●
Voltage eligibility Daily, Monthly, Yearly, Frozen,
Accumulative
● ●
SOE log ● ●
Alarm log ● ● ●
Waveform log
● ●
Trending log ● ●
System status Alarming record ● ● ●
SOE, waveform, trending ● ●
Schedule of TOU ● ●
Run time
● ● ● ●
Alarm Alarming ● ● ●
Waveform triggering ● ●
Others Max and Min recording mode ● ● ●
Trending settings ● ●
Page 13

Chapter 2 Installation
Appearance and Dimensions
Installation Method
Wiring
11
Page 14

12
DPMS XPQ User Manual
Note: Before trying to operate the meter, note the functions according to its
pattern. The installation method is introduced in this chapter. Please read this
chapter carefully before beginning installation work.
Appearance and Dimensions
Fig 2.1 Appearance of the DPMS XPQ
PART NAME DESCRIPTION
1. Enclosure
The DPMS XPQ enclosures are made of high strength anticombustible engineered plastic
2. Front
Casing After the installation, this part is before the panel. The color of
the front casing is optional
3. LCD Display Large bright blue backlight LCD Display
4. Key
Four keys are used to select display and to set parameters of the
meter
5. Input Wiring Terminals Used for Voltage and Current input
6. Auxiliary Wiring Terminals Used for auxiliary power, communication and DI
7. Extend Wiring Terminals Auxiliary I/O wiring terminals
8. Installation Clip The clips are used for xing the meter to the panel
Table2.1 Part Names of the DPMS XPQ
3
1
2
4
8
5
7
6
Page 15

13
POWER INSTRUMENTS
Dimensions
Fig 2.2 Dimensions
Installation Method
Environmental
Before installation, please check the environment temperature and humidity
to ensure the DPMS XPQ meter is being placed where optimum performance
will occur.
Temperature
Operation: -25 - 70 deg.
Storage: -40 - 85 deg.
Humidity
5% - 95% non-condensing
96.00
96.00
55.00
96.00
43.00
38.50
Front
Side
Page 16

14
DPMS XPQ User Manual
The meter should be installed in a dry and dust free environment and avoid
heat, radiation and high electrical noise sources.
Maximum Altitude: 2,000m
Site Requirement: Indoor Use
Installation Steps
Normally, meters are installed on the panel of switch gear.
1. First, cut a square hole on the panel of the switch gear. The cutting size
is in g 2.3 Unit (mm)
Fig 2.3 Panel Cutting
2. Second, remove the clips from the meter and insert the meter into the
square hole from the front side.
Fig 2.4 Put the meter into the square hole
Cut
panel
90±
0.5
0.0
90±
0.5
0.0
Page 17
15
POWER INSTRUMENTS
3. Finally, install clips back on the meter from the backside and push the
clip tightly so that the meter is afxed on the panel.
Fig 2.5 Use the clips to afx the meter on the panel
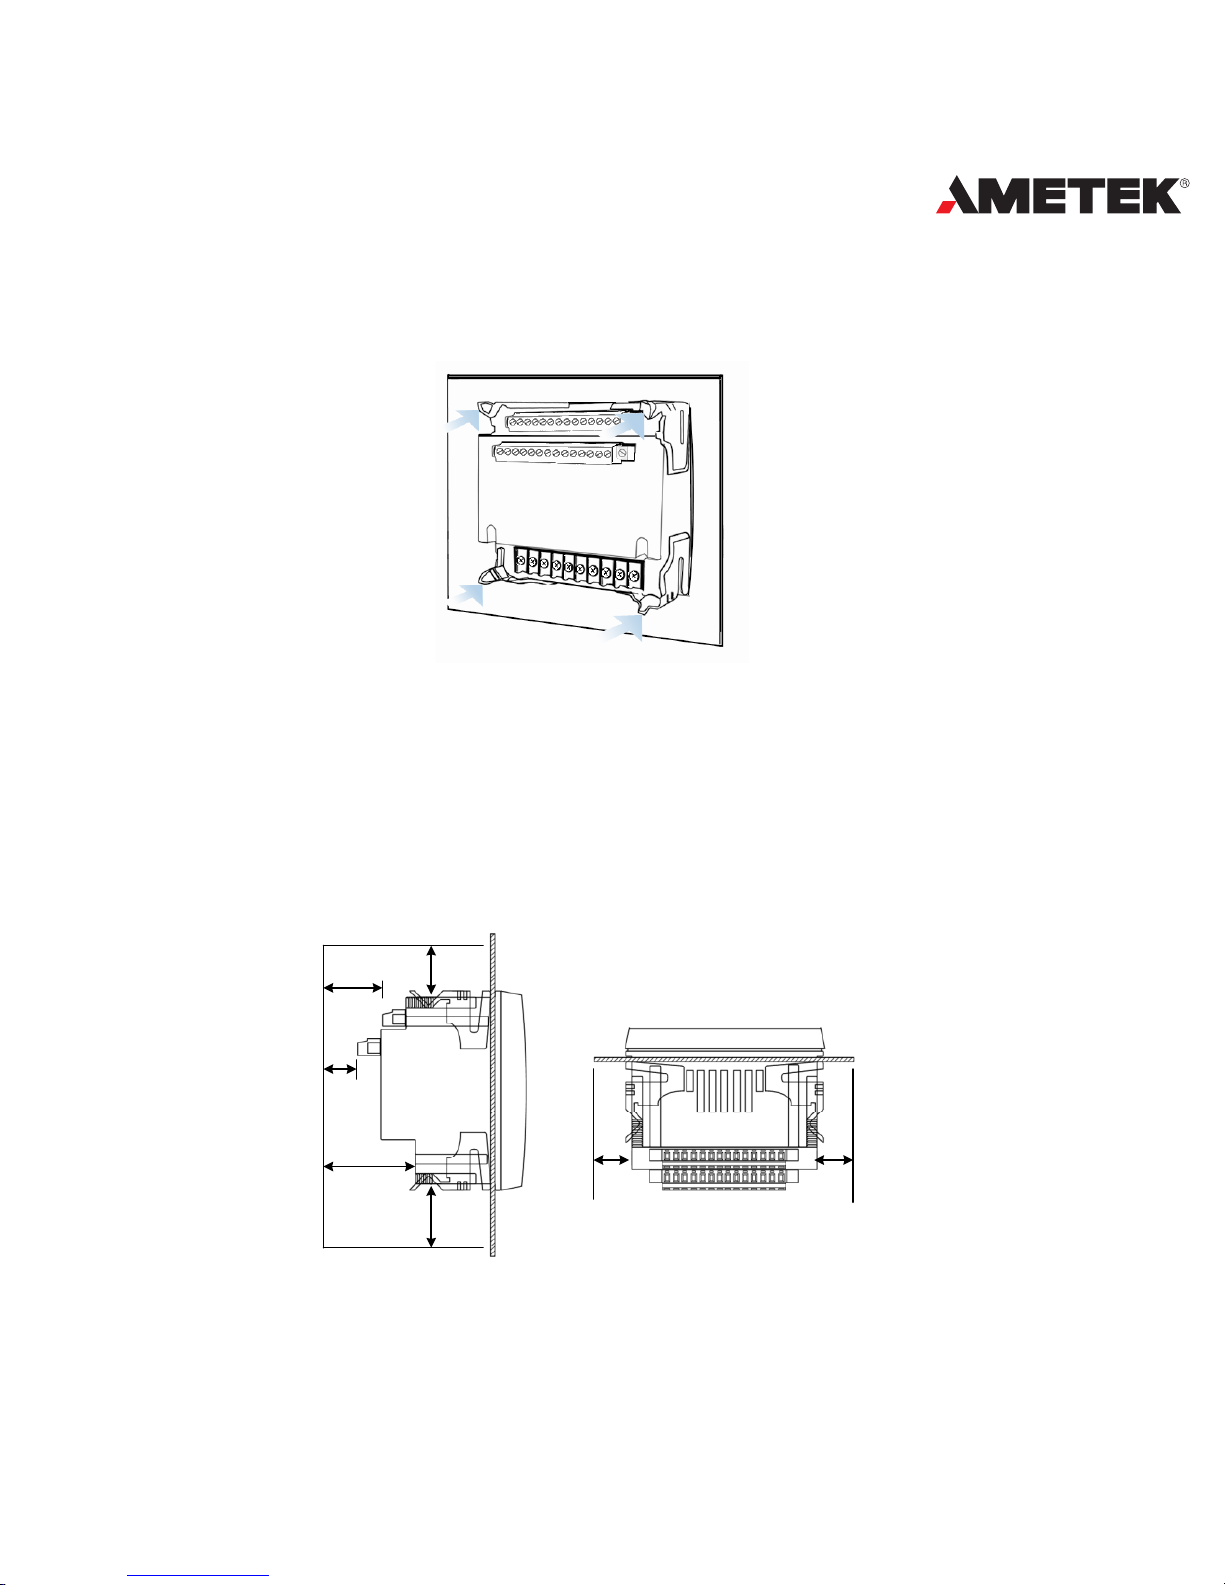
Space required for Installation
The space around the meter should be large enough so that the meter
removal, terminal strip wiring and wire arrangement could be done easily. The
recommended minimum space around the meter is shown in Table 2.2 and Fig
2.6.
Fig 2.6 Space around the meter
panel
Paneld
c
e
b
a
f
g
panel
Page 18
16
DPMS XPQ User Manual
Environment Temperature Minimum Distance(mm)
a b c d e f g
<50< 25 25 38 38 64 25 25
≥50< 38 38 51 51 76 38 38
Table 2.2 Minimum Space
Wiring
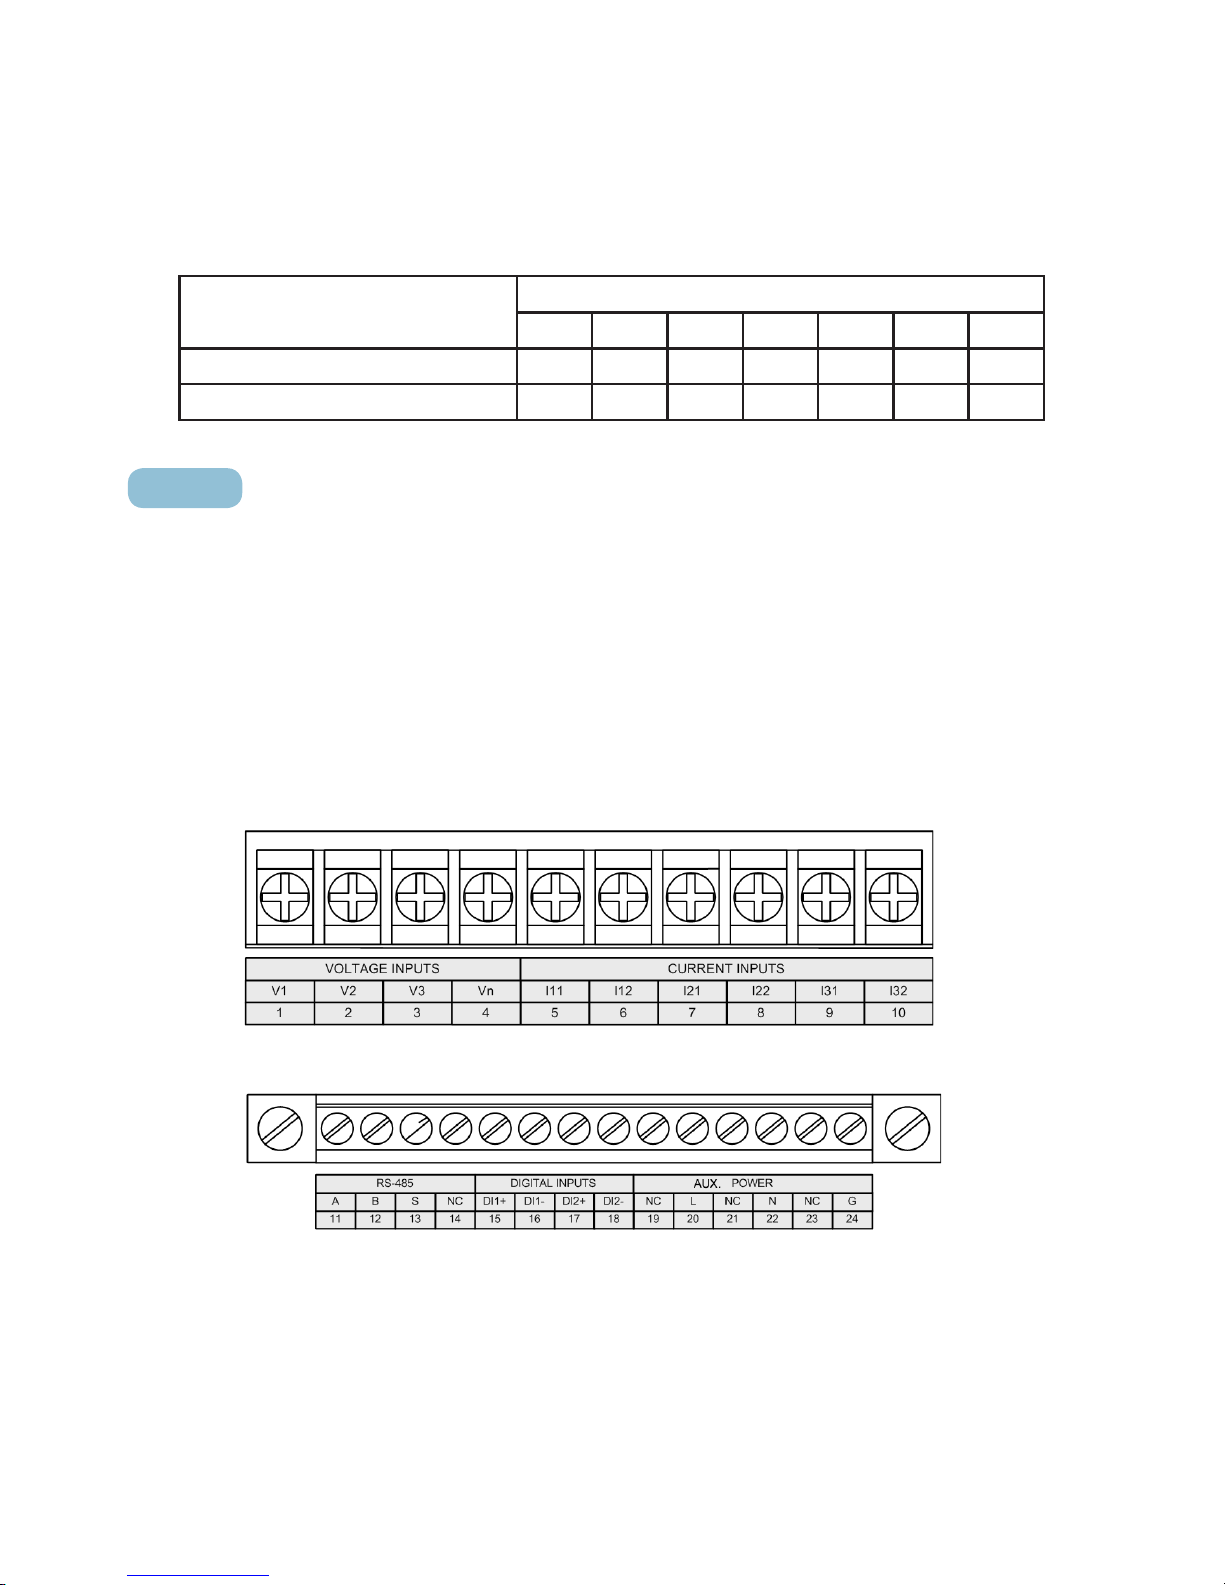
Terminal Strips
There are three terminal strips on the back: Voltage & Current input,
Auxiliary and Extend. Only the DPMS XPQ with the PRIO option has the Extend
Terminal Strip. The 1, 2 and 3 are used to represent each phase of a three
phase system. They have the same meaning with A, B and C or R, S and T in a
three phase system.
Voltage & Current Input Terminal Strip
Auxiliary Terminal Strip
Note: NC means No Connection
Page 19

17
POWER INSTRUMENTS
Extend Terminal Strip
Fig 2.7 Terminal Strips
Safety Earth Connection
Before doing the meter wiring connection, please
make sure that the switch gear has a safety Earth
system. Connect the meter safety earth terminal to the
switch gear safety earth system. The following safety
earth symbol is used in this user’s manual.
Auxiliary Power
The auxiliary power supply of the meter is 100-
240Vac (50/60Hz) or 100-300Vdc. The meter’s typical
power consumption is less than 2W. A regulator or a
UPS should be used when the power supply undulates
too much. The terminals for the auxiliary power supply
are 20, 22 and 24 (L, N, G). A switch or circuit-breaker should be included in the
building installation, and it should be in close proximity to the equipment and
within easy reach of the operator, and it should be marked as the disconnecting
device for the equipment.
DANEROUS
Only qualied personnel
s h o u l d d o th e w i r e
connection work. Make
sure the power supply
is off and all the wires
are powerless. Failure to
observe this may result
in severe injury or death.
Note
Make sure the auxiliary
power terminal of the
meter, G, is connected
to th e safety Ea r t h of
switchgear.
Page 20

18
DPMS XPQ User Manual
Fig 2.8 Wiring of Power Supply
A fuse (typical 1A/250Vac) should be used in the auxiliary power supply
loop. No.24 terminal must be connected to the safety earth system of
switchgear. An isolated transformer or EMI lter should be used in the auxiliary
power supply loop if there is a power quality problem in the power supply.
Fig 2.9 Wiring of Aux. Power Supply with power line lter
Choice of wire should be AWG22~16 or 0.6~1.3mm2.
Note: A lter should be used if there is an EMI problem.
Voltage Input
Meter input voltage should be 40~230Vac L-N,
60~400Vac. L-L. The voltage input could be directly
connected to the meter terminal without the use of PT if
the voltage system is less than 400Vac (L-L). If the input
Voltage is higher than 400Vac, a PT or VT should be
Note
The secondary of PT
c a n n o t be sh o r t ed ,
otherwise it may cause
the severe damage of
the instrument.
Note
Mak e sure th e po we r
supply voltage is the
same as what the meter
needs fo r its auxiliary
power.
L
N Acuvim-X
G
20
22
24
Power Supply
1A FUSE
Ground
L
N Acuvim-X
G
20
22
24
L L
N N
G G
Power Supply
1A FUSE
Ground
Power
lter
Page 21

19
POWER INSTRUMENTS
used. A fuse (typical 1A/250Vac) should be used in the voltage input loop. A PT
should be used to transform the high voltage into the measurement range of the
meter if it is used in a high voltage system. The wire gauge of the input voltage
should be AWG16~12 or 1.3~2.0mm
2
.
Note: In no circumstances should the PT secondary be shorted. The PT
secondary should be well grounded at one end.
Current Input
In a practical engineering application, CTs should be installed in the
measuring loop. Normally the CT secondary is 5A. 1A is possible as an option.
A CT accuracy over 0.5% (rating over 3VA) is recommended and it will inuence
the measuring accuracy. The wire between the CT and meter should be as short
as possible. The length of the wire may increase the error of the measurement.
CTs must be required for rated current over 5A.
The wire guage of the input current should be AWG15~10 or 1.5~2.5mm2.
Note: The CT loop should not be open in any circumstances when the power
is on. There should not be any fuse or switch in the CT loop and one end of the
CT loop should be connected to the ground.
Vn Connection
Vn is the reference point of meter input voltage. The lower the wire
resistance the lower the error.
Three phase wiring diagram
The DPMS XPQ can satisfy most kinds of three phase wiring diagrams.
Please read this part carefully before you begin to do the wiring so that you may
chose a wiring diagram suitable for your power system.
Page 22
20
DPMS XPQ User Manual
The voltage and current input wiring mode can be set separately in the meter
parameter setting process. The voltage wiring mode could be 3-phase 4-line
Wye (3LN), 3-phase 4-line 2PT Wye mode (2LN) and 3-phase 3-line open delta
(2LL). The current input wiring mode could be 3CT, 2CT and 1CT. Any voltage
mode could be grouped with one of the current modes.
Voltage Input Wiring
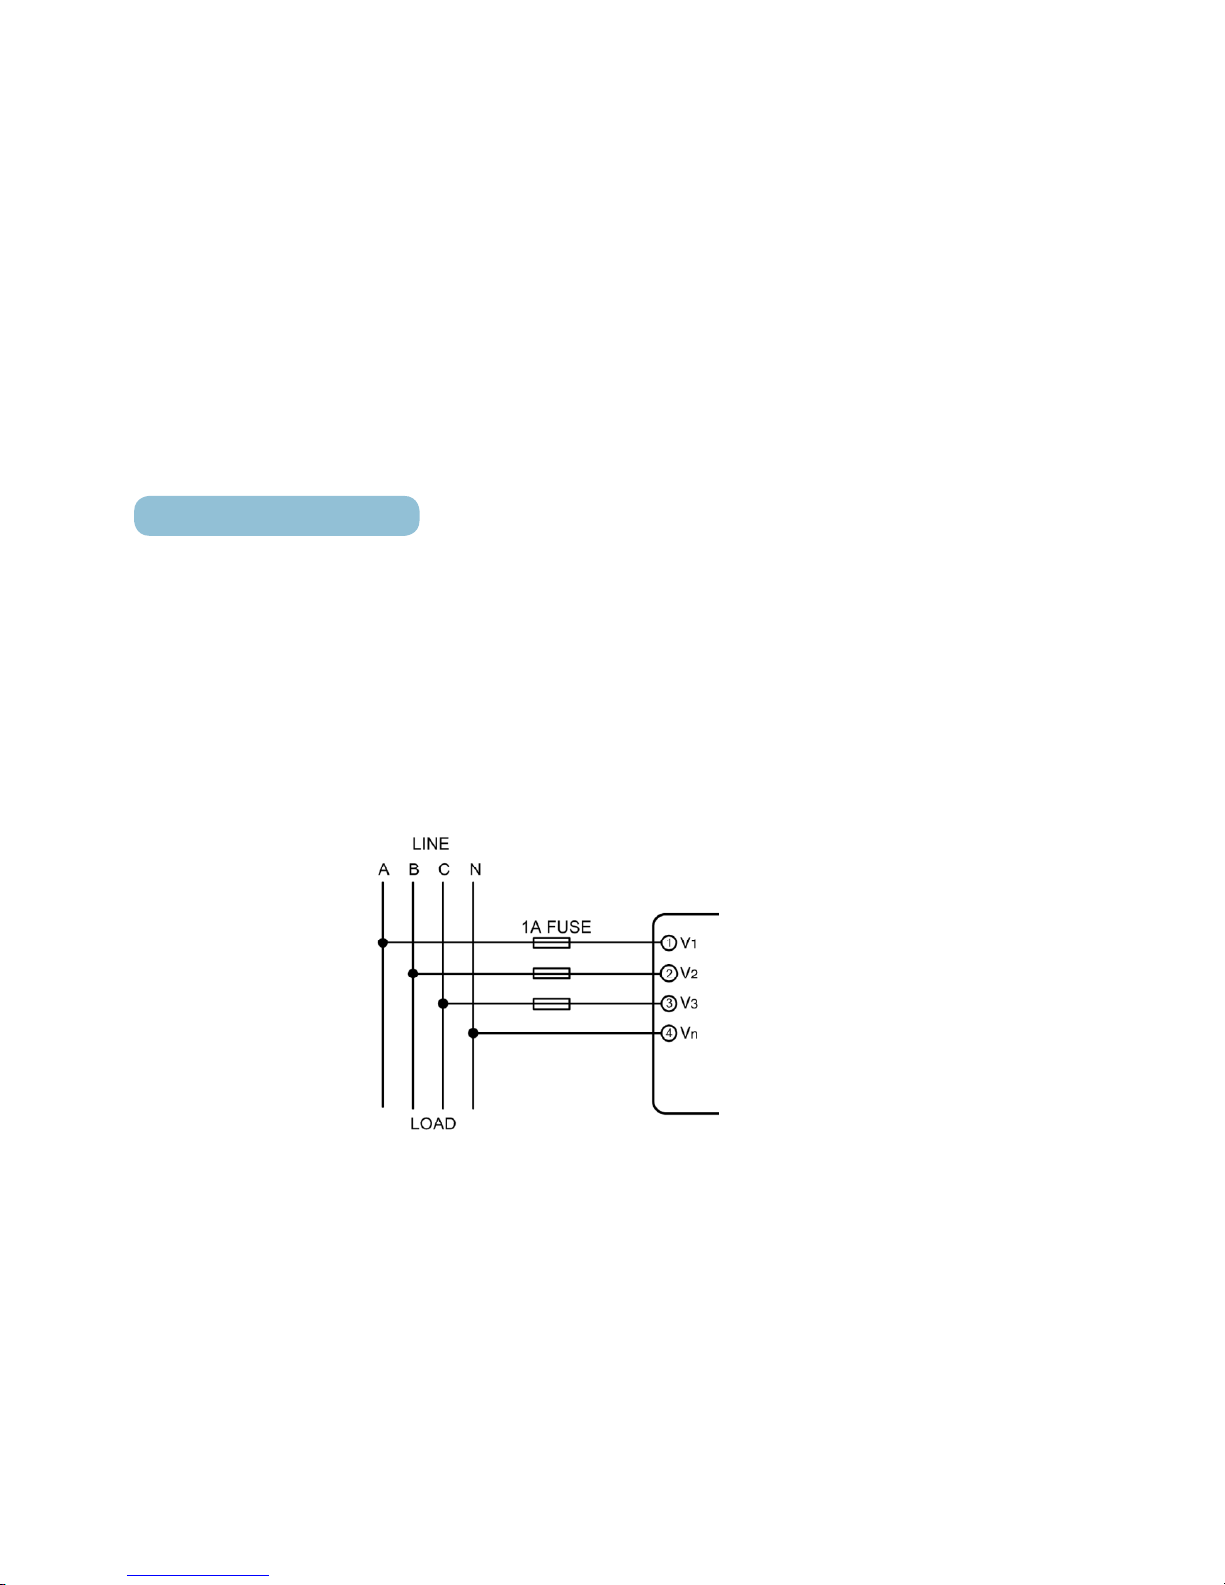
3-Phase 4-Line Wye mode (3LN)
The 3-Phase 4-Line Wye mode is commonly used in low voltage electric
distribution power systems. The power line can be connected to the meter
voltage input directly as in g 2.10a. In the high voltage input system, 3PT Wye
mode is often used as in g 2.10b. The voltage input mode of the DPMS XPQ
should be set to 3LN for both voltage input wiring modes.
Fig 2.10a 3LN direct connection
Acuvim-X
Page 23
21
POWER INSTRUMENTS
Fig 2.10b 3LN with 3PT
3-Phase 3-Line direct connection mode (3LN)
In a 3-Phase 3-Line system, power line A, B and C are connected to V1, V2
and V3 directly. Vn is oated. The voltage input mode of the DPMS XPQ should
be set to 3LN.
Fig 2.11 3LN 3-Phase 3-Line direct connection
Acuvim-X
Page 24

22
DPMS XPQ User Manual
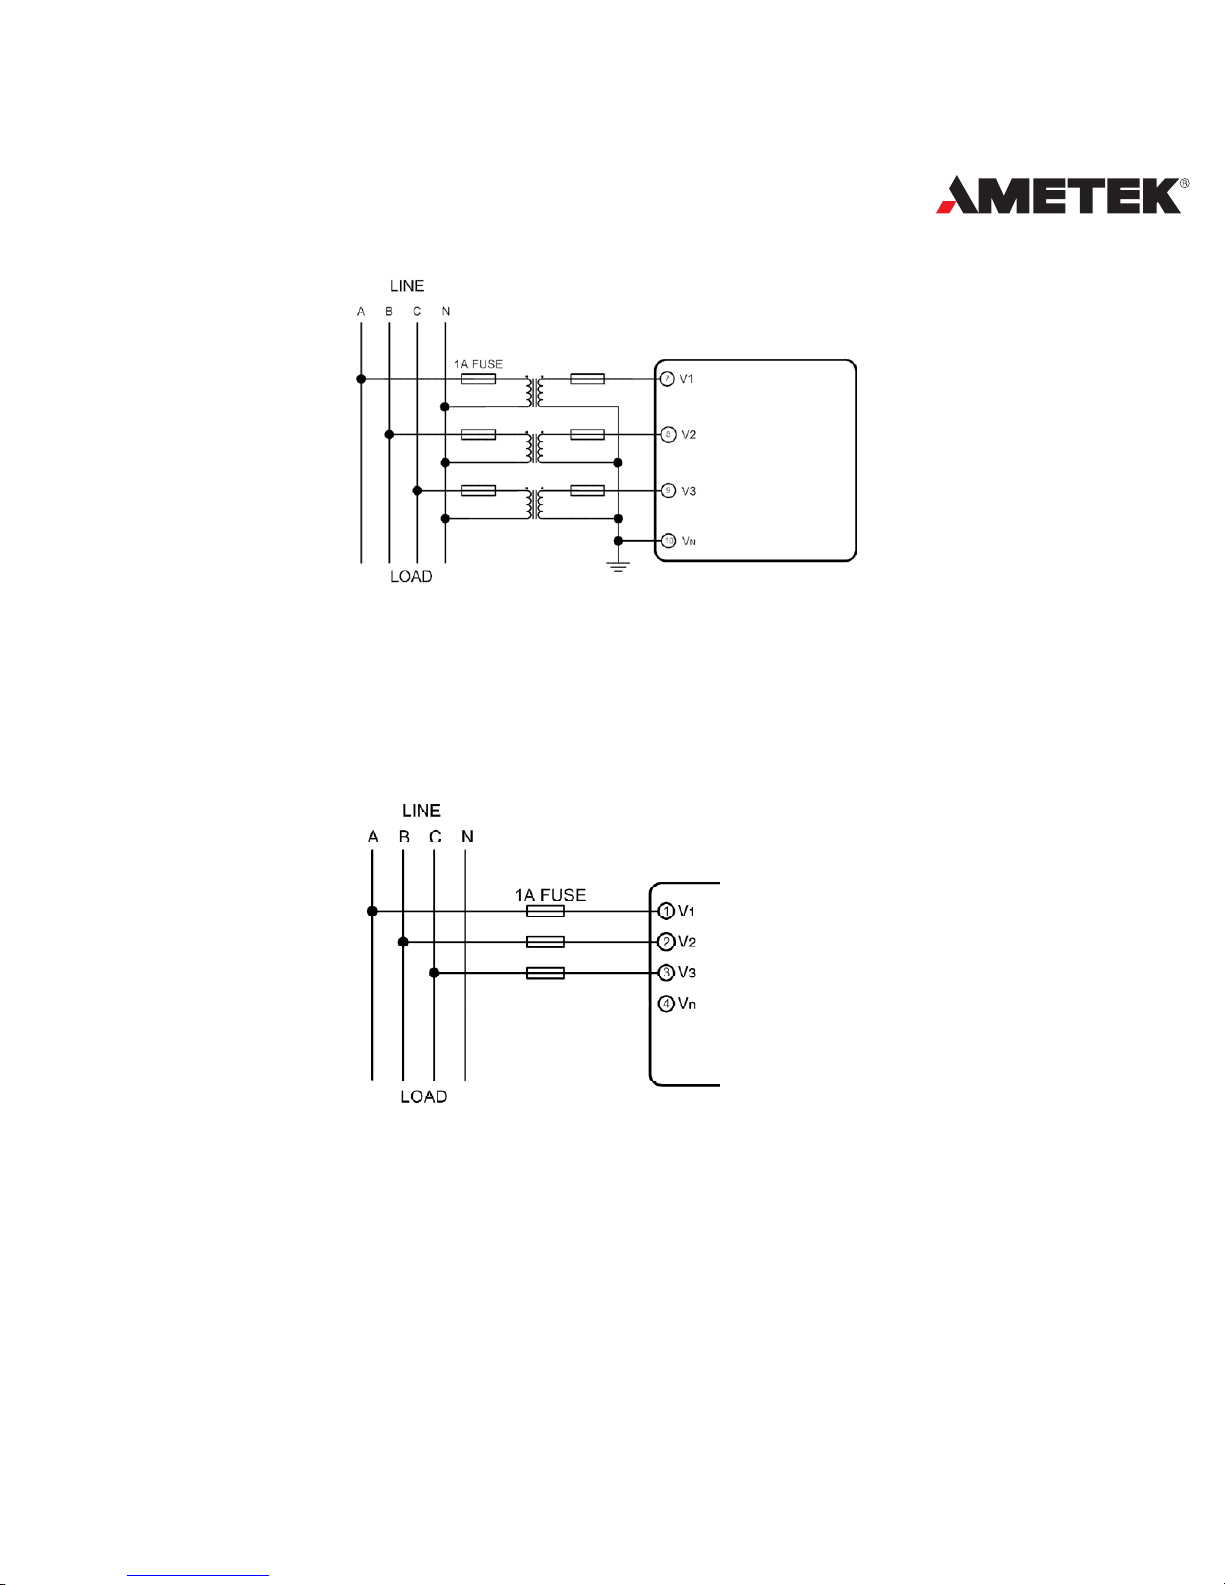
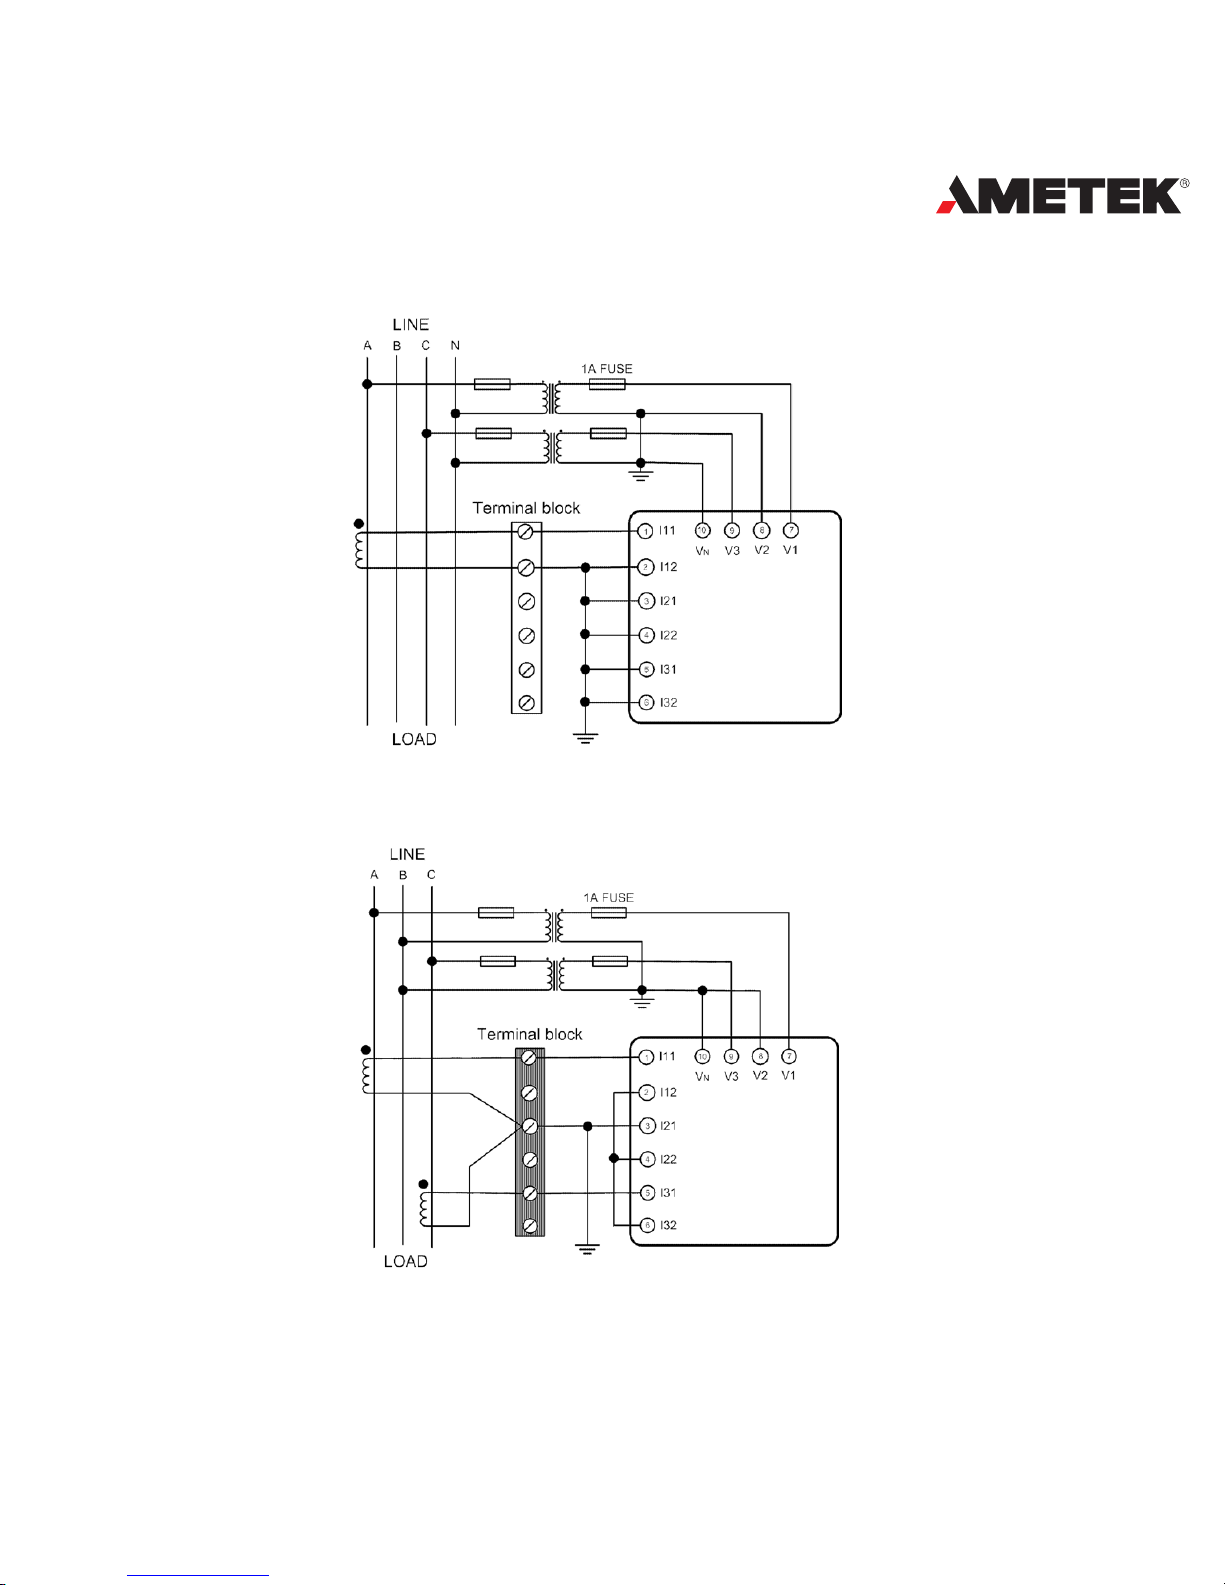
3-Phase 4-Line 2PT mode (2LN)
In some 3-Phase 4-Line Wye systems, 2PT Wye mode is often used as in
g 2.12. It is supposed that the 3 phases of the power system are balanced. The
voltage of V2 is calculated according to V1 and V3. The voltage input mode of
the DPMS XPQ should be set to 2LN for 2PT voltage input wiring mode.
Fig 2.12 2LN with 2PTs
3-Phase 3-Line open Delta Mode (2LL)
Open delta wiring mode is often used in high voltage systems. V2 and
Vn connect together in this mode. The voltage input mode of the DPMS XPQ
should be set to 2LL for voltage input wiring mode.
Fig 2.13 2LL with 2PTs
Page 25
23
POWER INSTRUMENTS
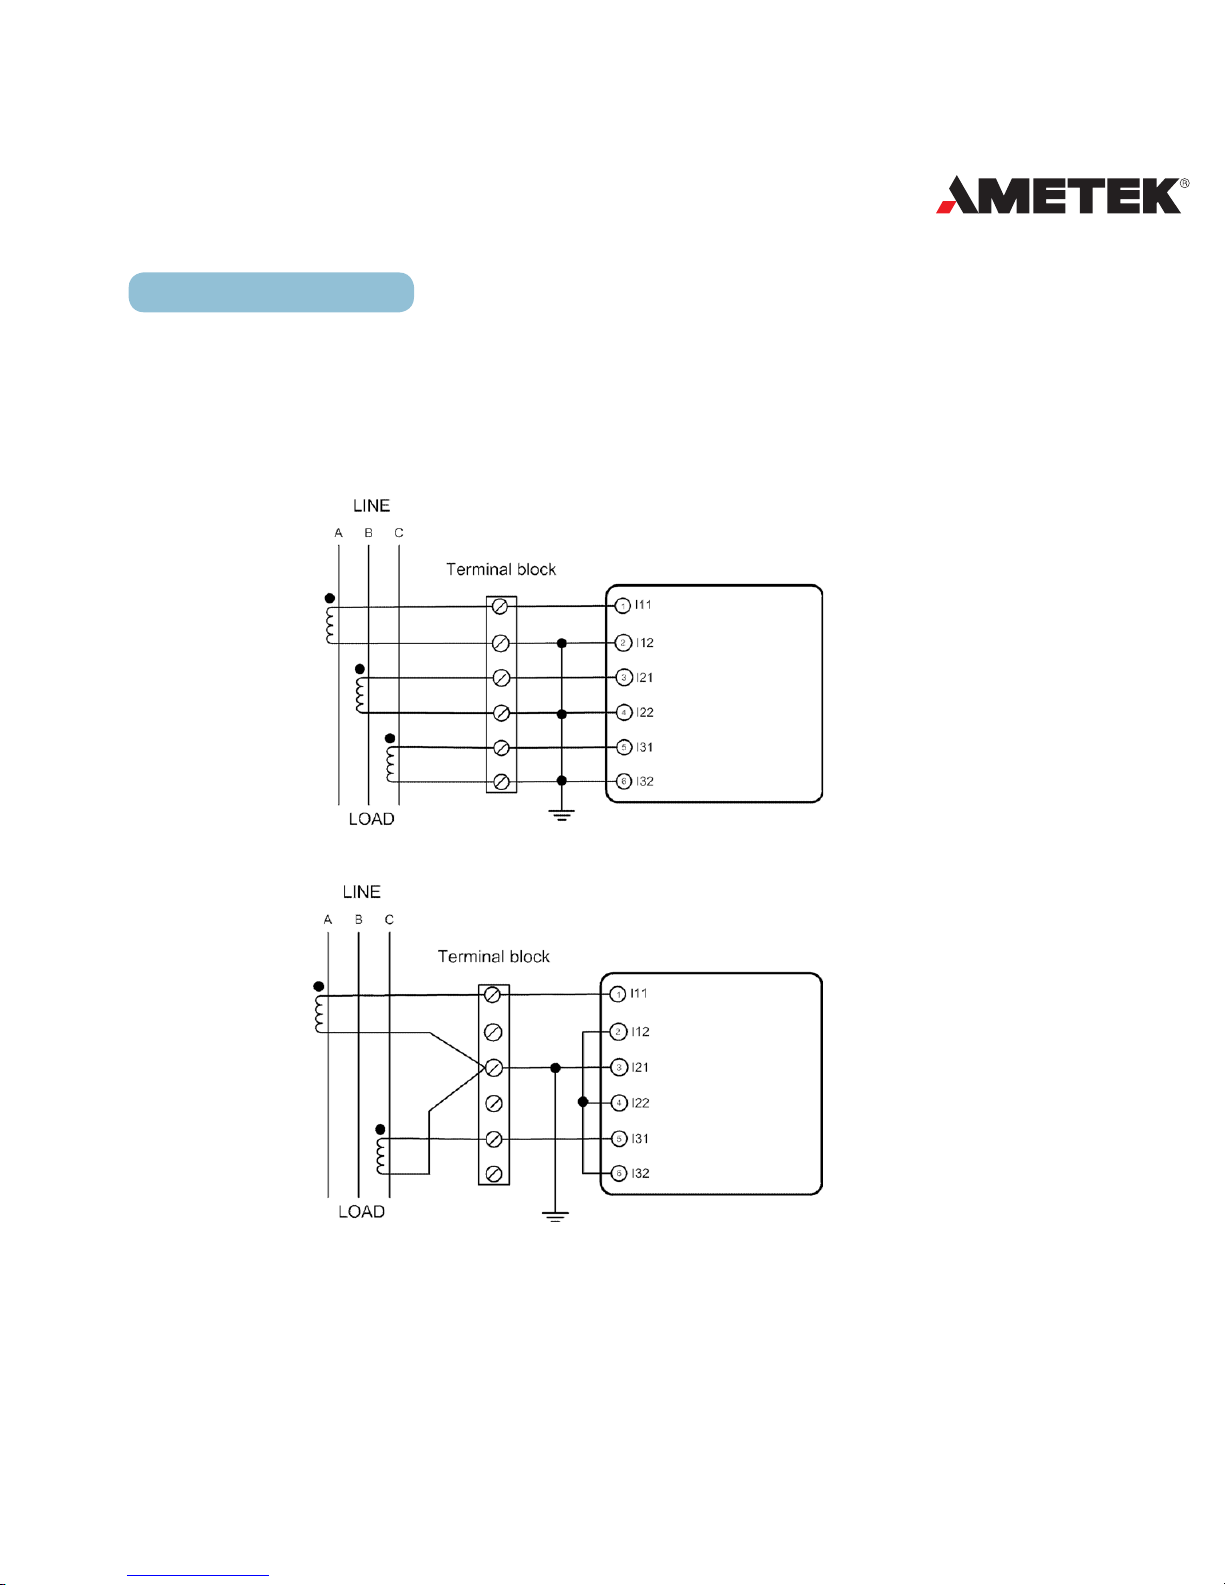
Current Input Wiring
3CT
All current input of a three phase system can be viewed as 3CT, whether
there are 2 CTs or 3 CTs on the input side. The current input mode of the DPMS
XPQ should be set to 3CT for this current input wiring mode.
Fig 2.14 3CT-a
Fig 2.15 3CT-b
Page 26
24
DPMS XPQ User Manual
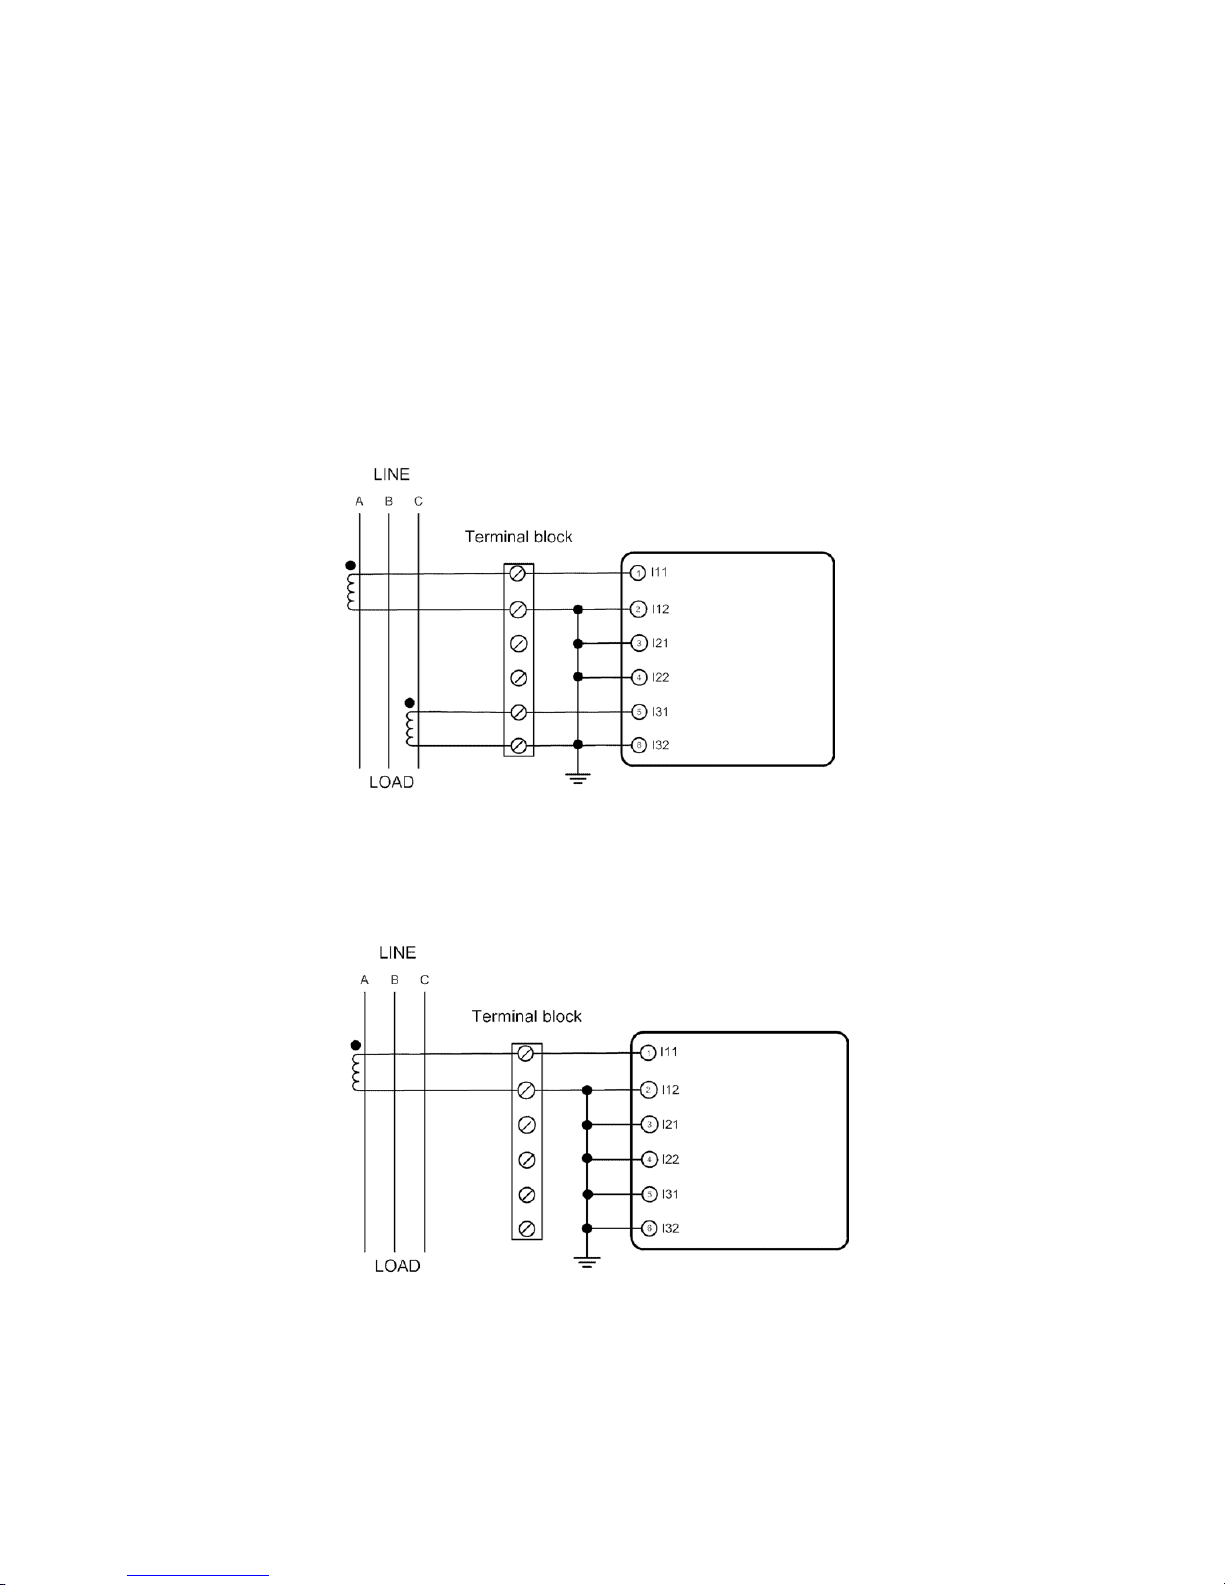
2CT
The difference in g. 2.16 and g. 2.15 is that there is not current input in
the I21 and I22 terminals. The I2 value is calculated from formula i1+i2+i3=0.
The current input mode of the DPMS XPQ should be set to 2CT for this current
input wiring mode.
Fig 2.16 2CT
1CT
If it is a three phase balanced system, a 1 CT connection method can be
used. The other two currents are calculated according to the balance supposing.
Fig 2.17 1CT
Page 27
25
POWER INSTRUMENTS
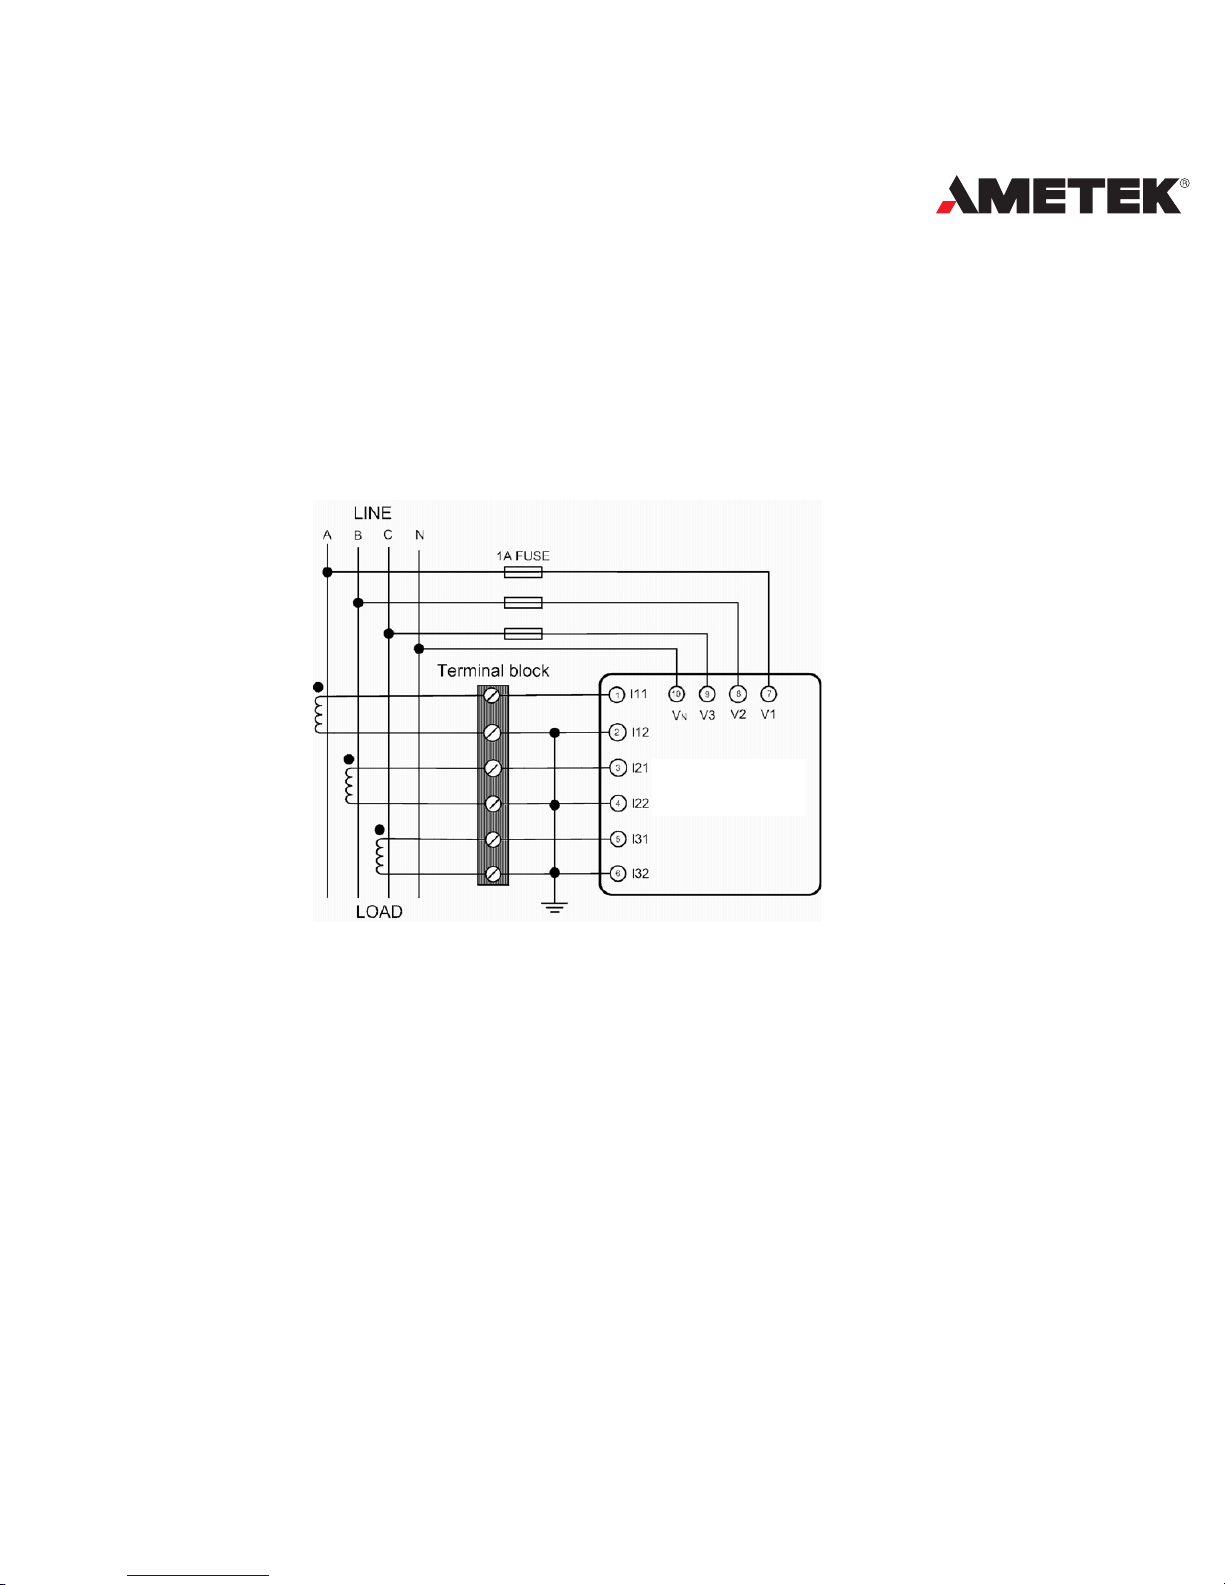
Frequently used wiring method
The voltage and current wiring method are put together in one drawing.
The DPMS XPQ meter will display normally only if the setting of the meter is
associated with the wiring of the voltage and current input.
1. 3LN, 3CT with 3 CTs
Fig 2.18 3LN, 3CT with 3CTs
Page 28

26
DPMS XPQ User Manual
2. 3LN, 3CT with 2 CTs
Fig 2.19 3LN, 3CT with 2 CTs
3. 2LN, 2CT
Fig 2.20 2LN, 2CT
Page 29
27
POWER INSTRUMENTS
4. 2LN, 1CT
Fig 2.21 2LN, 1CT
5. 2LL, 3CT
Fig 2.22 2LN, 3CT
Acuvim-X
Fig 2.21 2LN, 1CT
Page 30
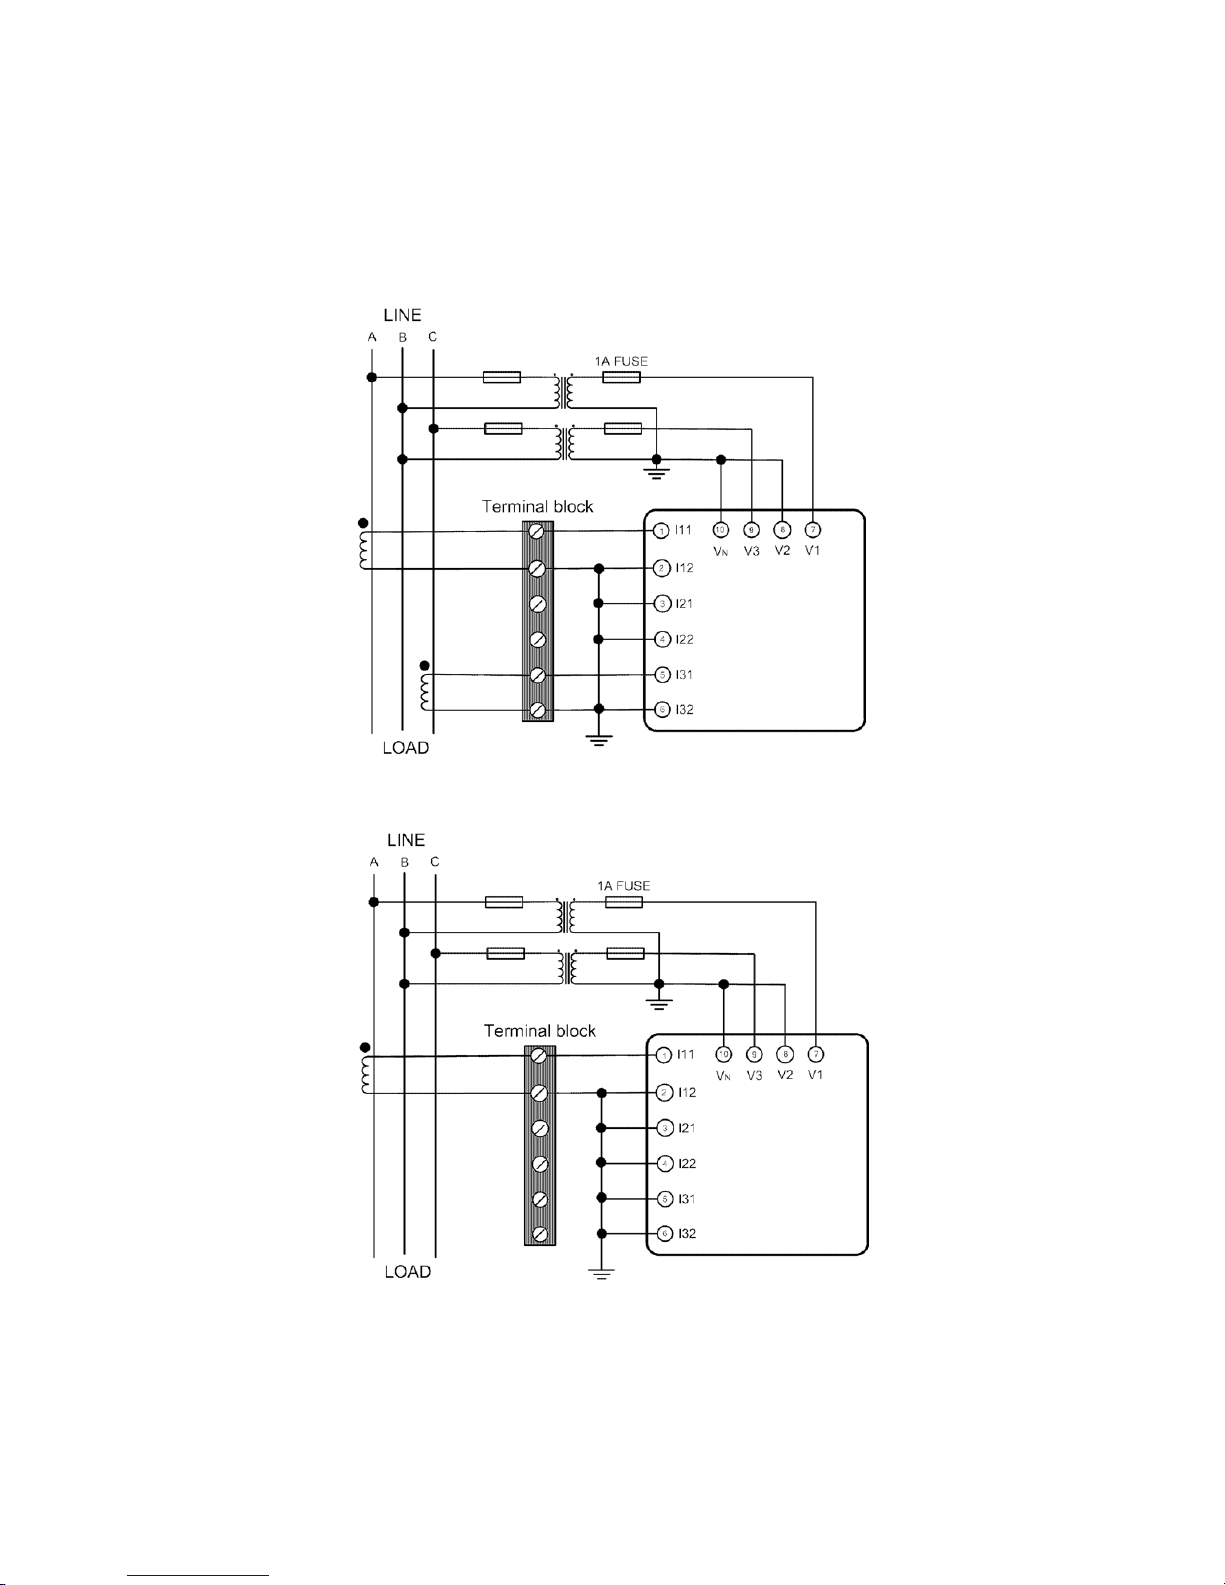
28
DPMS XPQ User Manual
6. 2LL, 2CT
Fig 2.23 2LL, 2CT
7. 2LL, 1CT
Fig 2.24 2LL, 1CT
Page 31
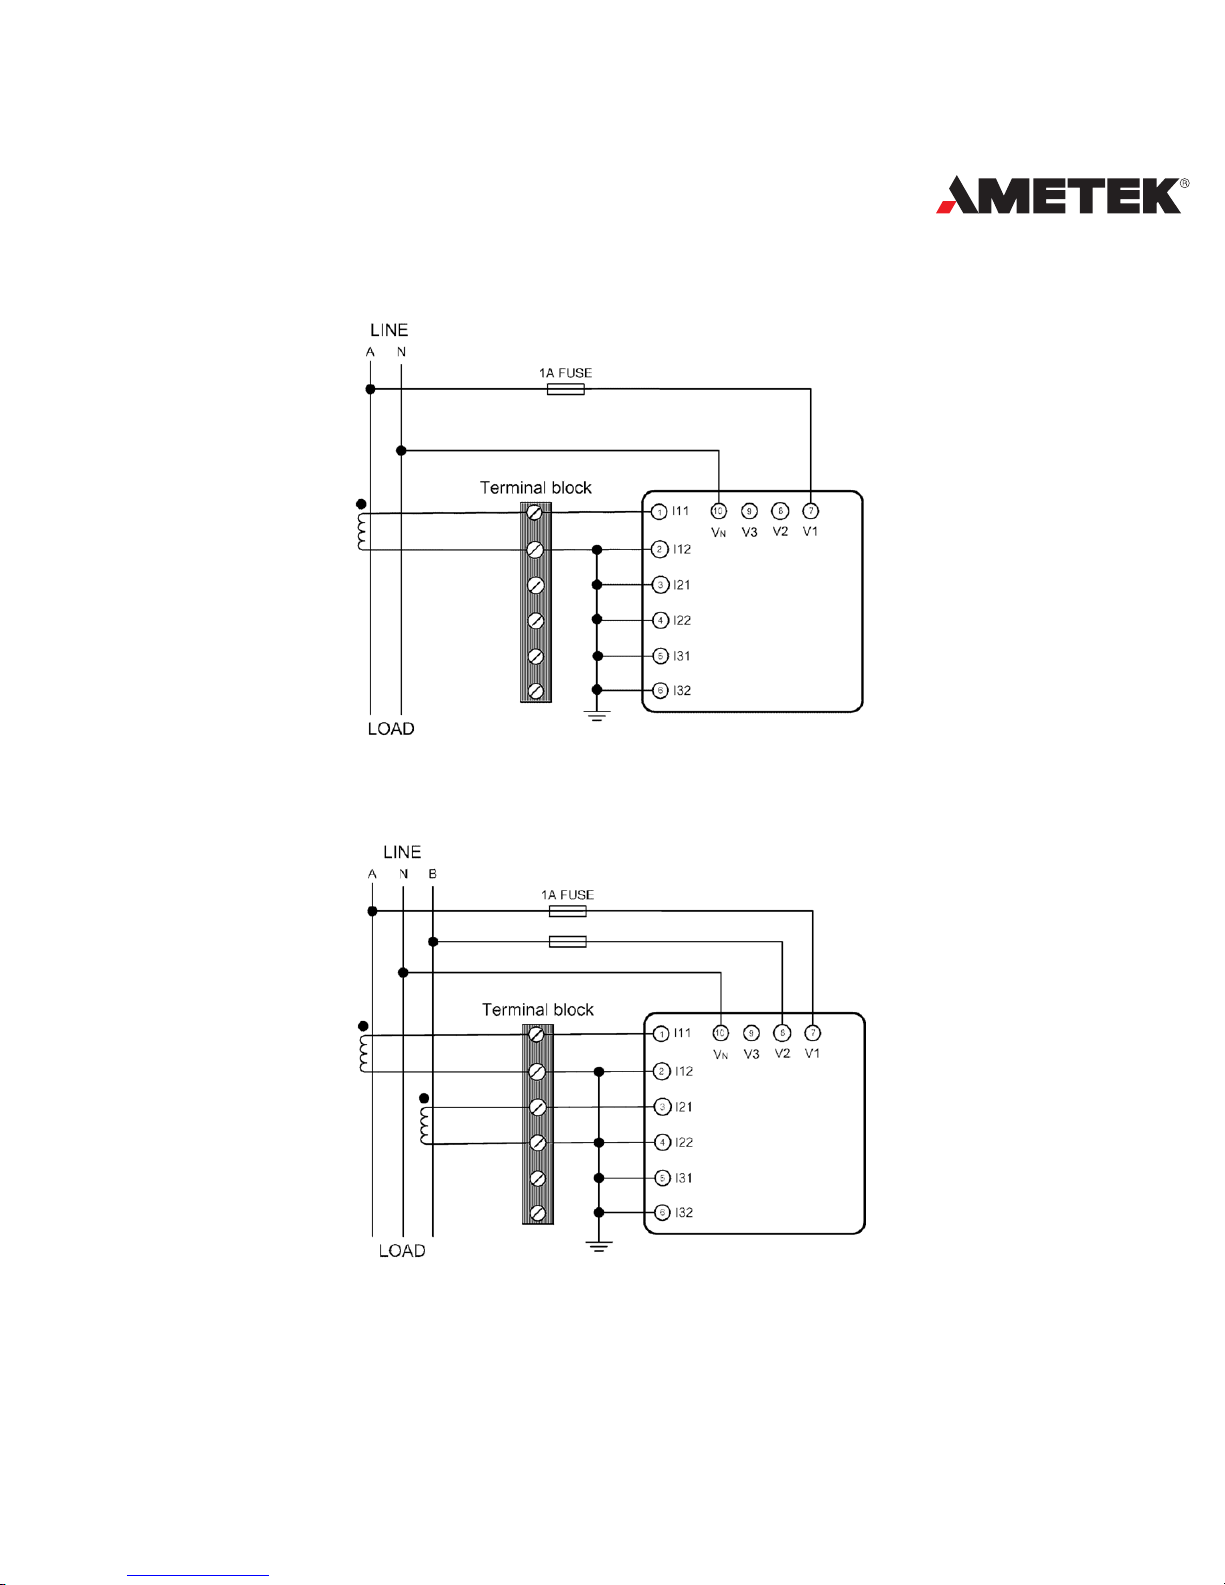
29
POWER INSTRUMENTS
8. Single Phase 2 Line (Wiring mode setting 3LN, 3CT)
Fig 2.25 Single Phase 2 Lines
9. Single Phase 3 Line (Wiring mode setting 3LN, 3CT)
Fig 2.26 Single Phase 3 Line
Page 32
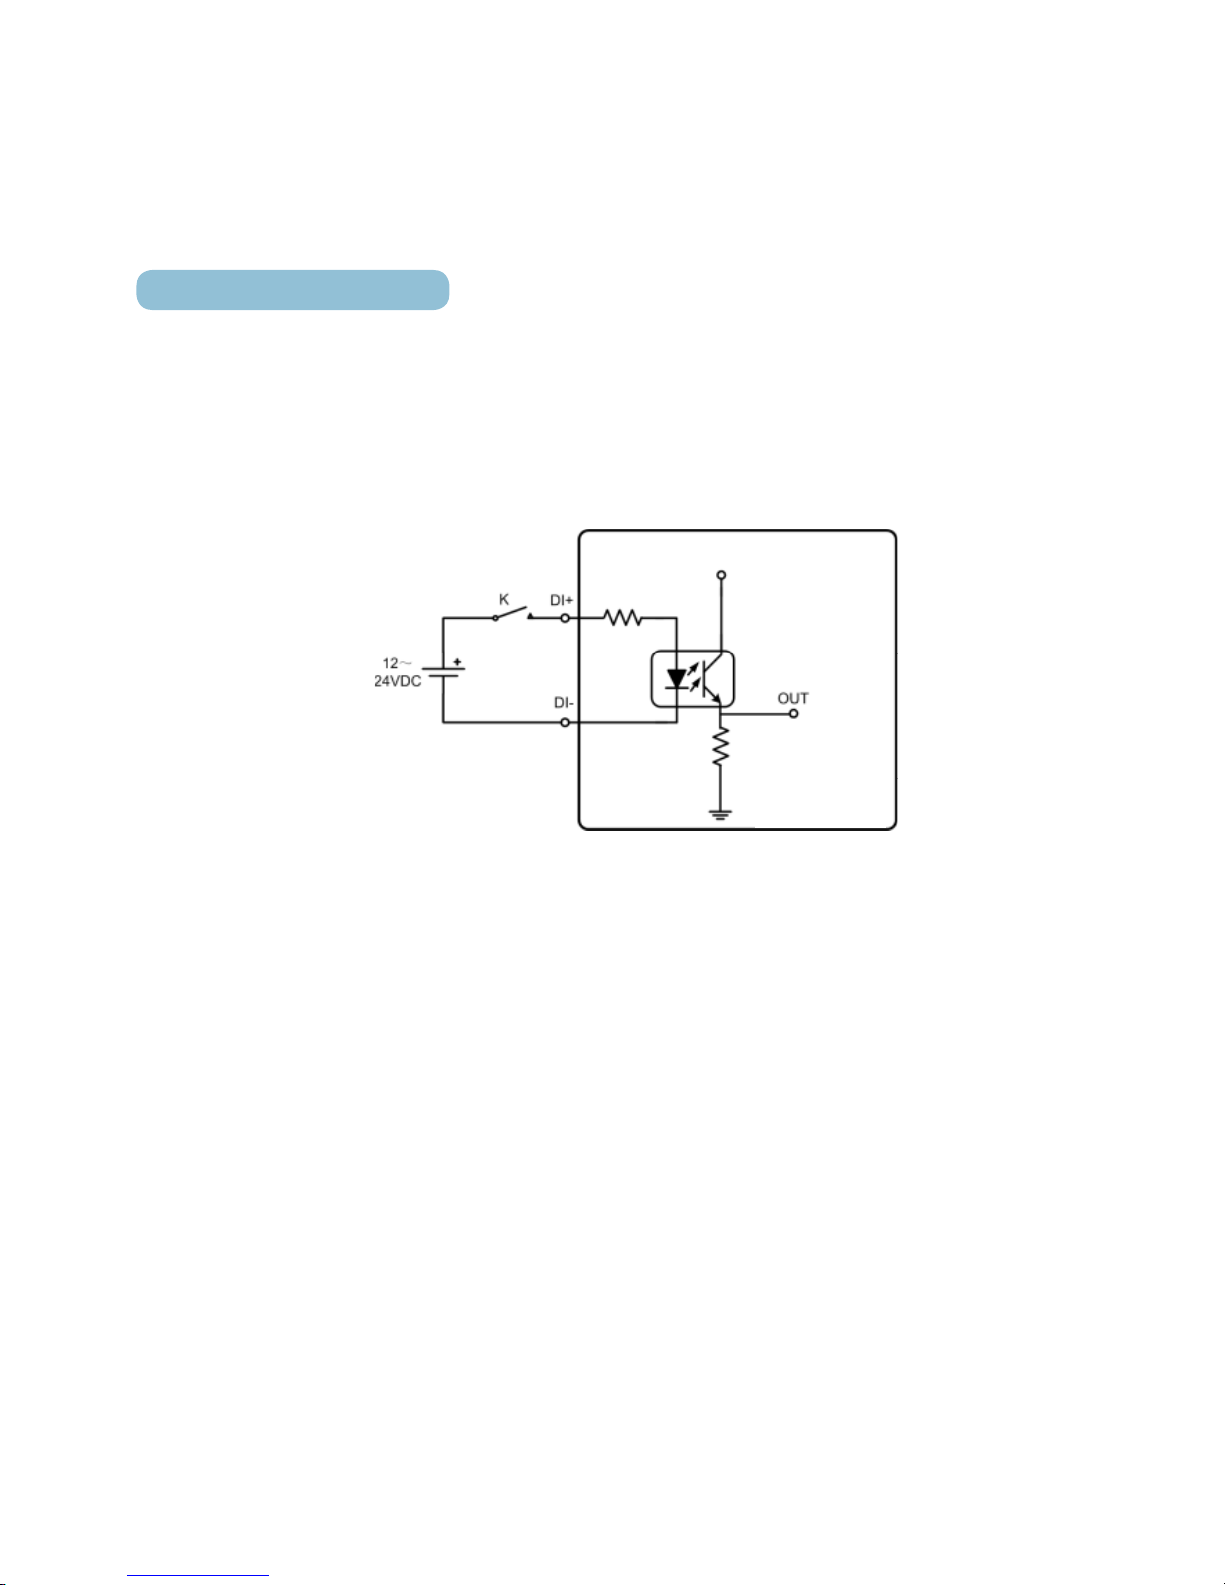
30
DPMS XPQ User Manual
Wiring of Digital Inputs
There are two digital inputs of wet contact in the standard DPMS XPQ. The
terminals of the two digital inputs are DI1+, DI1- (15, 16) and DI2+, DI2- (17,
18). Additional two digital inputs are optional. The terminals of the two additional
digital inputs are DI3+, DI3-(25, 26) and DI4+, DI4-(27, 28). The circuit drawing
of the digital input is simplied in g 2.27.
g 2.27 Digital Input Circult of the DPMS XPQ
The auxiliary power supply for the digital input is 12~24Vdc. If the
connection wire is too long, a relative higher voltage should be adopted. The
current in the loop line should be 10mA~15mA, and the Max current is 30mA.
A DI auxiliary power supply (optional) is provided for the convenience of
eld use. The voltage of the DI auxiliary power supply is 15Vdc (1W). The wiring
terminals are V+ and V- (29, 30). This power supply can not be used for any
other purpose.
The 4 DIs with the auxiliary power supply is in g 2.28. The wire for digital
input should be between AWG22 (0.5mm2)~ AWG16 (1.3mm2).
Acuvim-X
Optical
Isolator
Page 33
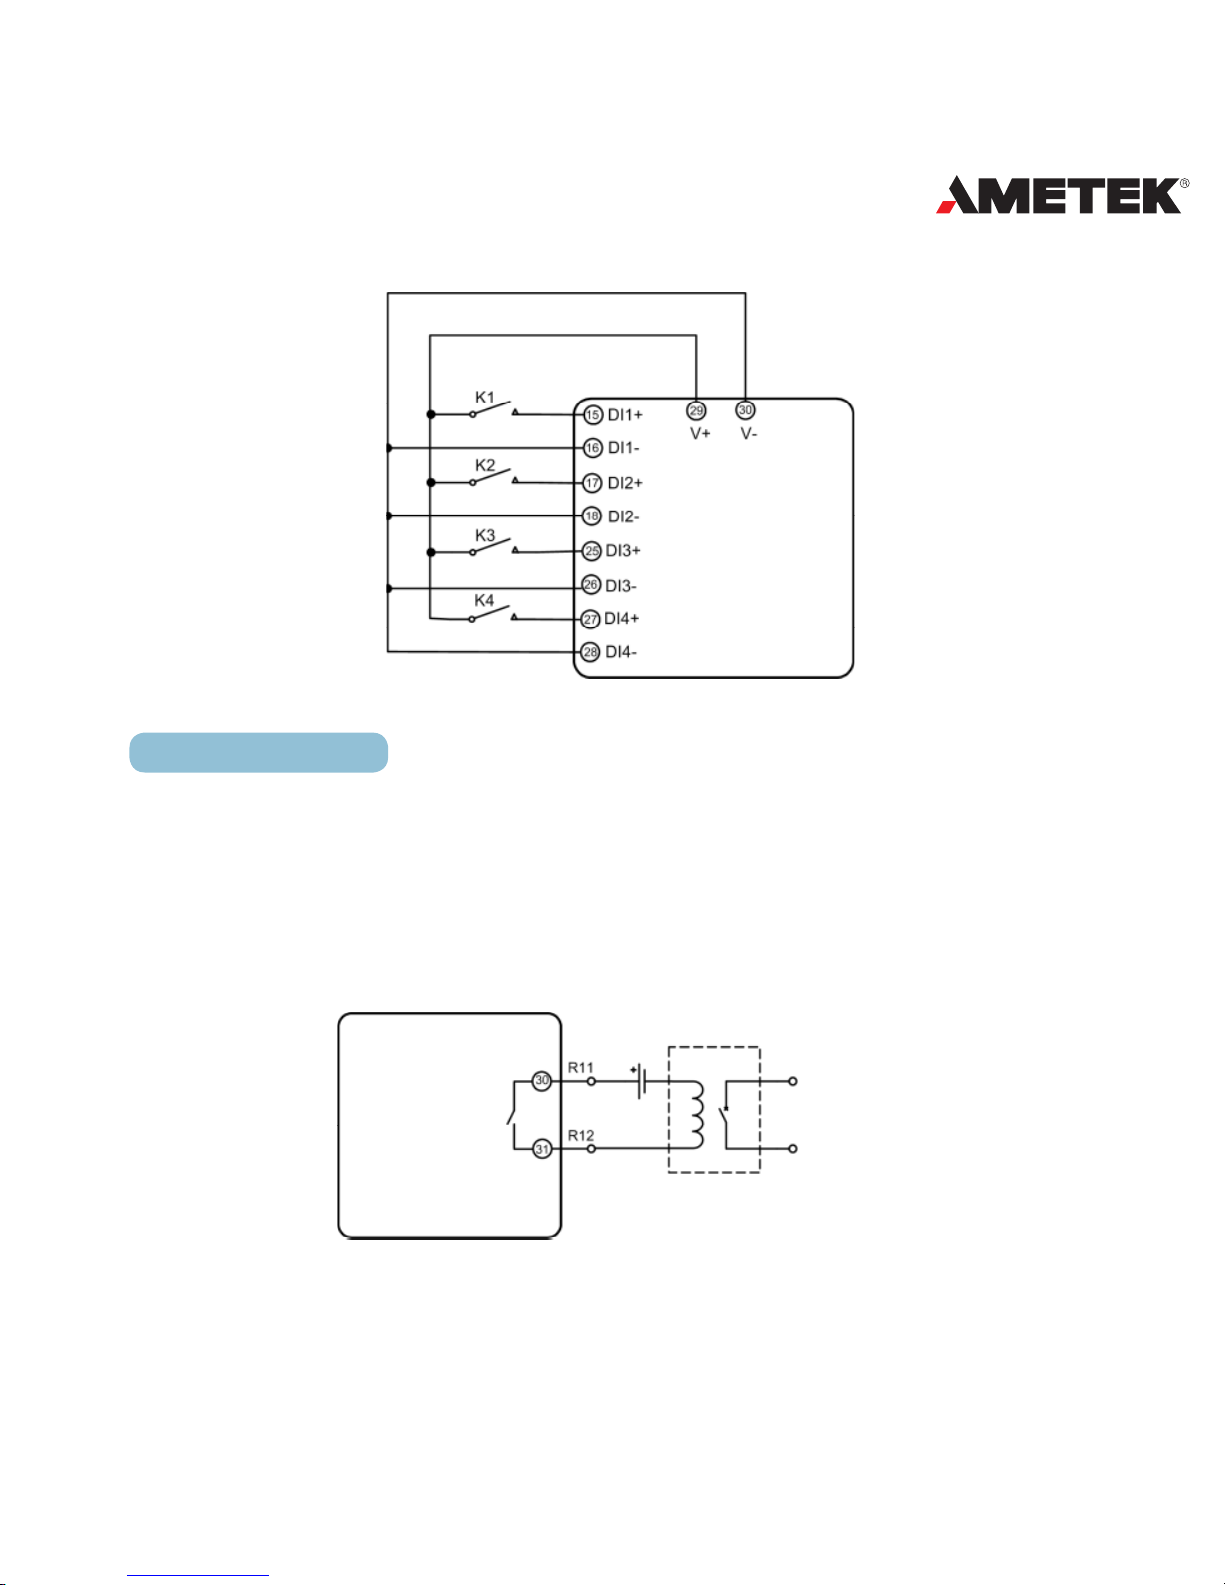
31
POWER INSTRUMENTS
Fig 2.28 Digital Input with Auxiliary Power
Relay Output (RO)
There are two additional relay output options for the DPMS XPQ. The
terminals are R11, R12 (31, 32) and R21, R22 (33, 34). These two relay outputs
are used for remote control electric switches in the power system.
The relay type is mechanical Form A contact with 3A/250Vac or 3A/30Vdc.
A mediate relay is recommended in the output circuit shown in g 2.29.
Fig 2.29 Relay output
Acuvim-X
Mediate Rel ay
Contr ol
output
Power
Supply
Acuvim-X
Page 34
32
DPMS XPQ User Manual
There are two mode selections for relay output, one is latching, and the
other is momentary. For the latching mode, the relay can be used to output two
states, on or off. For the momentary mode, the output of the relay changes from
off to on for a period of time Ton and then goes off. Ton can be set from 50-
3000ms.
The wire for relay output should be between AWG22 (0.5mm2)~AWG16
(1.3mm2).
Digital Output (DO)
There are two digital outputs as an option. The terminals of the digital
output are DO1+, DO1-(35, 36) and DO2+, DO2-(37, 38). These two digital
outputs can be used as an energy pulse output or over limit alarming output.
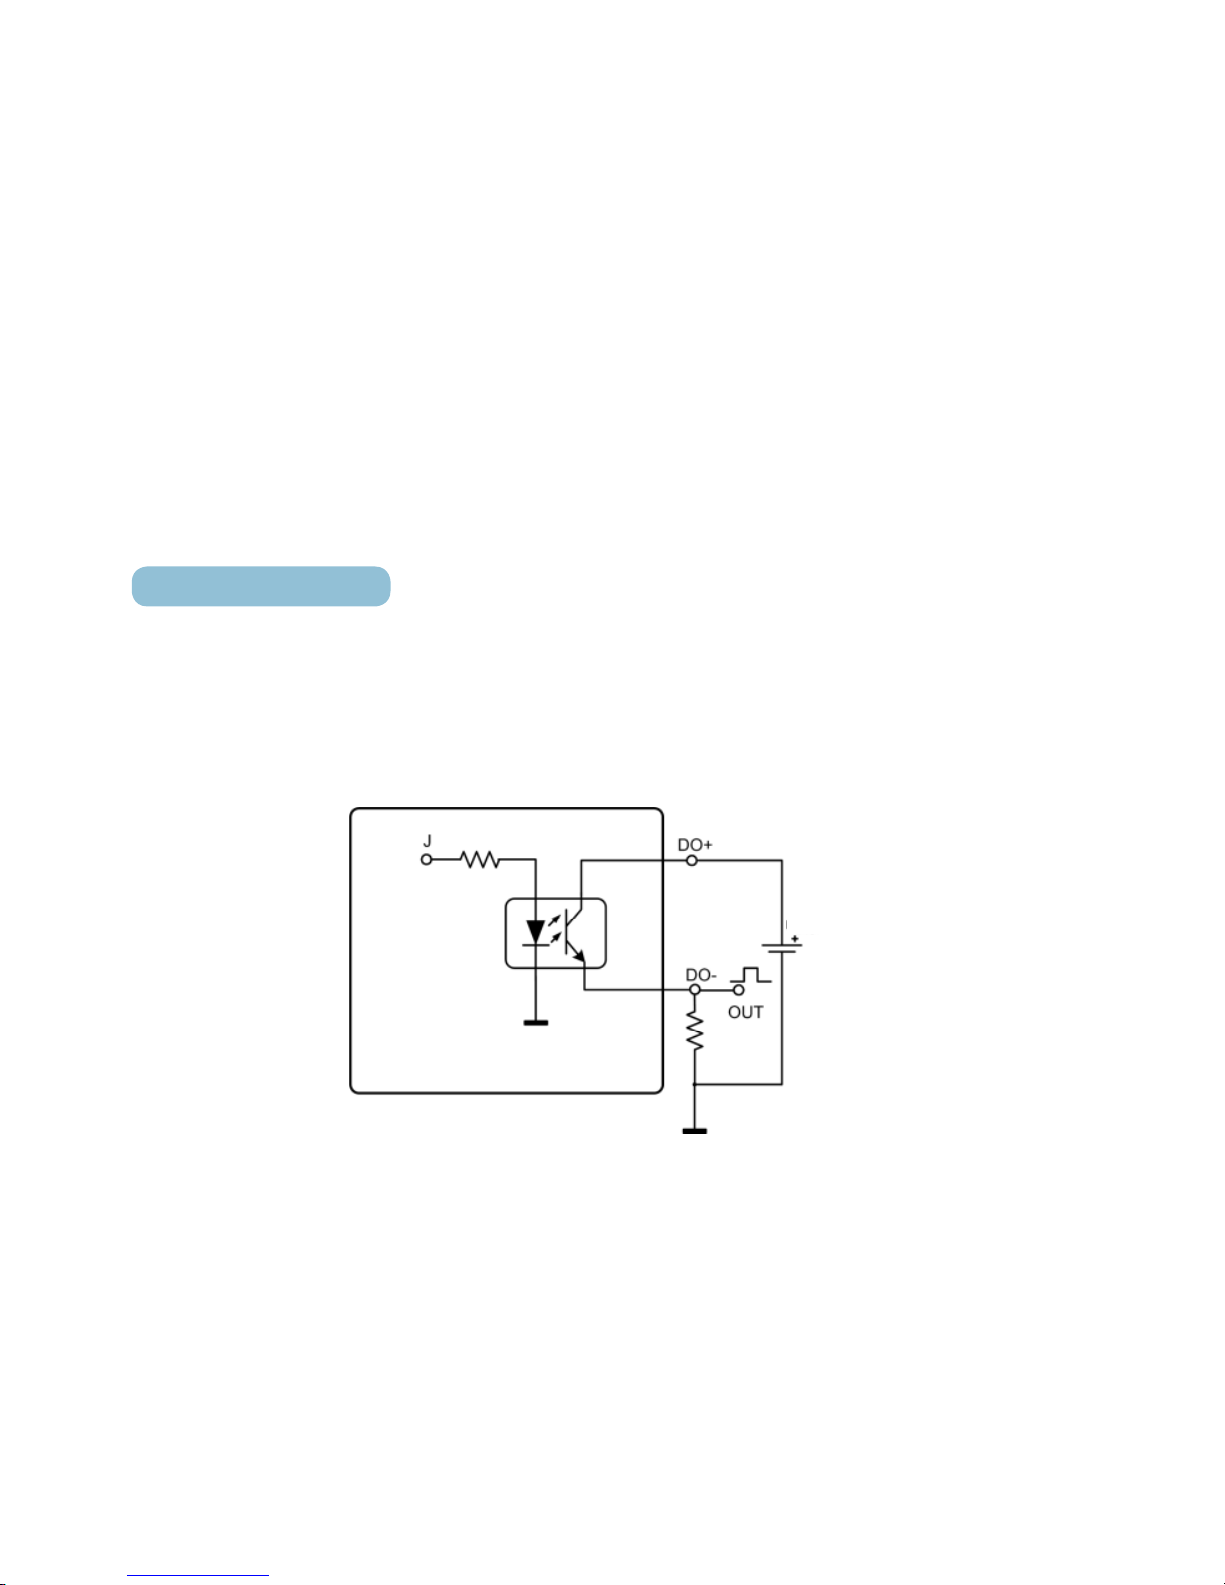
The digital output circuit form is Photo-MOS. The simplied circuit is in g 2.30.
Fig 2.30 Digital output Circuit
The Max output voltage and current are 100V and 50mA.
When the digital output is used as pulse output, DO1 and DO2 can be
Power
Supply
Acuvim-X
Photo -Mos
Page 35
33
POWER INSTRUMENTS
programmed as energy pulse output. For example, DO1 is used as energy
pulse output and DO2 is used as reactive energy pulse output. The pulse width
and pulse constant can be set.
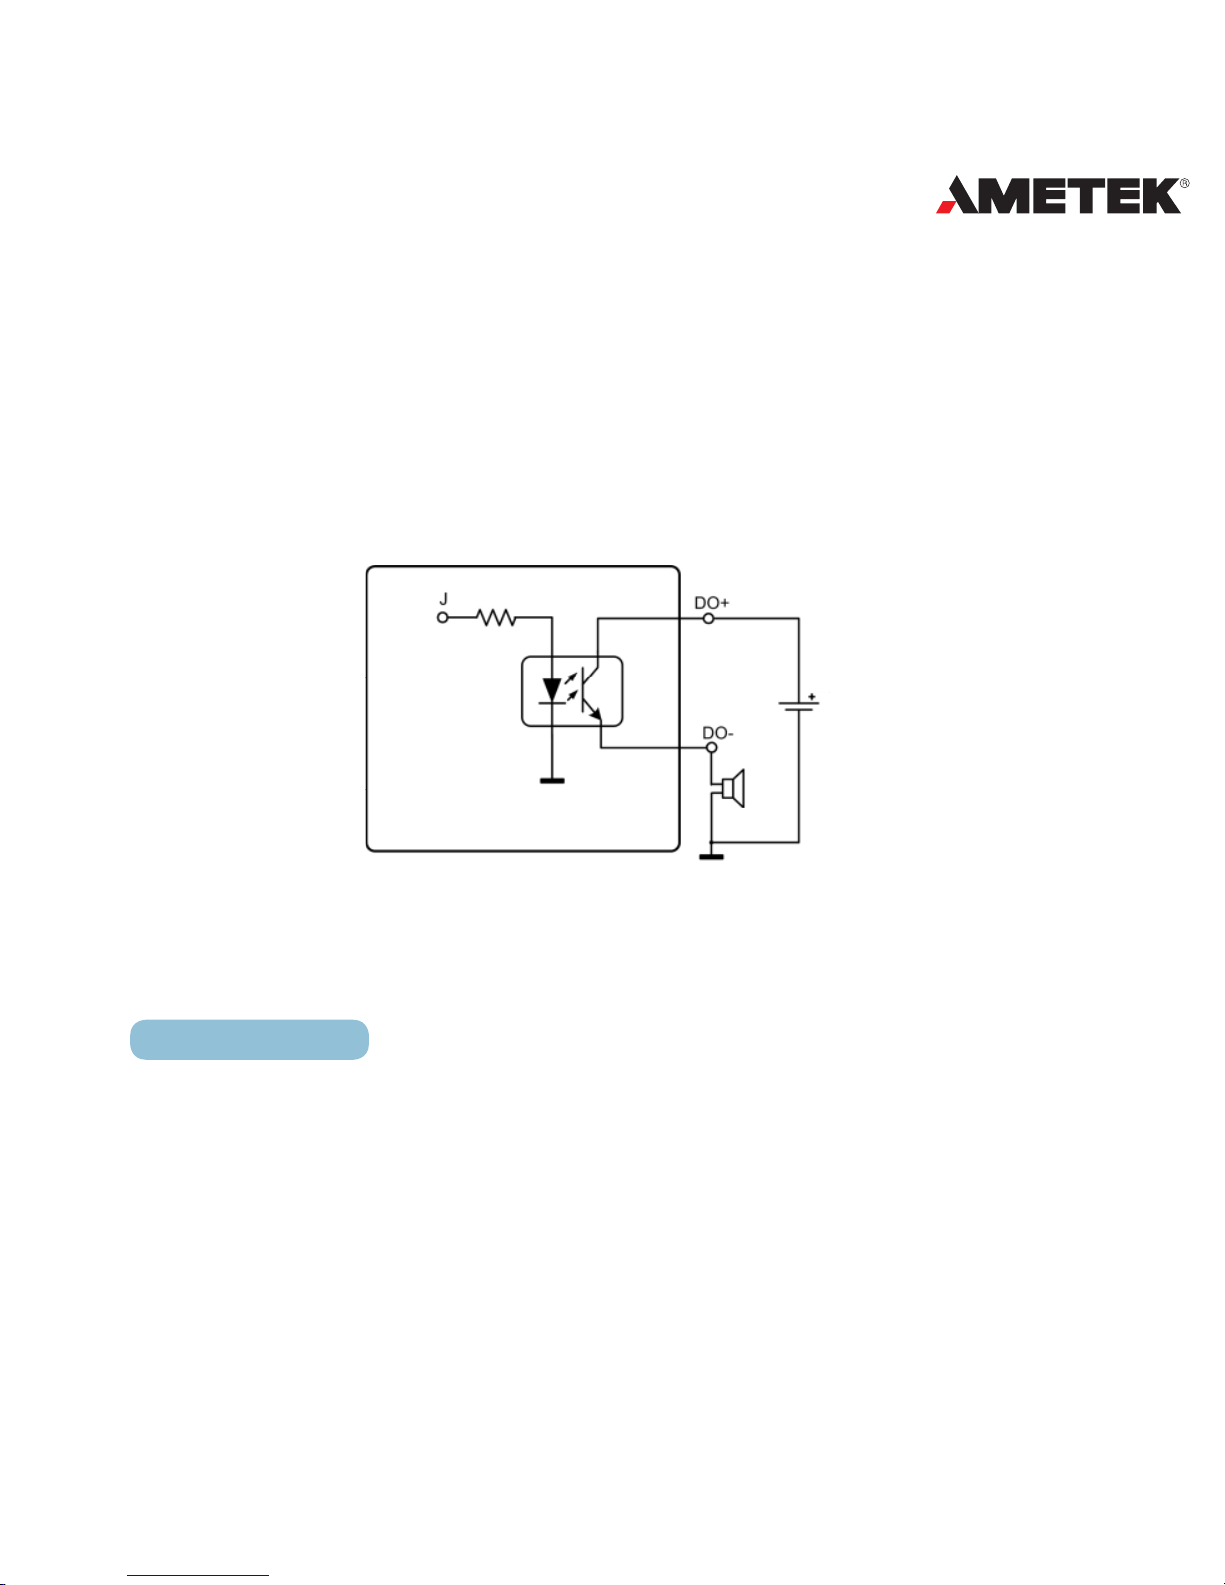
When the digital output is used as an over limit alarm output, the upper and
lower limit of the parameter, time interval and output port can be set. A drawing
of the alarming output with beeper is in g 2.31.
g 2.31 Do Alarming Circult
The wire for digital output should be between AWG22 (0.5mm2) ~AWG16
(1.3mm2).
Communication
The communication port and protocol of the DPMS XPQ are RS485 and
Modbus-RTU. The communication terminals are A, B, and S (11, 12, 13). A is
differential signal +, B is differential signal - and S is connected to the shield of
the twisted pair cable. Up to 32 devices can be connected on an RS485 bus.
Use good quality shielded twisted pair cable, AWG22 (0.5mm2) or larger. The
Power
Supply
Photo -Mos
Acuvim -X
Beeper
Page 36
34
DPMS XPQ User Manual
overall length of the RS485 cable connecting all devices can not exceed 1200m
(4000ft). The DPMS XPQ is used as a slave device of a master like a PC, PLC,
data collector or RTU.
If the master does not have an RS485 communication port, a converter has
to be used. Normally a RS232/RS485 or USB/RS485 is adopted. The topology
of RS485 net can be line, circle and star.
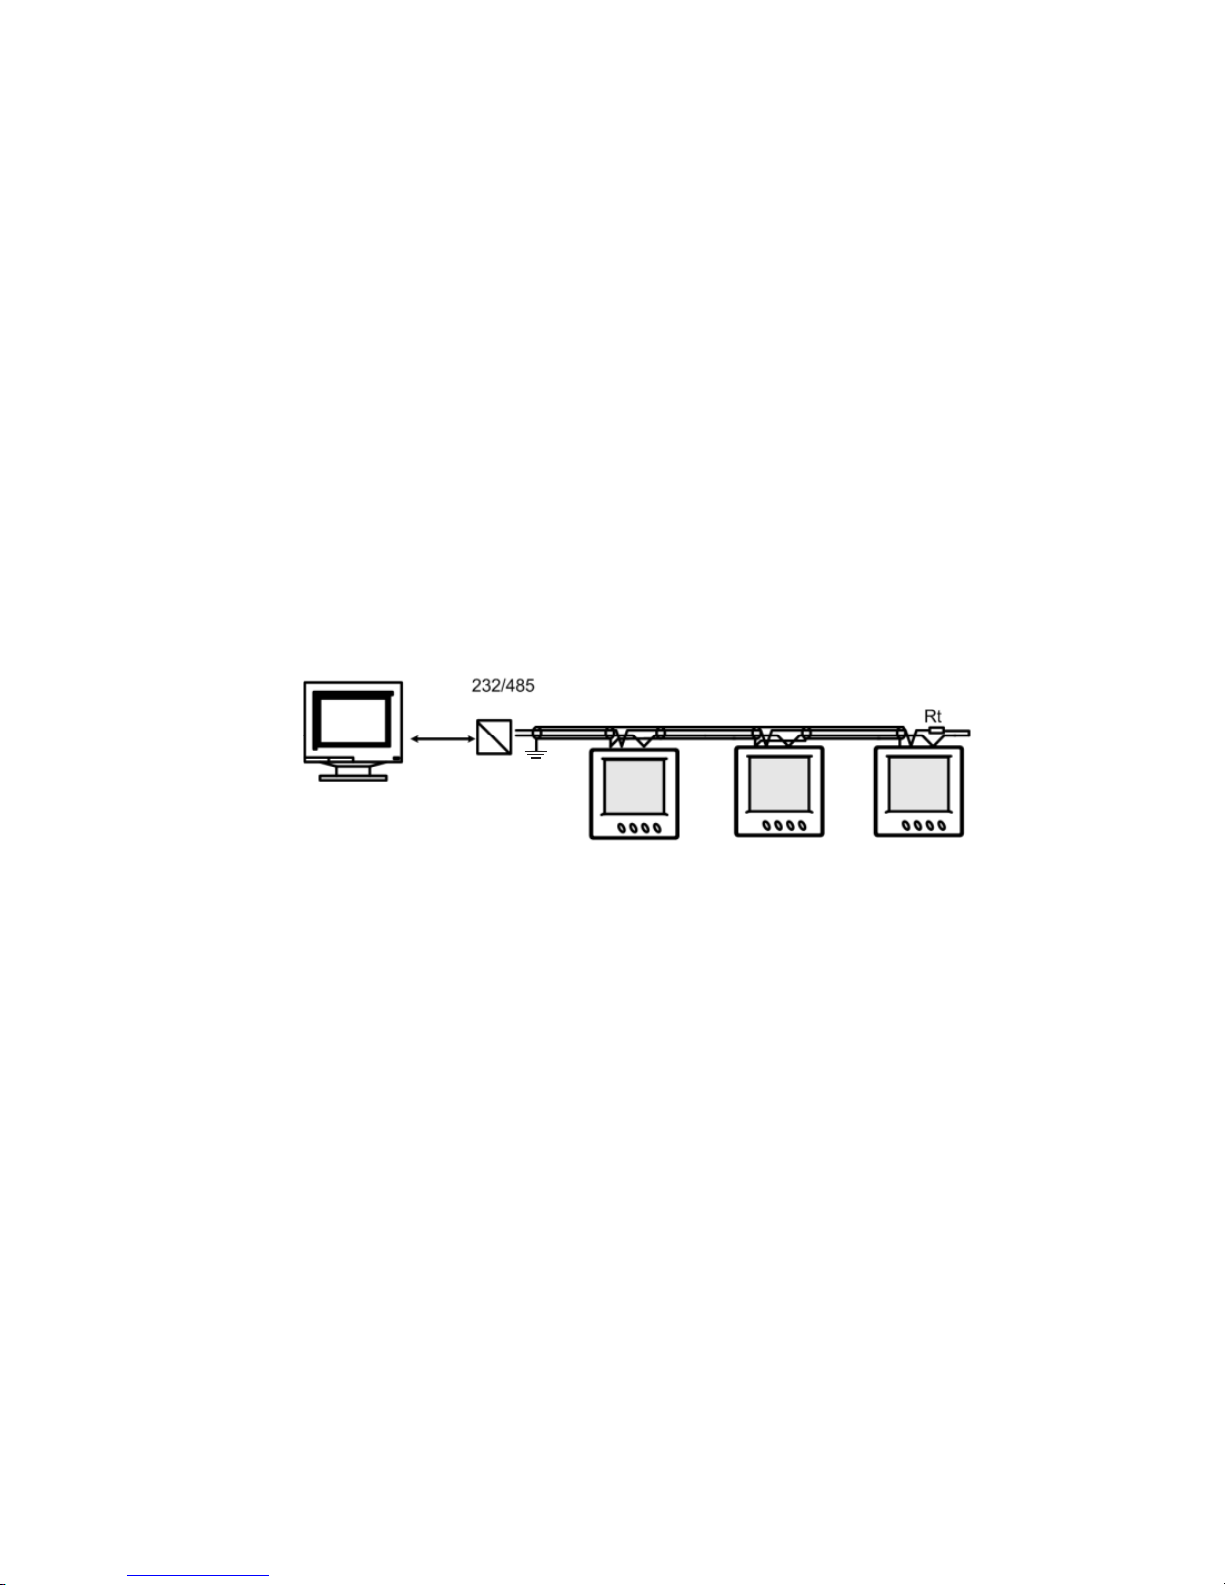
1. Line
The connection from master to meter is one by one in the RS485 net as in
g 2.32.
g 2.31 Line Mode
In g 2.32 the Rt is an anti-signal reecting resistor 120-300 ohm/0.25W.
Normally, it is added to the end of the circuit beside the last meter, if the
communication quality is not good.
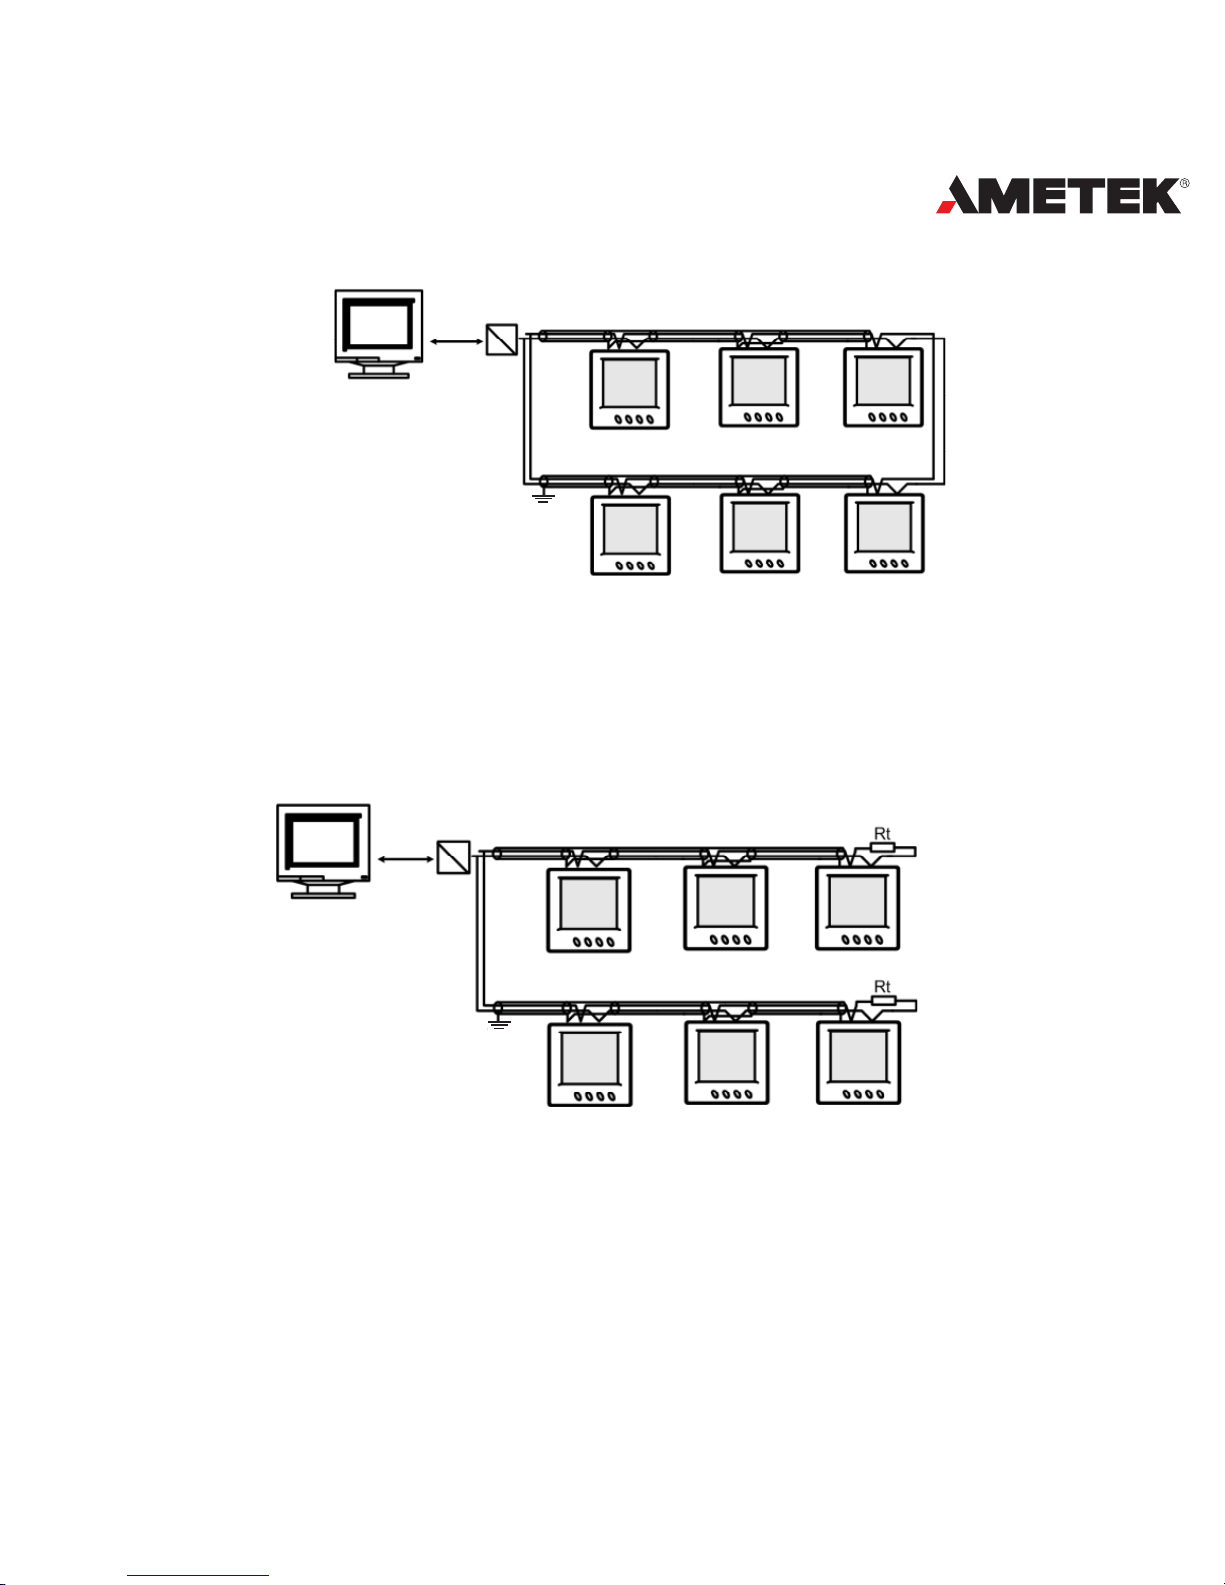
2. Circle
Meters are connected in a closed circle for the purpose of high reliability.
There is no need for anti-signal reecting resistors.
Converter
Acuvim-X Acuvim-X Acuvim -X
Master
PC
Page 37
35
POWER INSTRUMENTS
g 2.31 Circle Mode
3. Star
The connection for RS485 net is in Wye mode. An anti-signal reflecting
resistor may be needed in each line.
g 2.31 Star Mode
Master
PC
232 /485
Converter
Acuvim-X Acuvim-X Acuvim-X
Acuvim-X
Acuvim-X Acuvim-X
Master
PC
232 /485
Converter
Acuvim-X Acuvim-X Acuvim-X
Acuvim-X
Acuvim-X Acuvim-X
Page 38

36
DPMS XPQ User Manual
Recommendations for high quality communication:
Good quality shielded twisted pair of AWG22 (0.6mm2) or larger is very
important.
The shield of each segment of the RS485 cable must be connected to
the ground at one end only.
Keep communication cables as far away as possible from sources of
electrical noise.
Use an RS232/RS485 or USB/RS485 converter with optical isolated
output and surge protection.
Page 39

Chapter 3 Meter Operation and
Parameter Setting
Display Panel and Keys
Metering Data Reading
Statistics Display
Meter Parameter Setting
Energy Parameter Setting
Voltage Eligibility Parameter Setting
37
Page 40
38
DPMS XPQ User Manual
Detailed human-machine interface of the meter will be described in this
chapter. It includes how to get the metering data and how to do the parameter
setting. This chapter is based on the DPMS XPQ-G, but other patterns can be
operated the same way.
Display Panel and Key
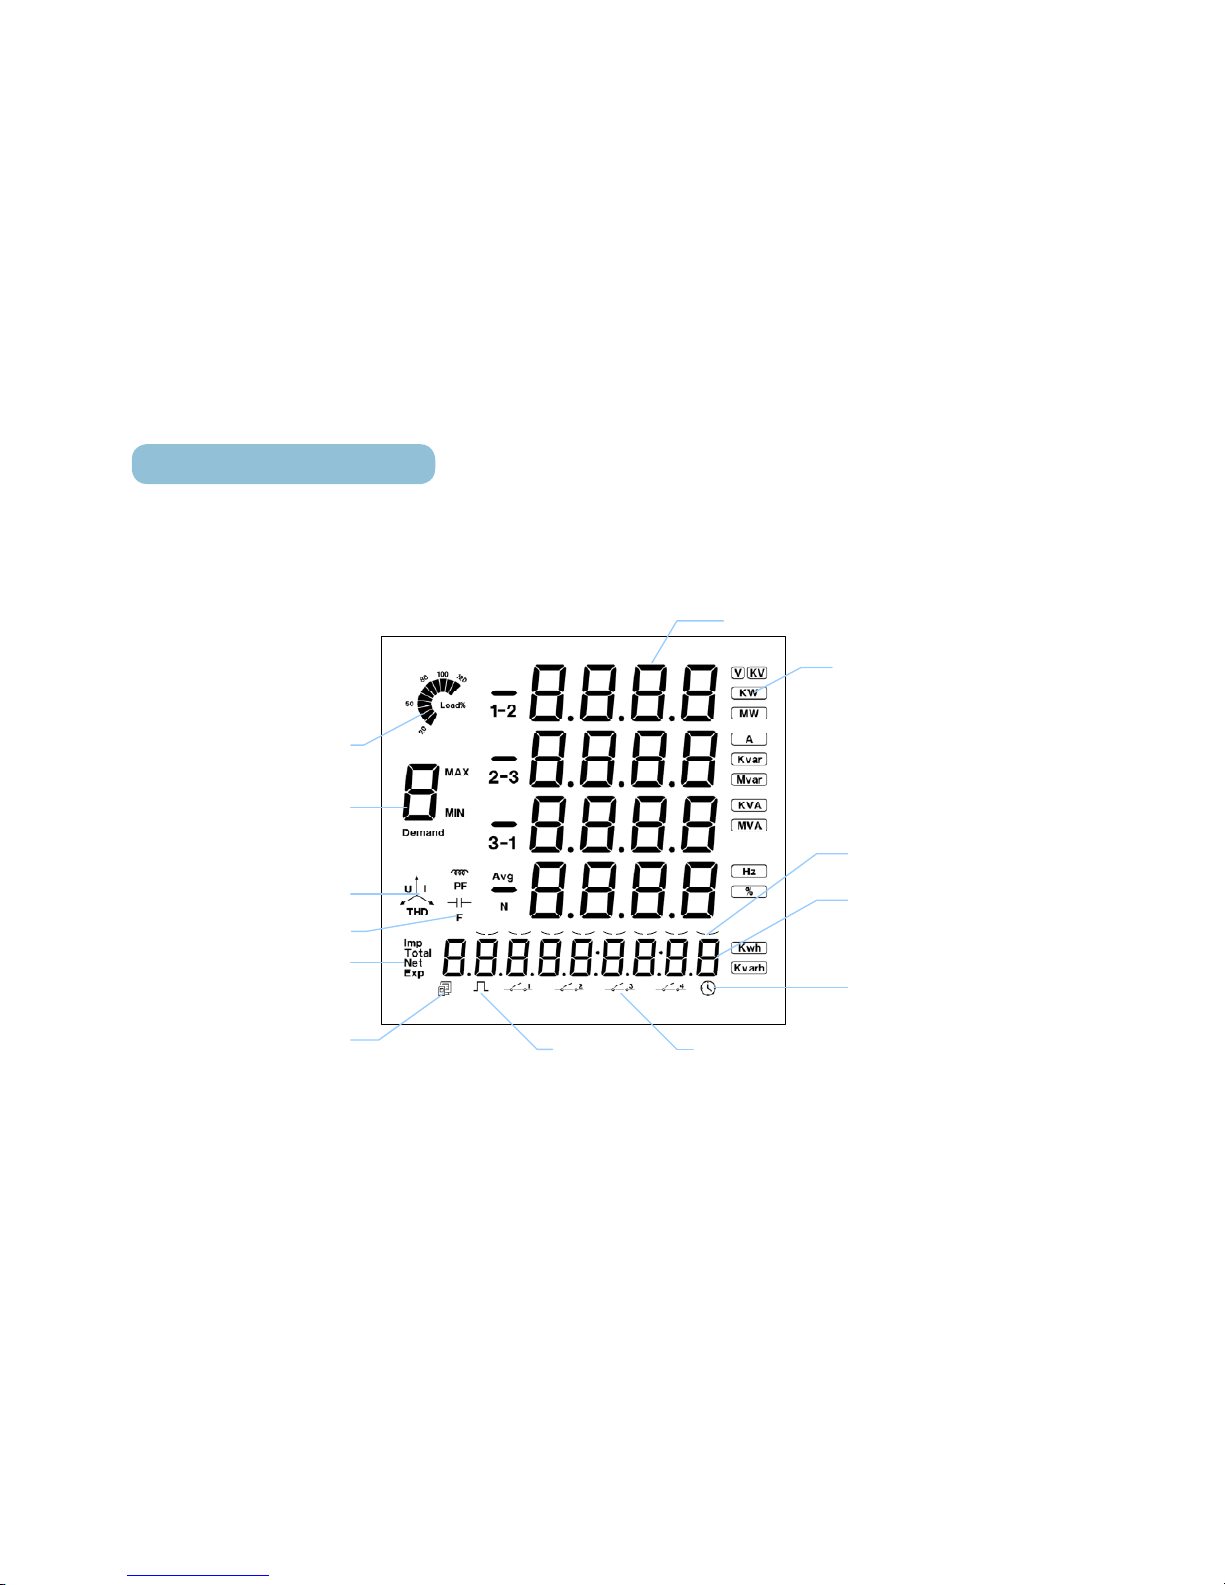
There is one display panel and four keys in the front of meter. All the
display segments are illustrated in g 3.1.
g 3.1 All display segments
4 5 6 7 81 2 3
1
13
7
2
12
1110
9
8
6
5
4
3
Fig 3.1 All Display Segments
Page 41
39
POWER INSTRUMENTS
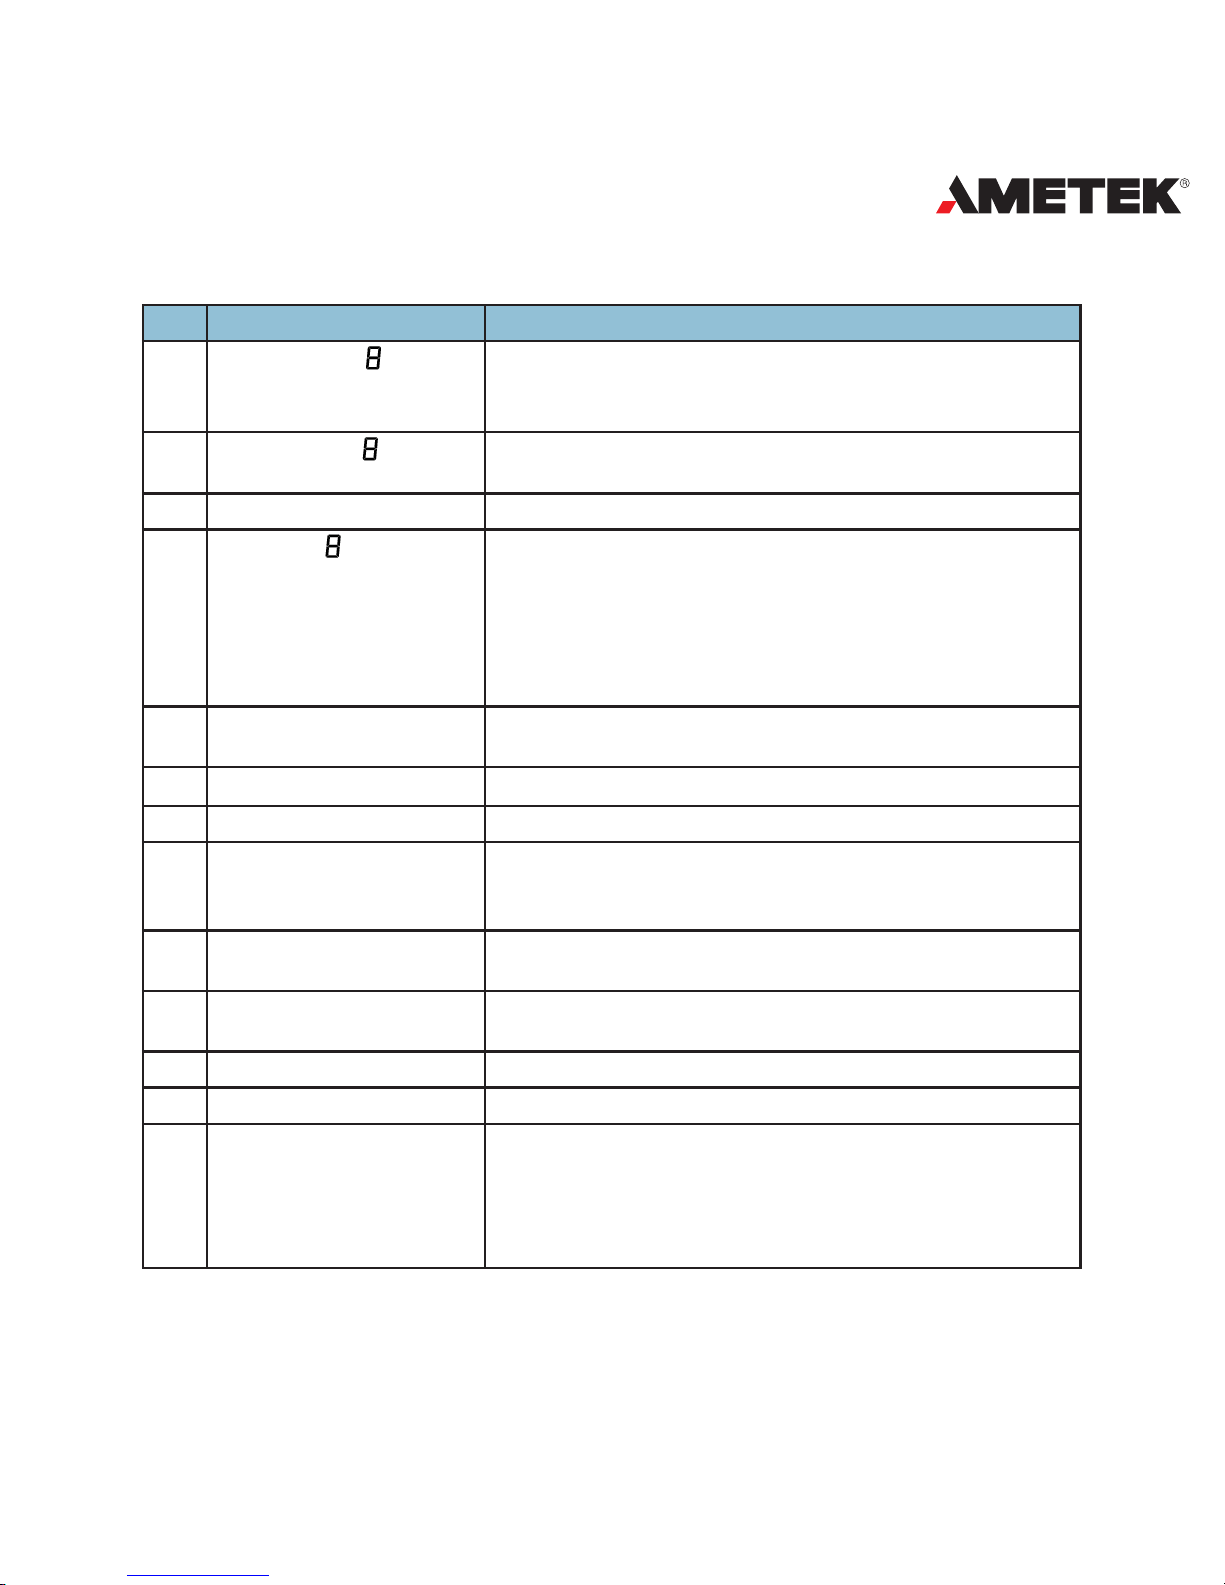
Table 3.1 Display Panel description
SN Display Description
1
Four lines of letter in
the
metering area
Display metering data: Voltage, Current, Power, Power
factor, Frequency, THD, Demand, Unbalance factor,
Max/Min Value etc.
2
One line of letter in
the energy display area
Energy data display or real time clock
3
Load rate Display load current to rating current percentage
4
Item label letter,
MAX, MIN, Demand,
PF and F
Item label:
U: voltage, I: current, P: power, q: reactive power, S:
apparent power, PF: power factor, F: frequency, MAX:
Maximum value, MIN: Minimum Value, Demand:Demand
value, Avg: average value, I with N: neutral current, PF, F,
Avg and N indicate the data in the fourth line.
5
Three phase
unbalance label
With letter U: Voltage unbalance factor
With letter I: Current unbalance factor
6
Load characteristic Capacitor label: capacitive load; Inductor: inductive load
7
TOU indicator 1, 2, 3, 4 stands for sharp, peak, normal and valley
8
Energy label imp: consumption energy; exp: generating energy;
total: absolute sum of imp and exp energy;
net: algebraic sum
9
Communication indicator No label: no communication; One label: inquiry
Two labels: inquiry and answer
10
Energy pulse
output indicator
No label: no pulse output;
With label: pulse output
11
Digital input indicator Switch 1 to 4 indicate DI1 to DI4
12
Time label Time display in energy area
13
Unit Indicate data unit
Voltage: V, kV, Current: A, Power: kW and MW, Reactive
Power: kVar and MVar, Apparent Power: kVA and MVA,
Frequency: Hz, Energy: kWh, Reactive Power: kVARh,
Percentage: %
Page 42
40
DPMS XPQ User Manual
There are four keys on the front panel, labeled as H, P, E and V/A from left
to right. Use these four keys to read metering data and set the parameters.
Metering Data Reading
Normally, it displays the metering data, such as voltage, current, power etc.
There are several key patterns: press H, P, E, V/A and press key P and key V/A
simultaneously.
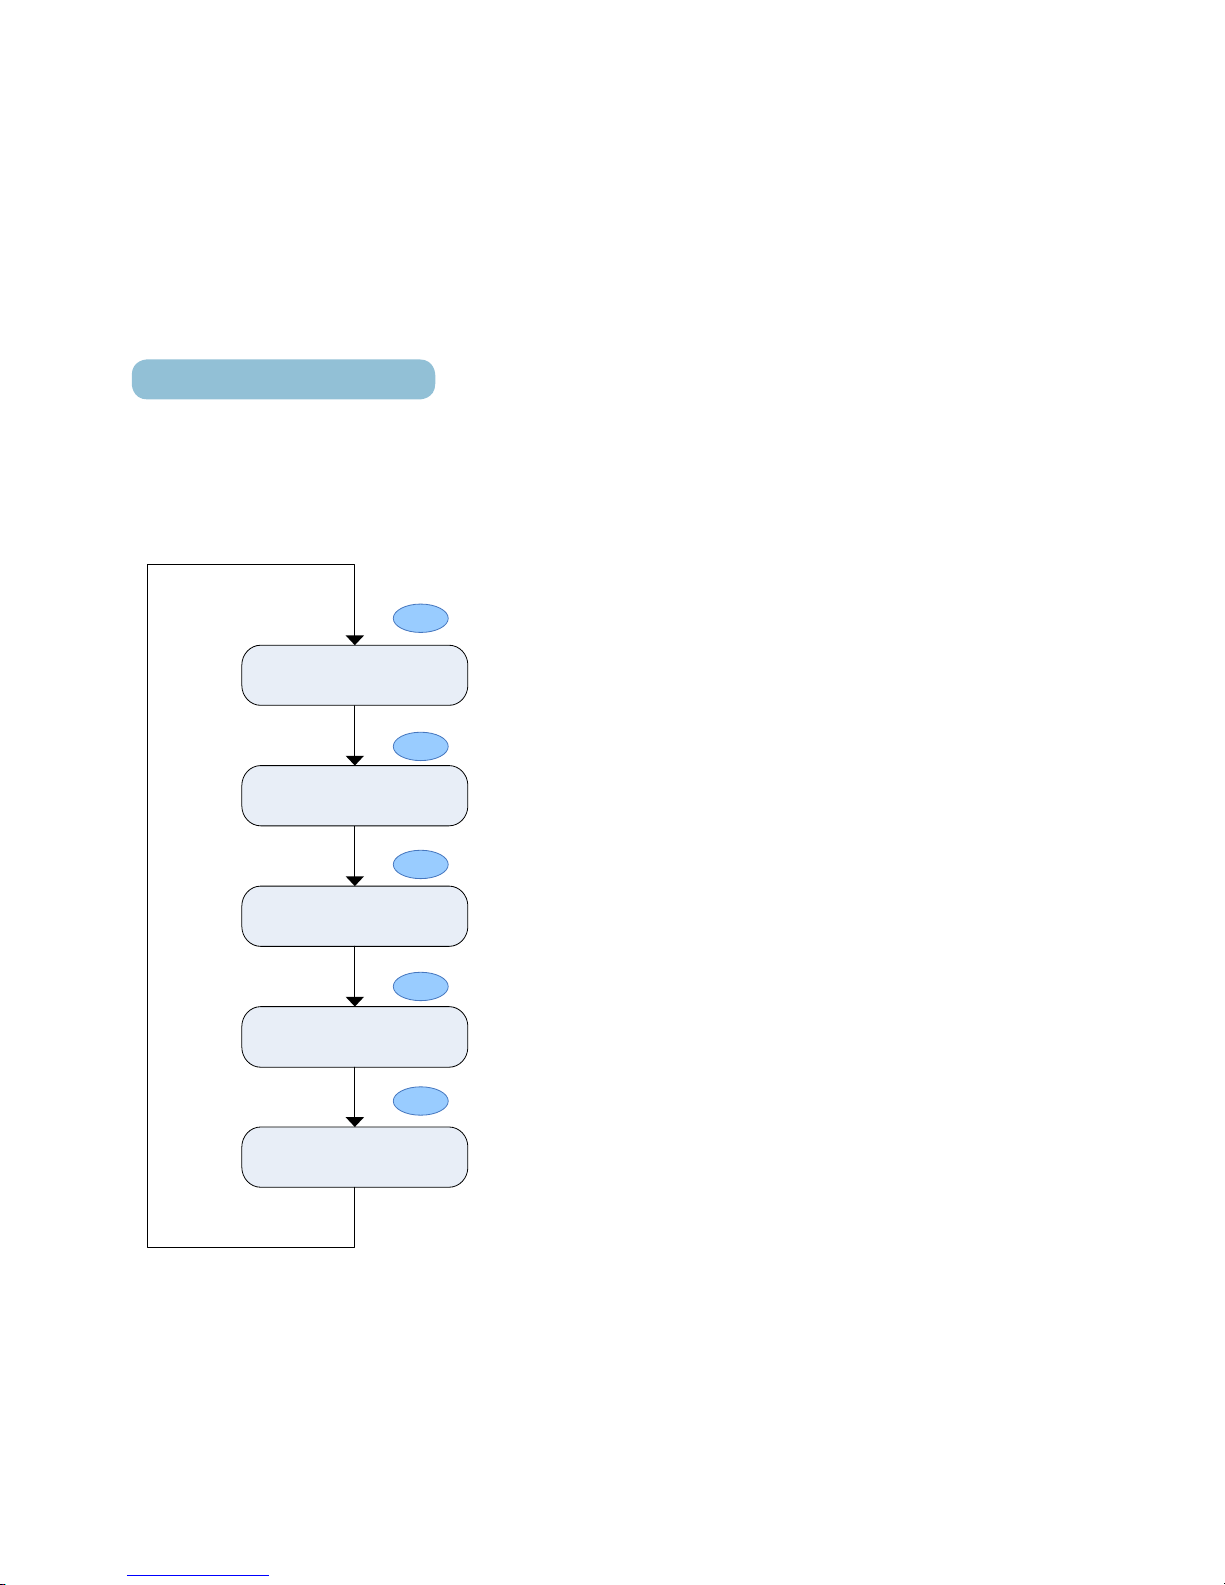
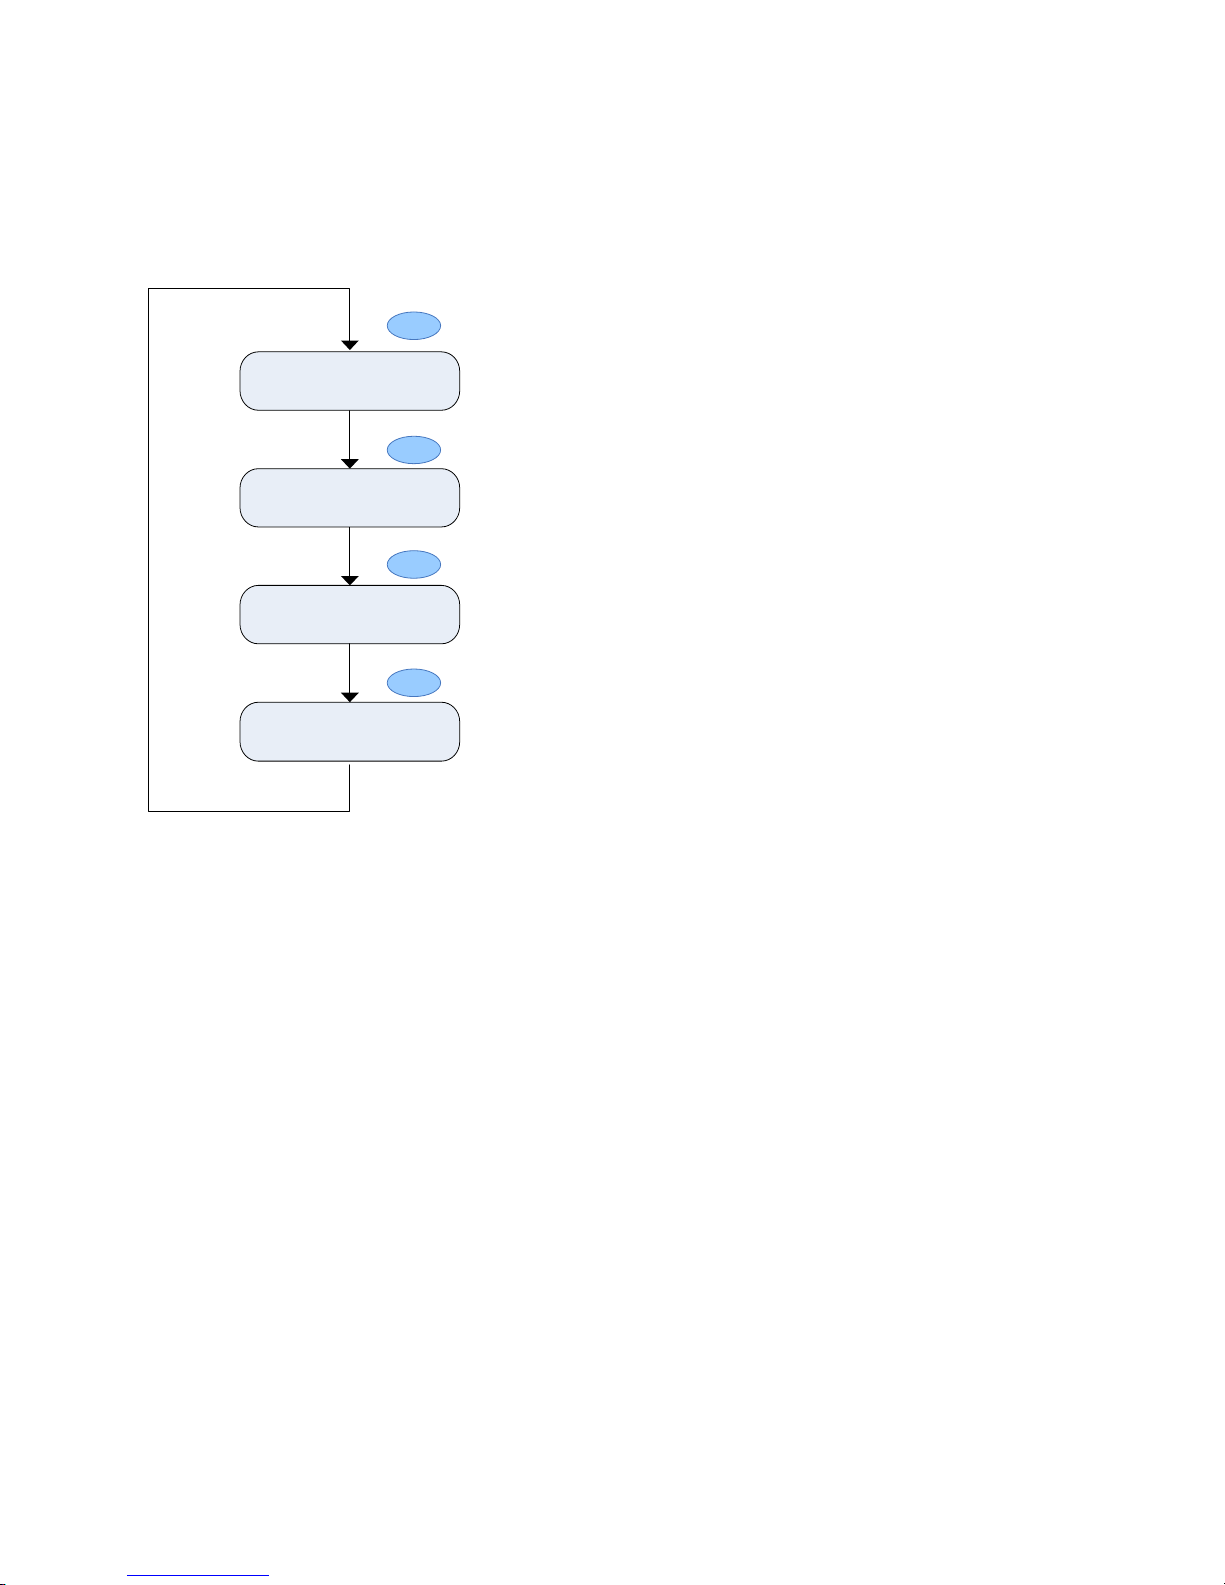
Press V/A to read voltage and current in the
metering area. The screen will roll to the next
display as you press V/A each time. It will go
back to the first screen if you press V/A at the
last screen.
Table on the left shows you how it scrolls:
Note: When the meter is set to “2LL”, there
is no phase voltage and neutral current display.
So only the third, fourth and fth screens will be
displayed.
Line
Voltage & avg
Curr ent & avg
Three phase C ur rent
demand
Three phase
Voltage & avg
Three phase
Curr ent & avg
V/A
V/A
V/A
V/A
V/A
Page 43
41
POWER INSTRUMENTS
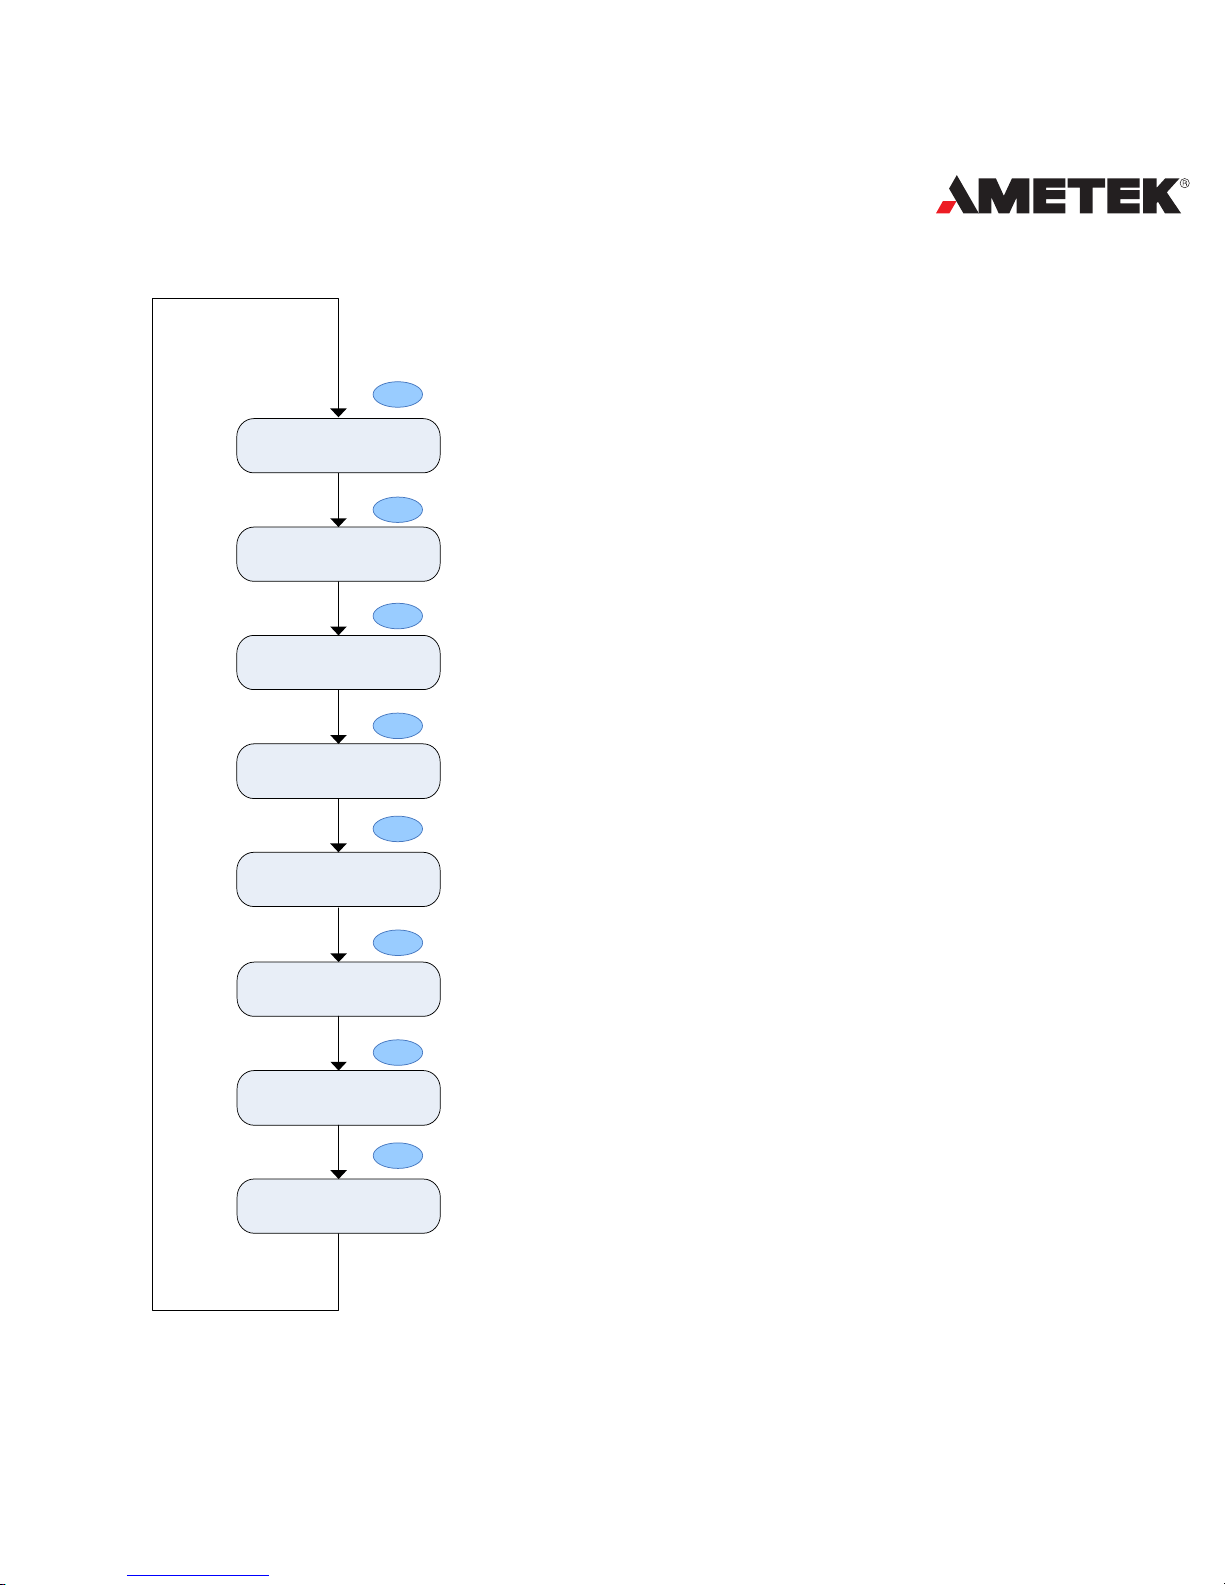
Press P, to display power related data. The
screen will scroll to the next display as you press
P each time. It will go back to the rst screen if you
press P at the last screen.
Table on the left shows you how it scrolls:
Note: When the meter is set to “2LL”, the rst
to the fourth screens will not be displayed.
Three phase
apparent pow er
Three phase PF
Syster m power &
power factor
Three phase
power
Three phase
r eac tive pow er
P
P
P
P
P
Syster m power &
fr equency
Syster m power demand
Syster m power
Pr edi c ting dem and
P
P
P
Page 44
42
DPMS XPQ User Manual
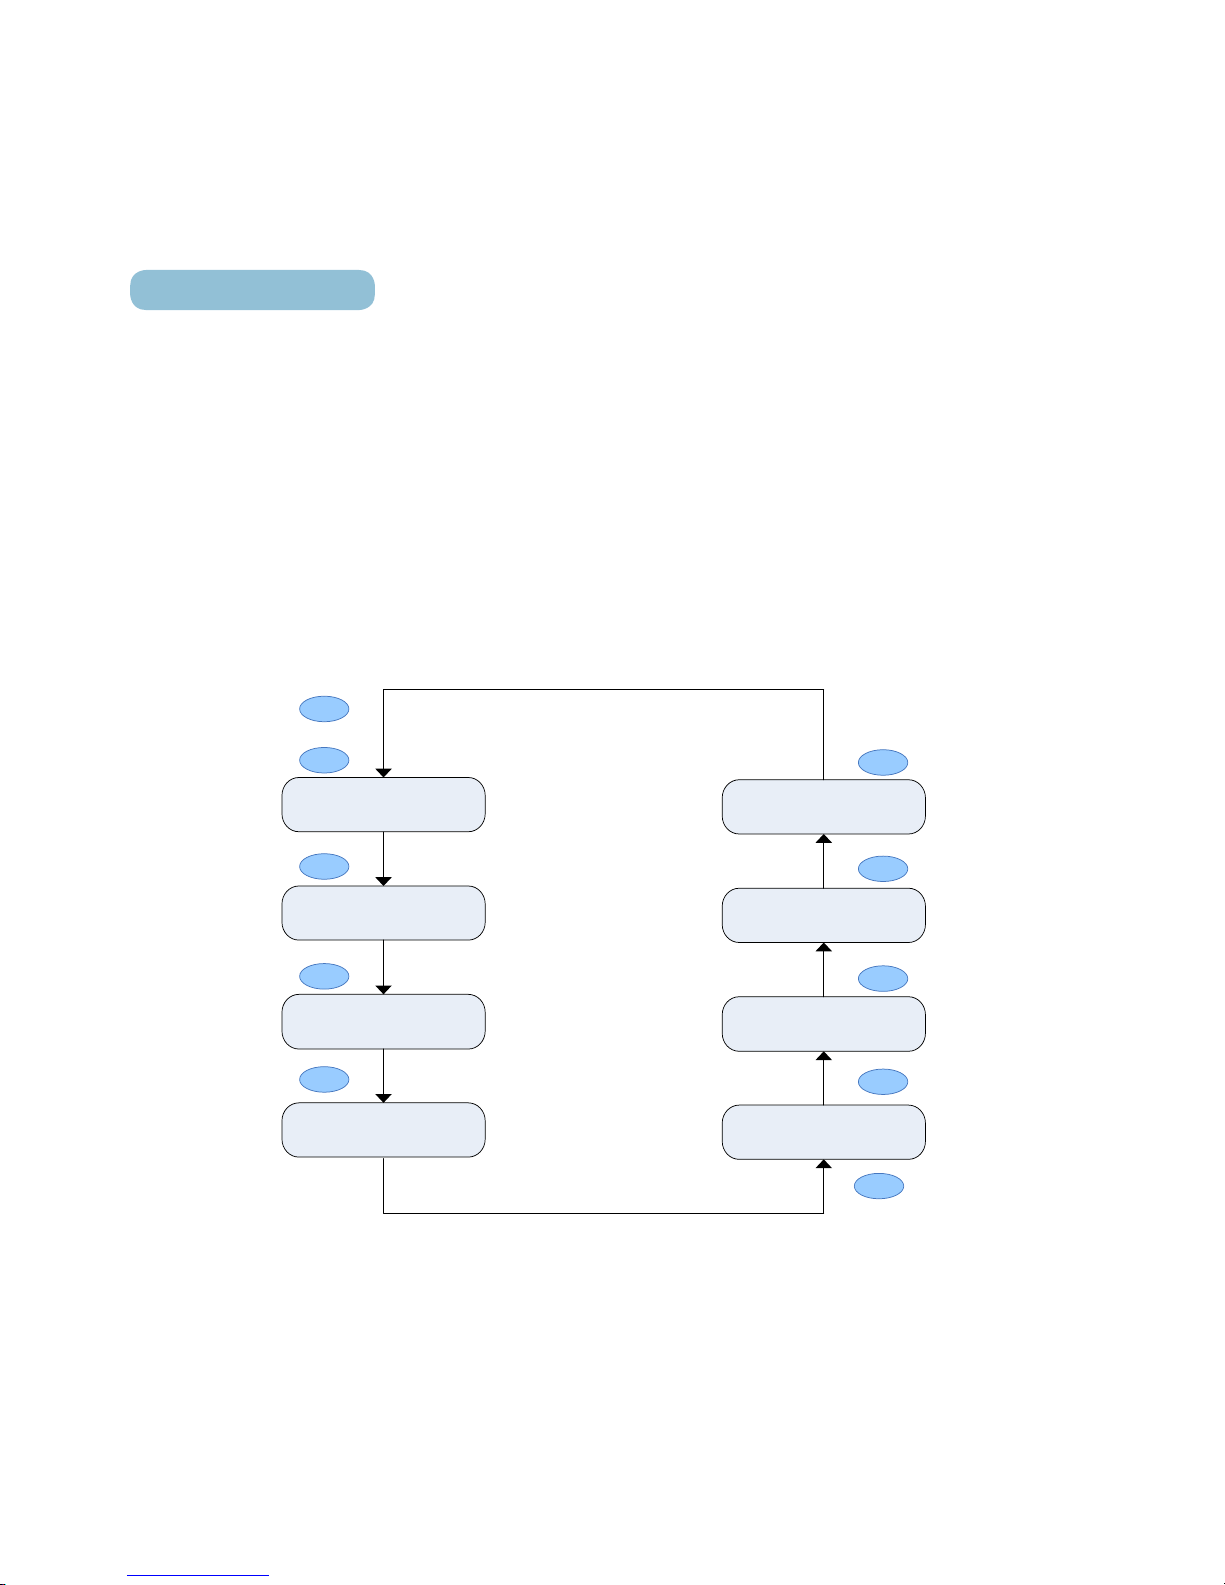
Press H, to display power quality data,
including THD, unbalance factor and voltage
eligibility. The screen will scroll to the next display
as you press H each time. It will go back to the
rst screen if you press H at the last screen.
The following table shows you how it scrolls:
Note 1: Some patterns do not have these
functions so the key function and display are
invalid.
Note 2: When the meter is set to “2LL”, THD,
unbalance factor and voltage eligibility are based
on the line-to-line voltage; otherwise they are
based on the phase voltage.
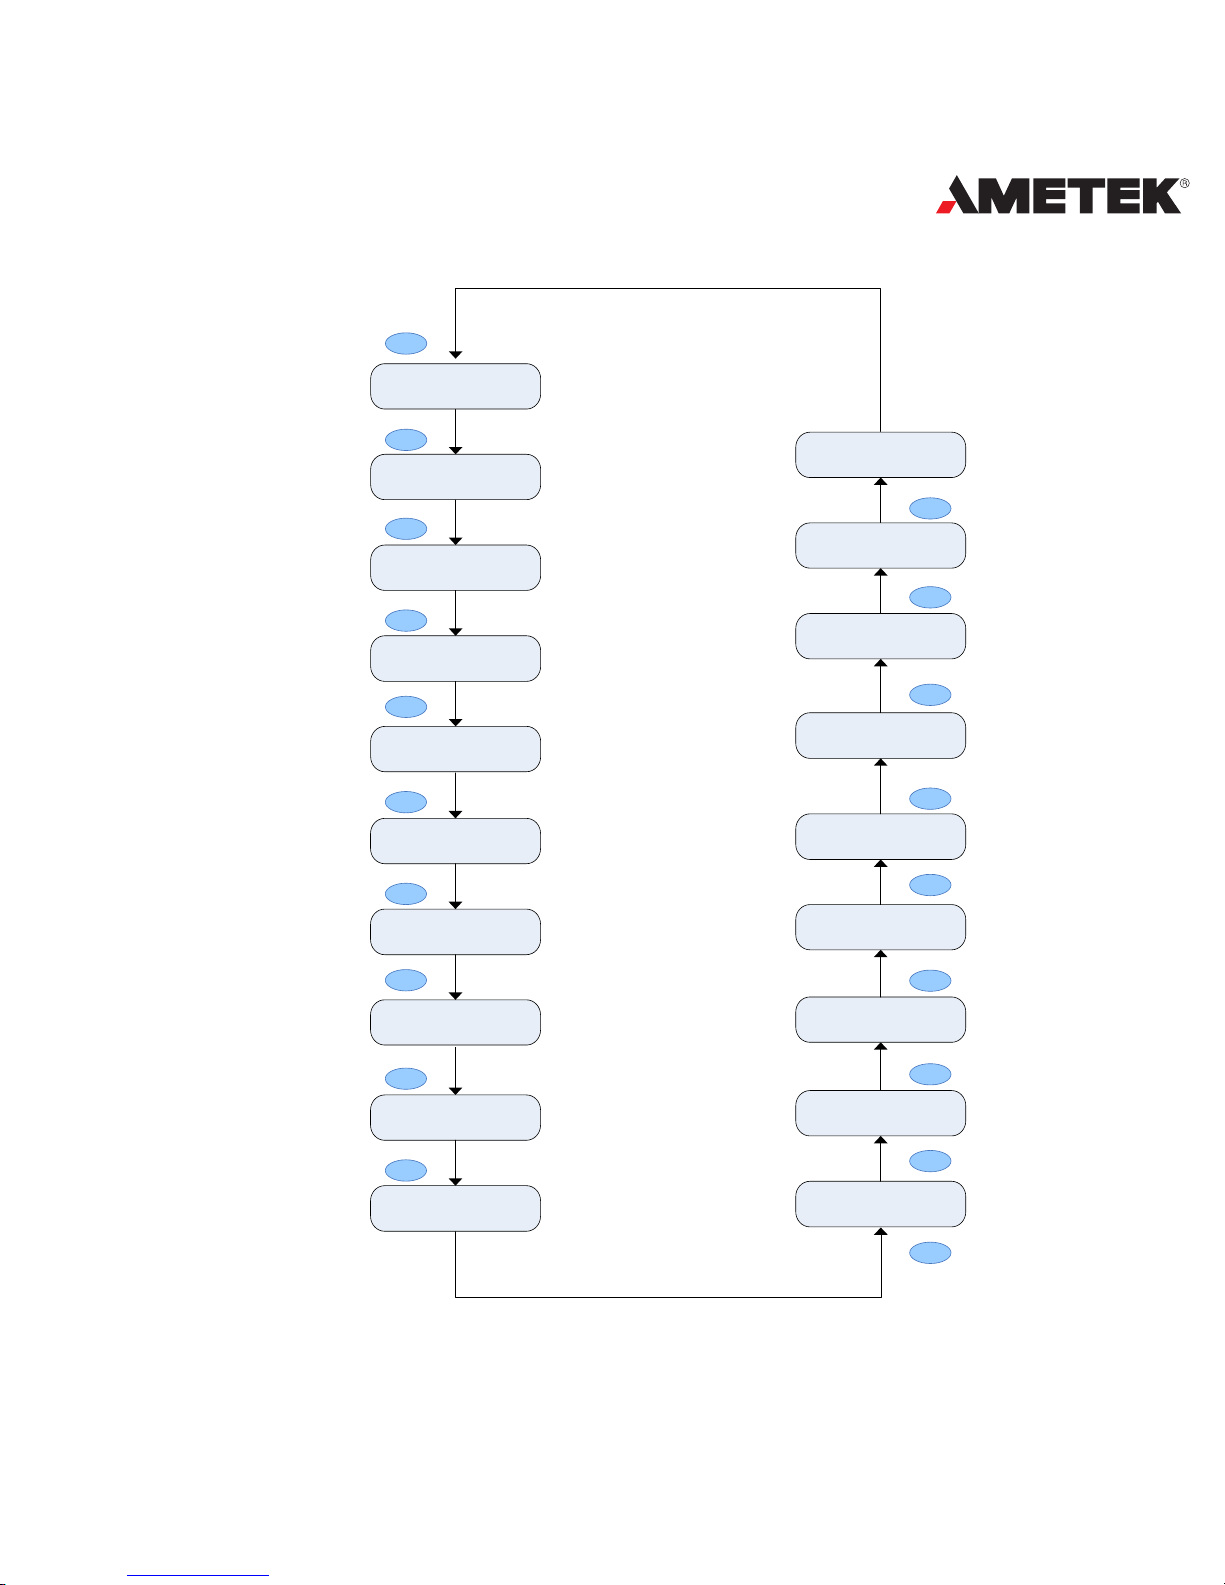
Press E to display energy and the real time clock. The screen will scroll to
the next display as you press E each time. It will go back to the rst screen if
you press E at the last screen.
The unit of power is kWh and kVARh for reactive power. The running
time begins to record at the time when the meter is turned on, with the
accuracy of 0.01H and is stored in the nonvolatile memory. It can be reset via
communication port.
The following table shows you how it scrolls:
Note: Patterns without TOU functions will not display the 9th~16th screens.
Unbalance factor
Voltage Eligibility
THD of phase or
li ne power
THD of l i ne cur rent
H
H
H
H
Page 45
43
POWER INSTRUMENTS
Total ener gy
Net ener gy
The absor ption
reac tiv e ener gy
Consum ption ener gy
Generati on ener gy
E
E
E
E
E
The gener ation
reac tiv e ener gy
Total r eac tiv e ener gy
Net r eacti ve ener gy
E
E
E
Date .For mat:
mm:dd :yyyy
Absor ption reac tiv e
ener gy of valley ti m e
Absor ption reac tiv e
ener gy of peak t i me
Meter r unni ng ti me
Time. For mat :
hh: mm:ss.
E
E
E
E
Consum ption ener gy of
nor mal ti me
Consum ption ener gy of
valley time
E
E
Absor ption reac tiv e
ener gy of shar p ti me
E
Consum ption ener gy of
shar p ti m e
Consum ption ener gy of
peak ti me
E
E
Absor ption reac tiv e
ener gy of nor mal ti me
E
E
Page 46
44
DPMS XPQ User Manual
Statistics Display
Press the P and V/A keys simultaneously, the Max and Min value of
metering data will be displayed on the screen. The time stamp can be accessed
through the communication port. P is used to change the display between
MAX and MIN, V/A is used to scroll the screen. The screen will scroll to the
next display as you press V/A each time. It will go back to the rst screen if you
press V/A at the last screen. It will exit whenever you press P and V/A Keys
simultaneously.
The following shows you how it scrolls:
Note: Set to "2LL", there is no display of "Max value of phase voltage"
.
Max val ue of the line to
line v ol tage
Max val ue of cur rent
Max val ue of power
Max val ue of phase
vol tage
V/A
V/A
V/A
V/A
Max val ue of vol tage
harm oni cs
Max val ue of unbalance
factor
Max val ue of cur rent
demand
Max val ue of cur rent
harm oni cs
V/A
V/A
V/A
V/A
P
+
V/A
Page 47
45
POWER INSTRUMENTS
Meter Parameter Setting
Under the metering data display mode, press the
H and V/A key simultaneously, to get into the meter
parameter setting mode. Most of the settings can be
done through the keys on the panel.
In the meter parameter setting mode, press H to move the cursor. Right
moves one digit each time. Press P for increasing and press E for decreasing.
Press V/A for acknowledgment and going to the next setting item page. Press H
and V/A page keys simultaneously to exit in any setting item page.
An access code is needed to access the parameter setting mode. Only the
person who knows the access code can do the parameter setting. The access
code is 4 digits decimal. It is from 0000 - 9999. The factory default is 0000. After
you key in the right access code, press V/A to go to the rst parameter setting
page, otherwise go back to the metering data display page.
The following table shows you how to set it:
Note
The secondary of the
PT can not be shorted,
otherwise it may cause
severe damage to the
instrument.
Page 48
46
DPMS XPQ User Manual
01: It is any digit from 1 - 247.
02: 1200, 2400, 4800, 9600, 19200, 38400bps are
available.
03: Voltage input could be one of three modes, 3LN,
2LN and 2LL. (Refer to chapter 2)
04: could be one of the three modes, 3CT, 2CT and 1CT.
(Refer to chapter 2)
05: PT1 value is an integer from 50.0 - 500000.0, the
unit is volt.
06: PT2 value is an integer from 100 - 400. The unit is
volt. If there is no PT on the voltage input side of meter,
the PT1 and PT2 should be the same and equal to the
input rated voltage.
07: CT1 value is an integer from 5 - 50000 for a 5 Amp
rated current meter, and 1 - 50000 for a 1 Amp rated
current meter.
08: Output mode of DO can be set as alarm (AL) and
pulse (PLS).
09: It is an integer from 0 - 4 and stands for no output,
consumption energy, generation energy, absorption
03 : Voltage input wi r ing
04 : C urrent input wir ing
05 : PT primary
01 : Address setting
02 : Baud r ate setting
V/A
V/A
V/A
V/A
V/A
Access code page
V/A
P
+
06 : PT secondary
07 : CT primary
V/A
V/A
Page 49
47
POWER INSTRUMENTS
reactive energy and generation of reactive energy
respectively.
10: The same as DO1 for setting, and they don’t affect
each other.
11: The DO pulse width is an integer from 1 - 50. One
digit is 20ms.
12: Pulse rate means the energy value per pulse. It
can be an integer of 1 - 6000. One digit is 0.1kWh or
0.1kVarh.
13: For the latching mode, the relay can be used to
output two states: on or off. For the momentary mode,
the output of the relay changes from off to on for a
period of time, Ton and than goes off. Ton can be set
from 50-300ms. (0: latching; 1: momentary).
14: When the relay mode is set to momentary, the
closing time, Ton is an integer from 50 - 3000ms.
15: The same as Relay1.
16: The same as Relay1 and they don’t affect each
other.
17: The “on” time can be set from 0 - 120 minutes. The
back light will always be “on” if the setting value is 0. If
it is another value, it means after a long time it goes off
if no key has been pressed. It will be “on” whenever you
10 : 09 : DO2 output item
11:The D O pul se w idth
12 : Energy pul se r ate
08: D O mode setting
09 : DO1 output i tem
V/A
V/A
V/A
V/A
V/A
13 : R elay 1 mode
14 : R elay 1 closing time
V/A
V/A
Page 50
48
DPMS XPQ User Manual
press any key if it is “off”.
18: 0 and 1 stands for current month and current day
respectively.
19: To clear the Max and Min value does not mean write
0 to all the registers, it will copy the metering value to the
statistic registers and start a new statistic period.
20: 1,2,3,4 stands for sliding window, fixed window,
rolling window and thermal respectively.
21: 1 - 60 minutes are available.
22: 1 - 60 minutes are available, but the demand period
must be divided exactly by the demand subinterval.
23: To clear demand memory means set “0” to all the
registers used in the demand calculation.
24: To clear the peak demand means just set “0” to the
peak demand registers and will not affect others.
25: “0” stands for no synchronous triggering, “1” for DI1
as the trigger, “2” for DI2 as the trigger, “3” for DI3 as the
trigger and “4” for DI4 as the trigger.
26: “1” stands for from OFF to ON; “2” stands for from
17 : Display back l i ght
“ on ” time
18 : M AX Statistic tim e
mode
19 : Clear ance of the
Max and M in value
15 : R elay 2 m ode
16 : R elay 2 closing tim e
V/A
V/A
V/A
V/A
V/A
20 : Dem and cal culation
mode
21 : Dem and period
V/A
V/A
22 : D emand subinter val
V/A
Page 51
49
POWER INSTRUMENTS
ON to OFF; “3” stands for trigger at any change.
27, 28, and 29: To adjust polarity of the current, the three
currents direction can be set as “Negative” which means
reversing 180 degrees and “Positive” which means
normal.
30: “yes” means alarming is available and “no” means
not.
31: “yes” means the backlight ashes during alarming.
32: “yes” means the relay works in alarming mode and
“no” for remote controlling mode.
33: Th ere are 16 records in a ll an d each one is
corresponding to one bit of a 16-bit register. For each
record, it works or not depends on the enable setting.
If some bits of the register are “1”, it means their
corresponding records take effect. While “0” means they
don’t work. On the panel, it is set as decimal but in the
register it is binary, so it needs conversion.
34: When DO1 works in alarming mode, it is controlled
by a 16-bit register which determines which record will
output to DO1. On the panel, it is set as decimal but in
the register it is binary, so it needs conversion.
35: When DO2 works in alarming mode, it is controlled
by a 16-bit register which determines which record will
25 : D I synchr onization
tr i ggering dem and
26 : D I synchr onization
tr i ggering m ode
27: C urrent I 1 direction
23 : C lear ance of peak
demand
24 : C lear ance of peak
demand m emory
V/A
V/A
V/A
V/A
V/A
28: C urrent I 2 direction
29: C urrent I 3 direction
V/A
V/A
Page 52
50
DPMS XPQ User Manual
output to DO2. On the panel, it is set as decimal but in
the register it is binary, so it needs conversion.
36, 37: The same as DO1 and DO2.
38: Two alarm rules can be logically “and” by controlling
the logic switch. When two alarm rules are logical and
the alarming works, only both of them are true. This
function is controlled by the low 8 bits of a 16-bit register;
each bit is corresponding to a group. “1” means this
function is turned on and “0” means off.
39: Any change on DI can trigger waveform capturing.
It is controlled by a 16-bit register. Bit1, bit0 controls
DI1, bit3, bit2 controls DI2, bit4, bit5 controls DI3 and
bit7, bit6 controls DI4. “00” stands for no capturing, “01”
capture from off to on, “10” from on to off and “11” for any
changes.
Note: You should convert the hex number to a binary
number rst.
40: Under the condition of a blank record, setting “yes”
can initialize one record of the waveform capture.
41: After every interval, it records the value of frequency,
UA (UAB), IA, UB (UBC), IB, UC (UCA), IC. The values
are called trending records. The interval can be set from
1min - 60min with a default of 60min.
42: Display format is MM: DD: YYYY.
43: display format is hh:mm:ss.
32 : R elay for alarm ing
33 : Alar ming r ecor ds
enable
34 : Al armi ng output to
DO1
30 : Al armi ng enable
31 : Backlight flashing
V/A
V/A
V/A
V/A
V/A
35 : Al armi ng output to
DO2
36 : Al armi ng output to
RO1
V/A
V/A
37 : Al armi ng output to
RO2
V/A
Page 53
51
POWER INSTRUMENTS
44: This is the last screen of the setting page. The
access code can be changed on this page. It is important
to remember the new access code.
40 : M anual tr igger ing
waveform capture
41 : Intervals of tr ending
record
42 : system date setting
38 : Logi cal and
between al ar m r ules
39 : D I tr iggering
waveform mode
V/A
V/A
V/A
V/A
V/A
43 : system time setting
44 : Access code
V/A
V/A
Page 54
52
DPMS XPQ User Manual
Energy Parameter setting
Pressing H and E simultaneously under the metering data display mode will
enter the energy settings page. The key operation is the same as in other
setting pages. You need to press H and E simultaneously to exit this mode.
The following table shows you how to set it:
01: TOU can be forbidden in application.
02: TOU time setting is complex, the meter has a default
when it leaves the factory. You can use the default or set it
yourself.
03: Energy can be reset by writing registers one by one
or writing “0” to them all at one time. TOU and real time
energy can be reset respectively.
04:“nature” means balance at the end of a month, “assign”
means balance at an assigned time every month. TOU
balance means to end the accumulation of the energy in
the current balance month and begin to accumulate the
energy in a new balance month.
05: When “assign” is selected, the time is to be set here,
format is dd:hh:mm:ss.
06: Copy the real time energy and TOU energy of current
month to the freezing memory. There are two modes.
“Assign” means pointing a time to freeze, “at once” means
freezing right now. If you select the “assign” mode, you
need to set the time on the 8th screen skipping the 7th; if
you select the “at once” mode, you need to nish the 7th
screen in order to execute the order.
03 : Real ti m e energy
reset selection
04 : T OU bal ance m ode
sel ecti on
05 : TOU balance tim e
setti ng
01 : TOU ener gy enable
02 : TOU setting reset to
defaul t
V/A
V/A
V/A
V/A
V/A
Acces s c ode page
E
H
+
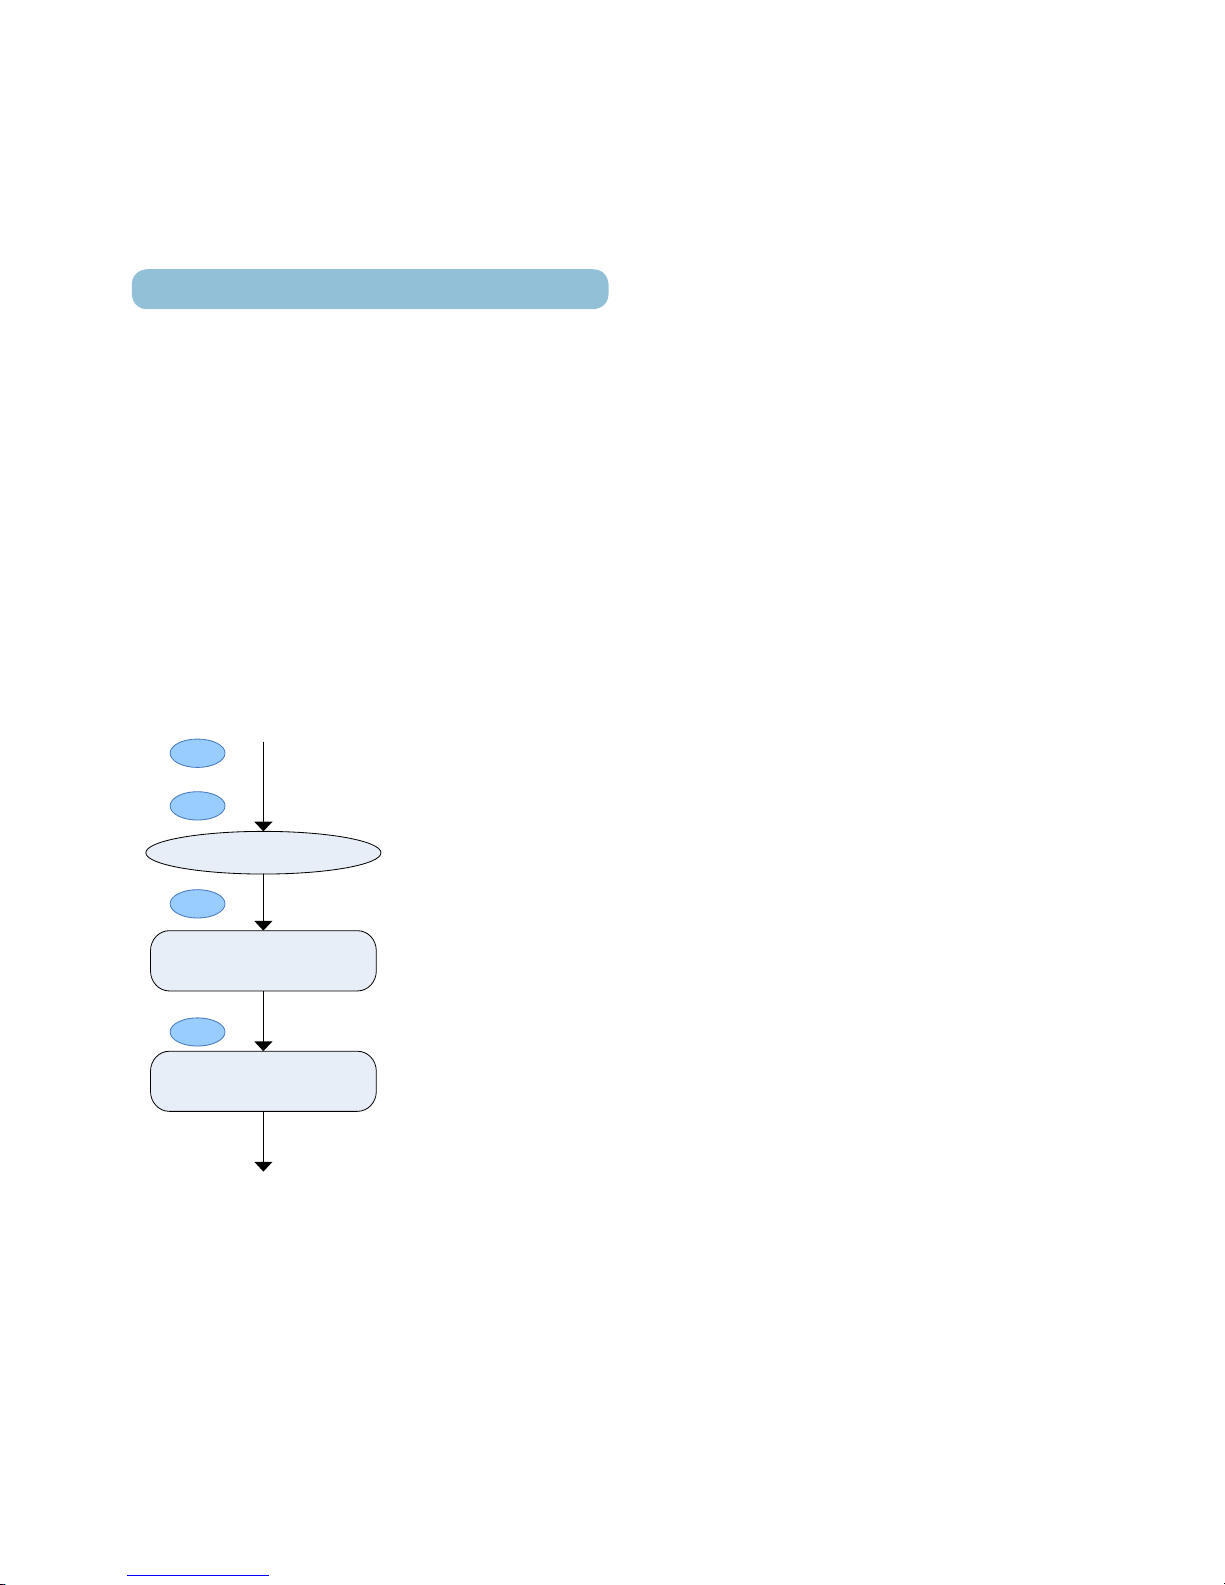
06 : Energy fr eezi ng
mode s el ecti on
V/A
Page 55
53
POWER INSTRUMENTS
07: This screen will display only when you select the “at
once”.
08: Set your time of freezing on this screen when you
select the “assign” mode.
09: There are two modes of clearance: “assign” means
clear at an assigned time, this will skip the 10th screen
to the 11th to set the time. “At once” means clear at once
after you nish the 10th screen.
10: Finish this screen when you select the “at once”
mode.
11: Execute this order every year at this date:MM:DD.
12: Execute this order every year at this time:hh:mm:ss.
13: “0”stands for fundamental based measuring, “1”
stands for all-wave based measuring.
14: “0” stands for mode 0:
“1” stands for mode 1: .
09 : TOU clear ance
mode selecti on
10: TOU clear ing at
once setti ng
11 : TOU clear ance date
setting
07 : Fr eezing at once
setting
08 : Freezing tim e
setting
V/A
V/A
V/A
V/A
V/A
12 : TOU clear ance tim e
setting
V/A
13 : Ener gy measuring
mode selecti on
14 : Apparent power
measuring mode
V/A
Page 56
54
DPMS XPQ User Manual
Voltage Eligibility Parameter Setting
Pressing H and P simultaneously under the metering data display mode
will enter the voltage eligibility statistics setting page. The operation of keys is
the same as in other setting pages. You need to press H and P simultaneously
to exit this mode.
Whether the voltage is eligible or not is according to whether the measured
voltage is within the limitations set by the user. The limitations of the three
phase voltages can be set respectively and the setting value is the same as the
communication value, which is the secondary value without PT and CT.
The following table shows you how to set it:
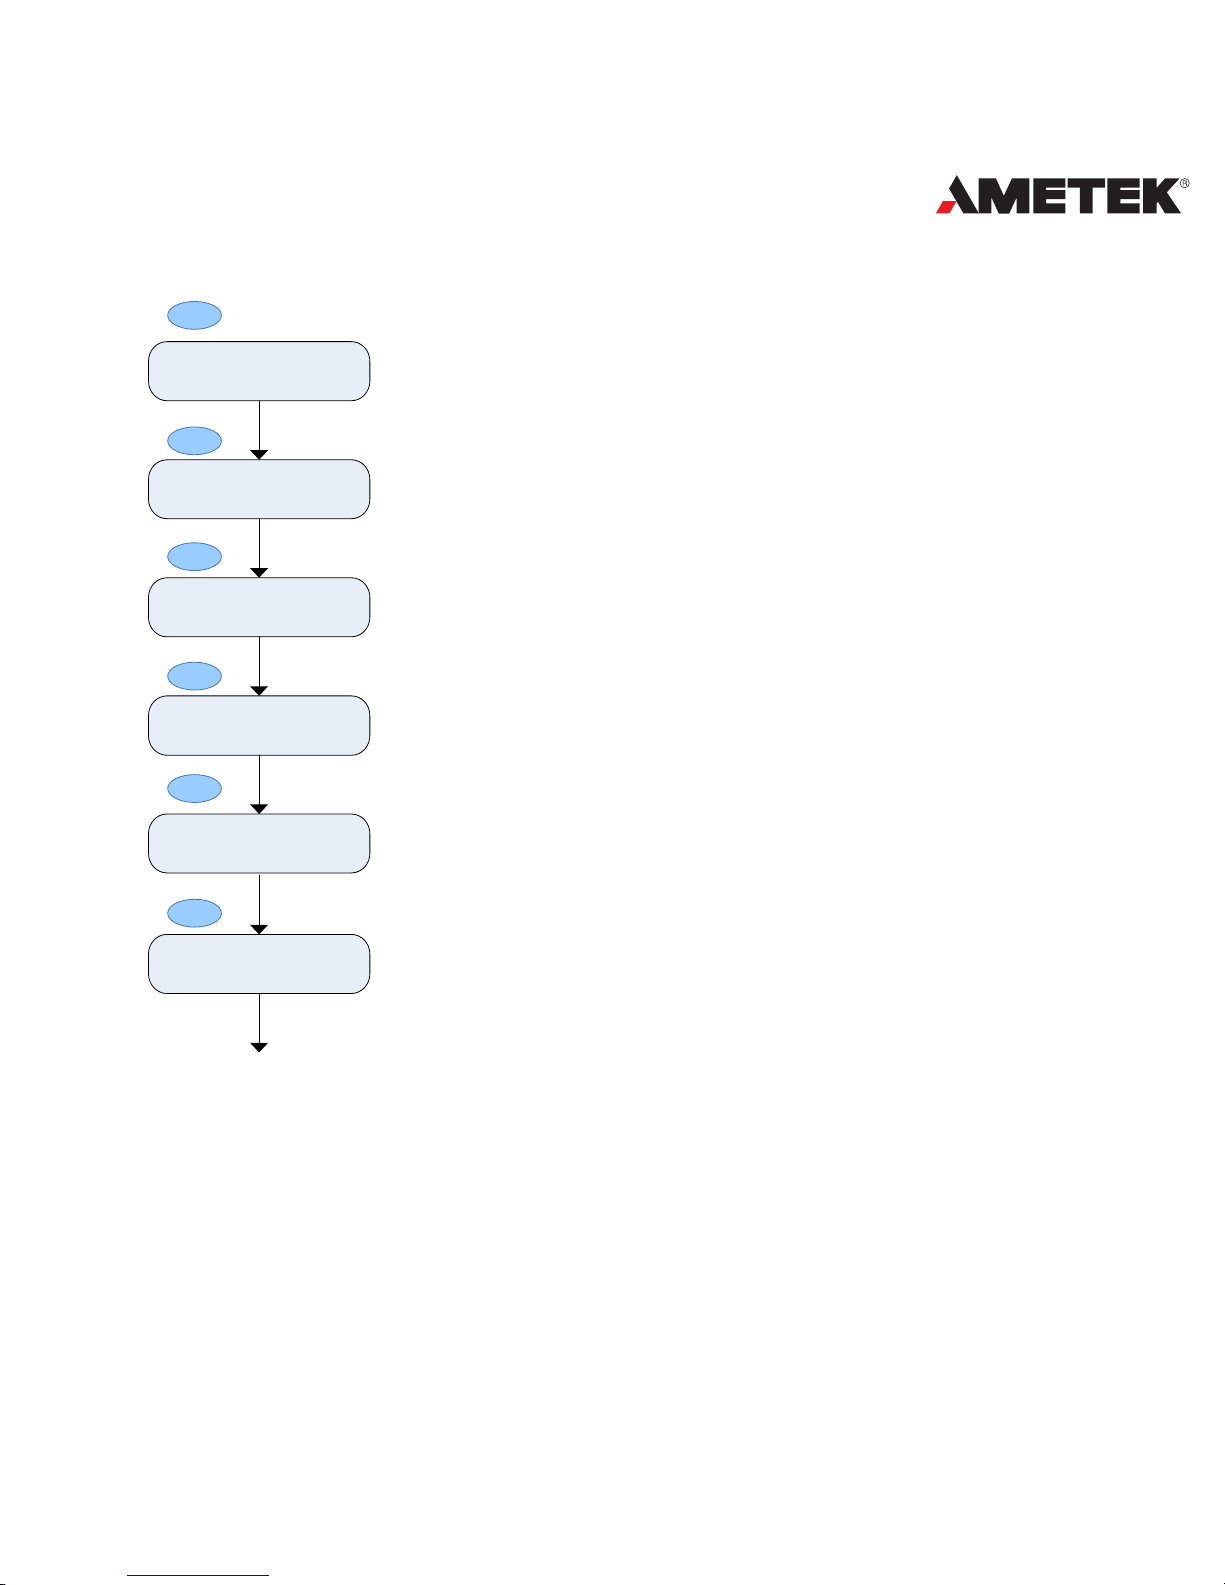
01, 02: When the meter is set to “2LL”, it is U12 and
U1 for others.
01: High limit of
U1(U12 )
02 : Low lim it of
U1(U12 )
V/A
V/A
Access code page
P
H
+
Page 57
55
POWER INSTRUMENTS
03, 04: when the meter is set to “2LL”, it is U23 and
U2 for others.
05, 06: when the meter is set to “2LL”, it is U31 and
U3 for others.
07: There are two modes of clearance: “assign”
means clear at an assigned time, this will skip the 8th
screen to the 9th to set the time. “At once” means
clear at once after you nish the 8th screen. After the
clearance, all time values will be 0 and voltage
eligibility will be 100%.
08: Finish this page when you select the “at once”
mode.
05 : High limit of
U3 (U31 )
06: Low limit of
U3 (U31 )
07 : Voltage Eligibility
cl earance mode
03 : High limit of
U2 (U23 )
04: Low limit of
U2 (U23 )
V/A
V/A
V/A
V/A
V/A
08 : Voltage Eligibility
cl ear at once setti ng
V/A
Page 58
56
DPMS XPQ User Manual
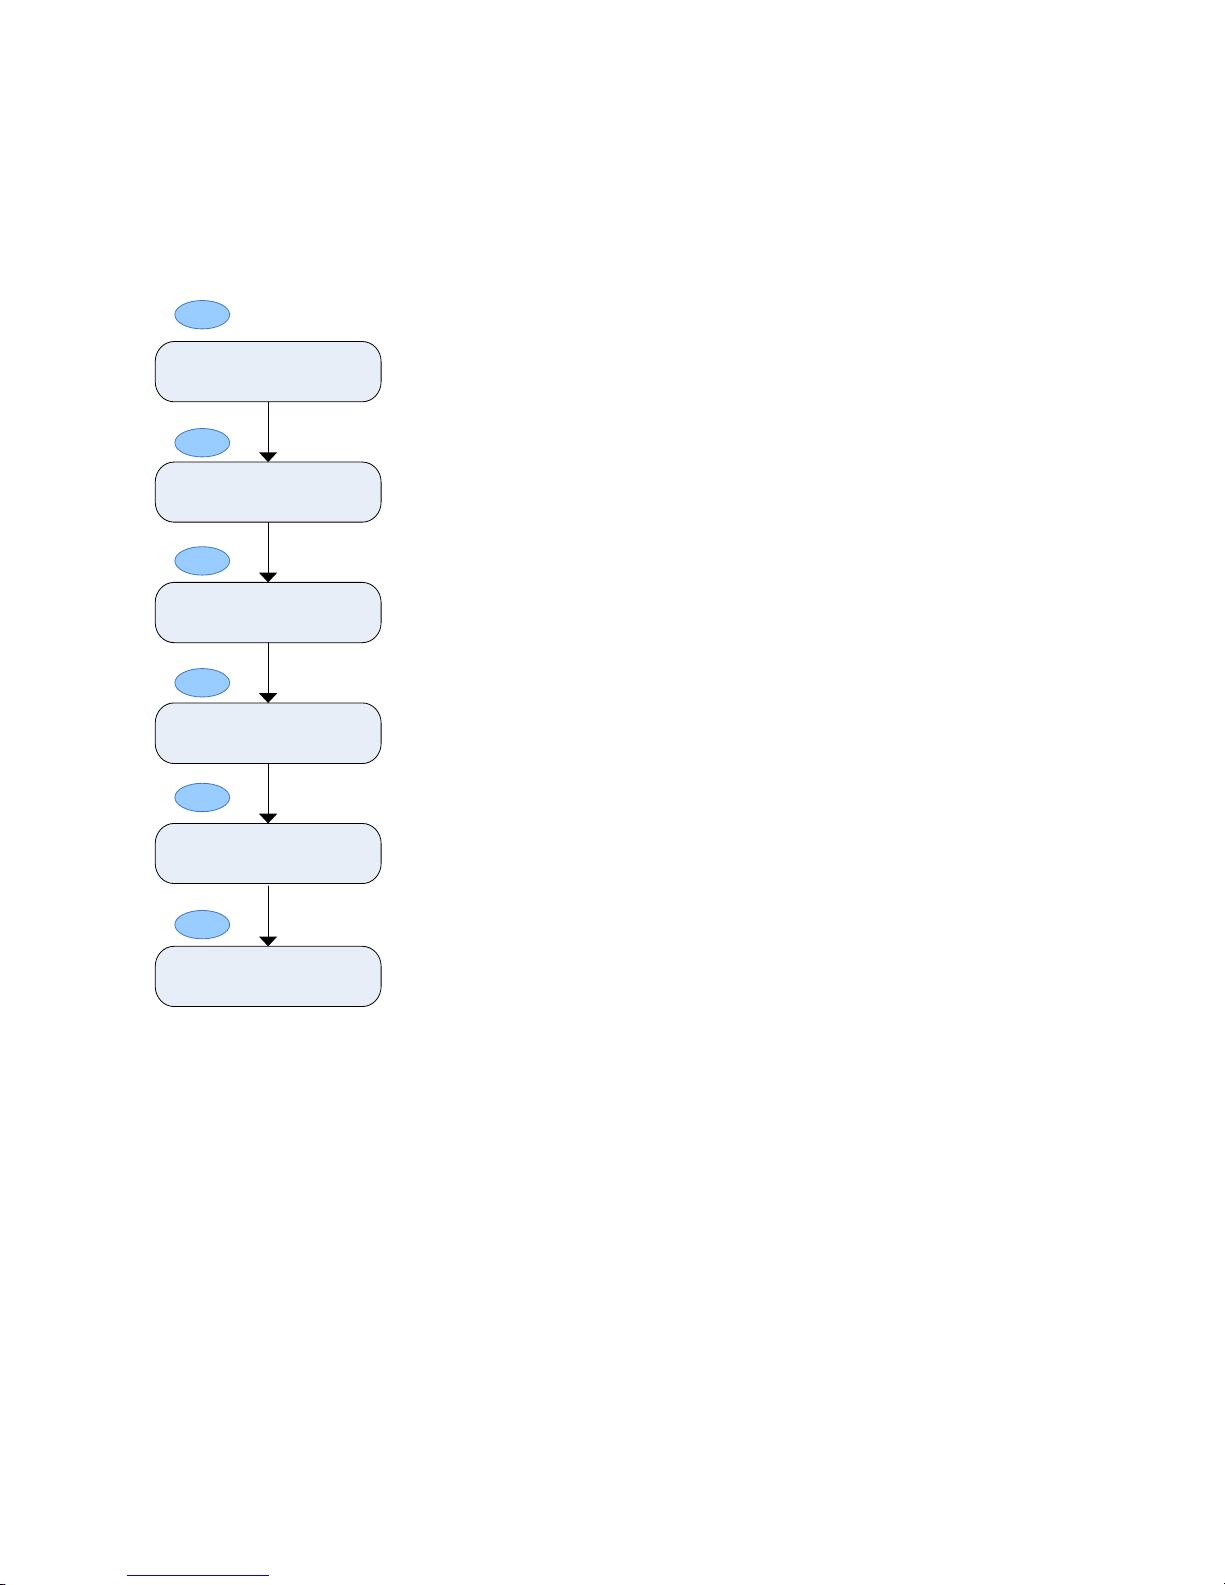
09, 10: Set the time for the “assign” mode
.
11: It only freezes real time measurement. There are
two modes. “Assign” means pointing a time to freeze,
“at once” means freezing right now. If you select the
“assign” mode, you need to set the time on the 13th
screen skipping the 12th; If you select the “at once’
mode, you need to finish the 12th screen in order to
execute the order.
12: if you select the “At once” mode at the “Voltage
Eligibility freezing mode setting”, you can go into this
page to execute the order at once.
13, 14: The meter will freeze the data at this
moment according to its inner clock.
11 : Voltage Eligibility
fr eezing mode setting
12 : Fr eezing at once
setting
13 : Fr eezing date
setting
09 : Voltage Eligibility
cl earing date setti ng
10 : Voltage Eligibility
cl earing ti me setting
V/A
V/A
V/A
V/A
V/A
14 : Freezing tim e
setting
V/A
Page 59

Chapter 4 Function and Software
Functionality and Utility Software
57
Page 60
58
DPMS XPQ User Manual
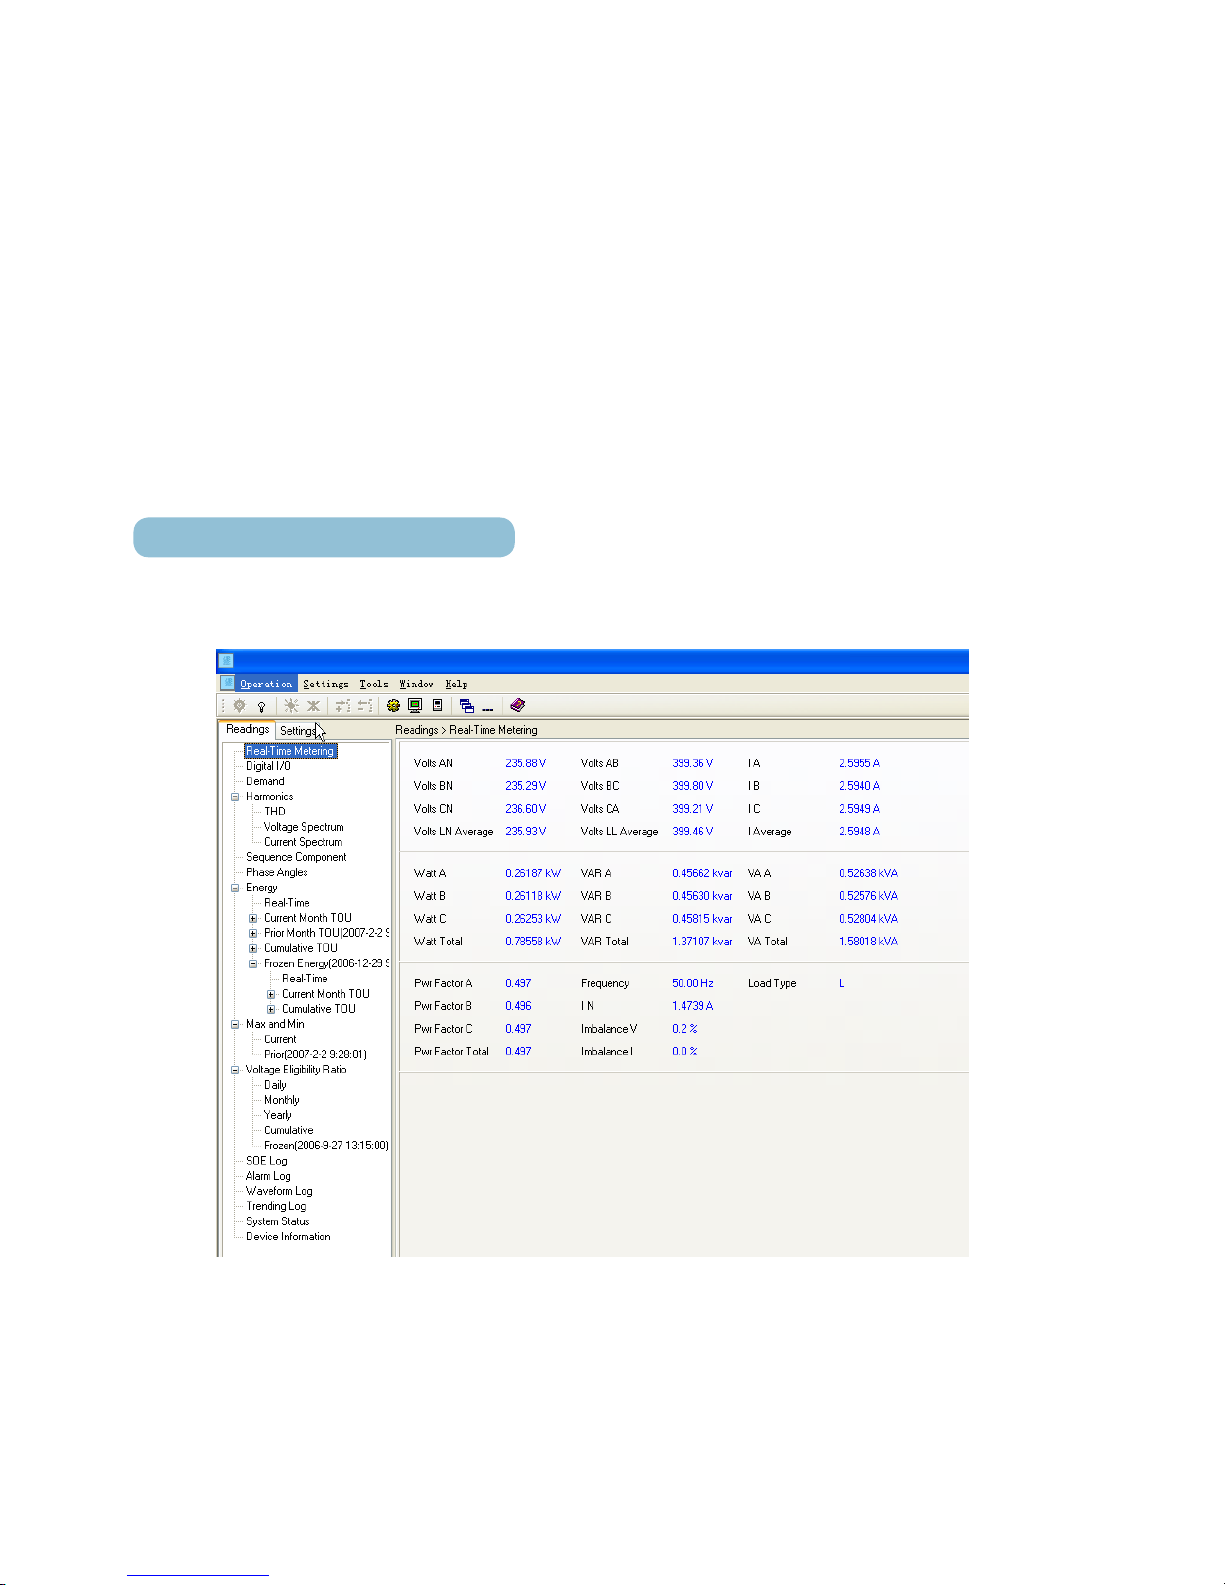
The DPMS XPQ can measure almost all the parameters in the power
system. Some of its functions may not be demonstrated by simply pressing the
keys, hence, the software to go with it. We’ll introduce functions with the help of
the software interface in this chapter. The version of the software you buy may
be advanced and it may differ somewhere, please refer to the manual that goes
with it.
Basic Analog Measurements
It can measure voltage, current, power, frequency etc with high accuracy,
shown as below:
Fig 4.1 Real-Time Metering
Page 61
59
POWER INSTRUMENTS
Note1: It should be clear that there is a dened correspondence between
the real value and communication value. For more detail, please refer to chapter
5.
Note 2: Settings related to measurements are in system settings.
Harmonics
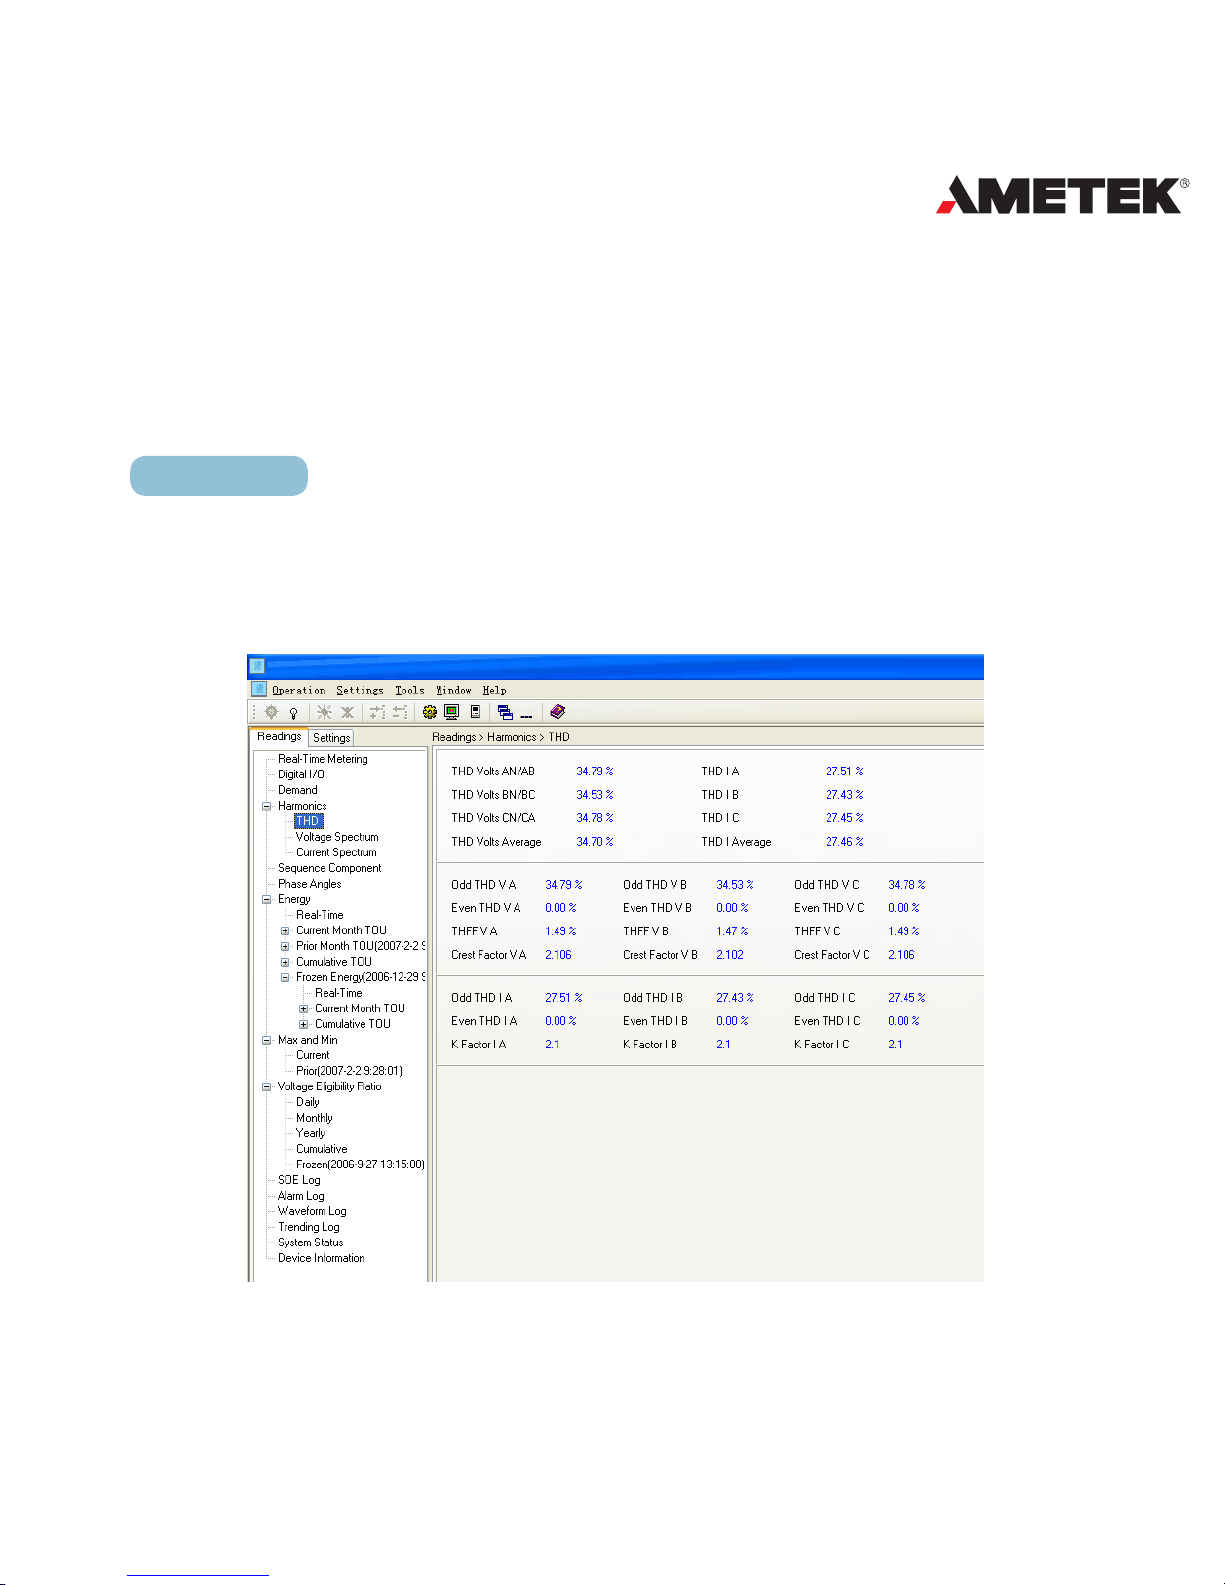
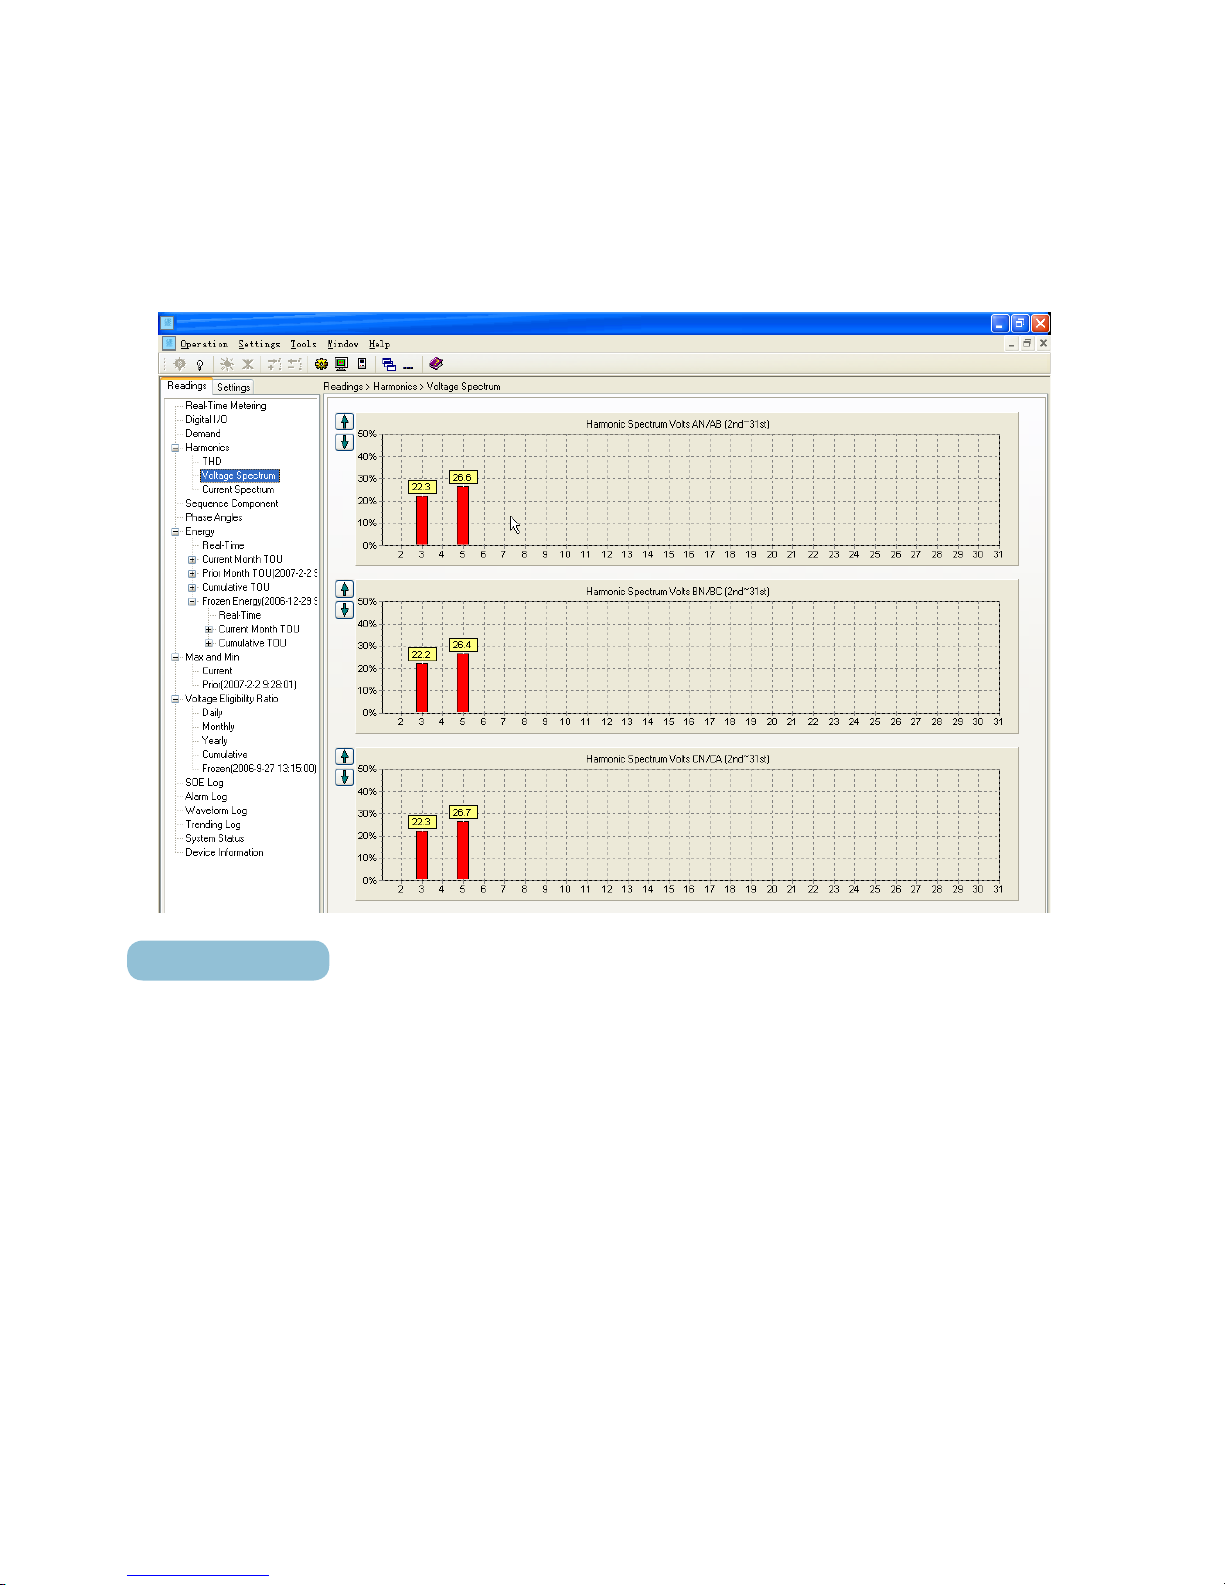
It can measure and analyze THD, Harmonics (2nd to 31st), even HD, odd
HD, Crest Factor, THFF, K factor etc. Values excluding harmonic ratios are
shown in the gure below:
Fig 4.2 Total Harmonic Distortion
Page 62
60
DPMS XPQ User Manual
A chart in the software is shown below:
Fig 4.3 Voltage Spectrum
Phase angle
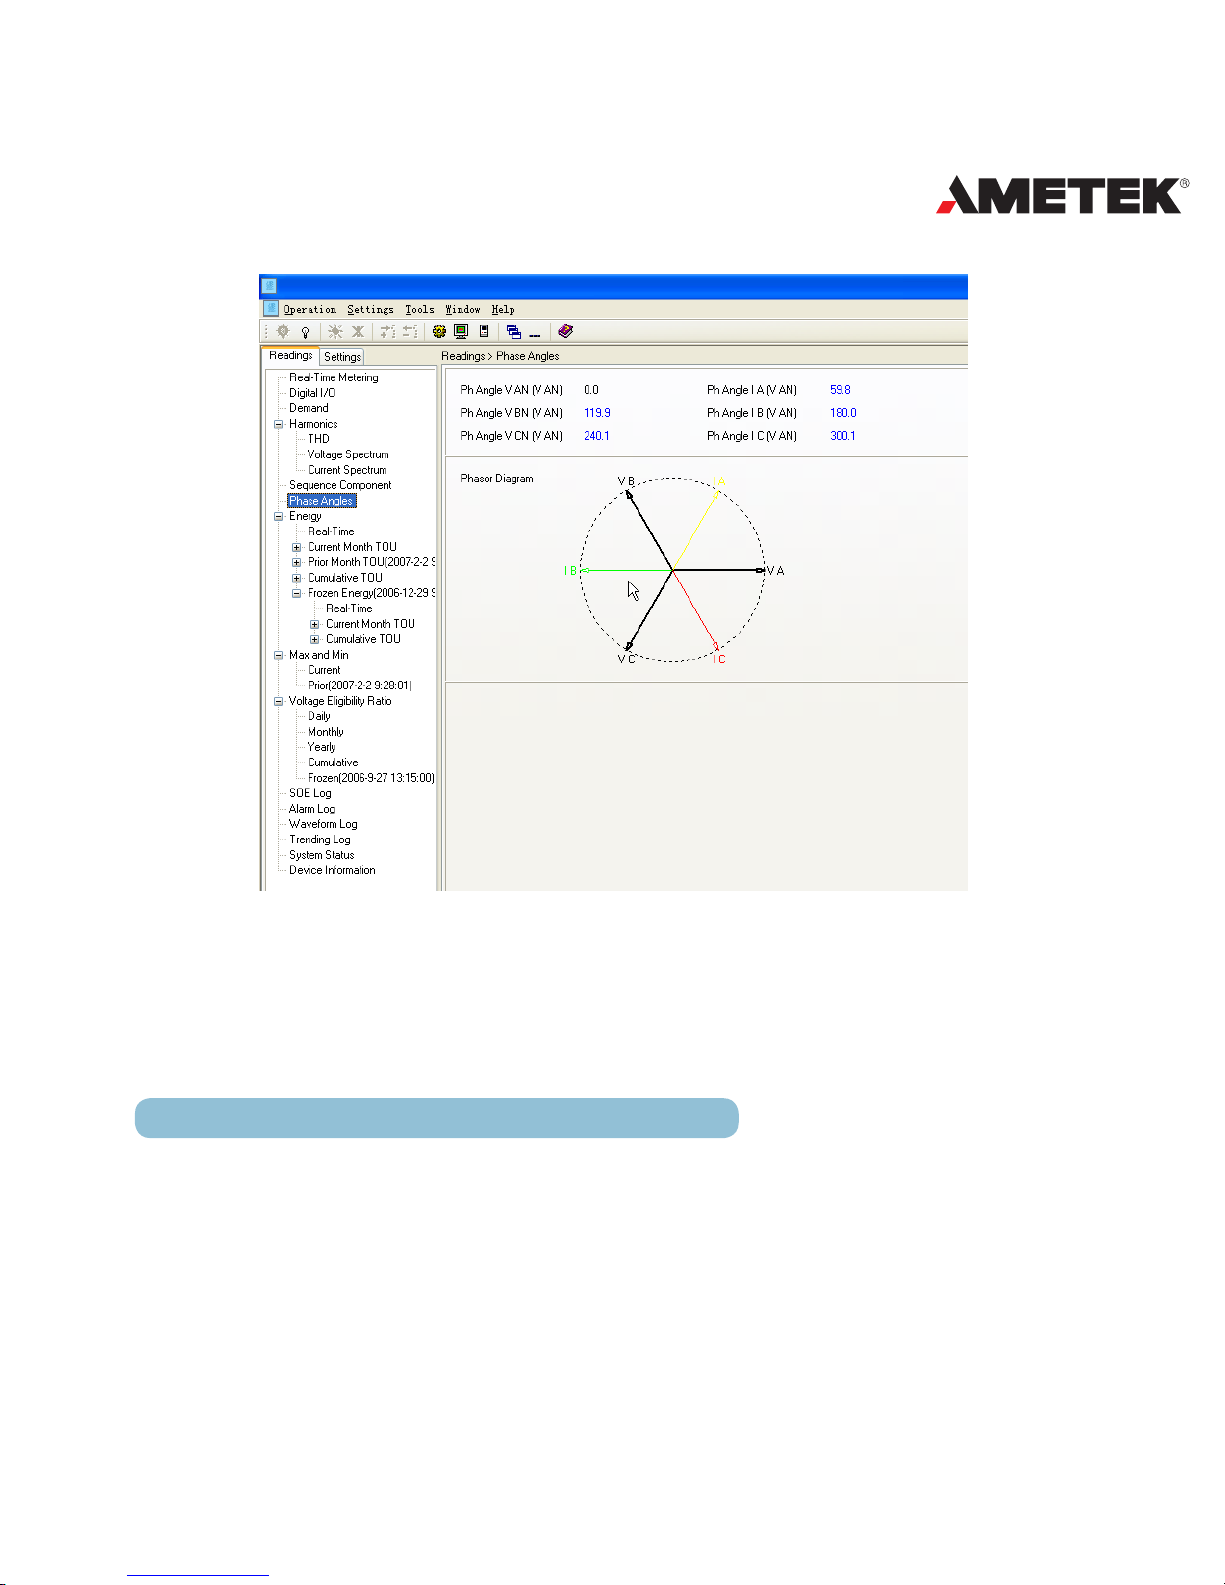
Phase angle indicates the angle between U1 and other voltage and current
parameters. It ranges from 0 - 360 degrees. This function is to help you nd out
the relationship between all input signals avoiding incorrect wiring. When it is
set to “2LL”, it gives the phase angle of u23, i1, i2, i3 corresponding to u12 and
u2, u3, i1, i2, i3 corresponding to u1 for other settings.
The following gure is an example:
Page 63
61
POWER INSTRUMENTS
Fig 4.4 Phase Angles
Current direction adjustment
The right current direction is from port 1 to port 2. To adjust polarity of
current, the three currents direction can be set as “Negative” which means
reversing 180 degrees and “Positive” which means normal.
Sequence component and unbalance analysis
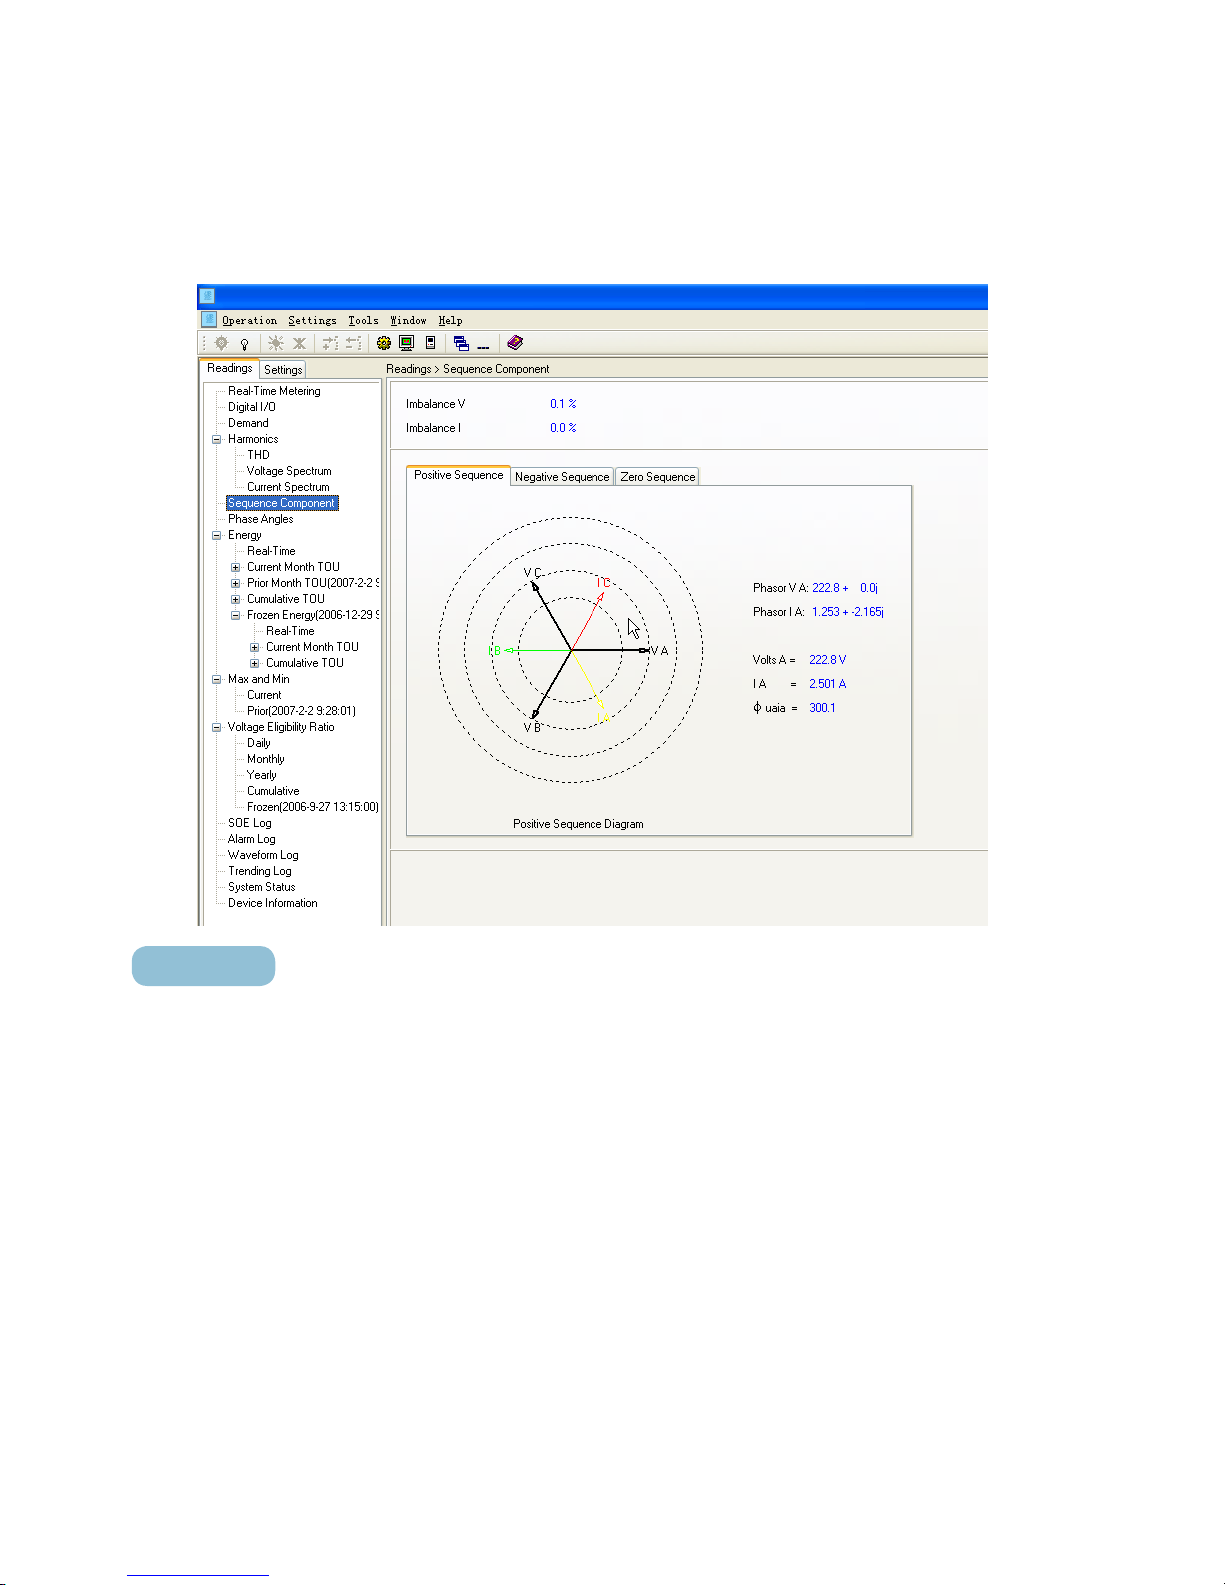
The DPMS XPQ will do some sequential analysis for the input signal. it
makes out the positive sequence, negative sequence and zero sequence of the
fundamentals and will do the unbalance analysis of voltage and current.
The following gure shows a sequence chart:
Page 64
62
DPMS XPQ User Manual
Fig 4.5 Sequence Component
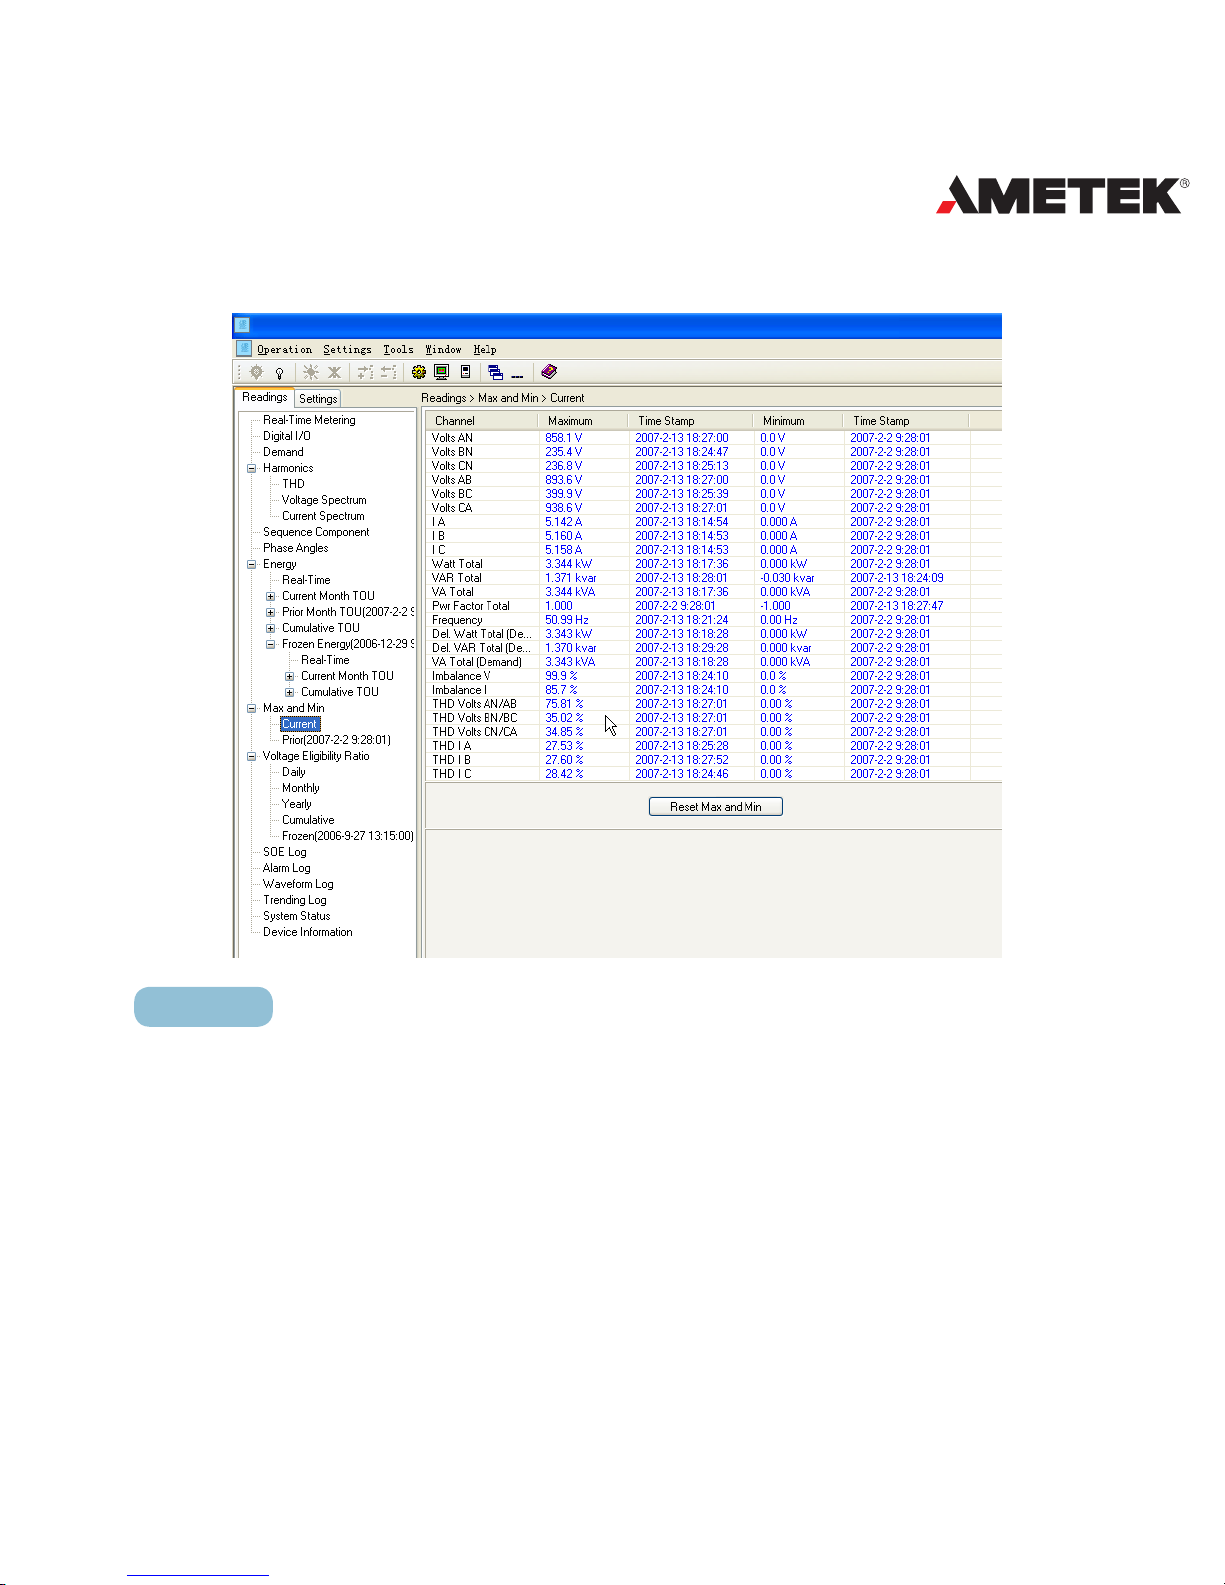
Max/Min
The meter can record statistics of the maximum and minimum values of
phase/line voltages, currents, power, reactive power, apparent power, power
factor, frequency, demand, unbalance factor, THD as well as the time they
occur. The statistic period can be set as “month” or “day”. All the data will be
stored in nonvolatile memory so that they will not be lost when the power is off.
All the data can be accessed via communication port and be cleared by panel
keys.
Page 65
63
POWER INSTRUMENTS
The following gure is an example:
Fig 4.6 Max and Min
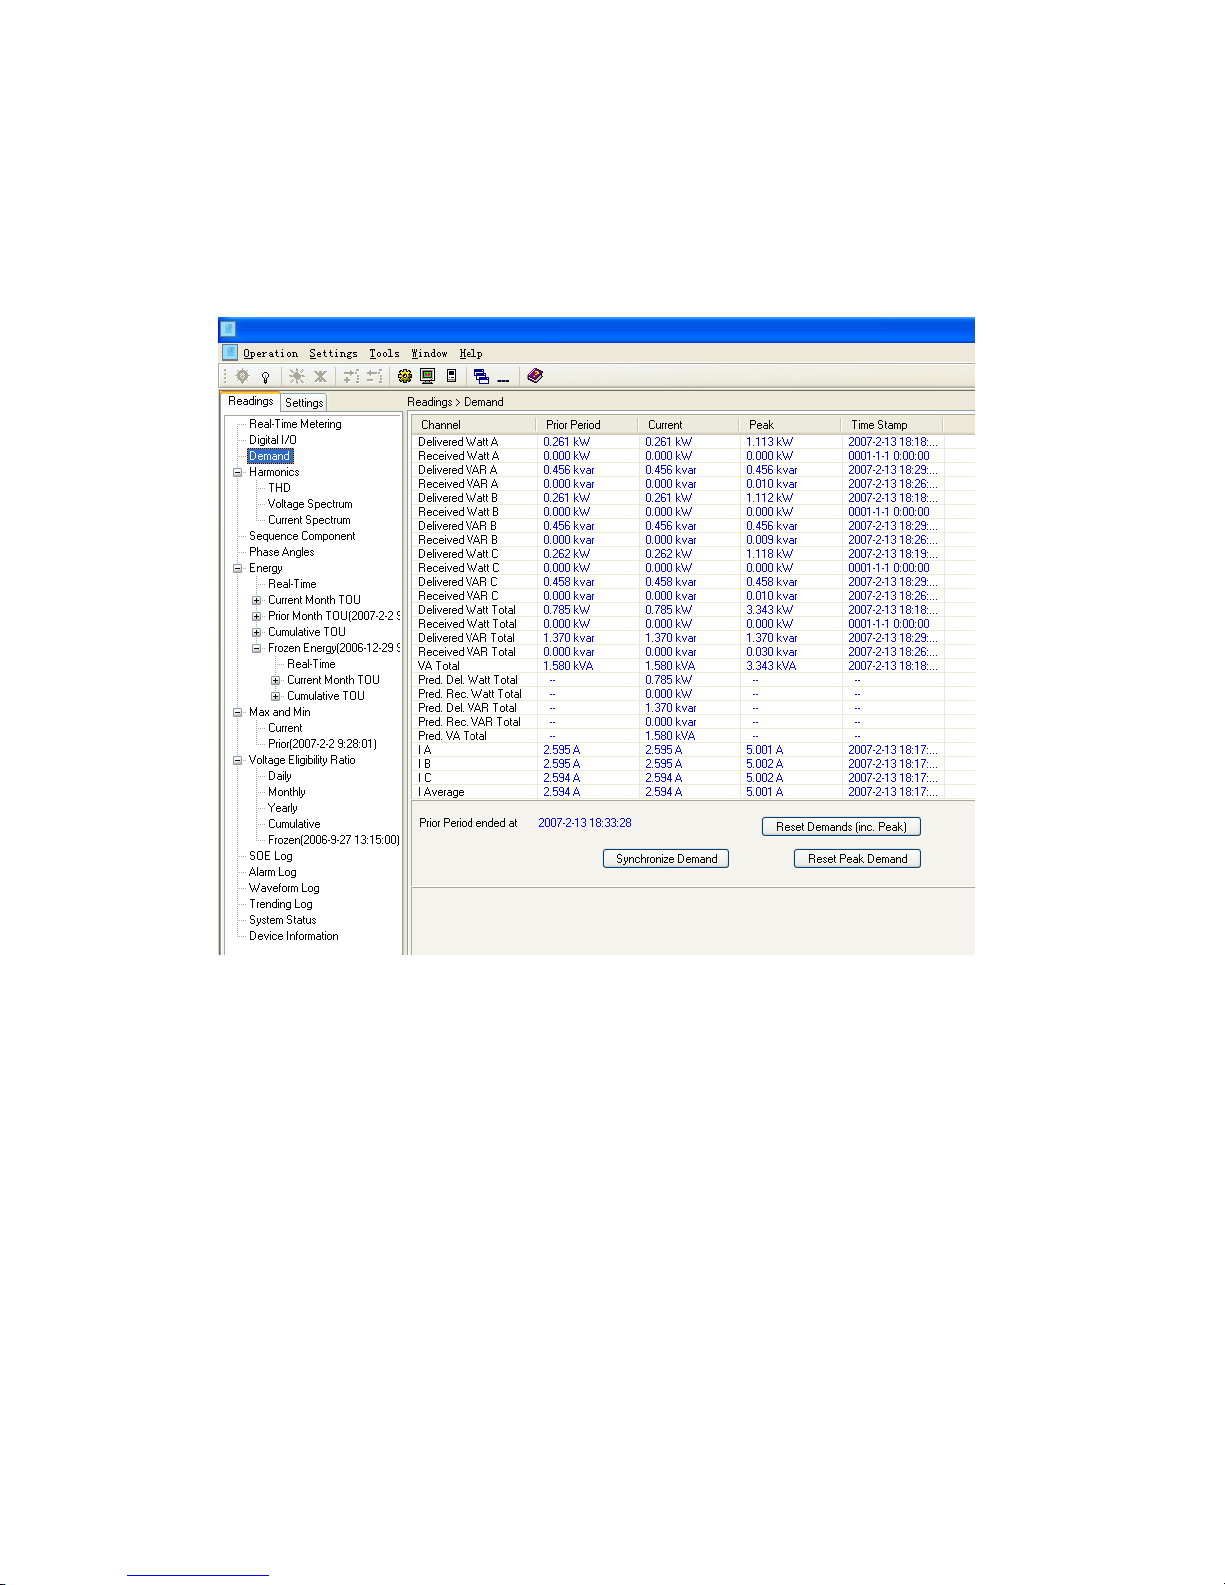
Demand
Types of demands calculated are: consumption power demand of phases
A, B, and C, generation power demand of phases A, B, and C, absorption
reactive power demand of phases A, B, and C, generation reactive power
demand of phases A, B, and C, consumption power demand of three phase,
generation power demand of three phase, absorption reactive power demand
of three phase, generation reactive power demand of three phase, apparent
Page 66

64
DPMS XPQ User Manual
power demand, current demand of I1, current demand of I2, current demand of
I3, current demand of average current, consumption power predictive demand,
generation power predictive demand, absorption reactive power predictive
demand, generation reactive power predictive demand, and apparent power
predictive demand.
The values calculated include last period values, current period values,
peak demands and their occurring time. Current period values are the
calculation values of demand in the current period, while last period values refer
to the values achieved for the last completed period. Peak demands are the
maximum demands since cleared last time. Time stamp will be stored when the
update of the calculation occurs.
Peak demand and demand memory can be cleared. To clear is to reset all
the registers to 0, like the initial state of the meter (demand calculation only).
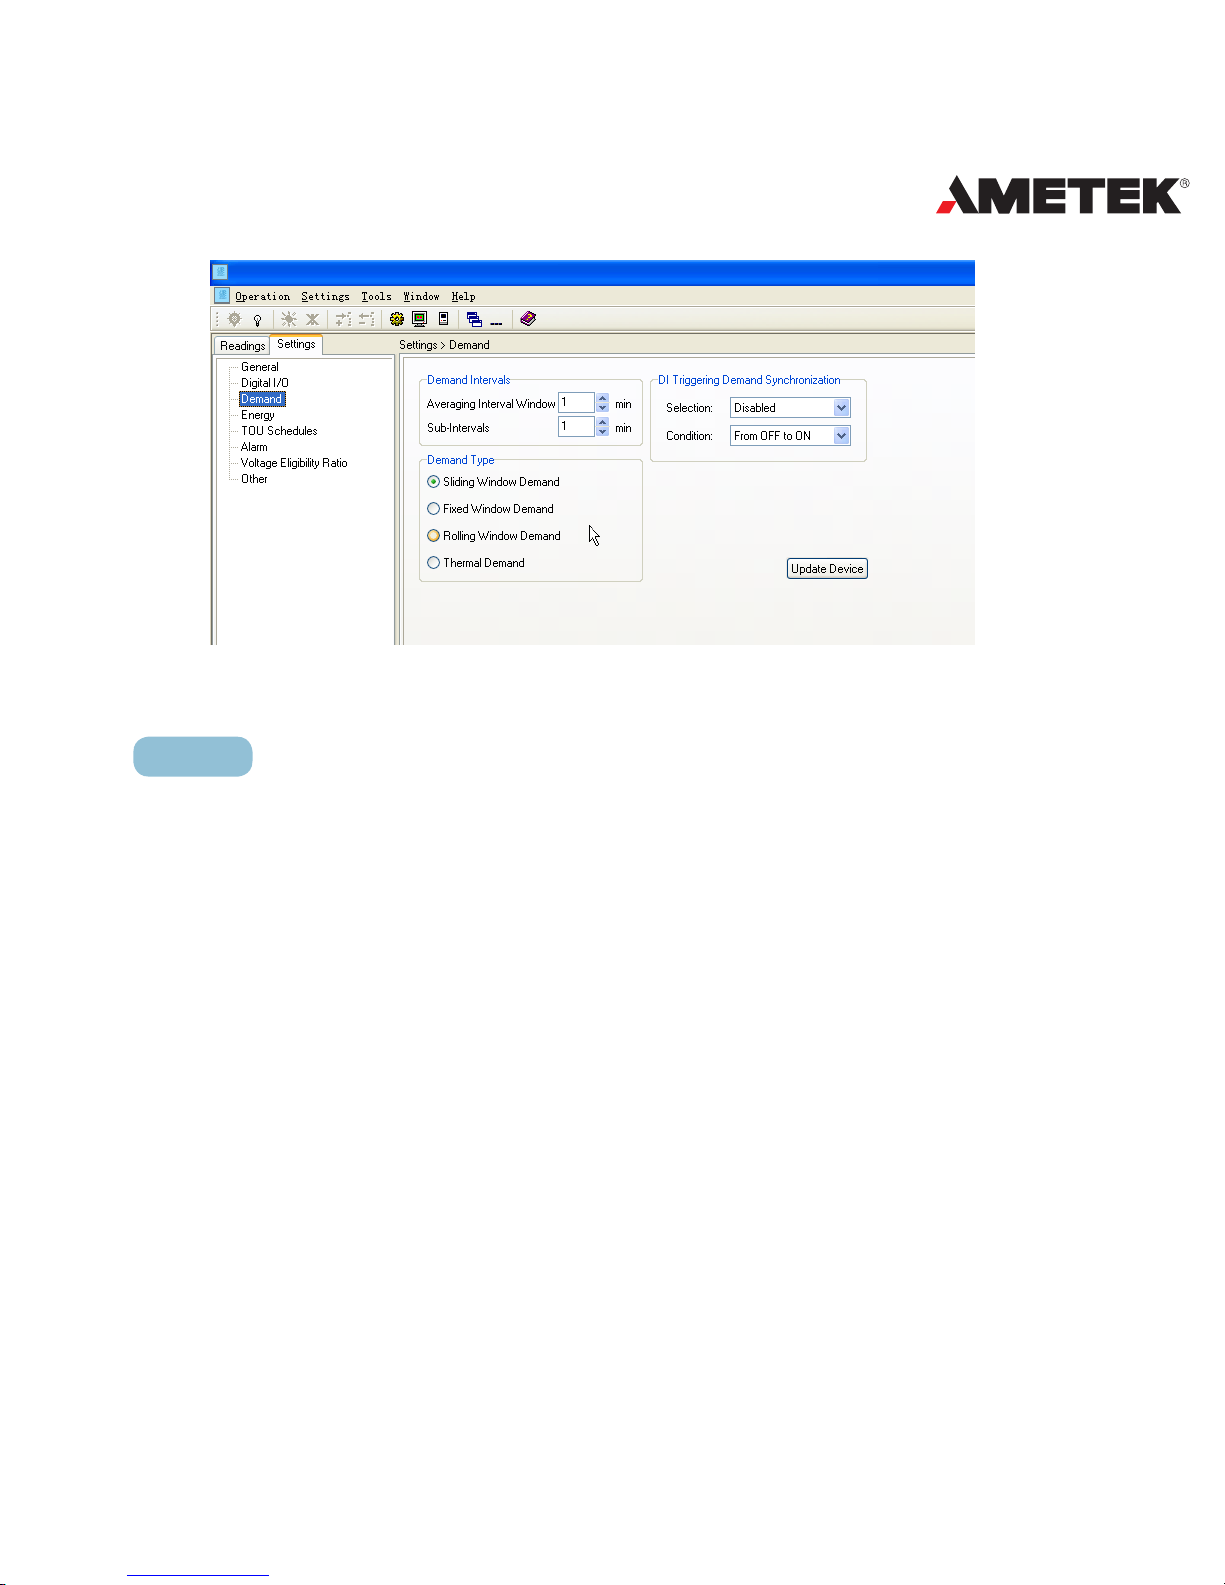
Demand calculating mode can be set as a sliding window, xed window,
rolling window or thermal demand according to the user.
In the sliding window interval, you select an interval from 1 - 60 minutes,
which is the period of the calculation. The demand updates every minute.
In xed window interval, select the period of the calculation as mentioned
above. The meter calculates and updates the demand at the end of each period.
In rolling window interval, you select an interval and a subinterval. The
subinterval should divide exactly by the interval. Demands update at the end of
each subinterval.
Thermal demand method calculates the demand based on a thermal
response which mimics the thermal demand meter. You select the period for the
Page 67

65
POWER INSTRUMENTS
calculation and the demands update at the end of each period.
Synchronization demand
When it is set as a xed window, rolling window or thermal demand, the
period can be synchronized via communication port or by changes of DI.
DI Synchronization demand
Changes to DI can trigger the synchronization of the demand period. The
set is as follows.
1. Select a method from xed window, rolling window or thermal demand.
2. Select a DI port (address is 1040H) as the trigger, the values are 0~4
corresponding to none and D1~D4.
3. Select the trigger mode of DI (address is 1041H), the values are 1~3
corresponding to from OFF to ON, from ON to OFF, triggering at any
change.
Command Synchronization demand
Using a broadcast command to synchronize the demand, calculation can
be set as follows:
1. Select a method from xed window, rolling window or thermal demand.
2. Broadcast command: the addresses of all the meters are considered 0.
Write ff00H to address 8000H using the 10H command. But the receiver
may not answer.
Note: All operations can only be finished via communication. Using key
functions can only partially nish them.
Page 68
66
DPMS XPQ User Manual
Here is an example:
Fig 4.7 Demand
Here is to set demand:
Page 69
67
POWER INSTRUMENTS
Fig 4.8 Demand Setting
Energy
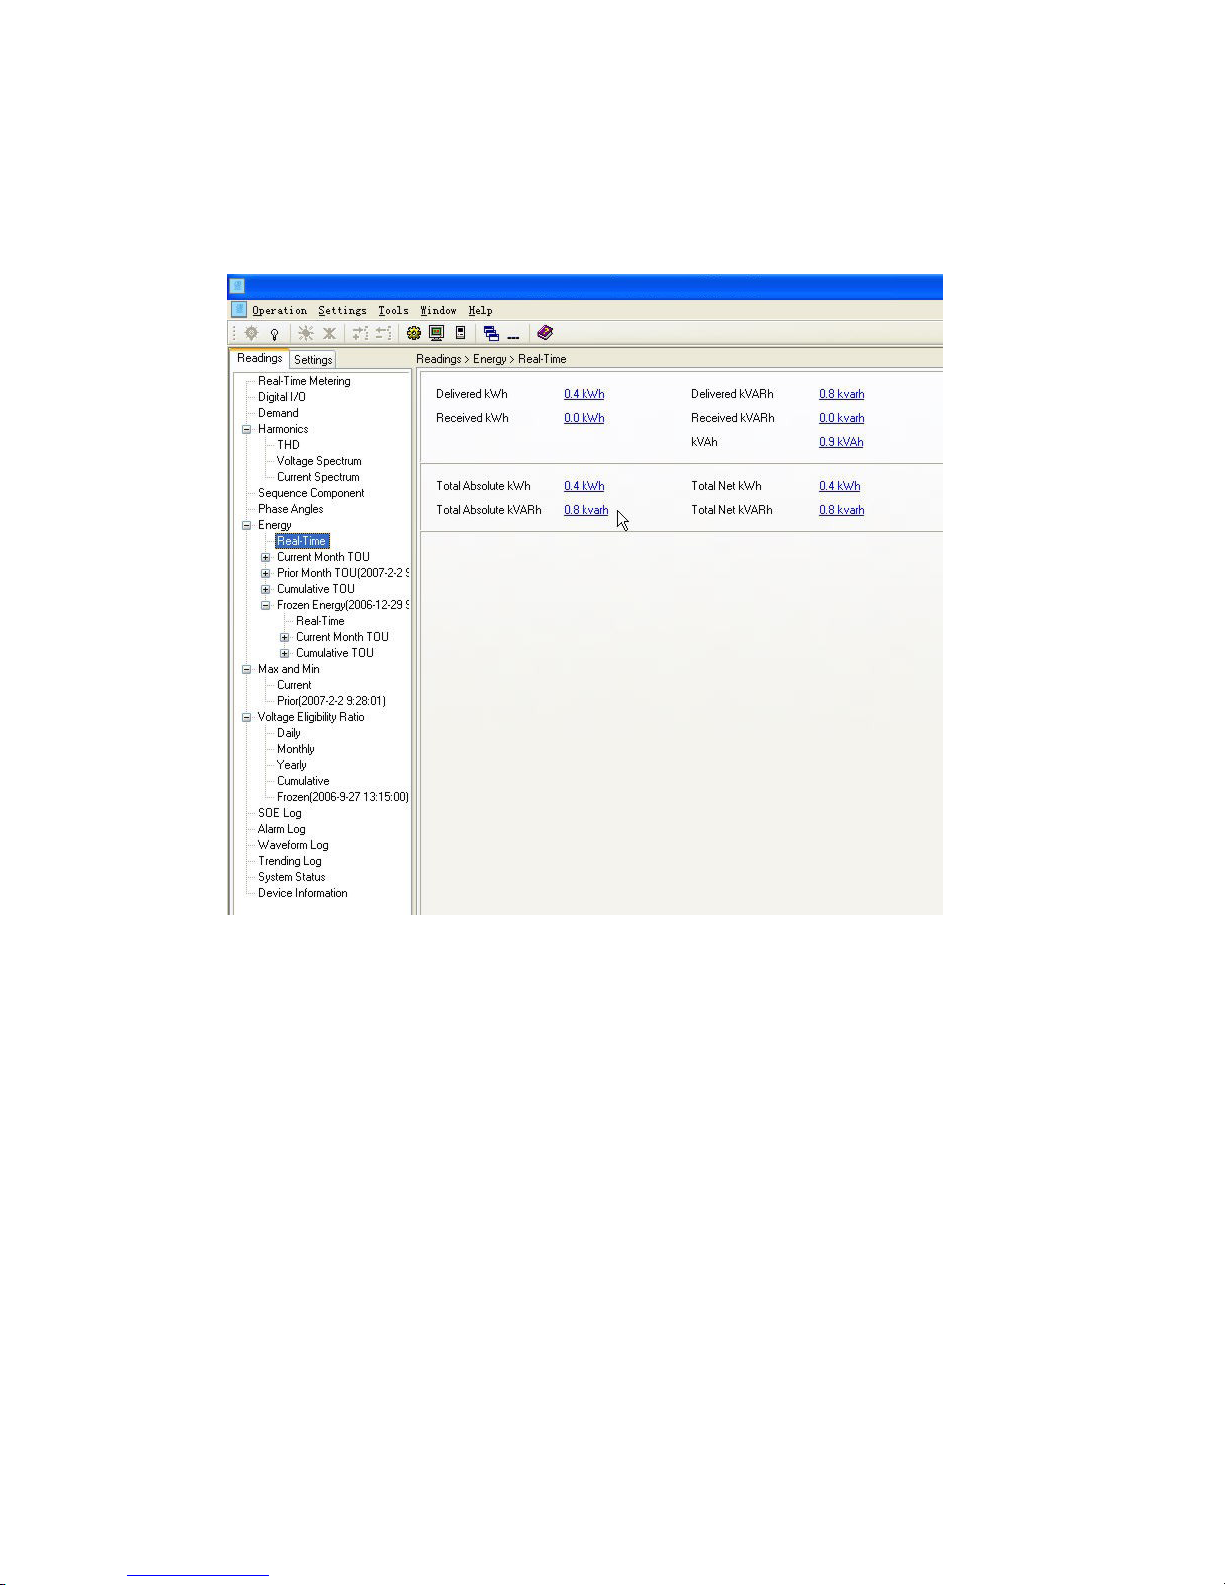
Various kinds of energy will be accumulated. The settings are explained in
other chapters, so please refer to chapter 3 and chapter 5 carefully.
Real time energy: the accumulation of energy for the kWh, kVARh and
kVAh since cleared last time.
Page 70
68
DPMS XPQ User Manual
Fig 4.9 Real-Time Energy
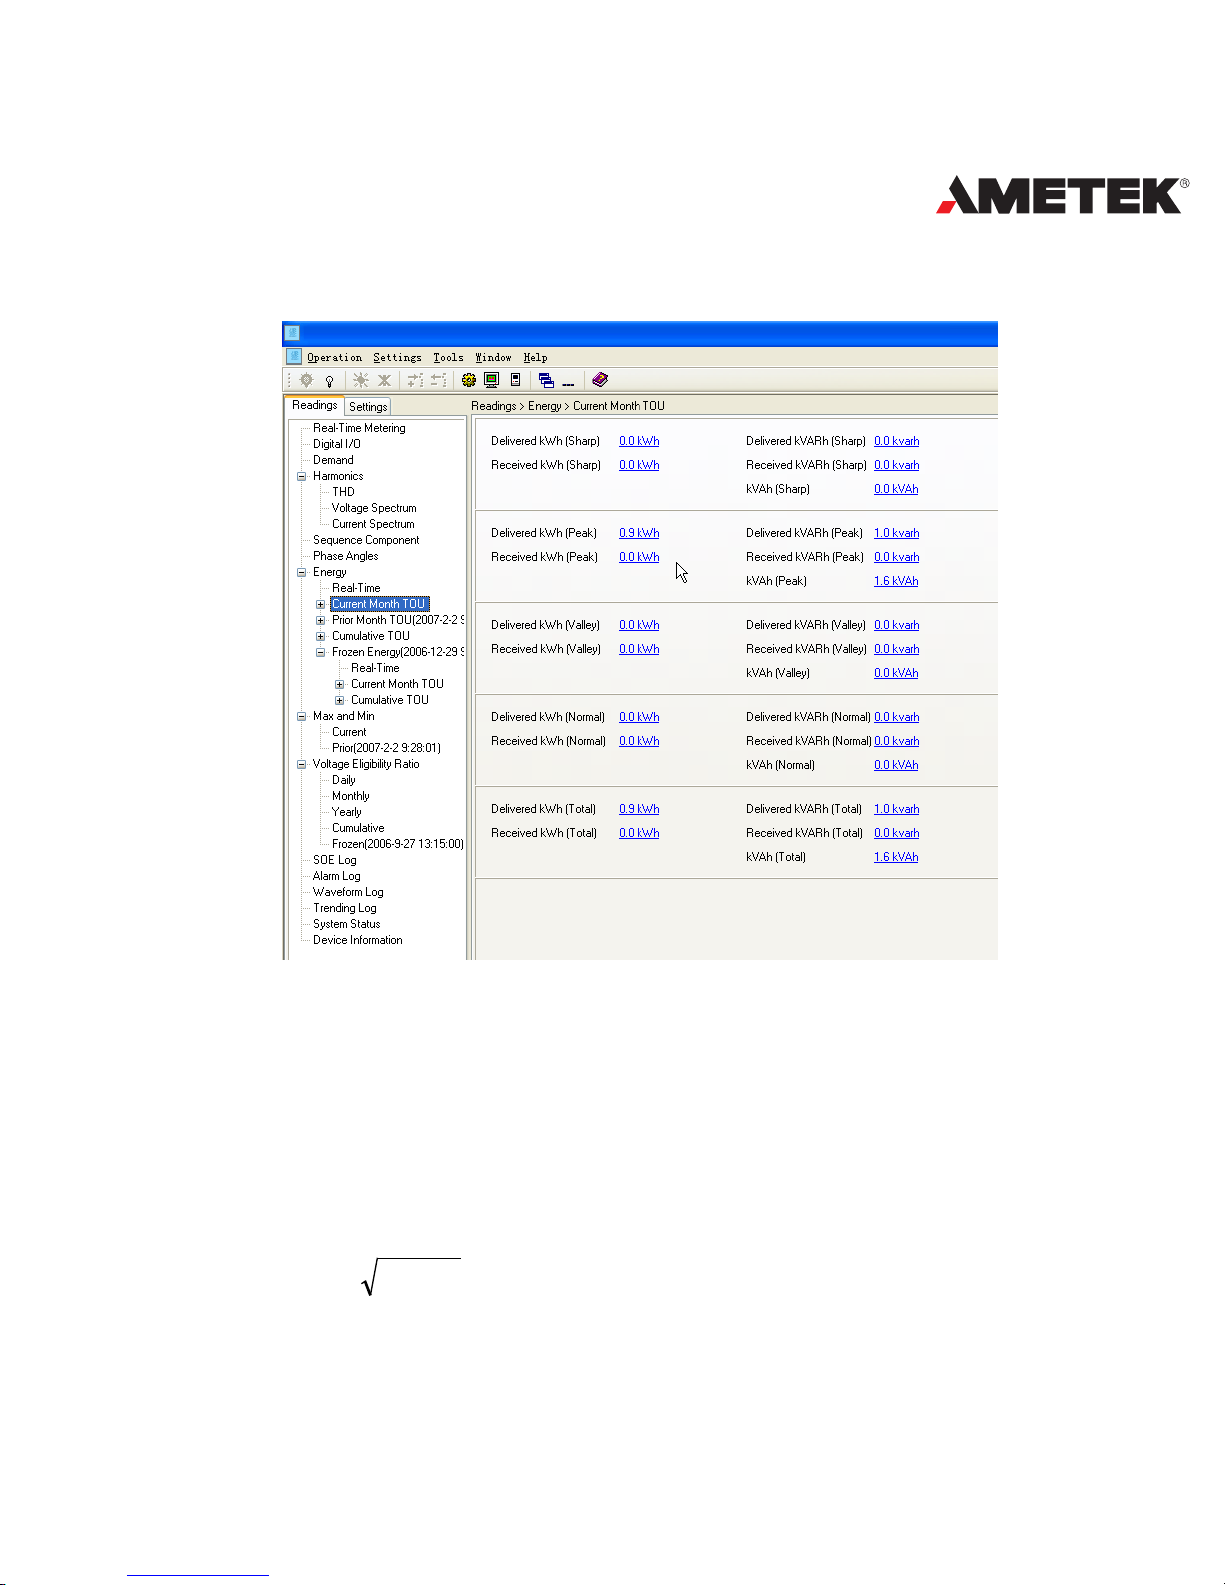
TOU
You can point some different time block to go with different rates (sharp,
peak, valley and normal). The meter will calculate the fee according to its inner
clock and the settings. So it charges different fees for different rates.
Page 71
69
POWER INSTRUMENTS
The following is an example:
Fig 4.10 Current Month TOU
Calculating mode
1. You can select calculating mode from a fundamental base or all-wave
base by pressing a key or via communication. Fundamental based calculating is
to accumulate energy ignoring harmonics while all-wave based calculating is to
accumulate energy including fundamental and harmonics.
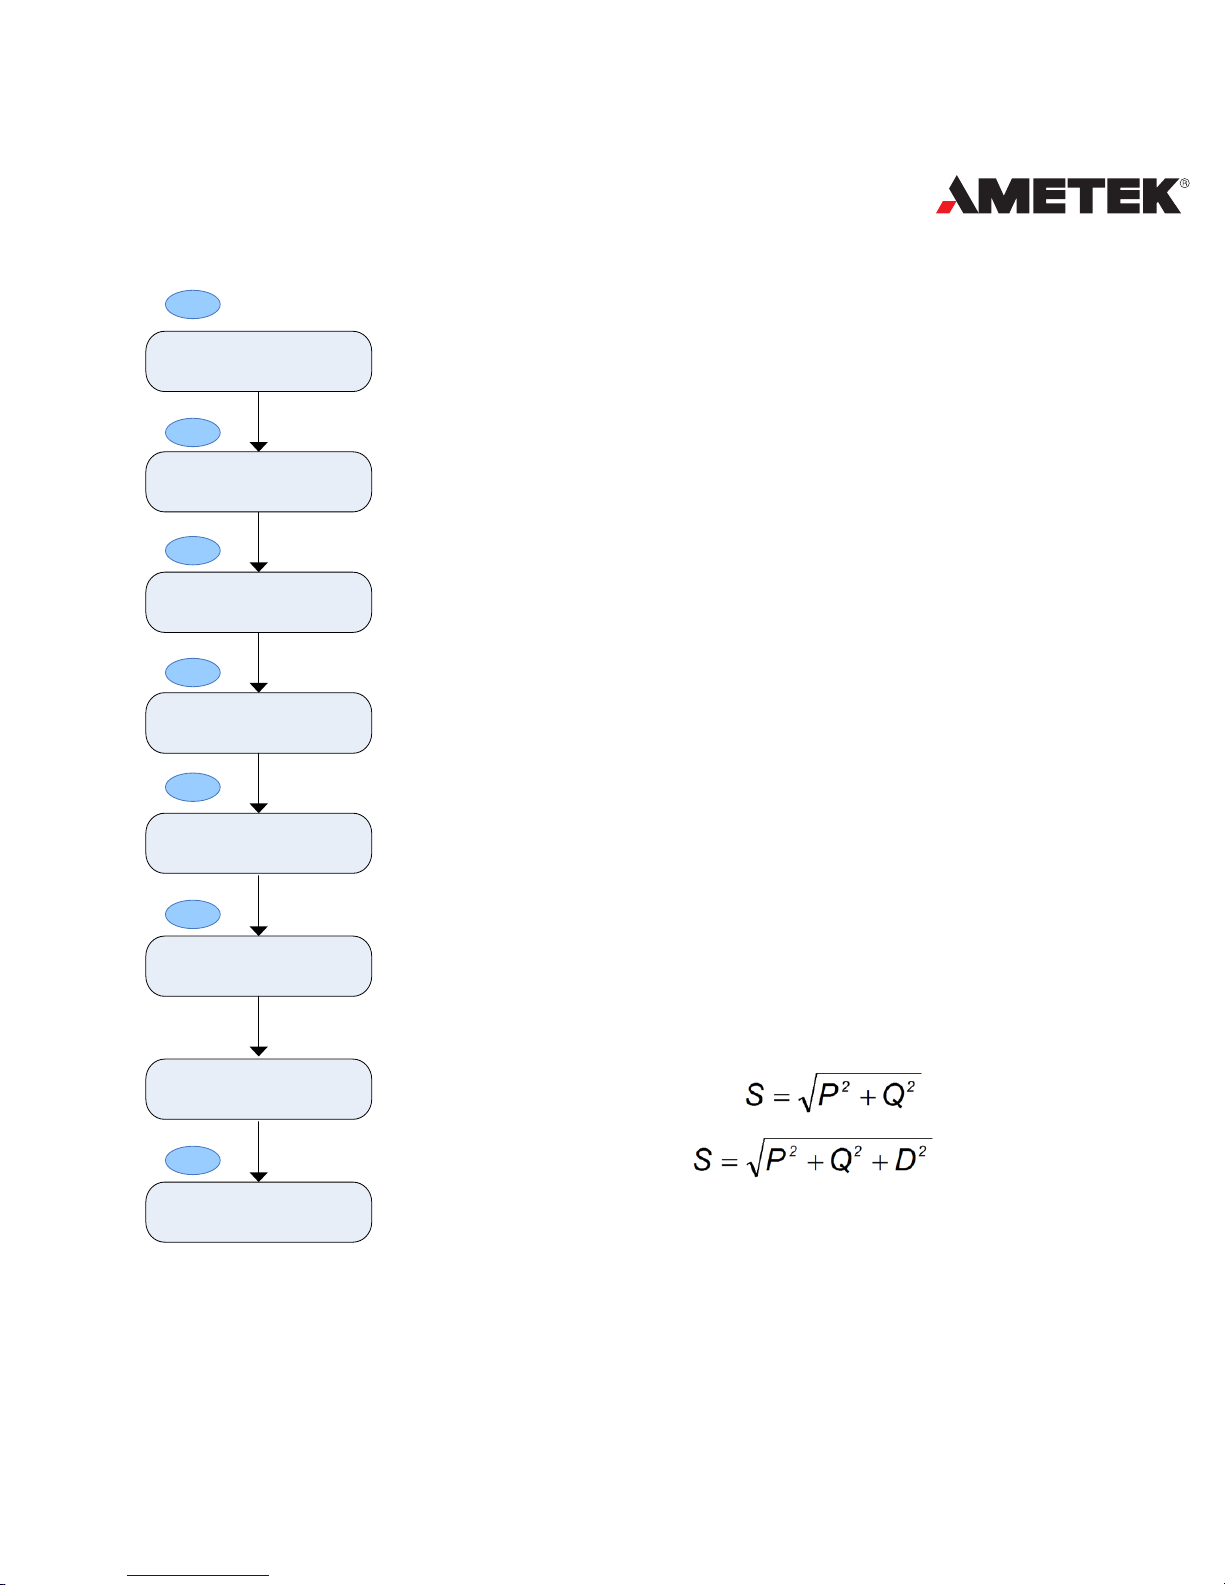
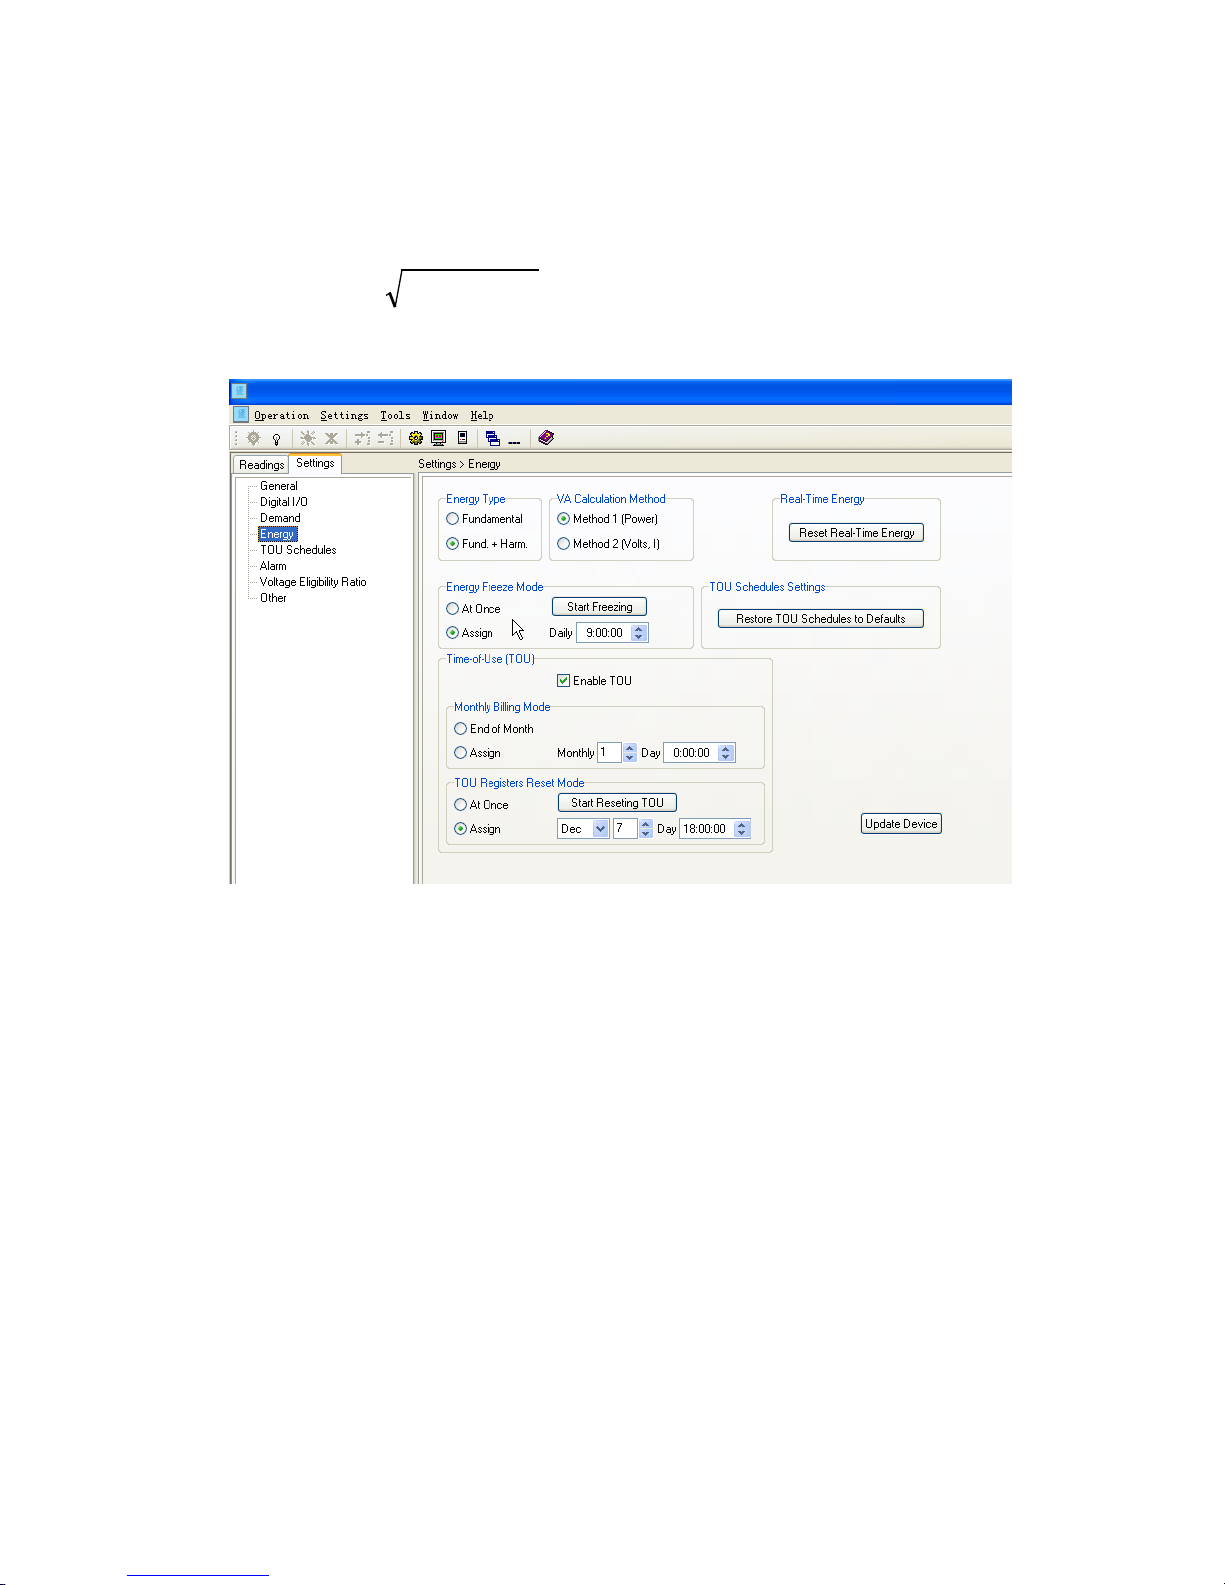
2. There are two ways to calculate apparent energy(power):
Mode 0:
Q
P
S
2
2
+=
Page 72
70
DPMS XPQ User Manual
Mode 1:
The following gure shows how to set it:
Fig 4.11 Energy Setting
Freezing
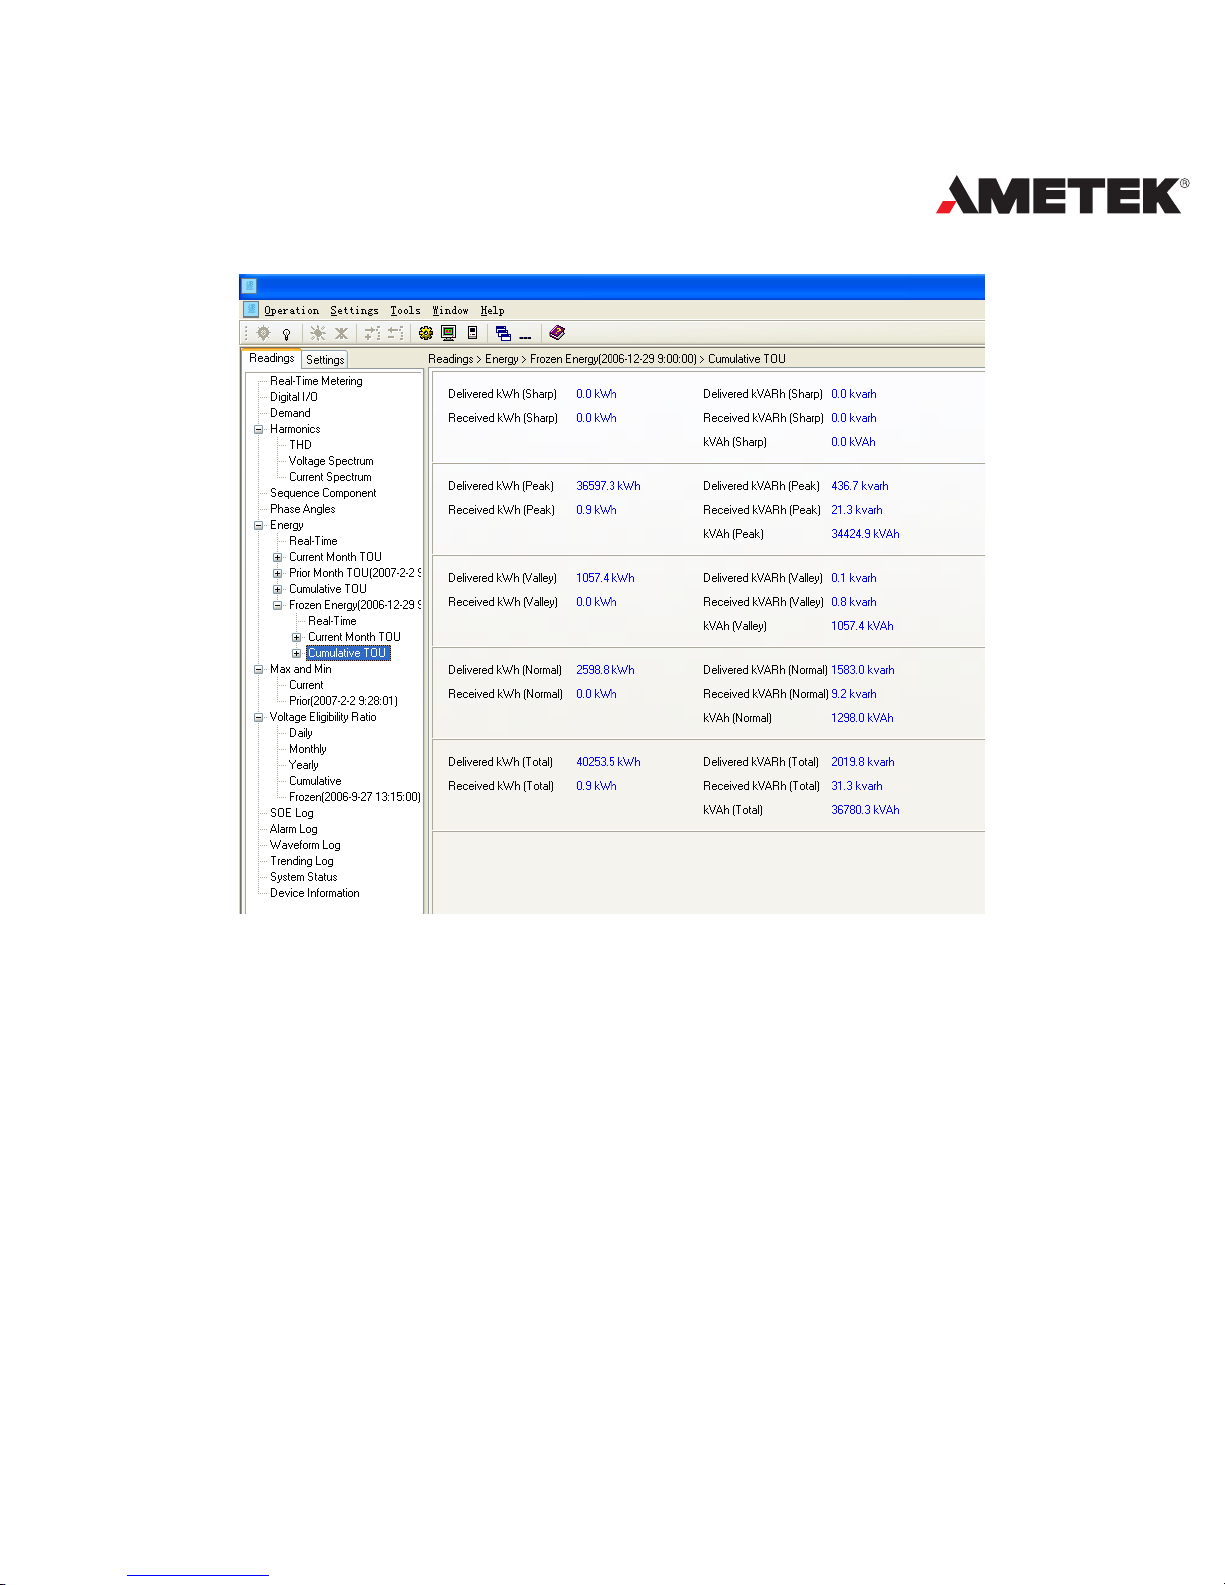
This is to backup the accumulated TOU, current TOU, and real time energy
at some time point without affecting the existing data.
You can use the freeze data for the statistic applications, with all the values
recorded at the same time, enhance the accuracy and efciency. Freezing can
be set automatically or manually making the application very exible.
Here is an example:
D
Q
P
S
2
2
2
++=
Page 73
71
POWER INSTRUMENTS
Fig 4.12 Cumulative TOU
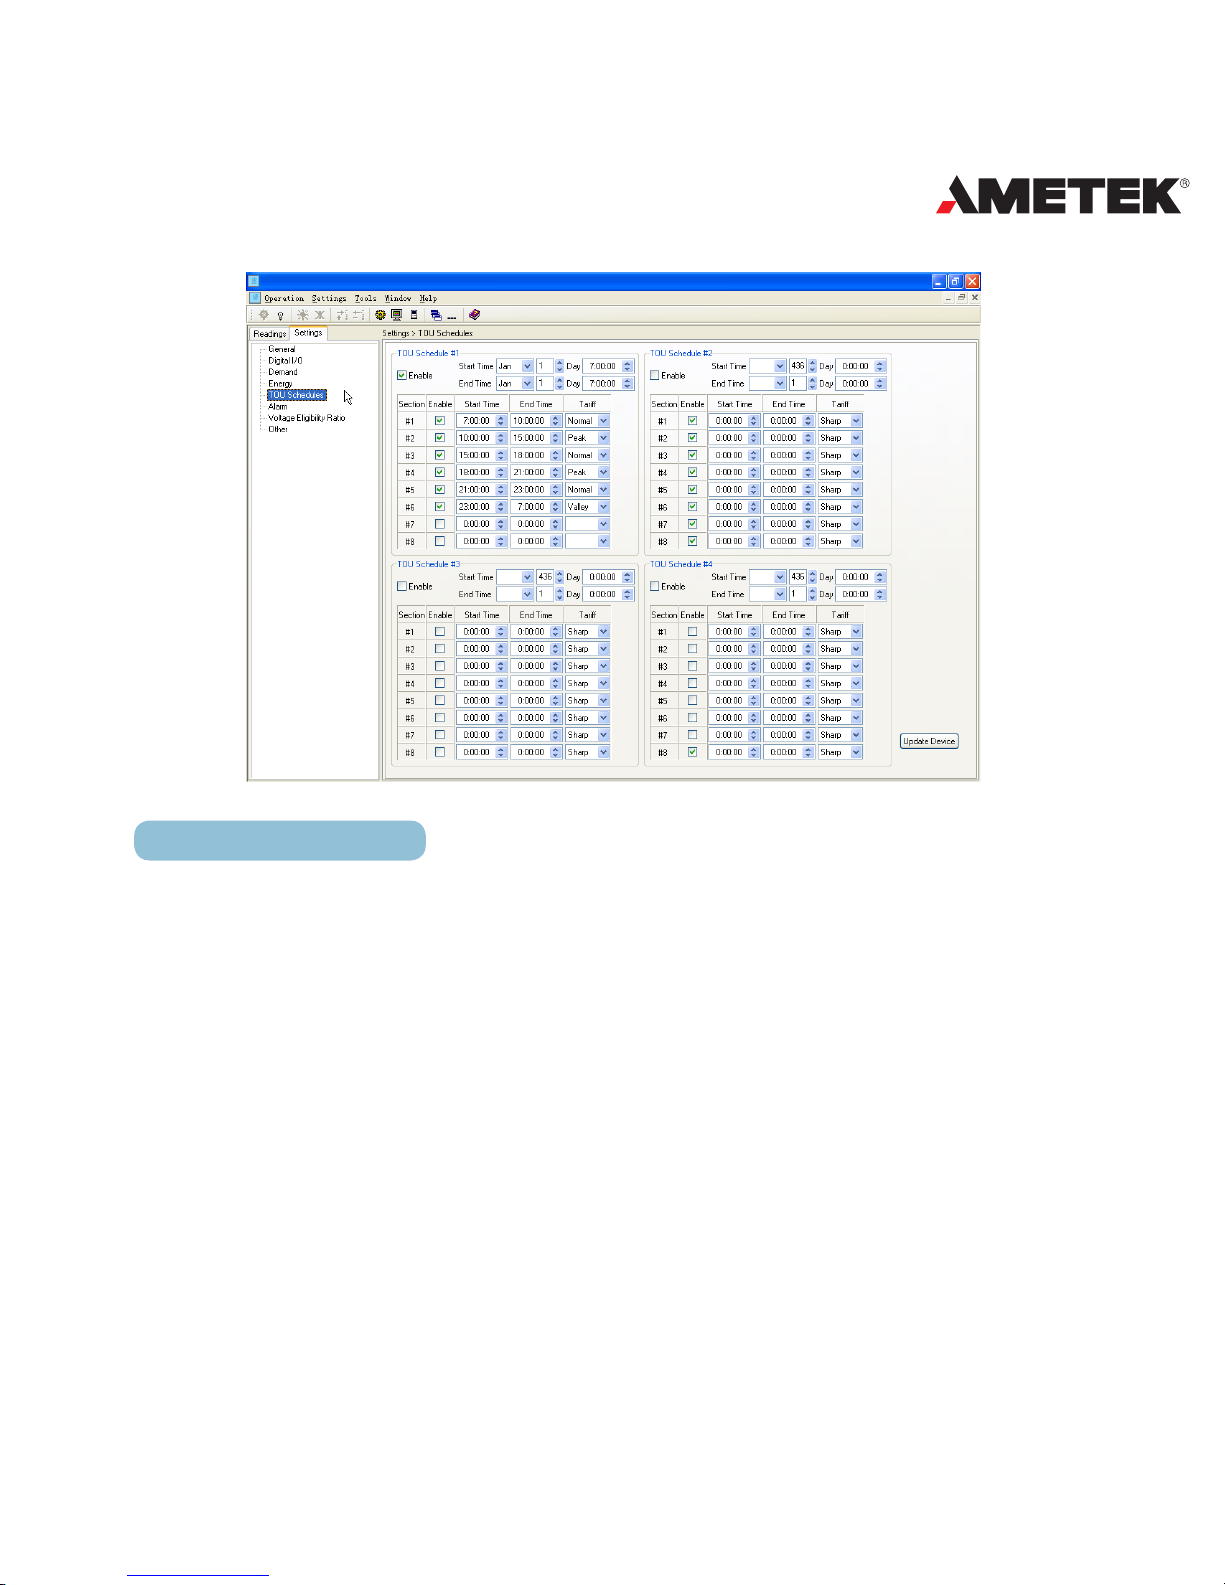
TOU calendar:
There are four schedules and each schedule has 8 time intervals. Each
interval can charge one of the four rates: sharp, peak, valley and normal.
Time format for each schedule is: enable | start time mm:dd:hh:mm:ss | end
time mm:dd:hh:mm:ss
Time format for each interval is: enable | start time hh:mm:ss | end time hh:
mm:ss | rate kind
Page 74

72
DPMS XPQ User Manual
You can adjust the calendar to satisfy different uses. To ensure the validity
of the calendar setting, the meter will check its rationality strictly. If there is no
mistake in the calendar and the TOU function is enabled, TOU accumulation will
begin.
Requirement of the time format:
1. Schedules must be selected in turn. For example, if you use two
schedules, you should enable the rst and then the second.
2. The sum of all schedules must be one year. For example, if you only
use schedules, the rst is from January 1st 03:03:03 to July 6th 02:02:02, the
second period must be from July 6th 02:02:02 to January 1st 03:03:03.
3. Start time of the next schedule must be the end time of the last schedule.
4. Schedules in use must be at least 1 and at most 4.
5. The record in use must be at least 1 and most 8 used in turn. If you use
3 intervals, you should use the 1st, 2nd and 3rd.
6. The sum of all time intervals in a schedule must be one day. For
example, 3 intervals are enabled, if the rst interval is from 03:03:03 to 12:02:02,
the second interval is from 12:02:02 to 02:03:03, then the third interval must be
from 02:03:03 to 03:03:03.
7. The next start time equals the last end time.
8. Many intervals can share the same rate.
Note: You can order special factory settings, the product has default settings.
You can reset the meter to default via communication or by key functions.
Here is an example:
Page 75
73
POWER INSTRUMENTS
Fig 4.13 TOU Schedules Setting
Pulse Energy Output
The two digital outputs can be used as energy pulse output and cannot
be used as the alarming outputs at the same time. The output energy can be
selected among all kinds of energy and reactive energy. Pulse constant and
pulse width can be set to meet your requirements. Pulse constant is the kWh
a pulse stands for, pulse width is the pulse duration. When the accumulated
energy reaches the pulse constant, there will be a pulse on DO.
Related parameters: pulse energy output ranges from 0 to 4 corresponding
to none, Ep_imp, Ep_exp, Eq_imp, Eq_exp.
Pulse constant ranges from 1 - 6000 (integer) with a unit of 0.1kWh (kVARh),
apparently that is the resolving power of energy output.
Page 76
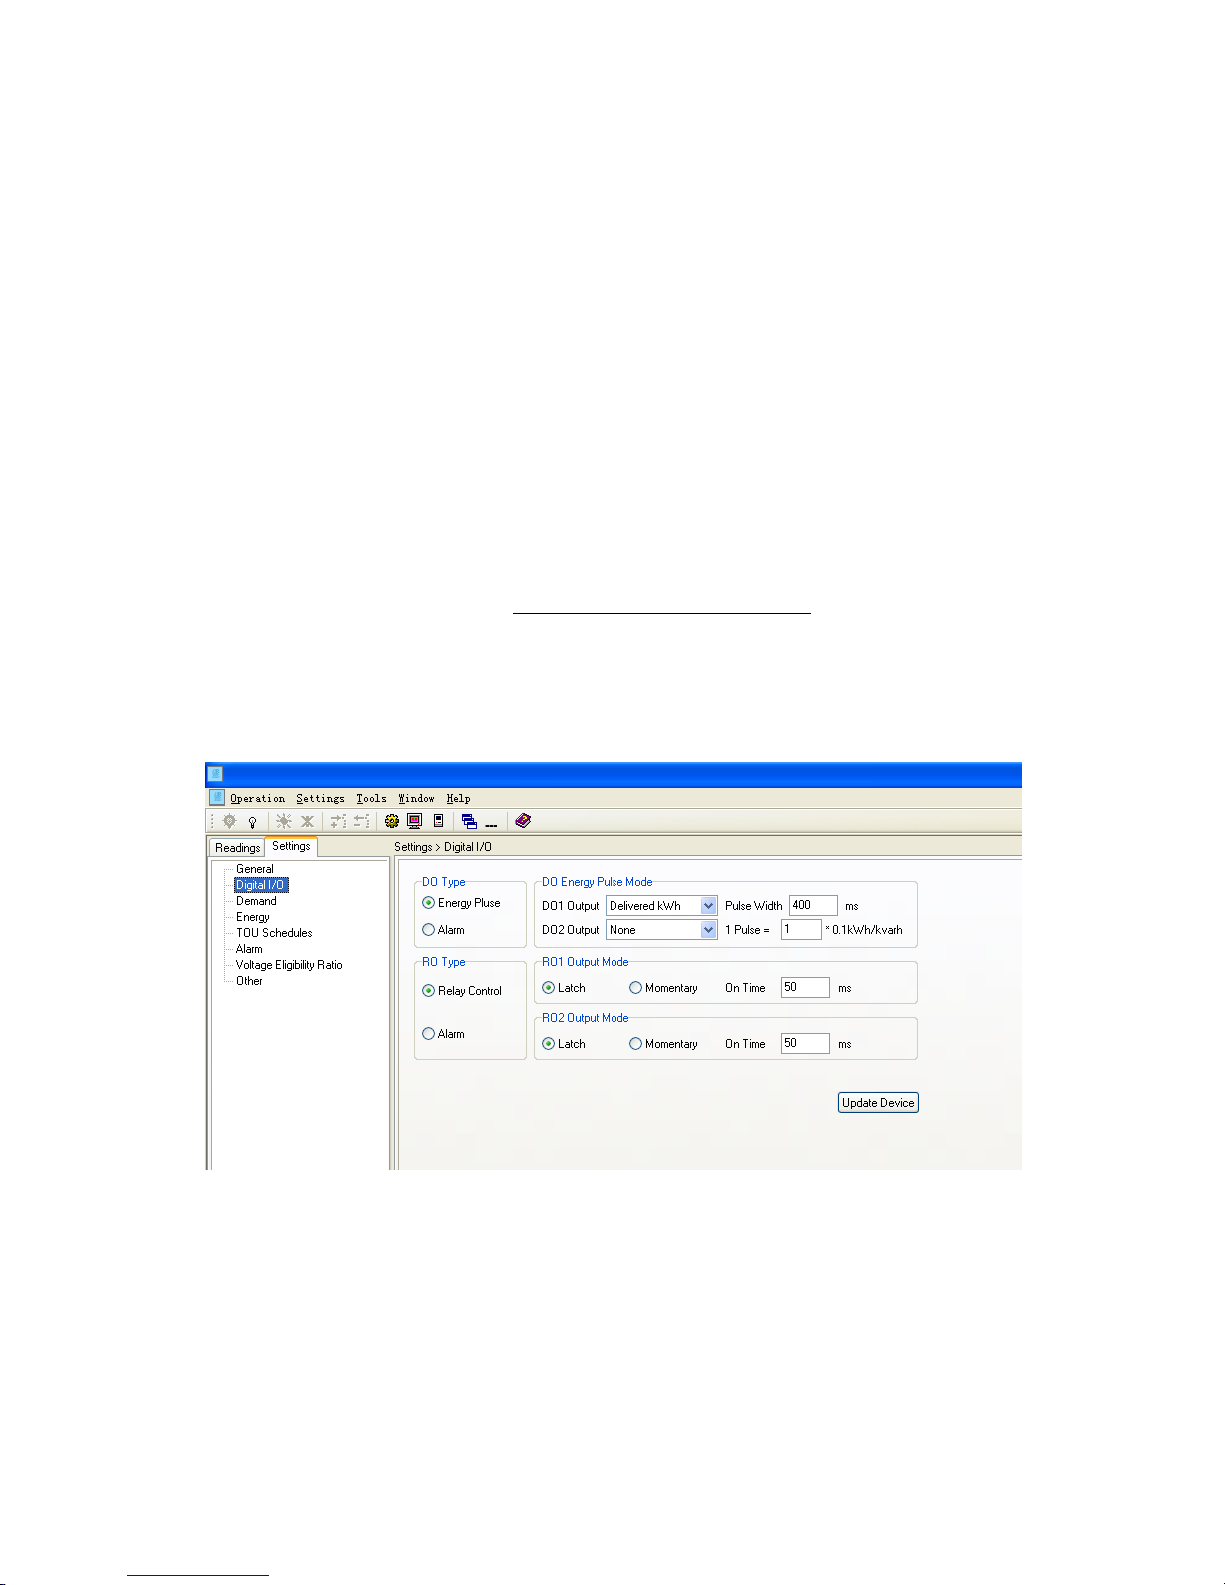
74
DPMS XPQ User Manual
Pulse width ranges from 1 - 50 (integer) with a unit of 20ms. The narrowest
interval between two pulses is 20ms.
In practice the pulse width and the pulse ratio are selected according to
system power. The relation of the two parameters should be satisfied by the
following expression,
In the expression, the Pmax is the maximum power or reactive power. The
unit is kW or kVAR. Recommend pulse ratio is 3 to 5 times the right side value
of the above expression.
The related settings are:
Fig 4.14 Digital I/O Setting
18000000
Pmax) 1 width pulse (
radio Pulse
×+
>
Page 77

75
POWER INSTRUMENTS
Event alarming
When the metering data is over the pre-setting limit and over pre-setting
time interval, the over limit alarming will be picked up. The over limit value and
time will be recorded and the maximum number of records is 16. The digital
output (DO) and RO1, RO2 can be used as a trigger to light or sound alarming.
Alarming can also trigger waveform capturing.
Application and settings of event alarming:
In order to use the event alarming function, you should finish all the
settings (equation or in equation or enable switches) correctly, or it will fail. All
the settings are to write their corresponding registers via communication.
1. Alarming setting
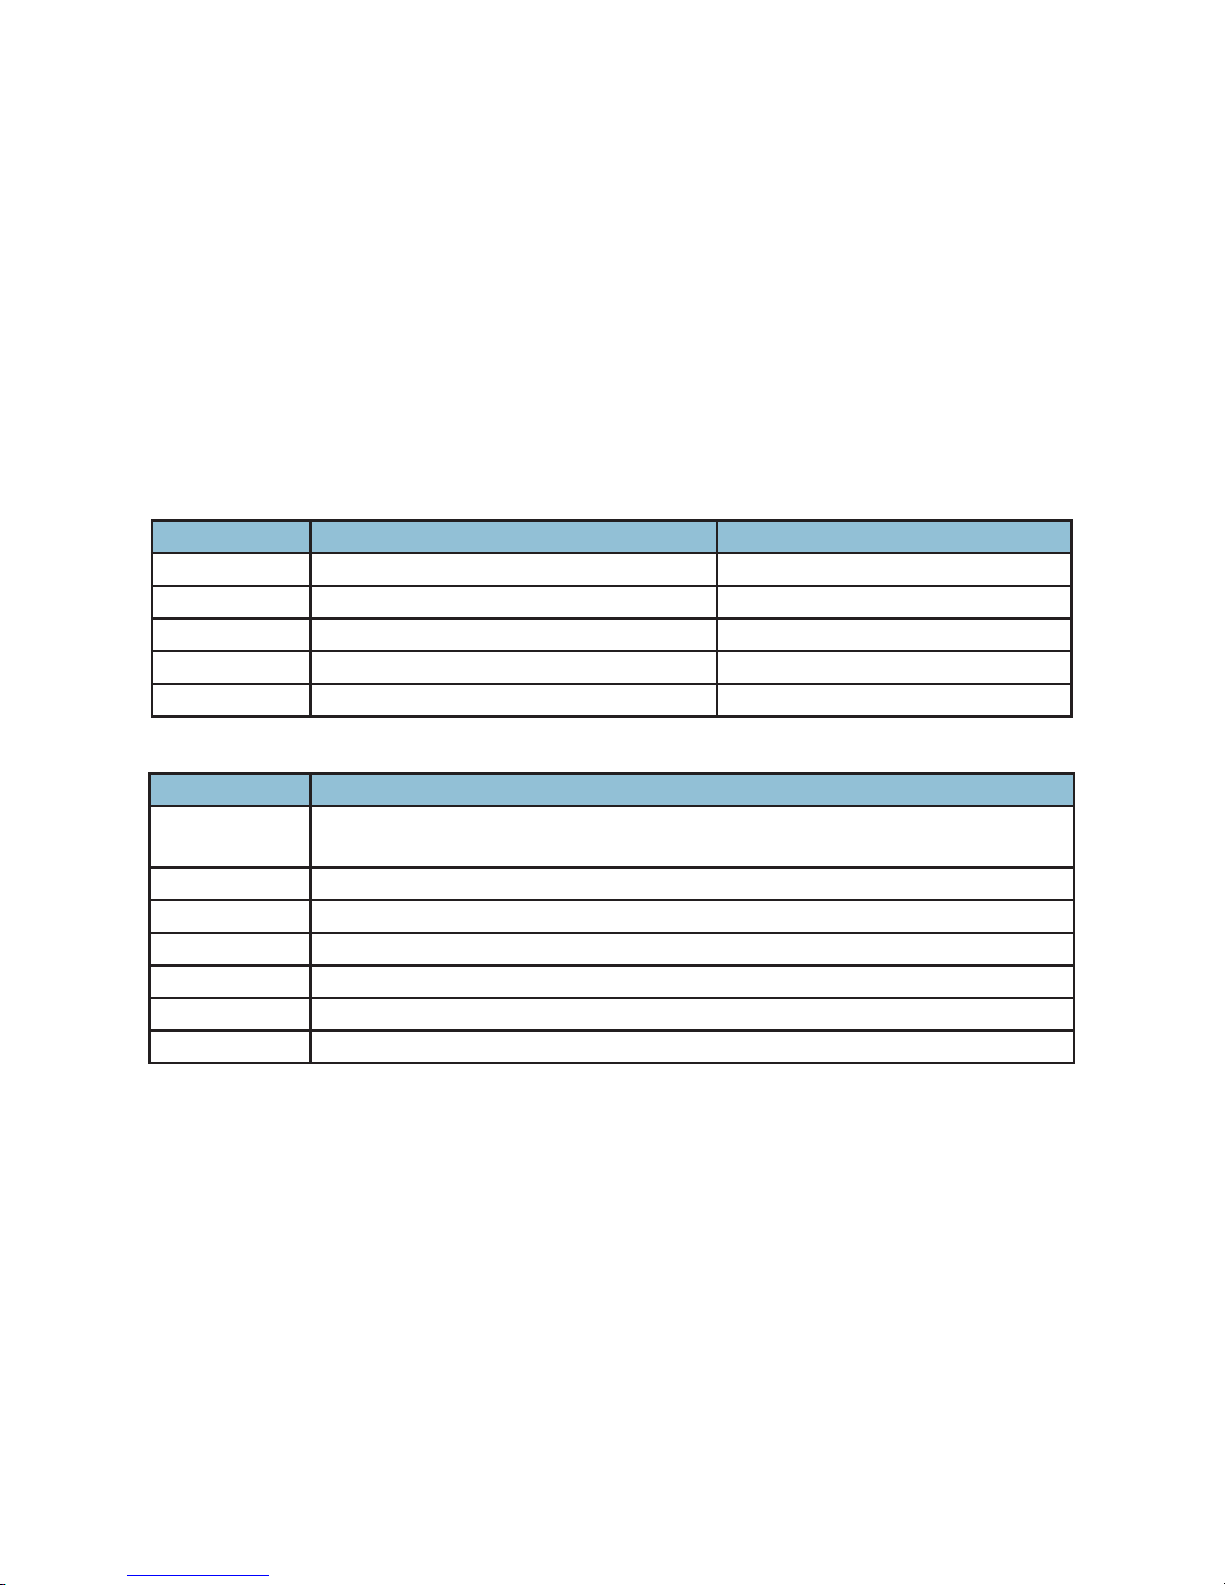
Table 4-1 indicates a group of settings, there are 16 groups in all with the
same format. Parameter is the main body. There are 247 parameters in all as
shown in table 4-2.
We use the serial number instead of its parameter to nish the settings, the
serial number will be stored in the rst storage unit of every group.
What is most important is parameter, so we can calculate some equations
or in equations to get the goal. For example, if we want one event of frequency
equaling to 50 Hz, we set: serial number: 0; comparison mode: 2; setting value:
5000.
Special attention: “setting value” corresponds to main parameter, the
relationship between its value and real physical value is the same as the main
parameter.
Page 78
76
DPMS XPQ User Manual
“Delay time” indicates the time period that the event keeps happening after
the setting equation or in equation is satisfied, which is used to confirm the
event. Its value ranges from 0 - 6000 (integer) with a unit of 10ms. There is no
delay when it is set to be 0, so the event triggers alarming at once. For example,
if it is set to be 20, delay is 20*10=200ms. “Waveform triggering” refers to
whether waveform capture works when the set event occurs.
address parameter range
14F0H First group: serial number 0~246
14F1H First group: comparison mode 1:more,2:equal,3:less
14F2H First group: setting value Related with parameters
14F3H First group: delay time 0~6000(*10ms)
14F4H First group: waveform capture 1:capture; 0:not capture
Table 4-1 rst group of alarming settings
Serial number parameter
0~32 33 basic analog measurements parameters from“Frequency” to
“Loadcharacteristic” discussed in chapter 5.
33~241 209 parameters from “THD_V1” to “K Factor of I3” discussed in chapter 5.
242 Consumption energy predict demand
243 Generation energy predict demand
244 Consumption reactive energy predict demand
245 Generation reactive energy predict demand
246 Apparent energy predict demand
Table 4-2 parameters for alarming
Thus far, the equations or in equations are nished, but the setting are not
nished yet, we have to go through the following steps to nish them.
Page 79

77
POWER INSTRUMENTS
2. Global settings
The addresses of all global variables are 101dH~1024H and 103dH in
system parameters discussed in chapter 5. “Alarming enable” determines
whether the alarming function of this meter works. Only when it is set as “1”,
the alarming function enables. When “Alarming ash enable“ is set to “1”, the
backlight will ash when an alarm happens.
“Alarming records enable setting” determines whether it records. There are
16 records in all and each one corresponds to one bit of a 16-bit register. For
each record, it works or not depending on the enable setting. If some bits of the
register are “1”, it means their corresponding records take effect.
“Relay for alarming setting”: There are two relays. They can be used as
remote controlling output and alarming output. But one can’t work in two modes
at the same time. “1” means the relay works in alarming mode and “0” for
remote controlling mode. This setting is valid for both relays.
“Alarming output to RO1 setting”: when “Relay for alarming setting” is set
to be “1”, the relay is available for alarming, but which record it will be driven by
and whether output to RO1 or RO2 will depend on other settings. This setting
will give an answer. There are 16 records in all and each one corresponds to
one bit of a 16-bit register, when the corresponding bit is set to “1”, the relay
will close if the alarming condition is satised. It opens only when all the alarms
related to RO1 recover. If the corresponding bit is set to “0”, RO1 will not be
disturbed.
Note: When the relay is used in alarming mode, it works in latching mode. There
is no pulse mode. So all setting of the relay's working mode will be ignored.
Page 80

78
DPMS XPQ User Manual
“Alarming output to RO2” decides which alarm will be output to RO2. It is
set the same as RO1.
“Alarming output to DO1 setting”: When “Digital output mode” is set to “1”,
DO1 can be used as an alarming output. Which alarm will be output to RO2 is
set here. You need to do the same as what you do in setting RO1.
“Alarming output to DO2 setting”: The same as “Alarming output to DO1
setting”.
“Logical and between alarming setting”: The 16 alarming records are
divided into 8 groups. Each group has two records. The two alarms can be
logically “and” by controlling the logic switch. When two alarms are logically “and”,
the alarming works only when both are satisfied. If the switch is off, the two
alarms work independently.
The 8 groups are arranged as follows: according to their serial number, the
1st & 2nd make the 1st group as group A; the 3rd & 4th make the 2nd group as
group B; The 5th & 6th make the 3rd group as group C; 7th & 8th make the 4th
group as group D; 9rd &10th make the 5th group as group E; 11th & 12th make
the 6th group as group F; 13th & 14th make the 7th group as group G; 15th &
16th make the 8th group as group H.
This function is controlled by the low 8 bits of a 16 bits register, each bit
corresponds to a group. “1” means this function is turned on and “0” means off.
After finishing the previous settings, the alarming function is turned on.
We’ll show you an example of how to use the logical “and” in a group.
We set an event as follow: I1 greater than 180A, delay 5s for the 1st record;
U1 less than 9980V, delay 10s for the 2nd record. No waveform triggering,
Page 81

79
POWER INSTRUMENTS
no output. The CT primary value of I1 is 200A. The primary voltage of U1 is
10000V, PT2 is 100V. Then let’s look how all the related registers are set.
The rst record:
According to the table, the serial number of I1 is 9 ((14d8H)= 9); Conditions
in equation 1 determine the high limit. So “comparison mode” (14d9H) = 1(>).
CT1 is 200A, according to the relationship between the communication value
and numerical value. I=Rx X(CT1/5)/1000, so I1 is 180A. Then the limit is (14daH)
= 4500; Delay 5s, as the unit of Limit_t register is 10ms, so the delay time is
(14dbH) = 500; Alarming but no waveform triggering, “waveform capture” (14dcH)
= 0.
The second record:
According to the table, the serial number of U1 is 1 ((14ddH) = 1);
Conditions in equation 1 determine the low limit. So “comparison mode” (14d9H)
= 3(<); PT1 is 10000V, according to the relationship between the communication
value and numerical value, U=Rx X (PT1 / PT2) /10, so the register value should
be 998; Delay 10s, as the unit of Limit_t register is 10ms, so the delay time is
(14e0H) = 1000; Alarming but no waveform triggering, so “waveform capture”
(14e1H) = 0.
Settings between the two records:
“Alarming output” of the 1st, 2nd(101fH) = 0x0003; No hardware output,
(1020H)=0; (1021H)=0;(1022H)=0; (1023H)=0; logical and(1024H)=0x0001; At
last, the” alarming enable”, (101dH) =1.
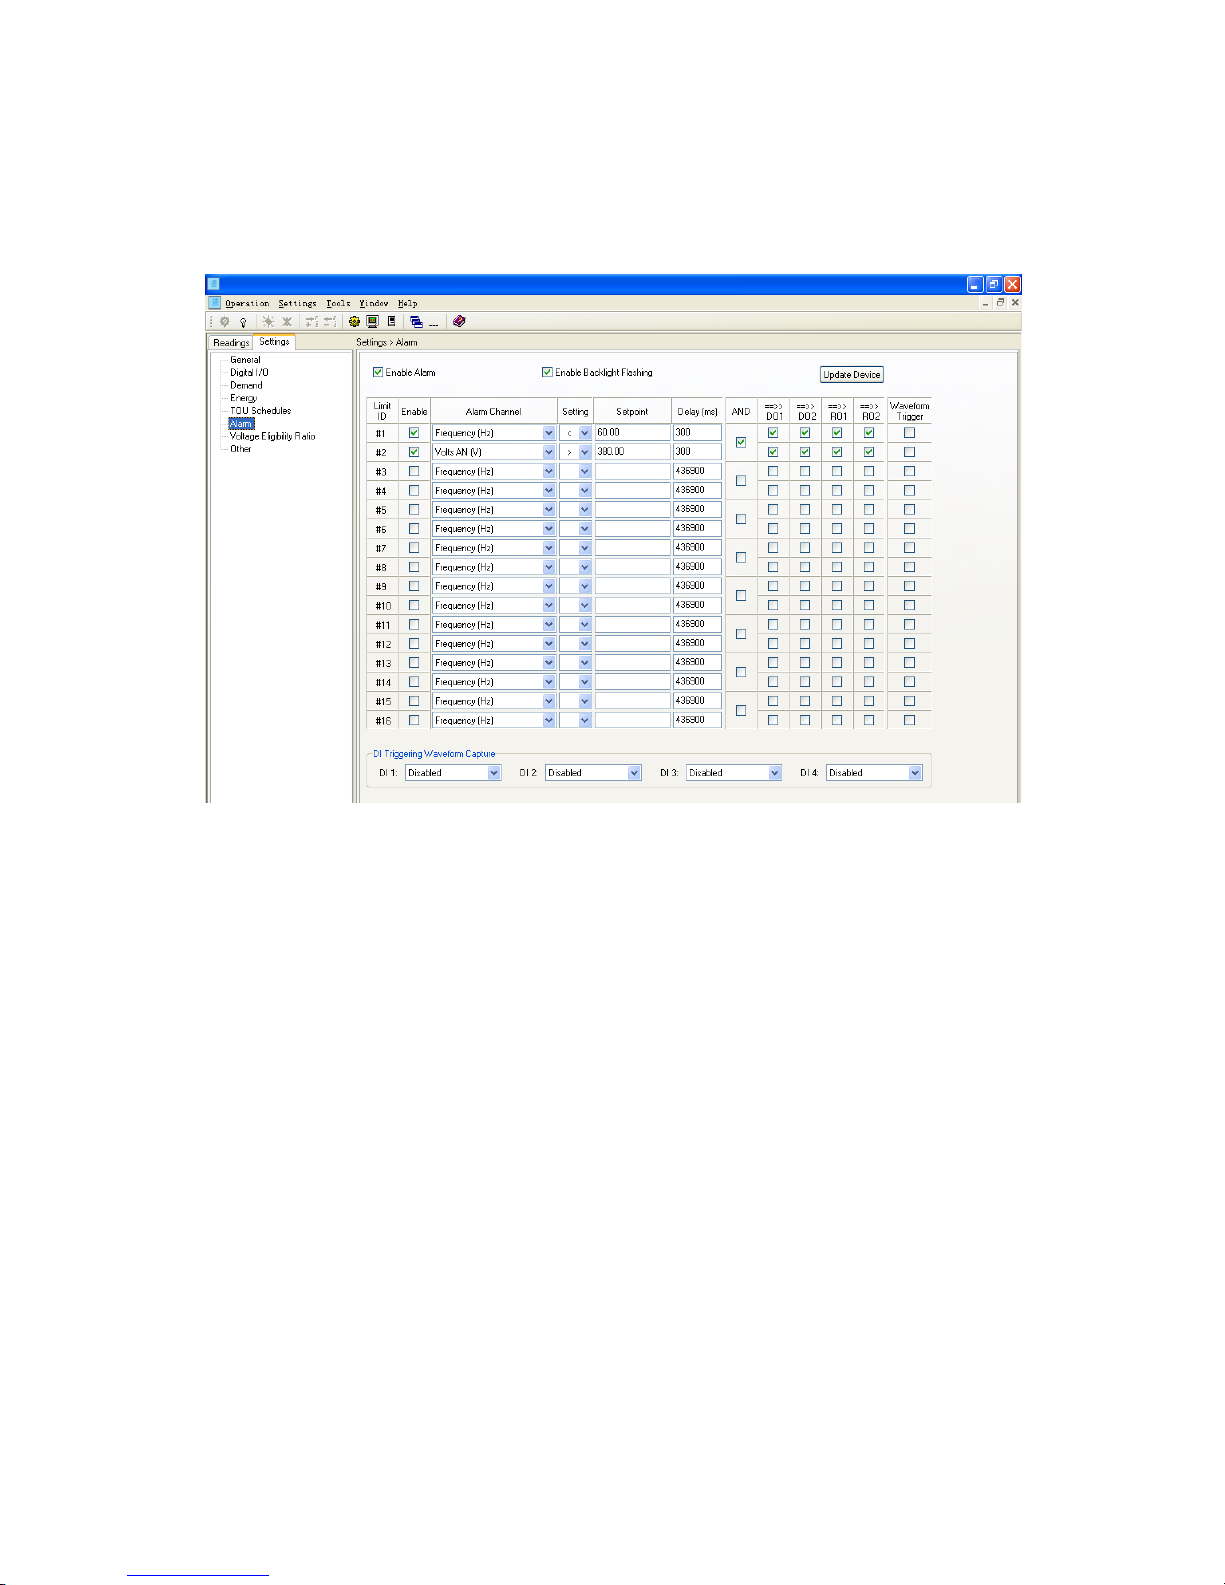
Here is a gture showing the alarming settings:
Page 82
80
DPMS XPQ User Manual
Fig 4.15 Alarm Setting
Event alarming setting
There are 16 of records to be stored. But they are not corresponding to
setting records, they record in cycle. The latest event will cover the oldest one.
It begins from the 1st record when the power is turned on. When over range
parameters resume to normal, the time and value will be recorded as an event
as well. So you can work out the continuous time of over range by checking the
changing time.
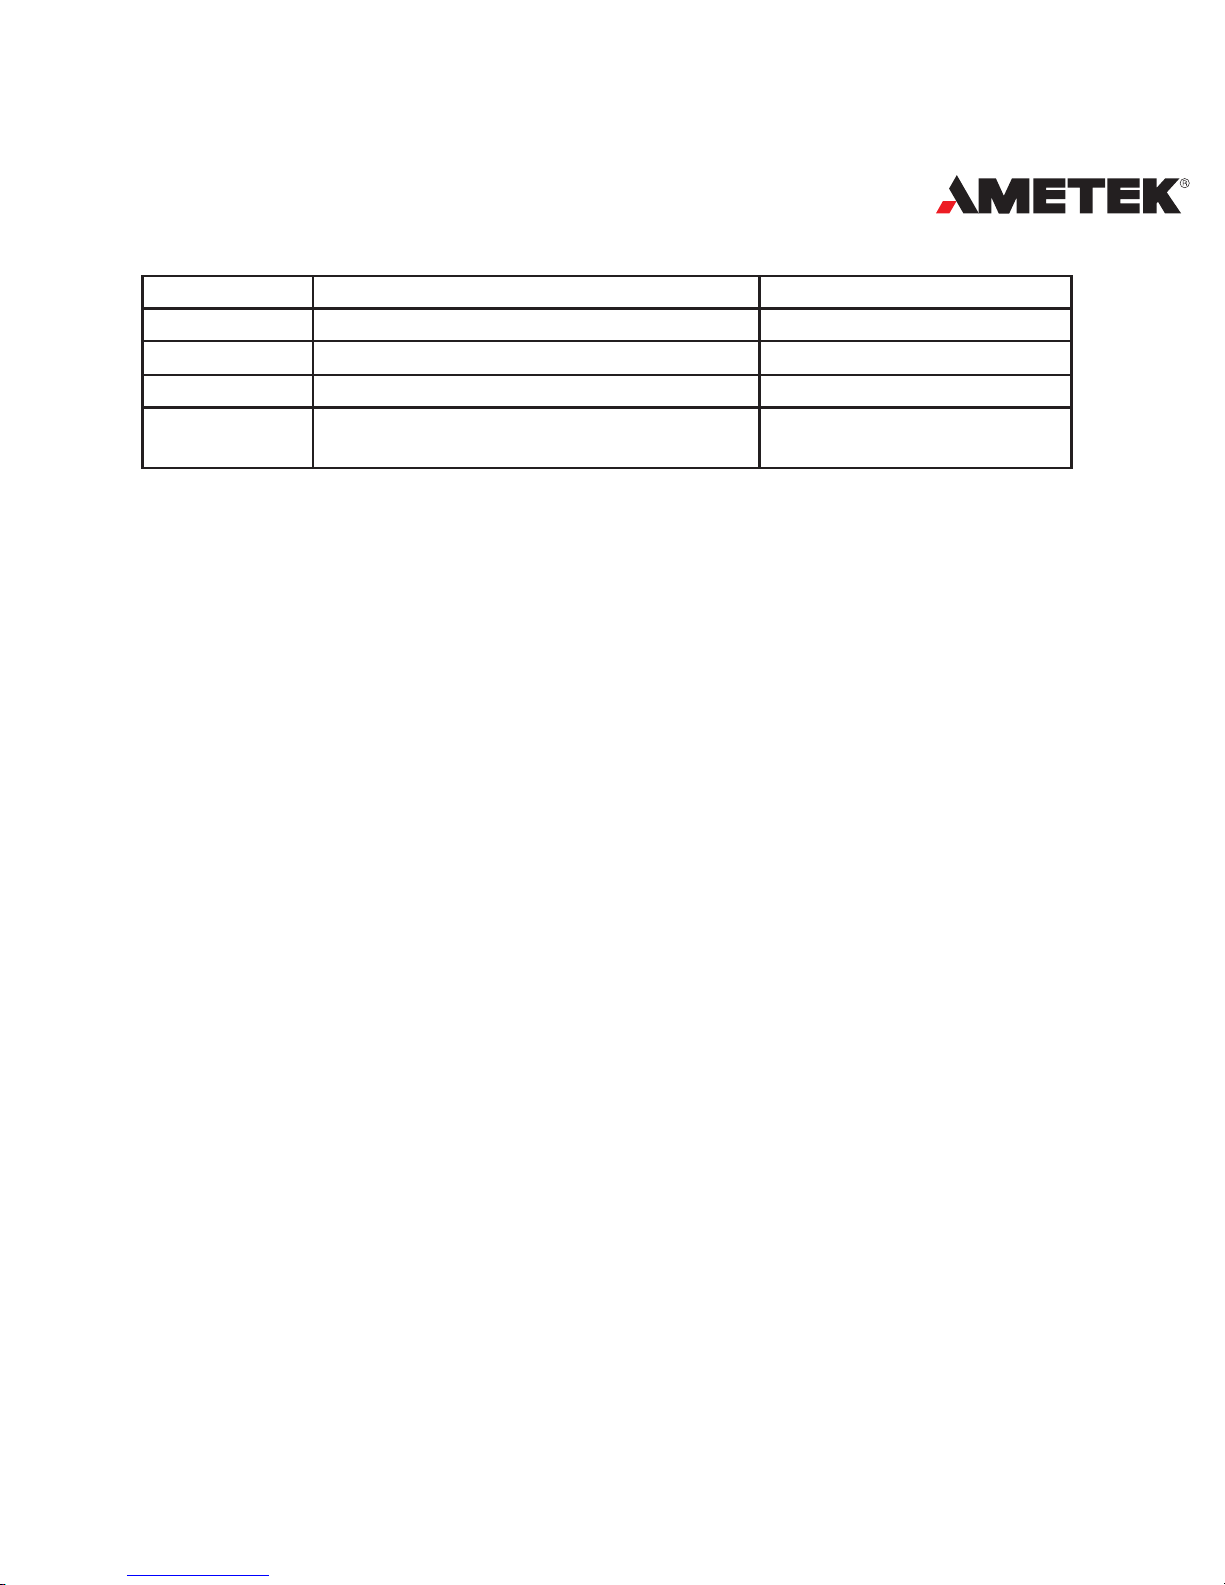
Here is the 1st record. Other records have the same format.
Page 83
81
POWER INSTRUMENTS
address parameter range
1540H First group: alarming status 0~65536
1541H First group: parameter number 0~246
1542H First group: over range or reset value Related with parameters
1543H~1549H First group: occur time: yyyy mm:dd:hh:
mm:ss:ms
time
Table 4-3 alarming status of the 1st record
“alarming status” indicates information of the current status. It is a 16-bit
unsigned integer. Serial number is stored in the high 8 bits. Bit1 indicates logical
and.
Bit1=1,yes; Bit1=0,no. Bit0 indicates alarming is to setup or to recover.
Bit0=1, setup; Bit0=0, recover. Undened bits are 0.
“Serial number” indicates which parameter is recorded.
“Value” indicates alarming limit value.
“Time” indicates the time with accuracy of ms.
Alarming event will set bit2 of “system status” to 1. At the same time,
corresponding ags will be set to 1 to indicate new data. It should be cleared
after the controller has read the data, then bit2 of the system parameter will be
set to 0.
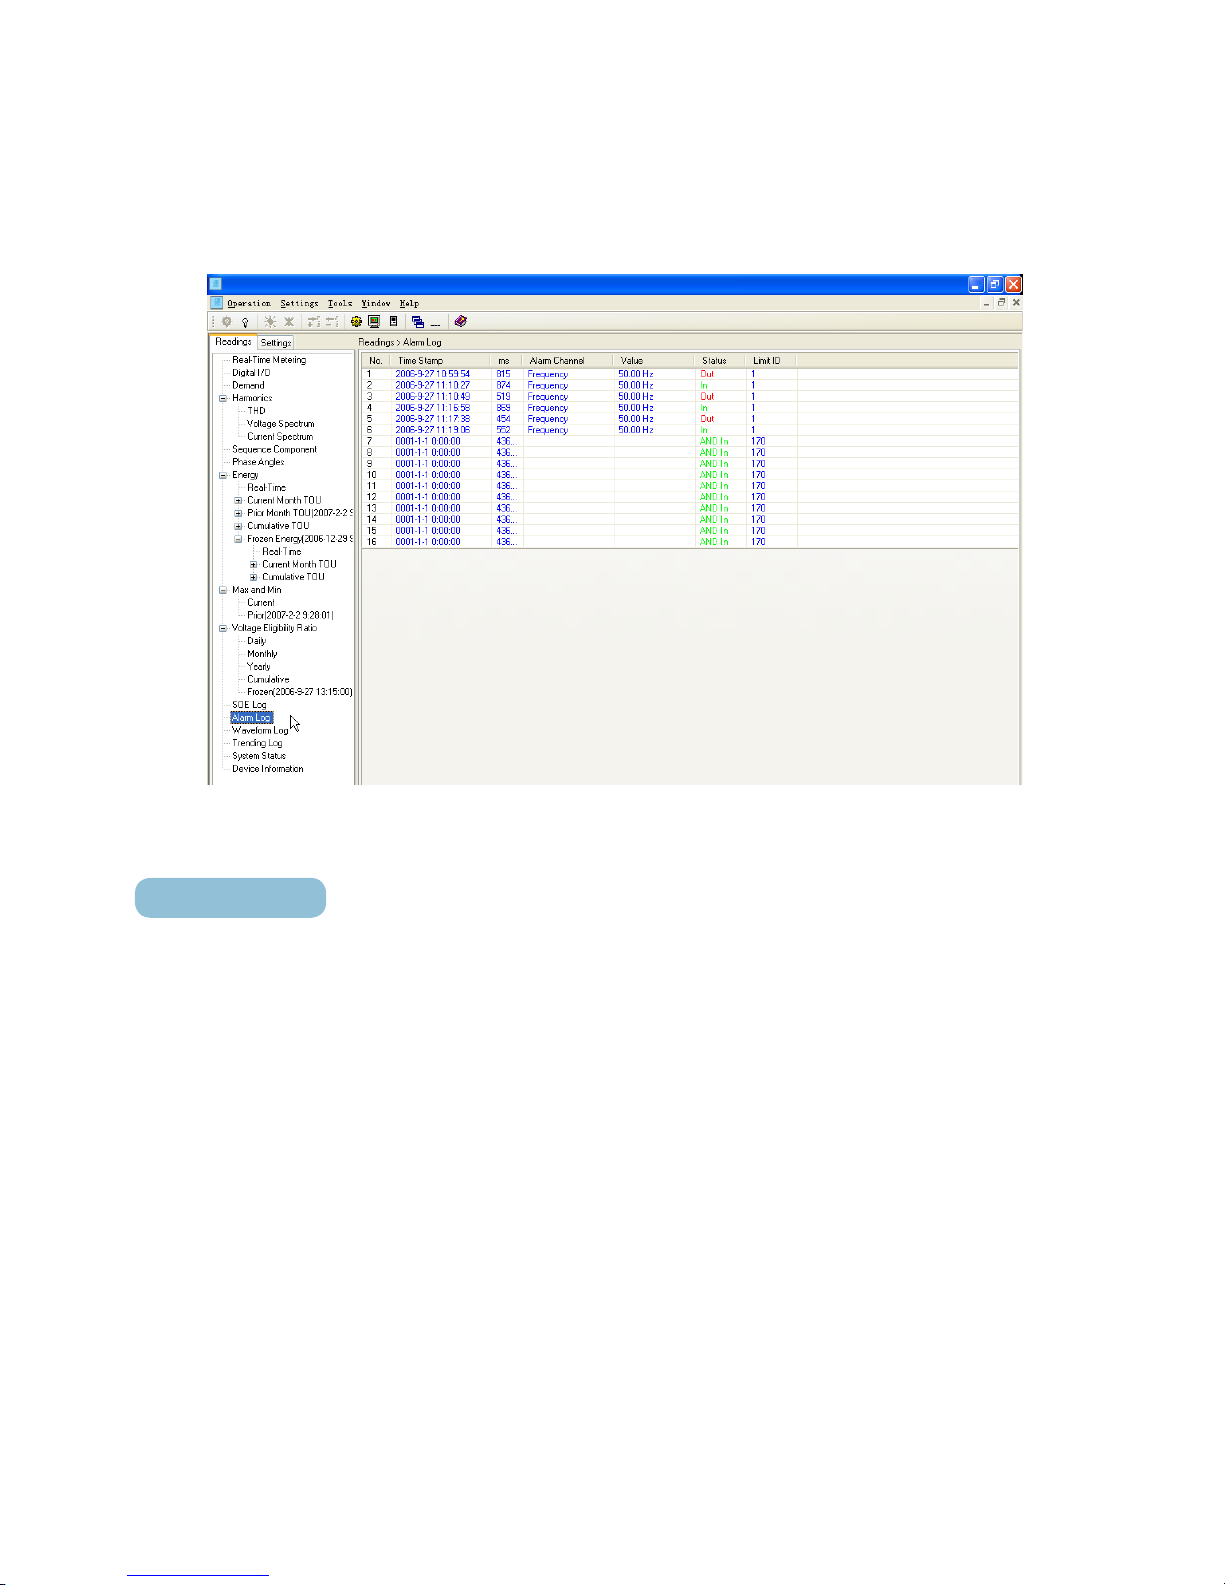
Note: alarming records will not be lost during power off. The pointer will
point to the 1st record after it is powered on again.
Here is an example:
Page 84
82
DPMS XPQ User Manual
Fig 4.16 Alarm Log
SOE Function
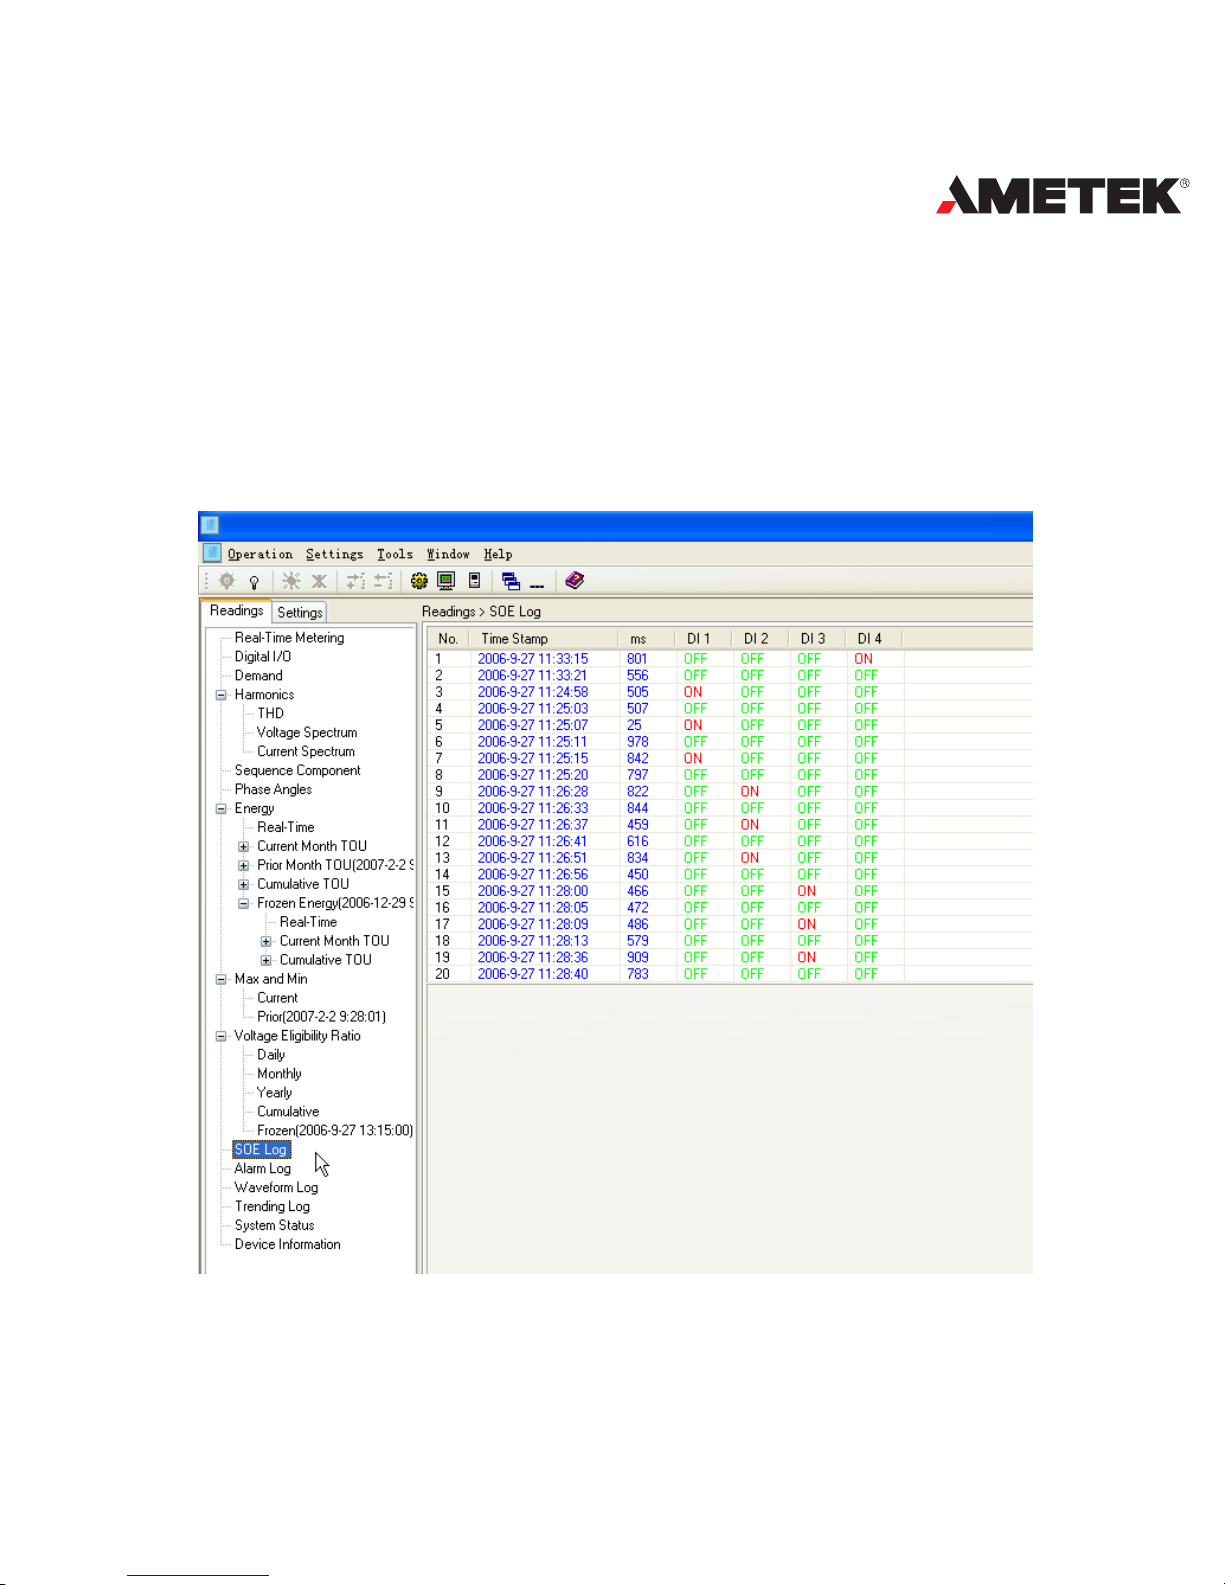
There are 4 DI inputs, it can record changing information of DIs. The time
resolution is 1ms. It can also determine whether to enable waveform capture
and which kind of triggering by setting “DI triggering waveform capture mode” in
system parameters. Its register forms a 16-bit unsigned integer. Bit1,bit0=DI1;
Bit3,bit2=DI2;Bit5,bit4=DI3; Bit7,bit6=DI4. “00” stands for none, “01” stands for
from OFF to ON, “10” stands for from ON to OFF ,“11” stands for trigger at any
change.
Format: DI status | occur time yyyy |mm | dd | hh | mm | ss | ms
There are 20 groups of records, it will begin with the rst one after power
Page 85
83
POWER INSTRUMENTS
on and it works in a cycle. The data won’t lose during power off SOE will set bit0
of “system status” to be 1. At the same time, corresponding ags will be set to 1
to indicate new data. The meter sets ag of SOE but does not clear it. It should
be cleared after controller has read the data, then bit0 of system parameters will
be set to 0.
Here is an example:
Fig 4.17 SOE Log
Page 86

84
DPMS XPQ User Manual
Waveform record
The DPMS XPQ can record 5 cycles of waveforms both before and after
the trigger point of the entire 6 input channels (U1, U2, U3, I1, I2 and I3). There
are 16 points for each cycle and a maximum of 5 waveform records.
There are three reasons for waveform triggering: DI changes, alarming and
manual triggering. Please refer to related chapters for more details.
Format: w1~w7 recording time (w1:yyyy; w2:mm; w3:dd; w4:hh; w5:mm;
w6:ss; w7:ms).
w8-w10 indicates the trigger: (w8: DI triggering, Bit1,bit0 indicates DI1;
Bit3,bit2 indicates DI2; Bit5,bit4 indicates DI3 and Bit7,bit6 indicates DI4. “00”
indicates not trigger by DI, “01” indicates trigger by DI from off to on, “10”
indicates trigger by DI from on to off and “11” indicates a trigger by DI for any
changes. w9: alarming trigger, bit0~bit15 are corresponding to the 1st - 16th of
the 16 alarming groups. 1: alarming trigger capture; 0: alarming does not trigger
capture. w10: manual triggering.1:yes; 0:no.)
Then there are 10 cycle waveform of UA, 10 cycle waveform of IA, 10 cycle
waveform of UB, 10 cycle waveform of IB, 10 cycle waveform of UC, 10 cycle
waveform of IC. Please refer to the address table for more details.
The waveform record will set bit1 of “system status” to 1. At the same time,
corresponding flags will be set to 1 to indicate new data. The meter sets the
ag of the waveform record but does not clear it. It should be cleared after the
controller has read the data, then bit0 of system parameters will be set to 0.
Update rule: It checks out empty records from the rst one, if there is no
blank record, it won’t take a new record. All records won’t be lost during power
off.
Page 87
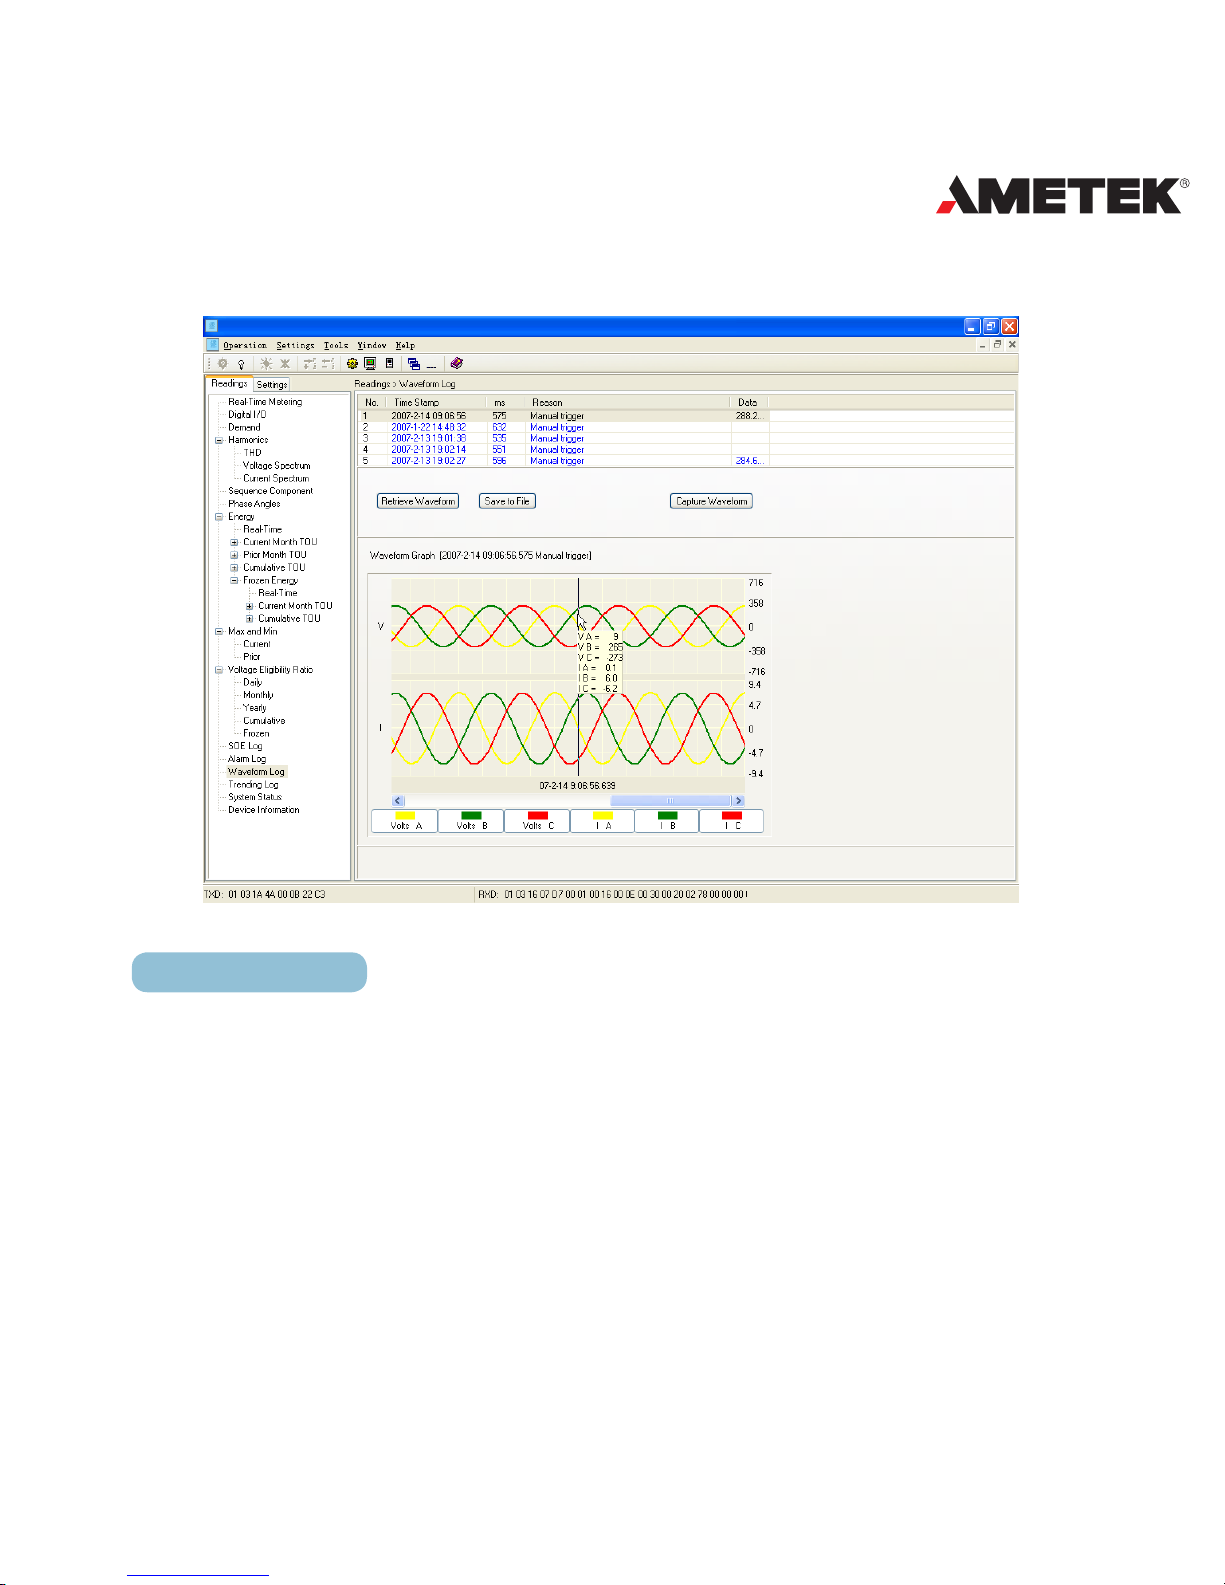
85
POWER INSTRUMENTS
Here is an example:
Fig 4.18 Waveform Log
Trending records
The DPMS XPQ-G takes records of frequency, UA (or UAB), IA, UB (or
UBC), IB, UC(or UCA), IC at a xed interval. So the controller can draw trending
charts easily.
The time interval can be 1~60 minutes, with the default of 60.
It can take 336 records in all and recurs after it is full. It takes the occurring
time of the latest record and there are no time stamps for other records. “Trending
record pointer” indicates the serial number of the next record. This pointer can
Page 88
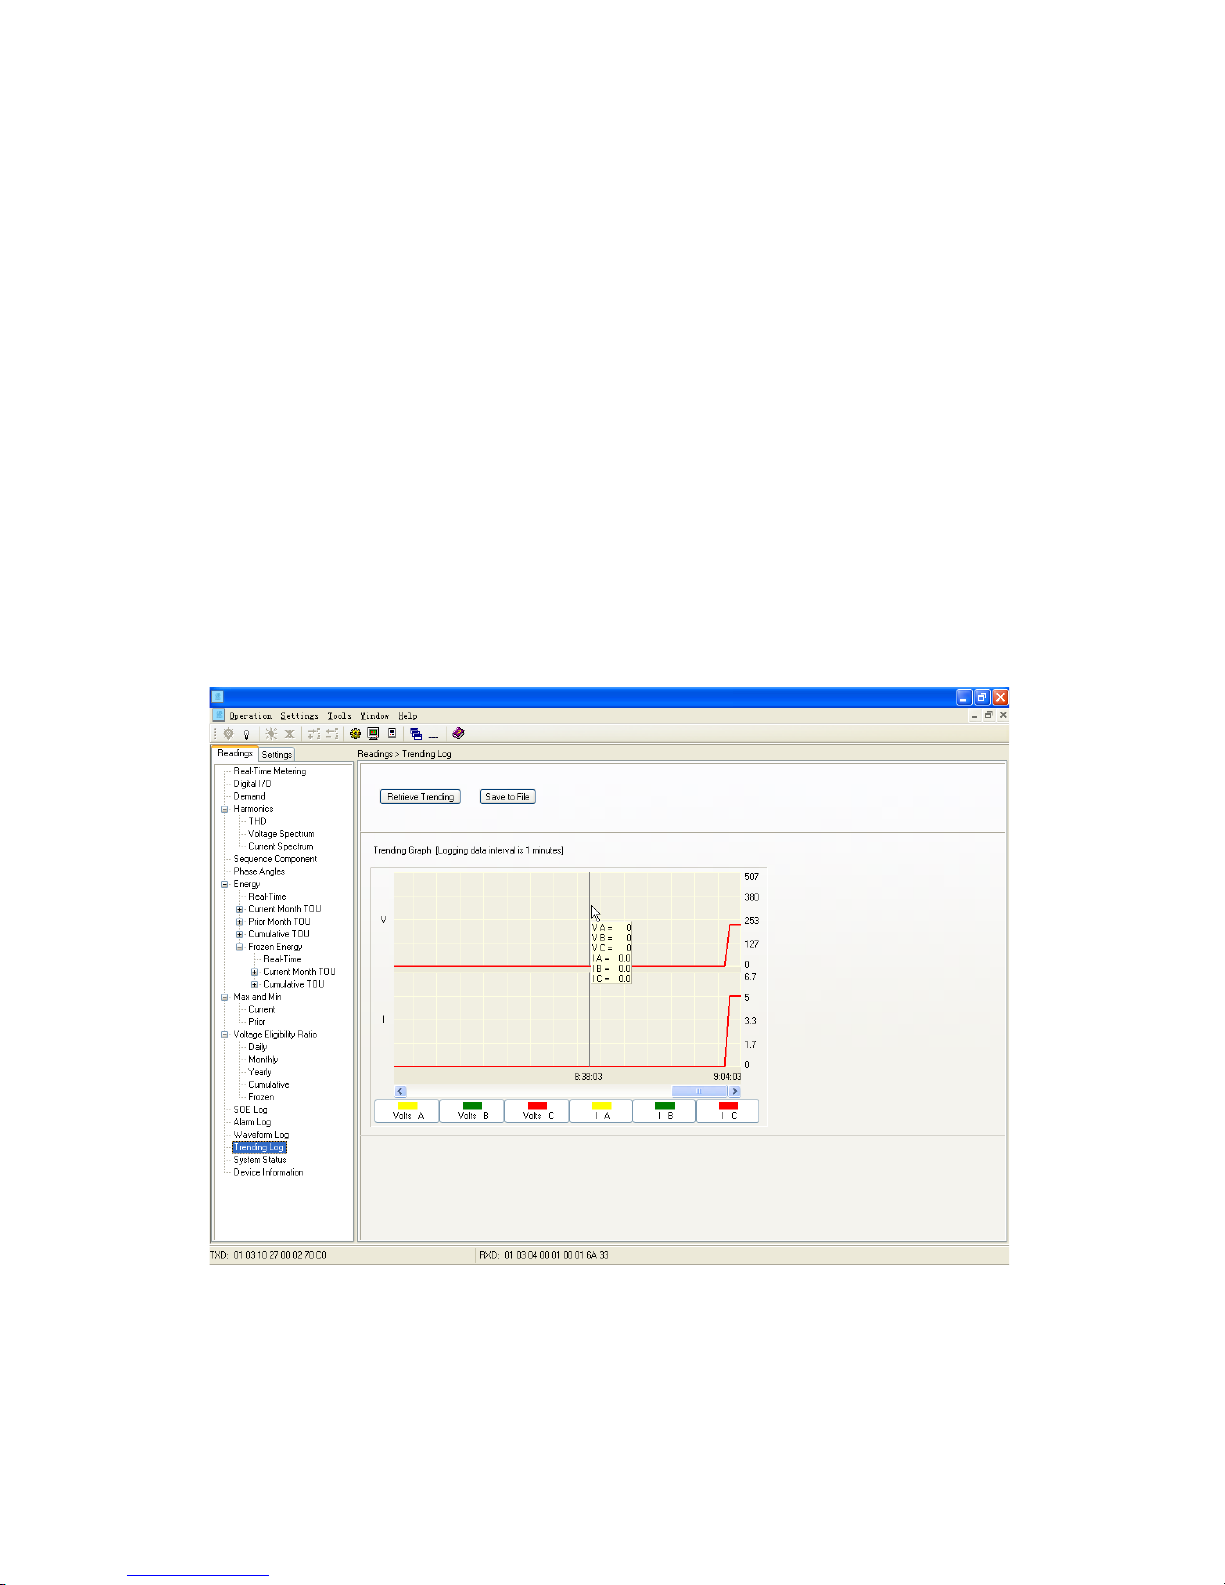
86
DPMS XPQ User Manual
not be changed. “Trending record backup pointer” is used by the controller,
it stores the serial number that the controller will read, it can not be changed
by the meter either. It is used to compare “trending record pointer” with input
data from the controller, when the two are equal, bit4 of “system status” will be
cleared ensuring all data has been read by the controller.
Bit4 of “system status” will be set to 1 when there is a new record.
Trending records will not be lost during power off. “Trending record pointer”,
“trending record backup pointer” and Bit4 of “system status” will be set to 0 after
power on.
Here is an example:
Fig 4.19 Trending Log
Page 89

87
POWER INSTRUMENTS
Voltage Eligibility
The DPMS XPQ-G can take the statistics of voltage eligibility, then give out
a great amount of data.
Eligibility = (1-overlimit time/Measuring time)*100%
The upper and lower limits of voltage can be set according to the user.
When voltage is out of range, it is not eligible. Three limitations of voltages of
the phase or line can be set respectively. The format of the setting value and
communication value is the same. They are all set according to input voltages.
For example, if the PT used is a 10000/100 PT, the high limit of voltage is set as
10300V, then the setting value is 10300÷(10000/100)=103V. Then according to
the relationship between the communication value and numerical value , U=Rx
X (PT1 / PT2) /10, so the value to be written, Rx is 103*10=1030. Setting by
pressing keys should use the same value.
Voltage eligibility consists of running time, channel eligibility and eligible
time. In order to find and analyze, it is divided into real time, statistics, and
freezing zone. Please refer to the address table for more details. The format of
eligibility is 99.9999999%.
Voltage eligibility can be frozen and cleared.
Here is an example:
Page 90
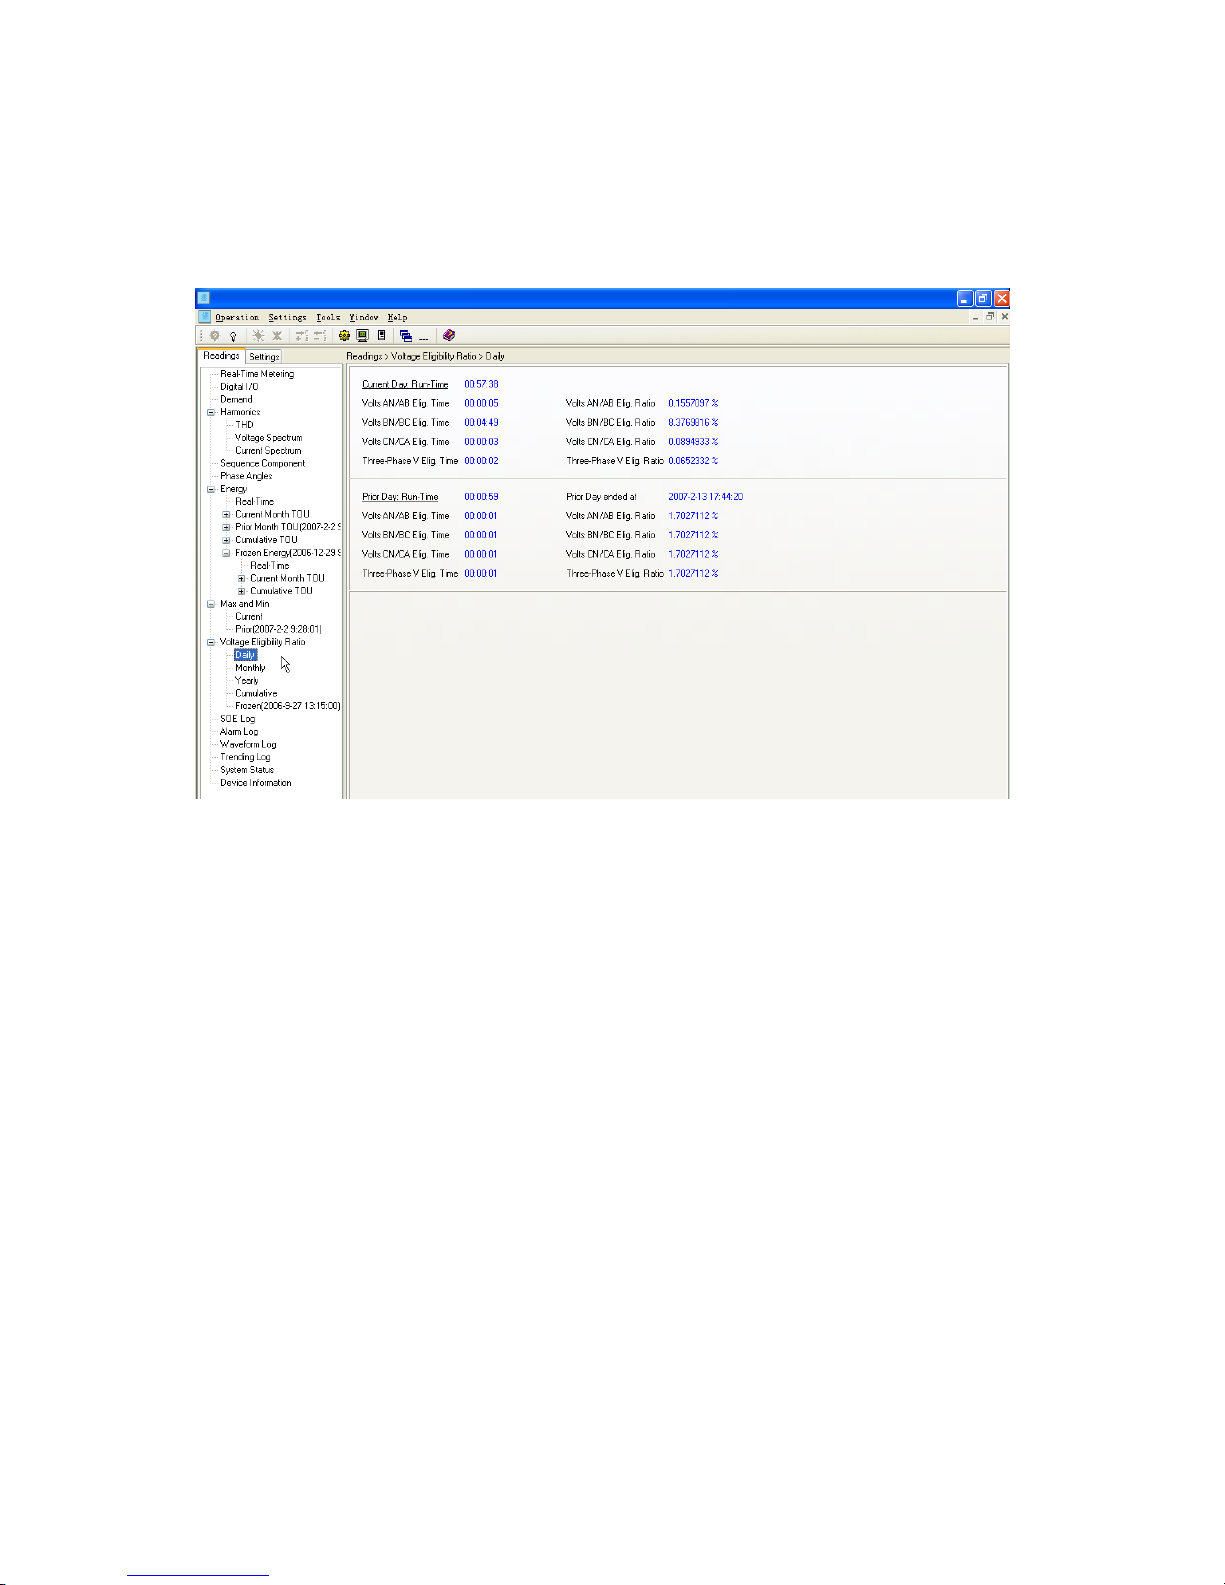
88
DPMS XPQ User Manual
Fig 4.20 Voltage Eligibility Ratio
Page 91

Chapter 5 Communication
Introducing Modbus Protocol
Format of Communication
Data Address Table
Application Details
89
Page 92

90
DPMS XPQ User Manual
This ch apter m ain ly disc uss es how to h andle t he mete r vi a the
communication port using software. To master this chapter, you should be
familiar with Modbus and have read the other chapters in this manual. Once you
have completed these steps you will have mastered the function and application
of this product.
This chapter includes: Modbus protocol, the format of communication and
data address tables and application details.
Introducing Modbus Protocol
The Modbus RTU protocol is used for communication in the DPMS XPQ.
The data format and error check methods are dened in the Modbus protocol.
The half duplex query and respond mode is adopted in the Modbus protocol.
There is only one master device in the communication net. The others are slave
devices, waiting for the query of the master.
Transmission mode
The mode of transmission defines the data structure within a frame and
the rules used to transmit data. The mode is dened in the following which is
compatible with Modbus RTU Mode*.
Coding System 8-bit binary
Start bit 1
Data bits 8
Parity no parity
Stop bit 1
Error checking CRC check
* Modbus is trademark of Modicon, Inc.
Page 93
91
POWER INSTRUMENTS
Framing
Address Function Data Check
8-Bits 8-Bits N×8-Bits 16-Bits
Table5.1 Data Frame Format
Address Field
The address field of a message frame contains eight bits. Valid slave
device addresses are 0~247 decimal. A master addresses a slave by placing
the slave address in the address eld of the message. When the slave sends
its response, it places its own address in this address eld of the response to let
the master know which slave is responding.
Function Field
The function code eld of a message frame contains eight bits. Valid codes
are 1~255 decimal. When a message is sent from a master to a slave device
the function code eld tells the slave what kind of action to perform.
Code Meaning Action
01 Read Relay Output Status Obtain current status of Relay Output
02 Read Digital Input(DI) Status Obtain current status of Digital Input
03 Read Data Obtain current binary value in one or more registers
05 Control Relay Output Force Relay to a state of on or off
16 Press Multiple-Register Place specic binary values into a series
of consecutive Multiple-Registers
Table5.2 Function Code
Data Field
The data field is constructed using sets of two hexadecimal digits, from
00 to FF hexadecimal. The data eld of messages sent from a master to slave
devices contains additional information which the slave must use to take the
action defined by the function code. This can include items like discrete and
Page 94

92
DPMS XPQ User Manual
register addresses, the quantity of items to be handled, and the count of actual
data bytes in the eld. For example, if the master requests a slave to read a
group of holding registers (function code 03), the data eld species the starting
register and how many registers are to be read. If the master writes to a group
of registers in the slave (function code 10 hexadecimal), the data eld species
the starting register, how many registers to write, the count of data bytes to
follow in the data eld, and the data to be written into the registers.
If no error occurs, the data field of a response from a slave to a master
contains the data requested. If an error occurs, the eld contains an exception
code that the master application can use to determine the next action to be
taken. The data field can be nonexistent (of zero length) in certain kinds of
messages.
Error Check Field
Messages include an error checking field that is based on a Cyclical
Redundancy Check (CRC) method. The CRC eld checks the contents of the
entire message. It is applied regardless of any parity check method used for the
individual characters of the message. The CRC field is two bytes, containing
a 16 bit binary value. The CRC value is calculated by the transmitting device,
which appends the CRC to the message.
The receiving device recalculates a CRC during receipt of the message,
and compares the calculated value to the actual value it received in the CRC
field. If the two values are not equal, an error will result. The CRC is started
by 66 first preloading a 16-bit register to all 1’s. Then a process begins of
applying successive 8-bit bytes of the message to the current contents of the
register. Only the eight bits of data in each character are used for generating
Page 95
93
POWER INSTRUMENTS
the CRC. Start and stop bits, and the parity bit, do not apply to the CRC. During
generation of the CRC, each 8-bit character is exclusive ORed with the register
contents. Then the result is shifted in the direction of the least significant bit
(LSB), with a zero lled into the most signicant bit (MSB) position. The LSB is
extracted and examined. If the LSB was a 1, the register is then exclusive ORed
with a preset, xed value. If the LSB was a 0, no exclusive OR takes place. This
process is repeated until eight shifts have been performed. After the last (eighth)
shift, the next 8-bit byte is exclusive ORed with the register current value, and
the process repeats for eight more shifts as described above. The nal contents
of the register, after all the bytes of the message have been applied, is the
CRC value. When the CRC is appended to the message, the low-order byte is
appended rst, followed by the high-order byte.
Format of communication
Explanation of frame
Addr Fun Data start
reg hi
Data start
reg lo
Data #of
regs hi
Data #of
regs lo
CRC 16HiCRC 16
Lo
06H 03H 00H 00H 00H 21H 84H 65H
Table 5.3 Explanation of frame
In table 5.3, the meaning of each abbreviated word is,
Addr: address of slave device
Fun: function code
Data start reg hi: start register address high byte
Data start reg lo: start register address low byte
Data #of reg hi: number of register high byte
Data #of reg lo: number of register low byte
Page 96

94
DPMS XPQ User Manual
CRC16 Hi: CRC high byte
CRC16 Lo: CRC low byte
1. Read Status of Relay (Function Code 01)
This function code is used to read status.
1=On, 0=Off;
There are 2 Relays. The Address of each Relay is Relay1=0000H and
Relay2=0001H.
The following query is to read Relay Status of meter number 17.
Query
Addr Fun relay start
reg hi
relay start
reg lo
relay #of
regs hi
relay #of
regs lo
CRC 16HiCRC 16
Lo
11H 01H 00H 00H 00H 02H BFH 5BH
Table 5.4 Read the status of Relay1 and Relay2 Query Message
Response
The DPMS XPQ response includes the meter's address, function code,
quantity of data byte, the data, and error checking. An example response to read
the status of Relay1 and Relay2 is shown in Table 4.5. The status of Relay1 and
Relay2 is responding to the last 2 bits of the data.
Relay1: bit0; Relay2: bit1
Address Function code Byte count Data CRC high CRC low
11H 01H 01H 02H D4H 89H
Table 5.5 Relay status responds
The content of the data is:
7 6 5 4 3 2 1 0
0 0 0 0 0 0 1 0
MSB LSB
Relay1 = OFF (LSB ), Relay2=ON (Left to LSB )
Page 97
95
POWER INSTRUMENTS
2. Read the Status of DI (Function Code 02)
1=On, 0=Off.
There are 4 DIs. The Address of each DI is DI1=0000H, DI2=0001H,
DI3=0002H and DI4=0003H.
The following query is to read the 4 DI Status of Number 17 DPMS XPQ.
Query
Addr Fun DI start
addr hi
DI start
addr lo
DI num
hi
DI num
lo
CRC 16
Hi
CRC 16
Lo
11H 02H 00H 00H 00H 04H 7BH 59H
Table 5.6 Read 4 DIs Query Message
Response
The meter response includes its address, function code, quantity of data
characters, the data characters, and error checking. An example response to
read the status of 4 DIs is shown as Table 5.7. The status of each is responding
to the last 4 bit of the data.
DI1: bit0 DI2: bit1 DI3: bit2 DI4: bit3
Address Function code Byte count Data CRC high CRC low
11H 02H 01H 03H E5H 49H
Table 5.7 Read Status of DI
The content of the data is,
7 6 5 4 3 2 1 0
0 0 0 0 0 0 1 1
MSB LSB
DI1=On, DI2=On, DI3=Off, DI4=Off
Page 98

96
DPMS XPQ User Manual
3. Read Data (Function Code 03)
Query
This function allows the master to obtain the measurement results of the
meter.Table 5.8 is an example to read the 3 measured data (F, V1 and V2) from
slave device number 17, the data address of F is 0130H, V1 is 0131H and V2 is
0132H.
Addr Fun Data start
addr hi
Data start
addr lo
Data #of
regs hi
Data #of
regs lo
CRC 16
regs Hi
CRC 16
regs Lo
11H 03H 01H 30H 00H 03H 06H A8H
Table 5.8 Read F, V1, V2 Query Message
Response
The meter's response includes its address, function code, quantity of data
byte, data, and error checking. An example response to read F, V1 and V2
(F=1388H (50.00Hz), V1=03E7H (99.9V), V2=03E9H (100.1V) is shown in Table
4.9.
Addr Fun Byte
count
Data1hiData1LoData2hiData2LoData3hiData3LoCRC16hiCRC16
lo
11H 03H 06H 13H 88H 03H E7H 03H E9H 7FH 04H
Table 5.9 Read F, V1 and V2 Message
4. Control Relay (Function Code 05)
Query
This message forces a single Relay either on or off. Any Relay that exists
within the meter can be forced to be either status (on or off). The address of
Relays starts at 0000H (Relay1=0000H, Relay2=0001H). The data value FF00H
will set the relay on and the value 0000H will turn it off; all other values are
illegal and will not affect that relay.
Page 99
97
POWER INSTRUMENTS
The example below is a request to meter number 17 to turn on Relay1.
Addr Fun DO addr
hi
DO addr
lo
Value
hi
Value
lo
CRC 16
Hi
CRC 16
Lo
11H 05H 00H 00H FFH 00H 8EH AAH
Table5.10 Control Relay Query Message
Response
The normal response to the command request is to retransmit the message
as received after the relay status has been altered.
Addr Fun Relay addr
hi
Relay addr
lo
Value
hi
Value
lo
CRC
Hi
CRC
Lo
11H 05H 00H 00H FFH 00H 8EH AAH
Table5.11 Control Relay Response Message
5. Preset / Reset Multi-Register (Function Code 16)
Query
Function 16 allows the user to modify the contents of a Multi-Register.
Any Register that exists within the meter can have its contents changed by
this message. The example below is a request to number 17 to Preset Ep_
imp=(17807783.3KWH), while its Hex Value 0A9D4089H. Ep_imp data address
is 0156H and 0157H.
Addr Fun Data start
register hi
Data start
register lo
Data
register hi
Data
register lo
Byte
count
Value
high
Value loValue hiValue loCRC hiCRC
lo
11H 10H 01H 56H 00H 02H 04H 0AH 9DH 40H 89H 4DH B9H
Table5.12 Preset KWH Query Message
Page 100

98
DPMS XPQ User Manual
Response
The normal response to a preset Multi-Register request includes the
meter's address, function code, data start register, the number of registers, and
error checking.
Addr fun Data start
addr hi
Data start
addr lo
Data
register hi
Data
register lo
CRC
high
CRC
low
11H 10H 01H 56H 00H 02H A2H B4H
Table5.13 Preset Multi-Registers Response Message
Data Address Table and Application Details
There are several rules to follow in using the meter:
1. Data type:
“bit” refers to binary
“word” refers to 16-bit unsigned integer using one data address and 2 bytes
of memory, it varies from 0 - 65535.
“int” refers to 16-bit integer using one data address and 2 bytes of memory,
it varies from -32768 - 32767.
“dword” refers to 32-bit unsigned integer using two data addresses and 4
bytes of memory with high word at the front and low word at the end, it varies
from 0 - 4294967295.Rx=high word *65536+low word.
“oat” refers to 32-bit single value using two data addresses and 4 bytes of
memory, it varies from -1.175494E-38 - 3.402823E+38.
2. Relationship between communication value and numerical value.
The numerical value may not be the communication value, it is important to
notice this. The following table shows how they correspond to each other.
 Loading...