

Page 1

ConnectCore® 8M Nano Performance
and Power
Benchmarking Report
Application Note
Page 2

Revision history—90002449
Revision Date Description
A March 2021 Initial release.
Trademarks and copyright
Digi, Digi International, and the Digi logo are trademarks or registered trademarks in the United
States and other countries worldwide. All other trademarks mentioned in this document are the
property of their respective owners.
© 2021 Digi International Inc. All rights reserved.
Disclaimers
Information in this document is subject to change without notice and does not represent a
commitment on the part of Digi International. Digi provides this document “as is,” without warranty of
any kind, expressed or implied, including, but not limited to, the implied warranties of fitness or
merchantability for a particular purpose. Digi may make improvements and/or changes in this manual
or in the product(s) and/or the program(s) described in this manual at any time.
Feedback
To provide feedback on this document, email your comments to
techcomm@digi.com
Include the document title and part number (ConnectCore® 8M Nano Performance and Power,
90002449 A) in the subject line of your email.
ConnectCore® 8M Nano Performance and Power
2
Page 3

Contents
Introduction
Power architecture
Primary input supplies 6
VSYS and VSYS2 6
VCC_MCA 7
PMIC output supplies 7
Measurement conditions
Hardware used 8
Software used 8
Digi Embedded Yocto 8
MCA firmware 8
Benchmark packages 8
Host requirements 9
General conditions 9
Location and environment 9
Instrumentation 10
SOM power measurements 10
How to calculate SOM power 10
Console cable 10
Measure points 10
Formula 11
Use cases
Low-power modes 12
Power-off 12
Suspend to RAM 12
System idle 13
Active modes 13
Performance tests
CPU 14
CoreMark 14
Memory 14
ConnectCore® 8M Nano Performance and Power
3
Page 4

perf-bench 14
eMMC 15
IOzone3 15
USB 15
IOzone3 15
Ethernet 16
Environment conditions 16
iPerf3 16
FTP 17
Wi-Fi 18
Environment conditions 18
iPerf3 18
Setup 18
FTP 19
GPU 20
Environment conditions 20
Glmark2 20
VPU 20
Environment conditions 20
Gstreamer video playback (decoding) 21
Audio 21
Environment conditions 21
Audio playback 22
Audio recording 22
Additional information
ConnectCore® 8M Nano Performance and Power
4
Page 5

Introduction
Introduction
This document characterizes power consumption and performance for the ConnectCore 8M Nano
SOM. It includes detailed measurements representing a variety of use cases and includes
performance tests for key interfaces, including CPU, memory, Wi-Fi, and video and audio playback.
Note This information is provided as a reference on the capabilities of the ConnectCore 8M Nano
platform. You may see different figures due to software or other factors.
ConnectCore® 8M Nano Performance and Power
5
Page 6
Power architecture Primary input supplies
Power architecture
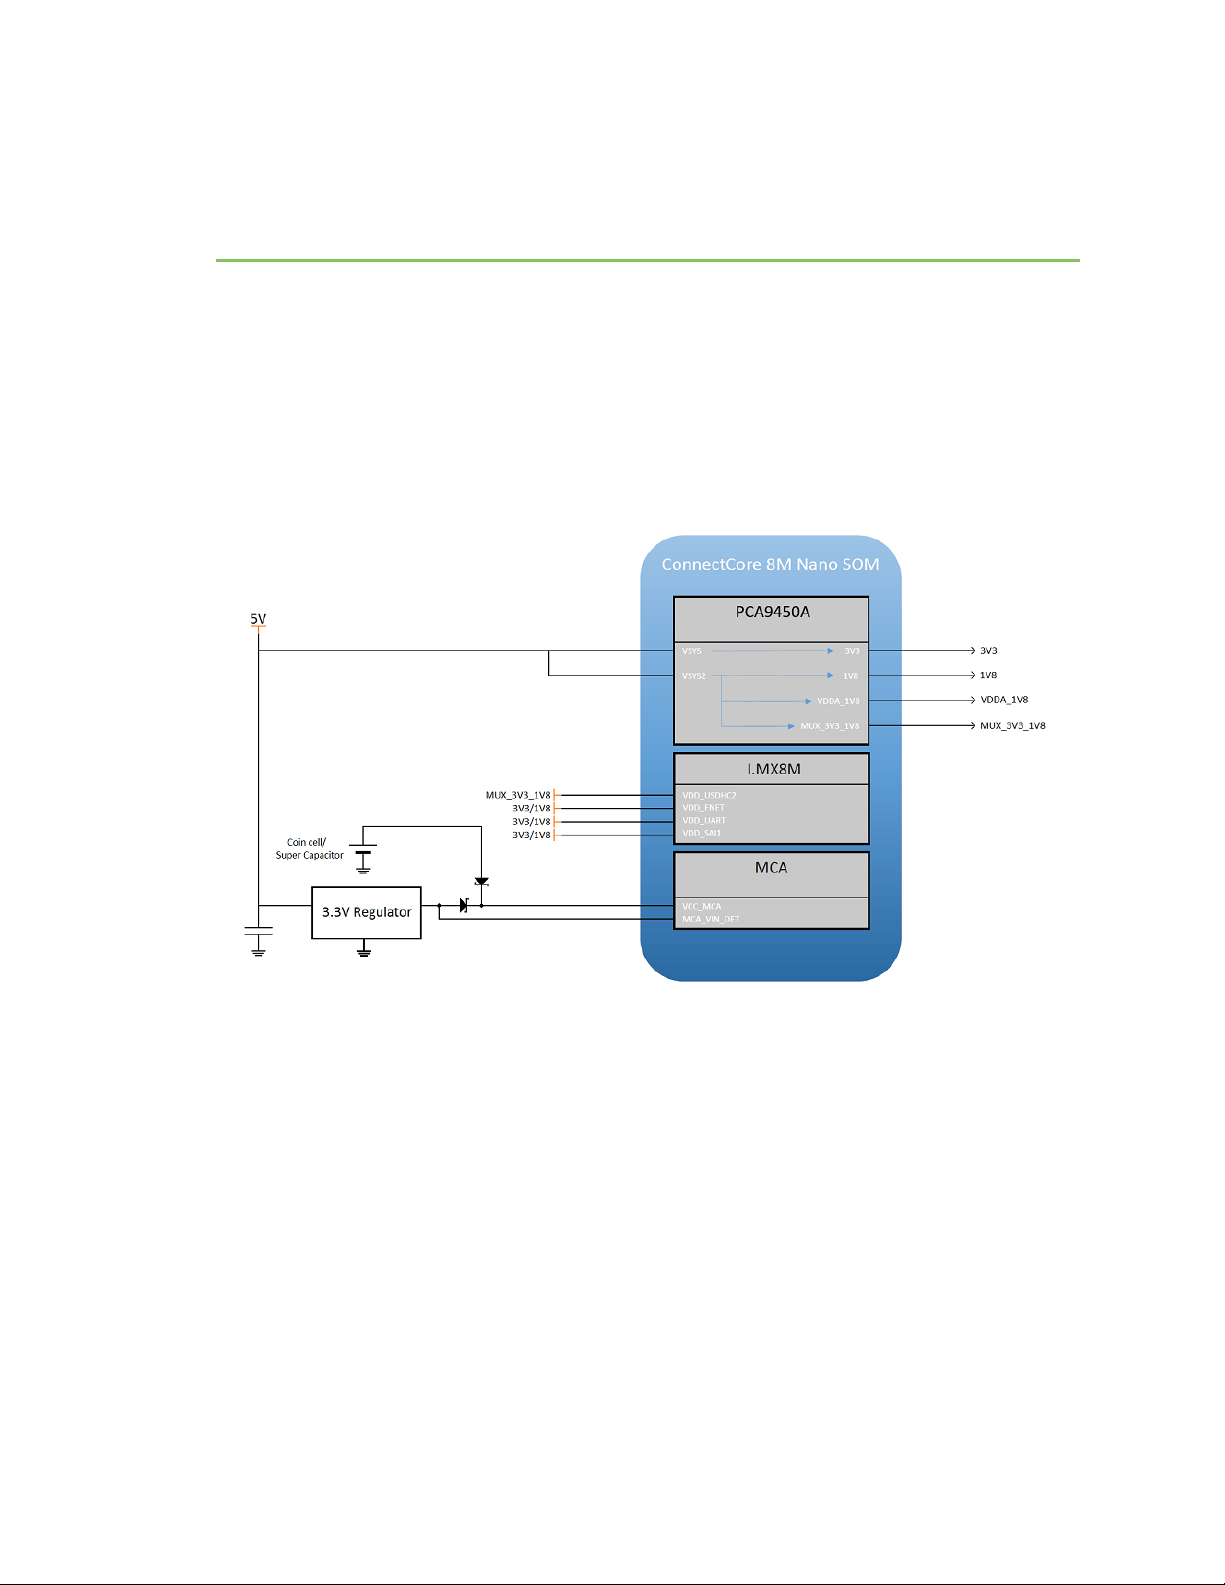
The following diagram represents the full power architecture distribution of the ConnectCore 8M
Nano module with its three main components:
n The PCA9450 PMIC
n The iMX8M SOC
n The Micro Controller Assist (MCA)
The following diagram shows a typical application:
Primary input supplies
The ConnectCore 8M Nano requires three primary power supply inputs:
n VSYS
n VSYS2
n VCC_MCA
VSYS and VSYS2
VSYS and VSYS2 are the input power supplies to the on-module NXP PCA9450A Power Management IC
(PMIC), as well as to most of its regulators.
ConnectCore® 8M Nano Performance and Power
6
Page 7
Power architecture PMIC output supplies
Some PMIC regulators are internally dedicated to powering the module, while others power external
circuitry.
VCC_MCA
VCC_MCA is the input power supply of the on-module Digi Microcontroller Assist (MCA).
PMIC output supplies
The PMIC generates many power rails. Most are used internally in the SOM and some are also used
externally:
PMIC power rails Comments Used internally Used externally
1V8 General purpose 1.8V power rail Yes Yes
3V3 General purpose 3.3V power rail Yes Yes
VDDA_1V8 Yes No
MUX_3V3/1V8 Yes No
ConnectCore® 8M Nano Performance and Power
7
Page 8

Measurement conditions Hardware used
Measurement conditions
Hardware used
The following hardware was used for the measurements:
n ConnectCore 8MN SOM
l Variant 0x02: Industrial Quad 1.4GHz, 8GB eMMC, 1GB LPDDR4, -40/+85C, Wireless,
Bluetooth
l PN: 55002070-01 1P
n ConnectCore 8MN DVK
l Hardware version: 30016232-02
Software used
Digi Embedded Yocto
The software used on the devices is the pre-built installer binary image for Digi Embedded Yocto 3.0r2.4 release, available on the Digi support site (md5sum: 90d156525f1732505b7df3ebbcecba4c).
To install the firmware, follow the Get Started documentation.
After installing the firmware you can run sysinfo to verify the component versions:
Component Version
U-Boot dub-2020.04-r1.3+gb84d3443cc
Firmware dey-3.0-r2-20201023151245
Kernel 5.4.64-dey+g8086dc5f8e29
MCA firmware
The firmware version used on the SOM during the tests is 1.0. See the documentation for information
on programming the MCA firmware.
Benchmark packages
A few additional packages with benchmark tools have been built and must be installed on the device
after programming the firmware. Download these tools from theDigi FTP server.
Package Description
coreutils A set of system commands with more extended optionsthan the ones in Busybox
ConnectCore® 8M Nano Performance and Power
8
Page 9

Measurement conditions General conditions
Package Description
coremark CPU benchmark application (executable binary).
glmark2 GPU benchmark application.
iozone3 Filesystem benchmark application.
iperf3 Network interfaces benchmarkapplication.
Copy pre-built binary coremark directly to /usr/sbin on the target and give the application execution
permissions.
~# chmod 755 /usr/sbin/coremark
To install RPM packages on the device, transfer the files to the target and then run for each package:
~# rpm -i <filename.rpm>
Host requirements
For the network tests your host system needs to have the iperf3 tool. To install it:
~$ sudo apt-get install iperf3
General conditions
Location and environment
The power consumption and benchmark tests have been carried out at room temperature of 22ºC,
30% humidity.
The target sits on a table with no enclosure.
ConnectCore® 8M Nano Performance and Power
9
Page 10

Measurement conditions SOM power measurements
Instrumentation
The following instruments were used during the tests:
Qty Instrument Model Details
1 Regulatedpower supply RIGOL DP832 5V / 3A
1 Multimeter FLUKE 8846A 6-1/2 Digit
3 Multimeter FLUKE 289 True RMS
SOM power measurements
How to calculate SOM power
As depicted in the Power architecture diagram, current flows into the SOM through VSYS, VSYS2, and
VCC_MCA.
The power provided by the SOM to the carrier board peripherals through the 1V8_EX and 3V3_EXT
power rails is application-specific and has been subtracted from the total input power to estimate the
power consumed solely by the SOM.
Console cable
The FTDI chip of the USB console cable introduces undesired voltage feedback to the CPU through the
data lines. It must be disconnected to get accurate power measurements.
Measure points
The ConnectCore 8M Nano DVK has several 0-ohm resistors for the purpose of power consumption
calculations. Some headers (not populated by default) are added to make measurements easier to
perform:
n Remove R28 and populate J6. Connect an ammeter to measure the current flowing in through
VSYS and VSYS2. Measure the voltage at this point too (~5V) to calculate the power more
accurately.
n Remove R31 and populate J7. Connect an ammeter to measure the current flowing out
through 3V3_EXT. Measure the voltage at this point too (~3.3V) to calculate the power more
accurately.
n Remove R32 and populate J8. Connect an ammeter to measure the current flowing out
through 1V8_EXT. Measure the voltage at this point too (~1.8V) to calculate the power more
accurately.
n Remove R13 and populate J3. Connect an ammeter to measure the current flowing in through
VCC_MCA. Measure the voltage at this point too (~3.3V) to calculate the power more
accurately.
Power Measuring point Power rail Voltage Direction with respect to SOM
P1 R1 VSYS+ VSYS2 5V In
ConnectCore® 8M Nano Performance and Power
10
Page 11

Measurement conditions SOM power measurements
Power Measuring point Power rail Voltage Direction with respect to SOM
P2 R2 EXT_3V3 3.3V Out
P3 R3 EXT_1V8 1.8V Out
P4 R31 VCC_MCA 3.3V In
Formula
SOM power can be estimated as P1 - P2 - P3 + P4.
This is the closest estimation you can measure on the ConnectCore 8M Nano SBC Pro. Note that part
of EXT_1V8 power rail is routed back to the SOM to power some additional domains of the SOC (VDD_
ENET0 and VDD_ESAI_SPDIF).
ConnectCore® 8M Nano Performance and Power
11
Page 12

Use cases Low-power modes
Use cases
Digi measured power consumption of the ConnectCore 8M Nano SOM in the following use cases:
n Low-power modes
l Power-off
l Suspend to RAM
l System idle
n Active modes (I/O, video, audio, camera, network interfaces)
Note This chapter presents the power measurements for the low-power modes.
The next section, containing the performance benchmarks for different tests, presents the power
measurements for the active modes beside each benchmark score.
Low-power modes
Power-off
To enter power-off mode, press the ON/OFF button of the carrier board for more than two seconds, or
run:
~# poweroff
In this mode only the MCA is powered, which maintains the MCA RTC and other low-power
functionality of the MCA such as wake-up interrupts (ADC, tamper, keypad, etc.).
SOM variant SOM power
Quad 325 uW
Suspend to RAM
To enter standby mode, press the ON/OFF button of the carrier board once, or run:
~# standby
In this mode, the system enters a low-power state where the CPU is halted and the content of the
RAM is maintained (self-refresh mode). The state of the PMIC power rails is configurable
(on/off/voltage) through the device tree. For this measurement, Digi used the default configuration,
which disables the 3V3_EXT power domain when the SOM is suspended to RAM. In this state, the
device can wake up from multiple wake-up sources (MCA and CPU peripherals).
SOM variant SOM power
Quad 29 mW
ConnectCore® 8M Nano Performance and Power
12
Page 13

Use cases Active modes
System idle
All power domains are active and the operating system will perform CPU frequency and voltage
scaling according to the CPU load.
SOM variant SOM power
Quad 1140 mW
Active modes
The Performance tests section, containing the performance benchmarks for different tests, presents
the power measurements for active modes beside each benchmark score.
ConnectCore® 8M Nano Performance and Power
13
Page 14

Performance tests CPU
Performance tests
CPU
CoreMark
CoreMark is a benchmark tool specificallydesigned to test the functionality of a processor core. The
test produces a single-number score in iterations per second.
Command
~# coremark
Results
Test SOM variant Score Metric SOM power SOM temp
CoreMark Quad
Memory
perf-bench
Digi used perf-bench, a tool for benchmark testing, to exercise the RAM memory in this performance
test.
Command: memset
~# perf bench -f simple mem memset -s 200MB
Command: memcpy
~# perf bench -f simple mem memcpy -s 200MB
21832
iter./s 2200mW 49 ºC
ConnectCore® 8M Nano Performance and Power
14
Page 15

Performance tests eMMC
Results
eMMC
Test
perfbench
SOM
variant LPDDR4 in SOM Operation Score Metric
Quad SMIC1GB LPDDR4 1.1V16 bits
1600 MHz
memset 3155 MB/s 1844 mW 47 ºC
memcpy 1306 MB/s 1694 mW 47 ºC
SOM
power
SOM
temp
IOzone3
IOzone3 is a file system benchmark tool that generates and measures a variety of file operations.
The following test measures the file system performance on eMMC (vfat) media.
~# cd <mount-point-of-test-media>
~# iozone -i 0 -i 1 -b /tmp/iozone.xls -r 128k -s 2G -l 1 -u 1
The test:
n Runs write/rewrite (-i 0)
n Runs read/reread (-i 1)
n Uses a record size of 128k (-r 128 k)
n Uses a file size of 2 GB (-s 2 G)
n Runs on a single core (-u 1)
USB
Results
SOM
Test Media
IOzone3 eMMC Quad SMIC 8GB eMMC
Variant Media model Operation Score Metric
BGA153
Read 157 MB/s 1491mW 44 ºC
Write 20 MB/s
SOM
power
SOM
temp
IOzone3
IOzone3 is a file system benchmark tool that generates and measures a variety of file operations.
The following test measures the file system performance on USB 2.0 (vfat) and USB 3.0 (vfat).
ConnectCore® 8M Nano Performance and Power
15
Page 16

Performance tests Ethernet
Command
~# cd <mount-point-of-test-media>
~# iozone -i 0 -i 1 -b /tmp/iozone.xls -r 128k -s 2G -l 1 -u 1
The test:
n Runs write/rewrite (-i 0)
n Runs read/reread (-i 1)
n Uses a record size of 128k (-r 128 k)
n Uses a file size of 2 GB (-s 2 G)
n Runs on a single core (-u 1)
Results
Test
IOzone3 Quad TranscendInformation,Inc.JetFlash16
Ethernet
Environment conditions
n Ethernet cable: 3 m CAT6 patch cable
n Gigabit switch model:D-Link DGS-108
n 10/100 switch model:D-Link DES-1008D
iPerf3
iPerf3 is a tool for active measurements of the maximum achievable bandwidth on IP networks.
SOM
Variant Media model Operation Score Metric
Read 14 MB/s 1319 mW
GB 2.0
Write 11 MB/s
Quad
USB3.0to SATA:Samsungv-nan SSD
Read 28
MB/s 1413 mW
860 PRO
Write 29
MB/s
SOM
power
Command (host)
~# iperf3 -s
Command (target)
~# iperf3 -c <server ip>
ConnectCore® 8M Nano Performance and Power
16
Page 17

Performance tests Ethernet
Results
Score
Test SOM variant Interface Network
iPerf3 Quad ETH1 Gigabit 937 Mbits/sec 1358mW 45 ºC
10/100 95 Mbits/sec 1238mW 43 ºC
send/receive Metric SOM power SOM temp
FTP
FTP is a protocol for file transfer over the network.
Command (target)
On the target side, allow access to user root (forbidden by default):
~# sed /root/d -i /etc/vsftpd.ftpusers
Generate a 1 GB file with random data.
~# dd bs=1M count=1024 if=/dev/urandom of=testfile && sync
Command (host): GET
On the host side, connect to the target via FTP (user: root, pass: root) and get the file:
~$ ftp -p <target_ip_address>
ftp> get testfile
Command (host): PUT
Send the file to the target
ftp> put testfile
Results
Test SOM variant Network Operation Score Metric SOM power SOM temp
iPerf3 Quad Gigabit GET (target to host) 112 MB/s 1792 mW 46ºC
PUT (host to target) 23 MB/s 1522 mW 45 ºC
10/100 GET (target to host) 11 MB/s 1382 mW 43 ºC
PUT (host to target) 11 MB/s 1332 mW 43 ºC
ConnectCore® 8M Nano Performance and Power
17
Page 18

Performance tests Wi-Fi
Wi-Fi
Environment conditions
n Dual band antennas connected to both U.FL connectors
n Access point model:NETGEAR Nighthawk X6 R8000
n Distance from target to access point: 2 m (with no obstacles in between)
iPerf3
iPerf3 is a tool for active measurements of the maximum achievable bandwidth on IP networks.
Note Wi-Fi performance is subject to many variables which are difficult or impossible to control, such
as the electromagnetic radiation present in the place where the test is carried out, the channel used
for the test, etc.
This test was not performed in an isolated chamber.
Setup
To measure the performance of the wireless interface, Digi set up two scenarios: one with the target
working in station mode (the target is connected to an access point), and other scenario as AP (the
target is acting as an access point)
Station
The target is connected to an access point. The setup requires an auxiliary device (host) connected to
the same network as the access point. Ideally, the auxiliary device is connected to the access point
using a Cat6 cable.
Soft-AP
The target is acting like an access point. This setup requires an auxiliary device connected to the
network created by the target. A mobile phone with the 5GHz band can be used with the iperf3
application.
Command (host)
~# iperf3 -s
Command (target)
~# iperf3 -c <server ip>
ConnectCore® 8M Nano Performance and Power
18
Page 19

Performance tests Wi-Fi
Results
Score
Test Mode SOM variant Band
send /receive Metric SOM power SOM temp
iPerf3 Station Quad 2.4 GHz
(802.11b/g/n)
5 GHz (802.11ac) 80.5 Mbits/sec 1791mW 42 ºC
Soft-AP Quad 2.4GHz
(802.11b/g/n)
5 GHz (802.11ac) 71.3 Mbits/sec 1750mW 42 ºC
36 Mbits/sec 2041mW 42 ºC
41 Mbits/sec 1475mW 42 ºC
FTP
FTP is a protocol for file transfer over the network.
Command (target)
On the target side, allow access to user root (forbidden by default):
~# sed /root/d -i /etc/vsftpd.ftpusers
Generate a 1 GB file with random data.
~# dd bs=1M count=1024 if=/dev/urandom of=testfile && sync
Command (host): GET
On the host side, connect to the target via FTP (user: root, pass: root) and get the file:
~$ ftp -p <target_ip_address>
ftp> get testfile
Command (host): PUT
Send the file to the target:
ftp> put testfile
ConnectCore® 8M Nano Performance and Power
19
Page 20

Performance tests GPU
Results
GPU
SOM
Test Mode
FTP Station Quad 2.4 GHz
variant Band Operation Score Metric
(802.11b/g/n)
5 GHz (802.11ac) GET (target to
GET (target to
host)
PUT (host to
target)
host)
PUT (host to
target)
MB/s 2266 mW 43ºC
3.6
MB/s 1666 mW 43ºC
5.42
MB/s 2041 mW 42ºC
8.81
MB/s 1766 mW 42ºC
9.72
SOM
power
SOM
temp
Environment conditions
n Full screen
Glmark2
Glmark2 runs a series of tests, rendering different kinds of 2D and 3D graphics and animations on the
screen and then measures the output performance in terms of frames per second (fps). It then
averages out the fps across all the tests to calculate a score for the GPU.
VPU
Command
~# glmark2-es2-wayland --fullscreen
Results
Test Resolution SOM variant Interface Score Metric SOM power SOM temp
Glmark2 1280x800 Quad LVDS0 204 Glmark2 score 2041 mW 51ºC
Environment conditions
n Full screen
n Playback:
ConnectCore® 8M Nano Performance and Power
20
Page 21

Performance tests Audio
l Video files (video codec, audio codec)
o
You can find videos with different resolutions and format
here:https://filesamples.com/categories/video
n Recording:
l MIPI camera model: Pcam 5C Digilent
l Video codecs
o
MOV H264
Gstreamer video playback (decoding)
This test plays videos with different codecs and measures the performance in frames per second (fps).
Command
~# gplay-1.0 <video-file>
Results
Audio
Test
Gstreamer
Display
resolution
1280x800 Quad
SOM
variant
video
playback
(decoding)
*Testedwith dey-3.0-r3.2 firmware
Environment conditions
n Playback audio files
l WAV 44100 Hz, 16 bit, stereo
l MP3 128 Kbps, 16 bit, stereo
n Recording audio files
l WAV 44100 Hz, 16 bit, stereo
l WAV 22050 Hz, 16 bit, stereo
Video
codec
AVI
Mpeg4
MOV
H264
Audio
codec
AC3
surround
AAC
surround
Video
resolution Score Metric
1920x1080
fps 1802mW48 ºC
24
(Full-HD)
1280x720
fps 1462
24
(HD)
1920x1080
(Full-HD)
1280x720
(HD)
24 fps 2700mW54 ºC
24 fps 2202mW50 ºC
SOM
power
mW
SOM
temp
ConnectCore® 8M Nano Performance and Power
21
Page 22

Performance tests Audio
Audio playback
This test plays audio files in different formats. The only score is the power consumption.
You can find sample audio files here:https://filesamples.com/categories/audio.
Command
/* Wav files */
~# aplay <file>
/* MP3 files */
~# gst-launch-1.0 filesrc location=<file> ! id3demux ! queue ! beepdec ! alsasink
Results
Test SOM variant Audio file SOM power SOM temp
Audioplayback(decoding) Quad WAV 44100 Hz, 16 bit,stereo 1169 mW 42 º C
MP3128Kbps,16 bit, stereo 1184 mW 42 ºC
Audio recording
This test records audio files in different formats. The only score is the power consumption.
Command
~# arecord -f cd sound.wav --duration 60
~# arecord -f S16_LE -c 2 -r22050 sound.wav --duration 60
Results
Test SOM variant Audio file SOM power SOM temp
Audioplayback(decoding) Quad WAV 44100 Hz, 16 bit,stereo 1169 mW 42 ºC
WAV22050 Hz, 16 bit, stereo 1195mW 42 ºC
ConnectCore® 8M Nano Performance and Power
22
Page 23

Additional information Audio
Additional information
See the ConnectCore 8M Nano documentation portal for additional information, including hardware
reference manuals, comprehensive software documentation, links to design documents, and
hardware compatibility reports.
ConnectCore® 8M Nano Performance and Power
23
 Loading...