

Page 1
The power behind competitiveness
Delta Power Monitor
User Manual
R4E
(for energy storage system.)
www.deltaww.com
Page 2

Page 3

Contents
■Introduction■
Precautions for Your Safety
Essential Points for Safety
Precautions for Use
Equipment Specification Considerations
Caring for the Product
1.Information on The Product
1.1.Principal Features
1.2.Power Monitor Set
1.3.Descriptions and Functions of Parts and Components
2. Installation Method
2.1.Wall Installation
2.2.Desktop Installation
2.3.Guiding the AC Adapter Cable
3.What Power Monitor can do
3.1.Principal Functions
3.2.Operation Screens
3.3.Interpreting and Operating Power Monitor
3.3.1.Home screen
3.3.2.Energy Log
3.3.3.Information
3.3.4.Setting
3.3.5.Inverter Status
4.When Something Seems Wrong (Troubleshooting)
4.1.Error Displays
4.2.Troubleshooting
5.Specifications
5.1.Power Monitor
5.2.Power Meter
5.3.Wireless Communication Unit (Wireless Set)
5.4.USB Wireless Module (Wireless Set)
5.5.Wireless Communication Unit for Inverter (Wireless Set)
04
06
07
08
09
10
11
14
19
20
20
21
22
23
23
26
59
67
84
85
87
89
90
91
91
92
3
■Note on expressions in this document■
Please note that product appearance, illustrations, screen depictions and data are
images only. They may vary slightly from the actual product. Please keep that in mind.
Page 4
This User Manual provides precautions with the following notations and symbols for safe use of
the Power Monitor Set (for energy storage system.) (Power Monitor: R4E; Power Meter: P1E / P3E;
Wireless Communication Unit: N1E; Wireless Communication Unit for Inverter: N2E; Battery and
USB Wireless Module).
The expression “Product” refers to the Power Monitor, Power Meter, Wireless Communication Unit,
and Wireless Communication Unit for Inverter and USB Wireless Module. Precautions described
herein contain important aspects of safety.
Please observe and follow these descriptions.
Notations and symbols are described below:
Notations for safe use of the product and their meanings
Precautions for Your Safety
Failing to handle the Product properly may result in the described danger
leading to slight or intermediate level injuries and in some cases may also
result in serious injury or death.
Failing to handle the Product properly may result in the described danger
leading to slight or intermediate level injuries or property damages in some
instances.
■ Explanation of graphic symbols
● Electric Shock Precaution
Notifications pertaining to precautions for potential electric shock,
under specific conditions
● General
Unspecified general notifications pertaining to prohibited actions.
● Disassembly prohibited
Notifications pertaining to prohibition of equipment disassembly,
when doing so can potentially lead to injuries such as electric shock.
● General
Unspecified general notifications pertaining to instructions for users
4
Warning
Caution
Introduction
Page 5
Do not allow any fire producing objects to be near the Product, or apply any spray,
including combustible gases, to the Product. The Product may ignite or explode in
the unlikely event such an occurrence takes place.
Do not touch the Product with wet hands.
The Product may cause injury due to electric shock or equipment malfunction may
occur in the unlikely event such an occurrence takes place.
Request the retailer where you purchased the Product or a specialist to perform
installation work, repairs, extensions, relocations and reinstallations of the Product.
Do not install the Product in a place that is subject to significant effects of vibration
and impact. There is danger of injury from the Product falling in some rare cases.
Do not install the Product in the following types of locations:
There is danger of burnout in some rare cases.
・
Locations that are exposed to rain water, such as outdoors or under eaves and the like.
・ Locations that are exposed to steam or where the moisture level is 30 to 85% RH,
such as lavatories, changing rooms, work sites, kitchens and the like.
・ Do not use organic solvents (paint thinners, benzene and the like), strong alkaline
substances or strong acidic substances to clean the case of the Product. There is
danger of discoloring the case or the equipment malfunctioning in some rare cases.
When installing the Power Monitor on a wall made of materials that are not wood,
be sure to acquire plastic anchors available on the market to secure the Wall
Surface/Desktop Mounting Plate on the wall surface. There is danger of injury from
the Product falling in some rare cases.
Warning
Caution
Do not conceal the wiring of the AC adapter, through such means as embedding
the cable inside a wall.
Furthermore, do not place any heavy objects such as a furniture on top of the cable
and avoid damaging the cable by rolling wheels, such as castors, over the cable.
The Product may ignite or explode in the unlikely event such an occurrence takes place.
Do not disassemble or modify the Product.
The Product may cause injury or fire due to electric shock in the unlikely event
such an occurrence takes place.
Request the retailer where you purchased the Product or a specialist to perform
installation work, repairs, extensions, relocations and reinstallations of the Product.
5
Introduction
Page 6

Items described below must be followed as they are necessary to secure safety.
1. Do not connect anything other than the dedicated AC adapter on the power source terminal of
the Power Monitor.
2. Request a specialist to dispose of the Product.
3. Pull the AC adapter off the power outlet when any abnormality is detected with the Product,
such as emission of smoke, heat or the like.
4. Turn OFF the power breaker, to which the Meter is connected when any abnormality is detected
with the Meter.
5. Do not install the Product in any place that is prevented from having air flow, such as inside
closets or under stairs.
6. Install the Product with the “DELTA” logo facing up when installing the Power Monitor on a wall.
When not installed on a wall, set the Product on the Wall Surface/Desktop Mounting Plate when
using the Product.
7. Take care to ensure no water or other liquid gets on the Power Monitor or the Meter.
8. There is danger of injury. Do not throw the Product.
9. Securely insert the AC adapter in a power outlet. Furthermore, periodically remove any dust on
the AC adapter.
10.The Product is not for outdoor use.
11.Do not install the Product at a high place or an unstable place when installing the product on a
desk.
Essential Points for Safety
6
Introduction
Page 7
1. The Product is not a specified measuring instrument that passed any certification criteria of any
designated accreditation organization as prescribed by the Measurement Act. The Product may
only be used to provide a rough indication on the amount of power.
3. The Product may malfunction or may be damaged by static electricity. Be sure to remove any
static electricity on the body, through such means as touching a metal object nearby, prior to
coming into contact with the Product.
2. A touch panel type liquid crystal display has been adopted for the Product. Do not press or hit
hard on the surface of the display.
4. Do not connect a telephone line or household LAN cable to the LAN terminal on the Power
Monitor and the Wireless Communication Unit. There is danger of the Product malfunctioning.
5.
Insert the AC adapter of the Power Monitor in the power outlet at all times when using the Product.
Removing the AC adapter from the power outlet will prevent the system from obtaining detailed
data during such period and result in the omission of graphs and the like.
6. Keep the power supply (breaker for solar power generation) of the Meter turned ON at all times
when the Product is in use.
Precautions for Use
7
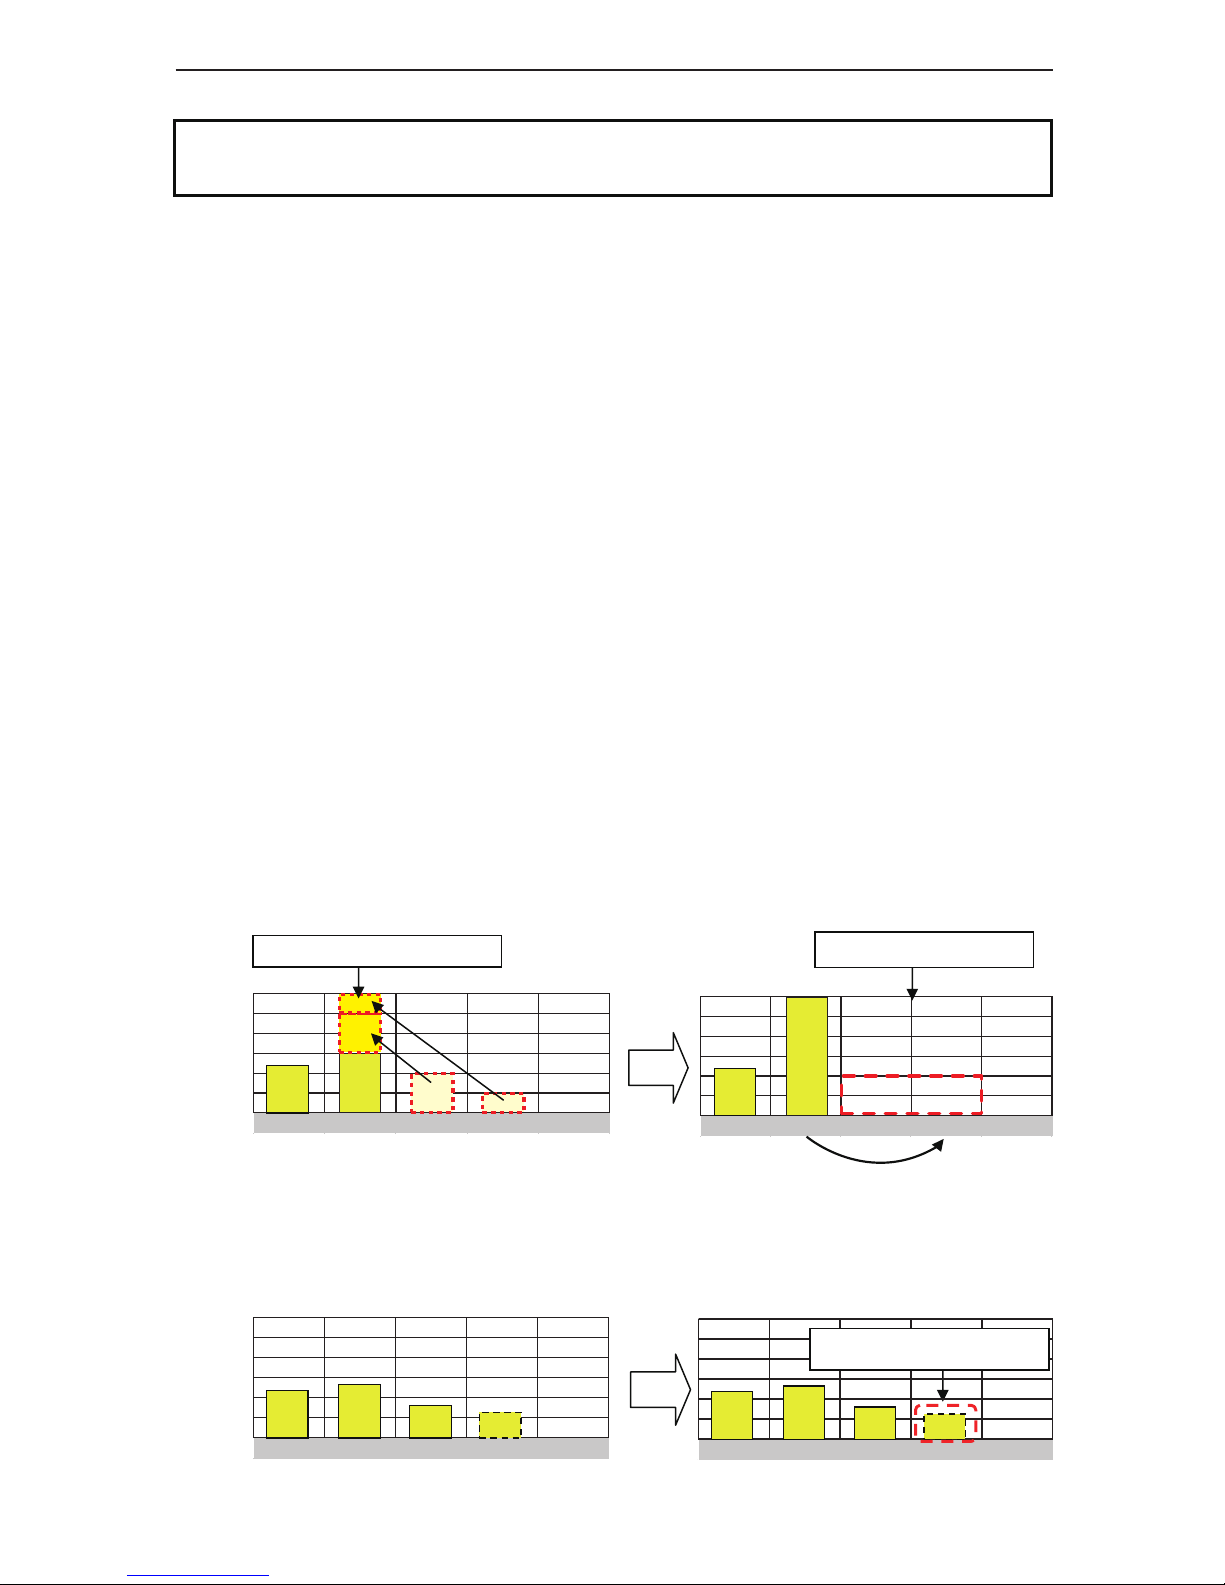
7. Reverting the date and time by at least a 15 minute interval into the past will result in the loss of
performance data. Set the date and time correctly.
Example : [A case where performance data is lost]
The time is inadvertently changed from 9:15 to 8:45 and then reverted to 9:15.
The performance data starting from 8:45 onwards are added to the performance data from 8:45
and the performance data for the period since 8:45 is lost. Lost data cannot be restored.
● Time is changed from 9:15 to 8:45.
● Time is changed from 8:45 to 9:15.
Example : [A case where performance data is not lost]
The time is inadvertently changed from 9:28 to 9:18 and then reverted to 9:28.
The performance data from 9:15 is fixed as of 9:30 and as such, the performance data is not lost,
as long as the time change does not extend to at least a 15 minute interval.
● Time is changed from 9:28 to 9:18.
● Time is changed from 9:18 to 9:28.
8:30 8:45 9:00 9:15 9:30
Data is added to that of 8:45.
Performance data is not lost.
Performance data is lost.
8:30 8:45 9:00 9:15 9:30
8:30 8:45 9:00 9:15 9:30
8:30 8:45 9:00 9:15 9:30
Introduction
Page 8

8. Do not install the Product in following types of locations:
a) A location with severe fluctuation of temperature.
b) A location that is exposed to
sea breeze (excluding the Wireless Communication Unit for Inverter).
c) A location that is exposed to volatile, combustible, corroding or toxic gases.
d) A location exposed to direct sun light.
e) A location exceeding the operating temperature range (-20 to +50°C) (5 to 35°C for the USB
Wireless Module).
f ) A location with altitude of 2,000 meters or higher.
g) A location with a large amount of dust (powder dust, sand dust, cotton dust, metal dust,
saw dust, straw dust and the like).
h) A location covered by metals or metal fittings, metals installed on walls, on top of a metal desk,
between metal products or near telephone unit, facsimile unit, personal computer, personal
computer peripheral device, television set, microwave oven or induction heating (IH) product.
9. Store the Product in a location with the temperature ranging between -20 and +60°C, with the
humidity ranging from 30 to 85% RH.
10. The Product communicates wirelessly.
Install the Product as far away as possible from devices that emit strong radio waves, such as a
civil band radio equipment.
11. The communication performance varies depending on the peripheral environment. Verify in
advance that the Product is communicating normally when installing the Power Monitor on a wall.
12. Avoid installing the Power Monitor near iron plate or steel reinforcements and try to install the
Product with as much clear space as possible.
13. The Product is not compatible with the Total Amount Purchasing System of the Feed-in Tariff
Scheme for Reusable Energy.
14. Do not pull out the USB Wireless Module while the power is turned on. Communication with the
personal computer and the Meter will no longer be possible.
15. Turn OFF the power breaker for the solar power generation on the power distribution board,
remove the AC adapter of the Power Monitor from the power outlet, and contact the retailer where
the Product was purchased when any instance of radio frequency interference occurs with the Product.
16. Do not use any USB Wireless Module other than the one that was bundled with the Product.
1. The value displayed as power consumption may be greater than (or smaller than) the actual value
when the power being generated fluctuates due to fluctuation of sun light or the like. This arises
from the difference in the timing of data acquisition for the power production from the power feed-in
and purchase and is not due to a malfunction of the Product.
2. The amount of power purchased displayed on the Home screen or Log screen may differ from
the power amount indicated on statements from the power company, due to such causes of errors
as those described below:
(1) Errors in measurement: The error arising from the fact that the instrument used by the power
company for the purpose of calculating the amount of power purchased is not a specified
measuring instrument but instead it is another equipment.
(2) Errors in calculation: The error arising from rounding up or rounding off of figures in the
calculation and display process of the Power Monitor.
Equipment Specification Considerations
8
Introduction
Page 9

Caring for the Product
Cleaning of the Product is recommended, in order to make it possible for you to use the Power
Monitor in the best possible condition at all times.
● Cleaning method
A touch panel has been adopted for this Product, the display on which becomes difficult to view
when soiled with fingerprints, sweat or oil.
・ Wipe dry with a piece of dry, soft cloth.
Do not remove soiling by using excessive force. Doing so may result in the display being scratched
and can also cause malfunction.
・ Do not apply any tape, plastic or rubber matter on the Product for a long period of time.
The Product may be soiled. In such an event remove the soiling when cleaning.
9
Introduction
Page 10

The Product is intended for verifying the status of a solar power generation system. The Product
collects and takes measurements of respective power information, to display results as well as store
performance data for a prescribed period of time or provide assistance to save energy based on such
information.
● A 7-inch color liquid crystal display is adopted to provide a clear display.
● The LED backlight feature is adopted to reduce power consumption.
● A real-time display of the power production and consumption are provided.
● The degree of freedom in the selection of location for installation has been improved with the
support of the wireless communication (when the Wireless Set is in use).
● The Energy Saving Guide function has been incorporated.
● R4 is specifically used with energy storage solar system.
● User can view the status of the inverter and battery and
set up charge and discharge mode to battery
● The background image of the Home screen can be changed.
● Performance data can be output and loaded onto a personal computer.
● Setting feature of the Grid Setting is available.
● The touch panel is adopted for easier operations
※ Notes on basic operation of the touch panel
Power Monitor is operated by using a touch panel, which is manipulated by touching with a fingertip.
The basic operation of the touch panel is described below.
1.Information on The Product
1.1.Principal Features
10
■ Touch
Touch lightly on the screen surface with a finger.
Information on The Product
Page 11
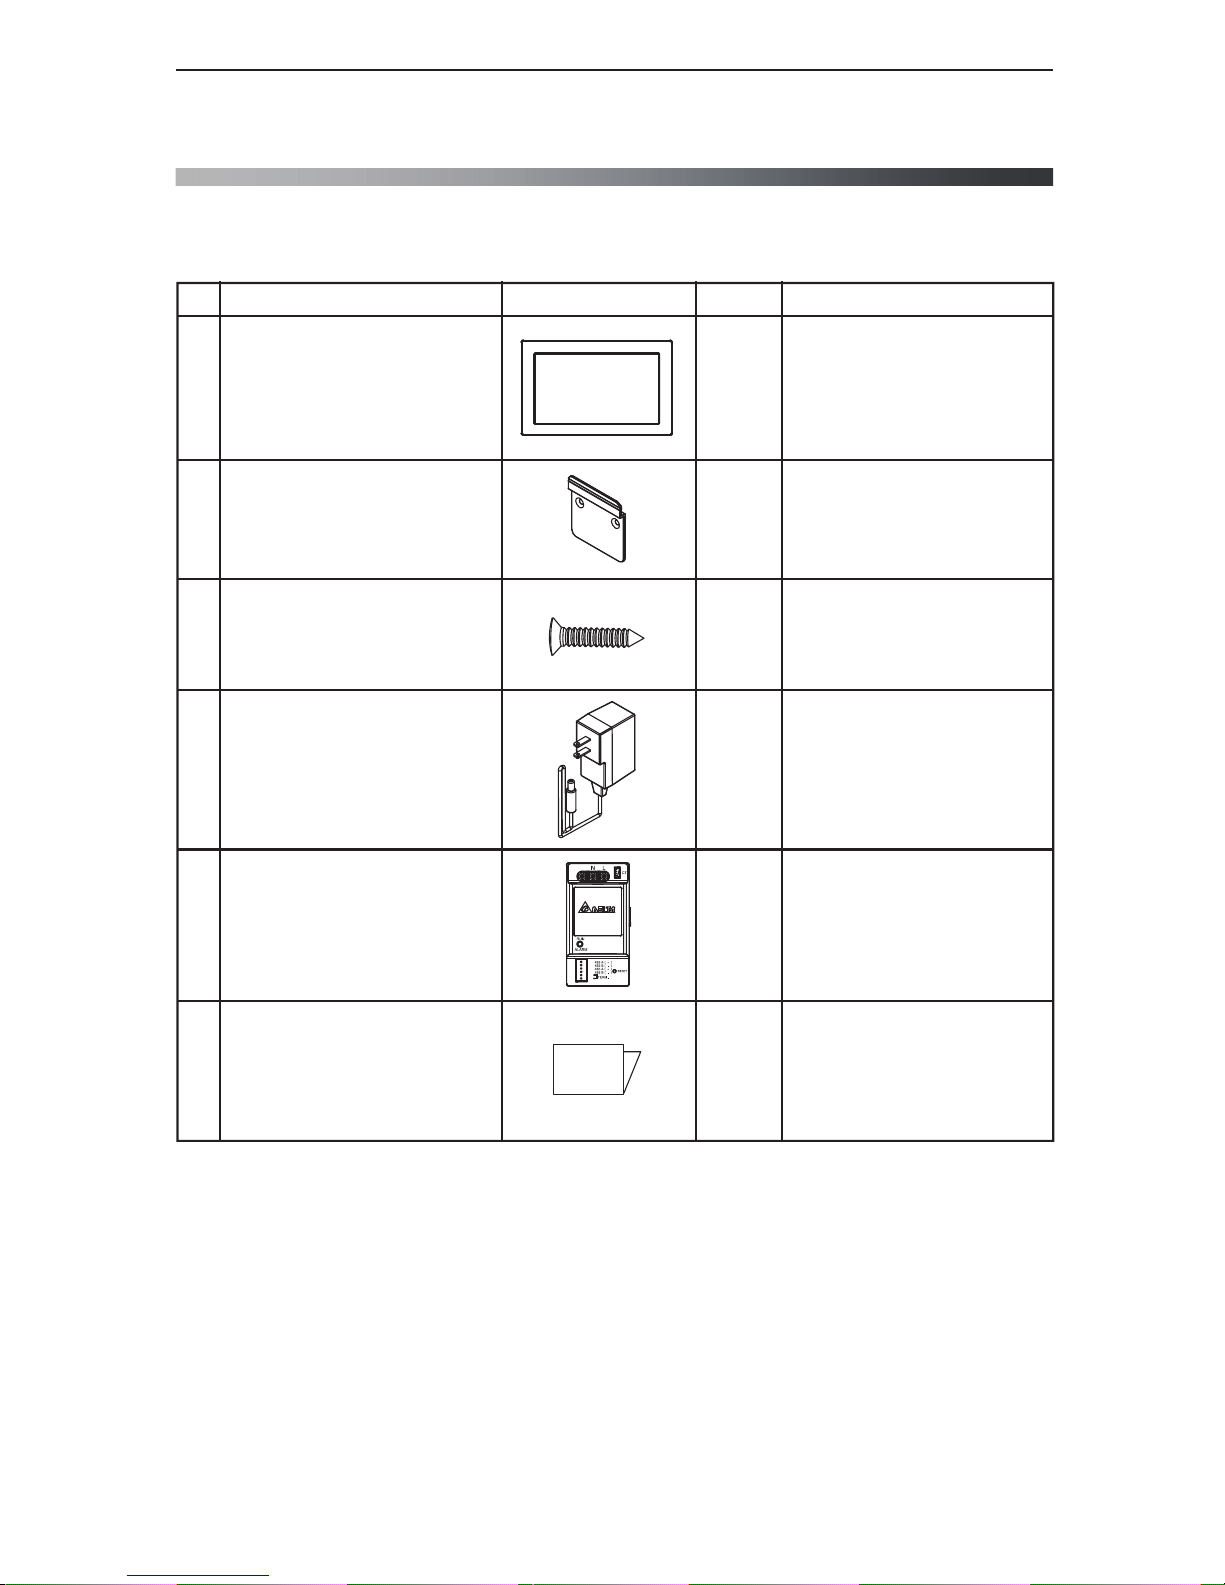
Verify that following items are available for use prior to using this feature.
No
1
2
3
4
5
6
1 unit
1 pc
2 pcs
1 unit
1 unit
Product name
Power Monitor
Wall Surface /
Desktop Mounting Plate
Wood screws (+) for Wall Surface /
Desktop Mounting Plate
(dia. 4 x 20 mm)
AC Adapter
Power Meter
Shape Qty Remarks
This is a plate used to install
the Product on a wall or on a
desk.
These are wood screws for
the Wall Surface / Desktop
Mounting Plate.
This is the power supply for
the Power Monitor.
1.2.Power Monitor Set
11
Quickinstallationguide 1 copy
Information on The Product
■ Wired Set (S4E_1P)
Page 12
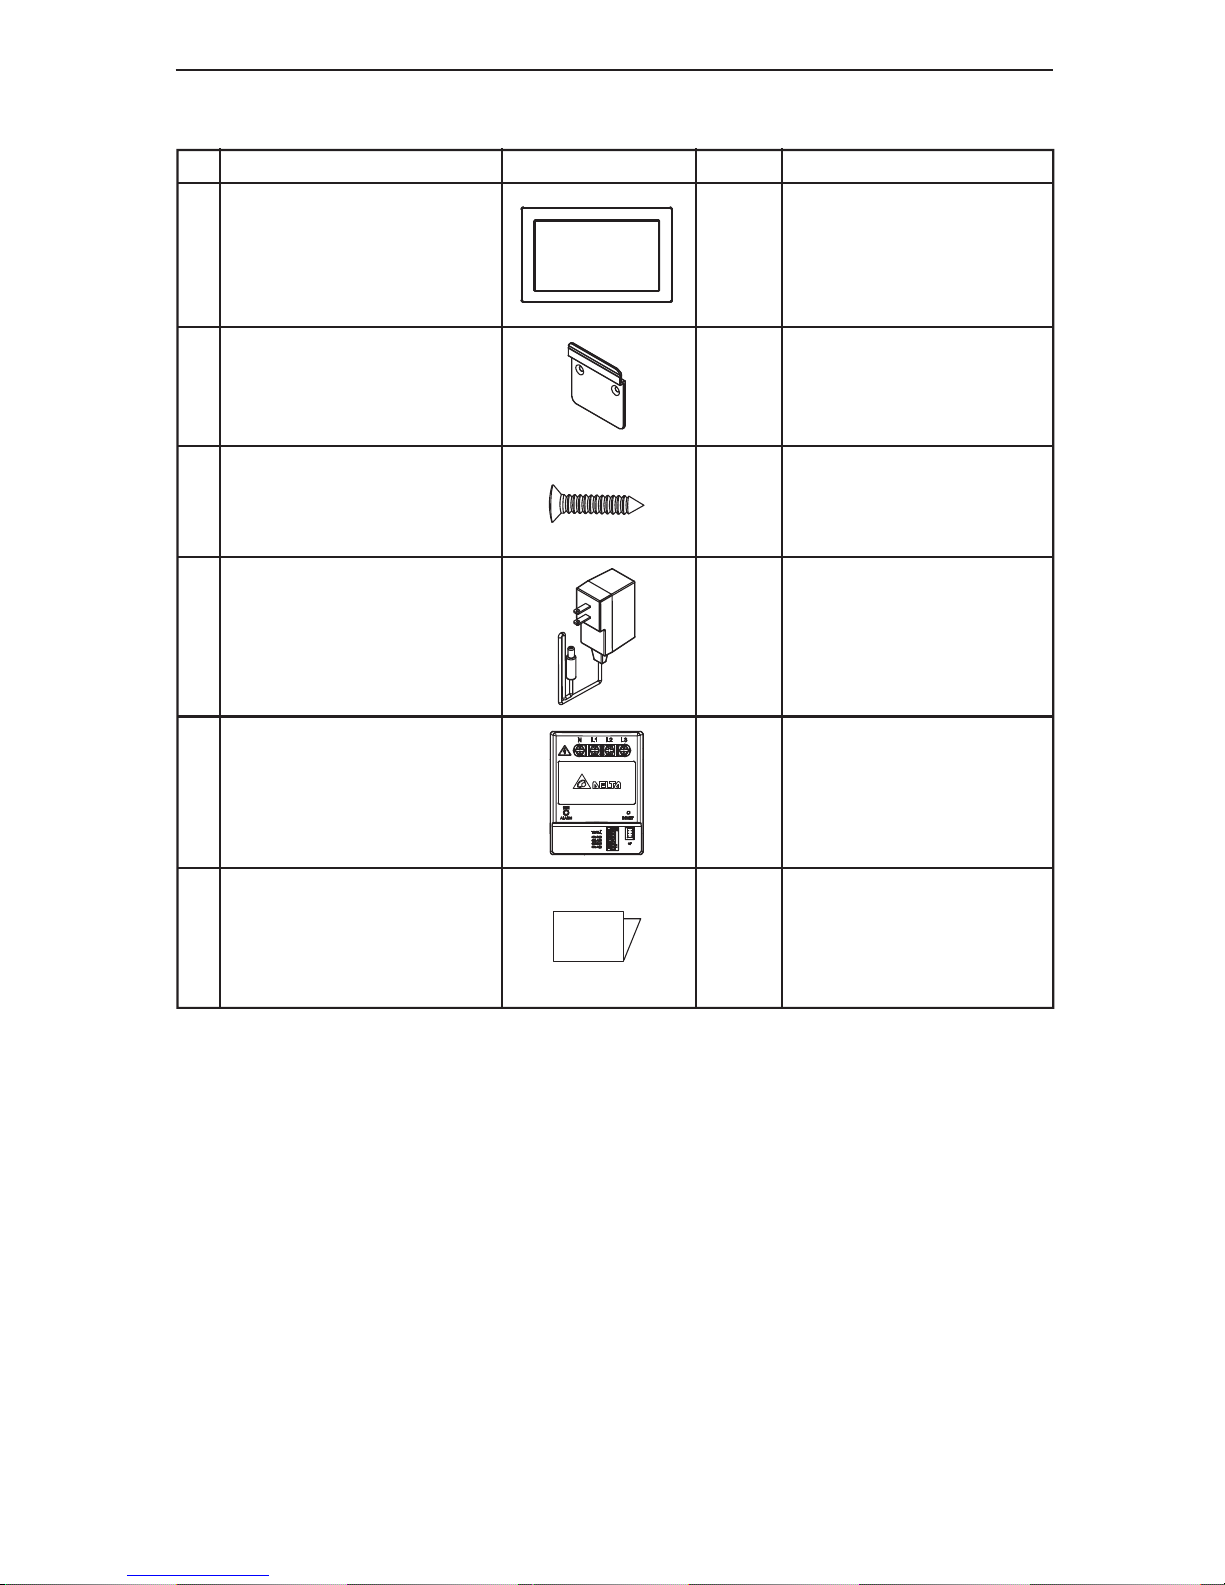
No
1
2
3
4
5
6
1 unit
1 pc
2 pcs
1 unit
1 unit
Product name
Power Monitor
Wall Surface /
Desktop Mounting Plate
Wood screws (+) for Wall Surface /
Desktop Mounting Plate
(dia. 4 x 20 mm)
AC Adapter
Power Meter
Shape Qty Remarks
This is a plate used to install
the Product on a wall or on a
desk.
These are wood screws for
the Wall Surface / Desktop
Mounting Plate.
This is the power supply for
the Power Monitor.
12
Quickinstallationguide 1 copy
Information on The Product
■ Wired Set (S4E_3P)
Page 13
13
Information on The Product
9
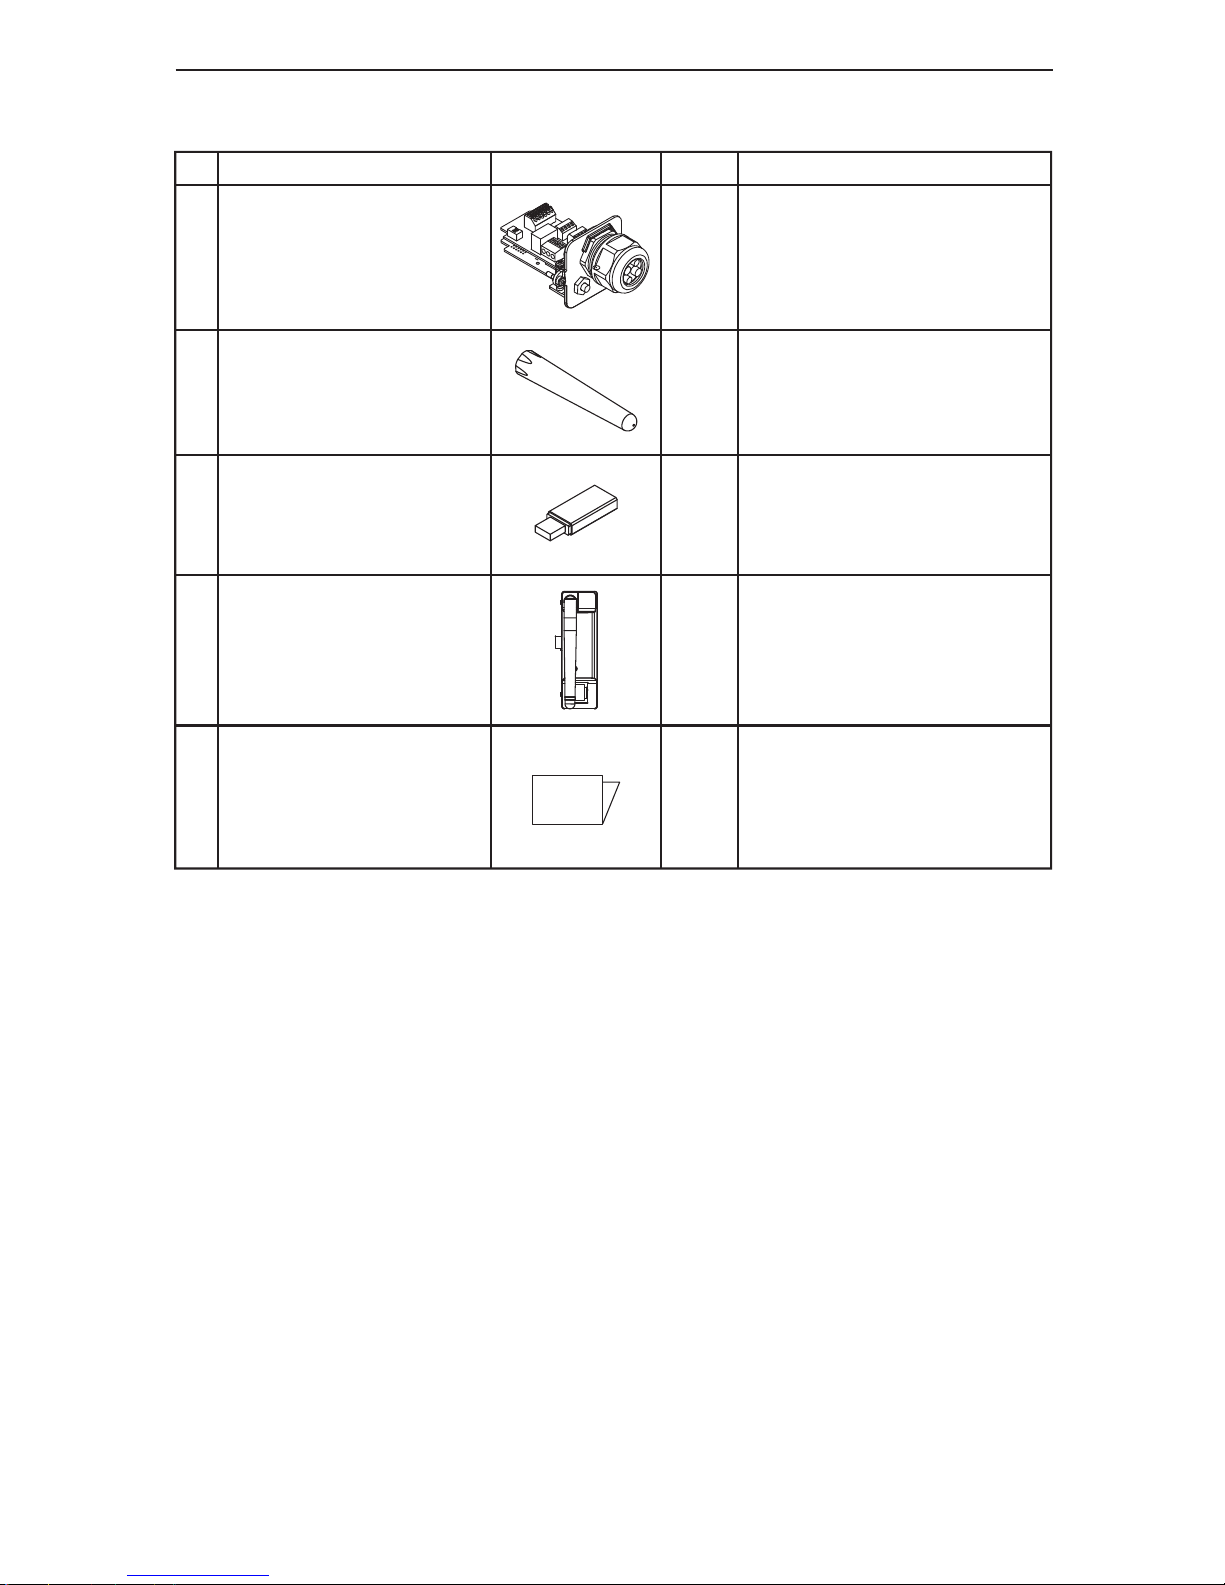
1 pc
USB Wireless Module
The unit converts the Power Monitor
into a wireless communication
system.
10
11
1 unitWireless Communication Unit
■ Wireless Set (S4E_WiFi)
7
8
1 unit
1 pc
Wireless Communication Unit
Antenna for Inverter
Wireless Communication Unit for
Inverter
This is an antenna that is mounted
on the Wireless Communication
Unit for Inverter.
The unit converts the Inverter
into a wireless communication
system.
No Product name Shape Qty Remarks
Quickinstallationguide
1 copy
Page 14
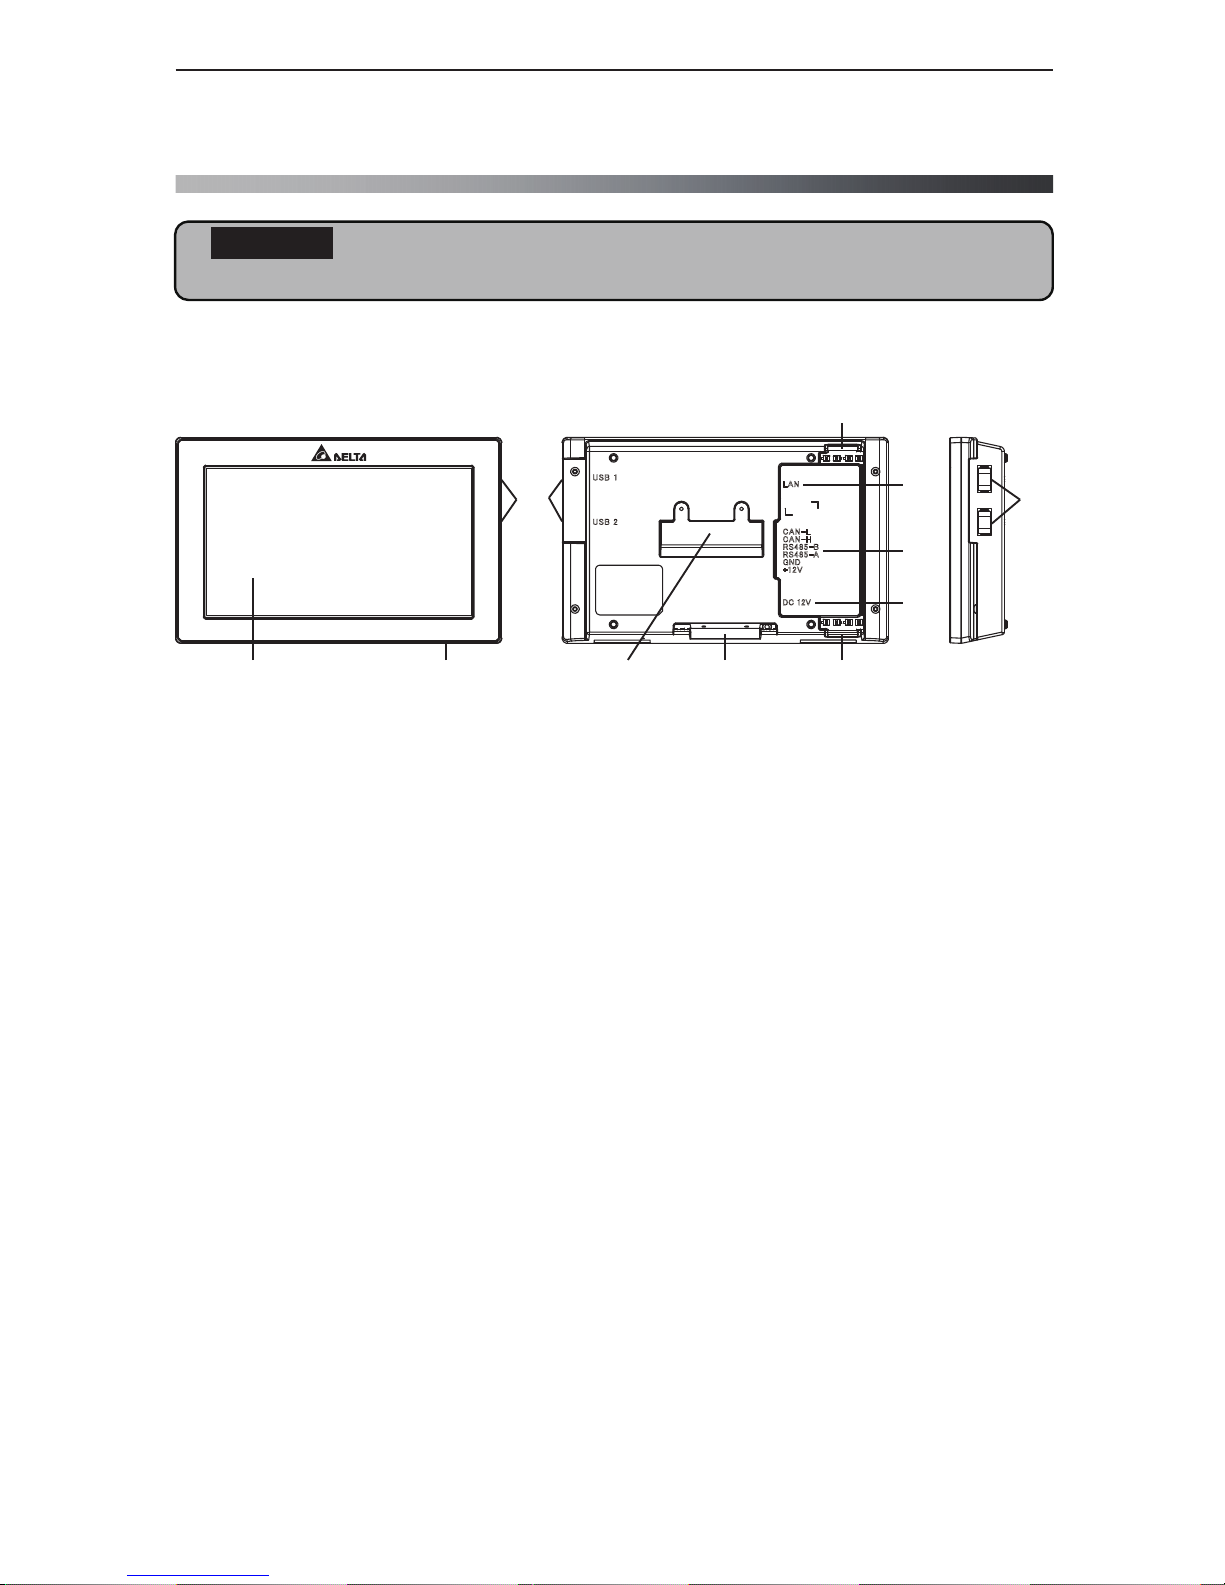
POWERMONITOR
■ Power Monitor
Important
Do not connect a telephone line or household LAN cable to the LAN terminal.
① LAN terminal (RJ-45 terminal) (fitted with a protective cover)
This is the terminal that is used to connect the system to an internet line. (A setup is required.)
② RS-485 (a 6-pin terminal)
This is the terminal that is used to connect a 6-pin connector provided, to link the supply of power
and signals from the Inverter.
③ Power Supply terminal
This is the terminal that is used to connect the AC Adapter provided.
④ USB Terminal (for USB 1 and USB 2) (fitted with a protective cover)
Downloading of various data and upgrading of software versions can be performed.
Furthermore, the monitor and the Inverter, as well as the Meter can be converted into a wireless
communication system by connecting the USB Wireless Module provided with the Wireless Set.
* Customers are requested to procure their own USB memory and USB cable.
⑤ Insertion slot for anchoring the Wall Surface Mounting Plate.
This is the insertion slot used to install the Wall Surface / Desktop Mounting Plate when installing
the Product on the wall.
⑥ Insertion slot for anchoring the Desktop Mounting Plate
This is the insertion slot used to install the Wall Surface/ Desktop Mounting Plate when installing
the Product on desktop.
⑦ Reset button
This is intended for use in maintenance work carried out by the manufacturer. Do not use this.
⑧ Wiring access
According to the prescribed wiring method, remove the tab on the wiring access, and guide the
cable through.
⑨ Touch Panel section
Displays are switched and various settings are performed by performing touch panel operations.
1.3.
Descriptions and Functions of Parts and Components
14
USB 1
USB 2
CAN-L
CAN-H
RS485-B
RS485-A
GND
+12V
LAN
DC 12V
①
②
③
④
⑥⑤⑦
④
⑨ ⑧
⑧
Front Back Side
Information on The Product
Page 15
15
Information on The Product
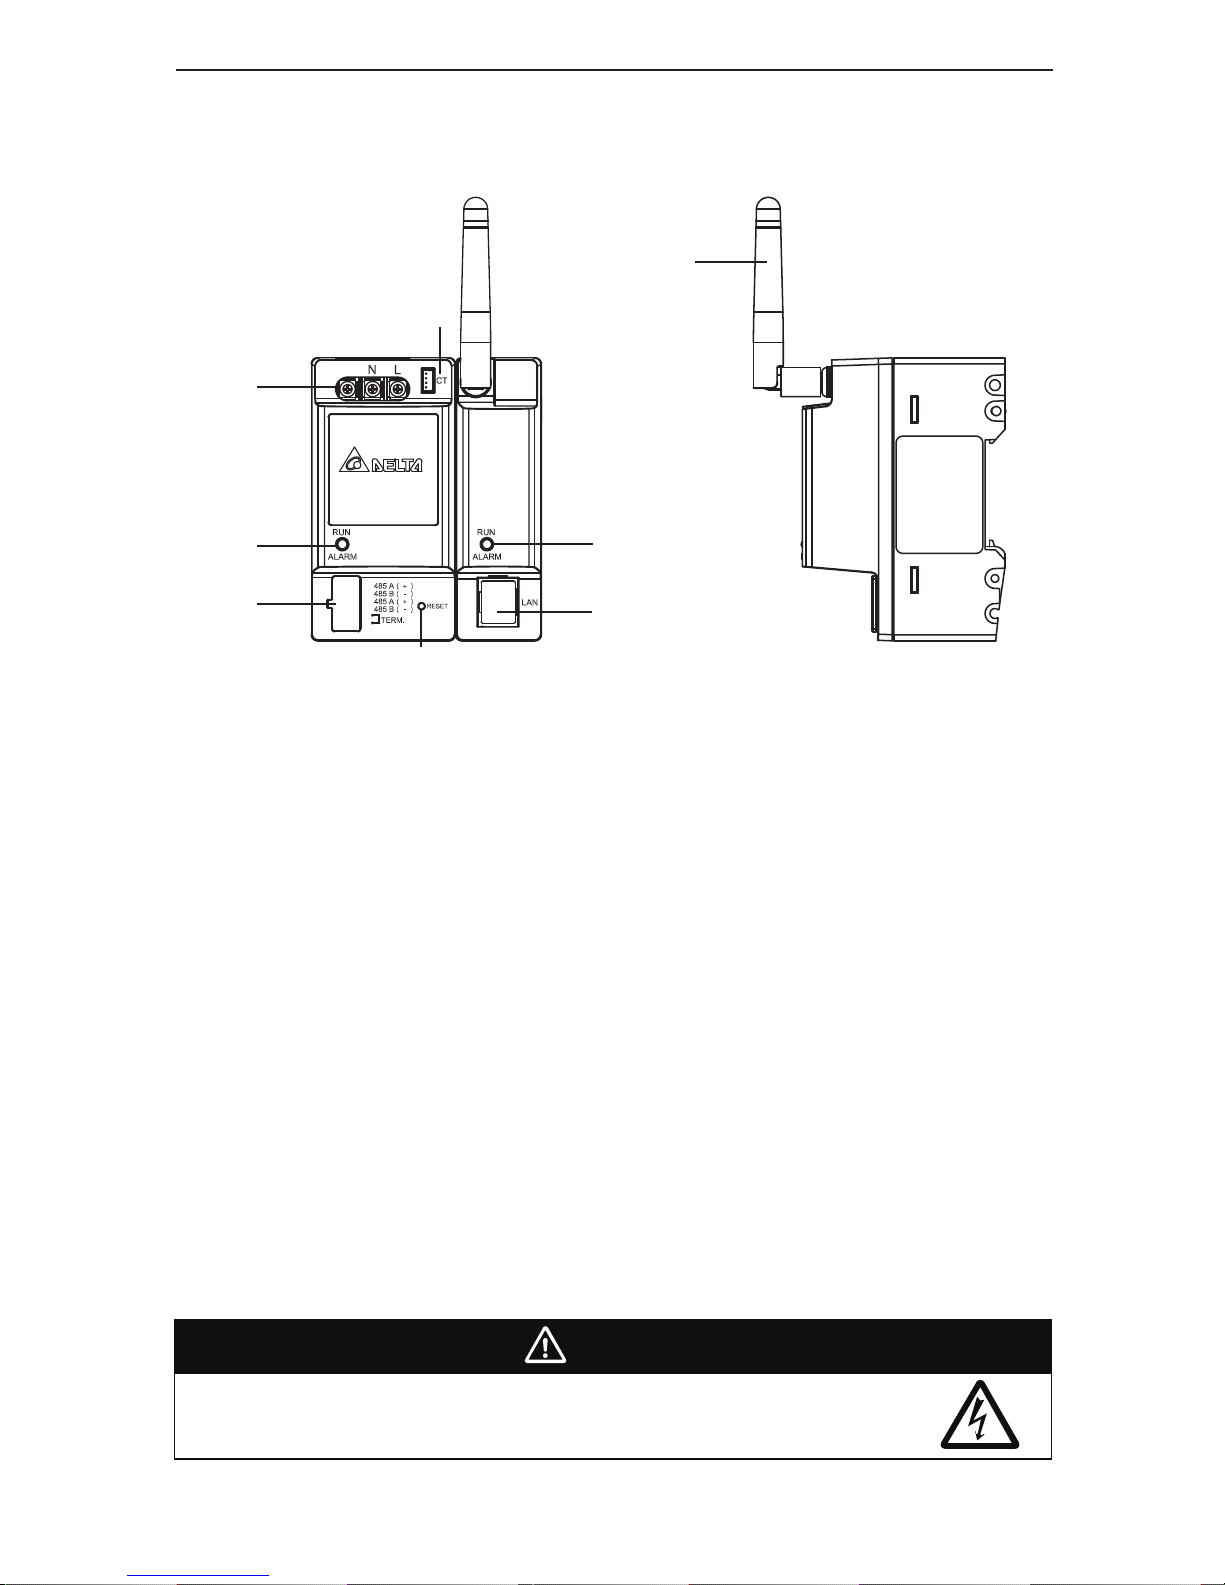
■ Meter & Wireless Communication Unit (P1E & N1E)
(The figure depicts a situation where the Meter and the Wireless Communication Unit have been
connected and the Antenna has been oriented upwards.)
① Power Supply Input terminal (fitted with a protective cover)
This is the terminal for connecting the voltage detection cable.
② Current Sensor Connection terminal
This is the terminal for connecting the current sensor cable.
③ Operation LED lamp
Green light turned on: Normal operation
Green light blinking: Standby or connection standby
Red light turned on: Hardware malfunction
Red light blinking: Communication interrupted
④ Communication Signal Input terminal (fitted with a protective cover)
This is the terminal for connecting the RS-485 cable.
⑤ Reset button
This is the Reset button for the Wireless Communication Unit. Pressing this button restarts the
Wireless Communication Unit. Holding this button down for five or more seconds reverts the
Wireless Communication Unit to the default setting. Caution is required.
⑥ Wireless Communication Unit Antenna
This is the antenna used to perform wireless communication with the Power Monitor. The antenna
can be detached from the main unit. (Do not remove the antenna.)
⑦ Operation LED lamp
Green light turned on: Normal operation
Green light blinking: Standby or connection not established
Red light turned on: Hardware malfunction
Red light blinking: Communication malfunction
⑧ LAN terminal (fitted with a protective cover)
This is intended for use in maintenance work carried out by the manufacturer. Do not use this.
(Do not remove the protective cover.)
Warning
Do not open the protective cover or touch the internal parts and components with
your hand. The Product may cause injury due to electric shock in the unlikely event
such an action is taken.
②
Front Side
⑤
①
③
④
⑥
⑦
⑧
Page 16
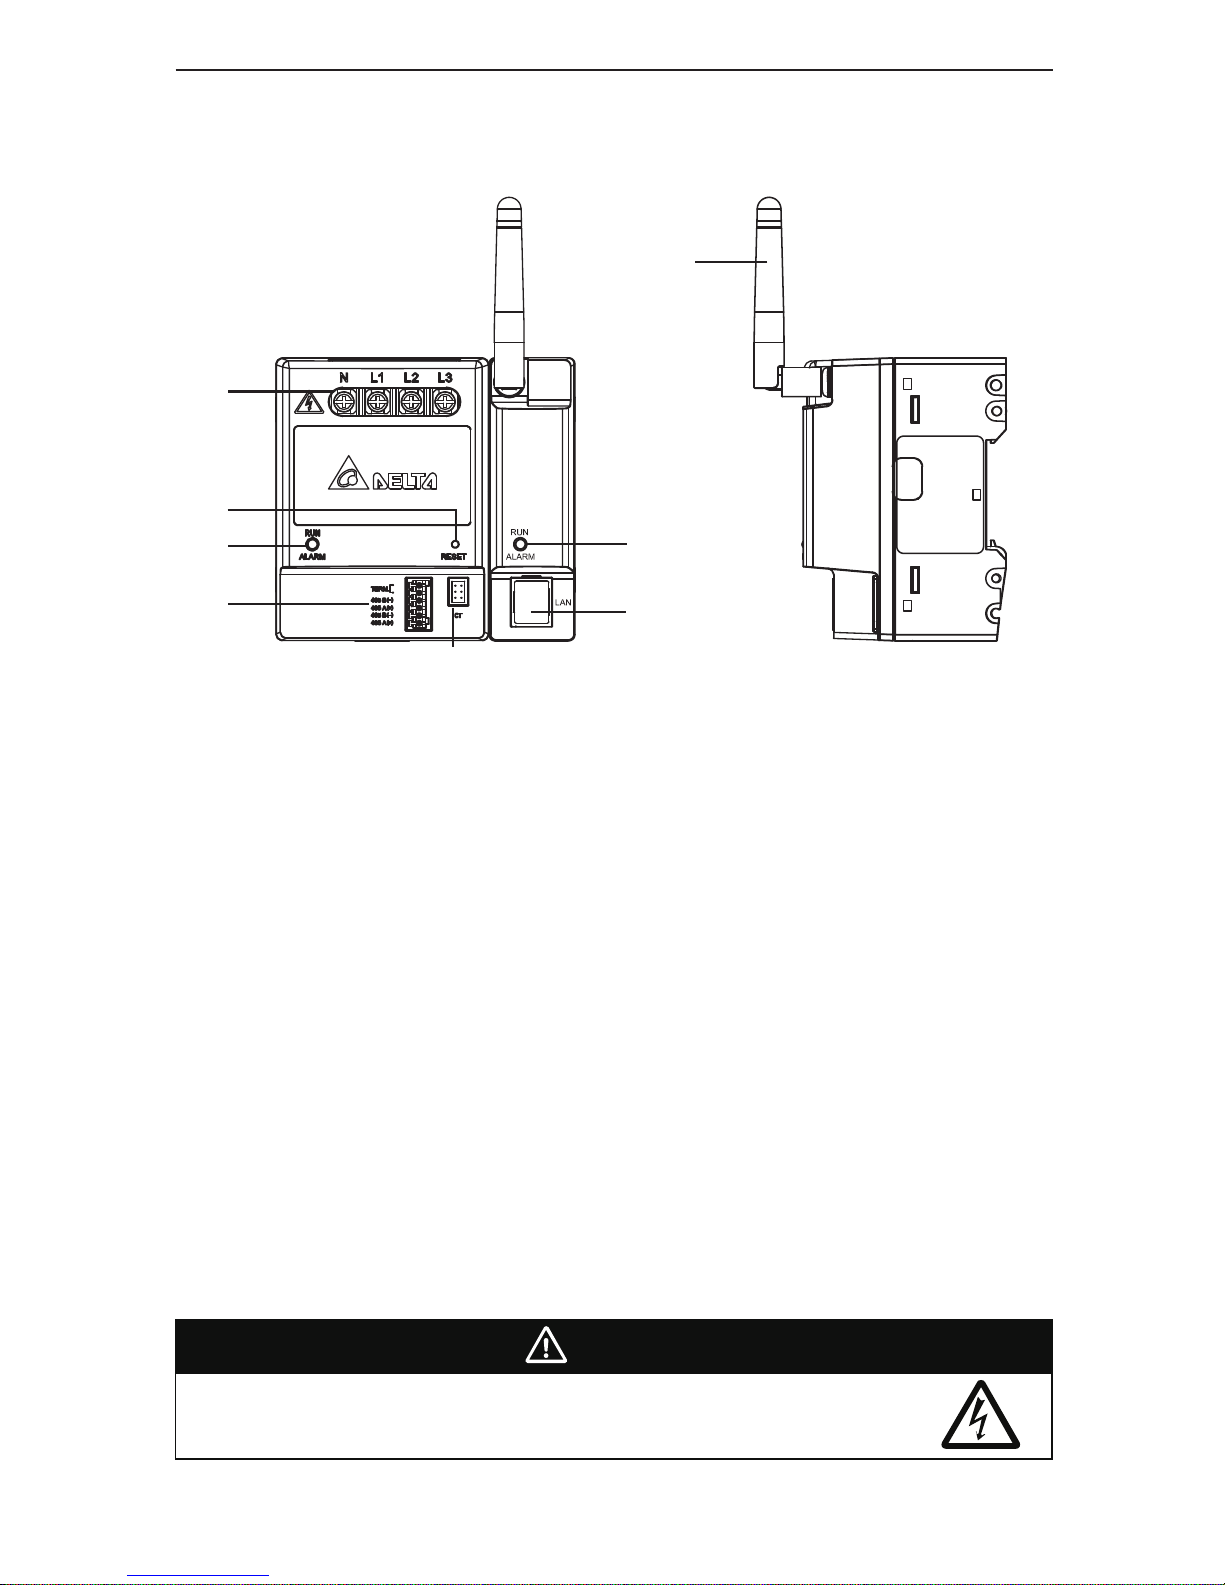
■ Power Meter & Wireless Communication Unit (P3E & N1E)
(The figure depicts a situation where the Meter and the Wireless Communication Unit have been
connected and the Antenna has been oriented upwards.)
① Power Supply Input terminal (fitted with a protective cover)
This is the terminal for connecting the voltage detection cable.
② Current Sensor Connection terminal
This is the terminal for connecting the current sensor cable.
③ Operation LED lamp
Green light turned on: Normal operation
Green light blinking: Standby or connection standby
Red light turned on: Hardware malfunction
Red light blinking: Communication interrupted
④ Communication Signal Input terminal (fitted with a protective cover)
This is the terminal for connecting the RS-485 cable.
⑤ Reset button
This is the Reset button for the Wireless Communication Unit. Pressing this button restarts the
Wireless Communication Unit. Holding this button down for five or more seconds reverts the
Wireless Communication Unit to the default setting. Caution is required.
⑥ Wireless Communication Unit Antenna
This is the antenna used to perform wireless communication with the Power Monitor. The antenna
can be detached from the main unit. (Do not remove the antenna.)
⑦ Operation LED lamp
Green light turned on: Normal operation
Green light blinking: Standby or connection not established
Red light turned on: Hardware malfunction
Red light blinking: Communication malfunction
⑧ LAN terminal (fitted with a protective cover)
This is intended for use in maintenance work carried out by the manufacturer. Do not use this.
(Do not remove the protective cover.)
Warning
Do not open the protective cover or touch the internal parts and components with
your hand. The Product may cause injury due to electric shock in the unlikely event
such an action is taken.
②
Front Side
⑤
①
③
④
⑥
⑦
⑧
16
Information on The Product
Page 17
Information on The Product
17
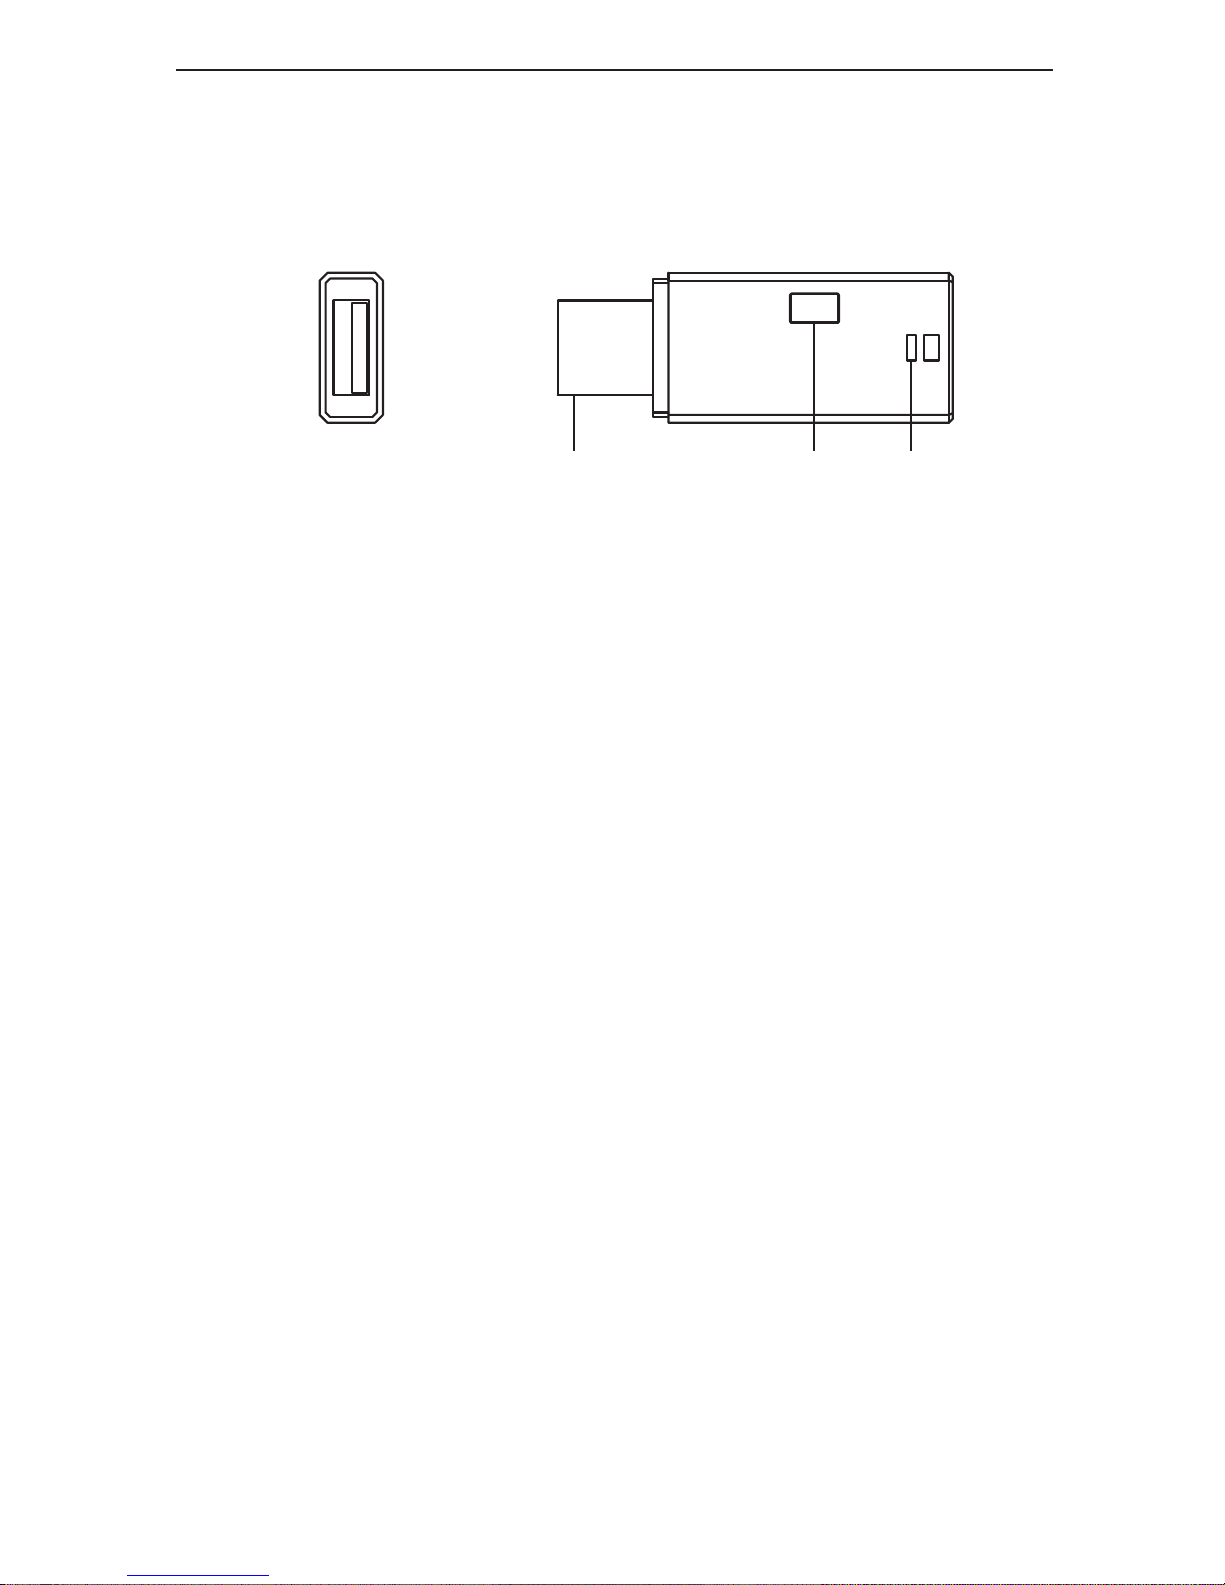
②① ③
■ USB Wireless Module (Wireless Set)
① USB insertion slot
This is installed on the USB terminal of the Power Monitor.
② Button Not used.
③ Operation LED lamp
Blue light blinking : Standby
Blue light on : Normal operation
Page 18
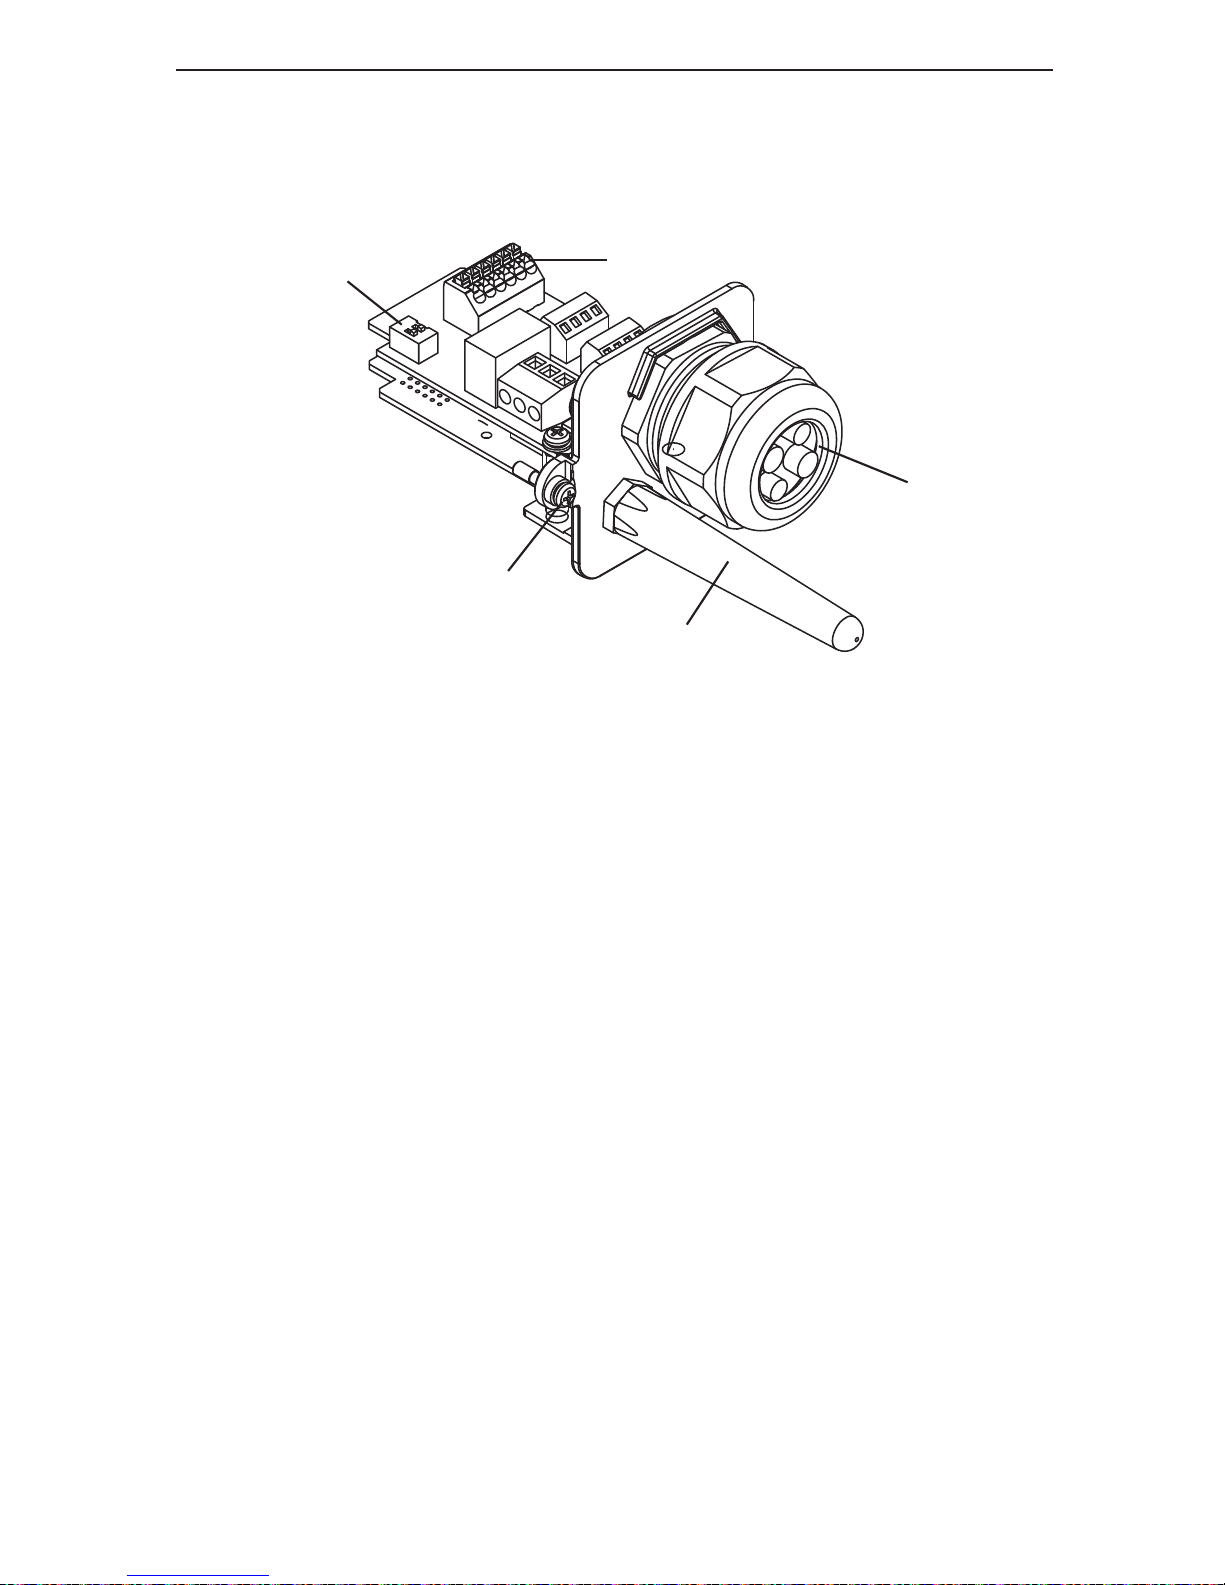
18
■ Wireless Communication Unit for Inverter
(The figure depicts a situation where the antenna has been installed.) (Wireless Set)
① Wireless Communication Unit Antenna for Inverter
This is the antenna used to perform wireless communication with the Power Monitor.
The antenna can be detached from the main unit.
(Do not remove the antenna.)
② Communication cable insertion slot
Not used.
③ RS485 terminal
Not used.
④ Terminal switch
Not used. (Default setting : ON)
⑤ Inverter anchoring screw
This is the screw used to secure the Inverter onto the main unit.
③
④
②
①
⑤
Information on The Product
Page 19
50mm
50mm
150mm
20mm
■ Separation distance from respective surfaces of
main unit
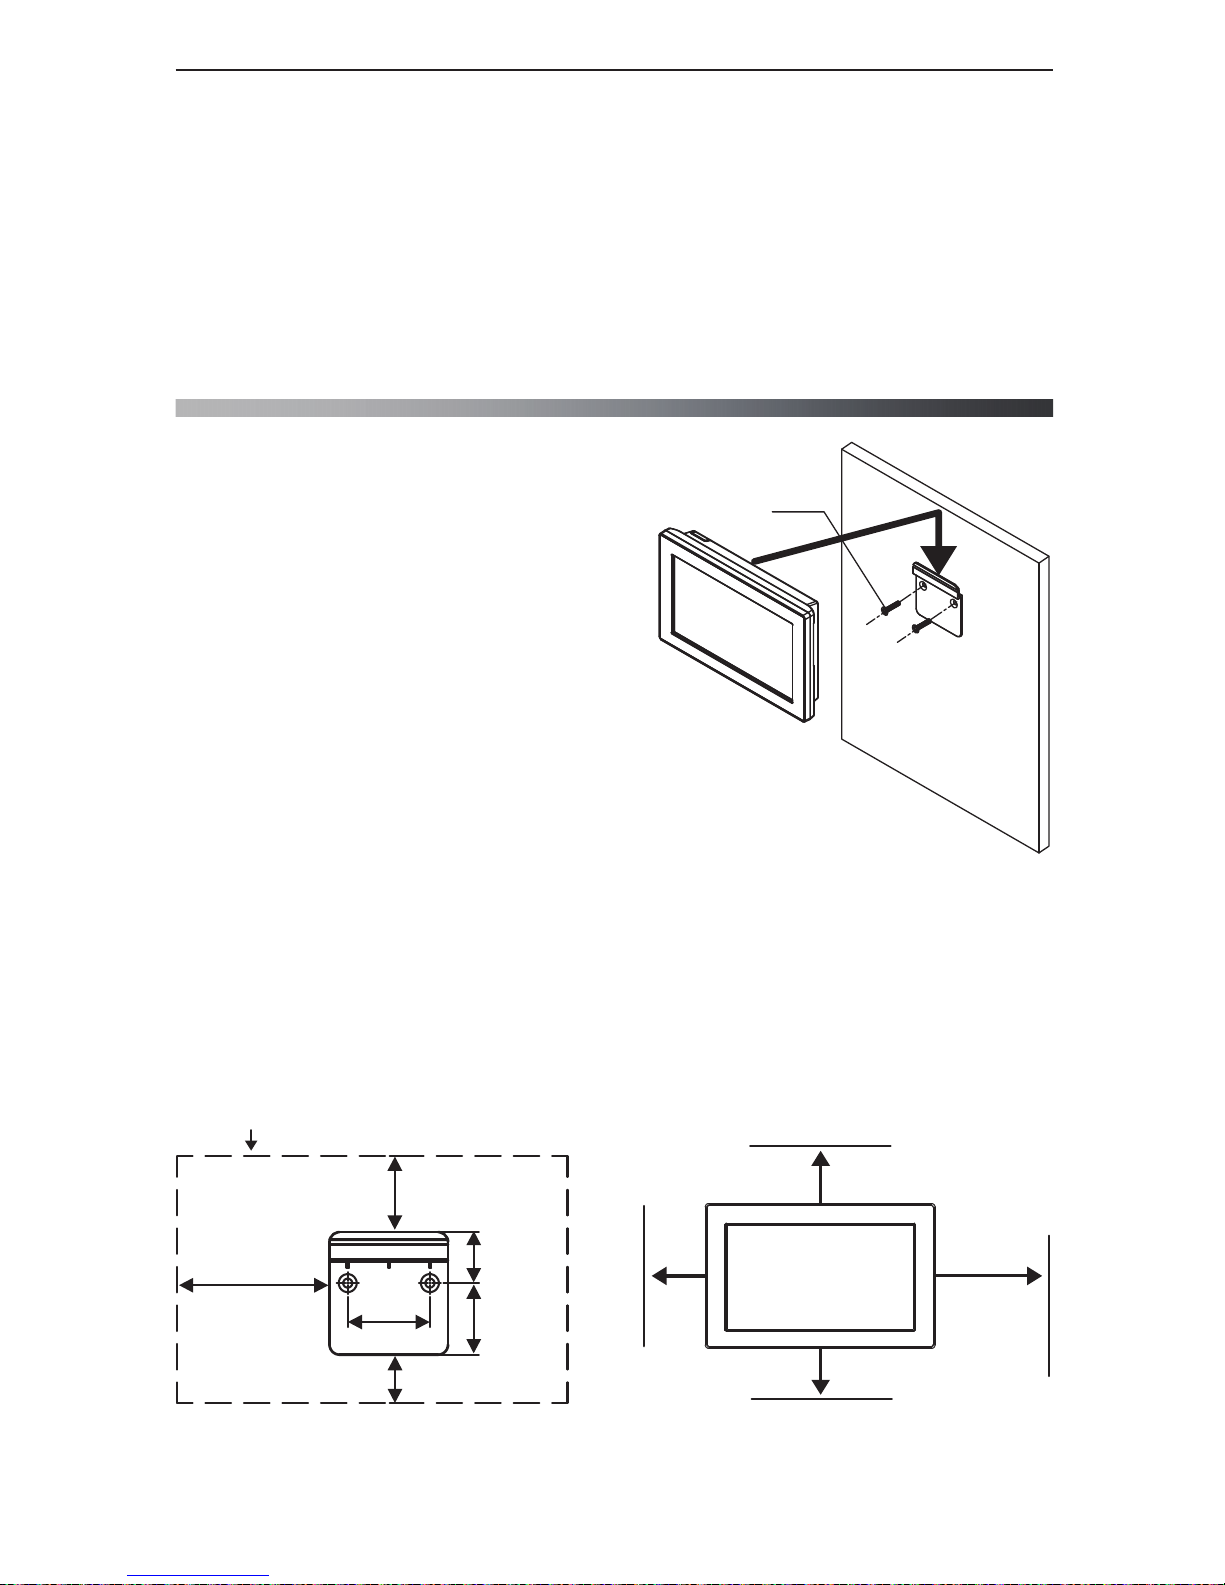
■ Installing Wall Surface / Desktop Mounting Plate on Power Monitor
Wood screws, 4 dia
①
②
③
The Power Monitor may be mounted on a desktop or on a wall surface for use.
“Wall Installation”, “Desktop Installation” and “Guiding the AC Adapter Cable” are respectively
explained in this chapter.
* Communication status between the Inverter and the Meter must be verified prior to installation,
in order to use wireless communication for the Power Monitor.
* Consult the retailer where you purchased the Power Monitor when relocating your Power Monitor.
2.Installation Method
2.1.Wall Installation
19
● Installation on wall
① Install the Wall Surface / Desktop Mounting Plate
on the wall, using the wood screws provided.
・ Install the Wall Surface / Desktop Mounting Plate on a location
that can withstand the weight of the main unit.
・ Use countersunk screws of 4 dia., when installing at a location
where the provided wood screws cannot be used.
・
Apply torque of 1.5 to 2.0 Nm when installing wood screws on a wall made of wooden materials.
・ Install on a flat wall surface.
② Verify the hooking portion of the Wall Surface / Desktop Mounting Plate and the Wall Mounting
Plate and the insertion slot for anchoring the Wall Surface Mounting Plate on the reverse surface
of the main unit, then press on the main unit until the insertion slot for anchoring is positioned
above the upper section of the Wall Surface / Desktop Mounting Plate.
③ Slide the main unit lower in that position and securely engage the hooking portion.
・
Hook on the insertion slot for anchoring the Wall Surface Mounting Plate on the reverse surface
of the main unit on the Wall Surface / Desktop Mounting Plate and shift down by approximately
1 centimeter.
36.7mm
25mm
35mm
23.3mm
74mm
40mm
■ Dimensions of Wall Surface / Desktop Mounting Plate
and the main unit
Main unit
Installation Method
Page 20
20
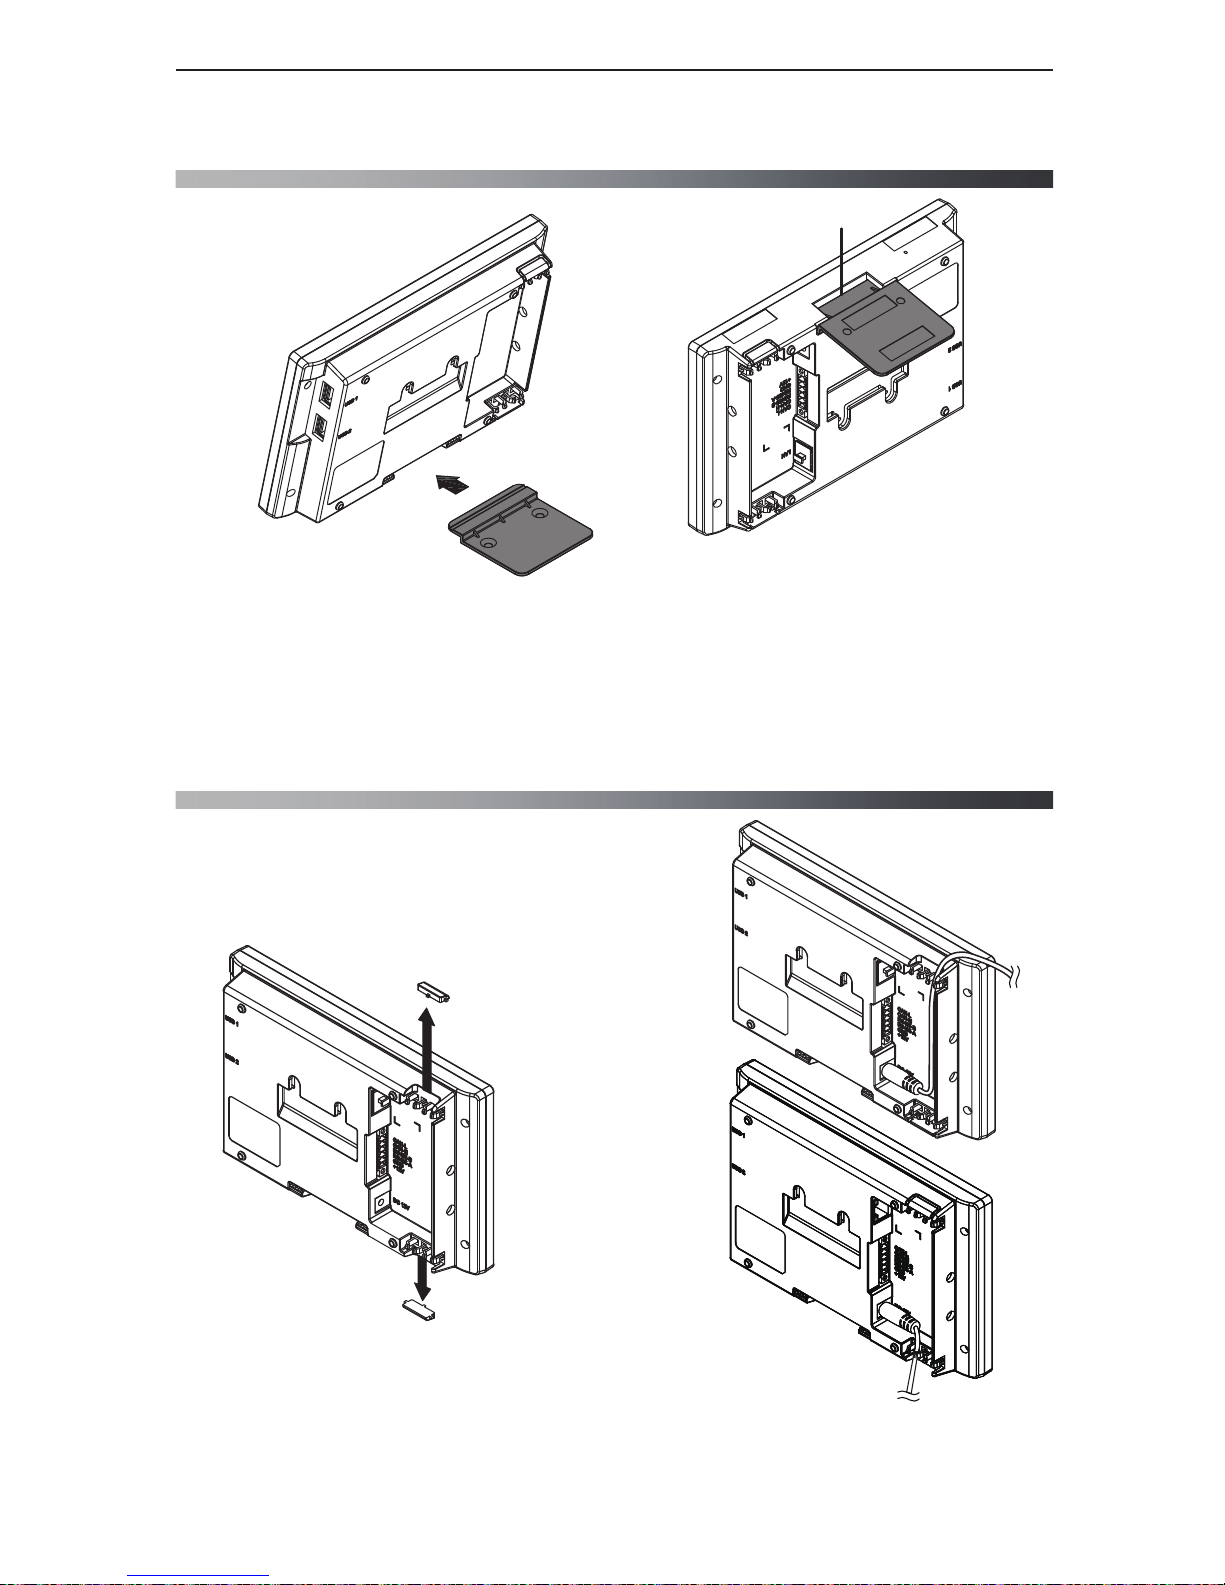
■ When wiring from bottom
■ When wiring from top
● Desktop installation method
① Insert the Wall Surface / Desktop Mounting Plate in the insertion slot for anchoring the Desktop
Mounting Plate at the lower section of the main unit, being careful about the direction the plate
is facing.
② Verify to ensure that there is no gap between the Wall Surface / Desktop Mounting Plate and
Part A at the bottom of the main unit, as shown in the figure to the right.
①
②
A
2.2.Desktop Installation
2.3. Guiding the AC Adapter Cable
②
②
①
Remove the tab on the wiring access, using a pair of pliers or the like.
(Remove burr with a pair of pliers to ensure that the cables are not scratched.)
② Guide through the cables.
There are two wiring accesses in the upper and lower sections
on the reverse side of the Power Monitor.
According to the prescribed wiring method, remove the tab
on the wiring access, and guide the cable through.
①
①
Installation Method
Page 21
The Power Monitor displays the power production status of the solar power generation system and
various information on a display screen.
The following types of information can be verified using the Power Monitor:
● Current system status can be verified.
User can check the power production, electricity trading status, operating status of inverter, and
charge and discharge status of inverter
● Past power status can be verified.
Power production, consumption, power feed-ins and power purchase status from the past can be
verified, in units of one day, one month, one year and 20 years. Furthermore, such data can also
be downloaded and used for proprietary compilation or management.
One Point
The amount of electric power purchased displayed on the Home screen or Log screen may
differ from the electric power amount indicated on statements from the power company, due
to such causes of errors as those described below:
(1) Errors in measurement: The error arising from the fact that the instrument used by the
electric power company for the purpose of calculating the amount of electric power
purchased is not a specified measuring instrument but instead it is another equipment.
(2) Errors in calculation: The error arising from rounding up or rounding off of figures in the
calculation and display process of the Power Monitor.
3.What Power Monitor can do
3.1.Principal Functions
21
What Power Monitor can do
Page 22
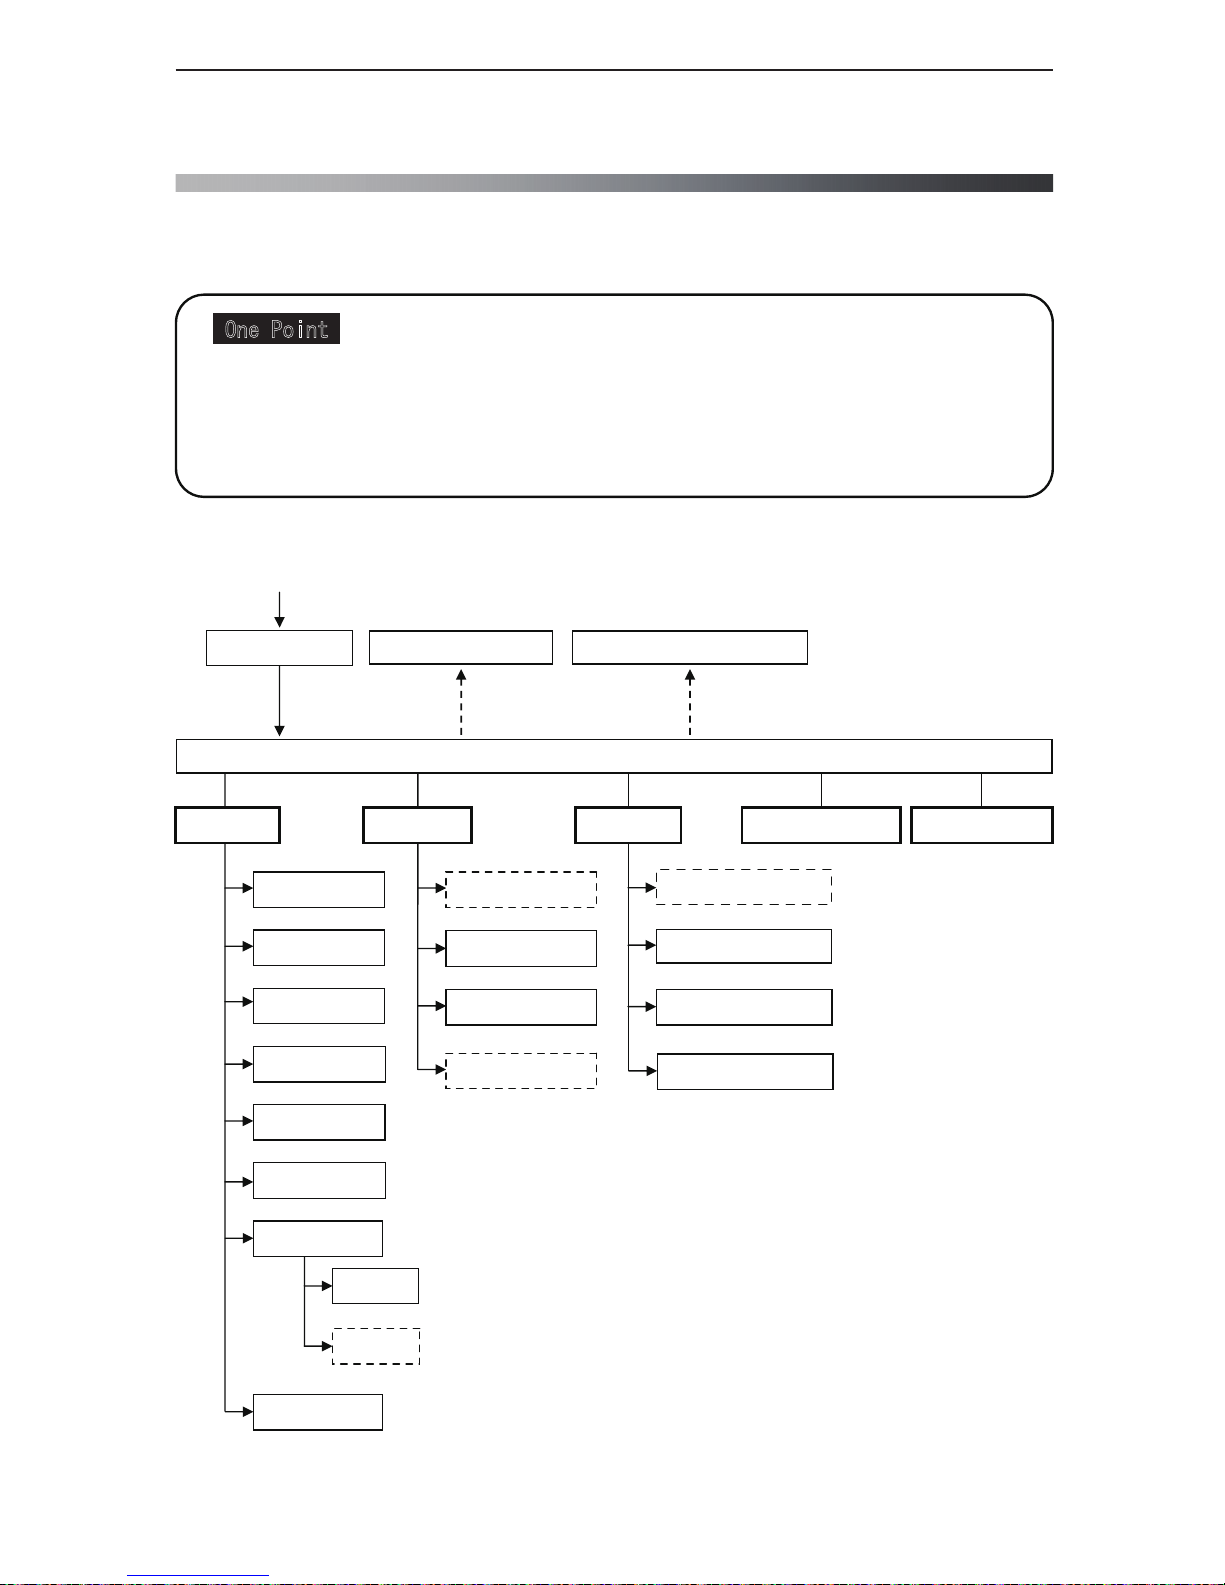
The display screen of the Power Monitor changes in the following manner, according to touch
panel operations and connection settings. Display details and operations of respective screen
are described in the “Display Functions” section.
■ List of Operation Screens
3.2.Operation Screens
22
One Point
・ The screens indicated by dotted arrow lines are displayed when a specific condition (such as
date/time not entered, connection settings and the like) is satisfied.
・ The screens surrounded by a frame of dotted line are not displayed when the Power Monitor
and the Inverter are unable to communicate with each other.
・ Screens indicated with solid lines are displayed for ordinary operations.
Power turned on (it takes about 10 seconds until the Startup screen is displayed )
Startup screen
Home screen
Today
Today (hour)
Month
Year
20 years
Calendar
Measurement
Battery
Plant
Inverter
Inverter
Grid Setting
Screen setting
Operation Mode
Page 84
Page 31
Page 33
Page 35
Page 37
Page 51
Page 58
Page 23
Page 53
Page 56
Page 61
Page 63
Page 29
Page 67
Page 68
Page 72
Page 59
Energy log
Connection Setting screen
Error Events Log
Connection Log
Time Setting screen
Information Setting Inverter status Slideshow
De-rating Log
Power Suppression
Page 82Page 65
What Power Monitor can do
Page 23
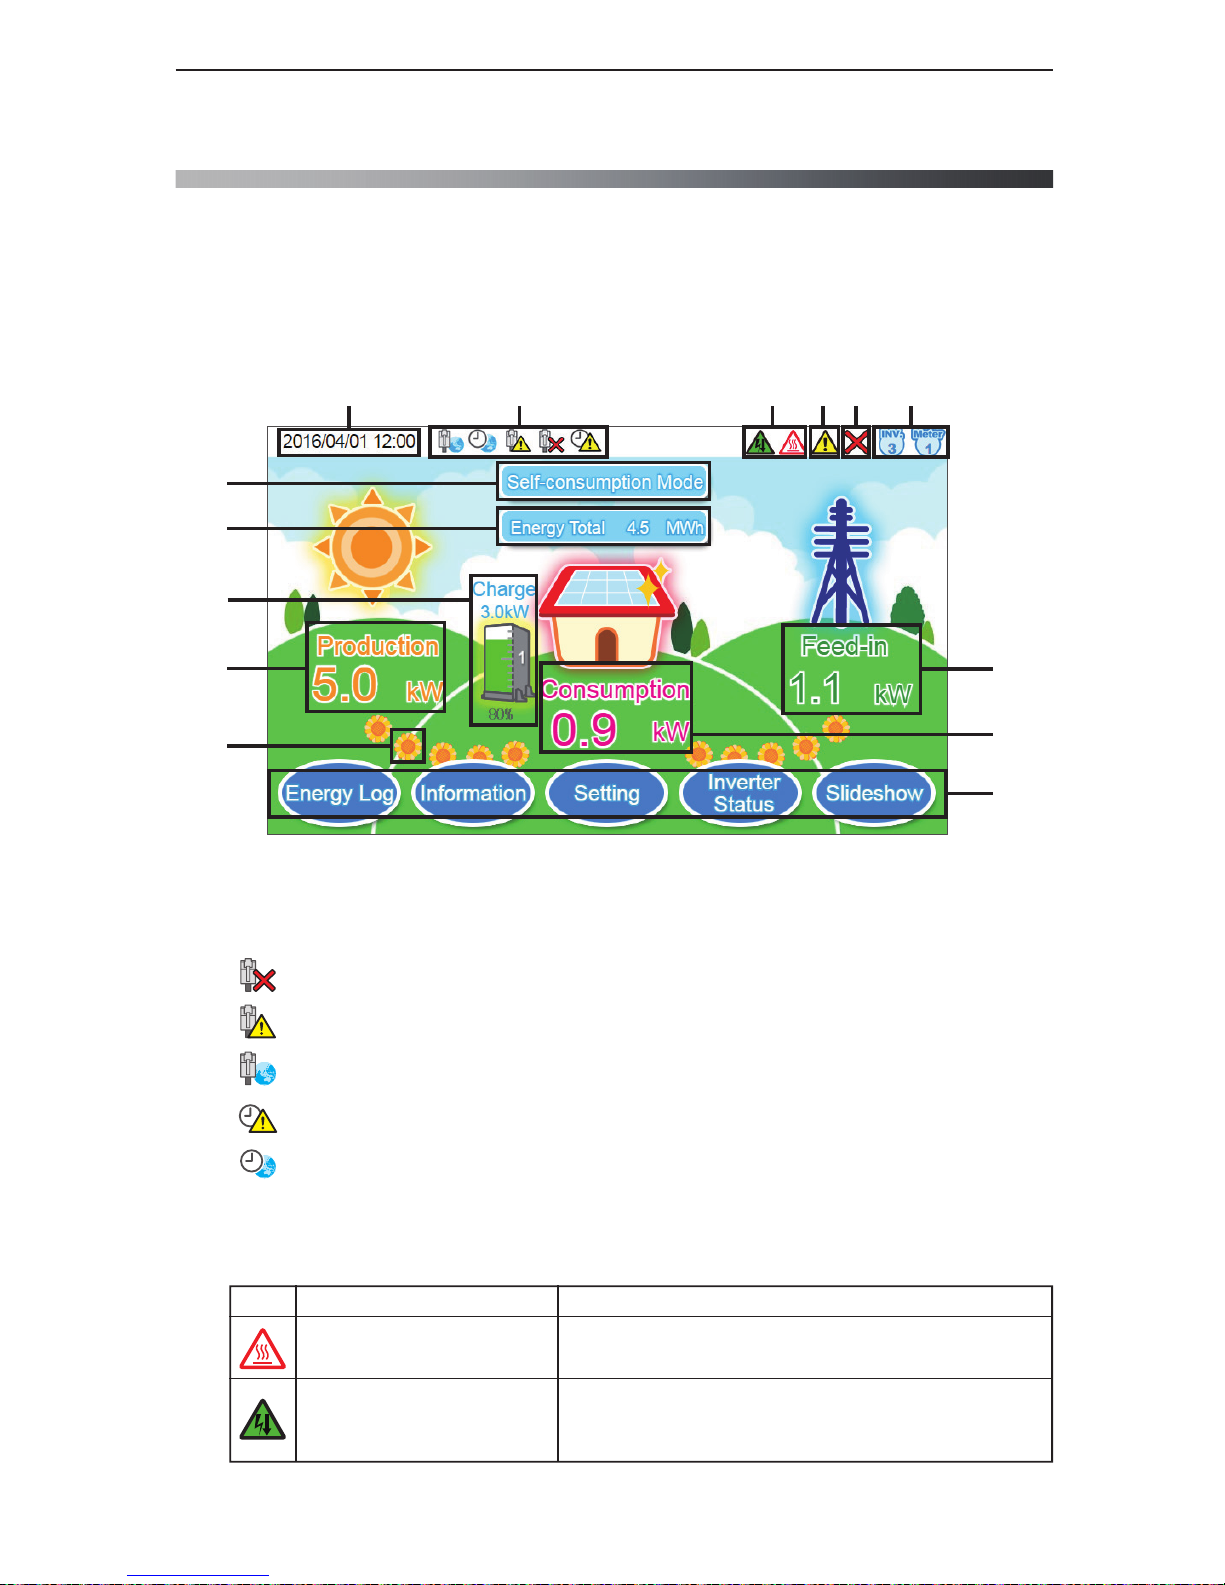
This is the Home screen of the monitor. Illustrations and icons displayed on this screen are
explained.
The Power Monitor displays a variety of information, such as the amount of power production,
consumed, Feed-in or purchased, as well as the operating status of the Inverter.
3.3.
Interpreting and Operating Power Monitor
23
⑭
⑫
③ ⑤
④
②① ⑥
⑪
⑩
⑨
⑦
⑧
⑬
① Date / Time
The current date and time are displayed.
Not connect to the LAN or internet
It's able to connect to LAN, but not able to connect to external internet
Internet is working normally
Internet time synchronization is not successful
Internet time synchronization is successful
②
③ Suppression icon
A Suppression icon is displayed when there is suppression on the operation of the Inverter.
Icon Operating mode
Voltage elevation suppression
Temperature elevation
suppression
The voltage of the commercial power system has reached
a high level while the Inverter was in operation. The
output of the Inverter is being suppressed.
The internal temperature of the Inverter has reached
a high level. The output of the Inverter is being suppressed.
Description
3.3.1.Home screen
What Power Monitor can do
Page 24
24
⑩ Power production icon and numerical value
The icon and the numerical value indicate the current status of power production.
⑨ Battery’s Icon and value
Shows charge and discharge wattage and power percentage.
In the main page, the electricity numbers are all for system except battery status. It only shows
1 battery status. Therefore, if connect to more than one Inverter and battery, some parts of
batteries will be hidden, so user must click on the battery Icon to switch to another page to
get battery information.
⑧ Energy Total
Indicates the total amount of power production from the day on which power production
started
to the present time.
⑥ Number of Connected Inverters and Meters icon
The number of Inverters and Meters that have been checked off in the Connection settings.
This feature cannot be used to verify erroneous wiring, since the actual wiring is irrelevant to
this indication.
⑦ Operation mode
Shows the charge and discharge mode of battery.
④ Error icon
An error icon is displayed to indicate that one or more errors are occurring.
The Error icon is ordinarily not displayed, and is displayed when one or more errors occur.
Refer to “4.When Something Seems Wrong (Troubleshooting)” (Page 85) for details.
⑤ Communication Malfunction icon
This icon is displayed when communication with the Inverter or the Meter is not available.
Communication malfunction
Communication with the Inverter or the Meter
is malfunctioning.
Icon Operating mode Description
⑫ Power feed-in and Power Purchase icon and numerical value
The icon and the numerical value indicate the current status of power feed-ins and purchases.
The color and text of the icon will change depending on the power feed-in and purchase status.
The color of the text is “green” when the power is feed-in and “red” when the power is being
purchased.
⑪ Power Consumption icon and numerical value
The icon and the numerical value indicate the current status of power consumption.
What Power Monitor can do
Page 25
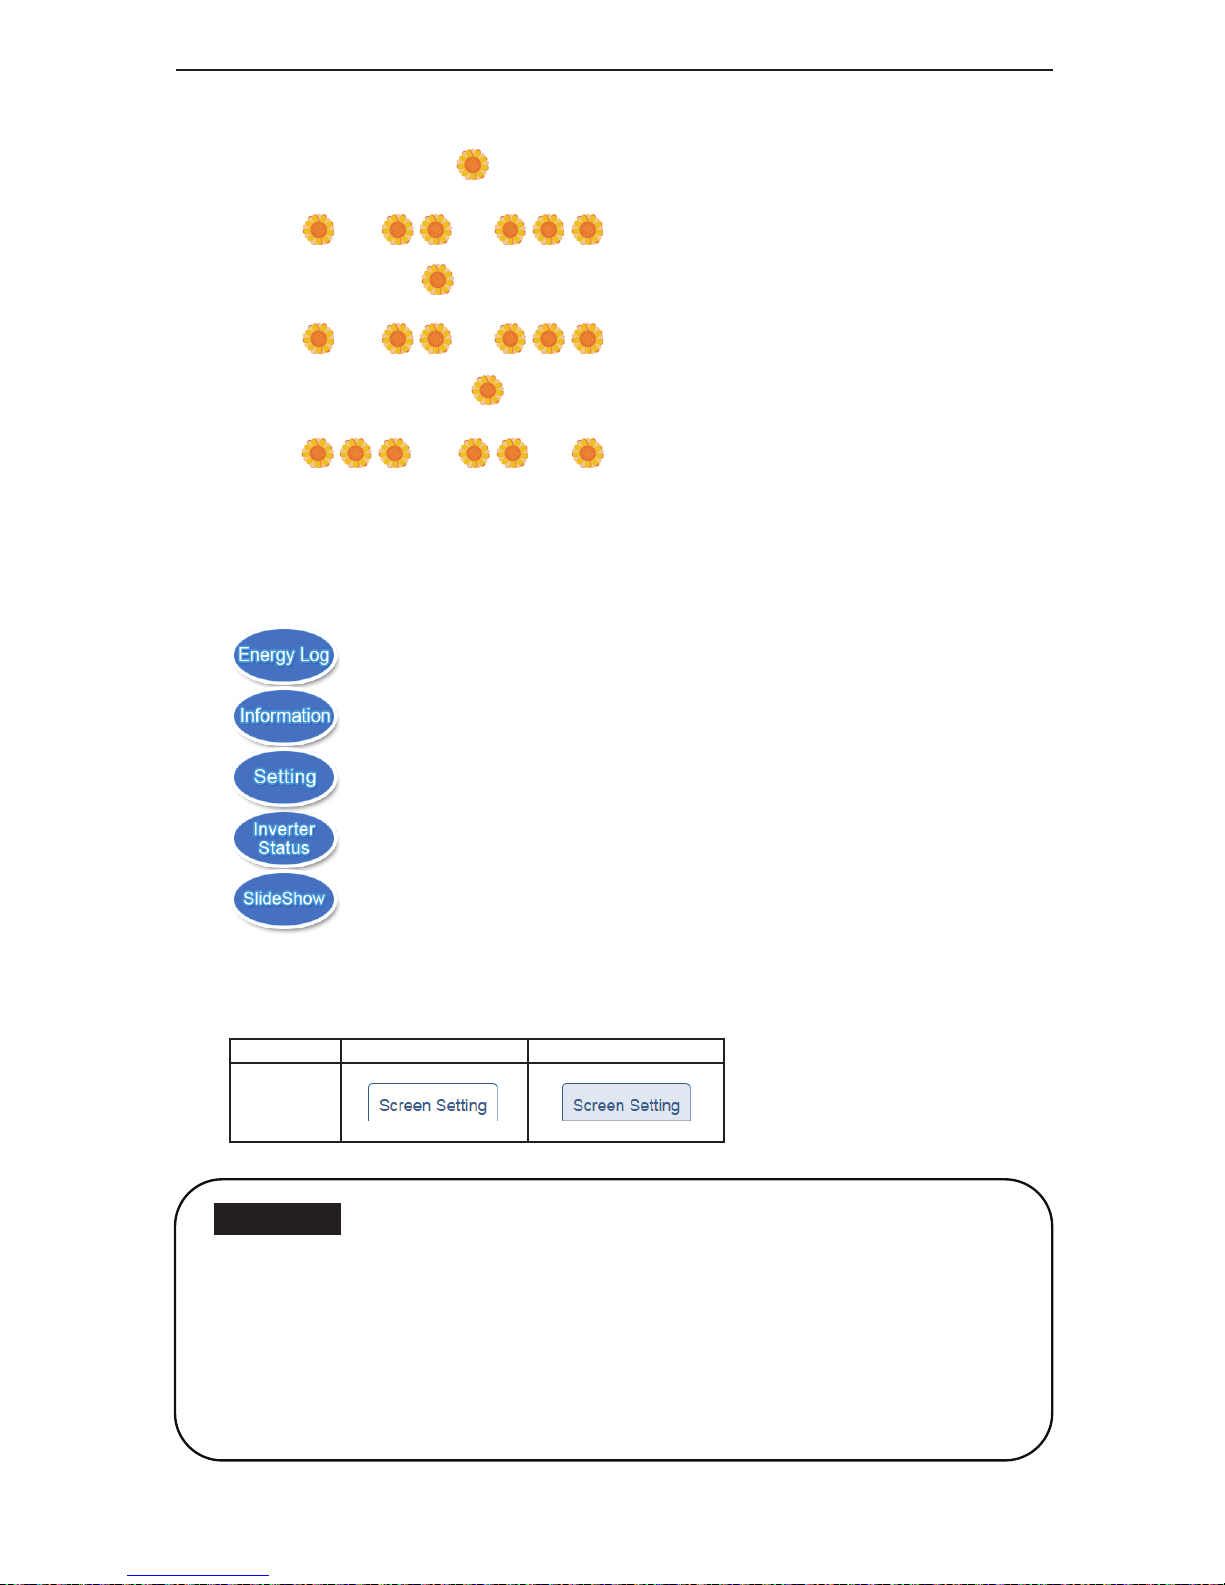
⑭ Menu buttons
The names of the Menu buttons are displayed.
Menu buttons have different names and roles for each screen that is being displayed.
Refer to the descriptions of respective functions for details of the Menu buttons.
Power log is displayed.
Status of the Inverters and the error log are displayed.
Setting for the Inverters and monitor.
Display the status of Inverters.
This is a slideshow feature.
25
One Point
・ Numerical values that are displayed on the screens are all displayed as values that have
been rounded up or off.
For instance in case where a value is “3.14 kWh”, this is displayed as “3.1 kWh”, whereas if
the value is “3.15 kWh”, then it is displayed as “3.2 kWh”.
Thus the numerical values that are displayed do not necessarily completely match with
the true value in some cases, as described above.
・ Refer to “4. When Something Seems Wrong (Troubleshooting)” (Page 85) for details when
the Suppression and Communication Malfunction icons are displayed frequently.
● Display of tabs
The selected tab is displayed in white. The non-displaying tabs are displayed in light blue.
Selected tab
Non-displaying tab
Tab
⑬ Flow of electricity
Power production: The “ ” symbol flows from left to right between power production and
consumption.
Power selling: The “ ” symbol flows from left to right between consumption and power
feed-in.
Power purchasing: The “ “symbol flows from right to left between consumption and
power purchase.
→ →
→ →
←←
What Power Monitor can do
Page 26
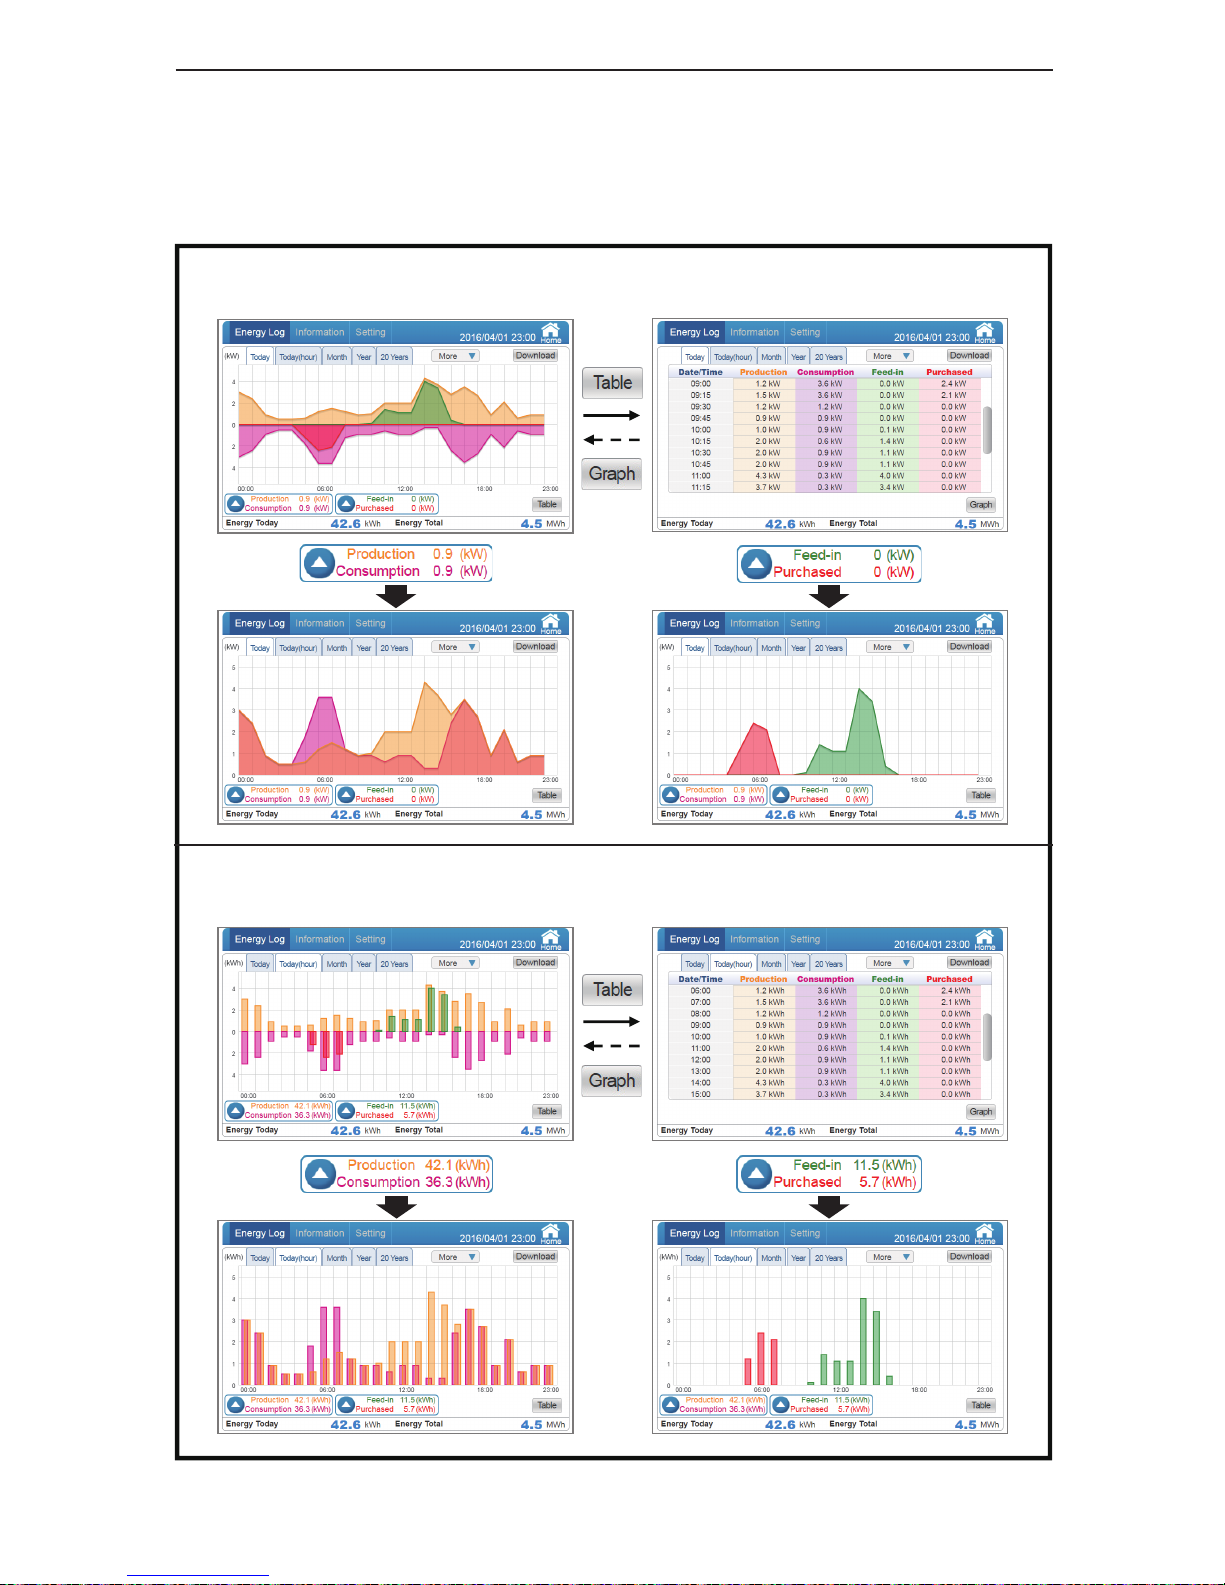
The details on the performance of respective power amounts (power production / power
consumption / power feed-in / power purchase) are displayed by respective units (date /month
/year), graphs and lists. The following screens are available:
Power log for today (graph display)
The power status for the day can be verified.
Power log for today by hours (list display)
Power log for today by hours (graph display)
The power status for each hour can be verified.
Power log for today (list display)
26
3.3.2.Energy Log
What Power Monitor can do
Page 27
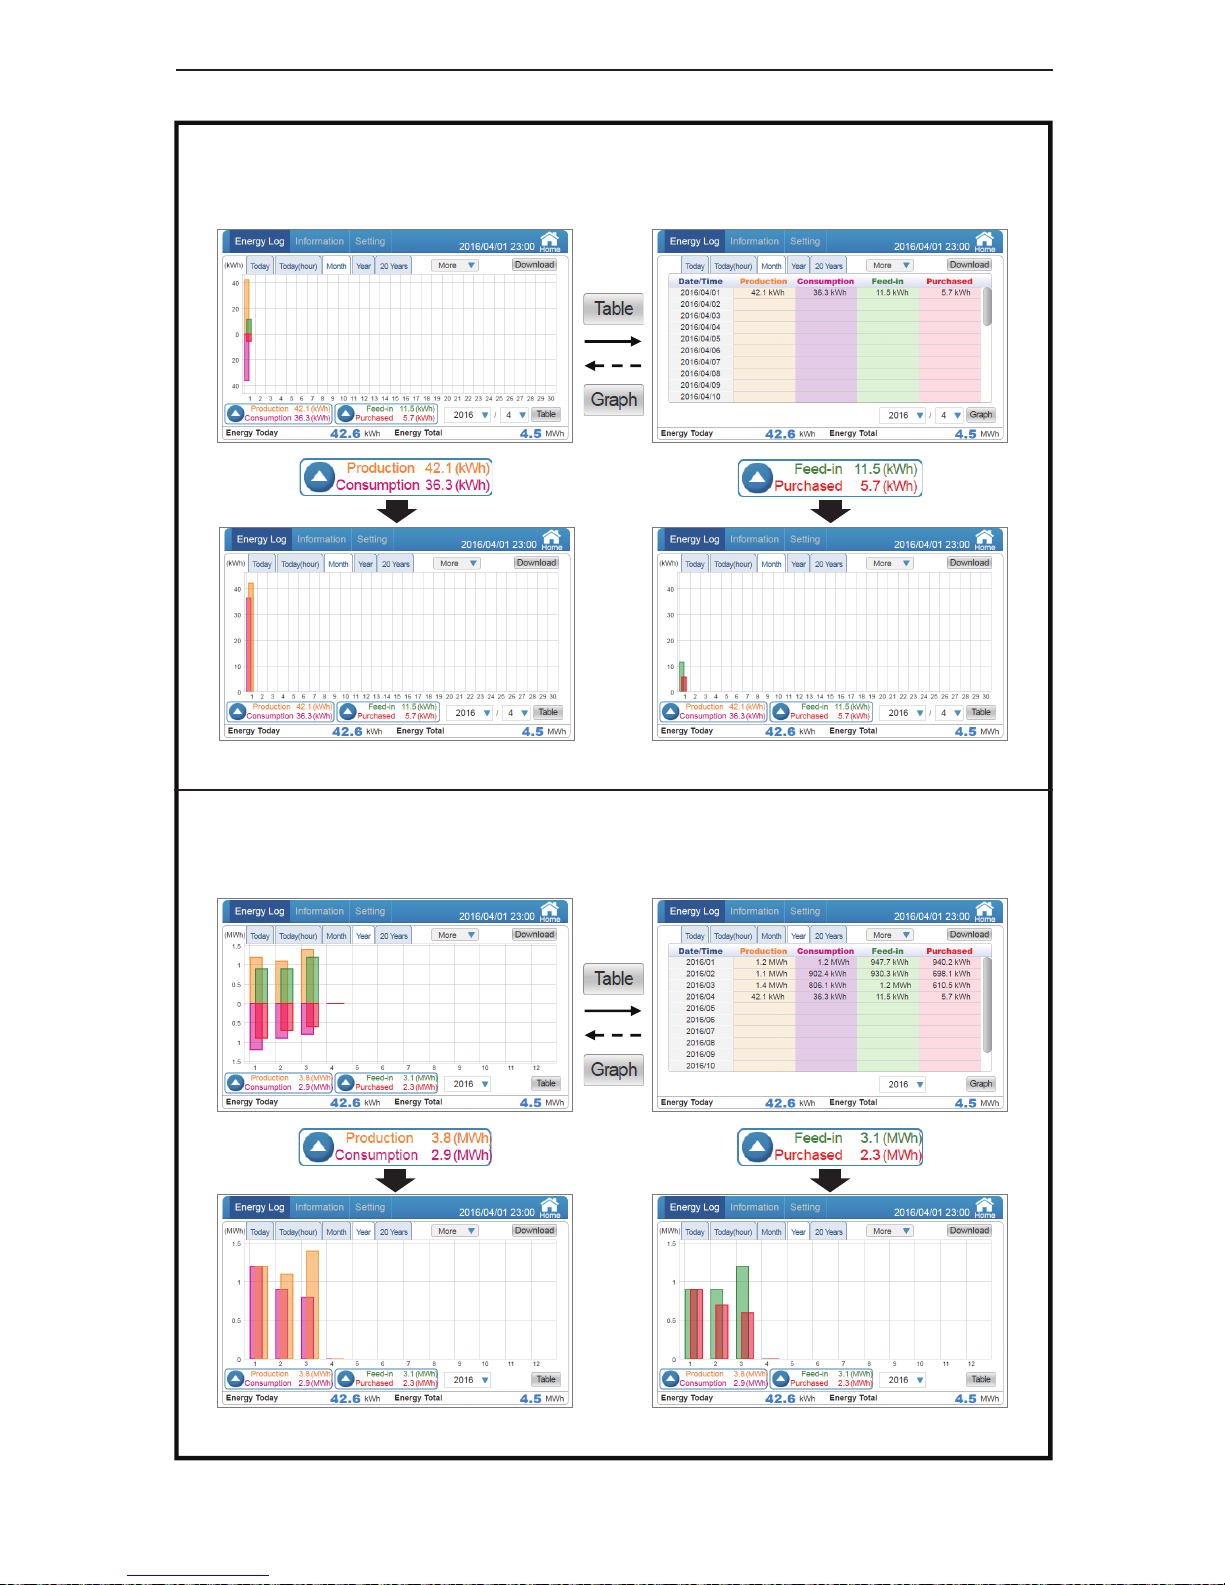
Power log for one month (graph display)
The power status for one month can be verified.
Power log for one month (list display)
Power log for one year (graph display)
The power status for one year can be verified.
Power log for one year (list display)
27
What Power Monitor can do
Page 28
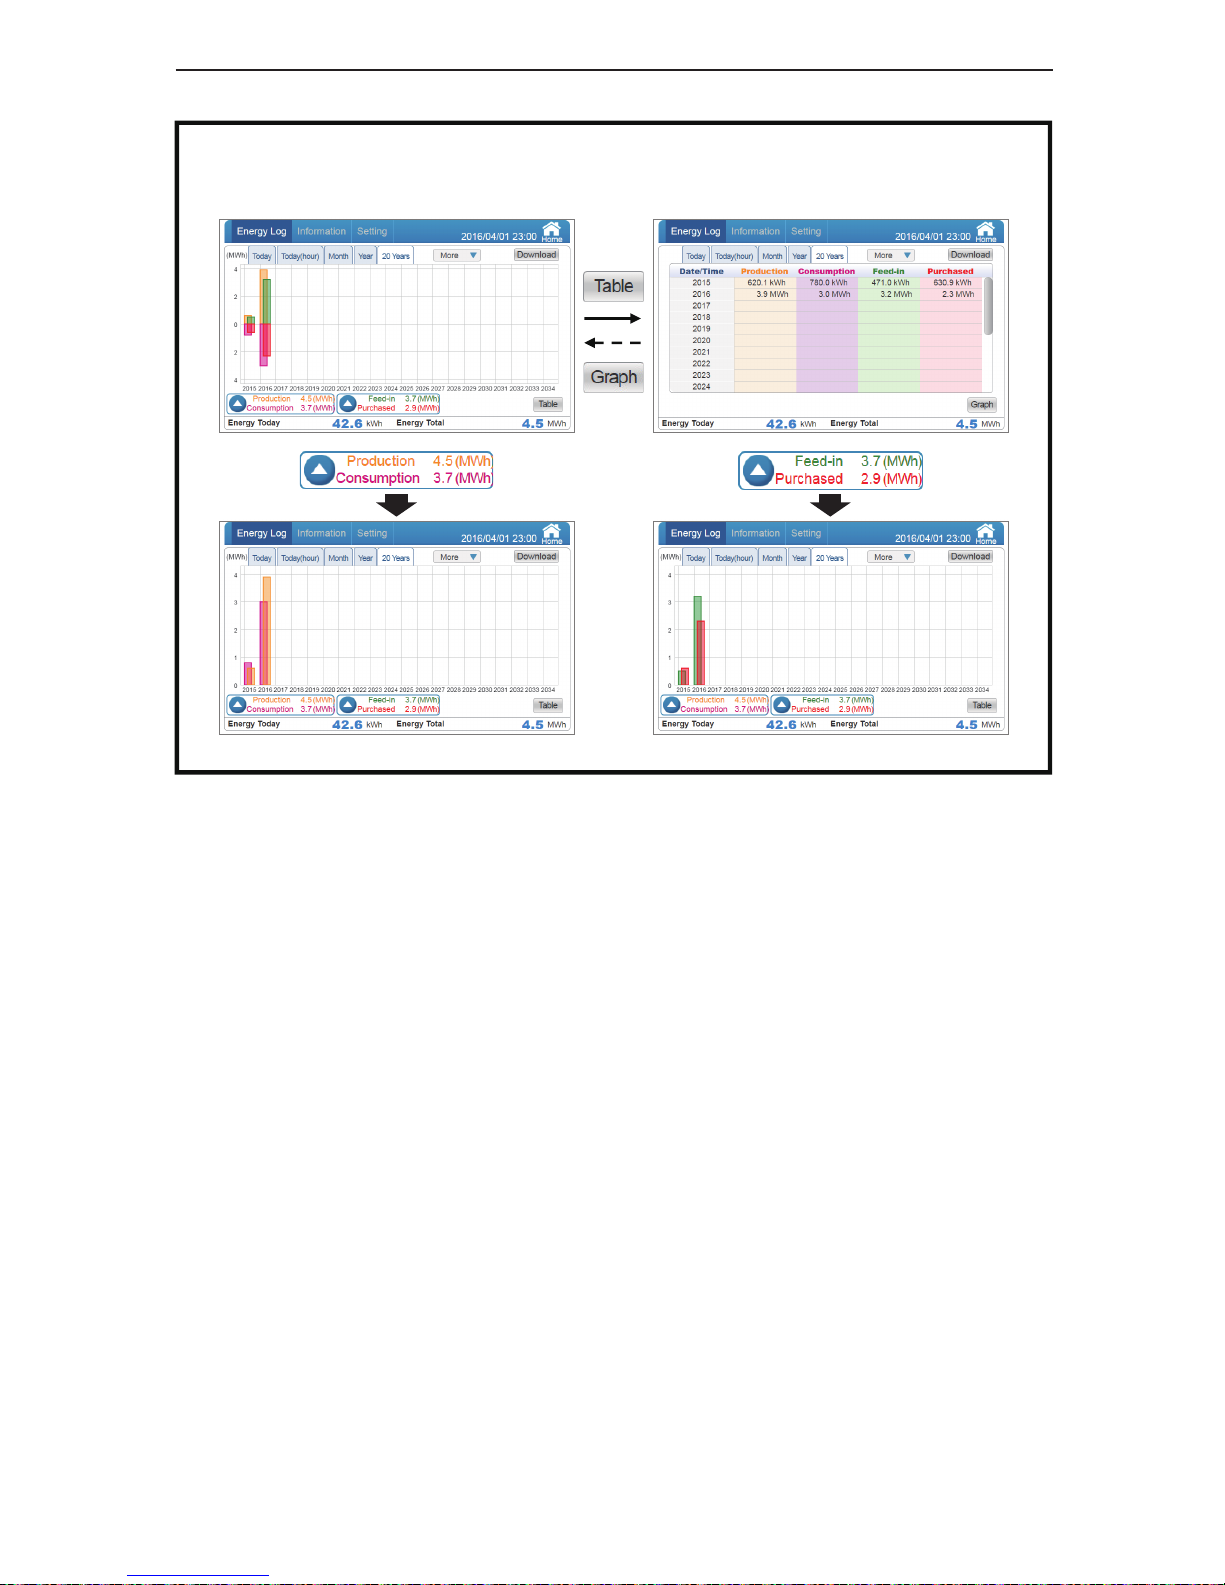
Electric power log for 20 years (list display)Electric power log for 20 years (graph display)
The electric power status for 20 years can be verified.
28
What Power Monitor can do
Page 29
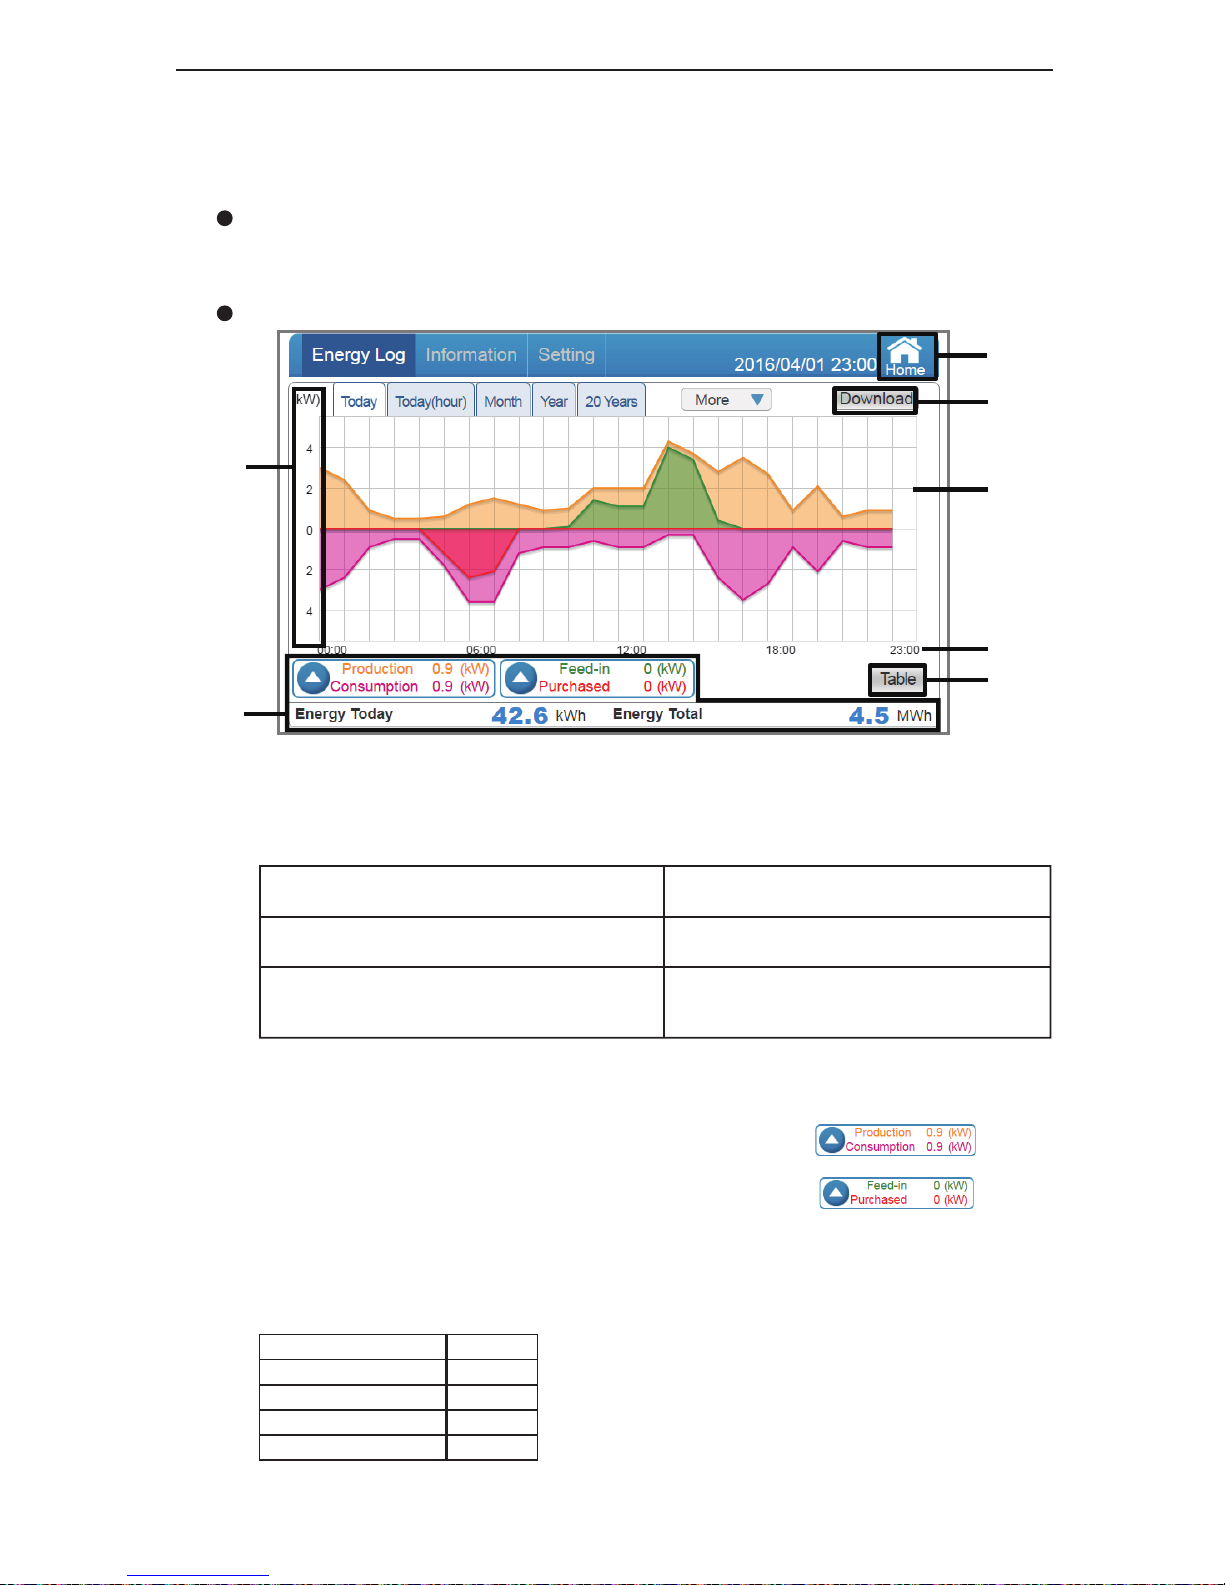
【 Power log graph (log for today) 】
The details on the power status of respective power attributes (power production / power
consumption / power feed-in / power purchase) are displayed by graphs.
Instantaneous power status for the 24 hour time span of the current day is shown in increments
of 15 minute intervals.
① Graph areas
The details on respective power attributes are shown with color coded line graph (power
production: orange / power consumption: purple / power feed-in: green / power purchase: red).
※ The power displayed under power production / power consumption / power feed-in /
power purchase represents the instantaneous power with the log for “today” only.
② Power / Amount of Power display area
Power consumption: The amount of instantaneous
electric power consumed for today is displayed.
Amount of electric power production for today: The
amount of electric power production today is displayed.
Accumulated amount of electric power production:
The accumulated amount of electric power production
as of today is displayed.
Power production: The amount of instantaneous
electric power production for today is displayed.
Power feed-in: The amount of instantaneous
electric power sold for today is displayed.
Power purchase: The amount of instantaneous
electric power purchased for today is displayed.
③ Power graph scale
The scale of the graph is displayed.
The graph comprised
only of power production and consumption can be viewed by touching
(Page 39).
(Page 39).
The graph comprised
only of power feed-in and purchase can be viewed by touching
⑦
③
②
④
⑤
①
⑥
Type of graph
Graph screen
29
④ Time scale
The time scale suitable for respective log displays (daily / monthly / yearly) is displayed.
Log Unit
Log for today Time
Log for 1 month
Log for 1 year
Log for 20 years
Day
Month
Year
What Power Monitor can do
Page 30

Operating method
・In the Home screen, touch → .
・A list is displayed with .
・Touch to switch respective power graphs.
⑦
Change the display to the Home screen.
⑤
Data can be downloaded onto USB memory.
Respective power details for a 3 month period, including the current day, are downloaded
as data in 15-minute increments.
Format: CSV
File name: TodayLog_yyyymmdd_hhmm.csv
The file name “yyyymmdd” represents the year, month and day on which the data was downloaded.
The file name “hhmm” represents the hour and minute at which the data was downloaded.
TodayLog_yyyymmdd_hhmm.csv
Year Month Day Hour Minute
File description: Date (date)
Time (time)
Power Production Max (kW) (maximum amount of power production)
Power Consumption Max (kW) (maximum amount of power consumed)
Power Import Max (kW) (maximum amount of power purchased)
Power Export Max (kW) (maximum amount of power feed-in)
⑥
The details on the power status of respective power attributes (power production / power
consumption / power feed-in / power purchase) are displayed by lists. (Page 41)
30
・
Touch the desired log ( ) to switch respective power graphs.
What Power Monitor can do
Page 31

31
【 Power log graph (log for today (hour)) 】
The details on the power status of respective power amounts (power production / power
consumption / power feed-in / power purchase) are displayed by graphs.
Power status for the 24 hour time span of the current day is shown in increments of 1 hour
intervals.
① Graph areas
The details on respective power amounts are shown with color coded bar graph (power
production: orange / power consumption: purple / power feed-in: green / power purchase: red).
⑦
③
②
④
⑤
①
⑥
Type of graph
Graph screen
② Amount of Power display area
Power consumption: The amount of electric power
consumed for today is displayed.
Amount of electric power production for today: The
amount of electric power production today is displayed.
Accumulated amount of electric power production:
The accumulated amount of electric power
production
as of today is displayed.
Power production: The amount of electric power
production for today is displayed.
Power feed-in: The amount of electric power
sold for today is displayed.
Power purchase: The amount of electric power
purchased for today is displayed.
③ Power graph scale
The scale of the graph is displayed.
④ Time scale
The time scale suitable for respective log displays (daily / monthly / yearly) is displayed.
Log Unit
Log for today Time
Log for 1 month
Log for 1 year
Log for 20 years
Day
Month
Year
The graph comprised
only of power production and consumption can be viewed by touching
(Page 39).
(Page 39).
The graph comprised
only of power feed-in and purchase can be viewed by touching
What Power Monitor can do
Page 32

32
⑦
Change the display to the Home screen.
⑤
Data can be downloaded onto USB memory.
Respective power details for a 3 month period, including the current day, are downloaded
as data in 1-hour increments.
Format: CSV
File name: TodayHourlyLog_yyyymmdd_hhmm.csv
The file name “yyyymmdd” represents the year, month and day on which the data was downloaded.
The file name “hhmm” represents the hour and minute at which the data was downloaded.
File description: Date (date)
Time (time)
Energy Generation (kWh) (amount of power production)
Energy Consumption (kWh) (amount of power consumed)
Energy Import (kWh) (amount of power purchased)
Energy Export (kWh) (amount of power feed-in)
⑥
The details on the power amount of respective power attributes (power production / power
consumption / power feed-in / power purchase) are displayed by lists. (Page 43)
TodayHourlyLog_yyyymmdd_hhmm.csv
Year Month Day Hour Minute
Operating method
・In the Home screen, touch → .
・A list is displayed with .
・Touch to switch respective power graphs.
・
Touch the desired log ( ) to switch respective power graphs.
What Power Monitor can do
Page 33

33
【 Power log graph (log for 1 month) 】
The details on the power status of respective power amounts (power production / power
consumption / power feed-in / power purchase) are displayed by graphs.
Power status for 1 month is shown in increments of 1 day intervals. (Including current day)
① Graph areas
The details on respective power amounts are shown with color coded bar graph (power
production: orange / power consumption: purple / power feed-in: green / power purchase: red).
④ Display period
The display period is indicated by respective units (month / year). Either the year or the
month can be selected by touch. The display by year can only be selected if there is any
power production performance for that year.
⑧
③
②
⑤
⑥
①
⑦
④
Type of graph
Graph screen
② Amount of Power display area
Power consumption: The amount of electric power
consumed for current month is displayed.
Amount of electric power production for today: The
amount of electric power production today is displayed.
Accumulated amount of electric power production:
The accumulated amount of electric power
production
as of today is displayed.
Power production: The amount of electric power
production for current month is displayed.
Power feed-in: The amount of electric power
sold for current month is displayed.
Power purchase: The amount of electric power
purchased for current month is displayed.
③ Power graph scale
The scale of the graph is displayed.
The graph comprised
only of power production and consumption can be viewed by touching
(Page 39).
(Page 39).
The graph comprised
only of power feed-in and purchase can be viewed by touching
What Power Monitor can do
Page 34

34
⑥
Data can be downloaded onto USB memory.
Respective power details for a 3 month period are downloaded as data in 1-day increments.
Format: CSV
File name: DailyLog_yyyymmdd_hhmm.csv
The file name “yyyymmdd” represents the year, month and day on which the data was downloaded.
The file name “hhmm” represents the hour and minute at which the data was downloaded.
File description: Date (date)
Energy Generation (kWh) (amount of power production)
Energy Consumption (kWh) (amount of power consumed)
Energy Import (kWh) (amount of power purchased)
Energy Export (kWh) (amount of power feed-in)
⑧
Change the display to the Home screen.
⑦
The details on the power amount of respective power attributes (power production / power
consumption / power feed-in / power purchase) are displayed by lists. (Page 45)
DailyLog_yyyymmdd_hhmm.csv
⑤ Time scale
The time scale suitable for respective log displays (daily / monthly / yearly) is displayed.
Log Unit
Log for today Time
Log for 1 month
Log for 1 year
Log for 20 years
Day
Month
Year
Year Month Day Hour Minute
Operating method
・In the Home screen, touch → .
・A list is displayed with .
・Touch to switch respective power graphs.
・
Touch the desired log ( ) to switch respective power graphs.
What Power Monitor can do
Page 35

35
【 Power log graph (log for 1 year) 】
The details on the power status of respective power amounts (power production / power
consumption / power feed-in / power purchase) are displayed by graphs.
Power status for 1 year is shown in increments of 1-month intervals. (Including current month)
① Graph areas
The details on respective power amounts are shown with color coded bar graph (power
production: orange / power consumption: purple / power feed-in: green / power purchase: red).
④ Display period
The display period is indicated for each year. The year can be selected by touch.
The display by year can only be selected if there is any power production performance for
that year.
⑧
③
②
⑤
⑥
①
⑦
④
Type of graph
Graph screen
② Amount of Power display area
Power consumption: The amount of electric power
consumed for current year is displayed.
Amount of electric power production for today: The
amount of electric power production today is displayed.
Accumulated amount of electric power production:
The accumulated amount of electric power
production
as of today is displayed.
Power production: The amount of electric power
production for current year is displayed.
Power feed-in: The amount of electric power
sold for current year is displayed.
Power purchase: The amount of electric power
purchased for current year is displayed.
③ Power graph scale
The scale of the graph is displayed.
The graph comprised
only of power production and consumption can be viewed by touching
(Page 39).
(Page 39).
The graph comprised
only of power feed-in and purchase can be viewed by touching
What Power Monitor can do
Page 36

36
⑥
Data can be downloaded onto USB memory.
Respective power details for a 1 year period are downloaded as data in 1-month increments.
Format: CSV
File name: MonthlyLog_yyyymmdd_hhmm.csv
The file name “yyyymmdd” represents the year, month and day on which the data was downloaded.
The file name “hhmm” represents the hour and minute at which the data was downloaded.
File description: Month (month)
Energy Generation (kWh) (amount of power production)
Energy Consumption (kWh) (amount of power consumed)
Energy Import (kWh) (amount of power purchased)
Energy Export (kWh) (amount of power feed-in)
⑦
The details on the power amount of respective power attributes (power production / power
consumption / power feed-in / power purchase) are displayed by lists. (Page 47)
MonthlyLogyyyymmddhhmm.csv
⑤ Time scale
The time scale suitable for respective log displays (daily / monthly / yearly) is displayed.
Log Unit
Log for today Time
Log for 1 month
Log for 1 year
Log for 20 years
Day
Month
Year
Year Month Day Hour Minute
Operating method
・In the Home screen, touch → .
・A list is displayed with .
・Touch to switch respective power graphs.
⑧
Change the display to the Home screen.
・
Touch the desired log ( ) to switch respective power graphs.
What Power Monitor can do
Page 37

37
【 Power log graph (log for 20 years) 】
The details on the power status of respective power amounts (power production / power
consumption / power feed-in / power purchase) are displayed by graphs.
Power status for 20 years is shown in increments of 1-year intervals. (Including current year)
① Graph areas
The details on respective power amounts are shown with color coded bar graph (power
production: orange / power consumption: purple / power feed-in: green / power purchase: red).
⑦
③
②
④
⑤
①
⑥
Type of graph
Graph screen
② Amount of Power display area
Power consumption: The amount of electric power
consumed for 20 years is displayed.
Amount of electric power production for today: The
amount of electric power production today is displayed.
Accumulated amount of electric power production:
The accumulated amount of electric power
production
as of today is displayed.
Power production: The amount of electric power
production for 20 years is displayed.
Power feed-in: The amount of electric power
sold for 20 years is displayed.
Power purchase: The amount of electric power
purchased for 20 years is displayed.
③ Power graph scale
The scale of the graph is displayed.
④ Time scale
The time scale suitable for respective log displays (daily / monthly / yearly) is displayed.
Log Unit
Log for today Time
Log for 1 month
Log for 1 year
Log for 20 years
Day
Month
Year
The graph comprised
only of power production and consumption can be viewed by touching
(Page 39).
(Page 39).
The graph comprised
only of power feed-in and purchase can be viewed by touching
What Power Monitor can do
Page 38

38
⑦
Change the display to the Home screen.
⑤
Data can be downloaded onto USB memory.
Respective power details for a 20-year period, including the current year, are downloaded
as data in 1-year increments.
Format: CSV
File name: YearlyLog_yyyymmdd_hhmm.csv
The file name “yyyymmdd” represents the year, month and day on which the data was downloaded.
The file name “hhmm” represents the hour and minute at which the data was downloaded.
File description: Year (year)
Energy Generation (kWh) (amount of power production)
Energy Consumption (kWh) (amount of power consumed)
Energy Import (kWh) (amount of power purchased)
Energy Export (kWh) (amount of power feed-in)
⑥
The details on the power amount of respective power attributes (power production / power
consumption / power feed-in / power purchase) are displayed by lists. (Page 49)
YearlyLogyyyymmddhhmm.csv
Year Month Day Hour Minute
Operating method
・In the Home screen, touch → .
・A list is displayed with .
・Touch to switch respective power graphs.
・
Touch the desired log ( ) to switch respective power graphs.
What Power Monitor can do
Page 39

39
The screen is a display example for the 1 month log .
【Power log graph ( / ) 】
The details on the power status, categorized into two pairs of power production with power
consumption and power feed-in with power purchase are displayed by graphs.
:
A graph showing only power production and power consumption is displayed.
:
A graph showing only power feed-in and power purchase is displayed.
① Graph areas
A bar graph is displayed, with respective power amounts ( )
color coded.
Type of graph
Graph screen
③
②
⑤
⑦
④
⑧
⑥
①
※ The power amount displayed under power production / power consumption / power
feed-in / power purchase represents the instantaneous power amount with the log for
“today” only.
④ Display period
The display period is indicated by respective units (month / year). Either the year or the
month can be selected by touch. The display by year can only be selected if there is any
power production performance for that year.
② Amount of Power display area
Power consumption: The amount of electric power
consumed for current month is displayed.
Amount of electric power production for today: The
amount of electric power production today is displayed.
Accumulated amount of electric power production:
The accumulated amount of electric power
production
as of today is displayed.
power production: The amount of electric power
production for current month is displayed.
Power feed-in: The amount of electric power
sold for current month is displayed.
Power purchase: The amount of electric power
purchased for current month is displayed.
③ Power graph scale
The scale of the graph is displayed.
What Power Monitor can do
Page 40

40
Operating method
・
In the Home screen, touch and then touch of
desired log to view respective power status.
・Touch to display a list screen.
⑧
Change the display to the Home screen.
⑥
Data can be downloaded onto USB memory. (The format is CSV). Details are the same
as those for respective power log graphs.
⑦
The details on the power amount of respective power attributes (power production / power
consumption / power feed-in / power purchase) are displayed by lists. (Page 45)
⑤ Time scale
The time scale suitable for respective log displays (daily / monthly / yearly) is displayed.
Log Unit
Log for today Time
Log for 1 month
Log for 1 year
Log for 20 years
Day
Month
Year
What Power Monitor can do
Page 41

【 List display (log for today) 】
The details on the power status of respective power attributes (power production / power
consumption / power feed-in / power purchase) are displayed by lists.
Log for today list: Power status for the 24 hour time span of the current day is shown in
increments of 15 minute intervals.
① Power data
The details on the power status of respective power attributes for the applicable period
(power production / power consumption / power feed-in / power purchase) are displayed
by numerical values. The maximum amounts of power for 15 minute intervals are displayed.
Values that have been rounded up or off are displayed.
③ Date / Time
The date / time suitable for respective performance displays (daily / monthly / yearly) are
displayed.
①
③
Type of list
List display screen
⑤
②
⑥
④
② Amount of Power display area
Energy Today: The amount of power production today is displayed.
Energy Total: The accumulated amount of power production as of today is displayed.
41
④
The graph screen for the performance data of respective power statuses (power production
/ power consumption / power feed-in / power purchase) is displayed. (Page 29)
⑤
Change the display to the Home screen.
What Power Monitor can do
Page 42

・Touch to return to the graph display of performance data.
Operating method
・In the Home screen, touch → → to display lists of details on the
power status of respective power attributes (power production / power consumption / power
feed-in / power purchase).
42
⑥
Data can be downloaded onto USB memory.
Respective power details for a 3 month period, including the current day, are downloaded
as data in 15-minute increments.
Format: CSV
File name: TodayLog_yyyymmdd_hhmm.csv
The file name “yyyymmdd” represents the year, month and day on which the data was downloaded.
The file name “hhmm” represents the hour and minute at which the data was downloaded.
TodayLog_yyyymmdd_hhmm.csv
Year Month Day Hour Minute
File description: Date (date)
Time (time)
Power Production Max (kW) (maximum amount of power production)
Power Consumption Max (kW) (maximum amount of power consumed)
Power Import Max (kW) (maximum amount of power purchased)
Power Export Max (kW) (maximum amount of power feed-in)
What Power Monitor can do
Page 43

43
【 List display (log for today (hour)) 】
The details on the power amount of respective power attributes (power production / power
consumption / power feed-in / power purchase) are displayed by lists.
③
Type of list
List display screen
Log for today (hour) list: Power status for the 24 hour time span of the current day is shown
in increments of 1 hour intervals.
① Power amount data
The details on the power amount of respective power attributes for the applicable period
(power production / power consumption / power feed-in / power purchase) are displayed
by numerical values.
Values that have been rounded up or off are displayed.
③ Date / Time
The date / time suitable for respective performance displays (daily / monthly / yearly) are
displayed.
② Amount of Power display area
Energy Today: The amount of power production today is displayed.
Energy Total: The accumulated amount of power production as of today is displayed.
④
The graph screen for the performance data of respective power statuses (power production
/ power consumption / power feed-in / power purchase) is displayed. (Page 31)
⑤
Change the display to the Home screen.
①
⑤
②
⑥
④
What Power Monitor can do
Page 44

・
In the Home screen, touch → → to display lists of details on the
power status of respective power attributes (power production / power consumption / power
feed-in / power purchase).
44
⑥
Data can be downloaded onto USB memory.
Respective power details for a 3 month period, including the current day, are downloaded
as data in 1-hour increments.
Format: CSV
File name: TodayHourlyLog_yyyymmdd_hhmm.csv
The file name “yyyymmdd” represents the year, month and day on which the data was downloaded.
The file name “hhmm” represents the hour and minute at which the data was downloaded.
File description: Date (date)
Time (time)
Energy Generation (kWh) (amount of power production)
Energy Consumption (kWh) (amount of power consumed)
Energy Import (kWh) (amount of power purchased)
Energy Export (kWh) (amount of power feed-in)
TodayHourlyLog_yyyymmdd_hhmm.csv
Year Month Day Hour Minute
・Touch to return to the graph display of performance data.
Operating method
What Power Monitor can do
Page 45

45
【 List display (log for 1 month) 】
The details on the power amount of respective power attributes (power production / power
consumption / power feed-in / power purchase) are displayed by lists.
Log for 1 month list: Power status for 1 month is shown in increments of 1-day intervals.
① Power amount data
The details on the power amount of respective power attributes for the applicable period
(power production / power consumption / power feed-in / power purchase) are displayed
by numerical values. Values that have been rounded up or off are displayed.
③ Date / Time
The date / time suitable for respective performance displays (daily / monthly / yearly) are
displayed.
③
④
Type of list
List display screen
② Amount of Power display area
Energy Today: The amount of power production today is displayed.
Energy Total: The accumulated amount of power production as of today is displayed.
④ Display period
The display period is indicated by respective units (month / year).
⑤
The graph screen for the performance data of respective power statuses (power production
/ power
consumption / power feed-in / power purchase) is displayed. (Page 33, Page 39)
⑥
Change the display to the Home screen.
①
⑥
②
⑦
⑤
What Power Monitor can do
Page 46

・In the Home screen, touch → → to display lists of details on the
power status of respective power attributes (power production / power consumption / power
feed-in / power purchase).
・Touch to return to the graph display of performance data.
Operating method
46
⑦
Data can be downloaded onto USB memory.
Respective power details for a 3 month period are downloaded as data in 1-day increments.
Format: CSV
File name: DailyLog_yyyymmdd_hhmm.csv
The file name “yyyymmdd” represents the year, month and day on which the data was downloaded.
The file name “hhmm” represents the hour and minute at which the data was downloaded.
File description: Date (date)
Energy Generation (kWh) (amount of power production)
Energy Consumption (kWh) (amount of power consumed)
Energy Import (kWh) (amount of power purchased)
Energy Export (kWh) (amount of power feed-in)
DailyLog_yyyymmdd_hhmm.csv
Year Month Day Hour Minute
What Power Monitor can do
Page 47

47
【 List display (log for 1 year) 】
The details on the power amount of respective power attributes (power production / power
consumption / power feed-in / power purchase) are displayed by lists.
Log for 1 year list: Power status for 1 year is shown in increments of 1-month intervals.
③
④
Type of list
List display screen
① Power amount data
The details on the power amount of respective power attributes for the applicable period
(power production / power consumption / power feed-in / power purchase) are displayed
by numerical values.
Values that have been rounded up or off are displayed.
③ Date / Time
The date / time suitable for respective performance displays (daily / monthly / yearly) are
displayed.
② Amount of Power display area
Energy Today: The amount of power production today is displayed.
Energy Total: The accumulated amount of power production as of today is displayed.
④ Display period
The display period is indicated for each year.
⑤
The graph screen for the performance data of respective power statuses (power production
/ power consumption / power feed-in / power purchase) is displayed. (Page 35)
⑥
Change the display to the Home screen.
①
⑥
②
⑦
⑤
What Power Monitor can do
Page 48

・In the Home screen, touch → → to display lists of details on the
power status of respective power attributes (power production / power consumption / power
feed-in / power purchase).
・Touch to return to the graph display of performance data.
Operating method
48
⑦
Data can be downloaded onto USB memory.
Respective power details for a 1 year period are downloaded as data in 1-month increments.
Format: CSV
File name: MonthlyLog_yyyymmdd_hhmm.csv
The file name “yyyymmdd” represents the year, month and day on which the data was downloaded.
The file name “hhmm” represents the hour and minute at which the data was downloaded.
File description: Month (month)
Energy Generation (kWh) (amount of power production)
Energy Consumption (kWh) (amount of power consumed)
Energy Import (kWh) (amount of power purchased)
Energy Export (kWh) (amount of power feed-in)
MonthlyLogyyyymmddhhmm.csv
Year Month Day Hour Minute
What Power Monitor can do
Page 49

49
【 List display (log for 20 years) 】
The details on the power amount of respective power attributes (power production / power
consumption / power feed-in / power purchase) are displayed by lists.
Log for 20 years list: Power status for 20 years is shown in increments of 1-year intervals.
③
Type of list
List display screen
① Power amount data
The details on the power amount of respective power attributes for the applicable period
(power production / power consumption / power feed-in / power purchase) are displayed
by numerical values. Values that have been rounded up or off are displayed.
③ Date / Time
The date / time suitable for respective performance displays (daily / monthly / yearly) are
displayed.
② Amount of Power display area
Energy Today: The amount of power production today is displayed.
Energy Total: The accumulated amount of power production as of today is displayed.
④
The graph screen for the performance data of respective power statuses (power production
/ power consumption / power feed-in / power purchase) is displayed. (Page 37)
⑤
Change the display to the Home screen.
①
⑤
②
⑥
④
What Power Monitor can do
Page 50

50
⑥
Data can be downloaded onto USB memory.
Respective power details for a 20-year period, including the current year, are downloaded
as data in 1-year increments.
Format: CSV
File name: YearlyLog_yyyymmdd_hhmm.csv
The file name “yyyymmdd” represents the year, month and day on which the data was downloaded.
The file name “hhmm” represents the hour and minute at which the data was downloaded.
File description: Year (year)
Energy Generation (kWh) (amount of power production)
Energy Consumption (kWh) (amount of power consumed)
Energy Import (kWh) (amount of power purchased)
Energy Export (kWh) (amount of power feed-in)
YearlyLogyyyymmddhhmm.csv
Year Month Day Hour Minute
・
In the Home screen, touch → → to display lists of details on the
power status of respective power attributes (power production / power consumption / power
feed-in / power purchase).
・Touch to return to the graph display of performance data.
Operating method
What Power Monitor can do
Page 51

51
【 Calendar function 】
Power statuses from the past can be verified on the calendar, to review the details on the amount
of power from the past.
⑤
④③②
①
① Date
Year: Year is displayed according to the Gregorian calendar. The year can be changed with
a touch.
Month: Month is displayed. The month can be changed with a touch.
Touching the “Nothing Changed” button reverts the display to the Calendar screen.
②
Change the display to the previous month.
③
Change the display to the next month.
④
Change the display to the power history for today.
Touch this button will return to the Calendar screen.
⑥
⑤ Power history
The power status for the day is displayed by
numerical values. Respective amounts of power
are color coded
(power production: orange; power consumption:
purple; power feed-in: green; power purchase: red)
Touch on a desired date to switch the display to
the Power history screen for that day.
What Power Monitor can do
Page 52

52
・In the Home screen, touch → .
・Touch on a desired date to switch the display to the Power status screen for that day.
Operating method
⑥ Current day display
The current day is indicated by a blue frame.
When the date in the frame is a week day, it is displayed with outlined characters in a blue
circle and if it is a Sunday it is displayed with outlined characters in a red circle.
What Power Monitor can do
Page 53

53
【Measurement → Plant】
The status of the plant can be verified based on the measurement values, when various
measurement values are viewed.
⑦
⑤④
③
②
⑥
①
① Plant screen
The energy today and the energy total are displayed.
Total power: The instantaneous amount of power generated at that moment is displayed.
Energy today: The amount of power generated today is displayed.
Energy total: The accumulated amount of power generated as of today is displayed.
②
Data can be downloaded to USB memory.
The total power, as well as energy today, energy total, and for respective Inverters as well
as their totals is downloaded.
Format: CSV
File name: PlantLog_yyyymmdd_hhmm.csv
The file name “yyyymmdd” represents the year, month and day on which the data was downloaded.
The file name “hhmm” represents the hour and minute at which the data was downloaded.
File description: Plant Total Power (kW) (current power production)
Plant Today Energy (kWh) (amount of power production for today)
Plant Total Energy (kWh) (accumulated amount of power production)
The power production data of each Inverter is listed after the title of the data.
Inverter Index (Inverter No.)
Today Energy (kWh) (amount of power production for today)
Month Energy (kWh) (amount of power production for the current month)
Total Energy (kWh) (accumulated amount of power production)
PlantLogyyyymmddhhmm.csv
Year Month Day Hour Minute
What Power Monitor can do
Page 54

54
③
Change the display to the Measurement values for today screen, where the status of the
plant for today can be verified.
The energy today can be verified with each Inverter No.
Energy TodayInverter No.
④
Change the display to the Measurement values for current month screen, where the status
of the system for the current month can be verified.
The month energy can be verified with each Inverter No.
Month EnergyInverter No.
⑤
Change the display to the Measurement values screen for energy total, where the status on
the energy total can be verified for each Inverter No.
The energy is accumulated for each Inverter and Power Monitor, respectively.
Therefore when a Inverter is replaced, the values for the energy may be different on the
Inverter and a Power Monitor.
Energy TotalInverter No.
What Power Monitor can do
Page 55

55
⑦
Change the display to the Home screen.
・ Touch → → .
Operating method
⑥
Change the display to the Measurement values for Inverter screen, where the status of the
Inverter can be verified.
Refer to “Measurement” → “Inverter” (Page 56) for details.
・
Touch the desired measurement value ( / / ) to switch
the display to respective measurement value screens.
・ Use to display the measurement value screen of the Inverter.
What Power Monitor can do
Page 56

【 Measurement→ Inverter 】
The status of the Inverter can be verified based on the measurement values, when various
measurement values are viewed.
⑤
④②
③
①
① Inverter screen
Input: Values are displayed for DC voltage, current and power of each circuit (The number
of circuits vary, depending on the Inverter).
* Slight voltage may be displayed as the DC voltage of a circuit that is not in use, but this is
not a malfunction.
Output: AC power, voltage, current and frequency are displayed.
Consumption: Shows Power, Voltage and Current of load.
(The value of circuits varies, depending on the Power Converter).
Battery: Show battery’s SOC, Power, Voltage and Current.
②
Data can be downloaded onto USB memory.
Format: CSV
File name: DeviceXLog_yyyymmdd_hhmm.csv
The “X” in the file name is the number of the Inverter, while “yyyymmdd” is the year for “yyyy”,
the month for “mm” and the day for “dd” on which the data is downloaded.
The file name “hhmm” represents the hour and minute at which the data was downloaded.
File description
Inverter Index (Inverter No.)
Date (date), Time (time)
DC1-Volt (V) (DC1 voltage), DC1-Current (A)(DC1 current), DC1-Power (W) (DC1 power)
DC2-Volt (V) (DC2 voltage), DC2-Current (A)(DC2 current), DC2-Power (W) (DC2 power)
DC3-Volt (V) (DC3 voltage), DC3-Current (A)(DC3 current), DC3-Power (W) (DC3 power)
DC4-Volt (V) (DC4 voltage), DC4-Current (A)(DC4 current), DC4-Power (W) (DC4 power)
AC Power (W) (AC power)
AC Volt (V) (AC electric voltage)
AC Current (A) (AC current)
AC Freq (Hz) (AC frequency)
* The number of circuits varies, depending on the Inverter.
56
DeviceXLogyyyymmddhhmm.csv
Year Month Day Hour Minute
What Power Monitor can do
Page 57

④
Change the display to the Home screen.
⑤
A screen in which the desired Inverter can be selected is displayed.
Touch the button to display the Inverter Selection dialog box. Touch the number of the
desired Inverter.
・Touch → → .
・ the desired Inverter ( / / ) to switch the measurement value
screens of respective Inverters.
Operating method
・Touch to display the measurement value screen of the Plant.
57
③
Change the display to the Measurement values screen, where the status of the plant can
be verified.
Refer to “Measurement” → “Plant” (Page 53) for details.
What Power Monitor can do
Page 58

① The details on respective electric power attributes are shown with color coded line graph
(Charge: Green/Discharge: Dark Green/SOC: Blue/Voltage: Red).
④
Touch the button to display the inverter selection dialog box. Touch the number of the
desired battery of inverter.
【 Battery 】
⑤
①
②
④
③
The details on the electric power status of battery (Charge/Discharge/SOC/Voltage) are
displayed by graphs.
② Data can be downloaded onto USB memory.
Respective electric power details of battery for a 1 day period as data in 15-minute increments.
③
The specific date can be selected by touch.
Touch the blue graph time axis, the
information of selected time is also
displayed with white words and blue
background. The below Charge/Discharge/
SOC/Voltage will become the information
of selected time.
Click icon to adjust the time axis,
the battery information of selected time
will also be displayed.
⑤
Change the display to the Home screen.
Log for day graph: Electric power status for the 24 hour time span of the selected day is
shown in increments of 15 minute intervals.
Type of graph
58
What Power Monitor can do
Page 59

59
③
⑤
④②
①
③
Change the display to the Home screen.
① Inverter screen
Model name: The model name is displayed.
Serial Number: The serial number is displayed.
Total Runtime: The power generating time is displayed.
Installation Date: The power generation starting date is displayed.
[Operation Data]
Maximum DC voltage: The maximum DC voltage is displayed.
Maximum AC voltage: The maximum AC voltage is displayed.
Current/Maximum Temperature: The Current/Maximum value of temperature is displayed.
Firmware Information: The firmware versions of the Inverter are displayed.
②
The error log of the inverters can be verified.
Refer to “Error Events Log” (Page 61) for details.
Status of the Inverter and the error log are displayed.
【 Inverter 】
3.3.3.Information
What Power Monitor can do
Page 60

60
⑤
A screen in which the desired Inverter can be selected is displayed.
Touch the button to display the Inverter Selection dialog box. Touch the ID of the desired
Inverter.
・In the Home screen, touch → .
Operating method
・Touch to select the desired Inverter and ( //) to switch the
measurement value screens of respective Inverters.
・Use , to switch screens.
④
Touching this button to display another page menu.
Touch the desired page to switch the display to the desired screen.
Voltage elevation and temperature elevation suppression can be verified.
Refer to “De-rating Log” (Page 65) for details.
Log of the connections between monitor and inverters (meters) can be verified.
Refer to “Connection Log” (Page 63) for details.
What Power Monitor can do
Page 61

61
【 Error Events Log 】
④
Change the display to the Home screen.
⑤
A screen in which the desired Inverter can be
selected is displayed. Touch the button to display
the Inverter Selection dialog box. Touch the
No. of the desired Inverter.
① Error Events Log screen
Date: The occurrence dates are displayed in chronological order, with the most recent date
on the top.
Maximum of 1,000 entries are stored, irrespective of the number of Inverters.
Once the number of entries exceeds 1,000 the data with the oldest date is overwritten.
Inverter: The inverter No. is displayed.
Type: The type of error (error: orange; fault: red; warning: yellow) is displayed.
Error code: The error code is displayed.
Description: The explanation on the description of the error is displayed.
Refer to the Installation and Maintenance Manual of the Inverter for details on the responsive
actions to be taken when one or more errors occur.
②
The status of the inverter can be verified.
Refer to “Information → Inverter” (Page 59) for details.
④
⑤
②
①
⑥
③ ⑦
Log of the connections between monitor and inverters
(meters) can be verified.
Refer to “Connection Log” (Page 63) for details.
Voltage elevation and temperature elevation suppression
can be verified.Refer to “De-rating Log” (Page 65) for details.
③
Touching this button to display another page menu.
Touch the desired page to switch the display to the desired screen.
What Power Monitor can do
Page 62

62
⑥ Page selection
Change the display to the next page.
Return to the Error Events Log screen.
Change the display to the last page.
・In the Home screen, touch → .
・Touch to select the desired Inverter ( / / / ) to switch
the status screens of respective Inverters.
Operating method
⑦
Data can be downloaded onto USB memory.
Format: CSV
File name: DeviceXEvent_yyyymmdd_hhmm.csv
The “X” in the file name is the No. of the Inverter. The “X” is not displayed when all Inverters
are selected. The “yyyymmdd” is the year for “yyyy”, the month for “mm” and the day for
“dd” on which the data is downloaded.
The file name “hhmm” represents the hour and minute at which the data was downloaded.
* Details are displayed in the order of date and time (Most recent displayed on top)
File description: Date (date)
Time (time)
Inverter # (Inverter No.)
Code (error code)
Message (error item)
DeviceXEventyyyymmddhhmm.csv
Change the display to the first page
Desired page can be selected.
(Maximum number of pages is 84 pages.)
Change the display to the previous page.
・
Switch the display of respective screens by touching , .
Year Month Day Hour Minute
What Power Monitor can do
Page 63

【 Connection Log 】
③
①
④
②
63
Equipment name: The name of the equipment is displayed.
The displayed equipment names are as the followings:
・ Inverter No. 1
・ Inverter No. 2
・ Inverter No. 3
Model / Serial No: The model name and serial number of equipment are displayed.
Status description: The status of equipment is described.
・ Connection setting completed successfully. / Connected. → Blue
Display when the equipment has been connected successfully.
・ Connection setting failed. → Red
Display when the connection of the equipment failed.
・ Disconnected. → Orange
Display when the equipment has been disconnected.
・ Connection cannot be established within a prescribed amount of time.
→ Yellow
Display when the connection of the equipment could not be established
after a period of time.
Equipment name
Model / serial No.
Status description
① Connection Log screen
Date: The occurrence dates are displayed in chronological order, with the most recent date
on the top.
Maximum of 1,000 entries are stored, irrespective of the number of Inverters.
Once the number of entries exceeds 1,000 the data with the oldest date is overwritten.
Description: The explanation on the description of the connection log is displayed.
Display example
Inverter No. 1(B1215A00000WA)unit is connected.
What Power Monitor can do
Page 64

64
③
Change the display to the Home screen.
Operating method
・In the Home screen, touch → .
・Touch to switch screens.
④ Page selection
Change the display to the next page.
Return to the
Connection Log screen.
Change the display to the last page.
Change the display to the first page
Desired page can be selected.
Change the display to the previous page.
The status of the Inverter can be verified.
Refer to “Information → Inverter” (Page 59) for details.
The error log of the Inverter can be verified.
Refer to “Error Events Log” (Page 61) for details.
②
Touching this button to display another page menu.
Touch the desired page to switch the display to the desired screen.
What Power Monitor can do
Page 65

65
① De-rating Log screen
The De-rating Log of the Inverter for four pair types, namely “Over Voltage De-rating_DC”,
“Under Voltage De-rating_DC”, “Over Temperature De-rating” and “Over Voltage De-rating_AC”
are displayed. A log entry is recorded in following cases:
・ Over Voltage De-rating_DC: In an event the output voltage exceeds the set value.
・ Under Voltage De-rating_DC: In an event the output voltage is low.
・ Over Temperature De-rating: In an event the temperature of the Inverterelevates to a
high level.
・ Over Voltage De-rating_AC: In an event the input voltage is high.
Start time: The date and time of occurrence are displayed.
The occurrence dates are displayed in chronological order, with the most recent
date on the top.
Maximum of 16 entries can be stored for each item of each Inverter.
Once the number of entries exceeds 16 the data the oldest date is overwritten.
Total occurrence time: The total duration of time during which De-rating have occurred is
displayed.
(When the interval between De-rating duration and other De-rating duration is within five
minutes, then these are counted as a single occurrence of De-rating).
②
Data can be downloaded onto USB memory.
The data containing the type of suppression, as well as the Inverter number, start date and
time, as well as total duration of occurrence is downloaded.
Format: CSV
File name: DeviceXDerating_yyyymmdd_hhmm.csv
The “X” in the file name is the ID of the Inverter.
The file name “yyyymmdd” represents the year, month and day on which the data was downloaded.
The file name “hhmm” represents the hour and minute at which the data was downloaded.
File description: Event (De-rating type)
Over Voltage De-rating_DC: OPV
Under Voltage De-rating_DC: OPV-Lo
Over Temperature De-rating: Thermal
Over Voltage De-rating_AC: Vin
Inverter # (Inverter ID)
Start (start date and time)
Time (total duration of occurrence)
DeviceXDeratingyyyymmddhhmm.csv
Inverter ID
【 De-rating Log 】
⑤
⑥
①
③
④
②
Year Month Day Hour Minute
※Start (start date and time) is displayed in the order of occurrence (Most recent displayed on top)
What Power Monitor can do
Page 66

66
⑤
Change the display to the Home screen.
⑥
A screen in which the desired Inverter can be selected is displayed.
Touch the button to display the Inverter Selection dialog box. Touch the ID of thedesired
Inverter.
Operating method
・Touch , to switch screens.
The status of the Inverter can be verified. Refer to “Information
→ Inverter” (Page 59) for details.
The error log of the Inverter can be verified.
Refer to “Error Events Log” (Page 61) for details.
④
Touching this button displays another page menu.
Touch the desired page to switchthe display to the desired screen.
③
The Connection Log between monitor and inverters canbe verified. Refer to “Connection
Log” (Page 63) for details.
・In the Home screen, touch → .
・ In , touch to select the desired Inverter ( / / ) to switch the
information screens of respective Inverters.
What Power Monitor can do
Page 67

Verification of Grid Setting and Setting Operation mode for the Inverter, as well as time and
screen settings of the Power Monitor can be performed.
67
【 Grid Setting 】
⑤
④
②
①
③
・In the Home screen, touch → .
Operating method
・ In , touch to select the desired Inverter ( / / ) to switch the
information screens of respective Inverters.
②
Sleep time and brightness and language for the screen can be set.
Refer to “Screen Setting” (Page 68) for details.
④
Change the display to the Home screen.
⑤
A
screen in which the desired Inverter can be selected
is displayed.
Touch the button to display the Inverter Selection dialog
box. Touch the No. of the desired Inverter.
Touch “Operation Mode” to switch the display to the Operation Mode
screen. Refer to “Operation Mode” (Page 72) for details.
・Touch , to switch the screens.
③
Touching this button to display another page menu.
Touch the desired page to switch the display to the desired screen.
The record of the output suppression on the Inverter can be verified.
Refer to “Power Suppression” (Page 82) for details.
3.3.4.Setting
① Grid Setting screen
Display the descriptions of the Grid Setting.
What Power Monitor can do
Page 68

68
④
③
②
①
⑩⑪ ⑨
⑧
【Screen setting】
⑤
⑥
⑦
Home screen selection
① Home screen
Touch the frame of the Home screen to select the Home screen.
Setting range: Screen 1 and Screen 2 (default setting is “Screen 1”).
②Slideshow photo selection
Files can be saved from USB memory onto the monitor.
Touch the frame of the Slideshow Photo Selection to display the Slideshow Photo Selection
screen.
[Target selection]: Select the monitor or USB memory.
Contents: A directory of the file is displayed.
Maximum of 30 characters can be displayed as character display for the contents.
Once the number of characters exceeds 30, the portion leading up to the valid
characters is replaced by “...”.
The directory of the file is displayed with maximum of 30 characters.
Once the number of characters exceeds 30, the portions following the valid
characters are replaced by “...”.
* It may take some time to display larger files.
(The recommended image size is 800 x 480 pixels.)
* File names must be assigned in alphanumeric characters and the file formats
must be JPG, JPEG, GIF or PNG.
Press the [Replace] button to select USB memory.
Select a folder and touch this button to store the file in the “show” folder in the monitor.
[x]: Touching this closes the dialog window.
What Power Monitor can do
Page 69

Folder Selection screen
69
④ Sleep mode
The duration of time with no operation until the liquid crystal display on the monitor is
turned off can be set.
Setting range: 1, 2, 3, 4, 5, 10, 15, 20, 25 and 30 minutes
The default setting is 5 minutes.
Touching the screen while in the sleep mode will trigger the display of the screen.
Furthermore, when an error code is displayed, the screen is turned on and the display
reverts to the Home screen.
⑤ Screen Brightness
The brightness of the screen can be selected in ten levels.
Setting range: 1, 2, 3, 4, 5, 6, 7, 8, 9, 10
The default setting is 8.
③ Slide interval
The screen switching time of the slideshow can be set (5, 10, 20 and 30 seconds).
The default setting is 10 seconds.
* It may take some time to display larger files.
(The recommended image size is 800 x 480 pixels.)
Touching the screen while a slideshow is being played will terminate the slideshow and
change the display to the Home screen.
If an error occurs, the slideshown terminates and Change the display to the Home screen.
⑥ Version
The firmware version of the Power Monitor is displayed.
⑦ Language
The language of the Power Monitor can be selected.
Setting range: English and Japanese.
What Power Monitor can do
Page 70

Touch “Operation Mode” to switch the display to the Operation Mode
screen. Refer to “Operation Mode” (Page 72) for details.
⑩
Touching this button to display another page menu.
Touch the desired page to switch the display to the desired screen.
The record of the output suppression on the Inverter can be verified.
Refer to “Power Suppression” (Page 82) for details.
70
⑧
A change is confirmed.
*
None of the settings will change until the “Save” button is touched at the end. Caution is required.
Touch to turn off the dialog box.
Screen Change dialog box
⑨
Change the display to the Home screen.
・In the Home screen, touch → .
・Use , to switch each screen.
Operating method
⑪
Grid Setting can be verified.
Refer to “Grid Setting” (Page 67) for details.
What Power Monitor can do
Page 71

Descriptions of Respective Screens
Screen 1:
A world of cute illustrations with large and
clear numbers.
Screen 2:
A simple format with a simple screen.
71
What Power Monitor can do
Page 72

⑤
⑥
①
⑧
⑦
【 Operation Mode 】
②
③
④
① Mode
Hybrid inverter has 6 normal operation modes for users to choose.
Each mode has different behavior between PV, battery, grid, and home load.
The following are the description of these modes.
In some area, the detail behavior of each operation mode may be different due to the local
electricity regulations.
Mode selection
72
What Power Monitor can do
Page 73

Self-consumption mode
Self-consumption mode is standard hybrid inverter mode.
In this mode, PV power is supplied in following priority :
1. Supply for home load.
2. Charge the battery until it is full.
3. Feed-in the remaining power to grid.
When there is no PV power, battery starts to discharge and supply home load until it’s empty.
If you had set the time settings, the behavior of hybrid inverter will change.
We will explain it in Page 81.
Self-consumption mode current flows
Electrical Grid
Hybrid Inverter
Battery
Input or
output
Charge or
discharge
Input
Output
Home Load
PV Array
Self-consumption mode behavior
19:0012:0007:0000:00 24:00
PV power
PV power used
for home load consumption
Excess PV power
Battery discharges
Home load power usage
73
What Power Monitor can do
Page 74

Peak cut mode
When home load consumption exceeds the Peak Cut Power you set in Function Setting
page, battery will discharge to assist the power usage.
Peak cut mode current flows
Electrical Grid
Hybrid Inverter
Battery
Input or
output
Charge or
discharge
Input
Output
Home Load
PV Array
Peak cut mode behavior
19:0012:0007:0000:00 24:00
PV power
PV power used
for home load consumption
Excess PV power
Home load power usage
Battery discharges
74
What Power Monitor can do
Page 75

Selling First mode
Selling first mode is a standard PV inverter mode combining with 6 time settings.
In normal operation, power generated by PV array will all feed-in to home load and grid.
If users have set the time settings, inverter will change behavior in these time intervals.
Please refer to page 81 chapter for more detail about time settings.
Selling first mode current flows
Selling first mode behavior
Electrical Grid
Hybrid Inverter
Battery
Input or
output
Charge or
discharge
Input
Output
Home Load
PV Array
19:0012:0007:0000:00 24:00
PV power
PV power used
for home load consumption
Excess PV power
Home load power usage
75
What Power Monitor can do
Page 76

Charge first mode
In this mode, PV power is supplied for battery charging first. After battery is fully charged,
the remaining PV power then feed-in to home load and grid.
Battery will not discharge in this mode even if there is no PV power.
Charge first mode current flows
Charge first mode behavior
Electrical Grid
Hybrid Inverter
Battery
Input or
output
Charge or
standby
Input
Output
Home Load
PV Array
19:0012:0007:0000:00 24:00
PV power
PV power used
for home load consumption
Excess PV power
Home load power usage
76
What Power Monitor can do
Page 77

Discharge First mode
In this mode, battery will not be charged any more.
All the PV power is feed-in to home load and grid. Battery keeps discharging when there
is no PV power until it is empty.
Discharge first mode current flows
Electrical Grid
Hybrid Inverter
Battery
Input or
output
Discharge
or standby
Input
Output
Home Load
PV Array
Discharge first mode behavior
19:0012:0007:0000:00 24:00
PV power
PV power used
for home load consumption
Excess PV power
Battery discharges
Home load power usage
77
What Power Monitor can do
Page 78

Without BT mode
If your battery was damaged for some reason, you can disconnect the battery wiring and
choose without BT mode. In this mode, hybrid inverter acts like a basic grid-tie PV inverter.
Without BT mode current flows
Electrical Grid
Hybrid Inverter
Input or
output
Input
Output
Home Load
PV Array
Without BT mode behavior
19:0012:0007:0000:00 24:00
PV power
PV power used
for home load consumption
Excess PV power
Home load power usage
78
What Power Monitor can do
Page 79

Special Modes
In addition to the 5 modes above, hybrid inverter still have 3 special modes.
These modes cannot be enabled by user but will be enabled automatically by inverter in
some special condition.
・Standalone mode
Hybrid inverter changes to standalone mode automatically during a power
outage occur. At this time, grid side is disconnected by inverter and home load
are supported by PV and battery power as much as possible.If the battery is
not connected, only when there has sufficient PV power can inverter enter
standalone mode.
Standalone mode current flows
Standalone mode behavior
Hybrid Inverter
Battery
Charge or
discharge
Input
Output
Home Load
PV Array
19:0012:0007:0000:00 24:00
PV power
PV power used
for home load consumption
Excess PV power
Battery discharges
Home load power usage
79
What Power Monitor can do
Page 80

・Forced charge mode
Although battery stops any action when SOC (state of charge) reach 0%,
the self-discharge phenomenon may still causing SOC lower than 0%.
At this time, hybrid inverter will force battery charging from PV power and grid
power until the battery SOC reaching 30%. Only in this special condition will
battery be charged by grid power. In normal operation mode, inverter only
charges the battery by PV power.
Forced charge mode current flows
Electrical Grid
Hybrid Inverter
Battery
Input or
output
Forced
Charge
Input
Output
Home Load
PV Array
Forced charge mode behavior
19:0012:0007:0000:00 24:00
PV power
PV power used
for home load consumption
Excess PV power
Home load power usage
80
What Power Monitor can do
Page 81

② SOC Limit
You can assign the lower limit of battery SOC. Battery will stop dischargingwhen its SOC
reach this limit.
③ Peak Cut Power
Peak cut power is used in peak cut mode. You can assign the peak power of home load
usage from grid. When the home load consumption exceeds this value, battery will discharge
to supply remaining power.
④ Time Settings
Time settings can be separated into BT charge time and BT discharge time.
Each setting can set 3 time intervals. These 6 time intervals cannot overlapwith each other.
When the inverter operation mode set to self-consumption or selling first mode,time settings
is enabled. Hybrid inverter will automatically change the modeto charge first / discharge first
in the time intervals you set and return to self-consumption / selling first mode outside the
intervals.
⑤
A change is confirmed.
*
None of the settings will change until the “Save” button is touched at the end. Caution is required.
Touch to turn off the dialog box.
⑦
Change the display to the Home screen.
・In the Home screen, touch → .
・Use to switch each screen.
Operating method
⑧
Touching this button to display another page menu.
Touch the desired page to switchthe display to the desired screen.
⑥
A
screen in which the desired Inverter can be selected
is displayed.
Touch the button to display the Inverter Selection dialog
box. Touch the No. of the desired Inverter.
Grid Setting can be verified.
Refer to “Grid Setting” (Page 67) for details.
Sleep time ,brightness, slideshow and language for the screen can
be set. Refer to “Screen Setting” (Page 68) for details.
81
What Power Monitor can do
Page 82

82
④
③
①
⑥
【 Power Suppression 】
⑤②
① Date
Year: Year is displayed according to the Gregorian calendar. The year can be changed with
a touch.
Month: Month is displayed. The month can be changed with a touch.
Touching the “Nothing Changed” button will return to the Power Suppression screen.
②
Change the display to the previous month.
Change the display to the next month.
③ Suppression record
That displays the set of suppression details.
Touch on the desired date to display the Schedule
Information for that day.
Touch to revert to the Power Suppression
screen.
What Power Monitor can do
Page 83

83
④ Current day display
The current day is indicated by a blue frame.
Past days are displayed in gray.
Grid Setting can be verified.
Refer to “Grid Setting” (Page 67) for details.
Sleep time ,brightness, slideshow and language for the screen can be set.
Refer to “Screen Setting” (Page 68) for details.
⑥
Change the display to the Home screen.
・In the Home screen, touch → .
・Touch , to switch the screens.
Operating method
⑤
Touching this button displays another page menu.
Touch the desired page to switchthe display to the desired screen.
What Power Monitor can do
Page 84

84
・In the Home screen, touch .
・ to close.
Operating method
The status of the Inverter can be verified.
② Operating status
Connected: System is connected with grid
Independent: System is in standalone mode
Off: The Inverter is stop
① Grid lock state will show by the color of Inverter No.
No grid lock if purple, and grid lock if yellow.
③ Error status
When one or more errors are occurring, the error codes are displayed here.
② Operating status
Connection status
① Inverter No.
③ Error status
3.3.5.Inverter Status
What Power Monitor can do
Page 85

4.
When Something Seems Wrong (Troubleshooting)
4.1.Error Displays
85
■ Icons are displayed on the Home screen when an error, malfunction or suppression occurs.
② ①
③
① Communication Malfunction icon
This icon is displayed when the communication with the Inverter or the Meter is not available.
Communication malfunction
Communication with the Inverter or the Meter is
malfunctioning.
Icon Operating mode Description
② Error icon
An error icon is displayed to indicate that one or more errors are occurring.
The Error icon is ordinarily not displayed, and displayed when one or more errors occur.
Details can be verified in the “Error Events Log” and “Inverter Status” pages.
Refer to the Installation and Maintenance Manual of the Inverter for details on the error codes.
・In the Home screen, touch → and .
・Touch and select the desired Inverter ( / / /
) to switch status screens of respective Inverters.
Operating method
When Something Seems Wrong (Troubleshooting)
Page 86

86
The temperature elevation suppression and voltage elevation suppression are not due to
malfunctions.
These are features available to ensure the safe operation of the system.
There is no malfunction with the system if the frequency is low or when they occur for brief
intervals.
Consult your retailer if the frequency is high or when the system is not restored for a long
period of time.
③ Suppression icon
Displayed when the Inverter is being suppressed.
Icon Operating mode
Voltage elevation
suppression
Temperature elevation
suppression
The voltage of the commercial power system has reached
a high level while the Inverter was in operation.
The output of the Inverter is being suppressed.
The internal temperature of the Inverter has reached a high
level. The output of the Inverter is being suppressed.
Description
When Something Seems Wrong (Troubleshooting)
Page 87

■ Responsive actions that should be taken in cases where the following symptoms occur are described.
4.2.Troubleshooting
87
Symptom
Nothing is displayed on
the screen.
Nothing is displayed even
when the screen is touched.
Total accumulated power
of Inverter and the total
accumulated amount of
power on the Power
Monitor vary.
Verification details
Is the backlight turned off?
Has the AC Adapter come
off the power outlet or the
Power Monitor?
Have you replaced the
Inverter?
Responsive action
Touching the screen will trigger the display of the
screen.
The duration of time the screen remains turned on
can be changed in the Screen Setting.
⇒ “Screen Setting” (Page 68).
“Battery Communication
Fail” appears in Error
Events Log.
It means there is no
communication between
inverter and battery.
Please check communication status between
inverter and battery
If there is no communication, check if communication
wiring is reversed or unusual.
If the issue cannot be cleared, please contact with
local representative.
“Battery Under Voltage”
appears in Error Events
Log.
Since reversed wiring may
cause battery voltage lower
Please check if wiring to the battery is reversed.
If the issue cannot be cleared, please contact with
local representative.
Connect the AC Adapter properly to the power outlet
and to the Power Monitor.
Contact your retailer if the symptom persists even
after a proper connection has been established.
It is normal in the following case:
The accumulated amount of power is accumulated
for each Inverter and Power Monitor, respectively.
Therefore, the values for the accumulated amount
of power may be different on a Inverter and those
displayed on a Power Monitor.
AC Adapter is hot How hot is it getting?
Heating does occur under normal circumstances while
the system is in use.
If the AC Adapter is so hot that you cannot touch it by
hand, pull it off the power outlet and consult your retailer.
Has any power failure
occurred?
The Power Monitor restarts and the screen remains
turned on for the duration of the set sleep time when
the system is restored from a power failure condition
after a power failure occurs.
The screen is turned on
when not in operation.
Is any error icon being
displayed?
The screen is turned on and the error message is
displayed automatically when a malfunction occurs.
Verify the displayed error message.
⇒ Refer to the Installation and Maintenance Manual
of the Inverter.
Voltage elevation
suppression and
temperature elevation
suppression are displayed.
Verify the frequency and
duration of occurrence.
The Voltage Elevation Suppression function and the
Temperature Elevation Suppression function are
functions that are triggered to ensure safe operation
of the system.
There is no malfunction with the system if the frequency
is low or when they occur for brief intervals.
Consult your retailer if the frequency is high or when
the system is not restored for a long period of time.
Performance data is lost.
Alternatively, the content
of the performance data
has changed.
Has the time been advanced
or reverted by 15 minutes
or more?
Has there been any power
failure?
The past performance data may be affected in
instances where date/time settings are performed
or when a power failure occurs.
When Something Seems Wrong (Troubleshooting)
Page 88

The Operation LED lamp
does not turn on when the
USB Wireless Module is
inserted in the Power
Monitor.
Has the AC Adapter come
off the power outlet or the
Power Monitor?
Connect the AC Adapter properly to the power outlet
and to the Power Monitor. Contact your retailer if the
symptom persists even after a proper connection has
been established.
Display (time and amount
of power production) does
not change.
Verify the radio wave status
of the Power Monitor.
Install the Power Monitor in a location with good
communication conditions when the Communication
Malfunction icon is displayed.
Communication Malfunction
icon is displayed.
Wireless communication
is not available.
Is there any obstruction in
the surrounding area or is
the installed location far
away?
The communication between the Power Monitor and
a Inverter or a Meter is in an abnormal condition
when the Communication Malfunction icon is displayed.
Consult your retailer.
Symptom Verification details Responsive action
The power display values
appear to be incorrect.
Alternatively, the values
for the power production,
power consumption and
power feed-in and purchase
are not in the following
relationship:
Power consumed =
(power production - power
feed-in) or Power consumed
= (power production +
Power purchased)
Verify that the displayed
power values are in
accordance with the
equations described to the
left.
There are instances that the values do not
necessarily match up with the values that can be
derived with these equations, due to effects from
the fluctuations that occur with the power production
or rounding up or off of the values and in such
instances there is no malfunction with the Product.
If the displayed power values are clearly wrong,
there may be a system malfunction. Consult your
retailer in such cases.
There are some variances in measurement values.
The Wireless Setting lamp
of the Meter is illuminated
red.
Is there an icon, such as an
Error icon displayed on the
Power Monitor?
Install the Power Monitor in a location with good
communication conditions when the Communication
Malfunction icon is displayed.
The Wireless Setting lamp
of the Meter is blinking
green.
Is there an icon, such as an
Error icon displayed on the
Power Monitor?
Install the Power Monitor in a location with good
communication conditions when the Communication
Malfunction icon is displayed. Verify the connection
if the Communication Malfunction icon is not displayed.
The value of the power
consumed displayed on
the Home screen
sometimes increases or
decreases, even when the
amount of electricity used
remains constant.
Has the value of the power
production
changed?
The value displayed as power consumption may be
greater (or smaller) than the actual value when there
is fluctuation with sunshine or the like.
This arises from the difference in the timing of data
acquisition for the power production and the power
purchase and is not due to a malfunction of the Product.
The amounts of power
feed-in and purchased
differ from those
described in the statement
of the power company.
Verify the amount of power
being displayed.
There may be discrepancy between the amount
described in the statement of the power company
and the amount of power displayed due to following
types of errors.
If the discrepancy is significant, consult your retailer.
(1) Error in measurement:
The error arising from the fact that the instrument
used by the power company for the purpose of
calculating the amount of power purchased is not a
specified measuring instrument but instead it is
another equipment.
(2) Errors in calculation:
The error arising from rounding up or rounding off of
figures in the calculation and display process of the
Power Monitor.
88
When Something Seems Wrong (Troubleshooting)
Page 89

POWERMONITOR
Model R4E
Screen 7-inch TFT liquid crystal display, 800 x 480 pixels, resistive touch panel.
Display color 24-bit RGB (16,770,000 colors)
Data communication
method
RS-485, Ethernet / Wireless communication
Installation method Wall mounted / Desktop installation (indoors)
Operating voltage range
DC10V ~ 26V (Rated operating voltage: DC12V (AC Adapter))
Standby power 4 W (when backlight is turned OFF) (including USB Wireless Module)
Operating temperature
range
-20°C to 50°C (no freezing permitted)
Operating humidity range
30% to 85% (no condensation permitted)
Dimensions
120 H x 190 W x 32 D (mm)
120 H x 215 W x 32 D (mm) (including USB Wireless Module)
Weight 440 g
Displayed details
Power production, power consumption, amount of power feed-in and
purchased, calendar history, Inverter information, error log,
De-rating Log display and the like.
Maximum power
consumption
10 W or less (including USB Wireless Module and USB Storage)
Power consumption 6 W (when backlight is turned ON) (including USB Wireless Module)
Maximum number of
Inverter connections
3 units
190mm
120mm
32mm
5.Specifications
5.1. Power Monitor
89
Downloads
Every hour, for period of 3 months
Every day, for period of 3 months (available for duration spanning 20 years)
Every month, for period of 1 year (available for duration spanning 20 years)
Every year for period of 20 years
Every 15 minutes, for period of 3 months
Specifications
Page 90

90
Model P1E
Installation method Wall mounting using DIN rails
Rated operating voltage Single-phase 2-wire, 220V, 230V, 50/60 Hz
Power consumption 2 W or lower
Operating temperature range -20°C to 50°C (no freezing permitted)
Operating humidity range 30% to 85% (no condensation permitted)
Dimensions 93.0 H x 47.3 W x 66.5 D (mm)
Weight 145 grams (current sensor 150 grams / cable 20 grams)
47.3mm
93mm
66.5mm
Model P3E
Installation method Wall mounting using DIN rails
Rated operating voltage Tripple-phase 4-wire, 220V, 230V, 50/60 Hz
Power consumption 3 W or lower
Operating temperature range -20°C to 50°C (no freezing permitted)
Operating humidity range 30% to 85% (no condensation permitted)
Dimensions 93.0 H x 70.0 W x 66.5 D (mm)
Weight 200 grams (current sensor 150 grams / cable 20 grams)
93mm
70mm
66.5mm
5.2.Power Meter
Specifications
Page 91

91
Part No. 5040456000
Communication frequency 2.4 GHz band
Rated operating voltage DC5V
Operating temperature range 5°C to 35°C (no freezing permitted)
Operating humidity range 10% to 85% (no condensation permitted)
Electric current consumption 260 mA (max.)
External dimensions 19(W)x49(D)x8(H)mm
Weight Approx. 6 grams
8mm
49mm
19mm
5.4.
USB Wireless Module (Wireless Set)
5.3.
Wireless Communication Unit (Wireless Set)
Model N1E
Installation method Wall mounting using DIN rails
Data communication method Wireless communication
Rated operating voltage DC 3.3 V
Power consumption 2 W or lower
Operating temperature range -20°C to 50°C (no freezing permitted)
Operating humidity range 30% to 85% (no condensation permitted)
Dimensions
93.0 H x 28.0 W x 82.6 D (mm)
62.7 (mm) (antenna)
Weight
※The antenna can be detached from the main unit.
90 grams (including antenna)
33.3mm
28mm
93mm
82.6mm
66.5mm
13mm
62.7mm
Φ9.5mm
Specifications
Page 92

Model N2E
Data communication method Wireless communication
Rated voltage DC3.3V
Power consumption 2 W or lower
Operating temperature range -20°C to 85°C (no freezing permitted)
Operating humidity range 0% to 90% (no condensation permitted)
Dimensions 167 mm x 80.3 mm (cover and antenna)
77 (mm) (antenna)
Weight 130 grams (including antenna)
5.5.
Wireless Communication Unit for Inverter (Wireless Set)
92
※The antenna can be detached from the main unit.
63.1mm
124.3mm
74mm
46mm
167mm
77mm
60.1mm
80.3mm
Specifications
Page 93

Page 94

Page 95

Page 96

20180529
 Loading...