

Page 1

Dell™ OpenManage™
Server Administrator Version 6.1
Command Line Interface
User's Guide
Page 2

Notes and Cautions
NOTE: A NOTE indicates important information that helps you make better use of
your computer.
CAUTION: A CAUTION indicates potential damage to hardware or loss of data
if instructions are not followed.
____________________
Information in this document is subject to change without notice.
© 2009 Dell Inc. All rights reserved.
Reproduction of these materials in any manner whatsoever without the written permission of Dell Inc.
is strictly forbidden.
Trademarks used in this text: Dell, the DELL logo, PowerEdge, and OpenManage are trademarks of
Dell Inc.; Microsoft, Windows, Active Directory, Hyper-V, MS-DOS and Windows Server are either
trademarks or registered trademarks of Microsoft Corporation in the United States and/or other
countries; SUSE is a registered trademark of Novell, Inc. in the United States and other countries;
Red Hat and Red Hat Enterprise Linux are registered trademarks of Red Hat, Inc. in the United States
and other countries; Intel, Pentium, and Itanium are registered trademarks and Intel386 is a trademark
of Intel Corporation in the United States and other countries; AMD, AMD Opteron, AMD-V, and AMD
Pow er No w! are trademarks of Advanced Micro Devices, Inc.; UNIX is a registered trademark of The
Open Group in the United States and other countries; OS/2 is a registered trademark of
International Business Machines Corporation; Rambus is a registered trademark of Rambus, Inc.
Other trademarks and trade names may be used in this document to refer to either the entities claiming
the marks and names or their products. Dell Inc. disclaims any proprietary interest in trademarks and
trade names other than its own.
March 2009
Page 3

Contents
1 Introduction . . . . . . . . . . . . . . . . . . . . . . . 15
What's New for Version 6.1 . . . . . . . . . . . . . . . 15
Using CLI Commands from Windows
Command Prompts
. . . . . . . . . . . . . . . . . . . 17
Primary CLI Commands
CLI Error Checking and Error Messages
Success Messages
Failure Messages
Scripting and Comparing With the CLI
Command Syntax Overview
. . . . . . . . . . . . . . . . . 17
. . . . . . . . 19
. . . . . . . . . . . . . . . . 19
. . . . . . . . . . . . . . . . . 19
. . . . . . . . . 20
. . . . . . . . . . . . . . . 21
2 Using the omhelp Command . . . . . . . . . . 23
Example Help Commands . . . . . . . . . . . . . . . . 23
3 omreport: Viewing System Status
Using the Instrumentation Service
Conventions for Parameter Tables . . . . . . . . . 28
Command Summary of the omreport Command
Help With the omreport Command
omreport modularenclosure
. . . . . . . . . . . 35
. . . . . . . . . . . . . . 35
. . . . . 27
. . . . 28
Contents 3
Page 4

omreport about . . . . . . . . . . . . . . . . . . . . . 37
omreport chassis/omreport mainsystem
Commands
. . . . . . . . . . . . . . . . . . . . . . . . 38
omreport chassis/ omreport mainsystem
. . . . . 38
omreport chassis acswitch/omreport
mainsystem acswitch
. . . . . . . . . . . . . . . 38
omreport chassis batteries/omreport
mainsystem batteries
. . . . . . . . . . . . . . . . 39
omreport chassis bios/omreport
mainsystem bios
. . . . . . . . . . . . . . . . . . 40
omreport chassis biossetup/omreport
mainsystem biossetup
. . . . . . . . . . . . . . . 40
omreport chassis bmc/omreport
mainsystem bmc
. . . . . . . . . . . . . . . . . . 43
omreport chassis currents/omreport
mainsystem currents
. . . . . . . . . . . . . . . . 43
omreport chassis fans/omreport
mainsystem fans
. . . . . . . . . . . . . . . . . . 44
omreport chassis fancontrol/omreport
mainsystem fancontrol
. . . . . . . . . . . . . . . 44
omreport chassis firmware/omreport
mainsystem firmware
. . . . . . . . . . . . . . . . 44
omreport chassis frontpanel/omreport
mainsystem frontpanel
. . . . . . . . . . . . . . . 45
omreport chassis fru/omreport
mainsystem fru
. . . . . . . . . . . . . . . . . . . 45
omreport chassis hwperformance/omreport
mainsystem hwperformance
. . . . . . . . . . . . 45
omreport chassis info/omreport
mainsystem info
omreport chassis intrusion
. . . . . . . . . . . . . . . . . . 46
. . . . . . . . . . . . . 47
omreport chassis leds/omreport
mainsystem leds
. . . . . . . . . . . . . . . . . . 47
omreport chassis memory/omreport
mainsystem memory
. . . . . . . . . . . . . . . . 48
4 Contents
Page 5

omreport chassis nics/omreport
mainsystem nics
. . . . . . . . . . . . . . . . . . 49
omreport chassis ports/omreport
mainsystem ports
. . . . . . . . . . . . . . . . . . 49
omreport chassis processors/omreport
mainsystem processors
. . . . . . . . . . . . . . 50
omreport chassis pwrmanagement/omreport
mainsystem pwrmanagement
. . . . . . . . . . . 54
omreport chassis pwrmonitoring/omreport
mainsystem pwrmonitoring
. . . . . . . . . . . . 55
omreport chassis pwrsupplies/omreport
mainsystem pwrsupplies
. . . . . . . . . . . . . . 57
omreport chassis remoteaccess/omreport
mainsystem remoteaccess
. . . . . . . . . . . . . 58
omreport chassis slots/omreport
mainsystem slots
. . . . . . . . . . . . . . . . . . 59
omreport chassis temps/omreport
mainsystem temps
. . . . . . . . . . . . . . . . . 59
omreport chassis volts/omreport
mainsystem volts
. . . . . . . . . . . . . . . . . . 60
omreport system Commands/omreport
servermodule Commands
. . . . . . . . . . . . . . . . 60
omreport system/omreport servermodule
Commands for Viewing Logs
. . . . . . . . . . . . 61
omreport system alertaction/omreport
servermodule alertaction
. . . . . . . . . . . . . 62
omreport system assetinfo/omreport
servermodule assetinfo
. . . . . . . . . . . . . . 64
omreport system events/omreport
servermodule events
. . . . . . . . . . . . . . . . 64
omreport system operatingsystem/omreport
servermodule operatingsystem
. . . . . . . . . . 66
omreport system pedestinations/omreport
servermodule pedestinations
. . . . . . . . . . . 66
omreport system platformevents/omreport
servermodule platformevents
. . . . . . . . . . . 68
. . . . . 60
Contents 5
Page 6

omreport system recovery/omreport
servermodule recovery
. . . . . . . . . . . . . . . 68
omreport system shutdown/omreport
servermodule shutdown
. . . . . . . . . . . . . . 68
omreport system summary/omreport
servermodule summary
. . . . . . . . . . . . . . 68
omreport system thrmshutdown/omreport
servermodule thrmshutdown
. . . . . . . . . . . . 73
omreport system version/omreport
servermodule version
. . . . . . . . . . . . . . . 74
omreport preferences Commands
. . . . . . . . . . . . 75
4 omconfig: Managing Components
Using the Instrumentation Service
Conventions for Parameter Tables . . . . . . . . . 78
omconfig Command Summary
Help With the omconfig Command
omconfig about
. . . . . . . . . . . . . . . . . . . . . 86
omconfig chassis/omconfig mainsystem
omconfig chassis biossetup/omconfig
mainsystem biossetup
omconfig chassis bmc/omconfig
mainsystem bmc
omconfig chassis currents/omconfig
mainsystem currents
omconfig chassis fans/omconfig
mainsystem fans
omconfig chassis fancontrol/omconfig
mainsystem fancontrol
omconfig chassis frontpanel/omconfig
mainsystem frontpanel
. . . . . . . . . . . . . . 78
. . . . . . . . . . . 85
. . . . . . . . 87
. . . . . . . . . . . . . . . 87
. . . . . . . . . . . . . . . . . . 100
. . . . . . . . . . . . . . . . 100
. . . . . . . . . . . . . . . . . . 100
. . . . . . . . . . . . . . . 101
. . . . . . . . . . . . . . . 102
. . . . . 77
6 Contents
Page 7

omconfig chassis info/omconfig
mainsystem info
. . . . . . . . . . . . . . . . . . 103
omconfig chassis leds/omconfig
mainsystem leds
. . . . . . . . . . . . . . . . . . 105
omconfig chassis memorymode/omconfig
mainsystem memorymode
. . . . . . . . . . . . . 105
omconfig chassis pwrmanagement/omconfig
mainsystem pwrmanagement
. . . . . . . . . . . 107
omconfig chassis pwrmonitoring/omconfig
mainsystem pwrmonitoring
. . . . . . . . . . . . 108
omconfig chassis remoteaccess/omconfig
mainsystem remoteaccess
. . . . . . . . . . . . . 110
omconfig chassis temps/omconfig
mainsystem temps
. . . . . . . . . . . . . . . . . 122
omconfig chassis volts/omconfig
mainsystem volts
. . . . . . . . . . . . . . . . . . 123
omconfig preferences
omconfig preferences cdvformat
omconfig preferences dirservice
omconfig preferences snmp
. . . . . . . . . . . . . . . . . . 125
. . . . . . . . . 125
. . . . . . . . . 126
. . . . . . . . . . . . 127
omconfig preferences useraccess
omconfig preferences webserver
omconfig system/omconfig servermodule
omconfig system alertaction/omconfig
servermodule alertaction
Commands for Clearing Logs
. . . . . . . . . . . . . 130
. . . . . . . . . . . 135
omconfig system pedestinations/omconfig
servermodule pedestinations
. . . . . . . . . . . 135
omconfig system platformevents/omconfig
servermodule platformevents
. . . . . . . . . . . 136
omconfig system events/omconfig
servermodule events
. . . . . . . . . . . . . . . . 139
omconfig system webserver/omconfig
servermodule webserver
. . . . . . . . . . . . . 142
. . . . . . . . 128
. . . . . . . . . 129
. . . . . . . 130
Contents 7
Page 8

omconfig system recovery/omconfig
servermodule recovery
. . . . . . . . . . . . . . . 142
omconfig system shutdown/omconfig
servermodule shutdown
. . . . . . . . . . . . . . 143
omconfig system thrmshutdown/omconfig
servermodule thrmshutdown
. . . . . . . . . . . . 144
5 omconfig system or servermodule
assetinfo: Editing Cost of
Ownership Values
Overview . . . . . . . . . . . . . . . . . . . . . . . . . 147
User Level Required for Adding
Asset Information
. . . . . . . . . . . . . . . . . 147
. . . . . . . . . . . . . . . . . 147
8 Contents
Adding Acquisition Information
. . . . . . . . . . . . . 148
Example Commands for Adding
Acquisition Information
Adding Depreciation Information
. . . . . . . . . . . . . . 149
. . . . . . . . . . . . 150
Example Commands for Adding Depreciation
Information
. . . . . . . . . . . . . . . . . . . . . 151
Adding Extended Warranty Information
Example Command for Adding Extended
Warranty Information
Adding Lease Information
. . . . . . . . . . . . . . . 152
. . . . . . . . . . . . . . . . 153
Example Command for Adding Lease
Information
Adding Maintenance Information
. . . . . . . . . . . . . . . . . . . . . 154
. . . . . . . . . . . . 154
Example Command for Adding Maintenance
Information
. . . . . . . . . . . . . . . . . . . . . 155
. . . . . . . . 151
Page 9

Adding Outsource Information . . . . . . . . . . . . . 156
Example Command for Adding Outsource
Information
. . . . . . . . . . . . . . . . . . . . . 157
Adding Owner Information
. . . . . . . . . . . . . . . 157
Example Command for Adding Owner
Information
Adding Service Contract Information
. . . . . . . . . . . . . . . . . . . . . 158
. . . . . . . . . . 159
Example Command for Adding Service
Information
Adding Support Information
. . . . . . . . . . . . . . . . . . . . . 159
. . . . . . . . . . . . . . . 160
Example Command for Adding Support
Information
Adding System Information
. . . . . . . . . . . . . . . . . . . . . 161
. . . . . . . . . . . . . . . 162
Example Command for Adding System
Information
Adding Warranty Information
. . . . . . . . . . . . . . . . . . . . . 162
. . . . . . . . . . . . . . 163
Example Command for Adding Warranty
Information
. . . . . . . . . . . . . . . . . . . . . 164
6 Using the Storage Management
Service
. . . . . . . . . . . . . . . . . . . . . . . . . 165
CLI Command Syntax . . . . . . . . . . . . . . . . . . 165
Syntax for Required, Optional, and Variable
Command Elements
. . . . . . . . . . . . . . . . . . . 166
User Privileges for omreport storage and
omconfig storage
. . . . . . . . . . . . . . . . . . . . 168
omreport Command . . . . . . . . . . . . . . . . . . . 168
Contents 9
Page 10

omreport Storage Help . . . . . . . . . . . . . . . . . 169
omreport Controller Status
. . . . . . . . . . . . . 170
omreport Global Information (Smart
Thermal Shutdown Status, Hot Spare
Protection Policy)
omreport Battery Status
omreport Connector Status
omreport Enclosure Status
omreport Temperature Probe Status
omreport Fan Status
omreport Power Supply Status
omreport EMM Status
omreport Physical Disk Status
omreport Virtual Disk Status
. . . . . . . . . . . . . . . . . 170
. . . . . . . . . . . . . . 171
. . . . . . . . . . . . 171
. . . . . . . . . . . . . 172
. . . . . . . . 173
. . . . . . . . . . . . . . . . 174
. . . . . . . . . . . 175
. . . . . . . . . . . . . . . 176
. . . . . . . . . . . 177
. . . . . . . . . . . . 178
10 Contents
omconfig Global Commands
. . . . . . . . . . . . . . 178
omconfig Global Enable Smart Thermal
Shutdown
. . . . . . . . . . . . . . . . . . . . . . 179
omconfig Global Disable Smart Thermal
Shutdown
. . . . . . . . . . . . . . . . . . . . . . 179
omconfig Global Rescan Controller
omconfig Set Hot Spare Protection Policy
omconfig Controller Commands
omconfig Rescan Controller
. . . . . . . . . . . . . 181
. . . . . . . . . . . . 183
omconfig Enable Controller Alarm
omconfig Disable Controller Alarm
omconfig Quiet Controller Alarm
omconfig Test Controller Alarm
omconfig Reset Controller Configuration
omconfig Create Virtual Disk
. . . . . . . . . . . . 186
omconfig Set Controller Rebuild Rate
omconfig Set Background Initialization Rate
omconfig Set Reconstruct Rate
omconfig Set Check Consistency Rate
. . . . . . . . 180
. . . . . 180
. . . . . . . . . 184
. . . . . . . . 184
. . . . . . . . . . 185
. . . . . . . . . . 185
. . . . . 186
. . . . . . . 192
. . . 193
. . . . . . . . . . 193
. . . . . . . 194
Page 11

omconfig Export the Controller Log . . . . . . . . 194
omconfig Import Foreign Configuration
. . . . . . 195
omconfig Import/Recover Foreign
Configuration
omconfig Clear Foreign Configuration
omconfig Set Patrol Read Mode
omconfig Start Patrol Read
omconfig Stop Patrol Read
omconfig Change Controller Properties
omconfig Storage Virtual Disk
omconfig Storage Controller
. . . . . . . . . . . . . . . . . . . . 195
. . . . . . . 196
. . . . . . . . . . 196
. . . . . . . . . . . . 197
. . . . . . . . . . . . 197
. . . . . . 198
. . . . . . . . . . . 199
. . . . . . . . . . . . 199
omconfig Virtual Disk Commands
omconfig Blink Virtual Disk
. . . . . . . . . . . . 201
omconfig Unblink Virtual Disk
omconfig Initialize Virtual Disk
omconfig Cancel Initialize Virtual Disk
omconfig Fast Initialize Virtual Disk
omconfig Slow Initialize Virtualize Disk
omconfig Cancel Background Initialize
omconfig Restore Dead Segments
omconfig Split Mirror
omconfig Unmirror
. . . . . . . . . . . . . . . 205
. . . . . . . . . . . . . . . . . 205
omconfig Assign Dedicated Hot Spare
omconfig Unassign Dedicated Hot Spare
omconfig Check Consistency
omconfig Cancel Check Consistency
omconfig Pause Check Consistency
omconfig Resume Check Consistency
omconfig Delete Virtual Disk
omconfig Format Virtual Disk
omconfig Reconfiguring Virtual Disks
omconfig Change Virtual Disk Policy
omconfig Rename Virtual Disk
. . . . . . . . . . . 200
. . . . . . . . . . . 201
. . . . . . . . . . . 202
. . . . . . . 202
. . . . . . . . 202
. . . . . . 203
. . . . . . 204
. . . . . . . . 204
. . . . . . 206
. . . . . 207
. . . . . . . . . . . 208
. . . . . . . 209
. . . . . . . . 209
. . . . . . . 210
. . . . . . . . . . . . 210
. . . . . . . . . . . 211
. . . . . . . 211
. . . . . . . 212
. . . . . . . . . . . 213
Contents 11
Page 12

omconfig Physical Disk Commands . . . . . . . . . . . 213
omconfig Blink Physical Disk
omconfig Unblink Physical Disk
omconfig Prepare to Remove Physical Disk
omconfig Initialize Physical Disk
omconfig Offline Physical Disk
omconfig Offline Physical Disk
omconfig Online Physical Disk
omconfig Assign Global Hot Spare
omconfig Unassign Global Hot Spare
omconfig Rebuild Physical Disk
omconfig Cancel Rebuild Physical Disk
omconfig Remove Dead Segments
omconfig Clear Physical Disk
omconfig Cancel Clear Physical Disk
omconfig Cancel Replace Member
. . . . . . . . . . . . 214
. . . . . . . . . . 215
. . . . 216
. . . . . . . . . . 217
. . . . . . . . . . . 218
. . . . . . . . . . . 218
. . . . . . . . . . . 219
. . . . . . . . . 220
. . . . . . . 221
. . . . . . . . . . 222
. . . . . . 222
. . . . . . . . 223
. . . . . . . . . . . 224
. . . . . . . 225
. . . . . . . . 225
12 Contents
omconfig Battery Commands
. . . . . . . . . . . . . . 226
omconfig Recondition Battery
omconfig Start Battery Learn Cycle
omconfig Delay Battery Learn Cycle
omconfig Connector Commands
omconfig Rescan Connector
omconfig Enclosure Commands
omconfig Enable Enclosure Alarm
omconfig Disable Enclosure Alarm
omconfig Set Enclosure Asset Tag
omconfig Set Enclosure Asset Name
omconfig Set Temperature Probe
Thresholds
. . . . . . . . . . . . . . . . . . . . . 232
omconfig Reset Temperature Probe
Thresholds
. . . . . . . . . . . . . . . . . . . . . 233
. . . . . . . . . . . 226
. . . . . . . . 227
. . . . . . . . 227
. . . . . . . . . . . . 228
. . . . . . . . . . . . 228
. . . . . . . . . . . . . 229
. . . . . . . . . 230
. . . . . . . . 230
. . . . . . . . . 231
. . . . . . . 232
Page 13

omconfig Set All Temperature Probe
Thresholds
. . . . . . . . . . . . . . . . . . . . . 234
omconfig Reset All Temperature Probe
Thresholds
omconfig Blink
. . . . . . . . . . . . . . . . . . . . . 235
. . . . . . . . . . . . . . . . . . . 235
7 Working With CLI Command
Results
. . . . . . . . . . . . . . . . . . . . . . . . . 237
Output Options for Command Results . . . . . . . 237
Controlling Command Output Display
Writing Command Output to a File
. . . . . . . 237
. . . . . . . . . 238
Selecting a Format for Your CLI
Command Output
. . . . . . . . . . . . . . . . . . 240
Glossary . . . . . . . . . . . . . . . . . . . . . . . . . . . . 245
Index
. . . . . . . . . . . . . . . . . . . . . . . . . . . . . . 285
Contents 13
Page 14

14 Contents
Page 15

Introduction
You can perform essential systems management tasks using Dell™
OpenManage™ Server Administrator’s graphical user interface (GUI) or the
command line interface (CLI).
The reporting and viewing features allow retrieval of overall health status for
systems on your network. At the component level, you can view information
about voltages, temperatures, fan’s
functioning, and many other critical component details. You can see a
detailed account of many relevant cost of ownership (COO) facts about your
system in a summary view. Version information for BIOS, firmware, operating
system, and all installed software is easy to retrieve.
Configuration features allow Server Administrator to perform essential tasks
described in detail in the following sections.
NOTE: You can use the CLI instead of the Server Administrator home page, and turn
the Server Administrator Web server off if you have security concerns. The CLI does
not use the Web server. Use the omconfig system webserver action=stop command
to turn off the Web server. The Web server starts automatically after a reboot, so this
command must be issued each time a system starts up. See ""omconfig system
webserver/omconfig servermodule webserver" on page 142" for more information.
What's New for Version 6.1
These are the release highlights of OpenManage Server Administrator:
• Support for configuration and display of the following BIOS setup options:
• Core multi processing
• Unified Extensible Firmware Interface (UEFI) boot option
• CPU C State option
• Embedded Video Controller
• Support for form factor and multiple slot information on modular systems
• Support for in-context launch of Server Administrator Web server
• Support for three new
• Support for the following system components:
xx1x
revolutions per minute (
systems.
RPM), memory
Introduction 15
Page 16

• Reporting presence of optional iDRAC6 Enterprise card
• Provides an option to configure reporting of more attributes on
front panel LCD
• Reporting presence of iDRAC6 Enterprise and the size of storage,
if present
• Reporting of new PCI devices that are part of
xx1x
systems
• Display of the CPU turbo mode
• Display of new memory types (DDR3 Registered,
DDR3 Unregistered)
• Display of new slot types (PCIe Gen1/2)
• Enabling/disabling Non-Uniform Memory Architecture
(Node Interleaving) during deployment
• Enabling Network Controller-Sideband Interface support on each of
the LOMs on an individual basis for all LOMs
• Reporting memory operating modes (optimizer, mirror, advanced
ECC)
• Support for NICS receive and transmit statistics.
• Configuring AC Power Recovery delay
• Support for configuration and reporting Serial Address Select
• Enhanced power monitoring support:
• Reporting of power consumption values in BTU (British Thermal
Unit), as well as Watts.
• Support for Peak power headroom and instantaneous headroom
• Support for user-definable power budget cap
• Support for reporting of maximum potential power consumption and
minimum potential power consumption
• Support for reporting input power rating of power supply
• Support for power profile configuration
• Support for events alerting capability for peak power consumption
16 Introduction
Page 17

• Inclusion of Internet Protocol version 6:
• This release supports IPv6, in addition to IPv4.
NOTE: For the supported operating systems list, see the Dell Systems Software
Support Matrix located at DVD_Drive\docs\readme\PEOSOM on the Dell-provided
media or on the Dell support website at support.dell.com.
NOTE: CLI commands are not supported on systems with VMware® ESXi
operating system.
Using CLI Commands from Windows Command Prompts
If you are running the Microsoft Windows® operating system, use the 32-bit
command prompt to issue a Server Administrator CLI command. You can
access the 32-bit command prompt by clicking the Start button and pointing
to Programs→ Accessories→ Command Prompt shortcut, or by clicking the
Start button, selecting Run, and typing cmd.exe in the Run dialog box.
Do not type command into the Run dialog box to launch a command line
window; this activates the MS-DOS
environment variable limitations that can cause subtle problems with
the CLI.
®
emulator command.com, which has
Primary CLI Commands
The commands that carry out the functions of Server Administrator are:
•
omconfig
•
omhelp
•
omreport
The omconfig command writes values that you assign to an object's
properties. You can specify values for warning thresholds on components or
prescribe what action your system is to take when a certain warning or failure
event occurs. You can also use the omconfig command to assign specific
values to your system's asset information parameters, such as the purchase
price of the system, the system's asset tag, or the system's location.
Introduction 17
Page 18

The omhelp command displays short text help for CLI commands.
The shorthand equivalent of omhelp is the command for which you want
help followed by -?. For example, to display help for the omreport command,
type one of the following commands:
omhelp omreport
omreport -?
The omreport command produces reports of your system’s management
information.
NOTE: For an overall summary of CLI commands, type omhelp.
Table 1-1 lists the primary CLI commands used by Server Administrator.
This guide contains a section for each primary command.
Table 1-1. CLI Commands and Sections in This Guide
Primary CLI
Command
omconfig "omconfig: Managing Components
omhelp "Using the omhelp Command"
omreport "omreport: Viewing System Status
NOTE: omupdate commands are no longer supported in Server Administrator and
are replaced by Dell Update Package or Server Update Utility commands. To update
the different components, download the Dell Update Package and run <package
name> /s [/f]. See the Dell Update Packages for Microsoft Windows Operating Systems
User’s Guide, the Dell Update Packages for Linux User’s Guide, or the Server Update
Utility User’s Guide on the Dell Systems Management tools and Documentation DVD
or on the Dell Support website at support.dell.com for more information on
corresponding CLI syntax.
Section Title Related Sections
"omconfig system or
Using the Instrumentation Service"
Using the Instrumentation Service"
servermodule assetinfo: Editing
Cost of Ownership Values"
Additional useful topics about the CLI include:
• "Working With CLI Command Results"
• "Glossary"
18 Introduction
Page 19

CLI Error Checking and Error Messages
When you type CLI commands, the CLI checks these commands for correct
syntax. If you enter a command and the command is executed successfully,
a message displays, stating that your command has been successful.
Success Messages
When you type a successful omconfig command, data for that
component displays.
The following omconfig command examples show valid CLI commands and
their success messages:
Command:
omconfig chassis temps index=0 warnthresh=default
Message:
Temperature probe warning threshold value(s) set
successfully.
Command:
omconfig chassis biossetup attribute=speaker
setting=on
Message:
BIOS setup configured successfully.
Command:
omconfig system assetinfo info=depreciation
duration=6
Message:
Asset information set successfully.
Failure Messages
CLI failure messages provide reasons why some commands do not succeed.
Some common reasons why commands fail include syntax errors and
components that are not present. Many error messages provide syntax
information that you can use to execute the command successfully.
Introduction 19
Page 20

If you try to execute a command for a component or feature not present in
your system configuration, the error message states that the component is not
present.
Command:
omconfig chassis volts index=3 minwarnthresh=
3.3000
Example message:
Error! Number with up to 3 digits after decimal
point expected, read 3.3000
The value given by the command specifies more than
3 digits after the decimal point. A valid minimum
warning threshold value for volts contains up to
3 digits after the decimal point.
Type:
omconfig chassis volts index=3 minwarnthresh=3.300
When you enter the revised command with three decimal points, you receive
another error message:
Error! This voltage probe min warning threshold
must be between 11.400 and 12.480.
Revised command:
omconfig chassis volts index=3 minwarnthresh=
11.500
Message:
Voltage probe warning threshold(s) set
successfully.
Scripting and Comparing With the CLI
The Server Administrator CLI allows administrators to write batch programs
or scripts to be executed by the operating system. For an enterprise with many
systems, an administrator could write a configuration script that specified the
warning thresholds for each major component of a system and also specified
a set of actions that the administrator wants each system to take in case of
20 Introduction
Page 21

a warning or failure event. In the most critical cases, the administrator could
write a script so that the system shuts down to prevent damage. The
administrator could then distribute and execute the script to many managed
systems at the same time. Such a scenario facilitates configuring any number
of new systems acquired by a company and makes implementation of new
system administration policies easier across many existing systems that
require reconfiguration.
A similar scenario could be used to populate a large number of newly acquired
systems with detailed asset information. Much of the information would be the
same, such as the manufacturer or lessor of the system, whether support for the
system is outsourced, name of the system's insurance company, method of
depreciation, and so on. Any variable that is common to all systems could be
scripted, sent to all managed systems, and executed. Asset information that is
unique to a system could be scripted as a group and sent to that managed
node for execution. For example, a script could specify values for all unique
variables such as owner, primary user phone number, asset tag, and so on.
Scripts to populate unique values would set all unique variables at once rather
than one by one through the system's command line.
In many cases, the CLI allows a user with a very well-defined task in mind to
retrieve information about the system rapidly. If a user wants to review a
comprehensive summary of all system components and save that summary
information to a file for comparison with later system states, the CLI is ideal.
Using CLI commands, administrators can write batch programs or scripts to
execute at specific times. When these programs execute, they can capture
reports on components of interest, such as fan RPMs during periods of high
system usage compared with the same measurements at times of lowest
system usage. Command results can be routed to a file for later analysis.
Reports can help administrators gain information that can be used to adjust
usage patterns, to justify purchasing new system resources, or to focus on the
health of a problem component.
Command Syntax Overview
Commands vary in complexity. The simplest command has only command
level 1. The omhelp command is a simple command. When you type
omhelp, a list of the main CLI commands is displayed.
Introduction 21
Page 22

The next level of complexity includes commands that contain command
levels 1 and 2. All of the about commands are examples of command level 2
complexity. The omconfig about and omreport about commands cause a very
brief summary to display. The summary shows version information for the
systems management software installed on your system; for example, Server
Administrator 1.x.
Some commands have command level 1 and command level 2 and one
name=value pair. Consider the following example command that instructs
Server Administrator for more details about the environment for Server
Administrator:
omreport about details=true
Command level 1 is omreport, command level 2 is about, and the name=
value pair is
details=true.
Many commands use command level 1, command level 2, and command
level 3, but do not require any parameters (name=value pairs). Most
omreport commands are of this type. For example:
omreport system alertaction
causes a list of alert actions that are configured for components on your
system to be displayed.
The most complex commands have all three command levels and can
have multiple name=value pairs. An example of two name=value pairs:
omconfig system assetinfo info=depreciation
duration=3
An example of nine name=value pairs:
omconfig system assetinfo info=acquisition
purchasecost=
purchasedate=<
expensed=<
<n> waybill=<n> installdate=<
mmddyy
yes | no
> ponum=<n> signauth=<
> costcenter=<
text
mmddyy
text
>
In each section, command syntax and other information about commands is
formatted with any of the following fields that apply:
command
level 1
command
level 2
command
level 3
name=value
pair 1
name=value
pair 2
22 Introduction
>
>
Page 23

Using the omhelp Command
The omhelp command and its equivalent, <command> -?, accesses the CLI's
detailed help text interface. You can get help at several levels of detail.
Each fully qualified CLI command may have a variable number of distinct
parts: the command (command level 1), one or more subcommands
(command level 2 and command level 3, if present), and one or more name=
value pair(s).
By appending -? (space-dash-question mark) to any command, you can get
help for that command.
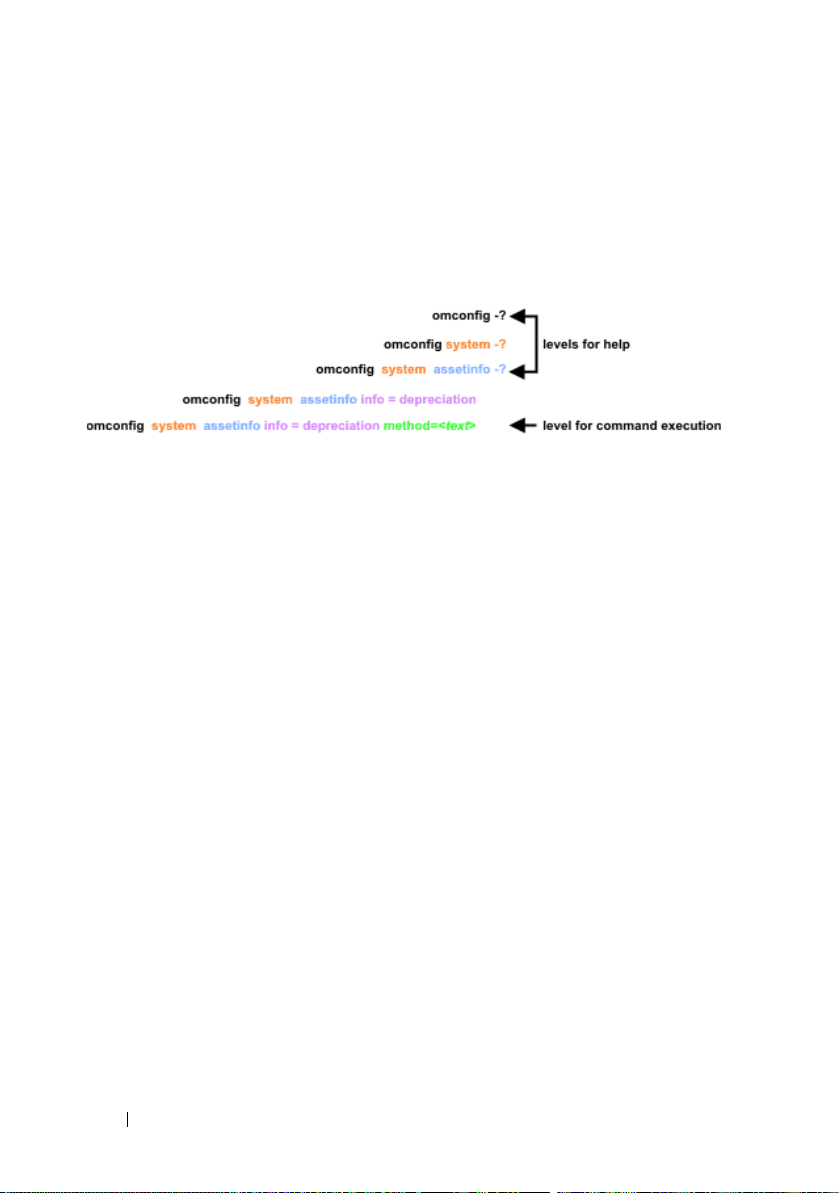
Example Help Commands
When you type omconfig -?, you get general help about the omconfig
command. The help at this level lists the available subcommands for
omconfig:
•about
• preferences
•chassis
• system
When you type omconfig system -?, CLI help lists all the
subcommands available for omconfig system:
• alertaction
• alertlog
• assetinfo
• cmdlog
•esmlog
• events
• platformevents
• pedestinations
• recovery
Using the omhelp Command 23
Page 24
•shutdown
• thrmshutdown
• webserver
Figure 2-1 shows the levels of help for a command.
Figure 2-1. Different Levels of Help for a Command
You can also parse the omconfig system assetinfo command as follows:
<command level 1 command level 2 command level 3>
<name=value pair 1> [name=value pair 2]
where command levels 1, 2, and 3 are represented by omconfig system assetinfo,
name=value pair 1 is represented by info=depreciation, and name=value pair 2
is represented by method=straightline.
To set your depreciation method to straight line, type:
omconfig system assetinfo info=depreciation
method=straightline
The CLI responds with the following message:
Asset information set successfully.
When you type omconfig system assetinfo -?, the help that
displays provides information about assigning values for the name and option
fields. Partial results for the request omconfig system assetinfo -? are as
follows:
assetinfo Set asset information.
24 Using the omhelp Command
Page 25

For one info value, specify one or more optional parameter(s).
Table 2-1 displays the optional parameters for info=acquisition:
Table 2-1. Optional Parameters
Info Value Optional parameters
Info=acquisition purchasecost=<num>
waybill=<num>
installdate=<mmddyy>
purchasedate=<mmddyy>
ponum=<num>
signauth=<text>
expensed=<yes|no>
costcenter=<text>
info=depreciation
method=<text>
duration=<num>
percent=<percent>
unit=<months|years|unknown>
Using the omhelp Command 25
Page 26

26 Using the omhelp Command
Page 27

omreport: Viewing System Status Using the Instrumentation Service
The omreport command allows you to see detailed information about your
system components. You can retrieve summaries for many system
components at one time, or you can get details about a specific component.
This chapter shows you how to get reports with the level of detail that you
want.
Commands documented in this chapter vary in whether they define the fields that
appear in the results of a particular omreport command. Fields are defined only
if they have a special or less familiar use.
As with all other components, you can use omreport to view component
status, and omconfig to manage a component. For information on
configuring components for management, see "omconfig: Managing
Components Using the Instrumentation Service."
You can use omreport commands to get information you need to execute an
omconfig command. For example, if you want to edit the minimum
temperature for a warning event on a temperature probe, you need to know
the index of the probe you want to configure. You can use omreport chassis
temps to display a list of probes and their indexes.
Table 3-1. System Availability for the omreport Command
Command Level 1 Command Level 2 Applicable To
omreport modularenclosure
servermodule
mainsystem
system
chassis
preferences
omreport: Viewing System Status Using the Instrumentation Service 27
Modular system
Modular system
Modular system
Non-modular system
Non-modular system
Modular/Non-modular
system
Page 28

Conventions for Parameter Tables
When listing the parameters that a command can take, the parameters are
listed in alphabetical order instead of the order in which they appear in the
command line interface.
The symbol |, often called pipe, is the logical exclusive or operator.
For example, enable | disable means that you can enable or disable the
component or feature, but you cannot simultaneously enable and disable the
component or feature.
Command Summary of the omreport Command
NOTE: Although this chapter lists all possible omreport commands, the commands
available on your system depend on your system configuration. The results that
display for the omreport command vary from one system to another. Data displays
for installed components only.
NOTE: When a system includes an external chassis, the displayed results vary by
operating system. On SUSE
®
systems, omreport commands display external chassis information in
Linux
a separate section after the main chassis information. On Microsoft
systems, data about the external chassis does not appear in the omreport output.
Table 3-2 is a high-level summary of the omreport command. The column
titled "Command level 1" shows the omreport command at its most general.
"Command level 2" shows the major objects or components that you can view
using omreport (about, chassis, storage, and system). "Command level 3" lists
the specific objects and components for which you can view reports. "User
privilege required" refers to the type of privilege you need to perform the
command, where U=User, P=Power User, and A=Administrator. "Use" is
a very general statement about the actions that can be performed using
omreport. More details about syntax and use of the command appear later in
this section.
Table 3-2 shows the omreport commands available for about, system, and
main system chassis. For information about viewing storage components,
see "omreport: Viewing System Status Using the Instrumentation Service."
®
Linux Enterprise Server and Red Hat® Enterprise
®
Windows®
28 omreport: Viewing System Status Using the Instrumentation Service
Page 29

Table 3-2. Command Level 1, Level 2, and Level 3 for omreport
Command
Level 1
omreport
Command Level 2 Command
Level 3
User
Privilege
Required
Use
modularenclosure U, P, A Shows information
for all the modular
chassis.
about U, P, A Shows version
number and
properties for Server
Administrator.
details=true U, P, A Displays information
for all the Server
Administrator
programs installed.
chassis/mainsystem U, P, A Shows the general
status of all the main
components.
acswitch U, P, A Shows failover
settings where
redundant AC power
lines are supported in
a system.
batteries U, P, A Shows the properties
set for batteries.
bios U, P, A Shows BIOS
information such as
manufacturer,
version, and date last
updated.
biossetup A Shows BIOS setup
properties configured
during system boot.
fancontrol U, P, A Shows the properties
set for fan speed.
omreport: Viewing System Status Using the Instrumentation Service 29
Page 30

Table 3-2. Command Level 1, Level 2, and Level 3 for omreport (continued)
Command
Level 1
Command Level 2 Command
Level 3
fans U, P, A Shows the status and
firmware U, P, A Shows firmware
frontpanel U, P, A Shows whether the
fru U, P, A Shows the Field
hwperformance U, P, A Shows the status and
info U, P, A Shows a status
intrusion U, P, A Shows the status of
User
Privilege
Required
Use
thresholds for system
fans.
properties such as
version, date of last
update, and whether
the firmware
is updatable.
front panel button
settings, such as the
Power button and/or
Nonmasking
Interrupt (NMI)
button (if present on
the system), are
enabled or disabled.
Replaceable Unit
(FRU) information.
cause for the system’s
performance
degradation.
summary for main
system chassis
components.
the system’s intrusion
sensor(s).
30 omreport: Viewing System Status Using the Instrumentation Service
Page 31

Table 3-2. Command Level 1, Level 2, and Level 3 for omreport (continued)
Command
Level 1
Command Level 2 Command
Level 3
leds U, P, A Shows the properties
memory U, P, A Shows properties of
nics U, P, A Shows the number of
ports U, P, A Shows the properties
processors U, P, A Shows properties of
pwrmanagement U, P, A Shows power
pwrmonitoring U, P, A Shows properties of
User
Privilege
Required
Use
you have set for lightemitting diodes to
flash under various
alert conditions.
your system's memory
arrays.
NICs installed in your
system and displays
controller and
interface related
details.
for your system’s
parallel and serial
ports, such as I/O
address, IRQ level,
connector type, and
maximum speed.
your system’s
processors, including
speed, manufacturer,
and processor family.
management profiles
that will provide
control over power
utilization.
power consumption.
omreport: Viewing System Status Using the Instrumentation Service 31
Page 32

Table 3-2. Command Level 1, Level 2, and Level 3 for omreport (continued)
Command
Level 1
Command Level 2 Command
Level 3
User
Privilege
Required
Use
pwrsupplies U, P, A Shows properties of
power supplies.
remoteaccess U, P, A Shows general
information on
remote access.
slots U, P, A Shows properties of
your system’s
expansion slots and
other slot types.
temps U, P, A Shows the status and
thresholds for the
system temperature
sensors.
volts U, P, A Shows the status and
thresholds for the
system voltage
sensors.
storage U, P, A See "Using the
Storage Management
Service."
system/servermodule U, P, A Shows a high-level
summary of system
components.
alertaction U, P, A Shows warning and
failure threshold
values, as well as
actions configured
when an essential
component detects a
warning or failure
state.
32 omreport: Viewing System Status Using the Instrumentation Service
Page 33

Table 3-2. Command Level 1, Level 2, and Level 3 for omreport (continued)
Command
Level 1
Command Level 2 Command
Level 3
alertlog U, P, A Allows the
assetinfo U, P, A Shows the cost of
cmdlog U, P, A Allows the
esmlog U, P, A Allows the
events U, P, A Shows the system’s
operatingsystem U, P, A Shows the name and
pedestinations U, P, A Shows destinations
platformevents U, P, A Shows the system’s
User
Privilege
Required
Use
administrator to
display the alert log.
ownership
information for
your system.
administrator to
display the
command log.
administrator to
display the
hardware log.
Simple Network
Management
Protocol (SNMP)
event settings.
version of your
operating system.
where alerts for
platform events are
configured to be sent.
response for each
listed platform event.
omreport: Viewing System Status Using the Instrumentation Service 33
Page 34

Table 3-2. Command Level 1, Level 2, and Level 3 for omreport (continued)
Command
Level 1
Command Level 2 Command
Level 3
User
Privilege
Required
Use
recovery P, A Shows how your
system is configured
to respond to a hung
operating system.
shutdown P, A Shows how the
shutdown action is to
be performed.
summary U, P, A Shows the key facts
for all system
components,
including main
system chassis,
software, and storage.
thrmshutdown P, A Shows the shutdown
action, if any, to be
taken when a
temperature warning
or failure condition is
detected.
version U, P, A Shows a summary for
all updatable
components on your
system.
preferences webserver U, P, A Shows the URL
information of your
Server Administrator
Web server.
34 omreport: Viewing System Status Using the Instrumentation Service
Page 35

Help With the omreport Command
Use the omreport -? command to get a list of the available commands for
omreport.
Use omreport <command level 2> -? to get help on the level 2 about, chassis,
and system commands. The following information on omreport system -?
applies also applies to get help for the omreport chassis command.
To see a list of valid commands for omreport system, type:
omreport system -? | more
omreport modularenclosure
Use the omreport modularenclosure command to view details of the modular
system. Type:
omreport modularenclosure
NOTE: This CLI command is available when Dell OpenManage Server
Administrator is installed on Dell modular systems.
Server Administrator displays information related to the modular enclosure
and chassis management controller CMC (if available):
NOTE: As with all output shown in this guide, the following output is an example
and may vary depending on your system configuration.
Modular Chassis Information
Chassis Information
Attribute : Model
Value : Modular Server Enclosure
Attribute : Lock
Value : true
Attribute : Service Tag
Value : 8RLNB1S
CMC Information
Attribute : Product
omreport: Viewing System Status Using the Instrumentation Service 35
Page 36

Value : Chassis Management Controller (CMC)
Attribute : Description
Value : The system component provides a
complete set of remote management
functions for Dell systems.
Attribute : Version
Value : 1.0 (100)
Attribute : IP Address
Value : 101.102.103.104
Attribute : IP Address Source
Value : Dynamic
Attribute : IP Address Type
Value : IPv4
Attribute : Remote Connect Interface
Value : Launch CMC Web Interface
36 omreport: Viewing System Status Using the Instrumentation Service
Page 37

omreport about
Use the omreport about command to learn the product name and version
number of the systems management application installed on your system.
The following is an example output from the omreport about command:
Product name :Dell OpenManage Server Administrator
Version : 6.x.x
Copyright :Copyright (C) Dell Inc. 1995-2009. All
rights reserved.
Company : Dell Inc.
For details about the environment for Server Administrator, type:
omreport about details=true
Server Administrator includes a number of services, each of which has a
version number of its own. The Contains field reports version numbers for
the services as well as other useful details. The output below is an example,
and can change depending on your configuration and the version of Server
Administrator installed on your system:
Contains: Instrumentation Service 6.
Storage Management Service 2.x.
Sun JRE - OEM Installed Version 1.x.
Secure Port Server 3.x.
Core Service 1.x.
Instrumentation Service Integration Layer
x.x
1.
Storage Management Service Integration
Layer 1.
Server Administrator 6.x.
x.x
x
x.x
x
x
x
x
omreport: Viewing System Status Using the Instrumentation Service 37
Page 38

omreport chassis/omreport mainsystem Commands
Use the omreport chassis or omreport mainsystem commands to view details
for the entire chassis or for a particular component.
omreport chassis/ omreport mainsystem
Type:
omreport chassis
or
omreport mainsystem
Server Administrator displays a general status for your main system
chassis/main system components.
SEVERITY : COMPONENT
Ok : Fans
Critical : Intrusion
Ok : Memory
Ok : Power Supplies
Ok : Temperatures
Ok : Voltages
omreport chassis acswitch/omreport mainsystem acswitch
Use the omreport chassis acswitch or omreport mainsystem acswitch
command if your system has redundant AC power lines that are configured in
a failover arrangement. Type:
omreport chassis acswitch
or
omreport mainsystem acswitch
38 omreport: Viewing System Status Using the Instrumentation Service
Page 39

Server Administrator displays the following output:
AC Failover Switch
AC Switch Redundancy
Redundancy Status : Full
Number of devices
required for full
redundancy
Redundancy Mode :
Redundancy
Configuration
AC Power Lines
Status : Ok
Location : AC Power Line 1
AC Present : Power Present
Active Source : Active
Status : Ok
Location : AC Power Line 2
AC Present : Power Present
Active Source : Not Active
Server Administrator reports values for the Redundancy Status and
Redundancy Mode fields.
:2
: Input Source Line 1, upon
redundancy restoration,
return to Line 1
omreport chassis batteries/omreport mainsystem batteries
Use the omreport chassis batteries or omreport mainsystem batteries
command to view battery properties. Type:
omreport chassis batteries
or
omreport mainsystem batteries
Server Administrator displays the summary of the battery information for
your system.
omreport: Viewing System Status Using the Instrumentation Service 39
Page 40

omreport chassis bios/omreport mainsystem bios
Use the omreport chassis bios/omreport mainsystem bios command to view
the current BIOS information. Type:
omreport chassis bios
or
omreport mainsystem bios
Server Administrator displays the summary of the BIOS information for
your system.
omreport chassis biossetup/omreport mainsystem biossetup
Use the omreport chassis biossetup or omreport mainsystem biossetup
command to view BIOS setup parameters that are normally available only
during system boot.
Type:
omreport chassis biossetup
or
omreport mainsystem biossetup
Table 3-3 displays the available BIOS setup parameters:
NOTE: All the BIOS Setup parameters are not displayed. Only those BIOS setup
properties configured during system boot are displayed.
Table 3-3. BIOS Setup Parameters
Parameters Description
Attribute
Bootsequence Displays the device used to boot the system.
Numlock Displays whether the keypad can be used as number keys.
Embedded Video
Controller
Boot Mode Displays whether the boot mode is configured to BIOS or
CPU Execute Disable Displays whether the Execute Disable (XD) option is
C States Displays whether the C States option is enabled or disabled.
Displays whether the Embedded Video Controller option is
enabled or disabled.
Unified Extensible Firmware Interface (UEFI).
enabled or disabled.
40 omreport: Viewing System Status Using the Instrumentation Service
Page 41

Table 3-3. BIOS Setup Parameters (continued)
Parameters Description
Processor CMP Displays the number of cores enabled per processor.
User accessible USB
Ports
CPU Virtualization
Technology
AC Power Recovery
Mode
Embedded SATA
Controller
Displays whether the user-accessible USB port is enabled or
disabled.
Displays the additional hardware capabilities provided by
Virtualization Technology.
Displays the system state when input power is restored after
an outage.
Displays whether the embedded SATA controller is set to
ATA mode, RAID mode, or is disabled.
SATA port 0 Displays the state of SATA port 0.
SATA Port 1 Displays the state of SATA port 1.
Dual NIC (1/2) Displays whether NIC 1 and NIC 2 with PXE/iSCSI is
enabled or disabled.
Dual NIC (3/4) Displays whether NIC 3and NIC 4 with PXE/iSCSI is
enabled or disabled.
NIC 1 Displays whether the first NIC is enabled (with or without
PXE/iSCSI) or disabled during system boot.
NIC 2 Displays whether the second NIC is enabled (with or
without PXE/iSCSI) or disabled during system boot.
NIC 3 Displays whether the third NIC is enabled (with or without
PXE/iSCSI) or disabled during system boot.
NIC 4 Displays whether the fourth NIC is enabled (with or
without PXE/iSCSI) or disabled during system boot.
Trusted Platform
Module (TPM)
Security
Displays whether Trusted Platform Module is off, on with
pre-boot measurements, or on without pre-boot
measurements.
Internal USB Displays whether internal USB is enabled or disabled.
Operating System
Watchdog Timer
Displays whether the operating system watchdog timer is
enabled or disabled.
Internal SD Card Displays whether the internal SD card is enabled or
disabled.
omreport: Viewing System Status Using the Instrumentation Service 41
Page 42

Table 3-3. BIOS Setup Parameters (continued)
Parameters Description
Bezel Displays whether the bezel removal intrusion check during
system reboot is enabled or disabled.
Console Redirection Displays if the BIOS screen is redirected over a particular
serial port or if it is turned off.
Diskette Displays whether the diskette is disabled, auto enabled, or
read-only.
Demand Based Power
Management (DBS)
Embedded Hypervisor Displays whether the embedded hypervisor is enabled or
IDE Displays whether the drive is enabled or disabled.
IDE Primary Drive 0 Displays whether the device is automatically detected and
IDE Primary Drive 1 Displays whether the device is automatically detected and
Intrusion Displays whether the intrusion check is enabled or disabled
Mouse Displays whether the mouse is enabled or disabled.
Optical Drive
Controller
Parallel port address Displays whether the address is located on LPT1, LPT2, and
Parallel port mode Displays the setting associated with the parallel port.
Primary SCSI Displays whether the device is on or off.
RAID on motherboard Displays whether RAID-on-motherboard is detected as a
RAID Channel A Displays whether RAID-on-motherboard Channel A is
RAID Channel B Displays whether RAID-on-motherboard Channel B is
Displays whether DBS is enabled or disabled on the system.
disabled.
enabled or if the device is disabled.
enabled or if the device is disabled.
during system boot.
Displays whether the optical drive controller is enabled or
disabled.
LPT3, or if it is disabled.
RAID device, a SCSI device, or if the device is disabled
during system boot.
detected as a RAID device or a SCSI device.
detected as a RAID device or a SCSI device.
42 omreport: Viewing System Status Using the Instrumentation Service
Page 43

Table 3-3. BIOS Setup Parameters (continued)
Parameters Description
SATA
Serial Port 1 Displays whether serial port 1 is mapped to a COM port, a
COM port 1, a COM port 3, a COM1 BMC, a BMC Serial,
a BMC NIC, a BMC RAC, or is disabled.
Serial Port 2 Displays whether serial port 2 is mapped to a COM port, a
COM port 2, a COM port 4, or is disabled.
Speaker Displays whether the speaker is on or off.
USB or USBB Displays whether the USB port is enabled or disabled.
Secondary SCSI Displays whether the device is enabled or disabled.
Serial Communications
Serial Communications Displays whether COM port 1 and COM port 2 are off or on
with or without console redirection.
Console Redirection
After Boot
External Serial
Connector
Console Redirection
Failsafe Baud Rate
Serial Address Select Displays port address for the serial devices.
Displays whether console redirection after system reboot is
enabled or disabled.
Displays whether the external serial connector is mapped to
Serial Device 1 or Serial Device 2 or a Remote Access
Device.
Displays the setting for console redirection failsafe baud
rate.
omreport chassis bmc/omreport mainsystem bmc
This command is phased-out in this release. It is replaced by the command
omreport chassis remoteaccess/omreport mainsystem remoteaccess.
omreport chassis currents/omreport mainsystem currents
This command is no longer available through Server Administrator.
omreport: Viewing System Status Using the Instrumentation Service 43
Page 44

omreport chassis fans/omreport mainsystem fans
Use the omreport chassis fans or omreport mainsystem fans command to
view the fan probe status and settings. Type:
omreport chassis fans index=
n
or
omreport mainsystem fans index=
n
The index parameter is optional. If you do not specify the index, Server
Administrator displays a summary of status, readings, and thresholds set for
any fan probes that might be present on your system. If you specify the index,
Server Administrator displays a summary for a specific fan probe.
omreport chassis fancontrol/omreport mainsystem fancontrol
Use the omreport chassis fancontrol or omreport mainsystem fancontrol
command to view the fan speed settings on your system. Fan speed can be set
to optimize speed for cooling or for quiet operation. Table 3-4 shows the
available settings.
Table 3-4. Fan Control Settings
name=value pair Description
speed=quiet Set fan speed for quiet operation.
speed=maxcool Set fan speed for maximum cooling.
omreport chassis firmware/omreport mainsystem firmware
Use the omreport chassis firmware or omreport mainsystem firmware
command to view current firmware properties. Type:
omreport chassis firmware
or
omreport mainsystem firmware
Server Administrator displays a summary of your system’s firmware
properties.
44 omreport: Viewing System Status Using the Instrumentation Service
Page 45

omreport chassis frontpanel/omreport mainsystem frontpanel
Use the omreport chassis frontpanel or omreport mainsystem frontpanel
command to view if the front panel button control settings, such as the Power
button and/or Nonmasking Interrupt (NMI) button (if present on the
system), are enabled or disabled.
If the Power button override is present on your system, you can see whether
the Power button override is enabled or not. If enabled, the Power button turns
the power to the system On and Off.
If the NMI button is present on your system, you can see whether the NMI
button is enabled or not. The NMI button can be used to troubleshoot
software and device errors when using certain operating systems.
omreport chassis fru/omreport mainsystem fru
Use the omreport chassis fru or omreport mainsystem fru command to view
FRU information. When you type:
omreport chassis fru
or
omreport mainsystem fru
Server Administrator displays a summary of your system’s FRU information.
This information is available in the Server Administrator GUI, SNMP, and
Common Information Model and is primarily used to support
troubleshooting activities.
omreport chassis hwperformance/omreport mainsystem hwperformance
Use the omreport chassis hwperformance or omreport mainsystem
hwperformance command to view the status and cause for the system’s
performance degradation. When you type:
omreport chassis hwperformance
or
omreport mainsystem hwperformance
Server Administrator displays a summary of your system’s hardware
performance degradation information.
NOTE: This command is applicable only to selected Dell™ xx0x systems that
support PMBus.
omreport: Viewing System Status Using the Instrumentation Service 45
Page 46

Depending on your configuration, output may resemble the following
example:
Hardware Performance
Index
Probe Name
Status
Cause
: 0
: System Board Power Optimized
: Normal
: [N/A]
omreport chassis info/omreport mainsystem info
Use the omreport chassis info or omreport mainsystem info command to see
a summary of installed component versions:
omreport chassis info index=
or
omreport mainsystem info
The index parameter specifies a chassis number and is optional. If you do
not specify the index, Server Administrator displays summary chassis
information for each chassis. If you specify the index, Server Administrator
displays summary information for a specific chassis.
Depending on your configuration, output may resemble the following
example:
Index : 0
Chassis Name : Main System
n
index=n
Chassis
Host Name : everglades
Baseboard Management Controller
Version
Primary Backplane Version : 1.01
Sensor Data Record Version : SDR Version 0.33
Chassis Model : PowerEdge 1750
System Revision Name : II
46 omreport: Viewing System Status Using the Instrumentation Service
: 1.80
Page 47

Chassis Lock : Present
Chassis Service Tag : 8RLNB1S
Chassis Asset Tag :
Flash chassis indentify LED state : Off
Flash chassis indentify LED
timeout value
: 300
omreport chassis intrusion
Use the omreport chassis intrusion command to find out whether the cover
of your system is open or not. Server Administrator tracks chassis intrusion
events because intrusions may indicate an attempt to steal a system
component, or to perform unauthorized maintenance on the system. Type:
omreport chassis intrusion
A message that resembles the following displays:
Status
Probe Name
State
: Ok
: Main chassis intrusion
: Chassis is closed
omreport chassis leds/omreport mainsystem leds
Use the omreport chassis leds or omreport mainsystem leds command to find
out whether clear hard drive fault is supported and what severity level lights
up the LED. Type:
omreport chassis leds index=
or
omreport mainsystem leds index=
n
n
The index parameter is optional. If you do not specify the index, Server
Administrator displays a summary of LED information for chassis 0. If you
specify the index, Server Administrator displays a summary for a specific
chassis.
omreport: Viewing System Status Using the Instrumentation Service 47
Page 48

The following is an example output:
Flash chassis indentify LED state
Flash chassis indentify LED timeout
value
: Off
: 300
omreport chassis memory/omreport mainsystem memory
Use omreport chassis memory or omreport mainsystem memory to view
details for each memory module slot in your system. If your system supports
redundant memory, this command also displays the status, state, and type of
memory redundancy implemented on your system. Type:
omreport chassis memory index=
or
omreport mainsystem index=
The index parameter is optional. If you do not specify the index, Server
Administrator displays information for all memory modules on your system.
If you specify the index, Server Administrator displays a summary for a
specific memory module.
Output for an occupied memory slot may resemble the following:
Index
Status
Connector Name
Type
Size
: 1
: OK
: DIMM_B
: SDRAM-SYNCHRONOUS
: 256 MB
n
n
An unoccupied memory slot still has a connector name. Output for an
unoccupied memory slot may resemble the following:
Index
Status
Connector Name
Type
Size
48 omreport: Viewing System Status Using the Instrumentation Service
: 2
: Unknown
: DIMM_D
: Not Occupied
: Unknown
Page 49

If your system supports redundant memory, the redundancy output may
resemble the following:
Memory Redundancy
Redundancy Status
Fail Over State
Redundancy Configuration
Attributes
Memory Array 1
Attributes
Memory Array 1
Attributes
Memory Array 1
Attributes
Memory Array 1
Attributes
Memory Array 1
: Full
: Inactive
: SpareBank
: Location
: Proprietary Add-on Card
: Use
: Unknown
: Installed Capacity
: 1536 MB
: Maximum Capacity
: 12288 MB
: Slots Available
: 12
omreport chassis nics/omreport mainsystem nics
Use the omreport chassis nics or omreport mainsystem nics command to
view NIC properties. Type:
omreport chassis nics index=
or
omreport mainsystem nics index=
n
n
The index parameter is optional. If you do not specify the index, Server
Administrator displays properties about all NICS on your system. If you
specify the index, Server Administrator displays properties for a specific NIC.
Values display for the following fields: Index (number of the NIC card),
IP Address, Ve nd or, Description, and Connection Status.
omreport chassis ports/omreport mainsystem ports
Use the omreport chassis ports or omreport mainsystem ports command to
view properties of your system’s parallel and serial ports.
Values display for the following fields: Port Type, External Name,
Base I/O Address, IRQ Level, Connector Type, and Maximum Speed.
omreport: Viewing System Status Using the Instrumentation Service 49
Page 50

Port Type is the detailed type of each system port, from the more general
serial, parallel, and USB ports to the names of ports by device type connected
to it, for example, pointing device or keyboard.
External Name is the name of the port, such as serial or parallel, USB, mouse,
keyboard, and so on.
Base I/O Address is the starting I/O address expressed in hexadecimal.
IRQ Level is a hardware interrupt on a system. The hardware interrupt signals
the system's CPU that an event has started or ended in a peripheral
component such as a modem or printer. When communicated over a
peripheral component interconnect card, the IRQ level is a standard way
to identify the type of device that is sending the interrupt request.
Connector Type refers to the type of plug or cable and plug that connects
two devices together, in this case, the type of connector that attaches an
external device to a system. There are many connector types, each designed to
connect a different device type to a system. Examples include DB-9 Male, AT,
Access Bus, PS/2, and so on.
Maximum Speed is the port speed. Port speed refers to the data transmission
rate of an input/output channel, measured in numbers of bits per second.
Serial ports usually have a maximum speed of 115 Kbps and USB version 1.x
ports have a maximum speed of 12 Kbps.
omreport chassis processors/omreport mainsystem processors
Use the omreport chassis processors or omreport mainsystem processors
command to view properties of your system’s processors.
Values display for the following fields: Connector Name, Manufacturer,
Processor Family, Processor Version, Current Speed, External Clock Speed,
and State.
Connector Name refers to the name or number of the device that occupies
the processor slot in the system.
Manufacturer is the business entity that sells the processor.
Processor Family refers to the type of processor made by a manufacturer such
as Intel
Processor Version refers to the model and stepping number of the processor.
Current Speed is the actual processor speed in MegaHertz at system boot
time.
®
Itanium® or Pentium® III or AMD™ Opteron™.
50 omreport: Viewing System Status Using the Instrumentation Service
Page 51

External Clock Speed is the speed of the processor's external clock in
MegaHertz.
State refers to whether the processor slot is enabled or disabled.
Core Count refers to the number of processors integrated into one chip.
Capabilities and Cache Properties of a Specific Processor
To view the cache properties of a processor on a given connector, type:
omreport chassis processors index=
n
or
omreport mainsystem processors index=
n
The index parameter is optional. If you do not specify the index, Server
Administrator displays properties for all processors. If you specify the index,
Server Administrator displays properties for a specific processor.
The following fields are defined for the capabilities present on a particular
microprocessor:
For Intel Processor
• 64-bit Support
• Hyperthreading (HT)
• Virtualization Technology (VT)
• Demand-Based Switching (DBS)
• Execute Disable (XD)
For AMD Processor
• 64-bit Support
• AMD-V
• AMD PowerNow!
™
™
• No Execute (NX)
omreport: Viewing System Status Using the Instrumentation Service 51
Page 52

The following fields are defined for a cache present on a particular
microprocessor. If the cache is internal to the processor, the fields do not
appear in the cache report:
• Speed
• Cache Device Supported Type
• Cache Device Current Type
• External Socket Name
NOTE: Due to the limitations of certain operating systems (for example, VMware®
ESXi), certain features may not be available with this release of OpenManage
Server Administrator.
Fields Reported for Each Cache on a Particular Processor
The following fields are displayed for each cache on a particular processor:
Status reports whether a specific cache on the processor is enabled or
disabled.
Level refers to a primary or secondary cache. Primary-level cache is a memory
bank built into the processor. Secondary-level cache is a staging area that
feeds the primary cache. A secondary-level cache may be built into the
processor or reside in a memory chipset outside the processor. The internal
processor cache is referred to as a Level 1 (or L1). L2 cache is the external
cache in a system with an Intel Pentium processor, and it is the second level of
cache that is accessed. The names L1 and L2 are not indicative of where the
cache is physically located (internal or external), but describe which cache is
accessed first (L1, therefore internal).
Speed refers to the rate at which the cache can forward data from the main
memory to the processor.
Max Size is the maximum amount of memory that the cache can hold in
kilobytes.
Installed Size is the actual size of the cache.
Ty p e indicates whether the cache is primary or secondary.
Location is the location of the cache on the processor or on a chipset outside
the processor.
52 omreport: Viewing System Status Using the Instrumentation Service
Page 53

A Write Policy describes how the cache deals with a write cycle. In a
write-back policy, the cache acts like a buffer. When the processor starts a
write cycle, the cache receives the data and stops the cycle. The cache then
writes the data back to the main memory when the system bus is available.
In a write-through policy, the processor writes through the cache to the main
memory. The write cycle does not complete until the data is stored into the
main memory.
Associativity refers to the way in which main memory content is stored on
the cache.
• A fully associative cache allows any line in main memory to be stored at
any location in the cache.
• A 4-way set-associative cache directly maps four specific lines of memory
to the same four lines of cache.
• A 3-way set-associative cache directly maps three specific lines of memory
to the same three lines of cache.
• A 2-way set-associative cache directly maps two specific lines of memory to
the same two lines of cache.
• A 1-way set-associative cache directly maps a specific line of memory in the
same line of cache.
For example, line 0 of any page in memory must be stored in line 0 of cache
memory.
Cache Device Supported Type is the type of static random access memory
(SRAM) that the device can support.
Cache Device Current Type is the type of the currently installed SRAM that
the cache is supporting.
External Socket Name Silk Screen Name is the name printed on the system
board next to the socket.
Error Correction Type identifies the type of error checking and correction
(ECC) that this memory can perform. Examples are correctable ECC or
uncorrectable ECC.
This report shows cache information for each cache present on the
microprocessor.
omreport: Viewing System Status Using the Instrumentation Service 53
Page 54

omreport chassis pwrmanagement/omreport mainsystem pwrmanagement
Use the omreport chassis pwrmanagement or omreport mainsystem
pwrmanagement command to view the power budget cap and power
management profiles of your system. Type:
omreport chassis pwrmanagement
or
omreport mainsystem pwrmanagement
For each power management profile in the system, values display for the
following fields:
Maximum Performance, Active Power Controller, OS Control, and Custom.
Custom attributes are:
CPU Power and Performance Management, Memory Power and
Performance Management, and Fan Power and Performance Management.
NOTE: The omreport chassis pwrmanagement or omreport mainsystem
pwrmanagement command is applicable only to select Dell xx1x systems that
support Power Management Bus (PMBus.)
Power Inventory
Power Consumption
System Idle Power
Attribute
Value
Attribute
Value
:
153 W
:
System Maximum Potential Power
:
597 W
:
Power Budget
Attribute
Values
Attribute
Values
:
Enable Power Cap
:
Enabled
:
Power Cap
:
400 W (56%)
54 omreport: Viewing System Status Using the Instrumentation Service
Page 55

omreport chassis pwrmonitoring/omreport mainsystem pwrmonitoring
Use the omreport chassis pwrmonitoring or omreport mainsystem
pwrmonitoring command to view the properties of your system’s power
consumption. Type:
omreport chassis pwrmonitoring
or
omreport mainsystem pwrmonitoring
For each power monitoring profile in the system, values display for the
following fields:
•
Power Consumption Status
•
Probe Name
•Reading
•
Warning Threshold
•
Failure Threshold
Amperage: Location
•
• Power Tracking Statistics
• Energy Consumption
•
Measurement Start Time
•
Measurement Finish Time
•
Reading
System Peak Power
•
• System Peak Amperage
and
Reading
NOTE: The omreport chassis pwrmonitoring or omreport mainsystem
pwrmonitoring command is applicable only to select Dell xx0x and xx1x systems
that support PMBus.
Table 3-5. omreport chassis pwrmonitoring/omreport mainsystem pwrmonitoring
name=value pair Description
config=stats Reports power statistics in Watts.
omreport: Viewing System Status Using the Instrumentation Service 55
Page 56

Power Consumption Information
Power Consumption
Index
Status
Probe Name
Reading
Warning Threshold
Failure Threshold
Power Headroom
Name
Reading
Name
Reading
Amperage
Location
Reading
Location
: 2
: Ok
: System Board
: System Level
: 539 W
: 994 W
: 1400 W
: System Instantaneous
Headroom
: 300 W
: System Peak Headroom
: 340 W
: PS 1 Current 1
: 1.2 A
: PS 2 Current 2
Reading
: 1.0 A
56 omreport: Viewing System Status Using the Instrumentation Service
Page 57

Power Tracking Statistics
Statistics
Measurement Start Time
Measurement Finish
Time
Reading
Statistics
Measurement Start Time
Peak Time
Peak Reading
Statistics
Measured Since
Read Time
Peak Reading
: Energy consumption
: Thu Jun 28 11:03:20 2007
: FRI Jun 28 11:05:46 2007
: 5.9 KWH
: System Peak Power
: Mon Jun 18 16:03:20 2007
: Wed Jun 27 00:23:46 2007
: 630 W
: System Peak Amperage
: Mon Jun 18 16:03:20 2007
: Tue Jun 19 04:06:32 2007
: 2.5 A
omreport chassis pwrsupplies/omreport mainsystem pwrsupplies
Use the omreport chassis pwrsupplies or omreport mainsystem pwrsupplies
command to view properties of your system’s power supplies. Type:
omreport chassis pwrsupplies
or
omreport mainsystem pwrsupplies
For each power supply profile in the system, values display for the following
fields:
• Status
•Location
• Type
• Rated Input Wattage
omreport: Viewing System Status Using the Instrumentation Service 57
Page 58

• Maximum Output Wattage
• Online Status
• Power Monitoring Capable
omreport chassis remoteaccess/omreport mainsystem remoteaccess
Use the omreport chassis remoteaccess or omreport mainsystem
remoteaccess command to view general information on baseboard
management controller or integrated Dell remote access controller
(BMC/iDRAC) and
Type:
omreport chassis remoteaccess
or
omreport mainsystem remoteaccess
NOTE: This command is applicable to PowerEdge x8xx, x9xx, xx0x, and xx1x
systems only.
The output of the omreport chassis remoteaccess/omreport mainsystem
remoteaccess command lists each of the valid parameters. Table 3-6 shows
the available settings.
Table 3-6. omreport chassis remoteaccess/omreport mainsystem remoteaccess
name=value pair Description
config=additional Reports the current state of IPv4 and IPv6 addresses on
config=advsol Reports advanced BMC/iDRAC6 or remote access information
config=nic Reports BMC/iDRAC6 or remote access information for the
config=serial Reports serial port information for BMC or remote access.
config=serialoverlan Reports BMC/iDRAC6 or remote access information on a serial
config=
terminalmode
config=user Reports information on BMC/iDRAC6 or remote access users.
remote access controller if DRAC is installed.
iDRAC6.
on a serial over local area network (LAN) connection.
LAN.
over LAN connection.
Reports terminal mode settings for the serial port.
58 omreport: Viewing System Status Using the Instrumentation Service
Page 59

omreport chassis slots/omreport mainsystem slots
Use the omreport chassis slots or omreport mainsystem slots command to
view properties of your system’s slots.
Ty p e :
omreport chassis slots index=
or
omreport mainsystem slots index=
The index parameter is optional. If you do not specify the index, Server
Administrator displays properties for all of the slots in your system. If you
specify the index, Server Administrator displays properties for a specific slot.
For each slot in the system, values display for the following fields: Index,
Slot ID, Adapter, and Data Bus Width.
Index is the number of the slot in the system.
Slot ID is the silk screen name printed on your system's motherboard next to
the slot. Alphanumeric text uniquely identifies each slot in the system.
Adapter refers to the name and/or type of the card that fits into the slot, for
example, a storage array controller, SCSI adapter, iDRAC6 Enterprise, or
HBA.
Data Bus Width is the width, in bits, of the information pathway between
the components of a system. The range of the data bus width can be from
16 to 64 bits.
n
n
omreport chassis temps/omreport mainsystem temps
Use the omreport chassis temps or omreport mainsystem temps command to
view properties of your system’s temperature probes. Type:
omreport chassis temps index=
or
omreport mainsystem temps index=
The index parameter is optional. If you do not specify the index, Server
Administrator displays a summary of status, readings, and thresholds set for
any temperature probes that might be present on your system. If you specify
the index, Server Administrator displays a summary for a specific
temperature probe.
omreport: Viewing System Status Using the Instrumentation Service 59
n
n
Page 60

omreport chassis volts/omreport mainsystem volts
Use the omreport chassis volts or omreport mainsystem volts command to
view properties of your system’s voltage probes. Type:
omreport chassis volts index=
or
omreport mainsystem volts index=
The index parameter is optional. If you do not specify the index, Server
Administrator displays a summary of status, readings, and thresholds set for
any voltage probes that might be present on your system. If you specify the
index, Server Administrator displays a summary for a specific voltage probe.
n
n
omreport system Commands/omreport servermodule Commands
Use the omreport system or omreport servermodule commands to view logs,
threshold values, cost of ownership information, and information about how
shutdown actions and recovery actions are configured.
omreport system/omreport servermodule
Use the omreport system or omreport servermodule command to see a
general status of the components of your system. When you specify a level 3
command, such as omreport system shutdown/omreport servermodule
shutdown, you can get detailed information for one system component rather
than the high-level status obtained with omreport system or omreport
servermodule.
Type:
omreport system
or
omreport servermodule
If your system has both a main system chassis/main system and at least one
direct attached storage device, Server Administrator may display a summary
that resembles the following example.
60 omreport: Viewing System Status Using the Instrumentation Service
Page 61

SEVERITY : COMPONENT
Ok : Main System Chassis
Critical : Storage
Commands for Viewing Logs
You can use the omreport system or omreport servermodule command to
view logs: the alert log, the command log, and the hardware or ESM log.
NOTE: If the Alert log or Command log displays invalid XML data (such as when
XML data generated for the selection is not well-formed), to clear the log and
resolve the issue."
"
omconfig system cmdlog action=clear" resolves the issue.
If you need to retain the log information for future reference, save a copy of the log
before clearing. See "Commands for Clearing Logs" for more information about
clearing logs.
To view the contents of the alert log, type:
omreport system alertlog
or
omreport servermodule alertlog
To view the contents of the command log, type:
omreport system cmdlog
or
omreport servermodule cmdlog
omconfig system alertlog action=clear" or
To view the contents of the ESM log, type:
omreport system esmlog
or
omreport servermodule esmlog
omreport: Viewing System Status Using the Instrumentation Service 61
Page 62

Overall Health Status of the ESM Log
When you type omreport system esmlog or omreport servermodule esmlog,
the ESM log displays. The first line of the report reflects the overall health of
the system hardware. For example, Health: OK means that less than
80 percent of the space allotted for the ESM log is occupied by messages.
If 80 percent or more of the allotted space for the ESM log is occupied, the
following caution appears:
Health: Non-Critical
If a caution appears, resolve all warning and critical severity conditions,
and then clear the log.
omreport system alertaction/omreport servermodule alertaction
Use the omreport system alertaction or omreport servermodule alertaction
command to view a summary of alert actions that have been configured for
warning and failure events on your system components. Alert actions
determine how Server Administrator responds when a component has a
warning or failure event.
The omreport system alertaction or omreport servermodule alertaction
command is useful for viewing which alert actions have been specified for
components. To set an alert action for a component, use the omconfig system
alertaction or omconfig servermodule alertaction command. For more
information, see "omconfig: Managing Components Using the
Instrumentation Service."
NOTE: Due to the limitations of certain operating systems (for example, VMware®
ESXi), certain features may not be available with this release of OpenManage
Server Administrator.
Components and Events for Which You Can View Alert Actions
You can view alert action properties for the following components and events,
if the components/events are present on the system:
• Battery Warning
• Battery Failure
• Chassis Intrusion
• Current Probe Warning
• Current Probe Failure
62 omreport: Viewing System Status Using the Instrumentation Service
Page 63

• Fan Warning
• Fan Failure
• Memory Pre-failure
• Memory Failure
• System Power Probe Warning
• System Power Probe Detects a Failure
• System Peak Power
• Power Supply Warning
• Power Supply Failure
• Degraded Redundancy
• Lost Redundancy
• Temperature Warning
• Temperature Failure
• Voltage Warning
• Voltage Failure
• Processor Warning
• Processor Failure
• Hardware Log Warning
• Hardware Log Full
• Watchdog Asr
• Storage System Warning
• Storage System Failure
• Storage Controller Warning
• Storage Controller Failure
• Physical Disk Warning
• Physical Disk Failure
• Virtual Disk Warning
• Virtual Disk Failure
• Enclosure Warning
• Enclosure Failure
omreport: Viewing System Status Using the Instrumentation Service 63
Page 64

• Storage Controller Battery Warning
• Storage Controller Battery Failure
NOTE: Storage Controller Battery Warning and
events are not available on modular systems.
Failure
NOTE: System Power Probe Warning is not applicable to modular systems.
Storage Controller Battery
omreport system assetinfo/omreport servermodule assetinfo
Use the omreport system assetinfo or omreport servermodule assetinfo
command to see cost of ownership data for the system, such as acquisition,
depreciation, and warranty information. To set any of these fields, use the
omconfig system assetinfo or omconfig servermodule assetinfo command.
For more information, see "omconfig system or servermodule assetinfo:
Editing Cost of Ownership Values."
omreport system events/omreport servermodule events
Use the omreport system events or omreport servermodule events command
to view the current enabled or disabled SNMP traps. This command displays
a summary of each component in your system for which events can be
generated. For each component, the report shows which severities are set to
be reported and which severities are set not to be reported. The following is
an example output for a few components:
omreport system events
or
omreport servermodule events
Current SNMP Trap Configuration
----------System
----------Settings
Enable: Informational, Warning and Critical
Disable: None
64 omreport: Viewing System Status Using the Instrumentation Service
Page 65

--------------Power Supplies
---------------Settings
Enable: Informational, Warning and Critical
Disable: None
----------Fans
----------Settings
Enable: Critical
Disable: Informational and Warning
The full report lists the settings for all components in your system for which
events can be generated.
To view the status for components of a specific type, use the omreport system
events type=<component name> or omreport servermodule event type=
<component name> command. This command displays a summary of each
component in your system for which events can be generated. Table 3-7
shows the events displayed for various component types.
NOTE: Due to the limitations of certain operating systems (for example, VMware®
ESXi), certain features may not be available with this release of OpenManage
Server Administrator.
Table 3-7. System Events by Component Type
name=value pair Description
type=accords Reports events for AC power cords.
type=battery Reports events for batteries
type=fanenclosures
type=fans Reports events for fans.
type=intrusion Reports events for chassis intrusion.
type=log Reports events for logs.
type=memory Reports events for memory.
type=powersupplies Reports events for power supplies.
type=redundancy Reports events for redundancy.
omreport: Viewing System Status Using the Instrumentation Service 65
Reports events for fan enclosures.
Page 66

Table 3-7. System Events by Component Type (continued)
name=value pair Description
type=systempower Reports events for system power.
type=temps Reports events for temperatures.
type=volts Reports events for voltages.
Example Command for an Event Type
Type:
omreport system events type=fans
or
omreport servermodule events type=fans
The following is an example output:
----------Fans
----------Settings
Enable: Critical
Disable: Informational and Warning
omreport system operatingsystem/omreport servermodule operatingsystem
Use the omreport system operatingsystem or omreport servermodule
operatingsystem command to display information about your operating
system.
omreport system pedestinations/omreport servermodule pedestinations
Use the omreport system pedestinations or omreport servermodule
pedestinations command to view destinations where alerts for platform
events are configured to be sent. Depending on the number of destinations
displayed, you can configure a separate IP address for each destination
address.
66 omreport: Viewing System Status Using the Instrumentation Service
Page 67

Ty p e :
omreport system pedestinations
or
omreport servermodule pedestinations
The output of the omreport system pedestinations or omreport
servermodule pedestinations command lists each of the valid parameters.
NOTE: The actual number of destinations that can be configured on your system
may differ.
Table 3-8 shows the available settings.
Table 3-8. Settings for the omreport system pedestinations/omreport servermodule
pedestinations
Output Attributes Description
Destination
List
Destination Number:
Destination1
Destination IP Address:
101.102.103.104
Destination Number:
Destination 2
Destination IP Address:
110.120.130.140
Destination Number:
Destination 3
Destination IP Address:
201.202.203.204
Destination Number:
Destination 4
Destination IP Address:
210.211.212.213
destination 1: Displays the first
destination.
101.102.103.104: IP address of the first
destination.
destination 2: Displays the second
destination.
110.120.130.140: IP address of the
second destination.
destination 3: Displays the third
destination.
201:202:203:204: IP address of the third
destination.
destination 4: Displays the fourth
destination.
210.211.212.213: IP address of the
fourth destination.
omreport: Viewing System Status Using the Instrumentation Service 67
Page 68

Table 3-8. Settings for the omreport system pedestinations/omreport servermodule
pedestinations (continued)
Output Attributes Description
Destination
Configuration
Settings
attribute=
communitystring
communitystring: Displays the text
string that acts as a password and is
used to authenticate SNMP messages
sent between the BMC and the
destination management station.
omreport system platformevents/omreport servermodule platformevents
Use the omreport system platformevents or omreport servermodule
platformevents command to view how the system responds for each listed
platform event.
omreport system recovery/omreport servermodule recovery
Use the omreport system recovery or omreport servermodule recovery
command to see whether there is an action configured for a hung operating
system. You can also view the number of seconds that must elapse before an
operating system is considered hung.
omreport system shutdown/omreport servermodule shutdown
Use the omreport system shutdown or omreport servermodule shutdown
command to view any pending shutdown actions for your system.
If properties for shutdown are configured, executing this command displays
these properties.
NOTE: Due to the limitations of certain operating systems (for example, VMware®
ESXi), certain features may not be available with this release of OpenManage
Server Administrator.
omreport system summary/omreport servermodule summary
Use the omreport system summary or omreport servermodule summary
command to view a comprehensive summary of software and hardware
components currently installed on your system.
68 omreport: Viewing System Status Using the Instrumentation Service
Page 69

Example Command Output
Ty p e :
omreport system summary
or
omreport servermodule summary
The output that appears in your CLI window depends on the systems
management software, operating system, and hardware components and
options installed on your system. The following partial command results are
unique and may not resemble the results for your system’s hardware and
software configuration:
System Summary
--------------
---Software
Profile
--------------
---System
Management
Name : Dell OpenManage Server
Administrator
Version : 6.
Description : Systems Management Software
Contains : Instrumentation Service 6.
omreport: Viewing System Status Using the Instrumentation Service 69
x.x
: Storage Management Service 3.x.
: Sun JRE - OEM Installed Version
3.
x.x
: Secure Port Server 1.x.
: Dell OpenManage Core Service 1.x.
: Instrumentation Service Integration
Layer 1.
: Storage Management Service
Integration Layer 1.
x.x
x
x.x
x.x
x
x
Page 70

Operating
System
Name : Microsoft Windows 2003 Server
Version : Service Pack 2(Build 2
System Time : Fri Sep 20 18:02:52 2
System Bootup
Time
Server Module
-------------Information
Host Name : svctag-d
System
Location
Model : PowerEdge 1955
Asset Tag : Test
Service Tag : D
Slot Number : Slot 01-02
Form Factor : Half Height Dual Width
Processor 1
Processor
Brand
Processor
Version
: Wed Sep 18 18:37:58 2
xxxx
s
: Please set the value
XXXX
S
: Intel(R) Xeon(R) CPU
: Model 15 Stepping 6
XXX
XXX
XXX
)
Voltage : 1400 mV
Processor 2
Processor
Brand
Processor
Version
Voltage : 1400 mV
70 omreport: Viewing System Status Using the Instrumentation Service
: Intel(R) Xeon(R) CPU
: Model 15 Stepping 6
Page 71

Memory
Total
: 2048 MB
Installed
Capacity
Memory
: 2048 MB
Available to
the OS
Total Maximum
: 32768 MB
Capacity
Memory Array
: 1
Count
The system summary hardware information includes data values for installed
components of the following types present in your system:
System Attributes
• Host name
• System location
Main System Chassis/Main System
Chassis
• Chassis Model
• Chassis Service Tag
• Chassis Lock
• Chassis Asset Tag
Processor
The following are listed for each processor in the system:
• Processor Manufacturer
• Processor Family
• Processor Version
• Current Speed
omreport: Viewing System Status Using the Instrumentation Service 71
Page 72

• Maximum Speed
• External Clock Speed
•Voltage
Memory
• Total Installed Capacity
• Memory Available to the Operating System
• Total Maximum Capacity
• Memory Array Count
Memory Array
The following details are listed for each memory board or module in the
system (for example, the system board or the memory module in a given
slot number):
• Location
•Use
• Installed Capacity
• Maximum Capacity
• Slots Available
•Slots Used
• Ecc Type
BIOS
• Manufacturer
• BIOS Version
• Release Date
• BIOS Firmware Information
•Name
• BIOS Firmware Version
72 omreport: Viewing System Status Using the Instrumentation Service
Page 73

Firmware
•Name
•Version
Network Interface Card
The following details are listed for each NIC in the system:
• IP Address
• Subnet Mask
• Default Gateway
• MAC Address
Storage Enclosures
The following details are listed for each storage enclosure attached to the
system:
•Name
• Product ID
omreport system thrmshutdown/omreport servermodule thrmshutdown
Use the omreport system thrmshutdown or omreport servermodule
thrmshutdown command to view the properties configured for a thermal
shutdown action.
The three properties that display for thermal shutdown are disabled, warning,
or failure. If the CLI displays the following message, the thermal shutdown
feature has been disabled:
Thermal protect shutdown severity: disabled
If the system is configured to shutdown when a temperature probe detects
a warning or failure event, one of the following messages displays:
Thermal protect shutdown severity: warning
Thermal protect shutdown severity: failure
omreport: Viewing System Status Using the Instrumentation Service 73
Page 74

omreport system version/omreport servermodule version
Use the omreport system version or omreport servermodule version
command to list the version numbers of the BIOS, firmware, systems
management software, and operating system installed on your system.
Example Command Output
Type:
omreport system version
or
omreport servermodule version
The output that appears in your CLI window depends on the version of the
BIOS, RAID controllers, and firmware installed on your system. The
following partial command results are unique and may not resemble the
results for your system’s configuration:
Version Report
--------------------Main System Chassis
---------------------
Name : BIOS
Version : 0.2.16
Name : BMC
Version : 0.26
Name : Primary Backplane
Version : 1.01
74 omreport: Viewing System Status Using the Instrumentation Service
Page 75

--------------Software
---------------
Name : Microsoft Windows Server 2003,
Enterprise Edition
Version : 5.2 <Build 3790: Service Pack 2><x86>
Name : Dell Server Administrator
Version : 6.1
omreport preferences Commands
Use the omreport preferences command to view the URL information of your
Server Administrator Web server.
Table 3-9 shows the available attributes.
Table 3-9. omreport preferences webserver
name=value pair Description
attribute=geturl Reports the URL information of your Web server.
omreport: Viewing System Status Using the Instrumentation Service 75
Page 76

76 omreport: Viewing System Status Using the Instrumentation Service
Page 77

omconfig: Managing Components Using the Instrumentation Service
The omconfig command allows you to provide values that define warning
events, configure alert actions, clear logs, and configure system shutdown,
as well as allowing you to perform other systems management tasks.
Examples of omconfig capabilities include the administrator's privilege to
clear command, alert, and hardware logs; the administrator's privilege to
configure and execute system shutdown; power user and administrator's
privilege to default or specify values for warning events on fans, voltage
probes, and temperature probes; power user and administrator's privilege to
set alert actions in the event of a warning or failure event from intrusion, fans,
voltage probes, and temperature probes.
For information on using the omconfig system command to view and manage
cost of ownership information (assetinfo), see "omconfig system or
servermodule assetinfo: Editing Cost of Ownership Values."
Often, you must use the omreport commands to get the information you need
to execute an omconfig command. For example, if you want to edit the
minimum temperature for a warning event on a temperature probe, you need
to know the index of the probe you want to configure. You can use the
omreport chassis temps or omreport mainsystem temp command to display a
list of probes and their indexes. For more information on using the omreport
command, see "omreport: Viewing System Status Using the Instrumentation
Service."
Table 4-1. System Availability for the omconfig Command
Command Level 1 Command Level 2 Applicable to
omconfig servermodule
mainsystem
system
chassis
Modular system
Modular system
Non-modular system
Non-modular system
omconfig: Managing Components Using the Instrumentation Service 77
Page 78

Conventions for Parameter Tables
When listing the parameters that a command can take, the parameters are
listed in alphabetical order instead of the order in which they appear in the
command line interface.
The symbol |, often called pipe, is the logical exclusive or operator. For
example, enable | disable means that you can enable or disable the
component or feature, but you cannot simultaneously enable and disable the
component or feature.
omconfig Command Summary
NOTE: Although this section lists all possible omconfig commands, the commands
available on your system depend on your system configuration. If you try to get help
or execute a command for a component not installed on your system, Server
Administrator issues a message that the component or feature is not found on
the system.
Table 4-2 is a high-level summary of the omconfig command. The columns
titled "Command level 2" and "Command level 3" list the major arguments
that can be used with omconfig. "User privilege required" refers to the type of
privilege you need to perform the command, where U=User, P=Power User, and
A=Administrator. "Use" is a very general statement about the actions that can
be performed using omconfig. More details about syntax and use of the
command appear later in this section.
Table 4-2. omconfig Command Level 1, Level 2, and Level 3
Command Level 1 Command Level 2 Command Level 3 User
Privilege
Required
omconfig
about U, P, A Shows version
Use
number and
properties for the
Server
Administrator
program.
78 omconfig: Managing Components Using the Instrumentation Service
Page 79

Table 4-2. omconfig Command Level 1, Level 2, and Level 3 (continued)
Command Level 1 Command Level 2 Command Level 3 User
Privilege
Required
details=true U, P, A Displays
preferences
cdvformat A Specifies the
dirservice A Configures the
snmp A Sets the SNMP root
useraccess A Determines
Use
information for all
of the Server
Administrator
programs that are
installed.
delimiter for
separating data
fields reported in
custom delimited
format (cdv).
Microsoft Active
Directory
®
service.
password.
Configures SNMP
Set Operations.
whether users
below the
administrator level
are allowed to use
Server
Administrator or
not.
omconfig: Managing Components Using the Instrumentation Service 79
Page 80

Table 4-2. omconfig Command Level 1, Level 2, and Level 3 (continued)
Command Level 1 Command Level 2 Command Level 3 User
Privilege
Required
webserver A Allows the
system/
servermodule
alertaction P, A Determines in
alertlog P, A Allows the
assetinfo P, A Enters and edits
Use
administrator to
set
the encryption
levels of the Web
server and
configure the
URL launch
point in the
Server
Administrator
Web server
environment
advance the actions
to be taken for
warning or failure
events on intrusion,
fans, temperatures,
voltages, power
supplies, memory,
and redundancy.
administrator to
clear the alert log.
cost of ownership
information for
your system,
including values for
depreciation, lease,
maintenance,
service,
and support.
.
80 omconfig: Managing Components Using the Instrumentation Service
Page 81

Table 4-2. omconfig Command Level 1, Level 2, and Level 3 (continued)
Command Level 1 Command Level 2 Command Level 3 User
Privilege
Required
cmdlog P, A Allows the
esmlog P, A Allows the
events P, A Enables and
pedestinations P, A Sets IP addresses
platformevents A Determines the
recovery P, A Determines in
shutdown A Allows the
Use
administrator to
clear the command
log.
administrator to
clear the ESM log.
disables SNMP
traps.
for alert
destinations.
shutdown action, if
any, to be taken for
a specific platform
event. Also, enables
and disables
platform events
filter
alert generation.
advance how your
system responds to
a hung operating
system.
administrator to
select from several
options when
shutting down the
system.
omconfig: Managing Components Using the Instrumentation Service 81
Page 82

Table 4-2. omconfig Command Level 1, Level 2, and Level 3 (continued)
Command Level 1 Command Level 2 Command Level 3 User
Privilege
Required
thrmshutdown A Sets the severity
webserver A Starts or stops the
chassis/
mainsystem
biossetup A Configures the
bmc A Configures remote
fans P, A Configures fan
Use
level at which a
thermal event
triggers a system
shutdown.
Web server.
behavior of specific
system components
controlled by the
BIOS.
access information.
NOTE: This
command is phasedout in this release. It
is replaced by the
remoteaccess
command.
probe warning
thresholds by
default or by value.
NOTE: You cannot
change threshold
values on embedded
server management
(ESM3) and Dell™
PowerEdge™ x8xx
systems.
82 omconfig: Managing Components Using the Instrumentation Service
Page 83

Table 4-2. omconfig Command Level 1, Level 2, and Level 3 (continued)
Command Level 1 Command Level 2 Command Level 3 User
Privilege
Required
fancontrol P, A Allows you to
frontpanel A Configures the
info P, A Allows you to set an
leds P, A Specifies when to
memorymode A Enables or disables
Use
optimize fan speed
for maximum
cooling or quiet
operation.
Power button and
Nonmasking
Interrupt (NMI)
button if present on
the system.
initial value, or to
edit the value for,
asset tag or chassis
name.
flash a chassis fault
LED or chassis
identification LED,
and allows you to
clear the LED for
the system's hard
drive.
the spare bank and
mirroring memory
modes, and also
specify which mode
to use.
omconfig: Managing Components Using the Instrumentation Service 83
Page 84

Table 4-2. omconfig Command Level 1, Level 2, and Level 3 (continued)
Command Level 1 Command Level 2 Command Level 3 User
Privilege
Required
pwrmanagement P, A Allows you to
pwrmonitoring P, A Configures power
remoteaccess A Configures remote
temps P, A Sets warning
volts P, A Sets warning
storage See "Using the
Use
choose between
maximum power
economy and
optimized
performance of the
system.
consumption
information and
thresholds.
access information.
threshold values by
default or value.
NOTE: You cannot
change threshold
values on ESM3 and
PowerEdge x8xx
systems.
threshold values by
default or value.
NOTE: You cannot
change threshold
values on ESM3 and
PowerEdge x8xx
systems.
Storage
Management
Service."
84 omconfig: Managing Components Using the Instrumentation Service
Page 85

Help With the omconfig Command
Use the omconfig -? command to get a list of the available commands for
omconfig.
Use omconfig <command level 2> -? to get help on the about, chassis,
preferences, and system’s level 2 commands. The following information on
omconfig system -? applies equally to getting help for the omconfig chassis
command.
Use the omconfig system -? command to get a list of the available commands
for omconfig system.
Use the omconfig preferences -? command to get a list of the available
commands for omconfig preferences, such as cdvformat, which is the custom
delimiter format (cdv). Type the following command to display the list of
delimiter values for the cdv:
omconfig preferences cdvformat -?
Use a command of the form omconfig system <command level 3> -? to get a
list of the parameters you must use to execute a particular omconfig system
command. For example, the following commands produce a list of valid
parameters for omconfig system alertaction and omconfig system shutdown:
omconfig system alertaction -?
omconfig system shutdown -?
In the case of the omconfig system alertaction command, you can use various
options to prevent all of the command line interface (CLI) help from
scrolling by before you can read it.
To scroll command output one screen at a time, type:
omconfig system alertaction -? | more
where | more allows you to press the spacebar to see the next screen of the
CLI help output.
To make a file that contains all the help for the omconfig system alertaction -?
command, type:
omconfig system alertaction -? -outa alert.txt
where -outa directs the output of the command to a file called alert.txt.
omconfig: Managing Components Using the Instrumentation Service 85
Page 86

To read the help for the alertaction command on a Microsoft® Windows®,
Red Hat
system, type:
®
Enterprise Linux®, or SUSE® Linux Enterprise Server operating
more alert.txt
omconfig about
Use the omconfig about command to learn the product name and version
number of the systems management application installed on your system.
The following is an example output of the omconfig about command:
Product
name
Version : 6.
Copyright : Copyright (C) Dell Inc. 1995-2009. All
Company : Dell Inc.
For more details about the environment for Server Administrator, type:
omconfig about details=true
Server Administrator includes a number of services, each of which has a
version number of its own. The Contains field reports version numbers for the
services and provides other useful details. The output that follows is an
example, and it can change depending on your configuration and the version
of Server Administrator that is available:
: Dell OpenManage Server Administrator
x.x
rights reserved.
Contains: Broadcom SNMP Agent 10.xx.xx
Common Storage Module 3.x.x
Data Engine 5.x.x
Hardware Application Programming Interface
5.x.x
Instrumentation Service 6.
Instrumentation Service Integration Layer
1.
x.x
Intel SNMP Agent 1.xx.x
OpenManage Inventory Collector 6.x.x
86 omconfig: Managing Components Using the Instrumentation Service
x.x
Page 87

OpenManage Tools 6.x.x
Remote Access Controller 4 Data Populator
4.x.x
Remote Access Controller 4 Managed Node
4.6.3
Secure Port Server 1.
Server Administrator Framework 6.x.
x.x
x
Agent for Remote Access 1.x.x
Storage Management 3.x.x
Sun Java Runtime Environment 1.x.xx
omconfig chassis/omconfig mainsystem
Use the omconfig chassis or omconfig mainsystem commands to default or
to set values for fan, voltage, and temperature probes, to configure BIOS
behavior during system start up, to clear memory error counts, and to enable
or disable power button control features where system configuration permits.
Use the omconfig chassis -? or omconfig mainsystem -? command to view a
list of all omconfig chassis/omconfig mainsystem commands.
omconfig chassis biossetup/omconfig mainsystem biossetup
Use the omconfig chassis biossetup or omconfig mainsystem biossetup
command to configure system BIOS settings that are normally available only
in your system's BIOS setup boot time settings.
CAUTION: Changing certain BIOS setup options might disable your system or
require you to reinstall the operating system.
NOTE: Reboot your system for the BIOS setup options take effect.
NOTE: Not all BIOS setup options are available on every system.
NOTE: Due to the limitations of certain operating systems (for example, VMware
ESXi), certain features may not be available with this release of OpenManage
Server Administrator.
omconfig: Managing Components Using the Instrumentation Service 87
®
Page 88

Table 4-3 shows the name=value pairs you can use with this command.
Table 4-3. BIOS Setup Settings
name=value pair 1
attribute=
attribute=
acpwrrecovery
attribute=bezel setting=enabled |
attribute=
bootsequence
attribute=
bootmode
name=value pair 2
setting=
setting=off | last| on off: System is turned off.
delay=random |
immediate | timedelay
time <value>
disabled
setting=diskettefirst |
hdonly | devicelist
|cdromfirst |
opticaldrive
setting=uefi | bios uefi: Enables the system to boot to
Description
last: System returns to previous state.
on: System is turned on.
random: System is turned on with
random delay.
immediate: System returns to previous
state immediately.
timedelay <value>: System is turned
on based on user specified time delay.
enabled: Enables the bezel removal
intrusion check during system boot.
disabled: Disables the bezel removal
intrusion check during system boot.
Instructs the BIOS which device is used
to boot the system, and the order in
which the boot routine is to check each
device.
operating systems that support Unified
Extensible Firmware Interface (UEFI).
bios: Enables the system to boot to
operating systems that do not support
UEFI.
88 omconfig: Managing Components Using the Instrumentation Service
Page 89

Table 4-3. BIOS Setup Settings (continued)
name=value pair 1
attribute=
attribute=cstates setting=enabled |
attribute=
conredirect
attribute=crab setting=enabled |
attribute=cpuht setting=enabled |
attribute=cpuvt setting=enabled |
name=value pair 2
setting=
disabled
setting=enabled |
disabled
disabled
disabled
disabled
Description
enabled: Enables the processor to go
into a deep sleep state when the system
is not utilized.
disabled: Disables the processor to go
into a deep sleep state when the system
is not utilized.
enabled: Redirects the BIOS screen over
Serial Port 1. Keyboard and text output
are redirected over Serial Port 2.
disabled: Turns off the BIOS console
redirection.
enabled: Enables BIOS console
redirection after system reboot.
disabled: Disables BIOS console
redirection.
NOTE: The command crab is valid for Dell
PowerEdge x9xx systems only.
enabled: Enables logical processor
hyperthreading.
disabled: Disables logical processor
hyperthreading.
enabled: Enables virtualization.
disabled: Disables virtualization.
omconfig: Managing Components Using the Instrumentation Service 89
Page 90

Table 4-3. BIOS Setup Settings (continued)
name=value pair 1
attribute=
attribute=
cpuxdsupport
attribute=cpucore setting=1 | 2 | 4 | all 1: Enables one core per processor.
name=value pair 2
setting=
setting=enabled |
disabled
Description
enabled: Enables Execute Disable (XD)
support on system.
disabled: Disables XD support on
system.
2: Enables two cores per processor.
4: Enables four cores per processor.
all: Enables the maximum cores per
processor.
NOTE: setting=all returns the
maximum core count.
attribute=dbs setting=enable |
disable
attribute=diskette setting=off | auto |
writeprotect
enable: Enables Demand Based
Switching (DBS) on the system.
disable: Disables DBS on the system.
off: Disables the diskette drive.
auto: Auto-enables the diskette drive.
writeprotect: Do not allow writes. Make
the diskette drive read-only.
90 omconfig: Managing Components Using the Instrumentation Service
Page 91

Table 4-3. BIOS Setup Settings (continued)
name=value pair 1
attribute=
attribute=dualnic setting=off | on |
attribute=
embhypvisor
name=value pair 2
setting=
pxeboth | nic1pxe
|nic2pxe | isciboth |
nic1isci | nic2isci |
nic1pxenic2isci |
nic1iscinic2pxe |
onpxeboth |
onpxenone |
onpxenic1 | onpxenic2
setting=enabled |
disabled
Description
off: Disables the Network Interface
(
Controllers
on: Enables the network interface (PXE
or iSCSI is not enabled on either of the
NICs).
pxeboth: Enables PXE on both NICs.
nic1pxe: Enables PXE on first NIC and
none (No PXE or iSCSI) on second NIC.
nic2pxe: Enables none (No PXE or
iSCSI) on first NIC and PXE on second
NIC.
isciboth: Enables iSCSI on both NICs.
nic1isci: Enables iSCSI on first NIC and
none (No PXE or iSCSI) on second NIC.
nic2isci: Enables none (No PXE or
iSCSI) on first NIC and iSCSI on
second NIC.
nic1pxenic2isci: Enables PXE on first
NIC and iSCSI on second NIC.
nic1iscinic2pxe: Enables iSCSI on first
NIC and PXE on second NIC.
NICs).
NOTE: The following options are
deprecated:
onpxeboth: Enables PXE on both NICs.
onpxenone: PXE is not enabled on
either of the NICs.
onpxenic1: Enables PXE on NIC 1.
onpxenic2: Enables PXE on NIC 2.
enabled: Enables embedded hypervisor.
disabled: Disables embedded hypervisor.
omconfig: Managing Components Using the Instrumentation Service 91
Page 92

Table 4-3. BIOS Setup Settings (continued)
name=value pair 1
attribute=
attribute=
embvideoctrl
attribute=
extserial
attribute=fbr setting=9600 | 19200
attribute=ide setting=on | off
attribute=
idepridrv
name=value pair 2
setting=
setting=enabled |
disabled
setting=com1 | com2
| rad
| 57600 | 115200
force=true
setting=off | auto off: Disables the device.
Description
enabled: Enables the embedded video
controller to be the primary video
device.
disabled: Disables the embedded video
controller to be the primary video
device.
com1: Maps external serial connector to
COM 1.
com2: Maps external serial connector to
COM 2.
rad: Maps external serial connector to
remote access device.
9600: Sets the console redirection failsafe
baud rate to 9600 bits per second.
19200: Sets the console redirection failsafe
baud rate to 19200 bits per second.
57600: Sets the console redirection
failsafe baud rate to 57600 bits per
second.
115200: Sets the console redirection
failsafe baud rate to 115200 bits per
second.
on: Enables this device.
off: Disables this device.
force=true: Verification of setting
change.
auto: Detects and enables the device
automatically.
92 omconfig: Managing Components Using the Instrumentation Service
Page 93

Table 4-3. BIOS Setup Settings (continued)
name=value pair 1
attribute=
attribute=
intrusion
attribute=intusb setting=enabled |
attribute=mouse setting=on | off on: Enables the mouse.
attribute=nic1 setting=enabled |
name=value pair 2
setting=
setting=enabled |
disabled
disabled
enabledwithpxe |
disabled | enabledonly
| enablednonepxe |
enabledwithiscsi
Description
enabled: Enables the intrusion check
during system boot. If the system also
has bezel intrusion checking, then the
intrusion option checks for removal of
the bezel of the system.
disabled: Disables the intrusion check
during system boot.
enabled: Enables the internal USB drive.
disabled: Disables the internal USB
drive.
off: Disables the mouse.
enabled: Enables the first NIC during
system boot.
enabledwithpxe: Enables the first NIC
during system boot (with PXE on if the
system has PXE)
disabled: Disables the first NIC during
system boot.
enabledonly: Enables the first NIC
during system boot (with PXE off if the
system has PXE).
enablednonepxe: Enables the first NIC
during system boot (with PXE off if the
system has PXE).
enabledwithiscsi: Enables the first NIC
during system boot (with iSCSI on if the
system has iSCSI).
omconfig: Managing Components Using the Instrumentation Service 93
Page 94

Table 4-3. BIOS Setup Settings (continued)
name=value pair 1
attribute=
attribute=nic2 setting=enabled |
attribute=nic3 setting=enabled |
name=value pair 2
setting=
enabledwithpxe |
disabled | enabledonly
| enablednonepxe |
enabledwithiscsi
enabledwithpxe |
disabled | enabledonly
| enablednonepxe |
enabledwithiscsi
Description
enabled: Enables the second NIC during
system boot.
enabledwithpxe: Enables the second
NIC during system boot (with PXE on if
the system has PXE)
disabled: Disables the second NIC
during system boot.
enabledonly: Enables the second NIC
during system boot (with PXE off if the
system has PXE).
enablednonepxe: Enables the second
NIC during system boot (with PXE off if
the system has PXE).
enabledwithiscsi: Enables the second
NIC during system boot (with iSCSI on
if the system has iSCSI).
enabled: Enables the third NIC during
system boot.
enabledwithpxe: Enables the third NIC
during system boot (with PXE on if the
system has PXE)
disabled: Disables the third NIC during
system boot.
enabledonly: Enables the third NIC
during system boot (with PXE off if the
system has PXE).
enablednonepxe: Enables the third NIC
during system boot (with PXE off if the
system has PXE).
enabledwithiscsi: Enables the third NIC
during system boot (with iSCSI on if the
system has iSCSI).
94 omconfig: Managing Components Using the Instrumentation Service
Page 95

Table 4-3. BIOS Setup Settings (continued)
name=value pair 1
attribute=
attribute=nic4 setting=enabled |
attribute=
numlock
attribute=node
interleaving
attribute=
ppaddress
name=value pair 2
setting=
enabledwithpxe |
disabled | enabledonly
| enablednonepxe |
enabledwithiscsi
setting=on | off on: Uses the keypad as number keys.
setting=enabled |
disabled
setting=off | lpt1 |
lpt2 | lpt3
Description
enabled: Enables the fourth NIC during
system boot.
enabledwithpxe: Enables the fourth
NIC during system boot (with PXE on if
the system has PXE)
disabled: Disables the fourth NIC
during system boot.
enabledonly: Enables the fourth NIC
during system boot (with PXE off if the
system has PXE).
enablednonepxe: Enables the fourth
NIC during system boot (with PXE off if
the system has PXE).
enabledwithiscsi: Enables the fourth
NIC during system boot (with iSCSI on
if the system has iSCSI).
off: Uses the keypad as arrow keys.
enabled: Enables Node Interleaving.
disabled: Disables Node Interleaving.
off: Disables the parallel port address.
lpt1: Locates the device on LPT1.
lpt2: Locates the device onLPT2.
lpt3: Locates the device on LPT3.
omconfig: Managing Components Using the Instrumentation Service 95
Page 96

Table 4-3. BIOS Setup Settings (continued)
name=value pair 1
attribute=
attribute=
ppmode
attribute=
primaryscsi
attribute=romb setting=raid | off |
attribute=romba setting=raid | scsi
name=value pair 2
setting=
setting=at | ps2 | ecp
| epp
setting=on | off
force=true
scsi
force=true
force=true
Description
at: Sets the parallel port mode to
type AT.
ps2: Sets the parallel port mode to
type PS/2.
ecp: Sets the parallel port mode to
type ECP (extended capabilities port).
epp: Sets the parallel port mode to
type EPP (enhanced parallel port).
CAUTION: If you modify the setting for
primary scsi, romb, romba, or rombb, your
system will become inoperable until you
reinstall the operating system.
on: Enables this device.
off: Disables this device.
force=true: Verification of
setting change.
raid: Instructs the BIOS to detect
RAID-on-motherboard as a RAID device.
off: Disables the device during
system boot.
scsi: Instructs the BIOS to detect this
device as a SCSI device.
force=true: Verification of setting
change.
raid: Instructs the BIOS to detect
RAID-on-motherboard channel A as a
RAID device.
scsi: Instructs the BIOS to detect this
device as a SCSI device.
force=true: Verification of
setting change.
96 omconfig: Managing Components Using the Instrumentation Service
Page 97

Table 4-3. BIOS Setup Settings (continued)
name=value pair 1
attribute=
attribute=rombb setting=raid | scsi
attribute=sata setting=off | ata | raid off: Disables the SATA controller.
attribute=sataport
(0...7) or (A...H)
attribute=
secondaryscsi
attribute=
serialportaddr
attribute=
serialcom
name=value pair 2
setting=
force=true
setting=off | auto off: Disables the SATA port.
setting=on | off on: Enables this device.
setting=default |
alternate
setting=off | on
|com1 |com2
Description
raid: Instructs the BIOS to detect
RAID-on-motherboard channel B as a
RAID device.
scsi: Instructs the BIOS to detect this
device as a SCSI device.
force=true: Verification of setting
change.
ata: Sets the onboard SATA controller to
ATA mode.
raid: Sets the onboard SATA controller
to RAID mode.
auto: Automatically enable the
SATA port.
off: Disables this device.
default: Maps to Serial device1=COM1,
Serial device2=COM2.
alternate: Maps to Serial device1=
COM2, Serial device2=COM1
off: Disables serial communication
setting.
on: Enables serial communication
setting without console redirection.
com1: Enables serial communication
setting with console redirection via
COM 1.
com2: Enables serial communication
setting with console redirection via
COM 2.
omconfig: Managing Components Using the Instrumentation Service 97
Page 98

Table 4-3. BIOS Setup Settings (continued)
name=value pair 1
attribute=
attribute=
serialport1
name=value pair 2
setting=
setting=off | auto |
com1 | com3 |
bmcserial | bmcnic |
rac | com1bmc
Description
off: Disables serial port 1.
auto: Maps serial port 1 to a COM port.
com1: Maps serial port 1 to COM port 1.
com3: Maps serial port 1 to COM port 3.
bmcserial: Maps serial port 1 to
BMC Serial.
bmcnic: Maps serial port 1 to the
Baseboard Management Controller
(BMC) NIC.
rac: Maps serial port 1 to the Remote
Access Controller (RAC).
com1bmc: Maps serial port 1 to COM
port 1 bmc.
NOTE: This command is applicable to
select x8xx systems.
attribute=
serialport2
attribute=speaker setting=on | off on: Enables the speaker.
attribute=
cputurbomode
setting=off | auto |
com2 | com4
setting=enabled |
disabled
off: Disables serial port 2.
auto: Maps serial port 2 to a COM port.
com2: Maps serial port 2 to COM port 2.
com4: Maps serial port 2 to COM port 4.
off: Disables the speaker.
CPU turbo mode can increase the CPU
frequency when your system is operating
below the thermal, power, or current
limits.
enabled: Enables CPU Turbo Mode.
disabled: Disables CPU Turbo Mode.
98 omconfig: Managing Components Using the Instrumentation Service
Page 99

Table 4-3. BIOS Setup Settings (continued)
name=value pair 1
attribute=
attribute=uausb setting=on | backonly
attribute=usb setting=enabled |
attribute=usbb setting=enabled |
name=value pair 2
setting=
| off
disabled
enabledwithbios|
disabled
Description
on: Enables the user-accessible
USB port(s)
backonly: Enables only the user
accessible USB port(s) located at the
back of the system.
off: Disables the user-accessible
USB port(s).
enabled: Enables the USB port(s).
disabled: Disables the USB port(s).
NOTE: Depending on your system’s
hardware, only one of the two attributes
usb and usbb is available for configuring
the USB port(s).
enabled: Enables the USB port(s) during
system boot, without BIOS support.
enabledwithbios: Enables the USB
port(s) during the system boot, with
BIOS support.
disabled: Disables the USB port(s)
during system boot.
NOTE: Depending on your system’s
hardware, only one of the two attributes
usb and usbb is available for configuring
the USB port(s).
omconfig: Managing Components Using the Instrumentation Service 99
Page 100

omconfig chassis bmc/omconfig mainsystem bmc
NOTE: This command is phased-out in this release. It is replaced by the omconfig
chassis remoteaccess/omconfig mainsystem remoteaccess command.
omconfig chassis currents/omconfig mainsystem currents
NOTE: This command is no longer available through Server Administrator.
omconfig chassis fans/omconfig mainsystem fans
Use the omconfig chassis fans or omconfig mainsystem fans command to
set fan probe warning thresholds. As with other components, you can view
both warning and failure threshold values, but you cannot set failure
thresholds. Your system's manufacturer sets the minimum and maximum
failure thresholds.
Valid Parameters for Fan Warning Thresholds
Table 4-4 shows the valid parameters for setting fan warning thresholds:
Table 4-4. omconfig chassis fans/omconfig chassis fans
name=value pair Description
index=<n> Number of the probe or probe index (must be specified).
warnthresh=default Sets minimum and maximum warning thresholds to default.
minwarnthresh=<n> Minimum warning threshold.
maxwarnthresh=<n> Maximum warning threshold.
Default Minimum and Maximum Warning Thresholds
NOTE: Systems that contain ESM3, ESM4, and BMC capabilities do not allow you to
set warning threshold values to default values.
If you want to set both the upper and lower fan warning threshold values to
the recommended default value, type:
omconfig chassis fans index=0 warnthresh=default
or
omconfig mainsystem fans index=0 warnthresh=
default
100 omconfig: Managing Components Using the Instrumentation Service
 Loading...