

Page 1

Dell™ OpenManage™
Server Administrator Version 6.1
Messages Reference Guide
Page 2

Notes and Cautions
NOTE: A NOTE indicates important information that helps you make better use of
your computer.
CAUTION: A CAUTION indicates potential damage to hardware or loss of data if
instructions are not followed.
____________________
Information in this document is subject to change without notice.
© 2009 Dell Inc. All rights reserved.
Reproduction of these materials in any manner whatsoever without the written permission of Dell Inc.
is strictly forbidden.
Trademarks used in this text: Dell, the DELL logo and Dell OpenManage are trademarks of Dell Inc.;
VMware is registered trademark or trademark of VMware, Inc. in the United States and/or other
jurisdictions; Microsoft, Windows, and W indows Server are either trademarks or registered trademarks
of Microsoft Corporation in the United States and/or other countries; Red Hat and Red Hat Enterprise
Linux are registered trademarks of Red Hat, Inc. in the United States and other countries; SUSE is a
registered trademark of Novell, Inc. in the United States and other countries.
Other trademarks and trade names may be used in this document to refer to either the entities claiming
the marks and names or their products. Dell Inc. disclaims any proprietary interest in trademarks and
trade names other than its own.
April 2009
Page 3

Contents
1 Introduction . . . . . . . . . . . . . . . . . . . . . . . . 7
What’s New in this Release . . . . . . . . . . . . . . . . 8
Messages Not Described in This Guide
Understanding Event Messages
Sample Event Message Text
Viewing Alerts and Event Messages
Logging Messages to a Unicode Text File
. . . . . . . . . 9
. . . . . . . . . . . . . 9
. . . . . . . . . . . . 11
. . . . . . . . . . 11
. . . . . 12
Viewing Events in Windows 2000
Advanced Server and
Windows Server 2003
. . . . . . . . . . . . . . . 12
Viewing Events in Red Hat Enterprise Linux
and SUSE Linux Enterprise Server
. . . . . . . . . 13
Viewing Events in VMware ESXi
version 3.5 update 4
Viewing the Event Information
Understanding the Event Description
. . . . . . . . . . . . . . . . 14
. . . . . . . . . . . 14
. . . . . . . 14
2 Event Message Reference . . . . . . . . . . . 19
Miscellaneous Messages . . . . . . . . . . . . . . . . 19
Temperature Sensor Messages
. . . . . . . . . . . . . 22
Cooling Device Messages
Voltage Sensor Messages
. . . . . . . . . . . . . . . 25
. . . . . . . . . . . . . . . 27
Contents 3
Page 4

Current Sensor Messages . . . . . . . . . . . . . . . . 30
Chassis Intrusion Messages
Redundancy Unit Messages
Power Supply Messages
Memory Device Messages
Fan Enclosure Messages
AC Power Cord Messages
. . . . . . . . . . . . . . 33
. . . . . . . . . . . . . . . 36
. . . . . . . . . . . . . . . . 38
. . . . . . . . . . . . . . . 42
. . . . . . . . . . . . . . . . 43
. . . . . . . . . . . . . . . . 45
Hardware Log Sensor Messages . . . . . . . . . . . . 46
Processor Sensor Messages
Pluggable Device Messages
Battery Sensor Messages
. . . . . . . . . . . . . . 48
. . . . . . . . . . . . . . 51
. . . . . . . . . . . . . . . . 53
Chassis Management Controller Messages
3 System Event Log Messages
for IPMI Systems
. . . . . . . . . . . . . . . . . . . 57
. . . . . . 55
4 Contents
Temperature Sensor Events . . . . . . . . . . . . . . . 57
Voltage Sensor Events
Fan Sensor Events
Processor Status Events
Power Supply Events
Memory ECC Events
BMC Watchdog Events
. . . . . . . . . . . . . . . . . . 58
. . . . . . . . . . . . . . . . . . . . 59
. . . . . . . . . . . . . . . . . 61
. . . . . . . . . . . . . . . . . . 62
. . . . . . . . . . . . . . . . . . . 64
. . . . . . . . . . . . . . . . . 64
Page 5

Memory Events . . . . . . . . . . . . . . . . . . . . . 65
Hardware Log Sensor Events
Drive Events
Intrusion Events
. . . . . . . . . . . . . . . . . . . . . . . 67
. . . . . . . . . . . . . . . . . . . . . 68
BIOS Generated System Events
R2 Generated System Events
Cable Interconnect Events
Battery Events . . . . . . . . . . . . . . . . . . . . . . 76
Power And Performance Events
Entity Presence Events
. . . . . . . . . . . . . . . . . 77
4 Storage Management
Message Reference
Alert Monitoring and Logging . . . . . . . . . . . . . . 79
Alert Message Format with Substitution
Variables
. . . . . . . . . . . . . . . . . . . . . . . . . 80
. . . . . . . . . . . . . . . . 79
. . . . . . . . . . . . . . 66
. . . . . . . . . . . . . 69
. . . . . . . . . . . . . . 75
. . . . . . . . . . . . . . . 76
. . . . . . . . . . . . 77
Alert Message Change History
Alert Descriptions and Corrective Actions
. . . . . . . . . . . . . 83
. . . . . . . 84
Index . . . . . . . . . . . . . . . . . . . . . . . . . . . . . . 231
Contents 5
Page 6

6 Contents
Page 7

Introduction
Dell™OpenManage™ Server Administrator produces event messages stored
primarily in the operating system or Server Administrator event logs and
sometimes in SNMP traps. This document describes the event messages
created by Server Administrator version 6.1 and displayed in the Server
Administrator Alert log.
Server Administrator creates events in response to sensor status changes and
other monitored parameters. The Server Administrator event monitor uses
these status change events to add descriptive messages to the operating
system event log or the Server Administrator Alert log.
Each event message that Server Administrator adds to the Alert log consists
of a unique identifier called the event ID for a specific event source category
and a descriptive message. The event message includes the severity, cause of
the event, and other relevant information, such as the event location and the
monitored item’s previous state.
Tables provided in this guide list all Server Administrator event IDs in numeric
order. Each entry includes the event ID’s corresponding description, severity level,
and cause. Message text in angle brackets (for example,
event-specific information provided by the Server Administrator.
<State>
) describes the
Introduction 7
Page 8

What’s New in this Release
The following changes have been made to this guide for this release:
• Added the following new alerts in the “Storage Management Message
Reference” section:
– 2370
– 2383
– 2384
– 2385
– 2386
• Updated the SNMP trap numbers for the following Storage Management
alerts:
– 2060
– 2075
– 2087
– 2125
– 2287
• Deleted alerts 2206 and 2207 in the “Storage Management Message
Reference” section.
• Added a new alert 2382 in the “Alert Descriptions and Corrective Actions”
section.
• Added two alerts 1013 and 1014 in the “Miscellaneous Messages” section.
• Added the POST Code Errors table in the “BIOS Generated System
Events” section.
• Support for the VMware® ESXi version 3.5 Update 4 hypervisor and 4.0.
• Support for the Server Administrator Web Server.
• Support for Solid State Drives (SSD).
• Supports Serial Attached SCSI (SAS) controllers.
8 Introduction
Page 9
Messages Not Described in This Guide
This guide describes only event messages logged by Server Administrator and
Storage Management that are displayed in the Server Administrator Alert log.
For information on other messages produced by your system, see one of the
following sources:
• Your system’s
Installation and Troubleshooting Guide or Hardware Owner's
Manual.
• Operating system documentation
• Application program documentation
Understanding Event Messages
This section describes the various types of event messages generated by
the Server Administrator. When an event occurs on your system, Server
Administrator sends information about one of the following event types to
the systems management console:
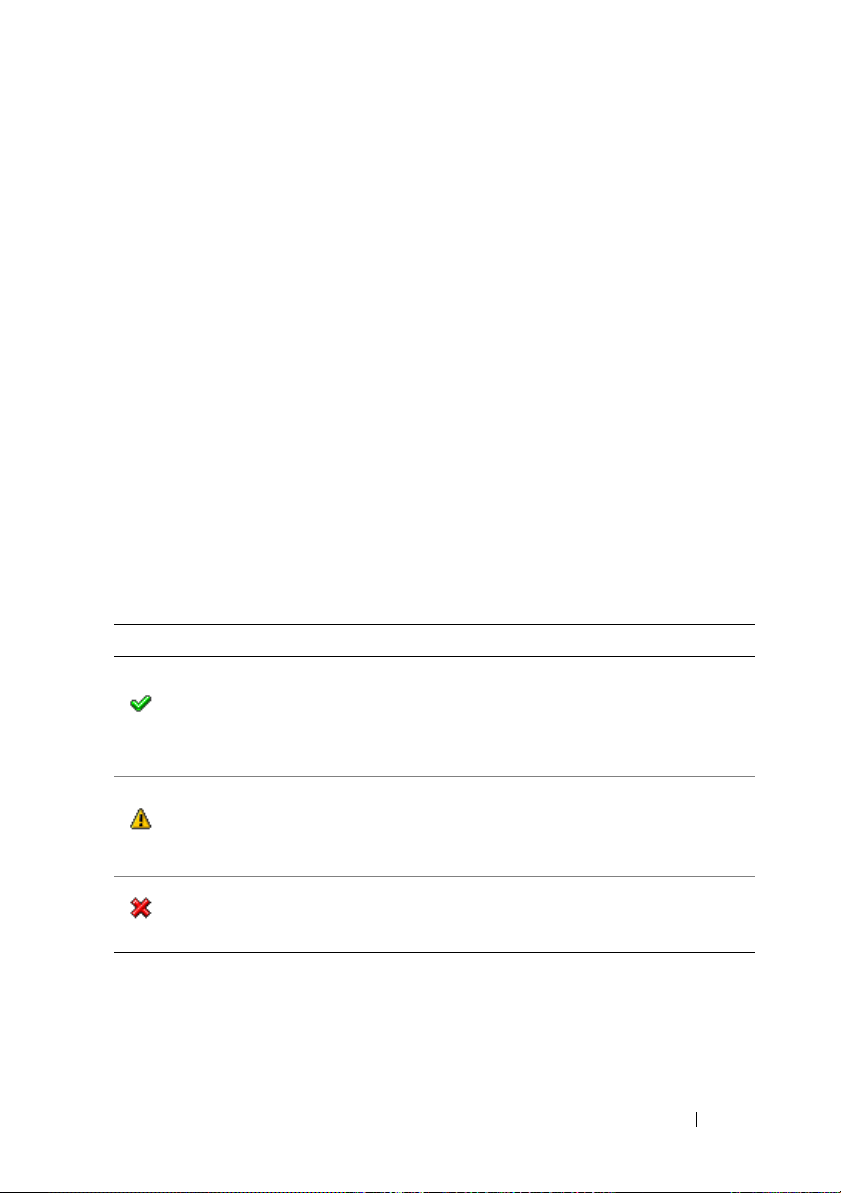
Table 1-1. Understanding Event Messages
Icon Alert Severity Component Status
OK /Normal /
Informational
Warning /
Non-critical
Critical /
Failure / Error
An event that describes the successful operation of a unit.
The alert is provided for informational purposes and does
not indicate an error condition. For example, the alert may
indicate the normal start or stop of an operation, such as
power supply or a
An event that is not necessarily significant, but may indicate a
possible future problem.
alert may indicate that a component (such as a temperature
probe in an enclosure) has crossed a warning threshold.
A significant event that indicates actual or imminent loss of
data or loss of function.
threshold or a hardware failure such as
sensor reading returning to normal.
For example, a Warning/Non-critical
For exam ple,
crossing a failure
an array disk.
Introduction 9
Page 10

Server Administrator generates events based on status changes in the
following sensors:
•
Temperature Sensor
— Helps protect critical components by alerting the
systems management console when temperatures become too high inside
a chassis; also monitors a variety of locations in the chassis and in any
attached systems.
•
Fan Sensor
— Monitors fans in various locations in the chassis and in any
attached systems.
•
Voltage Sensor
— Monitors voltages across critical components in various
chassis locations and in any attached systems.
•
Current Sensor
— Monitors the current (or amperage) output from the
power supply (or supplies) in the chassis and in any attached systems.
•
Chassis Intrusion Sensor
— Monitors intrusion into the chassis and any
attached systems.
•
Redundancy Unit Sensor
— Monitors redundant units (critical units such
as fans, AC power cords, or power supplies) within the chassis; also monitors
the chassis and any attached systems. For example, redundancy allows a
second or
n
th fan to keep the chassis components at a safe temperature
when another fan has failed. Redundancy is normal when the intended
number of critical components are operating. Redundancy is degraded when
a component fails, but others are still operating. Redundancy is lost when
there is one less critical redundancy device than required.
•
Power Supply Sensor
— Monitors power supplies in the chassis and in any
attached systems.
•
Memory Prefailure Sensor
— Monitors memory modules by counting the
number of Error Correction Code (ECC) memory corrections.
•
Fan Enclosure Sensor
— Monitors protective fan enclosures by detecting
their removal from and insertion into the system, and by measuring how
long a fan enclosure is absent from the chassis. This sensor monitors the
chassis and any attached systems.
•
AC Power Cord Sensor
— Monitors the presence of AC power for an
AC power cord.
•
Hardware Log Sensor
— Monitors the size of a hardware log.
10 Introduction
Page 11

•
Processor Sensor
•
Pluggable Device Sensor
or configuration errors for some pluggable devices, such as memory cards.
•
Battery Sensor
the system.
— Monitors the processor status in the system.
— Monitors the addition, removal,
— Monitors the status of one or more batteries in
Sample Event Message Text
The following example shows the format of the event messages logged by
Server Administrator.
EventID: 1000
Source: Server Administrator
Category: Instrumentation Service
Type: Information
Date and Time: Mon Oct 21 10:38:00 2002
Computer:
Description:
Server Administrator starting
Data: Bytes in Hex
<computer name>
Viewing Alerts and Event Messages
An event log is used to record information about important events.
Server Administrator generates alerts that are added to the operating system
event log and to the Server Administrator Alert log. To view these alerts in
Server Administrator:
1
Select the
2
Select the
3
Select the
You can also view the event log using your operating system’s event viewer.
Each operating system’s event viewer accesses the applicable operating
system event log.
System
Logs
tab.
Alert
subtab.
object in the tree view.
Introduction 11
Page 12

The location of the event log file depends on the operating system you are using.
• In the Microsoft® Windows® 2000 Advanced Server and Windows
• In the Red Hat
®
Server
2003 operating systems, messages are logged to the system event
log and optionally to a Unicode text file,
Notepad), that is located in the
The default
install_path
®
Enterprise Linux®, SUSE® Linux Enterprise Server,
install_path
is
C:\Program Files\Dell\SysMgt
dcsys32.log
\omsa\log
(viewable using
directory.
.
and VMware ESXi version 3.5 update 4 operating systems, messages are
logged to the system log file. The default name of the system log file is
var/log/messages
. You can view the messages file using a text editor such
/
as vi or emacs.
Logging Messages to a Unicode Text File
Logging messages to a Unicode text file is optional. By default, the feature is
disabled. To enable this feature, modify the Event Manager section of the
dcemdy32.ini file as follows:
• In Windows, locate the file at <
UnitextLog.enabled=True
Files\Dell\SysMgt
. Restart the
• In Red Hat Enterprise Linux and SUSE Linux Enterprise Server locate the
file at <
install_path>
/dataeng/ini
UnitextLog.enabled=True
srvadmin
. Issue the
"/etc/init.d/dataeng restart"
Server Administrator event manager service. This will also restart the
Server Administrator data manager and SNMP services.
The following subsections explain how to open the Windows 2000 Advanced
Server, Windows Server 2003, Red Hat Enterprise Linux, and SUSE Linux
Enterprise Server, and VMware ESXi
install_path>
.
The default
\dataeng\ini
install_path
DSM SA Event Manager
and set
.
The default
install_path
command to restart the
version 3.5 update 4
event viewers.
and set
is
C:\Program
service.
is
/opt/dell/
Viewing Events in Windows 2000 Advanced Server and Windows Server 2003
1
Click the
2
Double-click
12 Introduction
Start
button, point to
Administrative Tools
Settings
, and click
Control Panel
, and then double-click
Event Viewer
.
.
Page 13
3
In the
Event Viewer
The
System Log
4
To view the details of an event, double-click one of the event items.
NOTE: You can also look up the dcsys32.log file, in the install_path\omsa\log
directory, to view the separate event log file. The default install_path is
C:\Program Files\Dell\SysMgt.
window, click the
Tree
tab and then click
System Log
window displays a list of recently logged events.
Viewing Events in Red Hat Enterprise Linux and SUSE Linux Enterprise Server
1
Log in as
2
Use a text editor such as vi or emacs to view the file named
messages
The following example shows the Red Hat Enterprise Linux and SUSE Linux
Enterprise Server message log, /var/log/messages. The text in boldface type
indicates the message text.
NOTE: These messages are typically displayed as one long line. In the following
example, the message is displayed using line breaks to help you see the message
text more clearly.
...
Feb 6 14:20:51 server01 Server Administrator:
Instrumentation Service EventID: 1000
Server Administrator starting
root
.
.
/var/log/
.
Feb 6 14:20:51 server01 Server Administrator:
Instrumentation Service EventID: 1001
Server Administrator startup complete
Feb 6 14:21:21 server01 Server Administrator:
Instrumentation Service EventID: 1254 Chassis
intrusion detected Sensor location: Main chassis
intrusion Chassis location: Main System Chassis
Previous state was: OK (Normal) Chassis intrusion
state: Open
Feb 6 14:21:51 server01 Server Administrator:
Instrumentation Service EventID: 1252 Chassis
intrusion returned to normal Sensor location: Main
Introduction 13
Page 14

chassis intrusion Chassis location: Main System
Chassis Previous state was: Critical (Failed) Chassis
intrusion state: Closed
Viewing Events in VMware ESXi version 3.5 update 4
1
Log in to the VMware ESXi system with VMware Infrastructure (VI)
Client.
2
Click
Administration
3
Select
System Logs
4
Select
Server Log [/var/log/messages
NOTE: VMware® ESXi 3.5 update 4 does not support SNMP traps for this release.
on the navigation bar.
.
] entry on the drop-down list.
Viewing the Event Information
The event log for each operating system contains some or all of the following
information:
•
Date
— The date the event occurred.
Time
•
•
•
•
•
•
•
•
— The local time the event occurred.
Ty p e
— A classification of the event severity: Information, Warning,
or Error.
User
— The name of the user on whose behalf the event occurred.
Computer
Source
Category
Event ID
Description
the event description vary, depending on the event type.
— The name of the system where the event occurred.
— The software that logged the event.
— The classification of the event by the event source.
— The number identifying the particular event type.
— A description of the event. The format and contents of
Understanding the Event Description
Table 1-2 lists in alphabetical order each line item that may appear in the
event description.
14 Introduction
Page 15

Table 1-2. Event Description Reference
Description Line Item Explanation
Action performed
<Action>
was:
Action requested
<Action>
was:
Additional Details:
<Additional details
for the event>
Specifies the action that was performed, for example:
Action performed was: Power cycle
Specifies the action that was requested, for example:
Action requested was: Reboot, shutdown OS first
Specifies additional details available for the hot plug
event, for example:
Memory device: DIMM1_A Serial
number: FFFF30B1
<Additional power
supply status
information>
Chassis intrusion
state:
<Intrusion
state>
Chassis location:
<Name of chassis>
Configuration error
type:
<type of
configuration
error>
Current sensor
value (in Amps):
<Reading>
Date and time of
action:
<Date and
time>
Specifies information pertaining to the event,
for example:
Power supply input AC is off, Power
supply
POK (power OK) signal is not normal,
Power supply is turned off
Specifies the chassis intrusion state (open or closed),
for example:
Chassis intrusion state: Open
Specifies name of the chassis that generated the
message, for example:
Chassis location: Main System Chassis
Specifies the type of configuration error that occurred,
for example:
Configuration error type: Revision
mismatch
Specifies the current sensor value in amps, for example:
Current sensor value (in Amps): 7.853
Specifies the date and time the action was performed,
for example:
Date and time of action: Sat Jun 12
16:20:33 2004
Introduction 15
Page 16

Table 1-2. Event Description Reference (continued)
Description Line Item Explanation
Device location:
Location in
<
chassis
Discrete current
state:
Discrete
temperature state:
>
<State>
<State>
Discrete voltage
state:
Fan sensor value:
<State>
<Reading>
Log type:
<Log
type>
Memory device bank
location:
<Bank
name in chassis>
Memory device
location:
<Device name in
chassis>
Number of devices
required for full
redundancy:
<Number>
Peak value (in
Watts): <Reading>
Specifies the location of the device in the specified
chassis, for example:
Device location: Memory Card A
Specifies the state of the current sensor, for example:
Discrete current state: Good
Specifies the state of the temperature sensor,
for example:
Discrete temperature state: Good
Specifies the state of the voltage sensor, for example:
Discrete voltage state: Good
Specifies the fan speed in revolutions per minute (RPM)
or On/Off, for example:
Fan sensor value (in RPM): 2600
Fan sensor value: Off
Specifies the type of hardware log, for example:
Log type: ESM
Specifies the name of the memory bank in the system
that generated the message, for example:
Memory device bank location: Bank_1
Specifies the location of the memory module in the
chassis, for example:
Memory device location: DIMM_A
Specifies the number of power supply or cooling devices
required to achieve full redundancy, for example:
Number of devices required for full
redundancy: 4
Specifies the peak value in Watts, for example:
Peak value (in Watts): 1.693
16 Introduction
Page 17

Table 1-2. Event Description Reference (continued)
Description Line Item Explanation
Possible memory
module event cause:
<list of causes>
Power Supply type:
<type of power
supply>
Previous redundancy
state was:
Previous state was:
<State>
<State>
Processor sensor
status:
Redundancy unit:
<status>
<Redundancy
location in
chassis>
Sensor location:
<Location in
chassis>
Temperature sensor
value:
Voltage sensor
value (in Volts):
<Reading>
<Reading>
Specifies a list of possible causes for the memory module
event, for example:
Possible memory module event cause:
Single bit warning error rate exceeded
Single bit error logging disabled
Specifies the type of power supply, for example:
Power Supply type: VRM
Specifies the status of the previous redundancy message,
for example:
Previous redundancy state was: Lost
Specifies the previous state of the sensor, for example:
Previous state was: OK (Normal)
Specifies the status of the processor sensor, for example:
Processor sensor status: Configuration
error
Specifies the location of the redundant power supply or
cooling unit in the chassis, for example:
Redundancy unit: Fan Enclosure
Specifies the location of the sensor in the specified
chassis, for example:
Sensor location: CPU1
Specifies the temperature in degrees Celsius,
for example:
Temperature sensor value (in degrees
Celsius): 30
Specifies the voltage sensor value in volts, for example:
Voltage sensor value (in Volts): 1.693
Introduction 17
Page 18

18 Introduction
Page 19

Event Message Reference
The following tables lists in numerical order each event ID and its
corresponding description, along with its severity and cause.
NOTE: For corrective actions, see the appropriate documentation.
Miscellaneous Messages
Miscellaneous messages in Table 2-1 indicate that certain alert systems are up
and working.
Table 2-1. Miscellaneous Messages
Event IDDescription Severity Cause
0000 Log was cleared Information User cleared the log from
Server Administrator.
0001 Log backup created Information The log was full, copied to
backup, and cleared.
1000 Server Administrator
starting
1001 Server Administrator
startup complete
1002 A system BIOS update
has been scheduled for
the next reboot
1003 A previously scheduled
system BIOS update has
been canceled
Information Server Administrator is
beginning to initialize.
Information Server Administrator
completed its initialization.
Information The user has chosen to update
the flash basic input/output
system (BIOS).
Information The user decides to cancel the
flash BIOS update, or an error
occurs during the flash.
Event Message Reference 19
Page 20

Table 2-1. Miscellaneous Messages (continued)
Event IDDescription Severity Cause
1004 Thermal shutdown
protection has been
initiated
1005 SMBIOS data is absent Error The system does not contain
1006 Automatic System
Recovery (ASR) action
was performed
Action performed was:
<Action>
Date and time of
action:
time>
1007 User initiated host
system control action
Action requested was:
<Action>
<Date and
Error This message is generated
when a system is configured for
thermal shutdown due to an
error event. If a temperature
sensor reading exceeds the
error threshold for which the
system is configured, the
operating system shuts down
and the system powers off.
This event may also be
initiated on certain systems
when a fan enclosure is removed
from the system for an extended
period of time.
the required systems
management BIOS version 2.2
or higher, or the BIOS is
corrupted.
Error This message is generated
when an automatic system
recovery action is performed
due to a hung operating
system. The action performed
and the time of action are
provided.
Information User requested a host system
control action to reboot, power
off, or power cycle the system.
Alternatively, the user had
indicated protective measures
to be initiated in the event of a
thermal shutdown.
20 Event Message Reference
Page 21

Table 2-1. Miscellaneous Messages (continued)
Event IDDescription Severity Cause
1008 Systems Management
Data Manager Started
1009 Systems Management
Data Manager Stopped
1011 RCI table is corrupt Error This message is generated
1012 IPMI Status
Interface: <
the IPMI
interface being used
<
additional
information if
available and
applicable
1013 System Peak Power
detected new peak
value
Peak value (in
Watts):<Reading>
1014 System software
event:<
Date and time of
action:<
>
Description
Date and time
Information Systems Management
Data Manager services
were started.
Information Systems Management
Data Manager services
were stopped.
when the BIOS Remote
Configuration Interface (RCI)
table is corrupted or cannot be
read by the systems
management software.
Information This message is generated
to indicate the Intelligent
>,
Information The system peak power sensor
Warning This event is generated when
>
>
Platform Management
Interface (IPMI)) status of the
system.
Additional information, when
available, includes Baseboard
Management Controller
(BMC) not present, BMC not
responding, System Event Log
(SEL) not present, and SEL
Data Record (SDR) not present.
detected a new peak value in
power consumption. The new
peak value in Watts is
provided.
the systems management agent
detects a critical system
software generated event in the
system event log which could
have been resolved.
Event Message Reference 21
Page 22

Temperature Sensor Messages
Temperature sensors listed in Table 2-2 help protect critical components
by alerting the systems management console when temperatures become
too high inside a chassis. The temperature sensor messages use additional
variables: sensor location, chassis location, previous state, and temperature
sensor value or state.
Table 2-2. Temperature Sensor Messages
Event IDDescription Severity Cause
1050 Temperature sensor has failed
Sensor location: <Location in
chassis>
Chassis location: <Name of
chassis>
Previous state was: <State>
If sensor type is not discrete:
Temperature sensor value
(in degrees Celsius):
If sensor type is discrete:
Discrete temperature state:
<State>
1051 Temperature sensor value
unknown
Sensor location: <Location in
chassis>
Chassis location: <Name of
chassis>
If sensor type is not discrete:
Temperature sensor value
(in degrees Celsius):
If sensor type is discrete:
Discrete temperature state:
<State>
<Reading>
<Reading>
Error A temperature
sensor on the
backplane board,
system board,
or the carrier in the
specified system
failed. The sensor
location, chassis
location, previous
state, and
temperature sensor
value are provided.
Information A temperature
sensor on the
backplane board,
system board, or
drive carrier in the
specified system
could not obtain a
reading. The sensor
location, chassis
location, previous
state, and
a nominal
temperature sensor
value are provided.
22 Event Message Reference
Page 23

Table 2-2. Temperature Sensor Messages (continued)
Event IDDescription Severity Cause
1052 Temperature sensor returned
to a normal value
Sensor location:
<Location in
chassis>
Chassis location:
<Name of
chassis>
Previous state was:
If sensor type is not discrete:
Temperature sensor value (in
degrees Celsius):
If sensor type is discrete:
Discrete temperature state:
<State>
<Reading>
<State>
1053 Temperature sensor detected
a warning value
Sensor location:
<Location in
chassis>
Chassis location:
<Name of
chassis>
Previous state was:
If sensor type is not discrete:
Temperature sensor value (in
degrees Celsius):
If sensor type is discrete:
Discrete temperature state:
<State>
<Reading>
<State>
Information A temperature
sensor on the
backplane board,
system board, or
drive carrier in the
specified system
returned to a valid
range after crossing
a failure threshold.
The sensor
location, chassis
location, previous
state, and
temperature sensor
value are provided.
Warning A temperature
sensor on the
backplane board,
system board, CPU,
or drive carrier in
the specified
system exceeded its
warning threshold.
The sensor
location, chassis
location, previous
state, and
temperature sensor
value are provided.
Event Message Reference 23
Page 24

Table 2-2. Temperature Sensor Messages (continued)
Event IDDescription Severity Cause
1054 Temperature sensor detected
a failure value
Sensor location:
<Location in
chassis>
Chassis location:
<Name of
chassis>
Previous state was:
If sensor type is not discrete:
Temperature sensor value (in
degrees Celsius):
If sensor type is discrete:
Discrete temperature state:
<State>
<Reading>
<State>
1055 Temperature sensor detected
a non-recoverable value
Sensor location:
<Location in
chassis>
Chassis location:
<Name of
chassis>
Previous state was:
If sensor type is not discrete:
Temperature sensor value (in
degrees Celsius):
If sensor type is discrete:
Discrete temperature state:
<State>
<Reading>
<State>
Error A temperature
sensor on the
backplane board,
system board, or
drive carrier in the
specified system
exceeded its failure
threshold.
The sensor
location, chassis
location, previous
state,
and temperature
sensor value
are provided.
Error A temperature
sensor on the
backplane board,
system board, or
drive carrier in the
specified system
detected an error
from which it
cannot recover.
The sensor
location, chassis
location, previous
state, and
temperature sensor
value are provided.
24 Event Message Reference
Page 25

Cooling Device Messages
Cooling device sensors listed in Table 2-3 monitor how well a fan is
functioning. Cooling device messages provide status and warning information
for fans in a particular chassis.
Table 2-3. Cooling Device Messages
Event IDDescription Severity Cause
1100 Fan sensor has failed
Sensor location: <Location in
chassis>
Chassis location: <Name of
chassis>
Previous state was: <State>
Fan sensor value:
1101 Fan sensor value unknown
Sensor location: <Location in
chassis>
Chassis location: <Name of
chassis>
Previous state was: <State>
Fan sensor value:
1102 Fan sensor returned to a
normal value
Sensor location:
<Reading>
<Reading>
<Location in
chassis>
Chassis location:
<Name of
chassis>
Previous state was:
Fan sensor value:
<State>
<Reading>
Error A fan sensor in the
specified system is
not functioning.
The sensor
location, chassis
location, previous
state, and fan
sensor value are
provided.
Error A fan sensor in the
specified system
could not obtain a
reading. The sensor
location, chassis
location, previous
state, and a
nominal fan sensor
value are provided.
Information A fan sensor
reading on the
specified system
returned to a valid
range after crossing
a warning
threshold. The
sensor location,
chassis location,
previous state, and
fan sensor value are
provided.
Event Message Reference 25
Page 26

Table 2-3. Cooling Device Messages (continued)
Event IDDescription Severity Cause
1103 Fan sensor detected a warning
value
Sensor location:
<Location in
chassis>
Chassis location:
<Name of
chassis>
Previous state was:
Fan sensor value:
1104 Fan sensor detected a failure
value
Sensor location:
<State>
<Reading>
<Location in
chassis>
Chassis location:
<Name of
chassis>
Previous state was:
Fan sensor value:
1105 Fan sensor detected a
non-recoverable value
Sensor location:
<State>
<Reading>
<Location in
chassis>
Chassis location:
<Name of
chassis>
Previous state was:
Fan sensor value:
<State>
<Reading>
Warning A fan sensor
reading in the
specified system
exceeded a warning
threshold. The
sensor location,
chassis location,
previous state, and
fan sensor value are
provided.
Error A fan sensor in the
specified system
detected the failure
of one or more fans.
The sensor
location, chassis
location, previous
state, and fan
sensor value are
provided.
Error A fan sensor
detected an error
from which it
cannot recover.
The sensor
location, chassis
location, previous
state, and fan
sensor value are
provided.
26 Event Message Reference
Page 27

Voltage Sensor Messages
Voltage sensors listed in Table 2-4 monitor the number of volts across critical
components. Voltage sensor messages provide status and warning information
for voltage sensors in a particular chassis.
Table 2-4. Voltage Sensor Messages
Event IDDescription Severity Cause
1150 Voltage sensor has failed
Sensor location: <Location
in chassis>
Chassis location: <Name of
chassis>
Previous state was: <State>
If sensor type is not
discrete:
Voltage sensor value (in
Volts):
If sensor type is discrete:
Discrete voltage state:
<Reading>
<State>
1151 Voltage sensor value unknown
Sensor location: <Location
in chassis>
Chassis location: <Name of
chassis>
Previous state was: <State>
If sensor type is not
discrete:
Voltage sensor value
(in Volts):
If sensor type is discrete:
Discrete voltage state:
<Reading>
<State>
Error A voltage sensor in
the specified system
failed. The sensor
location, chassis
location, previous
state, and voltage
sensor value are
provided.
Warning A voltage sensor in
the specified system
could not obtain
a reading. The sensor
location, chassis
location, previous
state, and a nominal
voltage sensor value
are provided.
Event Message Reference 27
Page 28

Table 2-4. Voltage Sensor Messages (continued)
Event IDDescription Severity Cause
1152 Voltage sensor returned to
a normal value
Sensor location: <Location
in chassis>
Chassis location: <Name of
chassis>
Previous state was: <State>
If sensor type is not
discrete:
Voltage sensor value
(in Volts):
If sensor type is discrete:
Discrete voltage state:
<Reading>
<State>
1153 Voltage sensor detected a
warning value
Sensor location: <Location
in chassis>
Chassis location: <Name of
chassis>
Previous state was: <State>
If sensor type is not
discrete:
Voltage sensor value
(in Volts):
If sensor type is discrete:
Discrete voltage state:
<Reading>
<State>
Information A voltage sensor in
the specified system
returned to a valid
range after crossing
a failure threshold.
The sensor location,
chassis location,
previous state, and
voltage sensor value
are provided.
Warning A voltage sensor in
the specified system
exceeded its warning
threshold. The sensor
location, chassis
location, previous
state, and voltage
sensor value are
provided.
28 Event Message Reference
Page 29

Table 2-4. Voltage Sensor Messages (continued)
Event IDDescription Severity Cause
1154 Voltage sensor detected
a failure value
Sensor location: <Location
in chassis>
Chassis location: <Name of
chassis>
Previous state was: <State>
If sensor type is not
discrete:
Voltage sensor value
(in Volts):
If sensor type is discrete:
Discrete voltage state:
<Reading>
<State>
1155 Voltage sensor detected a
non-recoverable value
Sensor location: <Location
in chassis>
Chassis location: <Name of
chassis>
Previous state was: <State>
If sensor type is not
discrete:
Voltage sensor value
(in Volts):
If sensor type is discrete:
Discrete voltage state:
<Reading>
<State>
Error A voltage sensor in
the specified system
exceeded its failure
threshold. The sensor
location, chassis
location, previous
state, and voltage
sensor value are
provided.
Error A voltage sensor in
the specified system
detected an error
from which it cannot
recover. The sensor
location, chassis
location, previous
state, and voltage
sensor value are
provided.
Event Message Reference 29
Page 30

Current Sensor Messages
Current sensors listed in Table 2-5 measure the amount of current
(in amperes) that is traversing critical components. Current sensor messages
provide status and warning information for current sensors in a particular
chassis.
Table 2-5. Current Sensor Messages
Event IDDescription Severity Cause
1200 Current sensor has failed
Sensor location: <Location in
chassis>
Chassis location: <Name of
chassis>
Previous state was: <State>
If sensor type is not discrete:
Current sensor value
(in Amps):
Current sensor value
(in Watts):
If sensor type is discrete:
Discrete current state:
<Reading>
<Reading>
OR
Error A current sensor
in the specified
system failed.
The sensor
location, chassis
location, previous
state, and current
sensor value
are provided.
<State>
30 Event Message Reference
Page 31

Table 2-5. Current Sensor Messages (continued)
Event IDDescription Severity Cause
1201 Current sensor value unknown
Sensor location: <Location in
chassis>
Chassis location: <Name of
chassis>
Previous state was: <State>
If sensor type is not discrete:
Current sensor value (in Amps):
<Reading>
Current sensor value (in
Watts):
If sensor type is discrete:
Discrete current state:
1202 Current sensor returned to
a normal value
Sensor location: <Location in
chassis>
Chassis location: <Name of
chassis>
Previous state was: <State>
If sensor type is not discrete:
Current sensor value (in Amps):
<Reading>
Current sensor value (in
Watts):
If sensor type is discrete:
Discrete current state:
OR
<Reading>
<State>
OR
<Reading>
<State>
Error A current sensor
in the specified
system could not
obtain a reading.
The sensor
location, chassis
location, previous
state, and a
nominal current
sensor value are
provided.
Information A current sensor
in the specified
system returned
to a valid range
after crossing a
failure threshold.
The sensor
location, chassis
location, previous
state, and current
sensor value are
provided.
Event Message Reference 31
Page 32

Table 2-5. Current Sensor Messages (continued)
Event IDDescription Severity Cause
1203 Current sensor detected a
warning value
Sensor location: <Location in
chassis>
Chassis location: <Name of
chassis>
Previous state was: <State>
If sensor type is not discrete:
Current sensor value (in Amps):
<Reading>
Current sensor value (in
Watts):
If sensor type is discrete:
Discrete current state:
1204 Current sensor detected a
failure value
Sensor location: <Location in
chassis>
Chassis location: <Name of
chassis>
Previous state was: <State>
If sensor type is not discrete:
Current sensor value (in Amps):
<Reading>
Current sensor value (in
Watts):
If sensor type is discrete:
Discrete current state:
OR
<Reading>
<State>
OR
<Reading>
<State>
Warning A current sensor
in the specified
system exceeded
its warning
threshold.
The sensor
location, chassis
location, previous
state, and current
sensor value
are provided.
Error A current sensor
in the specified
system exceeded
its failure
threshold.
The sensor
location, chassis
location, previous
state, and current
sensor value
are provided.
32 Event Message Reference
Page 33

Table 2-5. Current Sensor Messages (continued)
Event IDDescription Severity Cause
1205 Current sensor detected a
non-recoverable value
Sensor location: <Location in
chassis>
Chassis location: <Name of
chassis>
Previous state was: <State>
If sensor type is not discrete:
Current sensor value (in Amps):
<Reading>
Current sensor value (in
Watts):
If sensor type is discrete:
Discrete current state:
OR
<Reading>
<State>
Error A current sensor
in the specified
system detected
an error from
which it
cannot recover.
The sensor
location, chassis
location, previous
state, and current
sensor value
are provided.
Chassis Intrusion Messages
Chassis intrusion messages listed in Table 2-6 are a security measure.
Chassis intrusion means that someone is opening the cover to a
system’s chassis. Alerts are sent to prevent unauthorized removal of parts
from a chassis.
Event Message Reference 33
Page 34

Table 2-6. Chassis Intrusion Messages
Event IDDescription Severity Cause
1250 Chassis intrusion
sensor has failed
Sensor location:
<Location in chassis>
Chassis location: <Name
of chassis>
Previous state was:
<State>
Chassis intrusion state:
<Intrusion state>
1251 Chassis intrusion
sensor value unknown
Sensor location:
<Location in chassis>
Chassis location: <Name
of chassis>
Previous state was:
<State>
Chassis intrusion state:
<Intrusion state>
1252 Chassis intrusion
returned to normal
Sensor location:
<Location in chassis>
Chassis location: <Name
of chassis>
Previous state was:
<State>
Chassis intrusion state:
<Intrusion state>
Error A chassis intrusion sensor
in the specified system
failed. The sensor
location, chassis location,
previous state, and
chassis intrusion state
are provided.
Error A chassis intrusion sensor
in the specified system
could not obtain a
reading. The sensor
location, chassis location,
previous state, and
chassis intrusion state
are provided.
Information A chassis intrusion sensor
in the specified system
detected that a cover was
opened while the system
was operating but has
since been replaced.
The sensor location,
chassis location, previous
state, and chassis
intrusion state are
provided.
34 Event Message Reference
Page 35

Table 2-6. Chassis Intrusion Messages (continued)
Event IDDescription Severity Cause
1253 Chassis intrusion in
progress
Sensor location:
<Location in chassis>
Chassis location: <Name
of chassis>
Previous state was:
<State>
Chassis intrusion state:
<Intrusion state>
1254 Chassis intrusion
detected
Sensor location:
<Location in chassis>
Chassis location: <Name
of chassis>
Previous state was:
<State>
Chassis intrusion state:
<Intrusion state>
1255 Chassis intrusion
sensor detected a
non-recoverable value
Sensor location:
<Location in chassis>
Chassis location: <Name
of chassis>
Previous state was:
<State>
Chassis intrusion state:
<Intrusion state>
Warning A chassis intrusion sensor
in the specified system
detected that a system
cover is currently being
opened and the system is
operating. The sensor
location, chassis location,
previous state, and chassis
intrusion state are
provided.
Warning A chassis intrusion sensor
in the specified system
detected that the system
cover was opened while
the system was operating.
The sensor location,
chassis location, previous
state, and chassis
intrusion state are
provided.
Error A chassis intrusion sensor
in the specified system
detected an error from
which it cannot recover.
The sensor location,
chassis location, previous
state, and chassis
intrusion state are
provided.
Event Message Reference 35
Page 36

Redundancy Unit Messages
Redundancy means that a system chassis has more than one of certain critical
components. Fans and power supplies, for example, are so important for
preventing damage or disruption of a computer system that a chassis may
have “extra” fans or power supplies installed. Redundancy allows a second
or nth fan to keep the chassis components at a safe temperature when the
primary fan has failed. Redundancy is normal when the intended number of
critical components are operating. Redundancy is degraded when a
component fails but others are still operating. Redundancy is lost when the
number of components functioning falls below the redundancy threshold.
Table 2-7 lists the redundancy unit messages.
The number of devices required for full redundancy is provided as part of
the message, when applicable, for the redundancy unit and the platform.
For details on redundancy computation, see the respective platform
documentation.
Table 2-7. Redundancy Unit Messages
EventIDDescription Severity Cause
1300 Redundancy sensor has
failed Redundancy unit:
<Redundancy location
in chassis>
Chassis location: <Name of
chassis>
Previous redundancy state
<State>
was:
1301 Redundancy sensor value
unknown
Redundancy unit:
location in chassis>
Chassis location: <Name of
chassis>
Previous redundancy state
<State>
was:
<Redundancy
36 Event Message Reference
Warning A redundancy sensor in
the specified system
failed. The redundancy
unit location, chassis
location, previous
redundancy state, and
the number of devices
required for full
redundancy are provided.
Warning A redundancy sensor in
the specified system
could not obtain a
reading. The redundancy
unit location, chassis
location, previous
redundancy state,
and the number of
devices required for full
redundancy are provided.
Page 37

Table 2-7. Redundancy Unit Messages (continued)
EventIDDescription Severity Cause
1302 Redundancy not applicable
Redundancy unit:
<Redundancy location
in chassis>
Chassis location: <Name of
chassis>
Previous redundancy state
<State>
was:
1303 Redundancy is offline
Redundancy unit:
<Redundancy location
in chassis>
Chassis location: <Name of
chassis>
Previous redundancy state
<State>
was:
1304 Redundancy regained
Redundancy unit:
<Redundancy location
in chassis>
Chassis location: <Name of
chassis>
Previous redundancy state
<State>
was:
Information A redundancy sensor in
the specified system
detected that a unit was
not redundant.
The redundancy
location, chassis location,
previous redundancy
state, and the number of
devices required for full
redundancy are provided.
Information A redundancy sensor in
the specified system
detected that
a redundant unit
is offline.
The redundancy
unit location, chassis
location, previous
redundancy state,
and the number of
devices required for full
redundancy are provided.
Information A redundancy sensor in
the specified system
detected that a “lost”
redundancy device has
been reconnected or
replaced; full redundancy
is in effect. The
redundancy unit
location, chassis location,
previous redundancy
state, and the number of
devices required for full
redundancy are provided.
Event Message Reference 37
Page 38

Table 2-7. Redundancy Unit Messages (continued)
EventIDDescription Severity Cause
1305 Redundancy degraded
Redundancy unit:
<Redundancy location
in chassis>
Chassis location: <Name of
chassis>
Previous redundancy state
<State>
was:
1306 Redundancy lost
Redundancy unit:
<Redundancy location
in chassis>
Chassis location: <Name of
chassis>
Previous redundancy state
<State>
was:
Warning A redundancy sensor in
the specified system
detected that one of the
components of the
redundancy unit has
failed but the unit is
still redundant.
The redundancy unit
location, chassis location,
previous redundancy
state, and the number of
devices required for full
redundancy are provided.
Error A redundancy sensor in
the specified system
detected that one of the
components in the
redundant unit has been
disconnected, has failed,
or is not present.
The redundancy unit
location, chassis location,
previous redundancy
state, and the number of
devices required for full
redundancy are provided.
Power Supply Messages
Power supply sensors monitor how well a power supply is functioning. Power
supply messages listed in Table 2-8 provide status and warning information
for power supplies present in a particular chassis.
38 Event Message Reference
Page 39

Table 2-8. Power Supply Messages
Event IDDescription Severity Cause
1350 Power supply sensor has
failed Sensor location:
<Location in chassis>
Chassis location: <Name of
chassis>
Previous state was: <State>
Power Supply type:
<type of
power supply>
<Additional power supply
status information>
If in configuration error
state:
Configuration error type:
<type of configuration
error>
1351 Power supply sensor value
unknown
Sensor location: <Location
in chassis>
Chassis location: <Name of
chassis>
Previous state was: <State>
Power Supply type: <type of
power supply>
<Additional power supply
status information>
If in configuration error
state:
Configuration error type:
<type of configuration
error>
Error A power supply sensor
in the specified
system failed.
The sensor location,
chassis location,
previous state, and
additional power
supply status
information
are provided.
Warning A power supply sensor
in the specified
system could not
obtain a reading.
The sensor location,
chassis location,
previous state, and
additional power
supply status
information
are provided.
Event Message Reference 39
Page 40

Table 2-8. Power Supply Messages (continued)
Event IDDescription Severity Cause
1352 Power supply returned to
normal Sensor location:
<Location in chassis>
Chassis location: <Name of
chassis>
Previous state was: <State>
Power Supply type: <type of
power supply>
<Additional power supply
status information>
If in configuration error
state:
Configuration error type:
<type of configuration
error>
1353 Power supply detected a
warning Sensor location:
<Location in chassis>
Chassis location: <Name of
chassis>
Previous state was: <State>
Power Supply type: <type of
power supply>
<Additional power supply
status information>
If in configuration error
state:
Configuration error type:
<type of configuration
error>
Information A power supply has
been reconnected or
replaced. The sensor
location, chassis
location, previous
state, and additional
power supply status
information
are provided.
Warning A power supply sensor
reading in the
specified system
exceeded
a user-definable
warning threshold.
The sensor location,
chassis location,
previous state, and
additional power
supply status
information
are provided.
40 Event Message Reference
Page 41

Table 2-8. Power Supply Messages (continued)
Event IDDescription Severity Cause
1354 Power supply detected a
failure
Sensor location: <Location
in chassis>
Chassis location: <Name of
chassis>
Previous state was: <State>
Power Supply type: <type of
power supply>
<Additional power supply
status information>
If in configuration error
state:
Configuration error type:
<type of configuration
error>
1355 Power supply sensor detected
a non-recoverable value
Sensor location: <Location
in chassis>
Chassis location: <Name of
chassis>
Previous state was: <State>
Power Supply type: <type of
power supply>
<Additional power supply
status information>
If in configuration error
state:
Configuration error type:
<type of configuration
error>
Error A power supply has
been disconnected or
has failed. The sensor
location, chassis
location, previous
state, and additional
power supply status
information
are provided.
Error A power supply sensor
in the specified system
detected an error from
which it cannot
recover. The sensor
location, chassis
location, previous
state, and additional
power supply status
information are
provided.
Event Message Reference 41
Page 42

Memory Device Messages
Memory device messages listed in Table 2-9 provide status and warning
information for memory modules present in a particular system. Memory
devices determine health status by monitoring the ECC memory correction
rate and the type of memory events that have occurred.
NOTE: A critical status does not always indicate a system failure or loss of data.
In some instances, the system has exceeded the ECC correction rate.
Although the system continues to function, you should perform system maintenance
as described in Table 2-9.
NOTE: In Table 2-9, <status> can be either critical or non-critical.
Table 2-9. Memory Device Messages
Event IDDescription Severity Cause
1403 Memory device status is
<status>
location:
chassis>
Possible memory module
event cause:
causes>
1404 Memory device status is
<status>
location:
chassis>
Possible memory module
event cause: <list of
causes>
Memory device
<location in
<list of
Memory device
<location in
Warning A memory device correction
rate exceeded an acceptable
value. The memory device
status and location are
provided.
Error A memory device correction
rate exceeded an acceptable
value, a memory spare bank was
activated, or a multibit ECC
error occurred. The system
continues to function normally
(except for a multibit error).
Replace the memory module
identified in the message
during the system’s next
scheduled maintenance. Clear
the memory error on multibit
ECC error. The memory device
status and location are
provided.
42 Event Message Reference
Page 43

Fan Enclosure Messages
Some systems are equipped with a protective enclosure for fans.
Fan enclosure messages listed in Table 2-10 monitor whether foreign
objects are present in an enclosure and how long a fan enclosure is
missing from a chassis.
Table 2-10. Fan Enclosure Messages
Event IDDescription Severity Cause
1450 Fan enclosure sensor
has failed
Sensor location:
<Location in chassis>
Chassis location:
<Name of chassis>
1451 Fan enclosure sensor
value unknown
Sensor location:
<Location in chassis>
Chassis location:
<Name of chassis>
1452 Fan enclosure inserted
into system
Sensor location:
<Location in chassis>
Chassis location:
<Name of chassis>
1453 Fan enclosure removed
from system
Sensor location:
<Location in chassis>
Chassis location:
<Name of chassis>
Critical/
Failure /
Error
Warning The fan enclosure sensor in
Information A fan enclosure has been
Warning A fan enclosure has been
The fan enclosure sensor in
the specified system failed.
The sensor location and
chassis location are provided.
the specified system could not
obtain a reading. The sensor
location and chassis location
are provided.
inserted into the specified
system. The sensor location
and chassis location are
provided.
removed from the specified
system. The sensor location
and chassis location are
provided.
Event Message Reference 43
Page 44

Table 2-10. Fan Enclosure Messages (continued)
Event IDDescription Severity Cause
1454 Fan enclosure removed
from system for an
extended amount of
time
Sensor location:
<Location in chassis>
Chassis location:
<Name of chassis>
1455 Fan enclosure sensor
detected a nonrecoverable value
Sensor location:
<Location in chassis>
Chassis location:
<Name of chassis>
Error A fan enclosure has been
removed from the specified
system for a user-definable
length of time. The sensor
location and chassis location
are provided.
Error A fan enclosure sensor in the
specified system detected an
error from which it cannot
recover. The sensor location
and chassis location
are provided.
44 Event Message Reference
Page 45

AC Power Cord Messages
AC power cord messages listed in Table 2-11 provide status and warning
information for power cords that are part of an AC power switch, if your
system supports AC switching.
Table 2-11. AC Power Cord Messages
Event IDDescription Severity Cause
1500 AC power cord sensor
has failed Sensor
location: <Location in
chassis>
Chassis location:
<Name of chassis>
1501 AC power cord is not
being monitored
Sensor location:
<Location in chassis>
Chassis location:
<Name of chassis>
1502 AC power has been
restored
Sensor location:
<Location in chassis>
Chassis location:
<Name of chassis>
Critical/
Failure/
Error
Information The AC power cord status is
Information An AC power cord that did
An AC power cord sensor in
the specified system failed.
The AC power cord status
cannot be monitored.
The sensor location and
chassis location information
are provided.
not being monitored.
This occurs when a system’s
expected AC power
configuration is set to
nonredundant. The sensor
location and chassis location
information are provided.
not have AC power has had
the power restored.
The sensor location and
chassis location information
are provided.
Event Message Reference 45
Page 46

Table 2-11. AC Power Cord Messages (continued)
Event IDDescription Severity Cause
1503 AC power has been
lost Sensor location:
<Location in chassis>
Chassis location:
<Name of chassis>
1504 AC power has been
lost Sensor location:
<Location in chassis>
Chassis location:
<Name of chassis>
1505 AC power has been lost
Sensor location:
<Location in chassis>
Chassis location:
<Name of chassis>
Critical/
Failure/
Error
Error An AC power cord has lost its
Error An AC power cord sensor in
An AC power cord has lost its
power, but there is sufficient
redundancy to classify this as
a warning. The sensor location
and chassis location
information are provided.
power, and lack of redundancy
requires this to be classified as
an error. The sensor location
and chassis location
information are provided.
the specified system failed.
The AC power cord status
cannot be monitored.
The sensor location and
chassis location information
are provided.
Hardware Log Sensor Messages
Hardware logs provide hardware status messages to systems management
software. On certain systems, the hardware log is implemented as a circular
queue. When the log becomes full, the oldest status messages are overwritten
when new status messages are logged. On some systems, the log is not
circular. On these systems, when the log becomes full, subsequent hardware
status messages are lost. Hardware log sensor messages listed in Table 2-12
provide status and warning information about the noncircular logs that may
fill up, resulting in lost status messages.
46 Event Message Reference
Page 47

Table 2-12. Hardware Log Sensor Messages
Event IDDescription Severity Cause
1550 Log monitoring has
been disabled
Log type:
1551 Log status is unknown
Log type:
1552 Log size is no longer
near or at capacity
Log type:
1553 Log size is near
capacity
Log type:
1554 Log size is full
Log type:
1555 Log sensor has failed
Log type:
<Log type>
<Log type>
<Log type>
<Log type>
<Log type>
<Log type>
Warning A hardware log sensor in the
specified system is disabled.
The log type information is
provided.
Information A hardware log sensor in the
specified system could not
obtain a reading. The log type
information is provided.
Information The hardware log on the
specified system is no longer near
or at its capacity, usually as the
result of clearing the log. The log
type information is provided.
Warning The size of a hardware log on the
specified system is near or at the
capacity of the hardware log. The
log type information is provided.
Error The size of a hardware log on
the specified system is full. The
log type information is provided.
Error A hardware log sensor in the
specified system failed. The
hardware log status cannot be
monitored. The log type
information is provided.
Event Message Reference 47
Page 48

Processor Sensor Messages
Processor sensors monitor how well a processor is functioning. Processor
messages listed in Table 2-13 provide status and warning information for
processors in a particular chassis.
Table 2-13. Processor Sensor Messages
Event IDDescription Severity Cause
1600 Processor sensor has
failed
Sensor Location:
<Location in chassis>
Chassis Location:
<Name of chassis>
Previous state was:
<State>
Processor sensor
status:
1601 Processor sensor value
unknown Sensor
Location:
chassis>
Chassis Location:
<Name of chassis>
Previous state was:
<State>
Processor sensor
status:
<status>
<Location in
<status>
Critical/
Failure/
Error
Critical/
Failure/
Error
A processor sensor in the
specified system is not
functioning. The sensor
location, chassis location,
previous state and processor
sensor status are provided.
A processor sensor in the
specified system could not
obtain a reading. The sensor
location, chassis location,
previous state and processor
sensor status are provided.
48 Event Message Reference
Page 49

Table 2-13. Processor Sensor Messages (continued)
Event IDDescription Severity Cause
1602 Processor sensor
returned to a normal
value
Sensor Location:
<Location in chassis>
Chassis Location:
<Name of chassis>
Previous state was:
<State>
Processor sensor
status:
1603 Processor sensor
detected a warning
value
Sensor Location:
<status>
<Location in chassis>
Chassis Location:
<Name of chassis>
Previous state was:
<State>
Processor sensor
status:
<status>
Information A processor sensor in the
specified system transitioned
back to a normal state.
The sensor location, chassis
location, previous state and
processor sensor status
are provided.
Warning A processor sensor in the
specified system is in a
throttled state. The sensor
location, chassis location,
previous state and processor
sensor status are provided.
Event Message Reference 49
Page 50

Table 2-13. Processor Sensor Messages (continued)
Event IDDescription Severity Cause
1604 Processor sensor
detected a failure
value
Sensor Location:
<Location in chassis>
Chassis Location:
<Name of chassis>
Previous state was:
<State>
Processor sensor
status:
1605 Processor sensor
detected a nonrecoverable value
Sensor Location:
<status>
<Location in chassis>
Chassis Location:
<Name of chassis>
Previous state was:
<State>
Processor sensor
status:
<status>
Error A processor sensor in the
specified system is disabled,
has a configuration error, or
experienced a thermal trip.
The sensor location, chassis
location, previous state and
processor sensor status
are provided.
Error A processor sensor in the
specified system has failed.
The sensor location, chassis
location, previous state and
processor sensor status
are provided.
50 Event Message Reference
Page 51

Pluggable Device Messages
The pluggable device messages listed in Table 2-14 provide status and error
information when some devices, such as memory cards, are added or removed.
Table 2-14. Pluggable Device Messages
Event IDDescription Severity Cause
1650 <Device plug event
type unknown>
Device location:
<Location in chassis,
if available>
Chassis location:
<Name of chassis,
if available>
Additional details:
<Additional details
for the events,
if available>
1651 Device added to
system
Device location:
<Location in
chassis>
Chassis location:
<Name of chassis>
Additional details:
<Additional details
for the events>
Information A pluggable device event message
of unknown type was received.
The device location, chassis
location, and additional event
details, if available, are provided.
Information A device was added in the
specified system. The device
location, chassis location,
and additional event details,
if available, are provided.
Event Message Reference 51
Page 52

Table 2-14. Pluggable Device Messages (continued)
Event IDDescription Severity Cause
1652 Device removed from
system
Device location:
<Location in
chassis>
Chassis location:
<Name of
chassis>
Additional details:
<Additional details
for the events>
1653 Device configuration
error
detected
Device location:
<Location in
chassis>
Chassis location:
<Name of
chassis>
Additional details:
<Additional details
for the events>
Information A device was removed from the
specified system. The device
location, chassis location,
and additional event details,
if available, are provided.
Error A configuration error was
detected for a pluggable device
in the specified system.
The device may have been
added to the system incorrectly.
52 Event Message Reference
Page 53

Battery Sensor Messages
Battery sensors monitor how well a battery is functioning. Battery messages
listed in Table 2-15 provide status and warning information for batteries in a
particular chassis.
Table 2-15. Battery Sensor Messages
Event IDDescription Severity Cause
1700 Battery sensor has failed
Sensor location: <Location in
chassis>
Chassis location: <Name of
chassis>
Previous state was: <State>
Battery sensor status:
<status>
1701 Battery sensor value unknown
Sensor Location:
<Location in
chassis>
Chassis Location:
<Name of
chassis>
Previous state was:
Battery sensor status:
<State>
<status>
1702 Battery sensor returned to a
normal value
Sensor Location:
<Location in
chassis>
Chassis Location:
<Name of
chassis>
Previous state was:
Battery sensor status:
<State>
<status>
Critical/
Failure/
Error
Warning A battery sensor in
Information A battery sensor in
A battery sensor in
the specified system
is not functioning.
The sensor location,
chassis location,
previous state, and
battery sensor status
are provided.
the specified system
could not retrieve a
reading. The sensor
location, chassis
location, previous
state, and battery
sensor status are
provided.
the specified system
detected that a
battery transitioned
back to a normal
state. The sensor
location, chassis
location, previous
state, and battery
sensor status are
provided.
Event Message Reference 53
Page 54

Table 2-15. Battery Sensor Messages (continued)
Event IDDescription Severity Cause
1703 Battery sensor detected a
warning value
Sensor Location:
<Location in
chassis>
Chassis Location:
<Name of
chassis>
Previous state was:
Battery sensor status:
<State>
<status>
1704 Battery sensor detected a
failure value
Sensor Location:
<Location in
chassis>
Chassis Location:
<Name of
chassis>
Previous state was:
Battery sensor status:
<State>
<status>
1705 Battery sensor detected a
non-recoverable value
Sensor Location:
<Location in
chassis>
Chassis Location:
<Name of
chassis>
Previous state was:
Battery sensor status:
<State>
<status>
Warning A battery sensor in
the specified system
detected that
a battery is in
a predictive failure
state. The sensor
location, chassis
location, previous
state, and battery
sensor status are
provided.
Error A battery sensor in
the specified system
detected that
a battery has failed.
The sensor location,
chassis location,
previous state, and
battery sensor status
are provided.
Error A battery sensor in
the specified system
detected that a
battery has failed.
The sensor location,
chassis location,
previous state, and
battery sensor status
are provided.
54 Event Message Reference
Page 55

Chassis Management Controller Messages
Alerts sent by Dell™ M1000e Chassis Management Controller (CMC) are
organized by severity. That is, the event ID of the CMC trap indicates the
severity (informational, warning, critical, or non-recoverable) of the alert.
Each CMC alert includes the originating system name, location, and event
message text. The alert message text matches the corresponding Chassis
Event Log message text that is logged by the sending CMC for that event.
Table 2-16. Chassis Management Controller Messages
EventID Description Severity Cause
2000 CMC generated a
test trap
2002 CMC reported a
return-to-normal
or informational
2003 CMC reported a
warning
2004 CMC reported a
critical event
2005 CMC reported a
non-recoverable
event
Informational A user-initiated test trap
was issued, through the
CMC GUI or RACADM
CLI.
Informational CMC informational
event, as described in the
drsCAMessage variable
binding supplied with
the alert.
Warning CMC warning event, as
described in the
drsCAMessage variable
supplied with the alert.
Critical CMC critical event, as
described in the
drsCAMessage variable
binding supplied with
the alert.
Non-Recoverable CMC non-recoverable
event, as described in the
drsCAMessage variable
binding supplied with
the alert.
Event Message Reference 55
Page 56

56 Event Message Reference
Page 57

System Event Log Messages for IPMI Systems
The tables in this chapter list the system event log (SEL) messages,
their severity, and cause.
NOTE: For corrective actions, see the appropriate documentation.
Temperature Sensor Events
The temperature sensor event messages help protect critical components by
alerting the systems management console when the temperature rises inside
the chassis. These event messages use additional variables, such as sensor
location, chassis location, previous state, and temperature sensor value or state.
Table 3-1. Temperature Sensor Events
Event Message Severity Cause
<
Sensor Name/Location
temperature sensor
detected a failure
Reading
<
Name/Location
entity that this sensor
is monitoring. For
example, "PROC Temp" or
"Planar Temp."
Reading is specified in
degree Celsius. For
example 100 C.
<Sensor Name/Location
temperature sensor
detected a warning
Reading
<
> where <
> is the
>.
>
Sensor
>
Critical Temperature of the backplane
board, system board, or the carrier
in the specified system <Sensor
Name/Location> exceeded the
critical threshold.
Warning Temperature of the backplane
board, system board, or the carrier
in the specified system <Sensor
Name/Location> exceeded the
non-critical threshold.
System Event Log Messages for IPMI Systems 57
Page 58

Table 3-1. Temperature Sensor Events (continued)
Event Message Severity Cause
<
Sensor Name/Location>
temperature sensor
returned to warning state
Reading
<
Sensor Name/Location
<
temperature sensor
returned to normal state
Reading
<
>.
>.
Warning Temperature of the backplane
board, system board, or the carrier
in the specified system <Sensor
Name/Location> returned from
critical state to non-critical state.
Information Temperature of the backplane
>
board, system board, or the carrier
in the specified system <Sensor
Name/Location> returned to
normal operating range.
Voltage Sensor Events
The voltage sensor event messages monitor the number of volts across critical
components. These messages provide status and warning information for
voltage sensors for a particular chassis.
Table 3-2. Voltage Sensor Events
Event Message Severity Cause
<Sensor Name/Location>
voltage sensor detected
a failure <Reading> where
<Sensor Name/Location> is
the entity that this sensor
is monitoring.
Reading is specified in
volts.
For example, 3.860 V.
<Sensor Name/Location>
voltage sensor state
asserted.
<Sensor Name/Location>
voltage sensor state
de-asserted.
Critical The voltage of the monitored
device has exceeded the critical
threshold.
Critical The voltage specified by
<Sensor Name/Location> is in
critical state.
Information The voltage of a previously
reported
<Sensor Name/Location> is
returned to normal state.
58 System Event Log Messages for IPMI Systems
Page 59

Table 3-2. Voltage Sensor Events (continued)
Event Message Severity Cause
<Sensor Name/Location>
voltage sensor detected a
warning <Reading>.
<Sensor Name/Location>
voltage sensor returned to
normal <Reading>.
Warning Voltage of the monitored
entity
<Sensor Name/Location>
exceeded the warning
threshold.
Information The voltage of a previously
reported
<Sensor Name/Location> is
returned to normal state.
Fan Sensor Events
The cooling device sensors monitor how well a fan is functioning.
These messages provide status warning and failure messages for fans for a
particular chassis.
Table 3-3. Fan Sensor Events
Event Message Severity Cause
<
Sensor Name/Location
Fan sensor detected a
failure <
where <
Location
entity that this
sensor is monitoring.
For example "BMC Back
Fan" or "BMC Front
Fan."
Reading is specified
in RPM. For example,
100 RPM.
Reading
Sensor Name/
> is the
<Sensor Name/Location
Fan sensor returned to
normal state
Reading
<
>.
>
>
Critical The speed of the specified <Sensor
Name/Location> fan is not sufficient
to provide enough cooling to the
system.
Information The fan specified by <Sensor Name/
>
Location> has returned to its normal
operating speed.
System Event Log Messages for IPMI Systems 59
Page 60

Table 3-3. Fan Sensor Events (continued)
Event Message Severity Cause
<
Sensor Name/Location
Fan sensor detected a
warning <
Sensor Name/Location
<
Fan Redundancy sensor
redundancy degraded.
<
Sensor Name/Location
Fan Redundancy sensor
redundancy lost.
<Sensor Name/Location>
Fan Redundancy sensor
redundancy regained
Reading
>.
>
Warning The speed of the specified <Sensor
Name/Location> fan may not be
sufficient to provide enough cooling
to the system.
>
Information The fan specified by <Sensor Name/
Location> may have failed and hence,
the redundancy has been degraded.
>
Critical The fan specified by <Sensor Name/
Location> may have failed and hence,
the redundancy that was degraded
previously has been lost.
Information The fan specified by <Sensor Name/
Location> may have started
functioning again and hence, the
redundancy has been regained.
60 System Event Log Messages for IPMI Systems
Page 61

Processor Status Events
The processor status messages monitor the functionality of the processors in a
system. These messages provide processor health and warning information of
a system.
Table 3-4. Processor Status Events
Event Message Severity Cause
<
Processor Entity
processor sensor IERR,
where <
is the processor that
generated the event. For
example, PROC for a single
processor system and PROC
# for multiprocessor
system.
Processor Entity
<
processor sensor Thermal
Trip.
Processor Entity
<
status processor sensor
recovered from IERR.
Processor Entity
<
processor sensor disabled.
<
Processor Entity
processor sensor
terminator not present.
Processor Entity
<Processor Entity>
presence was deasserted.
<Processor Entity>
presence was asserted.
> status
>
> status
>
> status
> status
Critical IERR internal error generated by
the <Processor Entity>.
This event is generated due to
processor internal error.
Critical The processor generates this
event before it shuts down
because of excessive heat caused
by lack of cooling or heat
synchronization.
Information This event is generated when a
processor recovers from the
internal error.
Warning This event is generated for all
processors that are disabled.
Information This event is generated if the
terminator is missing on an
empty processor slot.
Critical This event is generated when the
system could not detect the
processor.
Information This event is generated when the
earlier processor detection error
was corrected.
System Event Log Messages for IPMI Systems 61
Page 62

Table 3-4. Processor Status Events (continued)
Event Message Severity Cause
<Processor Entity>
thermal tripped
was deasserted.
<Processor Entity>
configuration error
was asserted.
<Processor Entity>
configuration error
was deasserted.
<Processor Entity>
throttled was asserted.
<Processor Entity>
throttled was deasserted.
Information This event is generated when the
processor has recovered from an
earlier thermal condition.
Critical This event is generated when the
processor configuration is
incorrect.
Information This event is generated when the
earlier processor configuration
error was corrected.
Warning This event is generated when the
processor slows down to prevent
overheating.
Information This event is generated when the
earlier processor throttled event
was corrected.
Power Supply Events
The power supply sensors monitor the functionality of the power supplies.
These messages provide status and warning information for power supplies
for a particular system.
Table 3-5. Power Supply Events
Event Message Severity Cause
<Power Supply Sensor
Name> power supply sensor
removed.
<Power Supply Sensor
Name> power supply sensor
AC recovered.
<Power Supply Sensor
Name> power supply sensor
returned to normal state.
Critical This event is generated when the
power supply sensor is removed.
Information This event is generated when the
power supply has been replaced.
Information This event is generated when the
power supply that failed or
removed was replaced and the
state has returned to normal.
62 System Event Log Messages for IPMI Systems
Page 63

Table 3-5. Power Supply Events (continued)
Event Message Severity Cause
<Entity Name> PS
Redundancy
sensor redundancy
degraded.
<Entity Name> PS
Redundancy
sensor redundancy lost.
<Entity Name> PS
Redundancy
sensor redundancy
Information Power supply redundancy
is degraded if one of the
power supply sources is
removed or failed.
Critical Power supply redundancy is lost
if only one power supply is
functional.
Information This event is generated if the
power supply has been
reconnected or replaced.
regained.
<Power Supply Sensor
Name>
was asserted
predictive failure
<Power Supply Sensor
Name>
asserted
<
Name
was deasserted
<
Name
deasserted
input lost was
Power Supply Sensor
> predictive failure
Power Supply Sensor
> input lost was
Critical This event is generated when the
power supply is about to fail.
Critical This event is generated when the
power supply is unplugged.
Information This event is generated when the
power supply has recovered from
an earlier predictive failure event.
Information This event is generated when the
power supply is plugged in.
System Event Log Messages for IPMI Systems 63
Page 64

Memory ECC Events
The memory ECC event messages monitor the memory modules in a system.
These messages monitor the ECC memory correction rate and the type of
memory events that occurred.
Table 3-6. Memory ECC Events
Event Message Severity Cause
ECC error correction
detected on Bank #
DIMM [A/B].
ECC uncorrectable
error detected on
Bank # [DIMM].
Correctable memory
error logging
disabled.
Information This event is generated when there is a
memory error correction on a particular
Dual Inline Memory Module (DIMM).
Critical This event is generated when the
chipset is unable to correct the memory
errors. Usually, a bank number is
provided and DIMM may or may not be
identifiable, depending on the error.
Critical This event is generated when the
chipset in the ECC error correction rate
exceeds a predefined limit.
BMC Watchdog Events
The BMC watchdog operations are performed when the system hangs or
crashes. These messages monitor the status and occurrence of these events in
a system.
Table 3-7. BMC Watchdog Events
Event Message Severity Cause
BMC OS Watchdog timer
expired.
BMC OS Watchdog
performed system
reboot.
Information This event is generated when the
BMC watchdog timer expires and no
action is set.
Critical This event is generated when the
BMC watchdog detects that the
system has crashed (timer expired
because no response was received
from Host) and the action is set
to reboot.
64 System Event Log Messages for IPMI Systems
Page 65

Table 3-7. BMC Watchdog Events (continued)
Event Message Severity Cause
BMC OS Watchdog
performed system power
off.
BMC OS Watchdog
performed system
power cycle.
Critical This event is generated when the
BMC watchdog detects that the
system has crashed (timer expired
because no response was received
from Host) and the action is set to
power off.
Critical This event is generated when the
BMC watchdog detects that the
system has crashed (timer expired
because no response was received
from Host) and the action is set to
power cycle.
Memory Events
The memory modules can be configured in different ways in
particular systems. These messages monitor the status, warning,
and configuration information about the memory modules in the system.
Table 3-8. Memory Events
Event Message Severity Cause
Memory RAID
redundancy
degraded.
Memory RAID
redundancy lost.
Memory RAID
redundancy
regained
Memory Mirrored
redundancy
degraded.
Warning This event is generated when there is
a memory failure in a RAID-configured
memory configuration.
Critical This event is generated when redundancy
is lost in a
RAID-configured memory configuration.
Information This event is generated when the
redundancy lost or degraded earlier is
regained in a RAID-configured
memory configuration.
Warning This event is generated when there is
a memory failure in a mirrored
memory configuration.
System Event Log Messages for IPMI Systems 65
Page 66

Table 3-8. Memory Events (continued)
Event Message Severity Cause
Memory Mirrored
redundancy lost.
Memory Mirrored
redundancy
regained.
Memory Spared
redundancy
degraded.
Memory Spared
redundancy lost.
Memory Spared
redundancy
regained.
Critical This event is generated when redundancy is
lost in a mirrored memory configuration.
Information This event is generated when the
redundancy lost or degraded earlier is
regained in a mirrored
memory configuration.
Warning This event is generated when there is
a memory failure in a spared
memory configuration.
Critical This event is generated when redundancy is
lost in a spared memory configuration.
Information This event is generated when the
redundancy lost or degraded earlier is
regained in a spared memory configuration.
Hardware Log Sensor Events
The hardware logs provide hardware status messages to the system
management software. On particular systems, the subsequent hardware
messages are not displayed when the log is full. These messages provide status
and warning messages when the logs are full.
Table 3-9. Hardware Log Sensor Events
Event Message Severity Cause
Log full
detected.
Log cleared. Information This event is generated when the SEL
Critical This event is generated when the SEL device
detects that only one entry can be added to
the SEL before it is full.
is cleared.
66 System Event Log Messages for IPMI Systems
Page 67

Drive Events
The drive event messages monitor the health of the drives in a system.
These events are generated when there is a fault in the drives indicated.
Table 3-10. Drive Events
Event Message Severity Cause
Drive <
fault state.
Drive <
fault state.
Drive
drive presence was asserted
Drive
predictive failure was
asserted
Drive
predictive failure was
deasserted
Drive
hot spare was asserted
Drive <Drive #>
hot spare was deasserted
Drive
consistency check in
progress was asserted
Drive
consistency check in
progress was deasserted
Drive #
Drive #
<Drive #>
<Drive #>
<Drive #>
<Drive #>
<Drive #>
<Drive #>
> asserted
> de-asserted
Critical This event is generated
when the specified drive in
the array is faulty.
Information This event is generated
when the specified drive
recovers from a faulty
condition.
Informational This event is generated
when the drive is installed.
Warning This event is generated
when the drive is about to
fail.
Informational This event is generated
when the drive from earlier
predictive failure is
corrected.
Warning This event is generated
when the drive is placed in
a hot spare.
Informational This event is generated
when the drive is taken out
of hot spare.
Warning This event is generated
when the drive is placed in
consistency check.
Informational This event is generated
when the consistency
check of the drive is
completed.
System Event Log Messages for IPMI Systems 67
Page 68

Table 3-10. Drive Events (continued)
Event Message Severity Cause
Drive
in critical array was
asserted
Drive
in critical array was
deasserted
Drive
in failed array was asserted
Drive
in failed array was
deasserted
Drive
rebuild in progress was
asserted
Drive
rebuild aborted was asserted
<Drive #>
<Drive #>
<Drive #>
<Drive #>
<Drive #>
<Drive #>
Critical This event is generated
when the drive is placed in
critical array.
Informational This event is generated
when the drive is removed
from critical array.
Critical This event is generated
when the drive is placed in
the fail array.
Informational This event is generated
when the drive is removed
from the fail array.
Informational This event is generated
when the drive is
rebuilding.
Warning This event is generated
when the drive rebuilding
process is aborted.
Intrusion Events
The chassis intrusion messages are a security measure. Chassis intrusion
alerts are generated when the system's chassis is opened. Alerts are sent to
prevent unauthorized removal of parts from the chassis.
Table 3-11. Intrusion Events
Event Message Severity Cause
<Intrusion sensor
Name> sensor detected
an intrusion.
<Intrusion sensor
Name> sensor returned
to normal state.
68 System Event Log Messages for IPMI Systems
Critical This event is generated when the
intrusion sensor detects an intrusion.
Information This event is generated when the
earlier intrusion has been corrected.
Page 69

Table 3-11. Intrusion Events (continued)
Event Message Severity Cause
<Intrusion sensor
sensor intrusion
Name>
was asserted while
system was ON
<Intrusion sensor
sensor intrusion
Name>
was asserted while
system was OFF
Critical This event is generated when the
intrusion sensor detects an intrusion
while the system is on.
Critical This event is generated when the
intrusion sensor detects an intrusion
while the system is off.
BIOS Generated System Events
The BIOS-generated messages monitor the health and functionality of the
chipsets, I/O channels, and other BIOS-related functions.
Table 3-12. BIOS Generated System Events
Event Message Severity Cause
System Event I/O channel
chk.
System Event PCI Parity
Err.
System Event Chipset Err.
System Event PCI System
Err.
System Event PCI Fatal
Err.
Critical This event is generated when a
critical interrupt is generated in
the
I/O Channel.
Critical This event is generated when a
parity error is detected on the
PCI bus.
Critical This event is generated when a
chip error is detected.
Information This event indicates historical
data, and is generated when the
system has crashed and
recovered.
Critical This error is generated when a
fatal error is detected on the PCI
bus.
System Event Log Messages for IPMI Systems 69
Page 70

Table 3-12. BIOS Generated System Events (continued)
Event Message Severity Cause
System Event PCIE Fatal
Err.
POST Err Critical This event is generated when an
POST fatal error #<number>
or <error description>
Memory Spared
redundancy lost
Memory Mirrored
redundancy lost
Memory RAID
redundancy lost
Err Reg Pointer
OEM Diagnostic data event
was asserted
System Board PFault Fail
Safe state asserted
System Board PFault Fail
Safe state deasserted
Critical This error is generated when a
fatal error is detected on the
PCIE bus.
error occurs during system boot.
See the system documentation
for more information on the
error code.
Critical This event is generated when a
fatal error occurs during system
boot. See “Table 3-13” for more
information.
Critical This event is generated when
memory spare is no longer
redundant.
Critical This event is generated when
memory mirroring is no longer
redundant.
Critical This event is generated when
memory RAID is no longer
redundant.
Information This event is generated when an
OEM event occurs. OEM events
can be used by Dell™ service
team to better understand the
cause of the failure.
Critical This event is generated when
the system board voltages are
not at normal levels.
Information This event is generated when
earlier PFault Fail Safe system
voltages return to a normal level.
70 System Event Log Messages for IPMI Systems
Page 71

Table 3-12. BIOS Generated System Events (continued)
Event Message Severity Cause
Memory Add
(BANK# DIMM#) presence was
asserted
Memory Removed
(BANK# DIMM#) presence was
asserted
Memory Cfg Err
configuration error (BANK#
DIMM#) was asserted
Mem Redun Gain
redundancy regained
Mem ECC Warning
transition to non-critical
from OK
Mem ECC Warning
transition to critical
from less severe
Mem CRC Err
transition to
non-recoverable
Mem Fatal SB CRC
uncorrectable ECC was
asserted
Mem Fatal NB CRC
uncorrectable ECC was
asserted
Mem Overtemp
critical over temperature
was asserted
Information This event is generated when
memory is added to the system.
Information This event is generated when
memory is removed from the
system.
Critical This event is generated when
memory configuration is
incorrect for the system.
Information This event is generated when
memory redundancy is regained.
Warning This event is generated when
correctable ECC errors have
increased from a normal rate.
Critical This event is generated when
correctable ECC errors reach a
critical rate.
Critical This event is generated
when CRC errors enter a
non-recoverable state.
Critical This event is generated when
CRC errors occur while storing
to memory.
Critical This event is generated when
CRC errors occur while
removing from memory.
Critical This event is generated when
system memory reaches critical
temperature.
System Event Log Messages for IPMI Systems 71
Page 72

Table 3-12. BIOS Generated System Events (continued)
Event Message Severity Cause
USB Over-current
transition to
non-recoverable
Hdwr version err hardware
incompatibility
(BMC/iDRAC Firmware and
CPU mismatch) was asserted
Hdwr version err hardware
incompatibility(BMC /iDRAC
Firmware and CPU mismatch)
was deasserted
SBE Log Disabled
correctable memory error
logging disabled was
asserted
CPU Protocol Err
transition to
non-recoverable
CPU Bus PERR
transition to
non-recoverable
CPU Init Err
transition to
non-recoverable
CPU Machine Chk
transition to
non-recoverable
Logging Disabled
all event logging
disabled was asserted
Critical This event is generated when
the USB exceeds a predefined
current level.
Critical This event is generated when
there is a mismatch between
the BMC and iDRAC firmware
and the processor in use
or vice versa.
Information This event is generated when
the earlier mismatch between
the BMC and iDRAC firmware
and the processor is corrected.
Critical This event is generated when
the ECC single bit error rate is
exceeded.
Critical This event is generated when
the processor protocol enters a
non-recoverable state.
Critical This event is generated when
the processor bus PERR enters a
non-recoverable state.
Critical This event is generated when
the processor initialization
enters a non-recoverable state.
Critical This event is generated when
the processor machine check
enters a non-recoverable state.
Critical This event is generated when all
event logging is disabled.
72 System Event Log Messages for IPMI Systems
Page 73

Table 3-12. BIOS Generated System Events (continued)
Event Message Severity Cause
LinkT/FlexAddr: Link
Tuning sensor, device
option ROM failed to
support link tuning or
flex address (Mezz XX)
was asserted
LinkT/FlexAddr: Link
Tuning sensor, failed to
program virtual MAC
address (<location>) was
asserted.
PCIE NonFatal Er: Non
Fatal IO Group sensor,
PCIe error(<location>)
I/O Fatal Err: Fatal IO
Group sensor, fatal IO
error (<location>)
Unknown system event
sensor unknown system
hardware failure was
asserted
Critical This event is generated when
the PCI device option ROM for
a NIC does not support link
tuning or the Flex addressing
feature.
Critical This event is generated when
BIOS fails to program virtual
MAC address on the given
NIC device.
Warning This event is generated in
association with a CPU IERR.
Critical This event is generated in
association with a CPU IERR
and indicates the PCI/PCIe
device that caused the CPU
IERR.
Critical This event is generated when an
unknown hardware failure is
detected.
System Event Log Messages for IPMI Systems 73
Page 74

POST Code Table
Table 3-13 lists the POST Code errors that are generated when a fatal error
occurs during system boot.
Table 3-13. POST Code Errors
Fatal Error
Code
80 No memory detected This error code implies that no memory is
81 Memory detected but is
82 Memory configured but
83 System BIOS shadow failure This error code indicates system BIOS
84 CMOS failure This error code indicates that CMOS
85 DMA controller failure This error code indicates DMA controller
86 Interrupt controller failure This error code indicates interrupt
87 Timer refresh failure This error code indicates timer refresh
88 Programmable interval
89 Parity error This error code indicates a parity error.
8A SIO failure This error code indicates SIO failure.
8B Keyboard controller failure This error code indicates keyboard
8C SMI initialization failure This error code indicates SMI
Description Cause
installed.
This error code indicates memory
not configurable
not usable.
timer error
configuration error that could be result of
bad memory, mismatched memory or bad
socket.
This error code indicates memory
sub-system failure.
shadow failure.
RAM is not working.
failure.
controller failure.
failure.
This error code indicates a programmable
interval timer error.
controller failure.
initialization failure.
74 System Event Log Messages for IPMI Systems
Page 75

Table 3-13. POST Code Errors (continued)
Fatal Error
Code
C0 Shutdown test failure This error code indicates a shutdown
C1 POST Memory test failure This error code indicates bad memory
C2 RAC configuration failure Check screen for the actual error message
C3 CPU configuration failure Check screen for the actual error message
C4 Incorrect memory
FE General failure after video Check screen for the actual error message
Description Cause
test failure.
detection.
Memory population order not correct.
configuration
R2 Generated System Events
Table 3-14. R2 Generated Events
Description Severity Cause
System Event: OS stop
event OS graceful
shutdown detected
OEM Event data record
(after OS graceful
shutdown/restart event)
System Event: OS stop
event runtime critical
stop
OEM Event data record
(after OS bugcheck event)
Information The OS was shutdown/restarted
normally.
Information Comment string accompanying
an OS shutdown/restart.
Critical The OS encountered a critical
error and was stopped
abnormally.
Information OS bugcheck code and
paremeters.
System Event Log Messages for IPMI Systems 75
Page 76

Cable Interconnect Events
The cable interconnect messages are used for detecting errors in the hardware
cabling.
Table 3-15. Cable Interconnect Events
Description Severity Cause
Cable sensor <Name/
Location>
Configuration error was
asserted.
Cable sensor <Name/
Location>
Connection was asserted.
Critical This event is generated when
the cable is not connected or
is incorrectly connected.
Information This event is generated when
the earlier cable connection
error was corrected.
Battery Events
Table 3-16. Battery Events
Description Severity Cause
<Battery sensor Name/
Location>
Failed was asserted
<Battery sensor Name/
Location>
Failed was deasserted
<Battery sensor Name/
Location>
is low was asserted
<Battery sensor Name/
Location>
is low was deasserted
Critical This event is generated when
the sensor detects a failed or
missing battery.
Information This event is generated when
the earlier failed battery was
corrected.
Warning This event is generated when
the sensor detects a low battery
condition.
Information This event is generated when
the earlier low battery condition
was corrected.
76 System Event Log Messages for IPMI Systems
Page 77

Power And Performance Events
The power and performance events are used to detect degradation in system
performance with change in power supply.
Table 3-17. Power And Performance Events
Description Severity Cause
System Board Power
Optimized:
Performance status
sensor for System
Board, degraded,
<description of
why> was
deasserted
System Board Power
Optimized:
Performance status
sensor for System
Board, degraded,
<description of
why> was asserted
Normal This event is generated when
system performance was
restored.
Warning This event is generated when
change in power supply
degrades system
performance.
Entity Presence Events
The entity presence messages are used for detecting different
hardware devices.
Table 3-18. Entity Presence Events
Description Severity Cause
<Device Name>
presence was
asserted
<Device Name>
absent was asserted
Information This event is generated when the device
was detected.
Critical This event is generated when the device
was not detected.
System Event Log Messages for IPMI Systems 77
Page 78

78 System Event Log Messages for IPMI Systems
Page 79

Storage Management Message Reference
The Dell™ OpenManage™ Server Administrator Storage Management’s alert
or event management features let you monitor the health of storage resources
such as controllers, enclosures, physical disks, and virtual disks.
Alert Monitoring and Logging
The Storage Management Service performs alert monitoring and logging.
By default, the Storage Management Service starts when the managed system
starts up. If you stop the Storage Management Service, then alert monitoring
and logging stops. Alert monitoring does the following:
• Updates the status of the storage object that generated the alert.
• Propagates the storage object’s status to all the related higher objects in
the storage hierarchy. For example, the status of a lower-level object will be
Health
propagated up to the status displayed on the
Storage
• Logs an alert in the Alert log and the operating system (OS) application log.
• Sends an SNMP trap if the operating system’s SNMP service is installed
and enabled.
NOTE: Dell OpenManage Server Administrator Storage Management does not log
alerts regarding the data I/O path. These alerts are logged by the respective RAID
drivers in the system alert log.
See the Dell OpenManage Server Administrator Storage Management Online
Help for updated information.
object.
tab for the top-level
Storage Management Message Reference 79
Page 80

Alert Message Format with Substitution Variables
When you view an alert in the Server Administrator alert log, the alert identifies
the specific components such as the controller name or the virtual disk name to
which the alert applies. In an actual operating environment, a storage system
can have many combinations of controllers and disks as well as user-defined
names for virtual disks and other components. Because each environment is
unique in its storage configuration and user-defined names, an accurate alert
message requires that the Storage Management Service be able to insert the
environment-specific names of storage components into an alert message.
This environment-specific information is inserted after the alert message text
as shown for alert 2127 in Table 4-1.
For other alerts, the alert message text is constructed from information
passed directly from the controller (or another storage component) to the
Alert Log. In these cases, the variable information is represented with a%
(percent sign) in the Storage Management documentation. An example of
such an alert is shown for alert 2334 in Table 4-1.
Table 4-1. Alert Message Format
Alert ID Message Text Displayed in the
Storage Management Service
Documentation
2127 Background Initialization
started
2334 Controller event log% Controller event log: Current capacity of the
Message Text Displayed in the Alert Log with
Variable Information Supplied
Background Initialization started: Virtual
Disk 3 (Virtual Disk 3) Controller 1
(PERC 5/E Adapter)
battery is above threshold.: Controller 1
(PERC 5/E Adapter)
The variables required to complete the message vary depending on the type
of storage object and whether the storage object is in a SCSI or SAS
configuration. The following table identifies the possible variables used to
identify each storage object.
NOTE: Some alert messages relating to an enclosure or an enclosure component,
such as a fan or EMM, are generated by the controller when the enclosure or
enclosure component ID cannot be determined.
80 Storage Management Message Reference
Page 81

Table 4-2. Message Format with Variables for Each Storage Object
Storage Object Message Variables
A, B, C and X, Y, Z in the following examples are variables
representing the storage object name or number.
Controller Message Format: Controller A (Name)
Message Format: Controller A
Example: 2326 A foreign configuration has been detected.:
Controller 1 (PERC 5/E Adapter)
NOTE: The controller name is not always displayed.
Battery Message Format: Battery X Controller A
Example: 2174 The controller battery has been removed: Battery 0
Controller 1
SCSI Physical
Disk
SAS Physical
Disk
Virtual Disk Message Format: Virtual Disk X (Name) Controller A (Name)
Message Format: Physical Disk X:Y Controller A, Connector B
Example: 2049 Physical disk removed: Physical Disk 0:14
Controller 1, Connector 0
Message Format: Physical Disk X:Y:Z Controller A, Connector B
Example: 2049 Physical disk removed: Physical Disk 0:0:14
Controller 1, Connector 0
Message Format: Virtual Disk X Controller A
Example: 2057 Virtual disk degraded: Virtual Disk 11
(Virtual Disk 11) Controller 1 (PERC 5/E Adapter)
NOTE: The virtual disk and controller names are not always displayed.
Enclosure: Message Format: Enclosure X:Y Controller A, Connector B
Example: 2112 Enclosure shutdown: Enclosure 0:2 Controller 1,
Connector 0
SCSI Power
Supply
Message Format: Power Supply X Controller A, Connector B,
Target ID C
where "C" is the SCSI ID number of the enclosure management
module (EMM) managing the power supply.
Example: 2122 Redundancy degraded: Power Supply 1,
Controller 1, Connector 0, Target ID 6
Storage Management Message Reference 81
Page 82

Table 4-2. Message Format with Variables for Each Storage Object (continued)
Storage Object Message Variables
A, B, C and X, Y, Z in the following examples are variables
representing the storage object name or number.
SAS Power
Supply
SCSI
Temperature
Probe
SAS
Temperature
Probe
SCSI Fan Message Format: Fan X Controller A, Connector B, Target ID C
SAS Fan Message Format: Fan X Controller A, Connector B, Enclosure C
Message Format: Power Supply X Controller A, Connector B,
Enclosure C
Example: 2312 A power supply in the enclosure has an AC failure.:
Power Supply 1, Controller 1, Connector 0, Enclosure 2
Message Format: Temperature Probe X Controller A, Connector B,
Target ID C
where "C" is the SCSI ID number of the EMM managing the
temperature probe.
Example: 2101 Temperature dropped below the minimum
warning threshold: Temperature Probe 1, Controller 1, Connector 0,
Target ID 6
Message Format: Temperature Probe X Controller A, Connector B,
Enclosure C
Example: 2101 Temperature dropped below the minimum warning
threshold: Temperature Probe 1, Controller 1, Connector 0,
Enclosure 2
where "C" is the SCSI ID number of the EMM managing the fan.
Example: 2121 Device returned to normal: Fan 1, Controller 1,
Connector 0, Target ID 6
Example: 2121 Device returned to normal: Fan 1, Controller 1,
Connector 0, Enclosure 2
82 Storage Management Message Reference
Page 83

Table 4-2. Message Format with Variables for Each Storage Object (continued)
Storage Object Message Variables
A, B, C and X, Y, Z in the following examples are variables
representing the storage object name or number.
SCSI EMM Message Format: EMM X Controller A, Connector B, Target ID C
where "C" is the SCSI ID number of the EMM.
Example: 2121 Device returned to normal: EMM 1, Controller 1,
Connector 0, Target ID 6
SAS EMM Message Format: EMM X Controller A, Connector B, Enclosure C
Example: 2121 Device returned to normal: EMM 1, Controller 1,
Connector 0, Enclosure 2
Alert Message Change History
The following table describes the changes made to the Storage Management
alerts from the previous release of Storage Management to the current release.
Table 4-3. Alert Message Change History
Alert Message Change History
Storage Management 3.1 Comments
Product Versions
to which
Changes Apply
New Alerts 2370, 2383, 2384, 2385, 2386
Deleted Alerts 2206 and 2207
Storage Management 3.1
Server Administrator 6.1
Dell OpenManage 6.1
Storage Management Message Reference 83
Page 84

Table 4-3. Alert Message Change History (continued)
Alert Message Change History
Modified Alerts 2060, 2075, 2087, 2125, 2192,
2200, 2250, 2261, 2287, 2289,
2293, 2294, 2295, 2327, 2367,
Documentation
Change
Storage Management 3.0.2 Comments
Product Versions
to which
Changes Apply
New Alerts 2382
Documentation updated to
reflect changes in 2060, 2075,
2087, 2125,
2261,2287, 2289, 2293, 2294,
2295, 2327, 2367
Storage Management 3.0.2
Server Administrator 6.0.1
Dell OpenManage 6.0.1
2192, 2200, 2250,
• The SNMP trap numbers were
changed for these alerts.
• Related alert information and
descriptions were modified.
• The SNMP trap number was
changed for these alerts.
• Related alert information and
descriptions were modified.
Alert Descriptions and Corrective Actions
The following sections describe alerts generated by the RAID or SCSI
controllers supported by Storage Management. The alerts are displayed in the
Server Administrator Alert subtab or through Windows Event Viewer. These
alerts can also be forwarded as SNMP traps to other applications.
SNMP traps are generated for the alerts listed in the following sections.
These traps are included in the Dell OpenManage Server Administrator
Storage Management management information base (MIB). The SNMP
traps for these alerts use all of the SNMP trap variables. For more information
on SNMP support and the MIB, see the Dell OpenManage SNMP Reference
Guide.
To locate an alert, scroll through the following table to find the alert number
displayed on the Server Administrator Alert tab or search this file for the alert
message text or number. See "Understanding Event Messages" for more
information on severity levels.
For more information regarding alert descriptions and the appropriate
corrective actions, see the online help.
84 Storage Management Message Reference
Page 85

Table 4-4. Storage Management Messages
EventIDDescription Severity Cause and Action Related Alert
Information
2048 Device failed Critical /
Failure / Error
Cause: A storage
component such as
a physical disk or an
enclosure has failed.
The failed component
may have been
identified by the
controller while
performing a task such
as a rescan or a check
consistency.
Action: Replace the
failed component.
You can identify which
disk has failed by
locating the disk that
has a red “X” for its
status. Perform a rescan
after replacing the
failed component.
Clear Alert
Number:
2121.
Related Alert
Number:
2095, 2201,
2203
LRA Number:
2051, 2061,
2071, 2081,
2091, 2101
SNMP
Tr ap
Numbers
754
804
854
904
954
1004
1054
1104
1154
1204
Storage Management Message Reference 85
Page 86

Table 4-4. Storage Management Messages (continued)
EventIDDescription Severity Cause and Action Related Alert
Information
2049 Physical disk
removed
Warning /
Non-critical
Cause: A physical disk
has been removed
from the disk group.
This alert can also be
caused by loose or
defective cables or by
problems with the
enclosure.
Action: If a physical disk
was removed from the
disk group, either replace
the disk or restore the
original disk. On some
controllers, a removed
disk has a red "X" for its
status. On other
controllers, a removed
disk may have an
Offline status or is not
displayed on the user
interface. Perform a
rescan after replacing or
restoring the disk. If a
disk has not been
removed from the disk
group, then check for
problems with the cables.
See the
online help
more information on
checking
Make sure that the
enclosure is powered on.
If the problem persists,
check the enclosure
documentation for
further diagnostic
information.
the cables.
for
Clear Alert
Number:
2052.
Related Alert
Number:
2054, 2057,
2056, 2076,
2079, 2081,
2083, 2129,
2202, 2204,
2270, 2292,
2299, 2369
LRA Number:
2070
SNMP
Tr ap
Numbers
903
86 Storage Management Message Reference
Page 87

Table 4-4. Storage Management Messages (continued)
EventIDDescription Severity Cause and Action Related Alert
Information
2050 Physical disk
offline
2051 Physical disk
degraded
Warning /
Non-critical
Warning /
Non-critical
Cause: A physical disk
in the disk group is
offline. The user may
have manually put the
physical disk offline.
Action: Perform a
rescan. You can also
select the offline disk
and perform a Make
Online operation.
Cause: A physical disk
has reported an error
condition and may be
degraded. The physical
disk may have reported
the error condition in
response to
a consistency check or
other operation.
Action: Replace the
degraded physical disk.
You can identify which
disk is degraded by
locating the disk that
has a red "X" for its
status. Perform a rescan
after replacing the disk.
Clear Alert
Number:
2158.
Related Alert
Number:
2099, 2196
LRA Number:
2070
Clear Alert
Number:
None.
Related Alert
Number: 2070
LRA Number:
None.
SNMP
Tr ap
Numbers
903
903
Storage Management Message Reference 87
Page 88

Table 4-4. Storage Management Messages (continued)
EventIDDescription Severity Cause and Action Related Alert
Information
2052 Physical disk
inserted
2053 Virtual disk
created
2054 Virtual disk
deleted
OK / Normal /
Informational
OK / Normal /
Informational
Warning /
Non-critical
Cause: This alert is for
informational purposes.
Action: None
Cause: This alert is for
informational purposes.
Action: None
Cause: A virtual disk
has been deleted.
Performing a Reset
Configuration may
detect that a virtual disk
has been deleted and
generate this alert.
Action: None
Clear Alert
Number:
None.
Related Alert
Number:
2065, 2305,
2367
LRA Number:
None.
Clear Alert
Number:
None.
Related Alert
Number:
None.
LRA Number:
None.
Clear Alert
Number:
None.
Related Alert
Number:
None.
LRA Number:
2080
SNMP
Tr ap
Numbers
901
1201
1203
88 Storage Management Message Reference
Page 89

Table 4-4. Storage Management Messages (continued)
EventIDDescription Severity Cause and Action Related Alert
Information
2055 Virtual disk
configuration
changed
2056 Virtual disk
failed
OK / Normal /
Informational
Critical /
Failure / Error
Cause: This alert is for
informational purposes.
Action: None
Cause: One or more
physical disks included in
the virtual disk have
failed. If the virtual disk
is non-redundant (does
not use mirrored or parity
data), then the failure of
a single physical disk can
cause the virtual disk to
fail. If the virtual disk is
redundant, then more
physical disks have failed
than can be rebuilt using
mirrored or parity
information.
Create a new
Action:
virtual disk and restore
from a backup.
The disk controller
rebuilds the virtual disk
by first configuring a
hot spare for the disk,
and then initiating a
write operation to the
disk. The write
operation will initiate a
rebuild of the disk.
Clear Alert
Number:
None.
Related Alert
Number:
None.
LRA Number:
None.
Clear Alert
Number:
None.
Related Alert
Number:
2048, 2049,
2050, 2076,
2079, 2081,
2129, 2346
LRA Number:
2081
SNMP
Tr ap
Numbers
1201
1204
Storage Management Message Reference 89
Page 90

Table 4-4. Storage Management Messages (continued)
EventIDDescription Severity Cause and Action Related Alert
Information
2057 Virtual disk
degraded
Warning /
Non-critical
Cause 1: This alert
message occurs when a
physical disk included
in a redundant virtual
disk fails. Because the
virtual disk is redundant
(uses mirrored or parity
information) and only
one physical disk has
failed, the virtual disk
can be rebuilt.
Action 1: Configure a
hot spare for the virtual
disk if one is not already
configured. Rebuild the
virtual disk. When
using an Expandable
RAID Controller
(PERC) PERC 3/SC, 3/
DCL, 3/DC, 3/QC, 4/
SC, 4/DC, 4e/DC, 4/Di,
CERC ATA100/4ch,
PERC 5/E, PERC 5/i or
a Serial Attached SCSI
(SAS) 5/iR controller,
rebuild the virtual disk
by first configuring a
hot spare for the disk,
and then initiating a
write operation to the
disk. The write
operation will initiate a
rebuild of the disk.
Clear Alert
Number:
None.
Related Alert
Number:
2048, 2049,
2050, 2076,
2079, 2081,
2123, 2129,
2346
LRA Number:
2080
SNMP
Tr ap
Numbers
1203
90 Storage Management Message Reference
Page 91

Table 4-4. Storage Management Messages (continued)
EventIDDescription Severity Cause and Action Related Alert
Information
2057
contd.
2058 Virtual disk
check
consistency
started
2059 Virtual disk
format
started
OK / Normal /
Informational
OK / Normal /
Informational
Cause 2: A physical disk
in the disk group has
been removed.
Action 2: If a physical
disk was removed from
the disk group, either
replace the disk or
restore the original disk.
You can identify which
disk has been removed
by locating the disk that
has a red “X” for its
status. Perform a rescan
after replacing the disk.
Cause: This alert is for
informational purposes.
Action: None
Cause: This alert is for
informational purposes.
Action: None
Clear Alert
Number:
2085.
Related Alert
Number:
None.
LRA Number:
None.
Clear Alert
Number:
2086.
Related Alert
Number:
None.
LRA Number:
None.
SNMP
Tr ap
Numbers
1201
1201
Storage Management Message Reference 91
Page 92

Table 4-4. Storage Management Messages (continued)
EventIDDescription Severity Cause and Action Related Alert
Information
2060 Copy of data
started on
physical
disk 1 from
physical
disk 2.
2061 Virtual disk
initialization
started
2062 Physical disk
initialization
started
OK / Normal /
Informational
OK / Normal /
Informational
OK / Normal /
Informational
Cause: This alert is for
informational purposes.
Action: None
Cause: This alert is for
informational purposes.
Action: None
Cause: This alert is for
informational purposes.
Action: None.
Clear Alert
Number:
None.
Related Alert
Number: 2075
LRA Number:
None.
Clear Alert
Number:
2088.
Related Alert
Number:
None.
LRA Number:
None.
Clear Alert
Number:
2089.
Related Alert
Number:
None.
LRA Number:
None.
SNMP
Tr ap
Numbers
901
1201
901
92 Storage Management Message Reference
Page 93

Table 4-4. Storage Management Messages (continued)
EventIDDescription Severity Cause and Action Related Alert
Information
2063 Virtual disk
reconfigurati
on started
2064 Virtual disk
rebuild
started
2065 Physical disk
rebuild
started
OK / Normal /
Informational
OK / Normal /
Informational
OK / Normal /
Informational
Cause: This alert is for
informational purposes.
Action: None
Cause: This alert is for
informational purposes.
Action: None
Cause: This alert is for
informational purposes.
Action: None
Clear Alert
Number:
2090.
Related Alert
Number:
None.
LRA Number:
None.
Clear Alert
Number:
2091.
Related Alert
Number:
None.
LRA Number:
None.
Clear Alert
Number:
2092.
Related Alert
Number:
2099, 2121,
2196
LRA Number:
None.
SNMP
Tr ap
Numbers
1201
1201
901
Storage Management Message Reference 93
Page 94

Table 4-4. Storage Management Messages (continued)
EventIDDescription Severity Cause and Action Related Alert
Information
2067 Virtual disk
check
consistency
cancelled
OK / Normal /
Informational
Cause: The check
consistency operation
was cancelled because a
physical disk in the
array has failed or
because a user cancelled
the check consistency
operation.
Action: If the physical
disk failed, then replace
the physical disk. You
can identify which disk
failed by locating the
disk that has a red “X”
for its status. Perform
a rescan after replacing
the disk. When
performing a
consistency check,
be aware that the
consistency check can
take a long time.
The time it takes
depends on the size of
the physical disk or
the virtual disk.
Clear Alert
Number:
None.
Related Alert
Number:
None.
LRA Number:
None.
SNMP
Tr ap
Numbers
1201
94 Storage Management Message Reference
Page 95

Table 4-4. Storage Management Messages (continued)
EventIDDescription Severity Cause and Action Related Alert
Information
2070 Virtual disk
initialization
cancelled
2074 Physical disk
rebuild
cancelled
OK / Normal /
Informational
OK / Normal /
Informational
Cause: The virtual disk
initialization cancelled
because a physical disk
included in the virtual
disk has failed or
because a user cancelled
the virtual disk
initialization.
Action: If a physical
disk failed, then replace
the physical disk. You
can identify which disk
has failed by locating
the disk that has a
red “X” for its status.
Perform a rescan after
replacing the disk.
Restart the format
physical disk operation.
Restart the virtual disk
initialization.
Cause: The user has
cancelled the rebuild
operation.
Action: Restart the
rebuild operation.
Clear Alert
Number:
None.
Related Alert
Number:
None.
LRA Number:
None.
Clear Alert
Number:
None.
Related Alert
Number:
None.
LRA Number:
None.
SNMP
Tr ap
Numbers
1201
901
Storage Management Message Reference 95
Page 96

Table 4-4. Storage Management Messages (continued)
EventIDDescription Severity Cause and Action Related Alert
Information
2075 Copy of data
completed
on physical
disk %2 from
physical disk
%1
2076 Virtual disk
Check
Consistency
failed
OK / Normal /
Informational
Critical /
Failure / Error
Cause: This alert is
provided for
informational purposes.
Action: None
Cause: A physical disk
included in the virtual
disk failed or there is an
error in the parity
information. A failed
physical disk can cause
errors in parity
information.
Action: Replace the
failed physical disk. You
can identify which disk
has failed by locating
the disk that has a red
“X” for its status.
Rebuild the physical
disk. When finished,
restart the check
consistency operation.
Clear Alert
Number:
None.
Related Alert
Number:
2060.
LRA Number:
None
Clear Alert
Number:
None.
Related Alert
Number:
None.
LRA Number:
2081
SNMP
Tr ap
Numbers
901
1204
96 Storage Management Message Reference
Page 97

Table 4-4. Storage Management Messages (continued)
EventIDDescription Severity Cause and Action Related Alert
Information
2077 Virtual disk
format failed
Critical /
Failure / Error
Cause: A physical disk
included in the virtual
disk failed.
Action: Replace the
failed physical disk. You
can identify which
physical disk has failed
by locating the disk that
has a red "X" for its
Clear Alert
Number:
None.
Related Alert
Number:
None.
LRA Number:
2081
status. Rebuild the
physical disk. When
finished, restart the
virtual disk format
operation.
2079 Virtual disk
initialization
failed
2080 Physical disk
initialization
failed
Critical /
Failure / Error
Critical /
Failure / Error
Cause: A physical disk
included in the virtual
disk has failed or a user
has cancelled the
initialization.
Action: If a physical
disk has failed, then
replace the physical
disk.
Cause: The physical
disk has failed or is
corrupt.
Action: Replace the
failed or corrupt disk.
You can identify a disk
that has failed by
locating the disk that
has a red “X” for its
Clear Alert
Number:
None.
Related Alert
Number:
None.
LRA Number:
2081
Clear Alert
Number:
None.
Related Alert
Number:
None.
LRA Number:
2071
status. Restart the
initialization.
SNMP
Tr ap
Numbers
1204
1204
904
Storage Management Message Reference 97
Page 98

Table 4-4. Storage Management Messages (continued)
EventIDDescription Severity Cause and Action Related Alert
Information
2081 Virtual disk
reconfigurati
on failed
2082 Virtual disk
rebuild failed
Critical /
Failure / Error
Critical /
Failure / Error
Cause: A physical disk
included in the virtual
disk has failed or is
corrupt. A user may also
have cancelled
the reconfiguration.
Action: Replace the
failed or corrupt disk.
You can identify a disk
that has failed by
locating the disk that
has a red “X” for its
status.
If the physical disk is
part of a redundant
array, then rebuild the
physical disk. When
finished, restart
the reconfiguration.
Cause: A physical disk
included in the virtual
disk has failed or is
corrupt. A user may also
have cancelled
the rebuild.
Action: Replace the
failed or corrupt disk.
You can identify a disk
that has failed by
locating the disk that
has a red “X” for its
status. Restart the
virtual disk rebuild.
Clear Alert
Number:
None.
Related Alert
Number:
None.
LRA Number:
2081
Clear Alert
Number:
None.
Related Alert
Number: 2048
LRA Number:
2081
SNMP
Tr ap
Numbers
1204
1204
98 Storage Management Message Reference
Page 99

Table 4-4. Storage Management Messages (continued)
EventIDDescription Severity Cause and Action Related Alert
Information
2083 Physical disk
rebuild failed
2085 Virtual disk
check
consistency
completed
2086 Virtual disk
format
completed
Critical /
Failure / Error
OK / Normal /
Informational
OK / Normal /
Informational
Cause: A physical disk
included in the virtual
disk has failed or is
corrupt. A user may also
have cancelled the
rebuild.
Action: Replace the
failed or corrupt disk.
You can identify a disk
that has failed by
locating the disk that
has a red “X” for its
status. Rebuild the
virtual disk rebuild.
Cause: This alert is for
informational purposes.
Action: None
Cause: This alert is for
informational purposes.
Action: None
Clear Alert
Number:
None.
Related Alert
Number:
None.
LRA Number:
2071
Clear Alert
Status: Alert
2085 is a clear
alert for alert
2058.
Related Alert
Number:
None.
LRA Number:
None.
Clear Alert
Status: Alert
2086 is a clear
alert for alert
2059.
Related Alert
Number:
None.
LRA Number:
None.
SNMP
Tr ap
Numbers
904
1201
1201
Storage Management Message Reference 99
Page 100

Table 4-4. Storage Management Messages (continued)
EventIDDescription Severity Cause and Action Related Alert
Information
2087 Copy of data
resumed
from
physical
disk %2 to
physical
disk %1
2088 Virtual disk
initialization
completed
2089 Physical disk
initialization
completed
OK / Normal /
Informational
OK / Normal /
Informational
OK / Normal /
Informational
Cause: This alert is for
informational purposes.
Action: None
Cause: This alert is for
informational purposes.
Action: None
Cause: This alert is for
informational purposes.
Action: None
Clear Alert
Status: None
Related Alert
Number: 260.
LRA Number:
None.
Clear Alert
Status: Alert
2088 is a clear
alert for alerts
2061 and
2136.
Related Alert
Number:
None.
LRA Number:
None.
Clear Alert
Status: Alert
2089 is a clear
alert for alert
2062.
Related Alert
Number:
None.
LRA Number:
None.
SNMP
Tr ap
Numbers
901
1201
901
100 Storage Management Message Reference
 Loading...