

Page 1

Dell OpenManage™
Server Administrator
Version 2.3
Command Line Interface
User's Guide
www.dell.com | support.dell.com
Page 2

Notes and Notices
NOTE: A NOTE indicates important information that helps you make better use of your computer.
NOTICE: A NOTICE indicates either potential damage to hardware or loss of data and tells you how to avoid the problem.
____________________
Information in this document is subject to change without notice.
© 2005 Dell Inc. All rights reserved.
Reproduction in any manner whatsoever without the written permission of Dell Inc. is strictly forbidden.
Trademarks used in this text: Dell, the DELL logo, PowerEdge, and Dell OpenManage are trademarks of Dell Inc.; Microsoft, Windows,
MS-DOS, and Windows NT are registered trademarks and Windows Server is a trademark of Microsoft Corporation; Red Hat is a registered
trademark of Red Hat, Inc.; Intel, P entium, and Xeon are registered trademarks and Itanium and Intel386 are trademarks of Intel Corporation;
VESA is a registered trademark of Video Electronic Standards Association; UNIX is a registered trademark of The Open Group in the United
States and other countries; OS/2 is a registered trademark of International Business Machines Corporation.
Other trademarks and trade names may be used in this document to refer to either the entities claiming the marks and names or their products.
Dell Inc. disclaims any proprietary interest in trademarks and trade names other than its own.
November 2005
Page 3

Contents
1 Introduction . . . . . . . . . . . . . . . . . . . . . . . . . . . . . . . . . 11
What's New for Version 2.3 . . . . . . . . . . . . . . . . . . . . . . . . . . . 11
Using CLI Commands from Windows Command Prompts
Primary CLI Commands
CLI Error Checking and Error Messages
Success Messages
Failure Messages
Scripting and Comparing With the CLI
Command Syntax Overview
. . . . . . . . . . . . . . . . . . . . . . . . . . . . . 12
. . . . . . . . . . . . . . . . . . . . . 13
. . . . . . . . . . . . . . . . . . . . . . . . . . . . . 13
. . . . . . . . . . . . . . . . . . . . . . . . . . . . . . 14
. . . . . . . . . . . . . . . . . . . . . 15
. . . . . . . . . . . . . . . . . . . . . . . . . . . 15
. . . . . . . . . . . . 11
2 omhelp: Getting Help With CLI Commands . . . . . . . . . . . . 17
Example Help Commands . . . . . . . . . . . . . . . . . . . . . . . . . . . . 17
3 omdiag: Using the Diagnostic Service . . . . . . . . . . . . . . . 19
omdiag about. . . . . . . . . . . . . . . . . . . . . . . . . . . . . . . . . . . 21
omdiag about details=true
omdiag chassis
. . . . . . . . . . . . . . . . . . . . . . . . . . . . . . . . . . 22
omdiag chassis -?
omdiag chassis cmos
omdiag chassis memory
omdiag chassis modem
omdiag chassis network
omdiag chassis parallelport
omdiag chassis pci
omdiag chassis rac
omdiag chassis serialport
omdiag chassis usbctrl
. . . . . . . . . . . . . . . . . . . . . . . . . . . . 22
. . . . . . . . . . . . . . . . . . . . . . . . . . . . . . 22
. . . . . . . . . . . . . . . . . . . . . . . . . . . . 22
. . . . . . . . . . . . . . . . . . . . . . . . . . 23
. . . . . . . . . . . . . . . . . . . . . . . . . . . 23
. . . . . . . . . . . . . . . . . . . . . . . . . . 24
. . . . . . . . . . . . . . . . . . . . . . . . 26
. . . . . . . . . . . . . . . . . . . . . . . . . . . . . 27
. . . . . . . . . . . . . . . . . . . . . . . . . . . . . 28
. . . . . . . . . . . . . . . . . . . . . . . . . 28
. . . . . . . . . . . . . . . . . . . . . . . . . . . 29
Contents 3
Page 4

omdiag storage. . . . . . . . . . . . . . . . . . . . . . . . . . . . . . . . . . 29
omdiag storage -?
omdiag storage cddvd
omdiag storage floppy
omdiag storage idedevdiag
omdiag storage raidctrl
omdiag storage sasdevdiag
omdiag storage scsidevdiag
. . . . . . . . . . . . . . . . . . . . . . . . . . . . . . 29
. . . . . . . . . . . . . . . . . . . . . . . . . . . 29
. . . . . . . . . . . . . . . . . . . . . . . . . . . 30
. . . . . . . . . . . . . . . . . . . . . . . . . 31
. . . . . . . . . . . . . . . . . . . . . . . . . . . 31
. . . . . . . . . . . . . . . . . . . . . . . . 33
. . . . . . . . . . . . . . . . . . . . . . . . 34
omdiag system
omdiag system -?
. . . . . . . . . . . . . . . . . . . . . . . . . . . . . . . . . . 35
. . . . . . . . . . . . . . . . . . . . . . . . . . . . . . 35
4 omreport: Viewing System Status Using the
Instrumentation Service
Conventions for Parameter Tables. . . . . . . . . . . . . . . . . . . . . . . . 37
omreport Command Summary
Help With the omreport Command
omreport about
omreport chassis Commands
omreport chassis
omreport chassis acswitch
omreport chassis bios
omreport chassis biossetup
omreport chassis bmc
omreport chassis currents
omreport chassis fans
omreport chassis fancontrol
omreport chassis firmware
omreport chassis frontpanel
omreport chassis fru
omreport chassis info
omreport chassis intrusion
omreport chassis leds
omreport chassis memory
omreport chassis nics
omreport chassis ports
omreport chassis processors
. . . . . . . . . . . . . . . . . . . . . . . . . . . . . . . . . . 41
. . . . . . . . . . . . . . . . . . . . . . . . . . . . . . 42
. . . . . . . . . . . . . . . . . . . . . . . . . 37
. . . . . . . . . . . . . . . . . . . . . . . . . . 37
. . . . . . . . . . . . . . . . . . . . . . . . 41
. . . . . . . . . . . . . . . . . . . . . . . . . . 42
. . . . . . . . . . . . . . . . . . . . . . . . . 43
. . . . . . . . . . . . . . . . . . . . . . . . . . . 43
. . . . . . . . . . . . . . . . . . . . . . . . 44
. . . . . . . . . . . . . . . . . . . . . . . . . . . 45
. . . . . . . . . . . . . . . . . . . . . . . . . 46
. . . . . . . . . . . . . . . . . . . . . . . . . . . 46
. . . . . . . . . . . . . . . . . . . . . . . . 46
. . . . . . . . . . . . . . . . . . . . . . . . . 46
. . . . . . . . . . . . . . . . . . . . . . . . 47
. . . . . . . . . . . . . . . . . . . . . . . . . . . . 47
. . . . . . . . . . . . . . . . . . . . . . . . . . . . 47
. . . . . . . . . . . . . . . . . . . . . . . . . 48
. . . . . . . . . . . . . . . . . . . . . . . . . . . 49
. . . . . . . . . . . . . . . . . . . . . . . . . 49
. . . . . . . . . . . . . . . . . . . . . . . . . . . 50
. . . . . . . . . . . . . . . . . . . . . . . . . . . 50
. . . . . . . . . . . . . . . . . . . . . . . . 51
4 Contents
Page 5

omreport chassis pwrsupplies . . . . . . . . . . . . . . . . . . . . . . . 53
omreport chassis slots
omreport chassis temps
omreport chassis volts
. . . . . . . . . . . . . . . . . . . . . . . . . . . 53
. . . . . . . . . . . . . . . . . . . . . . . . . . 53
. . . . . . . . . . . . . . . . . . . . . . . . . . . 54
omreport system Commands
omreport system
Commands for Viewing Logs
omreport system alertaction
omreport system assetinfo
omreport system events
omreport system operatingsystem
omreport system pedestinations
omreport system platformevents
omreport system recovery
omreport system shutdown
omreport system summary
omreport system thrmshutdown
omreport system version
. . . . . . . . . . . . . . . . . . . . . . . . . . . 54
. . . . . . . . . . . . . . . . . . . . . . . . . . . . . . 54
. . . . . . . . . . . . . . . . . . . . . . . . 55
. . . . . . . . . . . . . . . . . . . . . . . . 55
. . . . . . . . . . . . . . . . . . . . . . . . . 56
. . . . . . . . . . . . . . . . . . . . . . . . . . 57
. . . . . . . . . . . . . . . . . . . . . 58
. . . . . . . . . . . . . . . . . . . . . . 58
. . . . . . . . . . . . . . . . . . . . . . 59
. . . . . . . . . . . . . . . . . . . . . . . . . 59
. . . . . . . . . . . . . . . . . . . . . . . . . 59
. . . . . . . . . . . . . . . . . . . . . . . . . 60
. . . . . . . . . . . . . . . . . . . . . . 63
. . . . . . . . . . . . . . . . . . . . . . . . . . 64
5 omreport storage: Using the Storage Reports. . . . . . . . . . 65
Conventions for Parameter Tables. . . . . . . . . . . . . . . . . . . . . . . . 65
omreport storage Command Summary
omreport storage Commands
omreport storage arraydisks
omreport storage arrays
omreport storage enclosureinfo
omreport storage enclosures
omreport storage osdiskinfo
omreport storage osdisks
omreport storage volumes
. . . . . . . . . . . . . . . . . . . . . . 65
. . . . . . . . . . . . . . . . . . . . . . . . . . 66
. . . . . . . . . . . . . . . . . . . . . . . . 67
. . . . . . . . . . . . . . . . . . . . . . . . . . 68
. . . . . . . . . . . . . . . . . . . . . . 70
. . . . . . . . . . . . . . . . . . . . . . . . 71
. . . . . . . . . . . . . . . . . . . . . . . . 71
. . . . . . . . . . . . . . . . . . . . . . . . . . 73
. . . . . . . . . . . . . . . . . . . . . . . . . 74
6 omconfig: Managing Components Using the
Instrumentation Service
Conventions for Parameter Tables. . . . . . . . . . . . . . . . . . . . . . . . 75
omconfig Command Summary
. . . . . . . . . . . . . . . . . . . . . . . . . 75
. . . . . . . . . . . . . . . . . . . . . . . . . . 76
Contents 5
Page 6

Help With the omconfig Command . . . . . . . . . . . . . . . . . . . . . . . 78
omconfig about
omconfig chassis
. . . . . . . . . . . . . . . . . . . . . . . . . . . . . . . . . . 79
. . . . . . . . . . . . . . . . . . . . . . . . . . . . . . . . 80
omconfig chassis biossetup
omconfig chassis bmc
omconfig chassis currents
omconfig chassis fans
omconfig chassis fancontrol
omconfig chassis frontpanel
omconfig chassis info
. . . . . . . . . . . . . . . . . . . . . . . . . . . . 94
omconfig chassis leds
omconfig chassis memorymode
omconfig chassis temps
omconfig chassis volts
omconfig preferences
. . . . . . . . . . . . . . . . . . . . . . . . . . . . . . 98
omconfig preferences cdvformat
omconfig preferences dirservice
omconfig preferences snmp
omconfig preferences useraccess
omconfig system
. . . . . . . . . . . . . . . . . . . . . . . . . . . . . . . . 101
omconfig system alertaction
Commands for Clearing Logs
omconfig system pedestinations
omconfig system platformevents
omconfig system events
omconfig system webserver
omconfig system recovery
omconfig system shutdown
omconfig system thrmshutdown
. . . . . . . . . . . . . . . . . . . . . . . . 80
. . . . . . . . . . . . . . . . . . . . . . . . . . . 85
. . . . . . . . . . . . . . . . . . . . . . . . . 91
. . . . . . . . . . . . . . . . . . . . . . . . . . . 92
. . . . . . . . . . . . . . . . . . . . . . . . 93
. . . . . . . . . . . . . . . . . . . . . . . . 94
. . . . . . . . . . . . . . . . . . . . . . . . . . . 95
. . . . . . . . . . . . . . . . . . . . . . 95
. . . . . . . . . . . . . . . . . . . . . . . . . . 96
. . . . . . . . . . . . . . . . . . . . . . . . . . . 97
. . . . . . . . . . . . . . . . . . . . . . 98
. . . . . . . . . . . . . . . . . . . . . . 98
. . . . . . . . . . . . . . . . . . . . . . . . 99
. . . . . . . . . . . . . . . . . . . . 100
. . . . . . . . . . . . . . . . . . . . . . . 101
. . . . . . . . . . . . . . . . . . . . . . . 104
. . . . . . . . . . . . . . . . . . . . . 104
. . . . . . . . . . . . . . . . . . . . . 105
. . . . . . . . . . . . . . . . . . . . . . . . . 107
. . . . . . . . . . . . . . . . . . . . . . . 108
. . . . . . . . . . . . . . . . . . . . . . . . 109
. . . . . . . . . . . . . . . . . . . . . . . . 109
. . . . . . . . . . . . . . . . . . . . . 110
7 omconfig system assetinfo: Editing Cost of
6 Contents
Ownership Values
. . . . . . . . . . . . . . . . . . . . . . . . . . . . 111
omconfig System Asset Info Overview . . . . . . . . . . . . . . . . . . . . 111
User Level Required for Adding Asset Information
Adding Acquisition Information
. . . . . . . . . . . . . . . . . . . . . . . . 111
Example Commands for Adding Acquisition Information
. . . . . . . . . . . . 111
. . . . . . . . 112
Page 7

Adding Depreciation Information . . . . . . . . . . . . . . . . . . . . . . . 113
Example Commands for Adding Depreciation Information
. . . . . . . . 113
Adding Extended Warranty Information
. . . . . . . . . . . . . . . . . . . . 114
Example Command for Adding Extended Warranty Information
Adding Lease Information
Example Command for Adding Lease Information
Adding Maintenance Information
. . . . . . . . . . . . . . . . . . . . . . . . . . . 115
. . . . . . . . . . . . 115
. . . . . . . . . . . . . . . . . . . . . . . 116
Example Command for Adding Maintenance Information
Adding Outsource Information
. . . . . . . . . . . . . . . . . . . . . . . . . 117
Example Command for Adding Outsource Information
Adding Owner Information
Example Command for Adding Owner Information
Adding Service Contract Information
. . . . . . . . . . . . . . . . . . . . . . . . . . . 118
. . . . . . . . . . . . 118
. . . . . . . . . . . . . . . . . . . . . 119
Example Command for Adding Service Information
Adding Support Information
. . . . . . . . . . . . . . . . . . . . . . . . . . 120
Example Command for Adding Support Information
Adding System Information
. . . . . . . . . . . . . . . . . . . . . . . . . . 121
Example Command for Adding System Information
Adding Warranty Information
. . . . . . . . . . . . . . . . . . . . . . . . . 122
Example Command for Adding Warranty Information
. . . . . 114
. . . . . . . . 116
. . . . . . . . . . 117
. . . . . . . . . . . 119
. . . . . . . . . . . 120
. . . . . . . . . . . 121
. . . . . . . . . . 122
8 Using the Storage Management Service . . . . . . . . . . . . 123
CLI Command Syntax. . . . . . . . . . . . . . . . . . . . . . . . . . . . . . 123
Syntax for Required, Optional, and Variable Command Elements
User Privileges for omreport storage and omconfig storage
omreport Command
. . . . . . . . . . . . . . . . . . . . . . . . . . . . . . 126
. . . . . . 124
. . . . . . . . . 126
Contents 7
Page 8

omreport Storage Help. . . . . . . . . . . . . . . . . . . . . . . . . . . . . 126
omreport Controller Status
omreport Global Information (Smart Thermal Shutdown Status)
omreport Battery Status
omreport Connector Status
omreport Enclosure Status
omreport Temperature Probe Status
omreport Fan Status
omreport Power Supply Status
omreport EMM Status
omreport Array Disk Status
omreport Virtual Disk Status
. . . . . . . . . . . . . . . . . . . . . . . . 127
. . . . 127
. . . . . . . . . . . . . . . . . . . . . . . . . 127
. . . . . . . . . . . . . . . . . . . . . . . . 128
. . . . . . . . . . . . . . . . . . . . . . . . 128
. . . . . . . . . . . . . . . . . . . 129
. . . . . . . . . . . . . . . . . . . . . . . . . . . 129
. . . . . . . . . . . . . . . . . . . . . . 130
. . . . . . . . . . . . . . . . . . . . . . . . . . 130
. . . . . . . . . . . . . . . . . . . . . . . . 131
. . . . . . . . . . . . . . . . . . . . . . . 132
omconfig Global Commands
. . . . . . . . . . . . . . . . . . . . . . . . . . 132
omconfig Global Enable Smart Thermal Shutdown
omconfig Global Disable Smart Thermal Shutdown
omconfig Global Rescan Controller
omconfig Controller Commands
omconfig Rescan Controller
omconfig Global Rescan Controller
omconfig Enable Controller Alarm
omconfig Disable Controller Alarm
omconfig Quiet Controller Alarm
omconfig Test Controller Alarm
. . . . . . . . . . . . . . . . . . . . 133
. . . . . . . . . . . . . . . . . . . . . . . . 134
. . . . . . . . . . . . . . . . . . . . . . . 135
. . . . . . . . . . . . . . . . . . . . 135
. . . . . . . . . . . . . . . . . . . . 135
. . . . . . . . . . . . . . . . . . . . 136
. . . . . . . . . . . . . . . . . . . . . 136
. . . . . . . . . . . . . . . . . . . . . . 136
omconfig Reset Controller Configuration
omconfig Create Virtual Disk
omconfig Set Controller Rebuild Rate
. . . . . . . . . . . . . . . . . . . . . . . 137
. . . . . . . . . . . . . . . . . . 141
omconfig Set Background Initialization Rate
omconfig Set Reconstruct Rate
. . . . . . . . . . . . . . . . . . . . . 142
omconfig Set Check Consistency Rate
omconfig Export the Controller Log
. . . . . . . . . . . . . . . . . . . . 143
omconfig Import Foreign Configuration
omconfig Clear Foreign Configuration
omconfig Set Patrol Read Mode
omconfig Start Patrol Read
omconfig Stop Patrol Read
. . . . . . . . . . . . . . . . . . . . . . . . 144
. . . . . . . . . . . . . . . . . . . . . . . . 145
. . . . . . . . . . . . . . . . . . 144
. . . . . . . . . . . . . . . . . . . . . 144
. . . . . . . . . . . 132
. . . . . . . . . . . 133
. . . . . . . . . . . . . . . . . 137
. . . . . . . . . . . . . . . 142
. . . . . . . . . . . . . . . . . . 142
. . . . . . . . . . . . . . . . . 143
8 Contents
Page 9

omconfig Virtual Disk Commands . . . . . . . . . . . . . . . . . . . . . . . 145
omconfig Blink Virtual Disk
omconfig Unblink Virtual Disk
omconfig Initialize Virtual Disk
omconfig Cancel Initialize Virtual Disk
omconfig Fast Initialize Virtual Disk
omconfig Slow Initialize Virtualize Disk
omconfig Cancel Background Initialize
omconfig Restore Dead Segments
omconfig Split Mirror
omconfig Unmirror
omconfig Assign Dedicated Hot Spare
omconfig Unassign Dedicated Hot Spare
omconfig Check Consistency
omconfig Cancel Check Consistency
omconfig Pause Check Consistency
omconfig Resume Check Consistency
omconfig Delete Virtual Disk
omconfig Format Virtual Disk
omconfig Reconfiguring Virtual Disks
omconfig Change Virtual Disk Policy
omconfig Rename Virtual Disk
. . . . . . . . . . . . . . . . . . . . . . . . 146
. . . . . . . . . . . . . . . . . . . . . . 146
. . . . . . . . . . . . . . . . . . . . . . 147
. . . . . . . . . . . . . . . . . . 147
. . . . . . . . . . . . . . . . . . . 147
. . . . . . . . . . . . . . . . . 148
. . . . . . . . . . . . . . . . . 148
. . . . . . . . . . . . . . . . . . . . 148
. . . . . . . . . . . . . . . . . . . . . . . . . . . 149
. . . . . . . . . . . . . . . . . . . . . . . . . . . . 149
. . . . . . . . . . . . . . . . . . 150
. . . . . . . . . . . . . . . . 150
. . . . . . . . . . . . . . . . . . . . . . . 151
. . . . . . . . . . . . . . . . . . . 152
. . . . . . . . . . . . . . . . . . . 152
. . . . . . . . . . . . . . . . . . 153
. . . . . . . . . . . . . . . . . . . . . . . 153
. . . . . . . . . . . . . . . . . . . . . . . 154
. . . . . . . . . . . . . . . . . . 154
. . . . . . . . . . . . . . . . . . . 155
. . . . . . . . . . . . . . . . . . . . . . 155
omconfig Array Disk Commands
omconfig Blink Array Disk
. . . . . . . . . . . . . . . . . . . . . . . . 156
. . . . . . . . . . . . . . . . . . . . . . . . 156
omconfig Unblink Array Disk
omconfig Prepare to Remove Array Disk
omconfig Initialize Array Disk
omconfig Offline Array Disk
omconfig Offline Array Disk
omconfig Online Array Disk
. . . . . . . . . . . . . . . . . . . . . . . . 159
. . . . . . . . . . . . . . . . . . . . . . . . 159
. . . . . . . . . . . . . . . . . . . . . . . . 160
omconfig Assign Global Hot Spare
omconfig Unassign Global Hot Spare
omconfig Rebuild Array Disk
omconfig Cancel Rebuild Array Disk
omconfig Remove Dead Segments
omconfig Clear Array Disk
. . . . . . . . . . . . . . . . . . . . . . . . 164
omconfig Cancel Clear Array Disk
. . . . . . . . . . . . . . . . . . . . . . . 157
. . . . . . . . . . . . . . . . . 157
. . . . . . . . . . . . . . . . . . . . . . . 158
. . . . . . . . . . . . . . . . . . . . 160
. . . . . . . . . . . . . . . . . . 161
. . . . . . . . . . . . . . . . . . . . . . . 162
. . . . . . . . . . . . . . . . . . . 162
. . . . . . . . . . . . . . . . . . . . 163
. . . . . . . . . . . . . . . . . . . . 164
Contents 9
Page 10

omconfig Battery Commands . . . . . . . . . . . . . . . . . . . . . . . . . 165
omconfig Recondition Battery
omconfig Start Battery Learn Cycle
omconfig Delay Battery Learn Cycle
. . . . . . . . . . . . . . . . . . . . . . 165
. . . . . . . . . . . . . . . . . . . 166
. . . . . . . . . . . . . . . . . . . 166
omconfig Connector Commands
omconfig Rescan Connector
omconfig Enclosure Commands
omconfig Enable Enclosure Alarm
omconfig Disable Enclosure Alarm
omconfig Enable Smart Thermal Shutdown
omconfig Disable Smart Thermal Shutdown
omconfig Set Enclosure Asset Tag
omconfig Set Enclosure Asset Name
omconfig Set Temperature Probe Thresholds
omconfig Reset Temperature Probe Thresholds
omconfig Set All Temperature Probe Thresholds
omconfig Reset All Temperature Probe Thresholds
omconfig Blink
. . . . . . . . . . . . . . . . . . . . . . . . . . . . . . 174
. . . . . . . . . . . . . . . . . . . . . . . . 167
. . . . . . . . . . . . . . . . . . . . . . . 167
. . . . . . . . . . . . . . . . . . . . . . . . 167
. . . . . . . . . . . . . . . . . . . . 168
. . . . . . . . . . . . . . . . . . . . 169
. . . . . . . . . . . . . . . 169
. . . . . . . . . . . . . . . 169
. . . . . . . . . . . . . . . . . . . . 170
. . . . . . . . . . . . . . . . . . . 170
. . . . . . . . . . . . . . 171
. . . . . . . . . . . . . 172
. . . . . . . . . . . . 172
. . . . . . . . . . . 173
9 Working With CLI Command Results . . . . . . . . . . . . . . . 175
Output Options for Command Results . . . . . . . . . . . . . . . . . . . . . 175
Controlling Command Output Display
Writing Command Output to a File
Selecting a Format for Your CLI Command Output
. . . . . . . . . . . . . . . . . . . 175
. . . . . . . . . . . . . . . . . . . . 175
. . . . . . . . . . . . 177
Glossary . . . . . . . . . . . . . . . . . . . . . . . . . . . . . . . . . . . . . 181
Index
10 Contents
. . . . . . . . . . . . . . . . . . . . . . . . . . . . . . . . . . . . . . . . 203
Page 11

Introduction
Whether you are using the graphical user interface (GUI) or the command line interface (CLI),
Server Administrator performs essential systems management tasks.
The reporting and viewing features allow retrieval of overall health status for systems on your
network. At the component level, you can view information about the voltages, temperatures,
current, fan RPM, memory functioning, and many other critical component details. You see a
detailed account of many relevant cost of ownership (COO) facts about your system in summary
view. Version information for BIOS, firmware, operating system, and all installed software is easy to
retrieve. You can also run diagnostic tests on system components.
Configuration features allow the Server Administrator to perform essential tasks described in detail
in the following sections.
NOTE: You can use the CLI instead of the Server Administrator home page, and turn the Server Administrator
Web server off if you have security concerns. The CLI does not use the Web server. Use the omconfig system
webserver action=stop command to turn off the Web server. The Web server starts automatically after a
reboot, so this command must be issued every time a system starts up. See "omconfig system webserver" for
more information.
What's New for Version 2.3
Added Serial Attached SCSI (SAS) support for Dell™ PowerEdge™ 6800 and 6850
Using CLI Commands from Windows Command Prompts
If you are running the Windows operating system, use the 32-bit command prompt to issue a Server
Administrator CLI command. You can access the 32–bit command prompt by clicking the Start
button and pointing to Programs→ Accessories→ Command Prompt shortcut, or by clicking the
Start button and selecting Run, then typing cmd.exe in the Run dialog box.
Do not type command into the Run dialog box to launch a command line window; this activates
the MS-DOS
subtle problems with the CLI.
®
emulator command.com, which has environment variable limitations that can cause
Introduction 11
Page 12

Primary CLI Commands
The commands that carry out the functions of Server Administrator are:
•
omconfig
•
omdiag
•
omhelp
•
omreport
The omconfig command writes values that you assign to an object's properties. You can specify values for
warning thresholds on components or prescribe what action your system is to take when a certain
warning or failure event occurs. You can also use the omconfig command to assign specific values to your
system's asset information parameters, such as the purchase price of the system, the system's asset tag, or
the system's location.
The omdiag command runs diagnostic tests against system hardware to isolate problems.
The omhelp command displays short text help for CLI commands. The shorthand equivalent of omhelp
is the command for which you want help followed by -?. For example, to display help for the omreport
command, type one of the following commands:
omhelp omreport
omreport -?
The omreport command produces reports of your system’s management information.
NOTE: For an overall summary of CLI commands, type omhelp.
Table 1-1 lists the primary CLI commands used by Server Administrator. This guide contains a section
for each primary command.
Table 1-1. CLI Commands and Sections in This Guide
Primary CLI
Command
omconfig omconfig: Managing Components
omdiag omdiag: Using the Diagnostic Service
omhelp omhelp: Getting Help With CLI
omreport omreport: Viewing System Status
Section Title Related Sections
Using the Instrumentation Service
Commands
Using the Instrumentation Service
12 Introduction
omconfig system assetinfo: Editing
Cost of Ownership Values
omconfig rac: Managing the Remote
Access Controller
omreport storage: Using the Storage
Reports
omreport rac: Viewing Remote Access
Controller Components
Page 13

NOTE: Omupdate commands are no longer supported in Server Administrator and are replaced by Dell Update
Package or Server Update Utility commands. To update the different components, download the Dell Update
Package and run <package name> /s [/f]. See the Dell Update Packages for Microsoft
Sy stems User’s Guide, the Dell Update Packages for Red Hat
Utility User’s Guide for more information on corresponding CLI syntax.
®
Enterprise Linux User’ s Guide, or the Server Update
®
Windows® Operating
Additional useful topics about the CLI include:
• Working With CLI Command Results
• Glossary
CLI Error Checking and Error Messages
The CLI checks your commands for correct syntax when you enter them. If you enter a command and
the command is executed successfully, a message displays, stating that your command has
been successful.
Success Messages
For a successful omreport command, data about the component displays. When data for the component
displays, your command is successful.
The following omconfig command examples show valid CLI commands and their success messages:
Command:
omconfig chassis temps index=0 warnthresh=default
Message:
Temperature probe warning threshold value(s) set successfully.
Command:
omconfig chassis biossetup attribute=speaker setting=on
Message:
BIOS setup configured successfully.
Command:
omconfig system assetinfo info=depreciation duration=6
Message:
Asset information set successfully.
Introduction 13
Page 14

Failure Messages
CLI failure messages provide reasons why some commands do not succeed. Some common reasons why
commands fail include syntax errors and components that are not present. Many error messages provide
syntax information that you can use to execute the command successfully.
If you try to execute a command for a component or feature that is not present in your system
configuration, the error message states that the component is not present.
Command:
omreport chassis currents
Example message:
Error! No current probes found on this system.
Command:
omconfig chassis volts index=3 minwarnthresh=3.3000
Example message:
Error! Number with up to 3 digits after decimal point expected,
read 3.3000
The value given by the command specifies more than 3 digits after the
decimal point. A valid minimum warning threshold value for volts
contains up to 3 digits after the decimal point.
Ty p e :
omconfig chassis volts index=3 minwarnthresh=3.300
When you enter the revised command with three decimal points, you receive another error message:
Error! This voltage probe min warning threshold must be between
11.400 and 12.480.
Revised command:
omconfig chassis volts index=3 minwarnthresh=11.500
Message:
Voltage probe warning threshold(s) set successfully.
14 Introduction
Page 15

Scripting and Comparing With the CLI
The Server Administrator CLI allows administrators to write batch programs or scripts to be executed by
the operating system. For an enterprise with many systems, an administrator could write a configuration
script that specified the warning thresholds for each major component of a system and also specified a
set of actions that the administrator wants each system to take in case of a warning or failure event. In
the most critical cases, the administrator could write a script so that the system shuts down to prevent
damage. The administrator could then distribute and execute the script to many managed systems at the
same time. Such a scenario facilitates configuring any number of new systems acquired by a company
and makes implementation of new system administration policies easier across many existing systems
that require reconfiguration.
A similar scenario could be used to populate a large number of newly acquired systems with detailed
asset information. Much of the information would be the same, such as the manufacturer or lessor of the
system, whether support for the system is outsourced, name of the system's insurance company, method
of depreciation, and so on. Any variable that is common to all systems could be scripted, sent to all
managed systems, and executed. Asset information that is unique to a system could be scripted as a
group and sent to that managed node for execution. For example, a script could specify values for all
unique variables such as owner, primary user phone number, asset tag, and so on. Scripts to populate
unique values would set all unique variables at once rather than one by one through the system's
command line.
In many cases, the CLI allows a user with a very well-defined task in mind to retrieve information about
the system rapidly. If a user wants to review a comprehensive summary of all system components and
save that summary information to a file for comparison with later system states, the CLI is ideal.
Using CLI commands, administrators can write batch programs or scripts to execute at specific times.
When these programs execute, they can capture reports on components of interest, such as fan RPMs
during periods of high system usage compared with the same measurements at times of lowest system
usage. Command results can be routed to a file for later analysis. Reports can help administrators gain
information that can be used to adjust usage patterns, to justify purchasing new system resources, or to
focus on the health of a problem component.
Command Syntax Overview
Commands vary in complexity. The simplest command has only command level 1. The omhelp
command is a simple command. When you type
The next level of complexity includes commands that contain command levels 1 and 2. All of the about
commands are examples of command level 2 complexity. The omconfig about, omdiag about, and
omreport about commands all cause a very brief summary to display. The summary shows version
information for the systems management software installed on your system; for example, Server
Administrator 1.x.
omhelp, a list of the main CLI commands is displayed.
Introduction 15
Page 16

Some commands have command level 1 and command level 2 and one name=value pair. Consider the
following example command that instructs Server Administrator for more details about the environment
for Server Administrator:
omreport about details=true
Command level 1 is omreport, command level 2 is about, and the name=value pair is
details=true.
Many commands use command level 1, command level 2, and command level 3, but do not require any
parameters (name=value pairs). Most omreport commands are of this type. For example:
omreport system alertaction
causes a list of alert actions that are configured for components on your system to be displayed.
The most complex commands have all three command levels and can have multiple name=value
pairs. An example of two name=value pairs:
omconfig system assetinfo info=depreciation duration=3
An example of nine name=value pairs:
omconfig system assetinfo info=acquisition
purchasecost=
<
mmddyy
> ponum=<n> signauth=<
expensed=<
<n> waybill=<n> installdate=<
text
>
yes | no
> costcenter=<
text
mmddyy
> purchasedate=
>
In each section, command syntax and other information about commands is formatted with any of the
following fields that apply:
command level 1 command level 2 command level 3 name=value pair 1 name=value pair 2
16 Introduction
Page 17

omhelp: Getting Help With CLI Commands
The omhelp command and its equivalent, <command> -?, accesses the CLI's detailed help text
interface. You can get help at several levels of detail.
Each fully qualified CLI command may have a variable number of distinct parts: the command
(command level 1), one or more subcommands (command level 2 and command level 3, if present),
and one or more name=value pair(s).
By appending -? (space-dash-question mark) to any command, you can get help on the command.
Example Help Commands
When you type omconfig -?, you get general help about the omconfig command. The help at this
level lists the available subcommands for omconfig:
•about
•preferences
• chassis
• system
When you type omconfig system -?, CLI help lists all of the subcommands that are available for
omconfig system:
• alertaction
• alertlog
• assetinfo
• cmdlog
• esmlog
•events
• recovery
• shutdown
• thrmshutdown
• webserver
Figure 2-1 shows the levels of help for a command.
omhelp: Getting Help With CLI Commands 17
Page 18
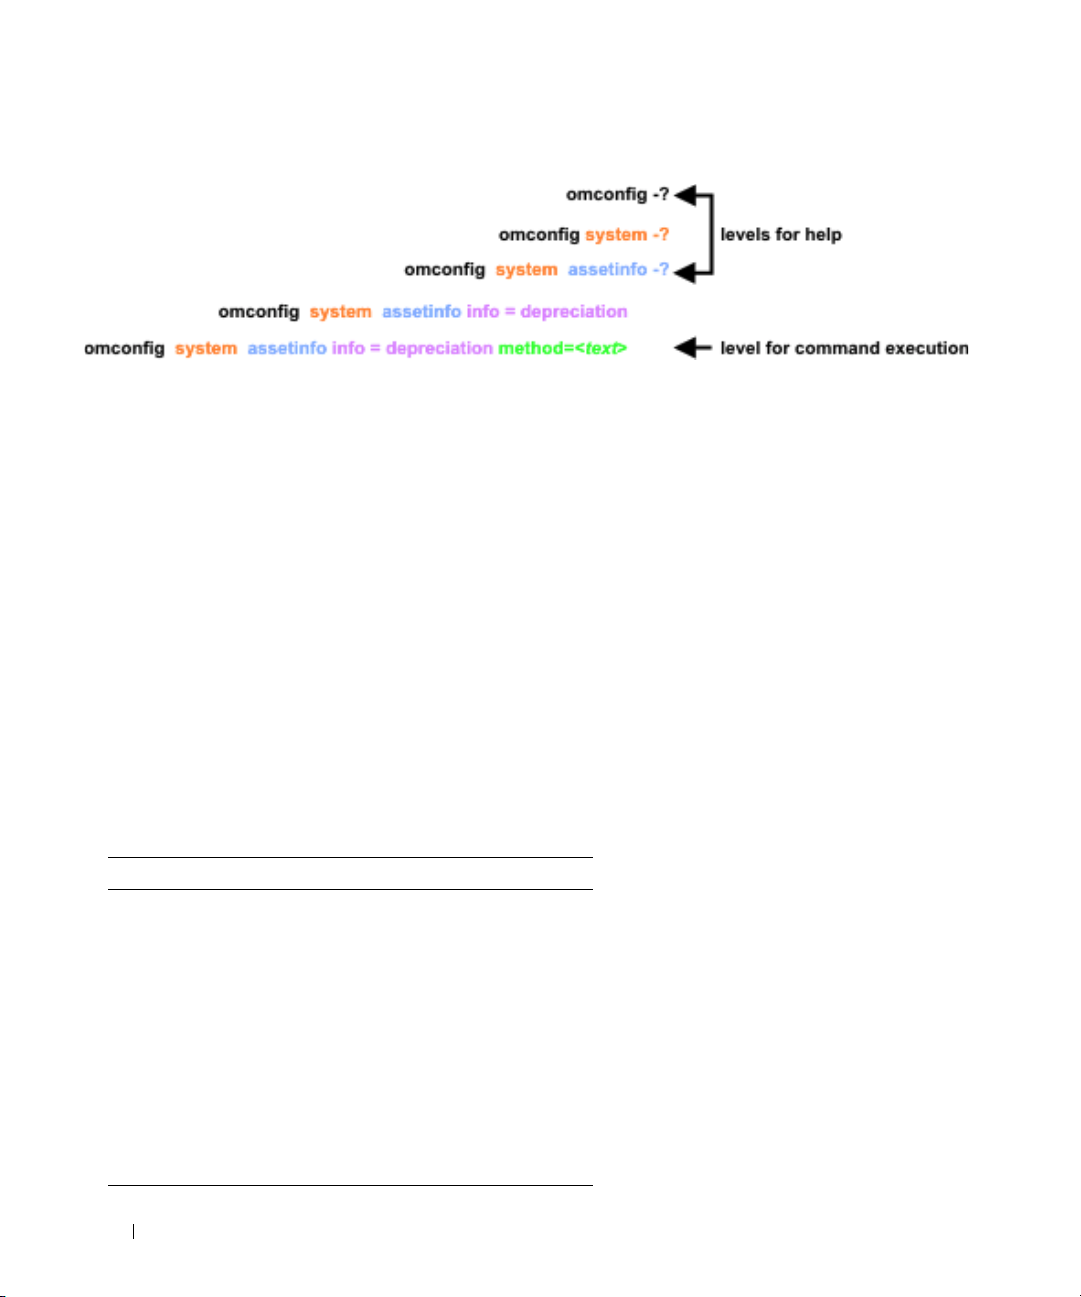
Figure 2-1. Different Levels of Help for a Command
You can also parse the omconfig system assetinfo command as follows:
<command level 1 command level 2 command level 3> <name=value pair 1>
[name=value pair 2]
where command levels 1, 2, and 3 are represented by omconfig system assetinfo, name=value pair 1 is
represented by info=depreciation, and name=value pair 2 is represented by method=straightline.
To set your depreciation method to straight line, type:
omconfig system assetinfo info=depreciation method=straightline
The CLI responds with the following message:
Asset information set successfully.
When you type
omconfig system assetinfo -?, the help that displays provides information about
assigning values for the name and option fields. Partial results for the request omconfig system
assetinfo -? are as follows:
assetinfo Set asset information.
For one info value, specify one or more optional parameter(s). Table 2-1 displays the optional parameters
for info=acquisition:
Table 2-1. Optional Parameters
Info Value Optional parameters
Info=acquisition purchasecost=<num>
waybill=<num>
installdate=<mmddyy>
purchasedate=<mmddyy>
ponum=<num>
signauth=<text>
expensed=<yes|no>
costcenter=<text>
info=depreciation
method=<text>
duration=<num>
percent=<percent>
unit=<months|years|unknown>
18 omhelp: Getting Help With CLI Commands
Page 19

omdiag: Using the Diagnostic Service
The omdiag command allows you to test chassis and storage components such as hard drives,
physical memory, communications and printer ports, NICs, CMOS, and more.
Most tests described in this section take less than one minute. Some test can take longer depending
on the device being tested. You cannot abort tests you start through the command line interface.
NOTICE: If you run omdiag commands from more than one console when the secure port server (for systems
running Microsoft
then the test in the first console will run to completion, but the test(s) in the subsequent console(s) may exit
with a "Test was interrupted" message.
NOTE: You can abort a Diagnostic Service test run through the CLI by using the Diagnostic Status window in
the Server Administrator GUI. Click the Diagnostics tab, click Status, and click Abort to stop the currently
running test or click Abort All to stop the currently running test and all queued tests.
NOTE: You cannot use <Ctrl-C> to cancel a CLI session from the console. However, tests started from the CLI
can be aborted using the "Abort" link in the "Diagnostic Status" page in the GUI.
NOTE: If the secure port server is not running when you type an omdiag command, there will be a noticeable
delay before the command executes because the system must check the hardware to determine the
diagnostic information to display.
NOTE: On systems running the Microsoft Windows operating system, the enumeration process requires that
the Windows Management Instrumentation (WMI) services be running.
®
Windows®) or omawsd (for systems running Red Hat® Enterprise Linux) is not running,
Table 3-1 is a high-level summary of the omdiag command. The columns titled "Command level 2"
and "Command level 3" list the major arguments that can be used with omdiag. The "Use" column
provides a very general statement about the actions that can be performed using omdiag. More
details about syntax and use of the command appear later in this section.
Table 3-1. omdiag Command Level 1, Level 2, and Level 3
Command
level 1
omdiag
Command
level 2
about Displays version number and properties for the
Command
level 3
details=
true
name=value
pair
Use
Server Administrator program.
Displays information for all of the Server
Administrator programs that are installed.
omdiag: Using the Diagnostic Service 19
Page 20

Table 3-1. omdiag Command Level 1, Level 2, and Level 3 (continued)
Command
level 1
Command
level 2
system any level 3
chassis cmos
Command
level 3
command
for chassis
or storage
memory
modem
network
parallelport
pci
serialport
rac
usbctrl
name=value
pair
passes=<n> Runs a test n time(s).
time=
<minutes>
quicktest=
<true /false>
haltonerror=
<true/false>
Device=
<number>
passes=<n> Runs a test n time(s).
time=
<minutes>
quicktest=
<true/false>
haltonerror=
<true/false>
Device=
<number>
Use
Runs the test for specified chassis or storage
component.
Runs a test for the specified number of minutes
<minutes>.
Uses a faster algorithm to conduct a specific test
if one is available.
Stops the tests if an error is encountered.
Specifies the device on which to run test.
Runs the CMOS test.
Runs the memory test.
Runs the modem test.
Runs the NIC test.
Runs the parallel port test.
Runs the PCI test.
Runs the serial port test.
Runs the RAC test.
Tests the Universal Serial Bus (USB)
controller(s).
Runs a test for no more than the specified
number of minutes <minutes>.
Uses a faster algorithm to conduct a specific test
if one is available.
Stops the tests if an error is encountered.
Specifies the device on which to run test.
20 omdiag: Using the Diagnostic Service
Page 21

Table 3-1. omdiag Command Level 1, Level 2, and Level 3 (continued)
Command
level 1
Command
level 2
storage cddvd
omdiag about
Command
level 3
floppy
raidctrl
idedevdiag
sasdevdiag
scsidevdiag
name=value
pair
passes=<n> Runs a test n time(s).
time=
<minutes>
quicktest=
<true/false>
haltonerror=
<true/false>
Device=
<number>
Use
Runs the CD/DVD drive test.
Runs the diskette drive test.
Runs the RAID control and attached device test.
Runs the IDE disk tests.
Runs Serial Attached SCSI (SAS), SAS RAID
controller, and attached device tests.
Runs the SCSI controller and attached tape and
hard drive tests.
Runs a test for no more than the specified
number of minutes <minutes>.
Uses a faster algorithm to conduct a specific test
if one is available.
Stops the tests if an error is encountered.
Specifies the device on which to run the test.
Use the omdiag about command to learn the product name and version number of the systems
management application installed on your system. The following is example output from the omdiag
about command:
Product name : Server Administrator
Version : 2.
x.x
Copyright : Copyright (C) Dell Inc.
1995-2005. All rights reserved.
Company : Dell Inc.
omdiag: Using the Diagnostic Service 21
Page 22

omdiag about details=true
Use the omdiag about details=true command to see information about all of the Server Administrator
programs that are installed. The following is example output from the omdiag about details=true command:
Product name : Server Administrator
Version : 2.
Copyright : Copyright (C) Dell Inc.
Company : Dell Inc.
Contains : Instrumentation Service 5.
x.x
1995-2005. All rights reserved.
x.x
Storage Management Service 3.x.
Diagnostic Service 3.x.
Sun JRE - OEM Installed Version 1.x.
Secure Port Server 1.x.
Core Service 1.x.
Instrumentation Service Integration Layer 1.x.
Storage Management Service Integration Layer 1.x.
Server Administrator 2.x.
x
x
x
x
x
x
x
x
omdiag chassis
Use the omdiag chassis commands to perform tests on nonstorage components of a system, such as the
memory, NICs, PCI, and ports.
NOTE: When you issue CLI commands to a server module in a modular system, chassis refers only to the server module.
omdiag chassis -?
Use the omdiag chassis -? command to see a list of all chassis components on the system.
omdiag chassis cmos
Use the omdiag chassis cmos command to test the system configuration information in the CMOS
settings. The following test is performed:
• Checksum Test — Performs a checksum test on the CMOS memory to determine if any bytes are
corrupt. This test scans the CMOS memory and calculates the checksum of the bytes read from the
checksum range. The calculated result is compared with the results stored in the CMOS memory. If
they match, the test succeeds; otherwise, the test logs errors.
22 omdiag: Using the Diagnostic Service
Page 23

omdiag chassis memory
Use the omdiag chassis memory command to test the system's RAM. The following test is performed:
NOTE: Shut down all other programs before running this test.
NOTE: Sufficient swap-space (temporary storage space used during a move or reconfiguration) is needed to
support the demands of the memory test.
NOTE: This test checks only memory seen by the operating system on systems that have redundant memory
support (spare bank or mirroring).
• Pattern Test — Checks your system’s memory by using a data patterns test. These patterns test the
memory's storage integrity and its ability to store data accurately. This test writes a pattern to each byte
in the memory and reads the pattern back. This verifies that the data paths, error-correction circuits,
and the memory devices themselves are working correctly.
omdiag chassis modem
Use the omdiag chassis modem command to run tests on all modems.
NOTE: This test runs on analog communication lines (regular telephone lines) and will not test a cable or Digital
Subscriber Link (DSL) modem. Currently, a test is not provided for testing cable or DSL modems; you can, however,
test cable or DSL Internet connections. To test an Internet connection that uses a cable or DSL modem, you must
use the network test.
NOTE: Shut down all other programs before running this test. If other programs use the modem, the test does not
run and you see "Cannot Run" in the Results window.
• Modem Test — Sends a series of AT command set commands to your modem to see if it is working.
The AT command set is a series of industry-standard instructions for the modem to perform.
NOTE: The correct modem drivers, when required, should be installed for the modem diagnostic tests to run
and provide the best results. For systems running Red Hat Enterprise Linux, in some cases, the "setserial"
command can be used to configure the modems without drivers.
The modem test performs the following tests:
– Hayes Basic Command Test— Uses the Hayes basic command set to exercise and diagnose the
functionality of the modem. The Hayes basic commands are written to the modem and the result
codes are verified and displayed either textually or numerically. Only important commands that
are common across different modems are used during this test.
– Hayes Extended Command Test — Uses the extended command group of the Hayes command
set to exercise and diagnose the functionality of the modem. The Hayes extended commands are
written to the modem and the result codes are verified and displayed either textually or
numerically. Only important commands that are common across different modems are used
during this test.
omdiag: Using the Diagnostic Service 23
Page 24

– S-Registers Test — Uses the selected range of S-Registers to exercise and diagnose the
functionality of the modem. The test saves the current S-register values, sets a new value, verifies
that the new value can be read and is correct, and restores the original value. The result codes are
verified and displayed either textually or numerically.
NOTE: In cases where the Windows registry with modem drivers is corrupted due to bad installs/uninstalls,
the modem diagnostic might give unexpected results.
• Broadcom Modem Test — Used for both external (for example, connected to a serial port) and internal
modems (for example, connected to a PCI slot).
The Broadcom Modem test performs the following tests:
NOTE: The following tests are not supported on systems running a Red Hat Enterprise Linux
operating system.
– Broadcom Modem Dialtone Detection Test — Verifies the correct operation of the codec, DAA,
and control logic on the Broadcom V.92 56K modem. This is accomplished by detecting the
presence of a dial tone on the telephone line. A telephone line must be attached to the modem for
this test to pass. If a dialtone is not detected, a warning is reported.
– Broadcom Modem Loopback Test — Instructs the Broadcom V.92 56K modem to perform a
standard local analog loopback test. A test pattern is looped back and checked by the modem. The
test fails if the modem reports any errors during the test.
– Broadcom Modem AT Command Test — Verifies the correct operation of the AT command
microprocessor and associated control functions on the Broadcom V.92 56K modem. A series of AT
commands are issued and the responses are checked for correctness. Each command must
correctly return "OK" or an error is reported.
omdiag chassis network
Use the omdiag chassis network command to test the NIC.
• Generic Network Diagnostic Test — The following two tests are available on all
Dell™ supported NICs:
– NIC Communication Test — Checks whether the NIC under test is physically connected (wired)
to the network. It also checks whether the NIC has a valid IP address.
NOTE: The network team test is only available on systems running a supported Microsoft Windows
operating system.
– NIC Team Test — Checks whether the NIC under test is in team mode. NIC teaming is one
method for providing high availability and fault tolerance in systems.
The following test runs on the Broadcom NIC:
NOTE: The following Broadcom NIC tests are not supported on systems running a Red Hat Enterprise Linux 4 (for
®
Intel
x86 and Intel EM64T) operating system.
• Broadcom Network Diagnostic Test — Analyzes overall controller health by checking for I/O conflicts,
memory faults, EEPROM operability, and transmit and receive functionality.
24 omdiag: Using the Diagnostic Service
Page 25

• The following tests are available on Dell supported Broadcom NICs:
– BRCMNetwork Control Registers Test — Tests most of the internal registers on the chip. Each
chip contains many internal registers. Each register can contain some read-only bits and some
read/write bits. This diagnostic tests read-only bits that cannot be overwritten, and tests if
read/write bits can be written properly.
– BRCMNetwork MII Registers Test — Tests most MII registers on the chip. Each chip contains
many MII registers. Each MII register may contain some read-only bits and some read/write bits.
This diagnostic tests read-only bits that cannot be overwritten, and tests if read/write bits can be
written properly.
– BRCMNetwork EEPROM Test — Tests the EEPROM checksum of the bootstrap record and the
configuration block on the chip.
– BRCMNetwork Internal Memory Test — Tests most of the internal memory of the chip. Each chip
contains a certain amount of on-chip memory to support on-chip processor operations.
– BRCMNetwork Interrupt Test — Tests the interrupt capability of the chip by verifying that the
NDIS driver is able to receive interrupts from the NIC.
– BRCMNetwork MAC Loop–back Test — Verifies that the NDIS driver is able to send and receive
packets from the NIC. It issues IOCTL (Input Output Controls) to request driver setup (MAC
layer loop back) in hardware.
– BRCMNetwork PHY Loop–back Test — Verifies that the NDIS driver is able to send and receive
packets from the NIC. It issues IOCTL (Input Output Controls) to request driver setup (PHY
layer loop back) in hardware.
– BRCMNetwork On Chip CPU Test — Tests the internal processor(s) on the chip. The test will
halt all on-chip processors, download an executable binary to the processor memory, and execute the
program.
– BRCMNetwork LED Test — Blinks the LEDs on the NIC.
– BRCMNetwork ASF Test — Tests various processor event registers and SMBus control registers.
Exercises ASF related hardware on the chip.
The following tests run on the Intel NIC:
• Intel FIFO Registers Test — Tests FIFO memory on the adapter by writing and reading patterns to
and from the FIFO memory.
• Intel Network Diagnostic Test — Analyzes overall controller health by checking for I/O conflicts,
memory faults, EEPROM operability, and transmit and receive functionality. The following tests are
available on Dell–supported Intel NICs.
NOTE: The Intel PROSet management agent is required for the Intel network adapter diagnostics. If the
management agent is not installed (or partially installed), the Intel vendor tests are not available (only the
default network diagnostics are available). You can access the Intel PROSet from either the Installation and
Server Management CD (version 8.x) or from support.dell.com. The Intel PROSet is listed under the Intel PRO
Family of Adapters.
omdiag: Using the Diagnostic Service 25
Page 26

NOTE: The following tests are only available on systems running a supported Microsoft Windows operating system.
– Intel Control Registers Test — Checks for any conflicts in the I/O address and tests the
accessibility of the registers. This test includes all General Registers, Receive Registers, and
Transmit Registers. It does not test the EEPROM Control/Data Register.
– Intel EEPROM Test — Verifies the integrity of data read from the EEPROM. This test completes a
write and read from the EEPROM and then compares the results for consistency.
– Intel Interrupt Test — Uses the Interrupt registers to confirm that all NIC interrupts work.
– Intel MAC Loopback Test — Tests the NIC’s ability to send and receive packets by sending packets to
itself. This test uses the MAC Loopback mode.
NOTE: The Intel MAC Loopback Test is not supported on the Intel PRO/1000 MF and the Intel PRO/1000 MT DP
network cards.
– Intel PHY Loopback Test — Tests the NIC’s ability to send and receive packets by sending packets
to itself. This test uses the PHY Loopback mode. Not all NICs support PHY Loopback.
– Intel Link Test — Checks the network connection, and the NICs send and receive functionality by
sending 1000 proprietary packets out on the network and retrieving those same packets.
The Intel Online Diagnostics tests and the Intel Offline Diagnostics tests are only available on systems
running a supported Red Hat Enterprise Linux operating system.
– Intel Online Diagnostics Tests — Performs a limited set of tests without interrupting normal NIC
operation during the tests.
– Intel Offline Diagnostics Tests — Performs a full set of tests. This test might disrupt the normal
operation of the NIC.
omdiag chassis parallelport
Use the omdiag chassis parallelport command to test the parallel port, which is a high-speed
communications port for attaching certain devices to your system.
The parallel port test writes a series of characters to the port and then reads it back again. If this test
detects differences between the written and read character series it logs an error message and the test
fails. The parallel port test performs the following tests:
• Mode Test — Tests the different modes of the Extended Capabilities Port (ECP). The following
modes are tested:
– Standard Mode (unidirectional)
– Byte Mode (a bi-directional mode, also called Reverse Mode)
– Parallel Port FIFO Mode (SPP hardware-handshake)
– EPP Mode (may not be available depending on chipset)
– ECP FIFO Mode (ECP hardware-handshake)
26 omdiag: Using the Diagnostic Service
Page 27

– FIFO Test Mode (test mode to determine FIFO depth)
– Configuration Mode (cnfgX registers are available)
NOTE: The Mode test may disrupt normal operation of a device connected to the parallel port, for example, a
printer that is printing.
• Parallel Port Register Test — Tests the parallel port registers using a write-read strategy, for example,
writing some data into the register, reading the data of the same registry and verifying it against the
data written (data-pattern, walking-bit). The following registers are tested:
– Standard Parallel Port (SPP) Registers: Control, Data, and Status Port registers
– Extended Parallel Port (EPP) Registers: Address and EPP Data Port registers
– Extended Capabilities Port (ECP) Register: Extended Control Register (ECR)
– ECP Configuration Registers A and B (cnfgA, cnfgB)
• FIFO Test — Configures the parallel port to the FIFO Test Mode. It detects the FIFO's depth, writes
different data patterns to the FIFO, and reads the patterns back from the FIFO. If the data written and
read are different, the test sends out an appropriate result.
• ECP Protocol Test — ECP protocol includes a simple compression scheme (maximum compression of
64:1) called Run-Length Encoding (consecutive repeated bytes are sent as a single byte with a repeatcount). This test configures the parallel port to FIFO Test Mode, tests if the compression is supported,
and sends out an appropriate result.
NOTE: Turn off all connected external devices before running this diagnostic.
omdiag chassis pci
Use the omdiag chassis pci command to test the PCI bus and check all PCI devices.
The PCI test includes the boards configuration test, which checks for the presence of PCI capability and
then scans all PCI devices for proper communication. PCI diagnostics enumerate the various kinds of
buses on the system board. In addition to the PCI bus, the package enumerates SCSI, IDE, and USB
buses. On systems running Microsoft Windows, the enumeration process requires that the WMI
(Windows Management Instrumentation) services is running. The following tests are performed by the
PCI test:
• PCI Device Configuration Test — Scans through the PCI bus, enumerating all the PCI devices. This
test examines the interrupt requests (IRQs) for each PCI device in use and issues a warning for those
devices that share the same ones. This test also checks if the driver for the device is loaded and
functioning correctly.
omdiag: Using the Diagnostic Service 27
Page 28

omdiag chassis rac
Use the omdiag chassis rac command to run the tests on the remote access controller (RAC).
The RAC test provides IT administrators with continuous access to their systems, enabling a full range of
systems management functions including monitoring, controlling, updating, and recovering. The RAC
can be connected to a PCI expansion slot or embedded on the system board. DRAC III and above are
enumerated and tested, whereas DRAC II is only enumerated, but not tested.
NOTE: In order to run the diagnostics, all the RAC drivers are required to be installed on the system, and the RAC-
specific services are required to be running on the system.
NOTE: In cases where the Windows registry is corrupted due to bad installs/uninstalls of RAC drivers, the RAC
diagnostic might give unexpected results
The following tests are performed by the RAC test:
• POST Result Test — Runs the power–on self–test (post) on the RAC hardware and firmware, gets the
result of the POST operation, and reports any errors.
• In–Band Access Test — Checks the status of the RAC–specific service running on the system that is
used for the in–band access of the RAC (through the operating system).
• Out–of–Band Test — Verifies the connectivity to the out–of–band interface of the RAC (the NIC on
the RAC). It first checks if the NIC is enabled on the RAC and if a valid IP address is assigned to it. It
then checks if it can connect to the HTTPS and FTP services running at this IP address.
omdiag chassis serialport
Use the omdiag chassis serialport command to test all 9-pin (AT) and 25-pin (PC, XT, and PS/2) serial
ports. The following tests are performed:
• Serial Port Register Test — Writes different data-patterns to the read-write registers of the serial port,
reads them back, and verifies the data against the written data. If this test detects differences between
the written and read data, it logs an error message and the test fails.
• Internal Loopback Test — Tests serial ports that have an internal loop-back mode, specifically for
testing. This test uses the internal loop-back mode to transmit and receive data and compare that the
data received is the same as the data transmitted. The write-only and read-only buffers are tested. Error
conditions such as buffer overrun are also detected.
• Baud Rate Test — Verifies the speed of the port against the system clock to ensure that the baud rate is
within an acceptable range. The baud rate is controlled by writing appropriate values to the Divisor
Latch bytes. The port transmits and receives (in internal loop-back mode) for 2 seconds, and checks
whether the number of characters transmitted and received is two times the baud rate divided by 10
(10 bits are used to transfer 1 byte).
• Interrupt Test — Verifies that the serial port is generating or receiving interrupt requests (IRQs) correctly
when key events occur. Otherwise error events are generated and the test fails.
NOTICE: This test may disrupt normal operation of a device connected to the serial port, for example, a modem. It
is recommended that any connected external device is turned off when this test is running.
28 omdiag: Using the Diagnostic Service
Page 29

omdiag chassis usbctrl
Use the omdiag chassis usbctrl command to test the USB controller(s).
The USB test performs the following test:
NOTE: The following test is available on systems running supported Microsoft Windows and Red Hat Enterprise
Linux (version 3) and later operating systems.
NOTE: On systems running supported Red Hat Enterprise Linux operating systems, connecting or removing a USB
device from the server while the diagnostics enumeration is in progress, may cause the system to hang.
• USB Node Detection Test — Scans the USB bus, enumerating all the USB devices connected to the
USB controller being tested. USB diagnostics enumerate the various kinds of USB controllers on the
system board. In addition to the on-board USB controllers, the package enumerates USB controller
cards inserted in the PCI slot and any other USB devices connected to the ports of these USB
controllers. This test examines hot plugged and unplugged devices from the tested USB controller.
omdiag storage
Use the omdiag storage commands to perform tests on your system’s storage components, such as the
CD drive, DVD drive, diskette drive, hard drive, tape drive, and SCSI or RAID controller.
omdiag storage -?
Use the omdiag storage -? command to see a list of all storage components on the system.
omdiag storage cddvd
Use the omdiag storage cddvd command to test CD and DVD drives.
The CD or DVD drive test runs several tests on a CD or DVD drive to make sure the drive is working
properly. This test determines how many CD or DVD drives are in your system and tests only those
drives that support the appropriate CD or DVD media. To run this test, you must have a data CD or
DVD (such as a program CD or DVD or your system's recovery CD or DVD) in the drive to be tested.
Standard music CDs are not suitable for testing.
NOTE: USB CD and DVD drives present at enumeration should not be disconnected at the time of testing if the USB
CD or DVD drive is being tested. A CD must be present in the CD drive being tested.
If there is no data CD or DVD present in the drive to be tested, you will see the following error message:
Media not present in the drive, or the device may have become
disconnected, or the cable may be bad. Make sure that the cable is
properly connected. Insert media in the drive and run the test again.
omdiag: Using the Diagnostic Service 29
Page 30

The CD/DVD drive test performs the following tests:
• Extremity Test — Conducts negative testing on the drive. The drive is requested to execute illegal
commands to access particular extreme sectors or play illegal lists. The test is expected to fail.
• Driver Mechanism Test — Performs the eject, close, and stop actions to determine if the drive servo
mechanism, the door motor, and the spindle motor are operating correctly. Slim CD/DVD drives like
those generally available in portable and rack-optimized systems do not allow retracting of the eject
tray. This kind of CD/DVD drive cannot be tested for drive mechanism test eject and
close functionality.
• Read Exerciser Test — Accesses and reads the actual contents of the media. If the data is in the format
of files, the data is read sector by sector into a temporary memory buffer during the first attempt.
During subsequent reads, the read pattern will follow a random set of sectors for the quick test and a
sequential set of sectors for the complete test. This data is then compared with data that was
previously stored in the memory to ensure the correctness of the read operation.
NOTICE: Allow sufficient time for the operating system to detect the presence of media in the drive before running
the CD/DVD diagnostics.
NOTE: This is the longest test in the CD/DVD diagnostics.
NOTE: Multi-session CDs are not supported by this test on supported Red Hat Enterprise Linux operating systems.
If the test fails, insert a different CD without multiple sessions and run the test again.
NOTE: Defective CDs may cause CD drive test failures. If an error occurs, insert a different CD and run the
test again.
omdiag storage floppy
Use the omdiag storage floppy command to test the diskette drive.
The diskette drive test examines your diskette drive using a series of seek and read tests to see if your
drive is working correctly. You must insert a diskette into the diskette drive in order to run this test. The
diskette test performs the following tests:
• Linear seek Test— Tests the integrity of the diskette drive mechanics. Moves the diskette drive heads
continuously, starting from the center of the diskette and moving outward to the maximum track, one
track at a time, until the entire disk is tested.
• Random seek Test — Tests the integrity of the diskette drive mechanics. Moves the diskette drive
heads to several hundred random locations on the diskette, one track at a time.
• Funnel seek Test — Tests the integrity of the diskette drive mechanics. Moves the diskette drive heads
continuously in a funnel fashion. For example, the test moves the heads from the first track on the disk
to the last, then to the second track, and from the second to the last track, and then to the third track,
and so on.
30 omdiag: Using the Diagnostic Service
Page 31

• Extremity Test — Attempts to access sectors beyond the range and confirms the error received.
• Read-Write Test — Targets an appropriate number of sectors. The data on each of these sectors is read
into a buffer where it is stored until it is restored. The algorithm then writes a stream of roving data
onto each sector. It then returns to the first designated sector and reads back the data to confirm the
data integrity. After this, the original data is restored.
NOTICE: On systems running a supported Red Hat Enterprise Linux operating system, disconnecting the USB cable
of a USB diskette drive while the test is running might cause unpredictable results.
NOTE: Defective diskettes may cause the diskette drive test to fail. If an error occurs, insert a different diskette
and run the test again.
NOTE: Read-only diskettes will cause diskette drive test failures. If the test fails, ensure that the read-only switch
on the diskette is in the read-write (or unlocked) position and run the test again.
omdiag storage idedevdiag
Use the omdiag storage idedevdiag to test IDE hard drives to verify that they are functional. The storage
controller test performs the following tests:
IDE Hard Disk Test — Tests the hard drives on your system. This test verifies a drive's ability to respond
to commands, return diagnostic information, and ensure data integrity across the entire
hard-drive surface.
omdiag storage raidctrl
Use the omdiag storage raidctrl command to validate normal operations of Adaptec and LSI RAID
controllers and connected hard drives. This command allows a user to test all RAID controllers and
attached drives. With more command options, a specific controller and its connected hard drives
may be tested.
• Adaptec RAID Controller Hardware Test — Performs various tests to validate normal operations of
Adaptec RAID controllers. It allows a user to selectively test a specific controller. The test retrieves and
verifies the status information of the main components of the controller. It performs basic and
advanced operations to verify the working status of the controller. The Adaptec Controller Hardware
test performs the following tests:
– Pause-resume I/O Test — Verifies the Pause I/O and Resume I/O functions of the controller on all
of the buses.
– Device scan Test — Verifies the status of devices attached to the controller. This test takes a
snapshot of the status of current attached devices, rescans for all devices, and then compares the
status with the first snapshot, reporting any changes.
– NVRAM and battery test Test — Checks for the existence of a nonvolatile random access memory
(NVRAM) and a battery module. If an NVRAM and a battery are present, the test verifies the
normal operation of these modules.
– Global cache Test — Retrieves the global cache parameters and verifies the normal operation of
this function.
omdiag: Using the Diagnostic Service 31
Page 32

You must stop an application that reserves the RAID controller before you attempt to run the Adaptec
RAID controller diagnostic test or the hard disk diagnostic test. If you do not, the diagnostic reports a
failure with the following message:
An application or service that manipulates RAID such as Array
Manager, FAST, or PERC Console has reserved the controller and must
be stopped before running this test. See the Server Administrator
online context-sensitive help or the "Server Administrator CLI User's
Guide" for more information.
NOTE: To stop the Array Manager service on a system running Microsoft Windows, go to the Control Panel, select
Services, right-click the Disk Management Service, and select Stop. To stop FAST or the PERC Console, exit
the application.
• LSI RAID Controller Hardware Test — Consists of two parts:
– Configuration Test — Tests and verifies the format and content of the configuration data and
compares it to the actual configuration for any discrepancies. Any format violations and
configuration mismatches are reported. Failing this test does not imply that the controller is
defective. Instead, failing this test means that the controller's configuration is not the same as the
data from NVRAM.
– Timer Test — Tests the timer sequence of the RAID controller. Any nonsupported timer sequence
verifications result in a timer test failure. Timer test failures cause the controller to be marked
as failed.
• LSI RAID Controller Battery Test — Tests the voltage and temperature on the battery, if one is
present. If this test fails and a battery is installed on your RAID controller, replace the battery. The test
is nondestructive; it does not write data to the storage devices managed by the controller.
• Adaptec and LSI Array Disk Test — Tests the hard drives on your system. You can test hard drives
attached to a system through a qualified Adaptec or LSI RAID controller and determine if the drives
have failed. This test verifies a drive's ability to respond to commands, return diagnostic information,
and ensure data integrity across the entire hard-drive surface.
• Identify Connected Disks —Ensures that the SCSI subsystem between the controller and the
connected device is intact. The Identify Connected Disk test is only available if the Adaptec and/or
LSI controller have devices connected to them.
NOTE: The hard disk diagnostics are designed to run as a low-priority background task to limit the effect on I/O.
Because of their low priority, it is recommended that you limit hard disk activity while running the diagnostics. The
diagnostics may run slowly or even stop while hard disk I/O activity is running simultaneously.
32 omdiag: Using the Diagnostic Service
Page 33

The diagnostics resume when the hard drive I/O activity has decreased. If the following message appears:
Device Inquiry command failed
it is likely that the hard drive is not connected properly. Check the cables to ensure that the hard drive is
properly connected to the controller. The hard drive may also fail and display the following message:
Device failed a send diagnostic command: Check cable connections and
termination and run this test again. If this error still occurs, it
may indicate a hardware problem.
To avoid this message, run the diagnostic when the system is experiencing light hard-drive I/O activity.
• Adaptec and LSI Blink Disk Light — Blinks the lights of a hard drive for 30 seconds to assist in locating
the hard drive.
omdiag storage sasdevdiag
Use the omdiag storage sasdevdiag command to test the SAS, SAS RAID controllers, and connected
devices. This test performs the following tests:
• Physical Integrity Test — Verifies the integrity of the physical layer of the SAS enclosure and its
connected hard drives. When a failure is identified, an error message will be displayed indicating that
an error has occurred. The detailed Phy error report log (Comma Separated Value, CSV file) is
available for Dell technical support personnel for further analysis. Prior knowledge of Phy is required to
interpret this log file. CSV files can be opened with common applications such as Microsoft Excel,
Open Office, and so on. Contact Dell technical support in case of repeated failures.
• Controller Log Test — SAS RAID controllers store all historical events in their memory. This test
exports the logs to a readable text file and Comma Separated Value (CSV) files. Entries in the
exported log file are intended for Dell technical support personnel. The messages in the log are
informational at the user level. Quick test will only retrieve entries since the last system boot. Using
the text or CSV files, Dell support personnel can analyze the logs to identify any potential failure of the
system. By default, the test runs for approximately 5 minutes. But in quick mode, it runs for
90 seconds.
• Enclosure Log Test — Enclosures store all historical events in their memory. This test exports the logs
to a readable text file and Comma Separated Value (CSV) files. Entries in the exported log file are
intended for Dell technical support personnel. The messages in the log are informational at the user
level. Using the text or CSV files, Dell support personnel can analyze the logs to identify any potential
failure of the system.
• Disk Self Test — Verifies the hard disks attached to a system through a qualified SAS or RAID
controller to determine if the hard disk has failed.
NOTE: The hard disk diagnostics are designed to run as a low-priority background task to limit the effect on I/O.
Because of their low priority, it is recommended that you limit hard disk activity while running the diagnostics. The
diagnostics may run slowly or even stop while hard disk I/O activity is running simultaneously.
omdiag: Using the Diagnostic Service 33
Page 34

omdiag storage scsidevdiag
Use the omdiag storage scsidevdiag command to test the SCSI controller, connected hard drives, and
tape devices. This test performs the following tests:
• SCSI Channel Communication Test — Ensures that the SCSI subsystem between the controller and
connected device is intact. This test is only available if the controller has devices connected to it.
• SCSI Disk Test — Moves the hard drive heads continuously, starting from the center of the disk and
moving outward to the maximum track, one track at a time, until the entire disk is tested. For a quick
test, this test moves the drive heads to several hundred random locations on the disk, one track at a time.
• Blink Disk Light — Blinks the lights of a hard drive for 30 seconds to assist in locating the drive.
• SCSI Tape Drive Tests — Performs several tests on the SCSI tape drive, which is connected to a SCSI
controller channel using a SCSI cable. The appropriate tape drive and SCSI controller drivers must be
installed to enumerate the tape drive. The following tests are performed on SCSI tape drives:
– Tape Device Self-Test — Ensures that any media in the drive is writable. For autoloaders/changers,
this test does not require a tape cartridge. For tape drives, a tape cartridge is required as this test
writes data to the media installed in the drive. This test initially verifies the communication path
from the host to the tape drive. If communication can be established, the test performs a quick
test of the drive's RAM and then performs the built-in RAM diagnostic. This diagnostic can vary
depending on the type of the drive. For autoloaders/changers, no other tests are performed. For
tape drives, the diagnostic writes several blocks of data and filemarks on the drive and tests the
drive’s ability to space along the filemarks.
– Tape Drive Media Test — Writes data to media present in the drive. Ensure that any media in the
drive is writable. The quick test will attempt to write 30 percent of the media's capacity and then
space back to the beginning of the media. The data is then read to confirm the written data's
integrity. The data is erased when the test is complete. The full test will attempt to write 80
percent of the media's capacity.
NOTE: Tape tests can take several hours to complete because the tests are proportional to the tape capacities.
Regular tests can take more than ten hours to complete, while the quick test can take up to ten hours to complete.
– Tape Drive Insert Test — Verifies the tape drive's ability to load a tape cartridge. This test is not
available for autoloader/changer tape drives. This test also writes a small amount of data, verifies
the data written, and then ejects the media.
NOTE: When the media is ejected from the tape drive, run the Tape Drive Insert Test as an individual test. Do
not group this test with any other tests on this device.
– Tape Drive Eject Test — Verifies the tape drive's ability to eject a tape cartridge. It will issue a
Prevent Allow Medium Removal SCSI
This test is not available for autoloader/changer tape drives.
NOTE: When the media is ejected from the tape drive, run the Tape Drive Eject Test as an individual test. Do
not group this test with any other tests on this device.
– Check Tape Drive Firmware (optional) — Checks the tape drive firmware revision number to see
if any updates exist.
34 omdiag: Using the Diagnostic Service
command and then attempt to unload the tape cartridge.
Page 35

• SCSI Tape Library/Changer Tests — Performs several tests on a SCSI tape library or changer, which is
connected to a SCSI controller channel using a SCSI cable. Appropriate SCSI controller and tape
changer or library drives must be installed for the tape changer or library to be enumerated. The
following tests are performed on a SCSI tape library or changer:
– Tape Device Self Test — Initially verifies the communication path from the host to the tape drive.
If communication can be established, the test performs a quick test of the drive's RAM and then
performs the built-in RAM diagnostic. This test does not require a tape cartridge. This diagnostic
can vary based on the type of the drive.
– Tape Changer Automation Test — Tests the functionality of the robotic components in the
autoloader or library. The test consists of two individual tests: a slot-to-slot test and a slot-to-drive
test. The complete tape changer automation test repeats both tests twice.
The slot-to-slot test is not supported on all devices. For devices that support this type of
functionality, the test randomly moves tape cartridges from one storage slot to another, and
back again.
The slot-to-drive test randomly loads and unloads tape cartridges to and from one or more drives.
– Check Tape Changer/Library Firmware (optional) — Checks the tape changer/library firmware
revision and verifies if an update is required.
omdiag system
You can use the omdiag system command to test any of the components for the system, regardless of
whether they are part of the chassis. For example, omdiag system memory tests the memory just the
same as if you run omdiag chassis memory.
omdiag system -?
Use the omdiag system -? command to see a list of all components on the system.
omdiag: Using the Diagnostic Service 35
Page 36

36 omdiag: Using the Diagnostic Service
Page 37

omreport: Viewing System Status Using the Instrumentation Service
The omreport command allows you to see detailed information about your system components. You
can retrieve summaries for many system components at one time, or you can get details about a
specific component. This chapter shows you how to get reports with the level of detail that you want.
Commands documented in this chapter vary in whether they define the fields that appear in the results of a
particular omreport command. Fields are defined only if they have a special or less familiar use.
As with all other components, you can use omreport to view component status, and omconfig to
manage a component. For information on how to configure components for management,
see "omconfig: Managing Components Using the Instrumentation Service."
Often you can use omreport commands to get information you need to execute an omconfig
command. For example, if you want to edit the minimum temperature for a warning event on a
temperature probe, you need to know the index of the probe you want to configure. You can use
omreport chassis temps to display a list of probes and their indexes.
Conventions for Parameter Tables
When listing the parameters that a command can take, the parameters are listed in alphabetical
order instead of the order in which they appear in the command line interface.
The symbol |, often called pipe, is the logical exclusive or operator. For example, enable | disable
means that you can enable or disable the component or feature, but you cannot simultaneously
enable and disable the component or feature.
omreport Command Summary
NOTE: Although this chapter lists all possible omreport commands, the commands available on your system
depend on your system configuration. The results that display for the omreport command vary from one
system to another. Data displays for installed components only.
NOTE: When a system includes an external chassis, the displayed results vary by operating system. For Red
®
Enterprise Linux systems, omreport commands display external chassis information in a separate
Hat
section after the main chassis information. On Microsoft
chassis does not appear in omreport output. Use Array Manager to get information about an external chassis
attached to a Windows system; for instructions, see the Dell OpenManage
omreport: Viewing System Status Using the Instrumentation Service 37
®
Windows® systems, data about the external
™ ArrayManager User's Guide.
Page 38

Table 4-1 is a high-level summary of the omreport command. The column titled "Command level 1"
shows the omreport command at its most general. "Command level 2" shows the major objects or
components that you can view using omreport (about, chassis, storage, system, and rac). "Command
level 3" lists the specific objects and components for which you can view reports. "User privilege required"
refers to the type of privilege you need to perform the command, where U=User, P=Power User, and A=
Administrator. "Use" is a very general statement about the actions that can be performed using omreport.
More details about syntax and use of the command appear later in this section.
Table 4-1 shows the omreport commands available for about, system, and main system chassis. For
information about viewing storage components, see "omreport storage: Using the Storage Reports."
Table 4-1. omreport Command Level 1, Level 2, and Level 3
Command
level 1
omreport
Command
level 2
about U, P, A Shows version number and properties for the
chassis U, P, A Shows a general status for all main components.
Command
level 3
details=true U, P, A Displays information for all of the Server
acswitch U, P, A Shows failover settings where redundant power
bios U, P, A Shows BIOS facts such as manufacturer, version,
biossetup U, P, A Shows BIOS setup properties that you have
bmc U, P, A Shows general information on the baseboard
currents U, P, A Shows the status and thresholds for the current
fancontrol U, P, A Shows properties you have set for fan speed.
fans U, P, A Shows status and thresholds for system fans.
firmware U, P, A Shows firmware properties such as version, date
frontpanel U, P, A Shows whether the front panel button settings,
User
privilege
required
Use
Server Administrator program.
Administrator programs that are installed.
units are installed in a system.
date last updated.
configured during system boot.
management controller (BMC).
system sensors.
of last update, and whether the firmware
is updatable.
such as for the Power button and/or Nonmasking
Interrupt (NMI) button (if present on the
system), are enabled or disabled.
38 omreport: Viewing System Status Using the Instrumentation Service
Page 39

Table 4-1. omreport Command Level 1, Level 2, and Level 3 (continued)
Command
level 1
Command
level 2
storage A See "omreport storage: Using the Storage
system U, P, A Shows a high-level summary of system
Command
level 3
fru U, P, A Shows the Field Replaceable Unit (FRU)
info U, P, A Shows a status summary for main system chassis
intrusion U, P, A Shows the status of the system’s intrusion
leds U, P, A Shows the properties you have set for LEDs to
memory U, P, A Shows properties of your system's memory arrays.
nics U, P, A Shows number of NICs installed in your system,
ports U, P, A Shows properties for your system’s parallel and
processors U, P, A Shows properties of your system’s processors,
pwrsupplies U, P, A Shows properties of power supplies.
slots U, P, A Shows properties of your system’s expansion slots
temps U, P, A Shows the status and thresholds for the system
volts U, P, A Shows the status and thresholds for the system
alertaction U, P, A Shows warning and failure threshold values, as
alertlog U, P, A Allows the administrator to show the alert log.
User
privilege
required
Use
information.
components.
sensor(s).
flash under various alert conditions.
NIC vendor, NIC description, IP address, and
connection status.
serial ports, such as I/O address, IRQ level,
connector type, and maximum speed.
including speed, manufacturer, and
processor family.
and other slot types.
temperature sensors.
voltage sensors.
Reports" and "Using the Storage Management
Service."
components.
well as actions that have been configured when
an essential components detects a warning or
failure state.
omreport: Viewing System Status Using the Instrumentation Service 39
Page 40

Table 4-1. omreport Command Level 1, Level 2, and Level 3 (continued)
Command
level 1
Command
level 2
rac U, P, A See "omreport rac: Viewing Remote Access
Command
level 3
assetinfo U, P, A Shows cost of ownership information for
cmdlog U, P, A Allows the administrator to show the
esmlog U, P, A Allows the administrator to show the
events U, P, A Shows the system’s SNMP event settings.
operatingsystem U, P, A Shows the name and version of your
pedestinations U, P, A Shows destinations where alerts for a platform
platformevents U, P, A Shows the system’s response for each listed
postlog U, P, A Shows your system’s POST log.
recovery U, P, A Shows how your system is configured to respond
shutdown U, P, A Shows how the shutdown action is to be
summary U, P, A Shows key facts for all system components,
thrmshutdown U, P, A Shows what shutdown action, if any, is to be
version U, P, A Shows a summary for all updatable components
User
privilege
required
Use
your system.
command log.
hardware log.
operating system.
event have been sent.
platform event.
to a hung operating system.
performed.
including main system chassis, software, and
storage.
taken when a temperature warning or failure
condition is detected.
on your system.
Controller Components."
40 omreport: Viewing System Status Using the Instrumentation Service
Page 41

Help With the omreport Command
Use the omreport -? command to get a list of the available commands for omreport.
Use omreport <command level 2> -? to get help on the level 2 commands about, chassis, and system.
The following information on omreport system -? applies equally to getting help for the omreport
chassis command.
To see a list of valid commands for omreport system, type:
omreport system -? | more
omreport about
Use the omreport about command to learn the product name and version number of the systems
management application installed on your system. The following is example output from the omreport
about command:
Product name
Version
Copyright
Company
For even more details about the environment for Server Administrator, type:
omreport about details=true
Server Administrator includes a number of services, each of which has a version number of its own. The
Contains field reports version numbers for the services as well as other useful details. The output below
is an example, and can change depending on your configuration and the version of Server Administrator
that is installed on your system:
Contains: Instrumentation Service 5.
: Server Administrator
: 2.x.x
: Copyright (C) Dell Inc. 1995-2005. All rights reserved.
: Dell Inc.
x.x
Storage Management Service 3.x.
Diagnostic Service 2.x.
Sun JRE - OEM Installed Version 3.x.
Secure Port Server 1.x.
Core Service 1.x.
Instrumentation Service Integration Layer 1.x.
Storage Management Service Integration Layer 1.x.
Server Administrator 2.x.
x
x
x
x
x
x
x
x
omreport: Viewing System Status Using the Instrumentation Service 41
Page 42

omreport chassis Commands
Use omreport chassis commands to view details for the entire chassis or for a particular component.
omreport chassis
When you type:
omreport chassis
Server Administrator displays a general status for your main system chassis components.
NOTE: The omreport chassis command does not list the health status of the Diagnostics Service. To view the
health of the Diagnostics Service, see the Properties page for the Main System Chassis object on the Server
Administrator home page.
NOTE: When you issue CLI commands to a server module in a modular system, chassis refers only to the
server module.
NOTE: As with all output shown in this guide, the following output is an example and may vary depending on your
system configuration.
SEVERITY : COMPONENT
Ok : Fans
Critical : Intrusion
Ok : Memory
Ok : Power Supplies
Ok : Temperatures
Ok : Voltages
42 omreport: Viewing System Status Using the Instrumentation Service
Page 43

omreport chassis acswitch
Use the omreport chassis acswitch command if your system has redundant power supplies that are
configured in a failover arrangement. When you type:
omreport chassis acswitch
Server Administrator displays the following output:
AC Failover Switch
AC Switch Redundancy
Redundancy Status : Full
Number of devices required for full
redundancy
Redundancy Mode :
Redundancy Configuration : Input Source Line 1,
upon redundancy restoration, return to Line 1
AC Power Lines
Status : Ok
Location : AC Power Line 1
AC Present : Power Present
Active Source : Active
Status : Ok
Location : AC Power Line 2
AC Present : Power Present
Active Source : Not Active
Server Administrator reports values for the Redundancy Status and Redundancy Mode fields.
:2
omreport chassis bios
Use the omreport chassis bios command to view current BIOS information. When you type:
omreport chassis bios
Server Administrator displays a summary of your system’s BIOS information.
omreport: Viewing System Status Using the Instrumentation Service 43
Page 44

omreport chassis biossetup
Use the omreport chassis biossetup command to view BIOS setup parameters that are normally available
only during system boot.
Ty p e :
omreport chassis biossetup
Table 4-2 displays the BIOS setup parameters that are available:
NOTE: Not all the parameters are displayed. Only those BIOS setup properties that are configured during system
boot are displayed.
Table 4-2. BIOS Setup Parameters
Parameters Description
Bezel Displays whether the bezel removal intrusion check during system
reboot is enabled or disabled.
Bootsequence Displays the device that is used to boot the system.
Console Redirection Displays if the BIOS screen is redirected over a particular serial port
or if it is turned off.
Diskette Displays whether the diskette is disabled, auto enabled, or read only.
Demand Based Power
Management (DBS)
Dual NIC Displays whether NIC 1 and NIC 2 with PXE is enabled or disabled.
Console Redirection Failsafe Baud
Rate
IDE Displays whether the drive is enabled or disabled.
IDE Primary Drive 0 Displays whether the device is automatically detected and enabled
IDE Primary Drive 1 Displays whether the device is automatically detected and enabled
Intrusion Displays whether the intrusion check is enabled or disabled during
Mouse Displays whether the mouse is enabled or disabled.
NIC and NIC 2 Displays whether the first and second NICs are enabled (with or
Numlock Displays whether the keypad can be used as number keys.
Parallel port address Displays whether the address is located on LPT1, LPT2, and LPT3,
Parallel port mode Displays the setting associated with the parallel port.
Displays whether DBS is enabled or disabled on the system.
Displays the setting for console redirection failsafe baud rate.
or if the device is disabled.
or if the device is disabled.
system boot.
without PXE) or disabled during system boot.
or if it is disabled.
44 omreport: Viewing System Status Using the Instrumentation Service
Page 45

Table 4-2. BIOS Setup Parameters (continued)
Parameters Description
Primary SCSI Displays whether the device is on or off.
RAID on motherboard Displays whether RAID-on-motherboard is detected as a RAID
device, a SCSI device, or if the device is disabled during system boot.
RAID Channel A Displays whether RAID-on-motherboard Channel A is detected as a
RAID device or a SCSI device.
RAID Channel B Displays whether RAID-on-motherboard Channel B is detected as a
RAID device or a SCSI device.
SATA Displays whether the onboard SATA controller is set to ATA mode,
RAID mode, or is disabled.
SATA port Displays if the SATA port is enabled or disabled.
Secondary SCSI Displays whether the device is enabled or disabled.
Serial Port 1 Displays whether serial port 1 is mapped to a COM port, a
COM port 1, a COM port 3, a BMC Serial, a BMC NIC, a
BMC RAC, or is disabled.
Serial Port 2 Displays whether serial port 2 is mapped to a COM port, a
COM port 2, a COM port 4, or is disabled.
Speaker Displays whether the speaker is on or off.
USB or USBB Displays whether the USB port is enabled or disabled.
omreport chassis bmc
Use the omreport chassis bmc command to view baseboard management controller (BMC)
general information.
Ty p e :
omreport chassis bmc
The output from the omreport chassis bmc command lists each of the valid parameters. Table 4-3 shows
the available settings.
Table 4-3. omreport chassis bmc
name=value pair Description
config=advsol Reports advanced BMC information on a serial over local area network
(LAN) connection.
config=serialoverlan Reports BMC information on a serial over LAN connection.
config=terminalmode Reports terminal mode settings for the serial port.
config=user Reports information on BMC users.
omreport: Viewing System Status Using the Instrumentation Service 45
Page 46

Table 4-3. omreport chassis bmc (continued)
name=value pair Description
config=nic Reports BMC information for the LAN.
config=serial Reports serial port information for BMC.
config=serialoverlan Reports BMC information on a serial over LAN connection.
config=terminalmode Reports terminal mode settings for the serial port.
config=user Reports information on BMC users.
omreport chassis currents
Use the omreport chassis currents command to view current (amperage) probe status and settings.
When you type:
omreport chassis currents index=
n
the index parameter is optional. If you do not specify the index, Server Administrator displays a
summary of status, readings, and thresholds set for all current probes present on your system. If you
specify the index, Server Administrator displays a summary for a specific current probe.
omreport chassis fans
Use the omreport chassis fans command to view fan probe status and settings. When you type:
omreport chassis fans index=
the index parameter is optional. If you do not specify the index, Server Administrator displays a
summary of status, readings, and thresholds set for any fan probes that might be present on your system.
If you specify the index, Server Administrator displays a summary for a specific fan probe.
n
omreport chassis fancontrol
Use the omreport chassis fancontrol command to see how fan speed is set on your system. Fan speed can
be set to optimize speed for cooling or for quiet operation. Table 4-4 shows the available settings.
Table 4-4. Fan Control Settings
name=value pair Description
speed=quiet Set fan speed for quiet operation.
speed=maxcool Set fan speed for maximum cooling.
omreport chassis firmware
Use the omreport chassis firmware command to view current firmware properties. When you type:
omreport chassis firmware
Server Administrator displays a summary of your system’s firmware properties.
46 omreport: Viewing System Status Using the Instrumentation Service
Page 47

omreport chassis frontpanel
Use the omreport chassis frontpanel command to view whether the front panel button control settings,
such as for the Power button and/or Nonmasking Interrupt (NMI) button (if present on the system), are
enabled or disabled.
If the Power button override is present on your system, you can see whether the Power button override is
enabled or not. If enabled, the Power button turns the power to the system On and Off.
If the NMI button is present on your system, you can see whether the NMI button is enabled or not. The
NMI button can be used to troubleshoot software and device errors when using certain
operating systems.
omreport chassis fru
Use the omreport chassis fru command to view the Field Replaceable Unit (FRU) information. When
you type:
omreport chassis fru
Server Administrator displays a summary of your system’s FRU information. This information is
available only through the Server Administrator CLI, and is primarily used to support
troubleshooting activities.
omreport chassis info
Use the omreport chassis info command to see a summary of installed component versions. When
you type:
omreport chassis info index=
n
the index parameter specifies a chassis number and is optional. If you do not specify the index, Server
Administrator displays summary chassis information for each chassis. If you specify the index, Server
Administrator displays summary information for a specific chassis.
omreport: Viewing System Status Using the Instrumentation Service 47
Page 48

Depending on your configuration, output may resemble the following example:
Index
Chassis Name
Host Name
Baseboard Management Controller
Version
Primary Backplane Version
Sensor Data Record Version
Chassis Model
Chassis Lock
Chassis Service Tag
Chassis Asset Tag
Flash chassis indentify LED state
Flash chassis indentify LED timeout
value
: 0
: Main System Chassis
: everglades
: 1.80
: 1.01
: SDR Version 0.33
: PowerEdge 1750
: Present
: 8RLNB1S
:
: Off
: 300
omreport chassis intrusion
Use the omreport chassis intrusion command to find out whether the cover to your system is open.
Server Administrator tracks chassis intrusion events because intrusions may indicate an attempt to steal
a system component, or to perform unauthorized maintenance on the system. Type:
omreport chassis intrusion
A message that resembles the following may display:
Status
Probe Name
State
48 omreport: Viewing System Status Using the Instrumentation Service
: Ok
: Main chassis intrusion
: Chassis is closed
Page 49

omreport chassis leds
Use the omreport chassis leds command to find out whether clear hard drive fault is supported and what
severity level lights up the LED. Type:
omreport chassis leds index=
The index parameter is optional. If you do not specify the index, Server Administrator displays a
summary of LED information for chassis 0. If you specify the index, Server Administrator displays a
summary for a specific chassis.
The following is example output:
n
Flash chassis indentify LED state
Flash chassis indentify LED
timeout value
: Off
: 300
omreport chassis memory
Use omreport chassis memory to see details for each memory module slot in your system. If your system
supports redundant memory, this command also displays the status, state, and type of memory
redundancy implemented on your system. Type:
omreport chassis memory index=
The index parameter is optional. If you do not specify the index, Server Administrator displays
information for all memory on your system. If you specify the index, Server Administrator displays a
summary for a specific memory module.
Output for an occupied memory slot may resemble the following:
Index
Status
Connector Name
Type
Size
An unoccupied memory slot still has a connector name. Output for an unoccupied memory slot may
resemble the following:
: 1
: OK
: DIMM_B
: SDRAM-SYNCHRONOUS
: 256 MB
n
Index
Status
Connector Name
Type
Size
: 2
: Unknown
: DIMM_D
: Not Occupied
: Unknown
omreport: Viewing System Status Using the Instrumentation Service 49
Page 50

If your system supports redundant memory, the redundancy output may resemble the following:
Memory Redundancy
Redundancy Status
Fail Over State
Redundancy Configuration
Attributes
Memory Array 1
Attributes
Memory Array 1
Attributes
Memory Array 1
Attributes
Memory Array 1
Attributes
Memory Array 1
: Full
: Inactive
: SpareBank
: Location
: Proprietary Add-on Card
: Use
: Unknown
: Installed Capacity
: 1536 MB
: Maximum Capacity
: 12288 MB
: Slots Available
: 12
omreport chassis nics
Use the omreport chassis nics command to view NIC properties. Type:
omreport chassis nics index=
The index parameter is optional. If you do not specify the index, Server Administrator displays
properties about all NICs on your system. If you specify the index, Server Administrator displays
properties for a specific NIC.
Values display for the following fields: Index (number of the NIC card), IP address, Ve nd or, Description,
and Connection Status.
n
omreport chassis ports
Use the omreport chassis ports command to view properties of your system’s parallel and serial ports.
Values display for the following fields: Port Type, External Name, Base I/O Address, IRQ Level,
Connector Type, and Maximum Speed.
Port Type is the detailed type of each system port, from the more general serial, parallel, and USB ports to
the names of ports by device type connected to it, for example, pointing device or keyboard.
External Name is the name of the port, such as serial or parallel, USB, mouse, keyboard, and so on.
Base I/O Address is the starting I/O address expressed in hexidecimal.
IRQ Level is a hardware interrupt on a system. The hardware interrupt signals the system's CPU that an
event has started or ended in a peripheral component such as a modem or printer. When communicated
over a peripheral component interconnect card, the IRQ level is a standard way to identify the type of
device that is sending the interrupt request.
50 omreport: Viewing System Status Using the Instrumentation Service
Page 51

Connector Type refers to the type of plug or cable and plug that connects two devices together, in this
case, the type of connector that attaches an external device to a system. There are many connector types,
each designed to connect a different device type to a system. Examples include DB-9 Male, AT, Access
Bus, PS/2, and so on.
Maximum Speed is the port speed. Port speed refers to the data transmission rate of an input/output
channel, measured in numbers of bits per second. Serial ports usually have a maximum speed of 115
Kbps and USB version 1.x ports have a maximum speed of 12 Kbps.
omreport chassis processors
Use the omreport chassis processors command to view properties of your system’s processors.
Values display for the following fields: Connector Name, Manufacturer, Processor Family, Processor
Version , Current Speed, External Clock Speed, and State.
Connector Name refers to the name or number of the device that occupies the processor slot in
the system.
Manufacturer is the business entity that sells the processor.
Processor Family refers to the type of processor made by a manufacturer such as Intel
®
Pentium
III.
Processor Version refers to the model and stepping number of the processor.
Current Speed is the actual processor speed in MHz at system boot time.
External Clock Speed is the speed of the processor's external clock in MHz.
State refers to whether the processor slot is enabled or disabled.
Core Count refers to the number of processors integrated onto one chip.
®
Itanium™ or
Cache Properties for a Specific Processor
To learn the cache properties for a processor on a given connector, type:
omreport chassis processors index=
n
The index parameter is optional. If you do not specify the index, Server Administrator displays
properties for all processors. If you specify the index, Server Administrator displays properties for a
specific processor.
The following fields are defined for a cache present on a particular microprocessor. If the cache is internal
to the processor, the fields do not appear in the cache report:
• Speed
• Cache Device Supported Type
• Cache Device Current Type
• External Socket Name
omreport: Viewing System Status Using the Instrumentation Service 51
Page 52

Fields Reported for Each Cache on a Particular Processor
Status reports whether a specific cache on the processor is enabled or disabled.
Level refers to primary or secondary cache. Primary-level cache is a memory bank built into the processor.
Secondary-level cache is a staging area that feeds the primary cache. A secondary-level cache may be built
into the processor or reside in a memory chip set outside the processor. The internal processor cache is
referred to as a Level 1 (or L1). L2 cache is the external cache in a system with an Intel Pentium
processor, and it is the second level of cache that is accessed. The names L1 and L2 are not indicative of
where the cache is physically located (internal or external), but describe which cache is accessed first (L1,
therefore internal).
Speed refers to the rate that the cache can forward data from main memory to the processor.
Max Size is the maximum amount of memory that the cache can hold in KB.
Installed Size is the actual size of the cache.
Ty p e indicates whether the cache is primary or secondary.
Location is the location of the cache on the processor or on a chip set outside the processor.
A Write Policy describes how the cache deals with a write cycle. In a write-back policy, the cache acts like
a buffer. When the processor starts a write cycle the cache receives the data and stops the cycle. The
cache then writes the data back to main memory when the system bus is available.
In a write-through policy, the processor writes through the cache to main memory. The write cycle does
not complete until the data is stored into main memory.
Associativity refers to the way main memory content is stored on the cache.
• A fully associative cache allows any line in main memory to be stored at any location in the cache.
• A 4-way set-associative cache directly maps four specific lines of memory to the same four lines
of cache.
• A 3-way set-associative cache directly maps three specific lines of memory to the same three lines
of cache.
• A 2-way set-associative cache directly maps two specific lines of memory to the same two lines
of cache.
• A 1-way set-associative cache directly maps a specific line of memory in the same line of cache.
For example, line 0 of any page in memory must be stored in line 0 of cache memory.
Cache Device Supported Type is the type of static random access memory (SRAM) that the device
can support.
Cache Device Current Type is the type of the currently installed SRAM that the cache is supporting.
External Socket Name Silk Screen Name is the name printed on the system board next to the socket.
Error Correction Type identifies the type of error checking and correction (ECC) that this memory can
perform. Examples are correctable ECC or uncorrectable ECC.
This report shows cache information for each cache present on the microprocessor.
52 omreport: Viewing System Status Using the Instrumentation Service
Page 53

omreport chassis pwrsupplies
Use the omreport chassis pwrsupplies command to view properties of your system’s power supplies.
Ty p e :
omreport chassis pwrsupplies index=
The index parameter is optional. If you do not specify the index, Server Administrator displays
properties for all power supplies in your system. If you specify the index, Server Administrator displays
properties for a specific processor.
For each power supply in the system, values display for the following fields: Status, Location, Ty p e , Max
Wattage, and Online Status.
n
omreport chassis slots
Use the omreport chassis slots command to view properties of your system’s power supplies. Type:
omreport chassis slots index=
The index parameter is optional. If you do not specify the index, Server Administrator displays
properties for all of the slots in your system. If you specify the index, Server Administrator displays
properties for a specific slot.
For each power supply in the system, values display for the following fields: Index, Slot ID, Adapter, and
Data Bus Width.
Index is the number of the slot in the system.
Slot ID is the silk screen name printed on your system's motherboard next to the slot. Alphanumeric text
uniquely identifies each slot in the system.
Adapter refers to the name and or type of the card that fits into the slot, for example, a storage array
controller, SCSI adapter, or HBA.
Data bus width is the width, in bits, of the information pathway between the components of a system.
Data bus width range is 16 to 64 bits.
n
omreport chassis temps
Use the omreport chassis temps command to view properties of your system’s temperature probes.
When you type:
omreport chassis temps index=
The index parameter is optional. If you do not specify the index, Server Administrator displays a
summary of status, readings, and thresholds set for any temperature probes that might be present on
your system. If you specify the index, Server Administrator displays a summary for a specific
temperature probe.
omreport: Viewing System Status Using the Instrumentation Service 53
n
Page 54

omreport chassis volts
Use the omreport chassis volts command to view properties of your system’s voltage probes. When
you type:
omreport chassis volts index=
The index parameter is optional. If you do not specify the index, Server Administrator displays a
summary of status, readings, and thresholds set for any voltage probes that might be present on your
system. If you specify the index, Server Administrator displays a summary for a specific voltage probe.
n
omreport system Commands
Use the omreport system commands to view logs, to see how shutdown actions are configured, and to
view threshold values, cost of ownership information, and information about how recovery actions are
configured.
omreport system
Use the omreport system command to see a general status for your system components. When you
specify a level 3 command, such as omreport system shutdown, you can get detailed information for one
system component rather than the high level status that you get with omreport system. Type:
omreport system
If your system has both a main system chassis and at least one direct attached storage device, Server
Administrator may display a summary that resembles the following example.
NOTE: As with all output shown in this guide, the following output is an example and may vary depending on your
system configuration.
SEVERITY : COMPONENT
Ok : Main System Chassis
Critical : Storage
54 omreport: Viewing System Status Using the Instrumentation Service
Page 55

Commands for Viewing Logs
You can use the omreport system command to view logs: the alert log, the command log, the hardware or
ESM log, and the POST log.
NOTE: If the Alert log or Command log displays invalid XML data (such as when XML data generated for the
selection is not well-formed), clearing the log by typing "omconfig system alertlog action=clear or omconfig system
cmdlog action=clear" resolves the issue. If you need to retain the log information for future reference, you should
save a copy of the log before clearing the log. See "Commands for Clearing Logs" for more information about
clearing logs.
To view the contents of the alert log, type:
omreport system alertlog
To view the contents of the command log, type:
omreport system cmdlog
To view the contents of the ESM log, type:
omreport system esmlog
To view the contents of the POST log, type:
omreport system postlog
ESM Log Overall Health Status
When you type omreport system esmlog, the Embedded Systems Management (ESM) report
displays. The first line of the report reflects the overall health of the system hardware. For example,
Health: OK means that less than 80 percent of the space allotted for the esmlog is occupied with
messages. If 80 percent or more of the allotted space for the esmlog is occupied, the following caution
appears:
Health: Non-Critical
If a caution appears, resolve all warning and critical severity conditions, and then clear the log.
omreport system alertaction
Use this command to see a summary of alert actions that have been configured for warning and failure
events on your system components. Alert actions determine how Server Administrator responds when a
component has a warning or failure event.
The omreport system alertaction command is useful for viewing which alert actions have been specified
for components. To set an alert action for a component, you must use the omconfig system alertaction
command. See "omconfig: Managing Components Using the Instrumentation Service."
omreport: Viewing System Status Using the Instrumentation Service 55
Page 56

Components and Events for Which You Can View Alert Actions
You can view alert action properties for the following components and the events:
• current probe warning
• current probe failure
•fan warning
• fan failure
• chassis intrusion
• memory pre-failure
• memory failure
• power supply failure
• degraded redundancy
• lost redundancy
• temperature warning
• temperature failure
• voltage warning
• voltage failure
• power supply warning
• processor warning
• processor failure
• hardware log warning
• hardware log full
• watchdog ASR
omreport system assetinfo
Use this command to see cost of ownership data for the system, such as acquisition, depreciation, and
warranty information. To set any of these fields, you must use the omconfig system assetinfo command.
See "omconfig: Managing Components Using the Instrumentation Service."
56 omreport: Viewing System Status Using the Instrumentation Service
Page 57

omreport system events
Use the omreport system events command to view the current enabled or disabled SNMP traps. This
command displays a summary of each component in your system for which events can be generated. For
each component, the report shows which severities are set to be reported and which severities are set not
to be reported. The following is example output for a few components:
omreport system events
Current SNMP Trap Configuration
----------System
----------Settings
Enable : Informational, Warning and Critical
Disable : None
--------------Power Supplies
---------------Settings
Enable : Informational, Warning and Critical
Disable : None
----------Fans
----------Settings
Enable : Critical
Disable : Informational and Warning
The full report lists the settings for all components in your system for which events can be generated.
To view the status for components of a specific type, use the omreport system events type=
<component name> command. This command displays a summary of each component in your system
for which events can be generated. Table 4-5 shows the events displayed for various component types.
NOTE: Some component types may be unavailable on your system.
Table 4-5. System Events by Component Type
name=value pair Description
type=accords Configures events for AC power cords.
type=currents Reports events for fan amperage probes.
type=fanenclosures
type=fans Reports events for fans.
type=intrusion Reports events for chassis intrusion.
Reports events for fan enclosures.
omreport: Viewing System Status Using the Instrumentation Service 57
Page 58

Table 4-5. System Events by Component Type (continued)
name=value pair Description
type=log Reports events for logs.
type=memory Reports events for memory.
type=powersupplies Reports events for power supplies.
type=redundancy Reports events for redundancy.
type=temps Reports events for temperatures.
type=volts Reports events for voltages.
Example Command for Event Type
When you type:
omreport system events type=fans
The following is example output:
----------Fans
----------Settings
Enable : Critical
Disable : Informational and Warning
omreport system operatingsystem
Use the omreport system operatingsystem command to display operating system information.
omreport system pedestinations
Use the omreport system pedestinations command to view destinations where alerts for a platform event
have been sent. Depending on the number of destinations displayed, you can configure a separate IP
address for each destination address.
Ty p e :
omreport system pedestinations
The output from the omreport system pedestinations command lists each of the valid parameters.
NOTE: The actual number of destinations that can be configured on your system may differ.
Table 4-6 shows the available settings.
58 omreport: Viewing System Status Using the Instrumentation Service
Page 59

Table 4-6. omreport system pedestinations
Output Attributes Description
Destination List
Destination Number: Destination1
Destination IP Address: 101.102.103.104
Destination Number: Destination 2
Destination IP Address: 110.120.130.140
Destination Number: Destination 3
Destination IP Address: 201.202.203.204
Destination Number: Destination 4
Destination IP Address: 210.211.212.213
Destination
Configuration
Settings
attribute=communitystring communitystring: Displays the text string that acts
destination 1: Displays the first destination.
101.102.103.104: IP address of the first destination.
destination 2: Displays the second destination.
110.120.130.140: IP address of the second
destination.
destination 3: Displays the third destination.
201:202:203:204: IP address of the third
destination.
destination 4: Displays the fourth destination.
210.211.212.213: IP address of the fourth
destination.
as a password and is used to authenticate SNMP
messages sent between the baseboard management
controller (BMC) and the destination management
station.
omreport system platformevents
Use the omreport system platformevents command to view how the system responds for each listed
platform event.
omreport system recovery
Use the omreport system recovery command to see whether there is an action configured for a hung
operating system. You can also view the number of seconds that must elapse before an operating system
is considered to be hung.
omreport system shutdown
Use the omreport system shutdown command to view any pending shutdown actions for your system. If
properties for shutdown are configured, executing this command displays them.
omreport: Viewing System Status Using the Instrumentation Service 59
Page 60

omreport system summary
Use the omreport system summary command to view a comprehensive summary of software and
hardware components currently installed on your system.
Example Command Output
When you type:
omreport system summary
the output that appears in your CLI window depends on the systems management software, operating system,
and hardware components and options that are installed on your system. The following partial command
results are unique and may not resemble the results for your system’s hardware and software configuration:
System Summary
-----------------Software Profile
-----------------System Management
Name : Server Administrator
Version : 2.
Description : Systems Management Software
Contains: : Instrumentation Service 5.
Operating System
Name : Microsoft Windows 2000 Server
Version : Service Pack 3 (Build 2
System Time : Fri Sep 20 18:02:52 2
System Bootup Time : Wed Sep 18 18:37:58 2
x.x
x.x
: Storage Management Service 3.x.
: Diagnostic Service 3.x.
: Sun JRE - OEM Installed Version 3.x.
: Secure Port Server 1.x.
: Dell OpenManage Core Service 1.x.
: Instrumentation Service Integration Layer 1.x.
: Storage Management Service Integration Layer 1.x.
x
x
XXX
)
XXX
XXX
x
x
x
x
x
60 omreport: Viewing System Status Using the Instrumentation Service
Page 61

The system summary hardware information includes data values for installed components of the
following types that are present in your system:
System Attributes
• Host name
• System location
Main System Chassis
Chassis
• Chassis model
• Chassis service tag
• Chassis lock
• Chassis asset tag
Processor
The following are listed for each processor in the system:
• Processor manufacturer
• Processor family
• Processor version
• Current speed
• Maximum speed
• External clock speed
•Voltage
omreport: Viewing System Status Using the Instrumentation Service 61
Page 62

Memory
• Total installed capacity
• Memory available to the operating system
• Total maximum capacity
• Memory array count
Memory Array
The following details are listed for each memory board or module in the system (for example, the system
board or the memory module in a given slot number):
• Location
•Use
• Installed capacity
• Maximum capacity
• Slots available
• Slots used
• ECC type
BIOS
• Manufacturer
• BIOS version
• Release date
• BIOS firmware information
•Name
• BIOS firmware version
Firmware
•Name
•Version
62 omreport: Viewing System Status Using the Instrumentation Service
Page 63

Network Interface Card
The following details are listed for each NIC in the system:
• IP address
• Subnet mask
• Default gateway
• MAC address
Storage Enclosures
The following details are listed for each storage enclosure attached to the system:
•Name
• Product ID
omreport system thrmshutdown
Use the omreport system thrmshutdown command to view which properties, if any, have been
configured for a thermal shutdown action.
The three properties that display for thermal shutdown are disabled, warning, or failure. If the
CLI displays the following message, the thermal shutdown feature has been disabled:
Thermal protect shutdown severity: disabled
If the system is configured to shutdown when a temperature probe detects a warning or failure event, one
of the following messages displays:
Thermal protect shutdown severity: warning
Thermal protect shutdown severity: failure
omreport: Viewing System Status Using the Instrumentation Service 63
Page 64

omreport system version
Use the omreport system version command to list the version numbers of the BIOS, firmware, systems
management software, and operating system that are installed on your system.
Example Command Output
When you type:
omreport system version
the output that appears in your CLI window depends on the version of the BIOS, RAID controllers, and
firmware installed on your system. The following partial command results are unique and may not
resemble the results for your system’s configuration:
System Version Report
--------------------Main System Chassis
--------------------Name : BIOS
Version : A12
Updateable : N/A
Name : Baseboard Management Controller
Version : 1.74
Updateable
: N/A
Name : Primary Backplane
Version : 1.01
Updateable : N/A
--------------------Software
--------------------Name
Version
Updateable : N/A
Name : Dell Server Administrator
Version : 2.0.0
Updateable : N/A
64 omreport: Viewing System Status Using the Instrumentation Service
: Microsoft Windows 2000 Advanced Server
: 5.0 Service Pack 4 (Build 2195) on x86
Page 65

omreport storage: Using the Storage Reports
Use the omreport storage command to view information about enclosures, volumes, arrays, and
disks that are part of your storage system.
NOTE: This chapter only documents commands that are available when Array Manager is installed. See
"Using the Storage Management Service" for information on using the omreport storage command when the
enhanced Storage Management Service is installed. See the Dell OpenManage™ Server Administrator User’s
Guide for information on Array Manager and the enhanced Storage Management Service. See the Dell
OpenManage Installation and Security User's Guide for installation information.
Conventions for Parameter Tables
When listing the parameters that a command can take, the parameters are listed in alphabetical
order instead of the order in which they appear in the command line interface.
The symbol |, often called pipe, is the logical exclusive or operator. For example, enable | disable
means that you can enable or disable the component or feature, but you cannot simultaneously
enable and disable the component or feature.
omreport storage Command Summary
NOTE: Although this section lists all possible omreport storage commands, the commands available on your
system depend on your system configuration. The results that display for the omreport storage command vary
from one system to another. Data displays for installed components only.
Table 5-1 is a high-level summary of the omreport storage command. The column titled "Command
level 1" shows the omreport command at its most general. "Command level 2" shows the major
objects or components that you can view using omreport storage. "Command level 3" lists the
specific storage objects and components for which you can view reports. "User privilege required"
refers to the type of privilege you need to perform the command, where U=User, P=Power User, and
A=Administrator. "Use" is a very general statement about the actions that can be performed using
omreport storage. More details about syntax and use of the command appear later in this section.
omreport storage: Using the Storage Reports 65
Page 66

Table 5-1. omreport storage Command Level 1, Level 2, and Level 3
Command
level 1
omreport
Command
level 2
storage A Displays a high-level status for all
Command
level 3
arraydisks A Displays a high-level status for array disks.
arrays A Displays detailed information for an array
osdiskinfo A Displays detailed information for a
osdisks A Displays operating system disk properties.
volumes A Displays properties for all volumes.
enclosures A Displays properties for all enclosures.
enclosureinfo A Displays detailed information for a
User privilege
required
Use
storage components.
disk on a particular controller.
particular operating system disk.
particular enclosure.
omreport storage Commands
When you type:
omreport storage
Server Administrator displays a general status for storage components.
NOTE: As with all output shown in this guide, the following output is an example and may vary depending on your
system configuration.
SEVERITY : COMPONENT
Ok : Array Subsystems
Warning : OS Disks
Ok : Volumes
66 omreport storage: Using the Storage Reports
Page 67

omreport storage arraydisks
Use the omreport storage arraydisks controller=ID command (where ID is the ID number for the
controller that controls the disks in the array) to view information for all enclosures and disks attached to
a specific RAID controller. For example, if the controller's ID is "447244640307," enter the following
command to see all enclosures and disks attached to that controller:
omreport storage arraydisks controller=47244640307
The report includes the following information for each enclosure in the array:
• ID — Assigned ID number for the enclosure.
• Status — Status of the enclosure.
Name — Name
•
• Application Version — Version of firmware installed on the enclosure.
• Product ID — Vendor-assigned ID for the enclosure.
• Asset Tag — A label that specifies either manufacturer's information or, in the case of a customerspecified asset tag, customer's information (such as inventory number, serial number, and so on).
• Service Tag — An alphanumeric code that uniquely identifies a storage device.
The report includes the following information for each physical disk in the array:
• Status — Status of the disk.
• Name — Name of the array disk. If more than one array disk comprises a virtual disk, the name may
include the number of the array disk, for example, ArrayDisk0:0, ArrayDisk0:1 means the first and
second array disks on virtual disk 0.
• State — Current state of the array disk.
• Type — Type of disk, such as SCSI. Also indicates the port ID and LUN for the disk.
• Product ID — Vendor-assigned ID for the physical disk.
• Rev — Revision number of the firmware on the array disk.
• Vendor — Manufacturer of the disk.
• Capacity — Amount of total storage space on the physical disk.
• Unallocated Space — Amount of usable storage space that is available.
If you want to see all disks that comprise a virtual disk, use the virtual disk ID in the command. For
example, to see all disks that make up a virtual disk with the ID of "47244640361," type the
following command:
omreport storage arraydisks vdisk=47244640361
of the enclosure.
NOTE: You can find virtual disk and controller IDs by running the omreport storage arrays command, which shows
the properties for all of the controllers in the system.
omreport storage: Using the Storage Reports 67
Page 68

omreport storage arrays
Use the omreport storage arrays command to view detailed information about the disk controller and
the storage subsystems attached to the controller. The following information is provided about
the controller:
• ID — Assigned ID number for the controller.
• Name — Name of the controller.
• State — Current state of the controller.
• Firmware Version— Version of firmware installed on the controller.
For each controller, you can view the following information about the virtual disks controlled by
the controller:
• ID — Assigned ID number for the virtual disk.
• Status — Status of the virtual disk.
• Name — Name of the virtual disk.
• State — Current state of the virtual disk.
• Read Cache — Read policies indicate whether or not the controller should read sequential sectors of
the logical drive when seeking data. The read policies are as follows:
– Read-Ahead — When using read-ahead policy, the controller reads sequential sectors of the logical
drive when seeking data. Read-ahead policy may improve system performance if the data is
actually written to sequential sectors of the logical drive.
– No-Read-Ahead — Selecting no-read-ahead policy indicates that the controller should not use
read-ahead policy.
– Adaptive Read-Ahead — When using adaptive read-ahead policy, the controller initiates read-
ahead only if the two most recent read requests accessed sequential sectors of the disk. If
subsequent read requests access random sectors of the disk, the controller reverts to no-read-ahead
policy. The controller continues to evaluate whether read requests are accessing sequential sectors
of the disk, and can initiate read-ahead if necessary.
68 omreport storage: Using the Storage Reports
Page 69

• Write Cache — Write policies specify whether the controller sends a write-request completion signal
as soon as the data is in the cache or after it has been written to disk. The write policies are as follows:
– Write-Back Caching — When using write-back caching, the controller sends a write-request
completion signal as soon as the data is in the controller cache but has not yet been written to
disk. Write-back caching may provide improved performance since subsequent read requests can
more quickly retrieve data from the controller cache than they could from the disk. Write-back
caching also entails a data security risk, however, since a system failure could prevent the data from
being written to disk even though the controller has sent a write-request completion signal. In this
case, data may be lost. Other applications may also experience problems when taking actions that
assume the data is available on the disk.
– Write-Through Caching — When using write-through caching, the controller sends a write-
request completion signal only after the data is written to the disk. Write-through caching
provides better data security than write-back caching, since the system assumes the data is
available only after it has been safely written to the disk.
• Cache Policy — Indicates whether read cache, write cache, or both are enabled for a specific disk.
The direct I/O and cache I/O cache policies apply to reads on a specific logical drive. These settings do
not affect the read-ahead policy. The cache I/O and direct I/O cache policies are as follows:
– Cache I/O — Specifies that all reads are buffered in cache memory.
– Direct I/O (default) — Specifies that reads are not buffered in cache memory. When using direct
I/O, data is transferred to the controller cache and the host system simultaneously during a read
request. If a subsequent read request requires data from the same data block, it can be read directly
from the controller cache. The direct I/O setting does not override the cache policy settings.
• Layout — RAID level for the array. See your Array Manager documentation for more information
about RAID levels.
• Size — Amount of storage on the disk in GB.
omreport storage: Using the Storage Reports 69
Page 70

omreport storage enclosureinfo
Use the omreport storage enclosureinfo enclosure=ID command (where ID is the ID number for the
enclosure) to view information about a single enclosure. For example, if the enclosure's ID is
"447244640512," enter the following command to see detailed information for that enclosure:
omreport storage enclosureinfo enclosure=47244640512
NOTE: You can find an enclosure ID by running the omreport storage enclosures command, which shows the
properties for all of the enclosures in the system.
The following information displays for the enclosure:
•Fans
– Status — Status of the fan.
– Name — Name of the fan.
– State — Current state of the fan.
– Speed — Speed at which the fan is running.
• Temperature Probes
– Status — Status of the temperature probes.
– State — State of the temperature probes.
– Reading — Actual temperature measured by a particular probe. Readings are always a snapshot of
a device's measurements at a point in time.
– Minimum Warning Threshold — Minimum temperature, expressed in degrees, that will activate
an alarm.
– Maximum Warning Threshold — Maximum temperature, expressed in degrees, that will activate
an alarm.
– Minimum Failure Threshold — Minimum temperature, expressed in degrees, that will cause the
enclosure to fail.
– Maximum Failure Threshold — Maximum temperature, expressed in degrees, that will cause the
enclosure to fail.
– Units — Measurement type of temperature, such as Celsius.
• Power Supplies
– Status — Status of the power supplies.
– Name — Name of the power supply, such as "Power Supply 1."
– State — Current state of the power supply.
70 omreport storage: Using the Storage Reports
Page 71

omreport storage enclosures
Use the omreport storage enclosures command to view the enclosures that contain array disks for a
particular controller. The following information displays for each enclosure on the controller:
• ID — Assigned ID number for the enclosure.
• Status — Status of the enclosure.
• Name — Name of the enclosure.
• Application Version — Version of firmware on the enclosure.
• Product ID — Identifying information for the storage enclosure, such as model and short description.
• Asset Tag — A label that specifies either manufacturer's information or, in the case of a customer-specified
asset tag, customer's information (such as inventory number, serial number, and so on).
• Service Tag — An alphanumeric code that uniquely identifies a storage device.
omreport storage osdiskinfo
Use the omreport storage osdiskinfo osdisk=ID command (where ID is the ID number for the operating
system disk) to view detailed information for the operating system disks. For example, if the operating
system disk's ID is "447244640714," enter the following command to see the disks that comprise the
operating system disk:
omreport storage osdiskinfo osdisk=447244640714
NOTE: You can find the ID by using the omreport storage osdisks command, which provides information for all
operating system disks.
The osdiskinfo command provides information, as applicable, about the volumes, virtual disks, and array
disks that make up an operating system disk.
osdiskinfo provides the following information about the volumes that contain operating system disks:
• Status — Status of the volume.
• Label — Name of the volume.
• State — State of the volume.
• File System — File system for the volume, such as NTFS or FAT.
• Size — Total space on the volume in GB.
• Free Space — Space available for creating logical drives within an extended partition, in GB.
The osdiskinfo command provides the following information about the virtual disk(s) that comprise the
operating system disk:
• Status — Status of the virtual disk.
• Name — Name of the virtual disk.
• State — Current state of the virtual disk.
omreport storage: Using the Storage Reports 71
Page 72

• Read Cache — Read policies indicate whether or not the controller should read sequential sectors of
the logical drive when seeking data. The read policies are as follows:
– Read-Ahead — When using read-ahead policy, the controller reads sequential sectors of the logical
drive when seeking data. Read-ahead policy may improve system performance if the data is
actually written to sequential sectors of the logical drive.
– No-Read-Ahead — Selecting no-read-ahead policy indicates that the controller should not use
read-ahead policy.
– Adaptive Read-Ahead — When using adaptive read-ahead policy, the controller initiates read-
ahead only if the two most recent read requests accessed sequential sectors of the disk. If
subsequent read requests access random sectors of the disk, the controller reverts to no-read-ahead
policy. The controller continues to evaluate whether read requests are accessing sequential sectors
of the disk, and can initiate read-ahead if necessary.
• Write Cache — Write policies specify whether the controller sends a write-request completion signal
as soon as the data is in the cache or after it has been written to disk. The write policies are as follows:
– Write-Back Caching — When using write-back caching, the controller sends a write-request
completion signal as soon as the data is in the controller cache but has not yet been written to
disk. Write-back caching may provide improved performance since subsequent read requests can
more quickly retrieve data from the controller cache than they could from the disk. Write-back
caching also entails a data security risk, however, since a system failure could prevent the data from
being written to disk even though the controller has sent a write-request completion signal. In this
case, data may be lost. Other applications may also experience problems when taking actions that
assume the data is available on the disk.
– Write-Through Caching — When using write-through caching, the controller sends a write-
request completion signal only after the data is written to the disk. Write-through caching
provides better data security than write-back caching, since the system assumes the data is
available only after it has been safely written to the disk.
• Cache Policy — Indicates whether the cache policy for privileges to read from and write to the disk
cache is enabled or not.
The direct I/O and cache I/O cache policies apply to reads on a specific logical drive. These settings do
not affect the read-ahead policy. The Cache I/O and Direct I/O cache policies are as follows:
– Cache I/O — Specifies that all reads are buffered in cache memory.
– Direct I/O (default) — Specifies that reads are not buffered in cache memory. When using direct
I/O, data is transferred to the controller cache and the host system simultaneously during a read
request. If a subsequent read request requires data from the same data block, it can be read
directly from the controller cache. The direct I/O setting does not override the cache
policy settings.
• Layout — RAID level on the virtual disk. See your Array Manager documentation for
more information.
• Size — Amount of storage on the virtual disk in GB.
72 omreport storage: Using the Storage Reports
Page 73

The omreport storage osdiskinfo command provides the following information about the physical array
disks that comprise the operating system disk:
• Status — Status of the array disk.
• Label — Name of the array disk. If more than one array disk comprises a virtual disk, the name may
include the number of the array disk, for example, ArrayDisk0:0, ArrayDisk0:1 means the first and
second array disks that make ArrayDisk0.
• State — Current state of the array disk.
• Controller — Name of the RAID controller that controls the array disk.
omreport storage osdisks
Use the omreport storage osdisks command to view information about all of your operating system disks.
The following information displays for each disk that contains operating system files:
• ID — Assigned ID number for the disk. You can use this number in conjunction with the
storage osdiskinfo
"omreport storage osdiskinfo" for more information.
• Status — Status of the operating system disk.
• Name — Name of the operating system disk.
• State — Current state of the operating system disk.
• Type — Type of disk, such as SCSI. Also indicates the port ID and LUN for the operating system disk.
• Vendor — Manufacturer of the disk.
• Unallocated Space — Amount of usable storage space that is available.
You can view operating system disk information for a volume by entering the volume ID as part of the
parameter. For example:
omreport storage osdisks volume=60129542154
command to view information about a specific operating system disk. See
omreport
You obtain a volume's ID by running the omreport storage volumes command. See "omreport storage
volumes" for more information.
omreport storage: Using the Storage Reports 73
Page 74

omreport storage volumes
Use the omreport storage volumes command to view information about the volumes on your storage
system. The following information displays for each volume:
• ID — Assigned ID number for the volume. You can use this number in conjunction with the
storage osdisks
See "omreport storage osdisks" for more information.
• Status — Status of the volume.
• Label — Name of the volume.
• State — Current state of the volume.
• File System — File system for the volume, such as NTFS or FAT.
• Size — Total space on the volume in GB.
• Free Space— Space available for creating logical drives within an extended partition, in GB.
command to view information about an operating system disk on a specific volume.
omreport
74 omreport storage: Using the Storage Reports
Page 75

omconfig: Managing Components Using the Instrumentation Service
The omconfig command allows you to provide values that define warning events, configure alert
actions, clear logs, and configure system shutdown, as well as allowing you to perform other systems
management tasks.
Examples of omconfig capabilities include the administrator's privilege to clear command, alert, and
hardware logs; the administrator's privilege to configure and execute system shutdown; power user
and administrator's privilege to default or specify values for warning events on current probes, fans,
voltage probes, and temperature probes; power user and administrator's privilege to set alert actions
in the event of a warning or failure event from intrusion, current probes, fans, voltage probes, and
temperature probes.
For information on how to use the omconfig system command to view and to manage cost of
ownership information (assetinfo), see "omconfig system assetinfo: Editing Cost of Ownership Values."
Often you must use the omreport commands to get the information you need to execute an
omconfig command. For example, if you want to edit the minimum temperature for a warning event
on a temperature probe, you need to know the index of the probe you want to configure. You can use
the omreport chassis temps command to display a list of probes and their indexes. For more
information on using the omreport command, see "omreport: Viewing System Status Using
the Instrumentation Service."
Conventions for Parameter Tables
When listing the parameters that a command can take, the parameters are listed in alphabetical
order instead of the order in which they appear in the command line interface.
The symbol |, often called pipe, is the logical exclusive or operator. For example, enable | disable
means that you can enable or disable the component or feature, but you cannot simultaneously
enable and disable the component or feature.
omconfig: Managing Components Using the Instrumentation Service 75
Page 76

omconfig Command Summary
NOTE: Although this section lists all possible omconfig commands, the commands available on your system depend
on your system configuration. If you try to get help or execute a command for a component that is not installed on
your system, Server Administrator issues a message that the component or feature is not "found on this system."
NOTE: For Microsoft
OpenManage™ Array Manager User's Guide for instructions.
®
Windows
Table 6-1 is a high-level summary of the omconfig command. The columns titled "Command level 2"
and "Command level 3" list the major arguments that can be used with omconfig. "User privilege
required" refers to the type of privilege you need to perform the command, where U=User, P=Power User,
and A=Administrator. "Use" is a very general statement about the actions that can be performed using
omconfig. More details about syntax and use of the command appear later in this section.
Table 6-1. omconfig Command Level 1, Level 2, and Level 3
®
systems, use Array Manager to configure an external chassis. See the Dell
Command
level 1
omconfig
Command
level 2
about U, P, A Shows version number and properties for the
preferences
system
Command
level 3
details=true U, P, A Displays information for all of the Server
cdvformat A Specifies the delimiter for separating data fields
dirservice A Configures the Active Directory service.
snmp A Sets the SNMP root password.
useraccess A Determines whether users below the
alertaction P, A Determines in advance what actions are to be
alertlog P, A Allows the administrator to clear the log.
assetinfo P, A Enters and edits cost of ownership information
cmdlog P, A Allows the administrator to clear the log.
User privilege
required
Use
Server Administrator program.
Administrator programs that are installed.
reported in custom delimited format (cdv).
administrator level are allowed to use Server
Administrator or not.
taken for warning or failure events on
intrusion, fans, temperatures, voltages, power
supplies, memory, and redundancy.
for your system, including values for depreciation,
lease, maintenance, service, and support.
76 omconfig: Managing Components Using the Instrumentation Service
Page 77

Table 6-1. omconfig Command Level 1, Level 2, and Level 3 (continued)
Command
level 1
Command
level 2
chassis
Command
level 3
esmlog P, A Allows the administrator to clear the log.
events P, A Enables and disables SNMP traps.
pedestinations P, A Sets IP addresses for alert destinations.
platformevents A Determines the shutdown action, if any, to be
recovery P, A Determines in advance how your system
shutdown A Allows the administrator to select from several
thrmshutdown A Sets the severity level at which a thermal event
webserver A Starts or stops the Web server.
biossetup A Configures behavior of specific system
bmc P, A Configures the baseboard management
currents P, A Configures current probe warning thresholds
fans P, A Configures fan probe warning thresholds by
User privilege
required
Use
taken for a specific platform event. Also,
enables and disables platform events filter
alert generation.
responds to a hung operating system.
options when shutting down the system.
triggers a system shutdown.
components that are controlled by the BIOS.
controller (BMC).
by default or by value.
default or by value.
NOTE: You cannot set warning threshold values
by default on embedded server management
(ESM3) systems.
fancontrol P, A Allows you to optimize fan speed for
maximum cooling or quiet operation.
frontpanel A Configures the Power button and Nonmasking
Interrupt (NMI) button if present on the system.
info P, A Allows you to set an initial value for, or to edit
the value for, asset tag or chassis name.
leds P, A Specifies when to flash a chassis fault LED or
chassis identification LED, and allows you to
clear the LED for the system's hard drive.
omconfig: Managing Components Using the Instrumentation Service 77
Page 78

Table 6-1. omconfig Command Level 1, Level 2, and Level 3 (continued)
Command
level 1
Command
level 2
Command
level 3
memorymode A Enables or disables the spare bank and
temps P, A Sets warning threshold values by default or value.
User privilege
required
Use
mirroring memory modes, and also specify
which mode to use.
NOTE: You cannot set warning threshold values
by default on ESM3 systems.
volts P, A Sets warning threshold values by default or value.
NOTE: You cannot set warning threshold values
by default on ESM3 systems.
storage See "Using the Storage Management Service."
Help With the omconfig Command
Use the omconfig -? command to get a list of the available commands for omconfig.
Use omconfig <command level 2> -? to get help on the level 2 commands about, chassis, preferences,
and system. The following information on omconfig system -? applies equally to getting help for the
omconfig chassis command.
Use the omconfig system -? command to get a list of the available commands for omconfig system.
Use the omconfig preferences -? command to get a list of the available commands for omconfig
preferences, such as cdvformat, which is the custom delimiter format (cdv). Type the following
command to display the list of delimiter values for the cdv:
omconfig preferences cdvformat -?
Use a command of the form omconfig system <command level 3> -? to get a list of the parameters you
must use to execute a particular omconfig system command. For example, the following commands
produce a list of valid parameters for omconfig system alertaction and omconfig system shutdown:
omconfig system alertaction -?
omconfig system shutdown -?
In the case of the omconfig system alertaction command, you can use various options to prevent all of
the CLI help from scrolling by before you can read it.
To scroll command output one screen at a time, type:
omconfig system alertaction -? | more
where | more allows you to press the spacebar to see the next screen of CLI help output.
78 omconfig: Managing Components Using the Instrumentation Service
Page 79

To make a file that contains all of the help for the omconfig system alertaction -? command, type:
omconfig system alertaction -? -outa alert.txt
where -outa directs the output of the command to a file called alert.txt.
®
To read the help for the alertaction command on a Microsoft Windows or Red Hat
operating system, type:
more alert.txt
Enterprise Linux
omconfig about
Use the omconfig about command to learn the product name and version number of the systems
management application installed on your system. The following is example output from the omconfig
about command:
Product name : Server Administrator
Version : 2.
Copyright : Copyright (C) Dell Inc.
1995-2005. All rights reserved.
Company : Dell Inc.
For even more details about the environment for Server Administrator, type:
omconfig about details=true
Server Administrator includes a number of services, each of which has a version number of its own. The
Contains field reports version numbers for the services and provides other useful details. The output
that follows is an example, and it can change depending on your configuration and the version of Server
Administrator that is available:
x.x
Contains: Instrumentation Service 5.
Storage Management Service 3.x.
Diagnostic Service 2.x.
Sun JRE - OEM Installed Version 3.x.
Secure Port Server 1.x.
Core Service 1.x.
Instrumentation Service Integration Layer 1.x.
Storage Management Service Integration
Layer 1.
Server Administrator 2.x.
x.x
omconfig: Managing Components Using the Instrumentation Service 79
x
x
x
x.x
x
x
x
x
Page 80

omconfig chassis
Use the omconfig chassis commands to default or to set values for current, fan, voltage, and temperature
probes, to configure BIOS behavior during system start up, to clear memory error counts, and to enable
or disable power button control features where system configuration permits.
Use the omconfig chassis -? command to see a list of all omconfig chassis commands.
NOTE: When you issue CLI commands to a server module in a modular system, chassis refers only to the
server module.
omconfig chassis biossetup
Use the omconfig chassis biossetup command to configure system BIOS settings that are normally
available only in your system's BIOS setup boot time settings.
NOTICE: Changing certain BIOS setup options might disable your system or require you to reinstall the
operating system.
NOTE: You must reboot your system before any changes to the BIOS setup options take effect.
NOTE: Not all BIOS setup options are available on every system.
Table 6-2 shows the name=value pairs you can use with this command.
Table 6-2. BIOS Setup
name=value pair 1
attribute=
attribute=acpwrrecovery setting=off | last | on off: System is turned off.
attribute=bezel setting=enable | disable enable: Enable the bezel removal
attribute=bootsequence setting=diskettefirst | hdonly
attribute=conredirect setting=enable | disable enable: Redirects the BIOS screen over
name=value pair 2
setting=
| devicelist |cdromfirst
Description
last: System returns to previous state.
on: System is turned on.
intrusion check during system boot.
disable: Disable the bezel removal
intrusion check during system boot.
Tells the BIOS which device is used to
boot the system, and the order in which
the boot routine is to check each device.
Serial Port 1. Keyboard and text output
are redirected over Serial Port 2.
disable: Turns off the BIOS console
redirection.
80 omconfig: Managing Components Using the Instrumentation Service
Page 81

Table 6-2. BIOS Setup (continued)
name=value pair 1
attribute=
attribute=dbs setting=enable | disable enable: Enables Demand Based Power
attribute=diskette setting=off | auto | writeprotect off: Disable the diskette drive.
attribute=dualnic setting=off | onpxeboth |
attribute=fbr setting=9600 | 19200 | 57600 |
attribute=ide setting=on | off
attribute=idepridrv setting=off | auto off: Disable the device.
attribute=intrusion setting=enable | disable enable: Enable the intrusion check
name=value pair 2
setting=
onpxenone | onpxenic1 |
onpxenic2
115200
force=true
Description
Management (DBS) on the system.
disable: Disables DBS on the system.
auto: Auto enable the diskette drive.
writeprotect
the diskette drive read only.
off: The NICs are disabled.
onpxeboth: Both the NICs are PXE
enabled.
onpxenone: PXE is not enabled on
either of the NICs.
onpxenic1: PXE is enabled on NIC 1.
onpxenic2: PXE is enabled on NIC 2.
9600: Sets the console redirection failsafe
baud rate to 9600 bits per second.
19200: Sets the console redirection failsafe
baud rate to 19200 bits per second.
57600: Sets the console redirection failsafe
baud rate to 57600 bits per second.
115200: Sets the console redirection failsafe
baud rate to 115200 bits per second.
on: Enable this device.
off: Disable this device.
force=true: Verification of setting change.
auto: Automatically detect and enable
the device.
during system boot. If the system also
has bezel intrusion checking, then the
intrusion option checks for removal of
the back of the system.
disable: Disable the intrusion check
during system boot.
: Do not allow writes. Make
omconfig: Managing Components Using the Instrumentation Service 81
Page 82

Table 6-2. BIOS Setup (continued)
name=value pair 1
attribute=
attribute=mouse setting=on | off on: Enable the mouse.
attribute=nic setting=enabled | disabled
attribute=nic2 setting=enabled | disabled
attribute=numlock setting=on | off on: Use the keypad as number keys.
attribute=ppaddress setting=off | lpt1 | lpt2 | lpt3 off: Disable the parallel port address.
attribute=ppmode setting=at | ps2 | ecp | epp at: Set the parallel port mode to type AT.
name=value pair 2
setting=
| enablednonepxe
| enablednonepxe
Description
off: Disable the mouse.
enabled: Enable the NIC during system
boot (with PXE on if the system has PXE).
disabled: Disable the NIC during
system boot.
enablednonepxe: Enable the NIC during
system boot (with PXE off if the system
has PXE).
enabled: Enable the second NIC during
system boot (with PXE on if the system
has PXE).
disabled: Disable the second NIC during
system boot.
enablednonepxe: Enable the second
NIC during system boot (with PXE off if
the system has PXE)S.
off: Use the keypad as arrow keys.
lpt1: Locate the device on LPT1.
lpt2: Locate the device onLPT2.
lpt3: Locate the device on LPT3.
ps2: Set the parallel port mode to
type PS/2.
ecp: Set the parallel port mode to type
ECP (extended capabilities port).
epp: Set the parallel port mode to type
EPP (enhanced parallel port).
82 omconfig: Managing Components Using the Instrumentation Service
Page 83

Table 6-2. BIOS Setup (continued)
name=value pair 1
attribute=
attribute=primaryscsi setting=on | off
attribute=romb setting=raid | off | scsi
attribute=romba setting=raid | scsi
attribute=rombb setting=raid | scsi
attribute=sata setting=off| ata | raid off: Disables SATA controller.
name=value pair 2
setting=
force=true
force=true
force=true
force=true
Description
NOTICE: If you modify the setting for
primary scsi, romb, romba, or rombb, your
system becomes inoperable until you
reinstall the operating system.
on: Enable this device.
off: Disable this device.
force=true: Verification of
setting change.
raid: Instructs the BIOS to detect
RAID-on-motherboard as a RAID device.
off: Disable the device during
system boot.
scsi: Instructs the BIOS to detect this
device as a SCSI device.
force=true: Verification of setting
change.
raid: Instructs the BIOS to detect
RAID-on-motherboard channel A as a
RAID device.
scsi: Instructs the BIOS to detect this
device as a SCSI device.
force=true: Verification of
setting change.
raid: Instructs the BIOS to detect
RAID-on-motherboard channel B as a
RAID device.
scsi: Instructs the BIOS to detect this
device as a SCSI device.
force=true: Verification of setting
change.
ata: Sets the onboard SATA controller to
ATA mode.
raid: Sets the onboard SATA controller
to RAID mode.
omconfig: Managing Components Using the Instrumentation Service 83
Page 84

Table 6-2. BIOS Setup (continued)
name=value pair 1
attribute=
attribute=sataport (0...7) setting=off | auto off: Disable the SATA port.
attribute=secondaryscsi setting=on | off on: Enable this device.
attribute=serialport1 setting=off | auto | com1 | com3
attribute=serialport2 setting=off | auto | com2 | com4 off: Disable serial port 2.
attribute=speaker setting=on | off on: Enable the speaker.
attribute=usb setting=enabled | disabled
attribute=usbb setting=enabled |
name=value pair 2
setting=
| bmcserial | bmcnic | rac
enabledwithbios| disabled
Description
auto: Automatically enable the
SATA port.
off: Disable this device.
off: Disable serial port 1.
auto: Map serial port 1 to a COM port.
com1: Map serial port 1 to COM port 1.
com3: Map serial port 1 to COM port 3.
bmcserial: Map serial port 1 to
BMC Serial.
bmcnic: Map serial port 1 to BMC NIC.
rac: Map serial port 1 to RAC.
auto: Map serial port 2 to a COM port.
com2: Map serial port 2 to COM port 2.
com4: Map serial port 2 to COM port 4.
off: Disable the speaker.
NOTE: Only one of the two attributes usb
and usbb is available for configuring the
USB port(s), depending on your system’s
hardware.
enabled: Enable the USB port(s).
disabled: Disable the USB port(s).
enabled: Enable the USB port(s) during
system boot, without BIOS support.
enabledwithbios: Enable the USB
port(s) during the system boot, with
BIOS support.
disabled: Disable the USB port(s) during
system boot.
84 omconfig: Managing Components Using the Instrumentation Service
Page 85

omconfig chassis bmc
Use the omconfig chassis bmc command to configure:
• The BMC on a local area network (LAN)
• The serial port for BMC
• The BMC on a serial over LAN connection
• Terminal settings for the serial port
• Advanced settings for a serial over LAN connection
• Information on a BMC user
NOTE: You have to enter the user ID to configure user information.
Ty p e :
omconfig chassis bmc
The output from the omconfig chassis bmc command lists each of the available configurations.
Table 6-3 shows the valid parameters:
Table 6-3. omconfig chassis bmc
name=value pair 1
config=
config=advsol characcuminterval=number number: Sets the character
config=nic enable=true | false true: Enables IPMI over LAN.
name=value pair 2 Description
accumulate interval in 5 millisecond
intervals.
charsendthreshold=number number: Sets the number of
characters. BMC automatically sends
a serial over LAN data packet that
contains this number of characters as
soon as this number of characters
(or greater) has been accepted from
the baseboard serial controller into
the BMC.
false: Disables IPMI over LAN.
gateway=Gateway gateway: Sets a gateway address if you
have selected static as the IP address
source for the BMC LAN interface.
IP address=IP ip: Sets the IP address if you have
selected static as the IP address source
for the BMC LAN interface.
omconfig: Managing Components Using the Instrumentation Service 85
Page 86

Table 6-3. omconfig chassis bmc (continued)
name=value pair 1
config=
config=nic (continued) ipsource=static | dhcp |
name=value pair 2 Description
systemsoftware
privilegelevel=administrator | operator
| user
subnet=Subnet subnet: Sets a subnet mask if you have
vlanenable=true | false true: Enables the virtual
vlanid=number number: Virtual LAN identification in
vlanpriority=number number: Priority of virtual LAN
static: Static if the IP address of the
BMC LAN interface is a fixed,
assigned IP address.
dhcp: DHCP if the source of the
IP address of the BMC LAN interface
is the dynamic host
configuration protocol.
systemsoftware: System software if
the source of the IP address of the
BMC LAN interface is from the
system software.
NOTE: Not all commands may be
supported on the system.
administrator: Sets the maximum
privilege level that can be accepted on
a LAN channel to Administrator.
operator: Sets the maximum privilege
level that can be accepted on a
LAN channel to Operator.
user: Sets the maximum privilege
level that can be accepted on a
LAN channel to User.
selected static as the IP address source
for the BMC LAN interface.
LAN identification.
false: Disables the virtual
LAN identification.
the range of 1 to 4094.
identification in the range of 0 to 7.
86 omconfig: Managing Components Using the Instrumentation Service
Page 87

Table 6-3. omconfig chassis bmc (continued)
name=value pair 1
config=
config=serial baudrate=9600 | 19200 | 38400
name=value pair 2 Description
| 57600
flowcontrol=none | rtscts none: No control over the flow of
mode=directbasic | directterminal |
directbasicterminal | modembasic |
modemterminal | modembasicterminal
9600: Sets connection speed to 9600
bits per second.
19200: Sets connection speed to
19200 bits per second.
38400: Sets connection speed to
38400 bits per second.
57600: Sets connection speed to
57600 bits per second.
communication through the serial
port.
rtscts: RTS is ready to send and
CTS is clear to send.
directbasic: Type of messaging used
for IPMI messaging over a
serial connection.
directterminal: Messaging that uses
printable ASCII characters and that
allows a limited number of text
commands over a serial connection.
directbasicterminal: Both basic and
terminal mode messaging over a
serial connection.
modembasic: Type of messaging used
for IPMI messaging over a modem.
modemterminal: Messaging that uses
printable ASCII characters and that
allows a limited number of text
commands over a modem.
modembasicterminal: Both basic and
terminal messaging over a modem.
NOTE: Not all commands may be
supported on the system.
omconfig: Managing Components Using the Instrumentation Service 87
Page 88

Table 6-3. omconfig chassis bmc (continued)
name=value pair 1
config=
config=serial
(continued)
config=settodefault Takes the default configuration
config=terminalmode deletecontrol=outputdel |
name=value pair 2 Description
privilegelevel=administrator | operator
| user
enable=true | false true: Enables serial over LAN for
baudrate=9600 | 19200 9600: Sets the volatile and nonvolatile
privilegelevel=administrator | operator
| user
outputbkspspbksp
administrator: Sets the maximum
privilege level that can be accepted on
a serial connection, to Administrator.
operator: Sets the maximum privilege
level that can be accepted on a serial
connection, to Operator.
user: Sets the maximum privilege
level that can be accepted on a serial
connection, to User.
the BMC.
false: Disables serial over LAN for
the BMC.
connection speed to 9600 bits per
second.
19200: Sets the volatile and
nonvolatile connection speed to
19200 bits per second.
administrator: Sets the maximum
privilege level that can be accepted on
a serial over LAN channel, to
Administrator.
operator: Sets the maximum privilege
level that can be accepted on a serial
over LAN channel, to Operator.
user: Sets the maximum privilege
level that can be accepted on a serial
over LAN channel, to User.
settings.
outputdel: BMC outputs a <del>
character when <bksp> or <del> is
received.
outputbkspspbksp: BMC outputs a
<bksp><sp><bksp> character
when <bksp> or <del> is received.
88 omconfig: Managing Components Using the Instrumentation Service
Page 89

Table 6-3. omconfig chassis bmc (continued)
name=value pair 1
config=
config=terminalmode
(continued)
name=value pair 2 Description
echocontrol=enabled | disabled enabled: Enables characters to be sent
to the screen.
disabled: Disables characters to be
sent to the screen.
handshakingcontrol=enabled | disabled enabled: Directs the BMC to output a
character sequence that indicates
when its input buffer is ready to
accept another command.
disabled: Does not direct the BMC to
output a character sequence that
indicates when its input buffer is
ready to accept another command.
inputlinesequence=cr | null cr: The console uses <CR> as a new
line sequence.
null: The console uses <NULL> as a
new line sequence.
lineediting=enabled | disabled enabled: Enables line editing as a line
is typed.
disable: Disables line editing as a line
is typed.
newlinesequence=none | crlf | null | cr
| lfcr | lf
none: BMC does not use a
termination sequence.
crlf: BMC uses <CR-LF> as a new
line sequence when the BMC writes a
new line to the console.
null: BMC uses <Null> as a new line
sequence when the BMC writes a new
line to the console.
cr: BMC uses <CR> as a new line
sequence when the BMC writes a new
line to the console.
lfcr: BMC uses <LF-CR> as a new
line sequence when the BMC writes a
new line to the console.
lf: BMC uses <LF> as a new line
sequence when the BMC writes a new
line to the console.
omconfig: Managing Components Using the Instrumentation Service 89
Page 90

Table 6-3. omconfig chassis bmc (continued)
name=value pair 1
config=
config=user id=number enable=true | false id=number: ID number of the user
name=value pair 2 Description
being configured.
enable=true: Enables user.
enable=false: Disables user.
id=number name=text number: ID number of the user being
configured.
name=text: Name of the user.
id=number newpw=text
confirmnewpw=text
id=number serialaccesslevel=
administrator | operator | user | none
number: ID number of the user being
configured.
newpw=text: New password of
the user.
confirmnewpw=text: Confirm new
password of the user.
id=number: ID number of the user
being configured.
serialaccesslevel=administrator: User
with an ID has access privileges of an
Administrator for the Serial Port
channel.
serialaccesslevel=operator: User with
an ID has access privileges of an
Operator for the Serial Port channel.
serialaccesslevel=user: User with an
ID has access privileges of a User for
the Serial Port Channel.
serialaccesslevel=none: User with an
ID does not have access privileges for
the Serial Port Channel.
90 omconfig: Managing Components Using the Instrumentation Service
Page 91

Table 6-3. omconfig chassis bmc (continued)
name=value pair 1
config=
config=user
(continued)
name=value pair 2 Description
id=number lanaccesslevel=
administrator | operator | user| none
id=number: ID number of the user
being configured.
lanaccesslevel=administrator: User
with an ID has access privileges of an
Administrator for the LAN channel.
lanaccesslevel=operator: User with
an ID has access privileges of an
Operator for the LAN channel.
lanaccesslevel=user: User with an ID
has access privileges of a User for the
LAN channel.
lanaccesslevel=none: User with an ID
does not have access privileges for the
LAN channel.
omconfig chassis currents
Use the omconfig chassis currents command to set amperage probe warning thresholds. As with other
components, you can view both warning and failure threshold values, but you cannot set failure thresholds.
Your system's manufacturer sets the minimum and maximum failure thresholds.
NOTE: Settable thresholds vary from one system configuration to another.
NOTE: Systems that contain embedded systems management 3 (ESM3) capabilities do not allow you to set
warning threshold values to default values.
Valid Parameters for Current Warning Thresholds
Table 6-4 shows the valid parameters for setting current warning thresholds:
NOTE: The index parameter is optional. If you do not specify the index, Server Administrator displays a summary of
status, readings, and thresholds set for all current probes present on your system. "Current probes are not present
in all systems". If you specify the index, Server Administrator displays a summary for a specific current probe.
Table 6-4. omconfig chassis currents
name=value pair Description
index=<n> Number of the probe or probe index (must be specified).
warnthresh=default Sets minimum and maximum warning thresholds to default.
minwarnthresh=<n> Minimum warning threshold (3 decimal places).
maxwarnthresh=<n> Maximum warning threshold (3 decimal places).
omconfig: Managing Components Using the Instrumentation Service 91
Page 92

Default Minimum and Maximum Warning Thresholds
If you want to set both the upper and lower current warning threshold values to the recommended
default value, type:
omconfig chassis currents index=0 warnthresh=default
You cannot default one value and set another. In other words, if you default the minimum warning
threshold value, you are also selecting the default value for the maximum warning threshold value.
Specify a Value for Minimum and Maximum Warning Thresholds
If you prefer to specify values for the current probe warning thresholds, you must specify the number of
the probe you are configuring and the minimum and/or maximum warning threshold values. In the
following example, the probe that is being configured is probe 0:
omconfig chassis currents index=0 minwarnthresh=3.310 maxwarnthresh=
3.381
When you issue the command and the system sets the values you specify, the following message appears:
Current probe warning threshold(s) set successfully.
omconfig chassis fans
Use the omconfig chassis fans command to set fan probe warning thresholds. As with other components,
you can view both warning and failure threshold values, but you cannot set failure thresholds. Your
system's manufacturer sets the minimum and maximum failure thresholds.
Valid Parameters for Fan Warning Thresholds
Table 6-5 shows the valid parameters for setting fan warning thresholds:
Table 6-5. omconfig chassis fans
name=value pair Description
index=<n> Number of the probe or probe index (must be specified).
warnthresh=default Sets minimum and maximum warning thresholds to default.
minwarnthresh=<n> Minimum warning threshold.
maxwarnthresh=<n> Maximum warning threshold.
92 omconfig: Managing Components Using the Instrumentation Service
Page 93

Default Minimum and Maximum Warning Thresholds
NOTE: Systems that contain ESM3 capabilities do not allow you to set warning threshold values to default values.
If you want to set both the upper and lower fan warning threshold values to the recommended default
value, type:
omconfig chassis fans index=0 warnthresh=default
You cannot default one value and set another. In other words, if you default the minimum warning
threshold value, you are also selecting the default value for the maximum warning threshold value.
Specify a Value for Minimum and Maximum Warning Thresholds
If you prefer to specify values for the fan probe warning thresholds, you must specify the number of the
probe you are configuring and the minimum and/or maximum warning threshold values. In the following
example, the probe that is being configured is probe 0. The first command sets only the minimum
threshold; the second sets minimum and maximum thresholds:
omconfig chassis fans index=0 minwarnthresh=3.31
omconfig chassis fans index=0 minwarnthresh=3.32 maxwarnthresh=3.38
When you issue the command and the system sets the values you specify, the following message appears:
Fan probe warning threshold(s) set successfully.
omconfig chassis fancontrol
Use the omconfig chassis fancontrol command to set fan speed. You can optimize speed for cooling or
for quiet operation. Table 6-6 shows the valid parameters for the command.
Table 6-6. omconfig chassis fancontrol
name=value pair Description
speed=quiet Sets fan speed for quiet operation.
speed=maxcool Sets fan speed for maximum cooling.
omconfig: Managing Components Using the Instrumentation Service 93
Page 94

omconfig chassis frontpanel
Use the omconfig chassis frontpanel command to configure the Power button and the Nonmasking
Interrupt (NMI) button.
NOTE: The Power and NMI buttons can be configured only if present on the system.
Table 6-7 shows the valid parameters for the command.
Table 6-7. omconfig chassis frontpanel
Subcommand name=value pair Description
nmibutton enable=true | false true: Enables the NMI button on the system.
false: Disables the NMI button on the system.
powerbutton enable=true | false true: Enables the Power button on the system.
false: Disables the Power button on the system.
omconfig chassis info
Use the omconfig chassis info command to enter an asset tag name for your system and a chassis name
for your system. If your system is a modular one, you can enter asset tag names for modular components
as well. Table 6-8 shows the valid parameters for the command.
Table 6-8. omconfig chassis info
name=value pair Description
index=<n> Number of the chassis whose asset tag or name you are setting.
tag=<text> Asset tag in the form of alphanumeric text. Letters or numbers
cannot exceed 10 characters.
name=<text> Name of the chassis.
In the following example, the asset tag for the main system chassis is being set to buildsys:
omconfig chassis info index=0 tag=buildsys
Index 0 always defaults to main system chassis. The following command omits index=n, but
accomplishes the same thing:
omconfig chassis info tag=buildsys
An acceptable command, when executed, results in the following message:
Chassis info set successfully.
94 omconfig: Managing Components Using the Instrumentation Service
Page 95

For some chassis, you can assign a different name. You cannot rename the main system chassis. In the
example below, the command renames chassis 2 from storscsi1 to storscsia:
omconfig chassis info index=2 name=storscsia
As with other commands, the CLI issues an error message if you do not have a chassis 2 (the main
chassis=0). The CLI allows you to issue commands only for the system configuration you have.
omconfig chassis leds
Use the omconfig chassis leds command to specify when to flash a chassis fault LED or chassis
identification LED and allow you to clear the LED for the system's hard drive. Table 6-9 shows the valid
parameters for the command.
Table 6-9. omconfig chassis leds
name=value pair 1 name=value pair 2 Description
index=<n> NA Number of the chassis where the LED
resides (defaults to chassis 0, main system
chassis).
led=fault severity=warning | critical Select to flash the LED either when a
warning event occurs or when a critical
event occurs.
led=hdfault action=clear Sets the number of faults for the hard drive
back to zero (0).
led=identify flash=off | on
time-out=<n>
Sets the chassis identification LED to off or
on. Set the time-out value for the LED to
flash to a number of seconds.
omconfig chassis memorymode
Use the omconfig chassis memorymode command to specify the redundancy mode you want to use for
your system’s memory in case of memory errors.
Redundant memory enables a system to switch to other available memory modules if unacceptable errors
are detected in the modules it is currently using. The omconfig chassis memorymode command allows
you to disable redundancy; when you disable redundancy, you instruct the system not to switch to other
available memory modules when the module the system is using begins to encounter errors. If you want
to enable redundancy, you must choose between spare bank and mirroring.
Spare bank mode disables a bank of system memory in which a correctable memory event is detected,
enables the spare bank, and copies all the data from the original bank to the spare bank. Spare bank
requires at least three banks of identical memory; the operating system does not recognize the
spare bank.
omconfig: Managing Components Using the Instrumentation Service 95
Page 96

Mirroring mode switches to a redundant copy of memory when an uncorrectable memory event is
detected. After switching to the mirrored memory, the system does not switch back to the original system
memory until the next reboot. The operating system does not recognize half of the installed system
memory in this mode.
Table 6-10 shows the valid parameters for the command.
Table 6-10. omconfig chassis memorymode
name=value pair 1 Description
index=<n> Number of the chassis where the memory module resides (the default is
chassis 0, the main system chassis).
redundancy=spare |
mirrored | disabled |
raid5
Spare disables the memory module that has a correctable memory event
and copies the failing module’s data to a spare bank.
Disabled indicates that the system is not to use other available memory
modules if uncorrectable memory events are detected.
Mirrored switches the systems to a mirrored copy of the memory if the
failing module has an uncorrectable memory event. In mirrored mode,
the operating system does not switch back to the original module until
the system reboots.
RAID5 is a method of system memory configuration. This is logically
similar to the RAID5 mode used in hard drive storage systems. This
memory mode gives you an extra level of memory checking and error
recovery at the expense of some memory capacity. The RAID mode
supported is RAID level 5 striping with rotational parity.
omconfig chassis temps
Use the omconfig chassis temps command to set warning thresholds for temperature probes. As with
other components, you can view both warning and failure threshold values, but you cannot set failure
thresholds. Your system's manufacturer sets the minimum and maximum failure thresholds.
NOTE: Settable thresholds vary from one system configuration to another.
Valid Parameters for Temperature Warning Thresholds
Table 6-11 shows the valid parameters for setting temperature warning thresholds:
Table 6-11. omconfig chassis temps
name=value pair Description
index=<n> Number of the probe or probe index (must be specified).
warnthresh=default Sets minimum and maximum warning thresholds to default.
minwarnthresh=<n> Minimum warning threshold (1 decimal place).
maxwarnthresh=<n> Maximum warning threshold (1 decimal place).
96 omconfig: Managing Components Using the Instrumentation Service
Page 97

Default Minimum and Maximum Warning Thresholds
NOTE: The capabilities for managing sensors vary by systems.
If you want to set both the upper and lower temperature warning threshold values to the recommended
default value, type:
omconfig chassis temps index=0 warnthresh=default
You cannot default one value and set another. In other words, if you default the minimum warning
threshold value, you are also selecting the default value for the maximum warning threshold value.
Specify a Value for Minimum and Maximum Warning Thresholds
If you prefer to specify values for the temperature probe warning thresholds, you must specify the
number of the probe you are configuring and the minimum and/or maximum warning threshold value.
In the following example, the probe that is being configured is probe 4:
omconfig chassis temps index=4 minwarnthresh=11.2 maxwarnthresh=58.7
When you issue the command and the system sets the values you specify, the following message appears:
Temperature probe warning threshold(s) set successfully.
omconfig chassis volts
Use the omconfig chassis volts command to set voltage probe warning thresholds. As with other
components, you can view both warning and failure threshold values, but you cannot set failure
thresholds. Your system's manufacturer sets the minimum and maximum failure thresholds.
Valid Parameters for Voltage Warning Thresholds
Table 6-12 shows the valid parameters for setting voltage warning thresholds.
NOTE: Settable thresholds vary from one system configuration to another.
Table 6-12. omconfig chassis volts
name=value pair Description
index=<n> Probe index (must be specified).
warnthresh=default Sets minimum and maximum warning thresholds to default.
minwarnthresh=<n> Minimum warning threshold (3 decimal places).
maxwarnthresh=<n> Maximum warning threshold (3 decimal places).
omconfig: Managing Components Using the Instrumentation Service 97
Page 98

Default Minimum and Maximum Warning Thresholds
NOTE: Systems that contain ESM3, ESM4, and BMC capabilities do not allow you to set warning threshold values
to default values.
If you want to set both the upper and lower voltage warning threshold values to the recommended
default value, type:
omconfig chassis voltage index=2 warnthresh=default
You cannot default one value and set another. In other words, if you default the minimum warning
threshold value, you are also selecting the default value for the maximum warning threshold value.
Specify a Value for Minimum and Maximum Warning Thresholds
If you prefer to specify values for the voltage probe warning thresholds, you must specify the number of
the probe you are configuring and the minimum and/or maximum warning threshold values. In the
following example, the probe that is being configured is probe 0:
omconfig chassis volts index=0 minwarnthresh=1.900 maxwarnthresh=
2.250
When you issue the command and the system sets the values you specify, the following message appears:
Voltage probe warning threshold(s) set successfully.
omconfig preferences
Use the omconfig preferences command to set system preferences. On the command line, you can set
the SNMP root password and specify which user levels are able to access Server Administrator. You can
also configure the Active Directory service.
omconfig preferences cdvformat
You can use the omconfig preferences cdvformat to specify the delimiters for separating data fields
reported in the custom delimited format. The valid values for delimiters are: exclamation, semicolon, at,
hash, dollar, percent, caret, asterisk, tilde, question, colon, comma, and pipe.
The following example shows how to set the delimiter for separating data fields to asterisk:
omconfig preferences cdvformat delimiter=asterisk
omconfig preferences dirservice
You can use the omconfig preferences dirservice command to configure the Active Directory service. The
<productname>oem.ini file is modified to reflect these changes. If the "adproductname" is not present
in the <productname>oem.ini file then a default value will be used. The default value will be
<computername>–<productname>, where <computername> refers to the name of the computer
running Server Administrator and <productname> refers to the name of the product defined in
omprv32.ini. For Server Administrator, it is "omsa".
98 omconfig: Managing Components Using the Instrumentation Service
Page 99

Therefore, for a computer named "myOmsa" running Server Administrator, the default name would be
"myOmsa–omsa". This is the name of Server Administrator defined in Active Directory by using the
snap–in tool. This name must match the name for the application object in Active Directory in order to
find user privileges.
NOTE: This command is applicable only on systems running the Windows operating system.
Table 6-13 shows the valid parameters for the command.
Table 6-13. Active Directory Service Configuration Parameters
name=value pair Description
prodname=<text> Specify the product to which you want to apply the Active
Directory configuration changes. Prodname refers to the
name of the product defined in omprv32.ini. For Server
Administrator, it is "omsa".
enable=<true | false> true: Enables Active Directory service authentication support
and the Active Directory Login option on the login page.
false: Disables Active Directory service authentication
support and the Active Directory Login option on the login
page. If the Active Directory Login option is not present, you
can only login to the local machine accounts.
adprodname=<text> Specify the name of the product as defined in the Active
Directory service. This name links the product with the
Active Directory privilege data for user authentication.
omconfig preferences snmp
Setting the SNMP root password allows administrators to restrict access to SNMP set operations that
allow important systems management interventions. You can configure the SNMP root password
normally (by typing all of the parameters in one command line) or interactively.
NOTICE: Interactive mode is the more secure method of setting the SNMP root password. In noninteractive mode,
the values you enter for the newpw and confirmnewpw options appear on your system’s monitor when you type
them. In interactive mode, the values you type for passwords are masked.
The parameters for configuring the SNMP root password are the same whether you configure it
interactively or iteratively.
NOTE: If you specify setting=rootpw but do not specify the other name=value pair parameters, you enter
interactive mode, and the command line prompts you for the remaining values.
omconfig: Managing Components Using the Instrumentation Service 99
Page 100

Table 6-14 shows the valid parameters for the command.
Table 6-14. SNMP Root Password Parameters
name=value pair Description
setting=rootpw Required.
oldpw=<oldpassword> Enter the old SNMP root password.
newpw=<newpassword> Sets the new SNMP root password.
confirmnewpw=<newpassword> Confirms the new SNMP root password.
When you type omconfig preferences snmp setting=rootpw, the system prompts you to
supply values for the required parameters.
When you type omconfig preferences snmp, you must supply all of the parameters in the initial
command line. For example:
omconfig preferences snmp setting=rootpw oldpw=openmanage newpw=
serveradmin confirmnewpw=serveradmin
omconfig preferences useraccess
Depending on the policies of your enterprise, you may want to restrict the access that some user levels
have to Server Administrator. The omconfig preferences useraccess command allows you to grant or
withhold the right of Users and Power Users to access Server Administrator.
Table 6-15 shows the valid parameters for the command.
Table 6-15. Enabling User Access for Administrators, Power Users, and Users
Command Result Description
omconfig preferences useraccess enable=user Grants Server
Administrator access
to Users, Power Users,
and Administrators.
omconfig preferences useraccess enable=poweruser Grants Server
Administrator access
to Power Users and
Administrators.
omconfig preferences useraccess enable=admin Grants Server
Administrator access
to Administrators only.
Least restrictive form
of user access.
Excludes user level
access only.
Most restrictive form
of user access.
100 omconfig: Managing Components Using the Instrumentation Service
 Loading...