

Page 1

Dell OpenManage
Power Center
Version 1.0
User Guide
Page 2

Notes, Cautions, and Warnings
NOTE: A NOTE indicates important information that helps you make better use of
your computer.
CAUTION: A CAUTION indicates potential damage to hardware or loss of data if
instructions are not followed.
WARNING: A WARNING indicates a potential for property damage, personal
injury, or death.
____________________
Information in this document is subject to change without notice.
© 2012 Dell Inc. All rights reserved.
Reproduction of these materials in any manner whatsoever without the written permission of Dell Inc.
is strictly forbidden.
Trademarks used in this text: Dell™, the DELL™ logo, Dell Precision™, OptiPlex™, Latitude™,
PowerEdge™, PowerVault™, PowerConnect™, OpenManage™, KACE™, FlexAddress™ and
Vostro™ are trademarks of Dell Inc. Intel
trademarks of Intel Corporation in the U.S. and other countries. AMD
combinations thereof, are registered trademarks and AMD Opteron™, AMD Phenom™, and AMD
Sempron™ are trademarks of Advanced Micro Devices, Inc. Microsoft
®
Server
, MS-DOS® and Windows Vista® are either trademarks or registered trademarks of Microsoft
Corporation in the United States and/or other countries. Red Hat Enterprise Linux
®
Linux
are registered trademarks of Red Hat, Inc. in the United States and/or other countries. Novell®
is a registered trademark and SUSE ™ is a trademark of Novell Inc. in the United States and other
countries. Oracle
XenServer
States and/or other countries. VMware
registered trademarks or trademarks of VMWare, Inc. in the United States or other countries.
Other trademarks and trade names may be used in this document to refer to either the entities claiming
the marks and names or their products. Dell Inc. disclaims any proprietary interest in trademarks and
trade names other than its own.
®
is a registered trademark of Oracle Corporation and/or its affiliates. Citrix®, Xen®,
®
and XenMotion® are either registered trademarks or trademarks of Citrix in the United
®
, Pentium®, Xeon®, Core™ and Celeron® are registered
®
, Virtual SMP®, vMotion®, vCenter®, and vSphere® are
®
, the AMD logo®, and
®
, Windows®, Windows
®
and Enterprise
February 2012
Page 3

Contents
1Overview . . . . . . . . . . . . . . . . . . . . . . . 11
Features. . . . . . . . . . . . . . . . . . . . . . . . 11
Topology
. . . . . . . . . . . . . . . . . . . . . . . 12
System Requirements . . . . . . . . . . . . . . . . . 13
Hardware Requirements for Server System
. . . . 13
Software Requirements for Server System . . . . 13
Hardware and Software Requirements for Devices
Supported Devices
. . . . . . . . . . . . . . . . 14
14
2 Getting Started . . . . . . . . . . . . . . . . . . . 16
Management Console Introduction . . . . . . . . . . 16
Use Case Introduction
Use Case 1: Installing Power Center
Use Case 2: Logging into Power Center
Use Case 3: Adding a Device from the Network
Use Case 4: Managing Devices
Use Case 5: Creating the Data Center Group Structure 20
. . . . . . . . . . . . . . . . . 18
. . . . . . . . . 19
. . . . . . . . 19
. . . . 19
. . . . . . . . . . . . 20
Use Case 6: Monitoring Power / Temperature /
Events of a Device or Group
Use Case 7: Creating Power Policies
. . . . . . . . . . . . . . 21
. . . . . . . . . 21
Contents 3
Page 4

Use Case 8: Comparing Two or More Devices/Groups . 21
3 Installing and Launching . . . . . . . . . . . . 23
Installing Power Center . . . . . . . . . . . . . . . . 23
Installed Directories
. . . . . . . . . . . . . . . . . 26
Power Center Services . . . . . . . . . . . . . . . . 26
Uninstalling Power Center
Launching Power Center
. . . . . . . . . . . . . . 27
. . . . . . . . . . . . . . . 28
Configuring ESC for Internet Explorer . . . . . . . . . 28
4 Access Control . . . . . . . . . . . . . . . . . . . 30
About Authentication . . . . . . . . . . . . . . . . . 30
Logging in
Logging out
Managing User Roles
. . . . . . . . . . . . . . . . . . . . . . . 30
About Login
Log in with User Name and Password
. . . . . . . . . . . . . . . . . . . 30
. . . . . . 31
Log in with Single Sign-on (SSO) . . . . . . . . . 35
Multiple User Login
. . . . . . . . . . . . . . . . . . . . . . 40
Adding a Role
Updating a Role
Deleting a Role
. . . . . . . . . . . . . . . . 39
. . . . . . . . . . . . . . . . . 40
. . . . . . . . . . . . . . . . . . 40
. . . . . . . . . . . . . . . . . 41
. . . . . . . . . . . . . . . . . . 41
Managing User Accounts
Adding a User
Updating a User
. . . . . . . . . . . . . . . . . . 41
. . . . . . . . . . . . . . . . . 42
. . . . . . . . . . . . . . . 41
Contents 4
Page 5

Deleting a User. . . . . . . . . . . . . . . . . . 42
Managing Privileges
Global Configuration
Device Discovery
. . . . . . . . . . . . . . . . . 43
. . . . . . . . . . . . . . . 46
. . . . . . . . . . . . . . . . . 47
Manage Role/User . . . . . . . . . . . . . . . . 47
View Device/Group
Manage Device/Group
. . . . . . . . . . . . . . . . 47
. . . . . . . . . . . . . . 47
Manage Policy . . . . . . . . . . . . . . . . . . 48
Manage Event
Manage License
Viewing Current User Information
Licensing
. . . . . . . . . . . . . . . . . . . . . . . 49
Importing License
Viewing License
. . . . . . . . . . . . . . . . . . 48
. . . . . . . . . . . . . . . . . 49
. . . . . . . . . . . 49
. . . . . . . . . . . . . . . . 49
. . . . . . . . . . . . . . . . . 50
5 Device Discovery . . . . . . . . . . . . . . . . . 51
Supported Devices and Unsupported Devices. . . . . 51
Adding a Device from the Network
. . . . . . . . . . 52
Adding a Device Manually
Rediscovering Devices in a Chassis
Protocol Profile
. . . . . . . . . . . . . . . . . . . . 56
. . . . . . . . . . . . . . 54
. . . . . . . . . . 55
6 Device Management . . . . . . . . . . . . . . . 58
Viewing Devices . . . . . . . . . . . . . . . . . . . 58
Editing Devices
. . . . . . . . . . . . . . . . . . . . 60
Contents 5
Page 6

Editing Protocol . . . . . . . . . . . . . . . . . . . . 61
Deleting Devices
Filtering Devices
. . . . . . . . . . . . . . . . . . . 61
. . . . . . . . . . . . . . . . . . . 62
Sorting Devices . . . . . . . . . . . . . . . . . . . . 63
7 Group Management . . . . . . . . . . . . . . . 64
Mapping Group Structure Information. . . . . . . . . 64
Finding a Group or Device
. . . . . . . . . . . . . . . 65
8 Physical Groups . . . . . . . . . . . . . . . . . . 67
Data Center Physical Group . . . . . . . . . . . . . . 67
Creating Physical Group
Managing Physical Groups
Adding Devices to a Physical Group
Editing Devices in a Physical Group
Removing Devices from a Physical Group . . . . 70
Moving Devices in a Physical Group
Moving a Physical Group
. . . . . . . . . . . . . . . . 67
. . . . . . . . . . . . . . 68
. . . . . . . 68
. . . . . . . 70
. . . . . . . 71
. . . . . . . . . . . . . 71
Editing Physical Groups
Deleting Physical Groups
. . . . . . . . . . . . . . . . 72
. . . . . . . . . . . . . . . 72
Viewing Physical Groups . . . . . . . . . . . . . . . 72
9 Logical Groups . . . . . . . . . . . . . . . . . . . 74
Creating a Logical Group . . . . . . . . . . . . . . . 74
Contents 6
Page 7

Managing Logical Groups . . . . . . . . . . . . . . . 74
Adding a Logical Group
. . . . . . . . . . . . . . 74
Adding Devices or Groups to a Logical Group . . 75
Editing Logical Groups . . . . . . . . . . . . . . . . 76
Deleting Logical Groups
Viewing Logical Groups
. . . . . . . . . . . . . . . . 76
. . . . . . . . . . . . . . . . 76
10 Power Monitoring . . . . . . . . . . . . . . . . . 78
Power Monitoring Level. . . . . . . . . . . . . . . . 78
Power Monitoring Configuration
Viewing Power Details
. . . . . . . . . . . . . . . . 80
. . . . . . . . . . . 78
Viewing Energy Consumption . . . . . . . . . . . . . 82
Monitoring PDU Power
Monitoring UPS Power
Power Dashboard
Printing Power Monitoring/Dashboard Graph
. . . . . . . . . . . . . . . . 83
. . . . . . . . . . . . . . . . 84
. . . . . . . . . . . . . . . . . . . 85
. . . . . 87
11 Temperature Monitoring . . . . . . . . . . . . 88
Temperature Monitoring Level . . . . . . . . . . . . 88
Temperature Monitoring Configuration
. . . . . . . . 88
Viewing Temperature Details . . . . . . . . . . . . . 89
Monitoring Temperature of Chassis/Blade Server
. . . 92
Contents 7
Page 8

Monitoring Temperature of Devices/Groups. . . . . . 92
Temperature Dashboard
Printing Temperature Monitoring/Dashboard Graph
. . . . . . . . . . . . . . . . 92
. . 94
12 Power Policies . . . . . . . . . . . . . . . . . . . 95
How Does a Dynamic Power Policy Work? . . . . . . 96
Power Policy Capabilities
Upgrading Device Power Policy Capability
Creating a Policy . . . . . . . . . . . . . . . . . . . 98
Viewing Policy Details
Policy Priority Levels
Policy Modes . . . . . . . . . . . . . . . . . . . . . 102
Enabling/Disabling Policy
Displaying Policies in the Power Details Graph
Updating a Policy
. . . . . . . . . . . . . . . 97
. . . . . . 98
. . . . . . . . . . . . . . . . 101
. . . . . . . . . . . . . . . . . 101
. . . . . . . . . . . . . . . 102
. . . . 103
. . . . . . . . . . . . . . . . . . . 103
Deleting Policies
Filtering Policies
Emergency Power Reduction
. . . . . . . . . . . . . . . . . . . 103
. . . . . . . . . . . . . . . . . . . 104
. . . . . . . . . . . . . 104
Policy-Related Events . . . . . . . . . . . . . . . . . 105
13 Comparing . . . . . . . . . . . . . . . . . . . . . 106
Changing the Time Period . . . . . . . . . . . . . . . 106
Contents 8
Page 9

Adding a Device or Group . . . . . . . . . . . . . . . 107
Removing/Changing Device or Group
Printing the Comparison Result
. . . . . . . . . 107
. . . . . . . . . . . . 108
14 Event Management . . . . . . . . . . . . . . . 109
Pre-defined Events . . . . . . . . . . . . . . . . . . 109
Custom Events
Supported PDU/UPS Events
Event Severity Levels . . . . . . . . . . . . . . . . . 115
Viewing Events
Sorting Events
Editing Events . . . . . . . . . . . . . . . . . . . . . 116
Deleting Events
Filtering Events
Filtering Events by Group/Device
. . . . . . . . . . . . . . . . . . . . . 112
. . . . . . . . . . . . . . 114
. . . . . . . . . . . . . . . . . . . . 115
. . . . . . . . . . . . . . . . . . . . . 116
. . . . . . . . . . . . . . . . . . . . 116
. . . . . . . . . . . . . . . . . . . . 117
. . . . . . . . . . . 118
Sending Test Events from an IPMI Device
. . . . . . . 118
15 Security . . . . . . . . . . . . . . . . . . . . . . . 120
Starting Services with a Normal Windows OS User Account 120
OS Hardening
Audit Log . . . . . . . . . . . . . . . . . . . . . . . 123
Managing Certificates
. . . . . . . . . . . . . . . . . . . . . 122
. . . . . . . . . . . . . . . . 124
Contents 9
Page 10

16 Configuring Power Center . . . . . . . . . . 126
Monitoring Settings . . . . . . . . . . . . . . . . . . 126
Default Units Settings
. . . . . . . . . . . . . . . . . 127
Protocol Type Device Timeout Settings . . . . . . . . 128
Energy Consumption Settings
SNMP Traps Settings
. . . . . . . . . . . . . . . . . 128
. . . . . . . . . . . . . 128
Database Policy Settings . . . . . . . . . . . . . . . 130
Installation Settings
Database Settings
Kerberos Realm Settings
. . . . . . . . . . . . . . . . . . 132
. . . . . . . . . . . . . . . . 132
. . . . . . . . . . . . . 138
Power Center Server's Domain Account for Kerberos SSO 138
17 Backup and Recovery . . . . . . . . . . . . . 139
Power Center Data . . . . . . . . . . . . . . . . . . 139
Power Center Backup . . . . . . . . . . . . . . . . . 140
Power Center Recovery
. . . . . . . . . . . . . . . . 141
18 Troubleshooting . . . . . . . . . . . . . . . . . 144
Contents 10
Page 11

1
Overview
Dell OpenManage Power Center is a power management solution for the data
center. It enables you to monitor and manage power consumption and
temperature in your data center through the management console.
Features
The following table lists the features provided by OpenManage Power Center.
Table 1-1. Product Features
Feature Description
Power Monitoring Monitors power related metrics on several levels:
• Individual device
• Data center/Room/Aisle/Rack/Chassis
• User-defined group
Temperature Monitoring Monitors data center temperature data.
Power Control Creates policies that can control the data center power
consumption at the device and group level.
Device Discovery Supports Dell enterprise systems including PowerEdge
blade and tower/rack servers, chassis, and many different
PDUs and UPS.
Role-based Access Control Supports user authentication and multiple role-based
privilege levels.
Event Management Monitor and manage device/group events.
Overview 11
Page 12
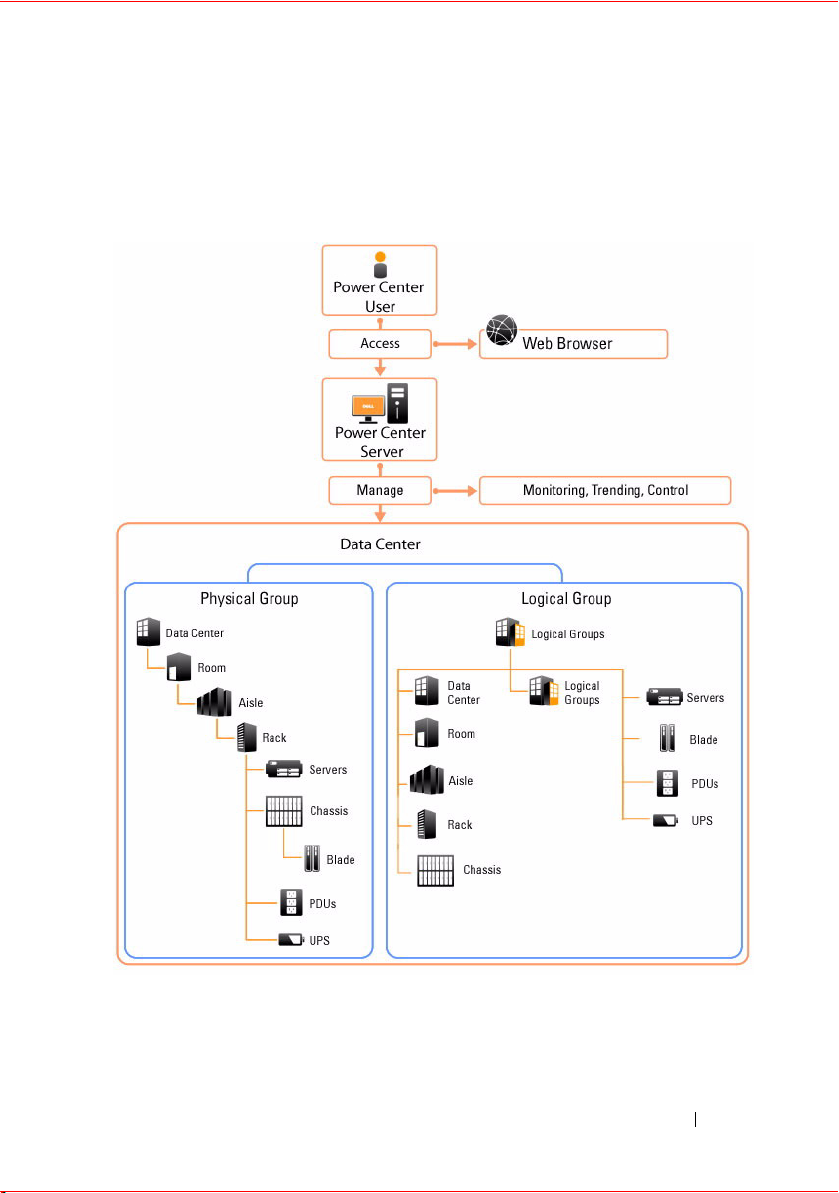
Topology
The following figure shows how to use a Web browser to access the Power
Center server and manage the data center.
Overview 12
Page 13

System Requirements
Hardware Requirements for Server System
You must install Power Center on a system with at least:
• A dual-core processor of 2.6Ghz or higher
•4GB RAM
• 60GB free space of hard drive
• Gigabit bandwidth of network infrastructure
Software Requirements for Server System
Power Center supports the following operating systems:
•
Microsoft
(x86, x64)
•
Microsoft
(x86, x64)
•
Microsoft
•
Microsoft
•
Microsoft
•
Microsoft
Power Center supports the following Web browsers:
• Mozilla Firefox 5.0 and 6.0
• Microsoft Internet Explorer 7.0, 8.0 and 9.0
Power Center is validated to work with the following virtualization
environment:
•VMware ESX (3.5/4.0)
• Microsoft Server 2008 Hyper-V
The Power Center installation includes the following major software tools:
• Sun Microsystems Java Runtime Environment (JRE) 6
• Apache Tomcat application server
• PostgreSQL 8.3.5
Windows 2003 Standard/Enterprise/Small Business Server
Windows 2003 Standard/Enterprise/Small Business Server R2
Windows 2008 Standard/Enterprise/Datacenter (x86, x64)
Windows 2008 R2
Windows 7
Windows Vista (x86, x64)
SP2
Overview 13
Page 14

Hardware and Software Requirements for Devices
Power Center defines the following hardware and software requirements for
supported devices:
• The server device must comply with Dell iDRAC6/iDRAC7.
• Power Distribution Unit (PDU) or Uninterruptable Power Supply (UPS)
devices comply with the Management Information Base (MIB) provided
by their vendor through SNMP interface.
• The device must provide exclusive access for Power Center. This is because
the policies set on the devices from other management software will
impact the Power Center power control function.
• The Baseboard Management Controller (BMC) user, through which Power
Center communicates with devices, must be a local user with
Administrator role. The device must be configured to allow the
Administrator to use at least one of the cipher suite levels 0-3, and enable
the "IPMI over LAN" setting.
• The WS-MAN user, through which Power Center communicates with the
chassis, must be a local user with Administrator role. The chassis must be
configured to enable the "Web Server" service.
Supported Devices
Power Center supports up to 2000 managed devices in one data center.
The following devices are validated and supported by Power Center:
Table 1-2. Supported Devices
Category Supported
Platform
Server Dell
Chassis Dell
Validated Model
• Dell PowerEdge R610 Rack Server
• Dell PowerEdge R620 Rack Server
• Dell PowerEdge R710 Rack Server
• Dell PowerEdge R720 Rack Server
• Dell PowerEdge M610 Blade Server
• Dell PowerEdge M620 Blade Server
• Dell PowerEdge T620 Tower Server
• Dell PowerEdge M1000e Blade Enclosure
Overview 14
Page 15

Table 1-2. Supported Devices
Category Supported
Platform
PDU Dell
APC
Eaton
Emerson
ServerTech
UPS Dell
APC
Eaton
Emerson
Validated Model
• Dell 6804 Metered PDU
• Dell 6607 Metered PDU
• Dell XX5T6 Metered PDU
• Dell 6803 Metered PDU
• Dell 6605 PDU
• APC Metered Rack PDU AP78001
• APC Switched Rack PDU AP7900
• APC Switched Rack PDU AP7920
• Eaton Monitored PDU PW312MI0UC07
• Eaton Switched PDU PW105SW0U154
• Emerson Liebert MPH MPH-NCR09NXXE30
• ServerTech Switched PDU CW-24V4J411
• ServerTech Smart CDU, 0U CS-24V1-C20M
• Dell N313P Line interactive UPS w/ web card H910P
• Dell Online Rack UPS 3750R OL K804N
• Dell UPS, 2700/2300VA, 120V, 3U K802N
• APC Online UPS w/ Web card SURTD3000XLI
• APC Smart-UPS 3000VA RM SUA3000RM2U
• Smart-UPS 5000VA RM DL5000RMT5U
• Eaton Line interactive UPS w/ Web card
PW5130I1750-XL2U
• Emerson Online UPS w/ Web card GXT2-2700RT208
Overview 15
Page 16
2
Getting Started
This chapter introduces the Power Center management console and presents
several use cases that describe standard usages of Power Center.
Management Console Introduction
To use the Power Center functions, you must open a Web browser and log
into Power Center.
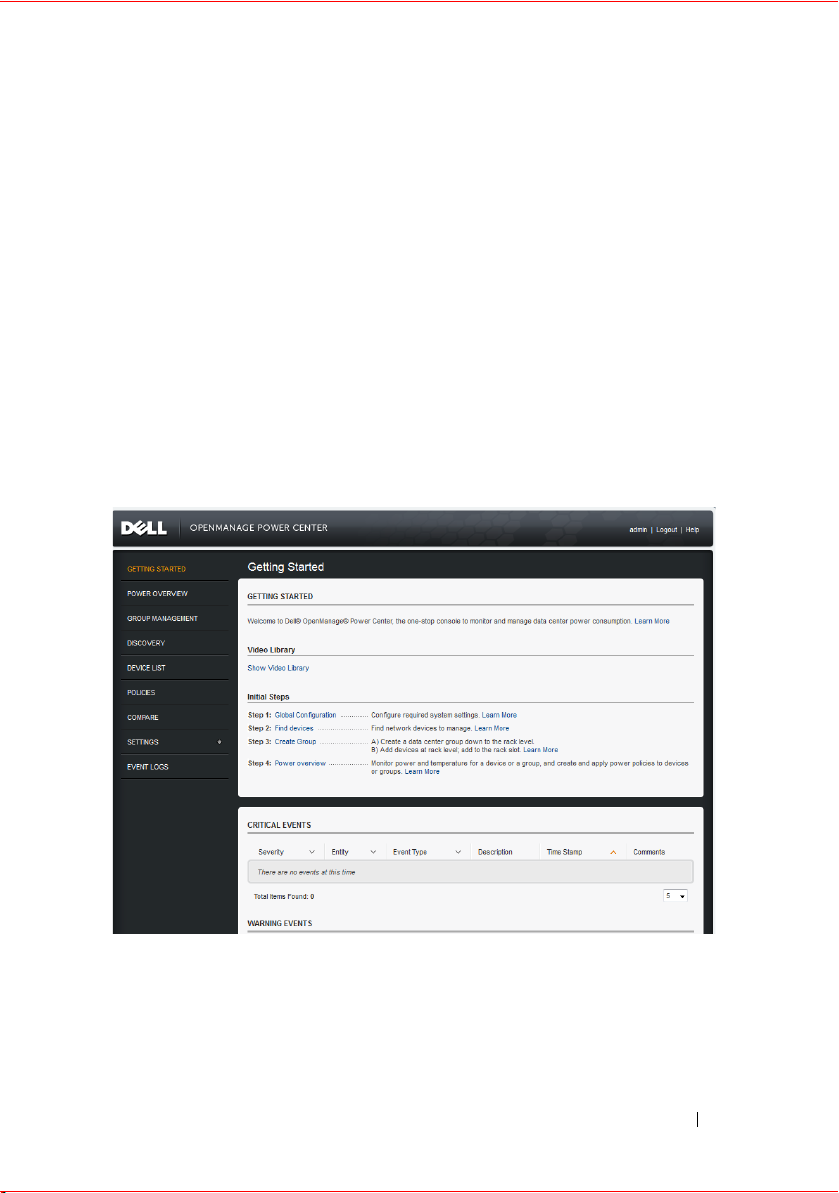
After you log into Power Center, the management console opens with a list of
the available pages in the left navigation pane, and the currently-open page
appearing in the right pane.
Getting Started 16
Page 17

Table 2-1. Available Actions
Main Page Available Actions on This Page
Getting Started This page introduces the Dell OpenManage Power
Center features and the initial setup steps, and lists
additional tasks you can complete after the setup. You
can select a video from the video liberary to help you get
started, or you can click help links to get additional
information.
Power Overview This page enables you to view or edit data center power
information of a physical group or logical group, and
view the information of devices in a rack or chassis. This
page includes these tabs:
Events, Dashboards, Power Details, Temperature
Details, Policies, Thresholds.
Group Management This page enables you to set up and organize your
devices into physical or logical groups.
Discovery This page discovers supported devices in the data center
network. After a device is discovered, it is automatically
added to the Device List page, and can be managed by
Power Center. From this page, you can:
• View the active searches
• View the recent discovery jobs
• Rerun a search using the discovery search criteria
Device List This page lists network-discovered devices and devices
added manually. From this page, you can:
• Add supported or unsupported devices to the Device
List page
• Remove devices from the Device List page
• Edit device information for a single device or multiple
devices
• Edit protocol information for a single device
• Filter and sort devices to meet current needs
Policies This page enables you to manage the power policies.
Getting Started 17
Page 18

Table 2-1. Available Actions
Main Page Available Actions on This Page
Compare This page enables you to compare power and
temperature status and energy consumption between
the selected groups/devices. You can also print the
comparison results.
Settings → Settings This page enables you to view or configure all the
settings.
Settings → User
Accounts
Settings → Licensing This page enables you to view or import the license.
Event Logs This page lists all events at all severity levels.
This page enables you to set up and manage the user
accounts.
From this page, you can:
• View all events
• Add comments to events
• Delete the events
•Filter and sort the events
Use Case Introduction
This section provides several standard usage scenarios to help you get started
with Power Center, or refresh your knowledge of Power Center functionality.
If you are a first-time user, you can follow the sequence of use cases 1- 5 to
install and set up the group structure for Power Center monitoring of your
data center. After you set up your data center for monitoring, you can refer to
use case 6, 7 or 8 to use Power Center for monitoring, comparing power and
temperature data between devices and/or time slots, and creating policies.
If you are an experienced user, you can refer to any use case for a quick
reference on how to complete tasks.
1
Installing Power Center
2
Logging into Power Center
3
Adding a device from the network
4
Managing devices
Getting Started 18
Page 19

5
Creating the data center group structure
6
Monitoring power/temperature/events of a device or group
7
Creating power policies
8
Comparing two or more devices/groups
Use Case 1: Installing Power Center
This use case describes how to install Power Center.
1
Make sure the system meets the software and hardware requirements.
See "System Requirements" in the "Overview" chapter.
2
Click OpenManagePowerCenter.exe to start installation.
See "Installing Power Center" in the "Installing and Launching" chapter.
Use Case 2: Logging into Power Center
This use case describes how to launch and log into Power Center.
1
Open your Web browser.
2
You may need to configure your Web browser to launch the Power Center
management console.
See "Configuring ESC for Internet Explorer" in the "Installing and
Launching" chapter.
3
Enter the Power Center management console address:
https://
<Server_Name>:<HTTPS_Port>
See "Launching Power Center" in the "Installing and Launching" chapter.
4
Select a user account and enter your user name and password.
See "Logging in" in the "Access Control" chapter.
5
The Power Center management console appears. You can start to use
Power Center functions.
/powercenter/
Use Case 3: Adding a Device from the Network
This use case describes how to discover devices from the network of your data
center.
Getting Started 19
Page 20

1
Go to the
2
Configure the search criteria for the devices you want to discover.
See "Adding a Device from the Network" in the "Device Discovery"
chapter.
3
The discovered devices appear in the
Discovery
page to add devices from the network.
Device List
page.
Use Case 4: Managing Devices
This use case describes how to manage devices after they are discovered.
1
Go to the
delete/edit/filter them.
2
Or you can click
then manage it.
See "Adding a Device Manually" in the "Device Discovery" chapter.
Device List
Add
page, select the devices you want to manage, then
in the
Device List
page to add a device manually
Use Case 5: Creating the Data Center Group Structure
This use case describes how to create the data center group structure.
1
Go to the
the physical groups following this order:
→
Rack → Chassis
See "Data Center Physical Group" in the "Physical Groups" chapter.
Group Management
.
page, click
Select a Physical Group
Data Center → Room →
. Create
Aisle
2
Add devices to the physical groups:
• A rack server can only be added to a rack.
• A blade server can only be discovered in a chassis.
• PDU, UPS and unsupported devices can be attached at any level of
the physical group structure.
See "Adding Devices to a Physical Group" in the "Physical Groups" chapter.
Getting Started 20
Page 21

Use Case 6: Monitoring Power / Temperature / Events of a Device or Group
This use case describes how to monitor power/temperature details and events
of a device or group.
1
Go to the
monitor.
2
Check the various tabs:
• The
Power Overview
Power Details
See the "Power Monitoring" chapter.
page, and select the device or group you want to
tab shows the power details for the device/group.
• The
• The
Temperature Details
device/group.
See the "Temperature Monitoring" chapter.
Events
tab shows the events for the device/group.
See the "Event Management" chapter.
tab shows the temperature details for the
Use Case 7: Creating Power Policies
This use case describes how to create a power policy. Power policies allow you
to cap power consumption and set priorities for the policies so that you can
save power for your data center.
1
Go to the
2
Click
See "Creating a Policy" in the "Power Policies" chapter.
3
You can view policies for this device/group in this
go to the
the data center.
Power Overview
Policies
tab, and create a policy for this device/group.
Policies
page, and select a device or group.
Policies
page in the management console to view all policies in
tab. You can also
Use Case 8: Comparing Two or More Devices/Groups
This use case describes how to compare the power/temperature status and the
energy cost for two or three devices/groups.
Getting Started 21
Page 22

1
Go to the
2
Select two or three devices or groups to compare.
Compare
page.
See "Adding a Device or Group" in the "Comparing" chapter.
3
Set the time frame for comparison. You can use this feature to compare
power/temperature data for the same devices/group in different time
ranges.
See "Changing the Time Period" in the "Comparing" chapter.
4
Optionally, click
Print
to print the comparison results. You may need to
configure your Web browser before printing.
See "Printing the Comparison Result" in the "Comparing" chapter.
Getting Started 22
Page 23

3
Installing and Launching
This chapter explains how to install, uninstall and launch Power Center. After
Power Center is installed, you may need to change the account for Power
Center services for better security, or you can use a Web browser to launch
the Power Center management console to start using it. You can also uninstall
it when you no longer need it.
Installing Power Center
To install Power Center, you must have Administrator privilege. Otherwise,
the installation may fail.
Before installing Power Center, verify that your system meets the minimum
system requirements. See "System Requirements" in the "Overview" chapter.
Follow these steps to install Power Center:
1
Double-click the file
2
In the installation wizard home page, click
3
In the
License Agreement
accept ...
4
In the
5
In the
or browse to your desired installation path. Click
.Click
License
Destination Folder
OpenManagePowerCenter.exe
Next
.
screen, read the license agreement and select
Next
.
page, read the license message. Click
screen, either leave the default installation path
Next
.
Next
.
I
.
NOTE: The installation path only supports ANSI characters (English characters,
numbers, and simple symbols). Do not use an installation path with non-ANSI
characters.
6
In the
OpenManage Power Center Setting
HTTPS settings:
•HTTPS Port
communication. To select a different port, enter the new port number.
The port number must be a number between 2000 to 9000.
• Keystore Password
used to access the keystore file. After entering the password, in the
Verify Password
—
By default, Power Center uses port 8643 for HTTPS
—
Enter a keystore password. The password will be
field, enter again to confirm.
screen, configure the following
Installing and Launching 23
Page 24

NOTE: The password must be more than 5 characters, and cannot contain
non-ANSI characters and double quotes (").
• HTTPS Certificate Information — Enter your information for the
HTTPS certificate, including your name, organization, address, state,
country code. The information will be used for certificate
management.
Click
Next
.
7
In the
OpenManage Power Center Setting
screen, continue to enter the
following information for the PostgreSQL database server account:
• Use another database server
—
This option enables you to install the
Power Center database on a remote server. To use this option, the
system must meet the following requirements:
– The remote server must have a running PostgreSQL database service
(v8.3.5). You can download it from
http://www.postgresql.org
– There is no Power Center database on the remote server.
– The database service on the remote server is able to accept remote
database connnection. For more information on this, see "Change to
Database on a Remote System" in the "Configuring Power Center"
chapter.
– The correct connection information (Server Name, Database Port,
Database User Name, Database User Password) is provided.
If you enabled the option to use another database server, enter the
following information about the database service on the remote server:
.
•User Name
• User Password
—
Enter your PostgreSQL database server user name.
—
Enter your PostgreSQL database server user
password.
NOTE: The password must be a minimum of 8 characters in length with
characters from at least three of the following categories: uppercase,
lowercase, numeric, non-alphanumeric. It cannot include spaces.
•Verify password — Enter the password again to confirm.
• PostgreSQL Port
—
Default value is 6443. If another database is
already using the default port, enter a different port.
Installing and Launching 24
Page 25

• PostgreSQL Data Directory — The location of PostgreSQL data. If
you enabled the option "Use another database server", you do not need
to enter information for this field.
Click
Next
.
8
In the
OpenManage Power Center Setting
screen, continue to configure
the Power Center super user account (also called installation account in
the
User Accounts
page) settings, this account is used for logging into the
Power Center management console:
•User Name
—
Enter a name for the super user, or leave the default
name: admin.
•User Name rules
a
Must be unique for each Power Center user.
b
Can be up to 20 uppercase or lowercase printable characters except " /
—
\ [ ] : ; | = , + * ? < > . @.
c
Case insensitive.
•User Password
NOTE: The password must be a minimum of 8 characters in length with
characters from at least three of the following categories: uppercase,
lowercase, numeric, non-alphanumeric, and can include spaces.
— Create the user password for the super user account.
•Verify password — Enter the password again to confirm.
Click
Next
.
9
In the
Power Center Setting
screen, continue to configure the Kerberos
settings. These options are optional, you can enable the option and
configure the following settings to support SSO. For more information on
SSO, see "Single Sign-on" in the "Access Control" chapter, or you can click
Next
to skip this step.
•Realm Name
—
Enter the Realm name (domain name) of KDC
server.
•KDC Server
—
Enter the address of KDC server, it can be either an IP
address or a server name.
• Kerberos Pre-authentication User Name
— Enter the user name for
the Kerberos pre-authentication account.
Installing and Launching 25
Page 26

NOTE: User names with Chinese characters are not supported due to the
limitation of Java Kerberos related library implementation.
• Kerberos Pre-authentication User Password —
the Kerberos pre-authentication account.
Click
Next
.
10
In the
Ready to Install the Program
11
After installation completes, click
screen, click
Finish
to exit the installation wizard.
Enter the password for
Install
.
Installed Directories
By default, the Power Center package installs to: C:\Program
Files\Dell\OpenManagePowerCenter.
NOTE: You cannot install Power Center to the root folders of Windows volume. You
must select a none-root folder or another volume to install.
The Power Center package includes the following folders:
Table 3-1. Installed Directories
Directory Description
bin Power Center binaries
conf Power Center configuration files
external Other applications installed by Power Center
Logs Power Center event logs
Pgdata (default) Database files
To protect your data, the following files are accessible only to Network Service
or Administrator users:
• OpenManagePowerCenter\conf\app.config.xml
• OpenManagePowerCenter\external\apache-tomcat\conf\server.xml
Power Center Services
Power Center includes the following services:
Installing and Launching 26
Page 27

• Dell OpenManage Power Center — Apache Tomcat server
accommodating the Power Center web application which passes action
requests to the Power Center server.
• Dell OpenManage Power Center Database Server
—
The PostgreSQL
internal database for Power Center.
• Dell OpenManage Power Center SNMP Dispatcher
—
If Windows SNMP
Trap service is installed, it reroutes SNMP traps to Dell OpenManage
Power Center Server service. If Windows SNMP Trap service is not
installed, this service will automatically stop.
NOTE: If Windows SNMP Trap service is installed, make sure it is not
disabled, otherwise Power Center cannot function properly.
• Dell OpenManage Power Center Server — The Power Center server core
service. It carries out all actions, including communication with devices.
To stop or start a service, select the appropriate service from the Windows
Services list and select the action to perform.
Power Center uses Network Service account to start all the services. You can
change to a normal Windows OS user account for security purpose. For more
information on how to change the account, see "Starting Services with a
Normal Windows OS User Account" in the "Security" chapter.
Uninstalling Power Center
NOTE: After uninstalling Power Center, the existing power cap value set in the
policies (including EPR) still remain effective on the devices. To avoid impacts to the
devices, remove all devices from the Power Center management console before
uninstalling Power Center. Make sure to check your data center power capacity
before removing the devices to avoid tripping the breaker because the policies will
be removed at the same time.
To uninstall Power Center:
1
Go to
Start → Control Panel → Add/Remove Programs
2
From the Add/Remove Programs dialog, select
Mitigation, and Management
3
Click
Yes
to confirm. Follow the on-screen instructions.
, and click
Dell Power Measurement,
Remove
.
.
Installing and Launching 27
Page 28

If you did not check the option "Use another database server" during the
installation, the uninstall program removes the Power Center database and
configurations.
If you checked the option "Use another database server" and used another
database during the installation, the uninstall program does not uninstall the
database.
Launching Power Center
To launch the Power Center management console, enter the following
address in lower case in your Web browser:
https://<Server_Name>:<HTTPS_Port>/powercenter/.
For example: https://localhost:8643/powercenter/.
NOTE: For Windows 2003, if you reinstall Power Center on the same server using a
different HTTPS port, you must log off Windows OS then log in once to make sure
the new HTTPS port takes effect.
NOTE: Power Center only supports screen resolutions of 1024*768 pixels or higher.
Make sure you have correctly set the screen resolution on your system before
launching the Power Center management console.
Configuring ESC for Internet Explorer
If the Power Center server uses Windows 2003 Server or Windows 2008 OS,
and the Web browser is Internet Explorer 8 or version above, by default, the
system has the Internet Explorer Enhanced Security Configuration (ESC)
feature enabled. To make sure Power Center functions properly in Internet
Explorer, you must either disable this feature or configure Internet Explorer
to trust the Power Center site/links.
To disable this feature in Windows 2008:
1
Go to
Control Panel → System and Security → Administrative Tools →
Server Manager
2
In the
Server Summary → Security Information
IE ESC
3
The
Internet Explorer Enhanced Security Configuration
set enhanced security configuration to
users.
.
section, click
.
Off
for both administrators and
Configure
window opens,
Installing and Launching 28
Page 29

To disable this feature in Windows 2003 Server:
1
Go to
Control Panel → Add or Remove Programs → Add/Remove
Windows Components
2
Uncheck the
Internet Explorer Enhanced Security Configuration
.
box.
3
Click
Next
, and then click
Finish
.
To trust the Power Center site/links:
1
Go to
Internet Explorer → Tools → Internet Options → Security
2
Click
Trusted Sites
NOTE: You may need to restart Internet Explorer for the configuration to take
effect.
, add
about: Blank
in trusted sites.
check
.
Installing and Launching 29
Page 30

4
Access Control
This chapter provides information about the access control in Power Center,
including:
• Log in/Log out —
account or by Kerberos Single Sign-On (SSO).
• User/Role/Privilege Management —
manage user accounts in the management console. Power Center
provides role-based access control.
the privileges for each role. After that, you can set up Power Center
accounts and assign them with different roles.
•Licensing
license before the trial license expires.
— Power Center requires a valid license. You must import a
About Authentication
Power Center supports Power Center managed users and Windows users.
For cross-domain authentication, the domains must be two-way transitively
trusted by the domain in which the Power Center server is installed.
For domains that are one-way trusted or not trusted by the domain in which
the Power Center server is installed, the authentication of user accounts in
these domains is not supported and may fail.
You can log into Power Center by entering a user
After you have logged in, you can
You must set up roles first, and define
Logging in
About Login
Power Center supports the following login methods:
• Log in with user name and password — You can use your user account to
log into Power Center. For more information, see "Log in with User Name
and Password" in this chapter.
• Log in using Kerberos Single Sign-On (SSO)
to log in without entering the user name and password if you have already
logged in the Windows domain with your domain account. Power Center
—
This feature enables you
Access Control 30
Page 31

only supports Kerberos-based SSO. For more information on SSO, see
"Single Domain Environment" and "Multiple Domain Environment" in
this chapter.
NOTE: You cannot log into Power Center locally using SSO, i.e., you cannot log into
Power Center using SSO on the Power Center server. You only can log into Power
Center using SSO remotely.
NOTE: You must add the SSO user account to Power Center before you can log in
using SSO. You will skip the login page and enter the Getting Started page directly
using SSO. After you log into Power Center, you cannot log out when you click
Logout. To log out, close the Web browser or Power Center management console.
Power Center tries Kerberos SSO first. If it fails, the Power Center login form
appears and you can use the user account information to log into Power
Center.
Log in with User Name and Password
To log into Power Center with the user name and password, you can use one
of the following accounts:
• Power Center Account — You can create this account in Power Center. For
the first-time login, you must use the Power Center user account created
during the installation.
•Domain Account
• Local Windows Account
server.
—
Windows domain account.
—
Windows local account on the Power Center
NOTE: Before logging into Power Center using either the Windows domain or the
Windows local account, you must add the account into Power Center by accessing
the User Accounts page.
For more information on how to open the Power Center management
console, see "Launching Power Center" in the "Installing and Launching"
chapter.
Access Control 31
Page 32

Log in Using Your Power Center Account
To log in using your Power Center Account:
Select
1
2
Enter the
3
Enter the
account.
4
Click
Power Center Account
User Name
Passwo rd
Login
.
. This is the user name of the Power Center account.
. This is the user password of the Power Center
(default).
Access Control 32
Page 33

Log in Using the Windows Domain Account
To log in using the Windows Domain Account:
Select
1
2
Enter the
Windows Domain Account
User Name
. This is the user name of the Windows domain
.
account.
3
Enter the
Passwo rd
. This is the user password of the Windows domain
account.
4
Enter the
5
Click
Domain
Login
. This is the domain name of this user account.
.
Access Control 33
Page 34

Log in Using the Windows Local Account
To log in using the Windows Local Account:
1
Select
2
Enter the
Local Windows Account
User Name
. This is the user name of the local Windows
.
account.
3
Enter the
Passwo rd
. This is the user password of the local Windows
account.
4
Click
Login
.
After successful login, the Getting Started page opens. Now you can start to
use Power Center functions.
NOTE: A windows local account with blank password may fail to log into Power
Center due to the Windows security policy settings. For more information on the
security policy settings, see the Microsoft Web site or Windows Help.
Access Control 34
Page 35

Log in with Single Sign-on (SSO)
SSO uses centralized authentication servers that other applications and
systems utilize for authentication purposes, and combines this with
techniques to ensure that users do not actively have to enter their credentials
more than once.
Kerberos SSO requires specific domain environment settings for the
Windows Active Directory (AD) domain controller, Power Center server, and
Web b row s er.
Single Domain Environment
The following illustration shows how to set up a single domain environment
with the following components:
• Domain Controller — dns.dcm.dell.com is the Windows AD server that
supports domain dcm.dell.com (Father and Child).
• Power Center Server
Center installed.
• Power Center Client
connects to the Power Center server.
—
server1.dcm.dell.com is the server with Power
—
server2.dcm.dell.com is the client server that
To set up the Kerberos SSO single domain environment, perform the
following steps:
Step 1. Install Power Center
When installing Power Center:
1
Set up a Realm Name. You must enter a Fully Qualified Domain Name
(FQDN) of the Realm. For example, dcm.dell.com.
Access Control 35
Page 36

2
Set up AD domain controller addresses. Separate multiple addresses with a
comma. For example, 192.168.0.250.
3
Specify a domain user for dcm.dell.com as Power Center server’s domain
account for Kerberos SSO. This user account must be an existing and valid
domain user account. For example, "Tom" and Tom’s password.
Step 2. Set up Service Principle Name (SPN) for Power Center service in
AD Domain Controller
1
Log into the AD domain controller as an Administrator.
2
Open a command console.
3
Add two SPNs for Power Center, use server FQDN in one SPN and server
NetBIOS name for the other SPN. The user account associated with
service SPN must be the Power Center server’s domain account for
Kerberos SSO configured during Power Center installation or in the
Settings
page. For example:
setspn -a HTTP/server1.dcm.dell.com Tom
setspn -a HTTP/server1 Tom
Step 3. Configure Web browser
You must configure your Web browser to support SSO. For more information
on how to configure this, see your Web browser Help. For a list of supported
Web browsers, see "System Requirements" in the "Overview" chapter.
NOTE: To correctly set up Kerberos SSO: 1) The date and time on all involved
computers must be consistent. 2) DNS configuration must be correct.
To support SSO in Firefox, you must send Kerberos credentials to the
appropriate KDC.
To support SSO in Internet Explorer, you must add the Power Center server
as a local Intranet site.
The following is an example of configuration steps in Microsoft Internet
Explorer 8:
1
Go to
Internet Explorer 8 → Internet Options → Security → Local
Intranet,
2
Click
and click
Advanced
Sites
. The Local Intranet window opens.
, add your Power Center site into Local Intranet. For
example, server1.dcm.dell.com.
Access Control 36
Page 37

Multiple Domain Environment
The following illustration shows how to set up a multiple domain
environment with the following components:
• Domain Controller — There are several Windows AD domain controllers
in the illustration, including the parent domain dcm.dell.com and the
child domans east.dcm.dell.com and west.dcm.dell.com.
• Power Center Server
—
server1.east.dcm.dell.com is the server with Power
Center installed. It is an AD domain controller, the domain name is
east.dcm.dell.com
。
• Power Center Client — test.west.dcm.dell.com is the client server that
connects to the network of the Power Center server.
To set up the Kerberos SSO multiple domain environment, perform the
following steps:
Step 1. Install Power Center
When installing Power Center, do the following:
1
Set up the Default Realm Name of the domain in which Power Center is
installed. You must enter FQDN. For example, east.dcm.dell.com.
2
Set up the AD Domain Controller addresses. Separate multiple addresses
with a comma. For example, 192.168.0.2, 192.168.0.3.
3
Specify a domain user for east.dcm.dell.com as Power Center server’s
domain account for Kerberos SSO. For example, "Jerry" and Jerry’s
password.
Step 2. Set up SPN for Power Center service
Access Control 37
Page 38

Set up SPN for Power Center service in all involved AD domain controllers. In
the example, three domains are involved: dcm.dell.com, east.dcm.dell.com
and west.dcm.dell.com. Repeat the following steps on each domain.
1
Log into the AD domain controller as an Administrator.
2
Open a command console.
3
Add two SPNs for Power Center:
• If it is on the Default Realm (configured in Step 1), the user account
associated with the service SPN must be the Power Center server’s
domain account for Kerberos SSO configured in Step 1. For example,
setspn -a HTTP/server1.east.dcm.dell.com Jerry
setspn -a HTTP/server1 Jerry
• If it is not on the Default Realm, for example, it is on dcm.dell.com,
the user account associated with the service SPN must be a domain
user account in the current domain. For example, Jack is a domain
user in dcm.dell.com. Use the following commands to create service
SPN on the dcm.dell.com domain controller.
setspn -a HTTP/server1.east.dcm.dell.com Jack
setspn -a HTTP/server1 Jack
Step 3. Configure Web browser
You must configure your Web browser to support SSO. For more information
on the configuration, see step 3 of "Single Domain Environment" in this
chapter.
Windows NT LAN Manager (NTLM) Authentication Limitation
Power Center supports Kerberos SSO for Windows domain user
authentication. To enable this feature, Power Center is configured to support
the Windows integrated authentication option which includes two
authentication mechanisms: Kerberos and NTLM .
NTLM is not supported in Power Center. If the client’s Web browser uses
NTLM to authenticate domain users for Power Center, there are some
limitations.
Access Control 38
Page 39

What's the limitation?
The Web browser displays a message box requiring a Windows user name and
password:
•If you press OK after entering a user name and password, whether the
information is correct or not, the Power Center login page appears and
requires you to authenticate through the login page.
•If you press
log into Power Center.
When does this occur?
When one of the following elements of Kerberos SSO is not correctly
configured: Power Center server, Web browser or AD domain controller
configuration.
How to solve?
Correctly configure your Power Center server, AD controller and Web browser
for Kerberos SSO. For more information on how to configure, see the section
above and your Web browser Help.
Cancel
, there is an HTTP Status 401 failure and you cannot
Multiple User Login
Power Center supports up to ten concurrent user login instances. When
multiple users log into Power Center,
Center, for example, deleting a device or moving a device, this may cause
unexpected behavior for other logged in users.
if one user implements a change in Power
For exa m ple:
Access Control 39
Page 40

• If another user is viewing the pages, this user may see inconsistent data.
• If another user is performing operations on the same device, this user may
receive an error message.
Logging out
You can log out of Power Center after completing your tasks.
To log out of Power Center, click Logout at the upper right corner of the
management console.
Managing User Roles
Power Center supports three types of pre-defined roles. Each role has
different privileges:
• Administrator — All privileges.
• Power User
License" privileges.
• Guest
Only a user with the "Manage Role/User" privilege can add/edit/delete a role
in Power Center.
Adding a Role
If you are an administrator, you can add a new role, assign privileges to it, and
add users to the new role.
To add a role:
1
Go to
2
Enter the following role information:
•Name
role name must be unique.
•Description
than 1024 characters.
•Privileges
3
Click
—
All privileges except the "Manage Role/User" and "Manage
—
"View Device/Group" privileges only.
Settings → User Accounts → User Roles
—
Role name. The length must be less than 50 characters. The
—
Optional. Role description. The length must be less
— Select the privileges for this role.
Apply
.
, and click
Add Role
.
Access Control 40
Page 41

Updating a Role
To update a role:
1
Go to
Settings → User Accounts → User Roles
2
Edit the role name, description, or privileges.
3
Click
Apply
.
NOTE: Pre-defined roles cannot be edited.
, and click
Edit
.
Deleting a Role
To delete a role:
1
Go to
Settings → User Accounts → User Roles
2
Select the roles’ checkboxes to delete them.
3
Click
Apply
.
NOTE: Pre-defined roles cannot be deleted.
, and click
Delete
.
Managing User Accounts
You can create users and assign them with different roles.
If you have the "Manage Role/User" privilege, you can add/edit/delete a user
in Power Center.
Adding a User
If you have the "Manage Role/User" privilege, you can add a new user and
assign roles to this user.
To add a user:
1
Go to
Settings → User Accounts → User Accounts
2
Select the user type. Enter the required information:
•
Local Windows Account —
account. It can be either a user account name or a group account name.
•
Windows Domain Account —
domain account and Windows domain name. It can be either a user
account name or a group account name.
Enter a valid user name of the Windows
Enter a valid user name of the Windows
, and click
Add User
.
Access Control 41
Page 42

•
Power Center Account — Create a user name and password for the Power
Center account. For more information on the user name and password
rules, see Step 8 of "Installing Power Center" in the "Installing and
Launching" chapter.
3
Select the user roles. You can select multiple (0-4) roles to assign more
privileges for the user.
NOTE: If you assign user A to role 1 and role 2, it has all privileges of role 1 and role
2.
4
Enter the user description. This field is optional. This is useful when there
are two users with the same user name. You can enter a description to
distinguish between them.
5
Click
Apply
.
Updating a User
After a user is created, you can update the user’s privilege or password;
however, you cannot update the user type and description.
To update a user:
1
Go to
Settings → User Accounts → User Accounts
2
Click
Update Password
to update the user password, or click
Role 1, Role 2, Role 3, or Role 4 to update user privileges.
3
Click
Apply
.
.
Edit
to edit
NOTE: You cannot edit the privileges of the Power Center super user that was
created during the installation.
Deleting a User
To d e le te a u s er :
1
Go to
Settings → User Accounts → User Accounts
2
Select the users’ checkboxes to delete them.
3
Click
Apply
.
NOTE: You cannot delete the Power Center managed user (super user) that was
created during the installation.
, and click
Access Control 42
Delete
.
Page 43

Managing Privileges
A user privilege is a right to execute a particular type of Power Center
function. Privileges are not configurable, however you can configure roles,
which group several privileges together.
Power Center has the following pre-defined privileges for each role:
• Global configuration
• Device discovery
• Manage role/user
•View device/group
• Manage device/group
• Manage policy
• Manage event
• Manage license
Each page in the Power Center management console can function differently
according to the user privilege:
• Fully functional — User can view and edit.
• Partially functional
•Not functional
The following table lists the functional status of each page for the different
user privileges.
Table 4-1. Pages and Privileges
—
User can partially view or edit.
—
User sees a blank page.
Page Privilege and Page Status
Getting Started Fully functional:
All users.
Partially functional:
NA
Not functional:
NA
Access Control 43
Page 44

Table 4-1. Pages and Privileges
Page Privilege and Page Status
Power Overview Fully functional:
For users with the "
"Manage Event" and "Manage Policy" privileges.
Partially functional:
Users with only "View Device/Group" and "Manage Policy"
privileges cannot view Thresholds tab.
Users with only "View Device/Group" and "Manage Event"
privileges cannot view Policies tab.
Not functional:
For users without the "View Device/Group" privilege.
Group
Management
Discovery Fully functional:
Fully functional:
For users with the "Manage Device/Group" privilege.
Partially functional:
NA
Not functional:
For users without the "Manage Device/Group" privilege.
For users with the "Device Discovery" privilege.
Partially functional:
NA
Not functional:
For users without the "Device Discovery" privilege.
Manage Device/Group," "View Device/Group,"
Access Control 44
Page 45

Table 4-1. Pages and Privileges
Page Privilege and Page Status
Device List Fully functional:
For users with the "View Device/Group" and "Manage
Device/Group" privileges.
Partially functional:
Users with the "View Device/Group" privilege can view devices on
this page.
Not functional:
Users without the "Manage Device" and "View Devices/Group"
privileges will see a blank page.
Policies Fully functional:
For users with the "View Device/Group" and "Manage Policy"
privileges.
Partially functional:
NA
Not functional:
Users without the "View Device/Group" and "Manage Policy"
privileges will see a blank page.
Compare Fully functional:
For users with the "View Device/Group" privilege.
Partially functional:
NA
Not functional:
For users without the "View Device/Group" privilege.
Settings
Settings
→
Fully functional:
For users with the "Global Configuration" privilege.
Partially functional:
Users without the "Global Configuration" privilege can only view
part of the settings on this page.
Not functional:
NA
Access Control 45
Page 46

Table 4-1. Pages and Privileges
Page Privilege and Page Status
Settings →
User Accounts
Settings
Licensing
Event Logs Fully functional:
→
Fully functional:
For users with the "Manage Role/User" privilege.
Partially functional:
Users without the "Manage Role/User" privilege only can view
their own user information.
Not functional:
NA
Fully functional:
For users with the "Manage License" privilege.
Partially functional:
Users without the "Manage License" privilege only can view the
license information.
Not functional:
NA
For users with the "Manage Event" and "View Device/Group"
privileges.
Partially functional:
Users with the "View Device/Group" privilege only can view the
events on this page.
Not functional:
NA
Global Configuration
The "Global Configuration" privilege enables:
• Changing the Power Center global configuration. For example, you can
configure the sampling interval or database settings.
What happens without this privilege?
You only can view part of the Settings page, you cannot make any changes.
There is no Edit option.
Access Control 46
Page 47

Device Discovery
The "Device Discovery" privilege enables:
• Discovering network devices
What happens without this privilege?
You cannot see the Power Overview page in Power Center. You can view the
Settings page, but cannot make any changes.
Manage Role/User
The "Manage Role/User" privilege enables:
•Creating role
•Deleting role
•Updating role
•Creating user
• Deleting user
•Updating user
What happens without this privilege?
You only can view your own user account information and update the
password. The User Roles and User Accounts sections are not displayed in the
User Accounts page.
View Device/Group
The "View Device/Group" privilege enables:
•
Viewing
What happens without this privilege?
You cannot view any device or group information; you can only view the
Settings page.
NOTE: Users with only "View Device/Group" privilege have the following
restrictions: 1) The Discovery page is not available to them. 2) The pages under
Devices Groups do not enable Add/Delete/Edit functionalities.
all devices and groups information
Manage Device/Group
The "Manage Device/Group" privilege enables:
Access Control 47
Page 48

• Creating logical groups
• Creating a Data Center/Room/Aisle/Rack/Device
• Associating Data Center/Room/Aisle/Rack/Device/Logical Group with
parent logical groups
• Deleting a Data Center/Room/Aisle/Rack/Device/Logical Group
• Managing a device
• Removing a device/group from the Device List
NOTE: When you assign the "Manage Device/Group" privilege to a user, Power
Center automatically assigns the "View Device/Group" privilege to this user.
What happens without this privilege?
Yo u c a n v i e w
all devices and groups information, but cannot
add/delete/edit/manage the devices and groups.
Manage Policy
The "Manage Policy" privilege enables:
•Adding/removing a policy
• Updating a policy
• Starting/stopping Emergency Power Reduction on a device/group
NOTE: To manage a policy, you must also have the "View Device/Group" privilege.
What happens without this privilege?
You cannot see the Policies tab in the Power Overview page.
Manage Event
The "Manage Event" privilege enables:
• Adding/Removing an event condition (threshold)
• Updating an event condition (threshold)
• Removing an event
NOTE: To manage event, you must also have the "View Device/Group" privilege.
What happens without this privilege?
Access Control 48
Page 49

You can view the events information and add comment to the events, but
cannot delete events. You cannot see the Thresholds tab in the Power
Overview page.
Manage License
The "Manage License" privilege enables:
• Importing a license
What happens without this privilege?
You only can view the License information, but the Import License option is
not available.
Viewing Current User Information
You can click the login user name at the upper-right corner of any page, or go
to Settings →
user information. You can:
• View the current user information
• Update the current user password
To update the user password:
1
Click
2
Enter the current password and new password. Enter the new password
again to confirm.
3
Click
User Accounts → Current User to view and update the current
Update Password
Apply.
.
Licensing
Power Center requires a valid license. You can import and view a license in the
Licensing page.
Importing License
Power Center automatically installs a 60-day trial license during installation.
When the trial license expires, most of the Power Center features are
disabled. You must import a perpetual license before the trial license expires.
NOTE: Only users with the "Manage License" privilege can import a license.
Access Control 49
Page 50

To im po rt a l i ce ns e:
1
Request a license
2
Click
Import License
3
Click
Upload File
4
Select a license file, and click
from www.dell.com
.
.
Open
.
/powercenter.
Power Center imports the license and brings up a message upon successful
import. You can view the license information in the Licensing page.
Viewing License
Power Center license information includes:
•Product Name —
•Version
— Product version.
•License Type
• Expiration
the format: YYYY-MM-DD, Days Left: xx.
• Status
NOTE: The Getting Started page displays a warning message when the license
— Val id or Ex pi r ed .
expires in less than 30 days.
Product name.
— Trial (60 days) or Perpetual.
— For Trial license only. Displays the license expiration date in
Access Control 50
Page 51

5
Device Discovery
To manage devices in Power Center, you must add the devices to the Power
Center management console first. You can add devices by discovering devices
from the network, or adding devices manually.
This chapter explains how to discover devices from the network and add
devices manually in the Power Center management console.
Power Center device discovery includes both the automatic detection of all
devices on your data center and the collection of basic information about
each device, such as the device name, connection status, device type, device
model, its IP address and hostname, and the protocol it uses for
communication. This enables you to track the device status and your data
center information. You can also manage these discovered devices in Power
Center. If there is a new or changed device in your data center, you can use
the device discovery function to rediscover the devices.
You must have the "Manage Device/Group" and "Discover Device" privileges
to add a device to Power Center.
There are two scenarios for adding devices:
• Add a device from the network — You can discover a device from the
network. The discovered devices will be automatically added to the Device
List.
• Add a device manually
console to specify device properties and add a device to the Device List.
— You can use the Power Center management
NOTE: If you use a network security policy, the discovery function may not work
properly.
Supported Devices and Unsupported Devices
You can add or discover supported devices, and create a group structure to
build out the data center. Power Center cannot discover or manage all device
types, and unsupported devices must be added manually to make the data
center group structure complete.
For supported devices:
Device Discovery 51
Page 52

• Device types include server, UPS, PDU and chassis.
• Set the connection protocol and credential information so that the device
can communicate with Power Center.
• Add or discover a supported device to the Device List. Perform
management functions including discovery, adding to the group
structure, monitoring power and temperature, applying power
management policies, and sending events.
For unsupported devices:
• Power Center does not communicate with unsupported devices, therefore
connection protocol and credential information is not necessary.
• Unsupported devices cannot be discovered, only added manually to the
Device List.
• Power Center adds the unsupported device to the group structure, but
cannot manage it using the available management functions.
You may need to enter the following power values when adding supported or
unsupported devices:
•
Faceplate Power:
can draw; this value should be listed on the power supply specifications.
The faceplate power rating is typically much higher than the actual
power used by the device.
•
De-rated Power:
measurement cannot be completed, this value is used.
The maximum amount of power that a group/device
The default maximum power value; if a power
NOTE: Faceplate power value is always greater than the de-rated power
value.
Adding a Device from the Network
This section explains how to use the Power Center management console to
discover a device from the network.
Before adding a device from the network, make sure the DNS server is set up
correctly. Specifically, make sure that:
• There is a DNS server running on the Power Center’s network.
• The specified DNS server has a reverse DNS zone for the network on
which you are trying to discover the devices.
Device Discovery 52
Page 53

NOTE: Power Center server tries to get device names from the DNS server
specified in the network configuration of the operating system. This may cause the
device name to be different from the actual one if the DNS server resolves the
device IP address to a different device name.
To discover devices from the network, complete the following steps:
Step 1. Enter IP Range
1
Go to the
2
Enter the IP address range, or select one in the list. If the correct range is
Discovery
page.
not displayed, add it using the following steps:
3
Click
Add IP Range
• Beginning
• End
—
•Network Mask
4
Click
Apply
The end IP address. For example, 192.168.1.255.
. The new IP range is added to the list of IP ranges and
, and enter information in the following fields:
—
The beginning IP address. For example, 192.168.1.1.
—
The network mask. For example, 255.255.255.0.
displayed at top of the page.
5
Select at least one IP Range, and click
NOTE: The IP Ranges section lists not only the IP ranges that you have added, but
also the IP ranges of the recent three discovery tasks.
Next
.
Step 2. Select Protocol
You can either create a new protocol profile or use an existing protocol profile.
To create a new protocol profile:
1
Click
Add Protocol
.
Enter information in the following fields:
•Profile Name
less than 16 characters.
•Description
•Protocol
through the network. You must enter credential information for the
selected protocol. For more information on protocol information, see
"Protocol Profile" in this chapter.
2
Click
Apply
page. Click
—
Enter the profile name. The profile name must be
—
Enter the description for this profile.
— Select the protocol used for communicating with devices
. The new protocol profile is added and displayed at top of the
+
next to a profile to see its details.
Device Discovery 53
Page 54

3
Select the connnection protocol(s), and click
Step 3. View Summary and Search Devices
1
The
Summary
Search
.
2
After the search progress completes, go to the
that the correct devices are listed on the page.
You can also perform the following tasks related to the device discovery:
To e d it an IP ran ge :
1
Click
Edit
2
Enter the new IP range.
3
Click
Apply
To view an active search:
1
Click
View Active Searches
2
The search progress percentage bar displays and the bar automatically
disappears when the search completes.
To view the recent discovery jobs:
1
The
Recent Discovery Jobs
searches.
2
Click
Details
To rerun the search:
In the
1
2
Recent Discovery Jobs
discovery job.
The search starts automatically using the discovery job search criteria, and
the device information is updated in the
information displays. Review the information and click
.
. The IP address range is updated.
to view the status of the active searches.
section displays the four most recent discovery
to view the history information on each search.
section, click
Next
.
Device List
Rerun Search
Device List
page to validate
next to a
page.
Adding a Device Manually
This section explains how to add a device manually in the Power Center
management console.
To add a device manually:
1
Go to the
Device List
page, and click
Add
.
Device Discovery 54
Page 55

2
Enter the device and protocol information - Required Device Information,
Protocol Information, Optional Device Information - for the device you
want to add.
• Required Device Information:
– Device Name:
– Device Type:
Chassis, or Unsupported.
– IP Address or Hostname:
optional for an Unsupported device.
NOTE: Enter either the IP Address or the Host Name field, not both. Power
Center will check its validation; make sure you have entered a valid IP
address or host name.
•
Protocol Information:
information on credential information for the protocols, see "Protocol
Profile" in this chapter.
–Protocol:
the device type. If you selected a UPS or a PDU in the previous step,
you must select a protocol.
– Credential Information:
•Optional Device Information:
– Device Model:
you add an unsupported device.
–Size of Device:
–Description:
– Faceplate Power: Enter the faceplate power value.
– De-rated Power: Enter the de-rated power value.
3
Click
Apply
Enter the name of the device
Select a device type which includes Server, UPS, PDU,
Enter a valid IP address or hostname;
Not required for an unsupported device. For more
The corresponding protocol type displays after you select
Enter the protocol credential information.
Enter the device model. This field is available when
Select the device height: 1-10 rack unit.
Enter a description for the device.
.
.
Rediscovering Devices in a Chassis
If you have physically added, removed or changed your devices in a chassis,
you can update the device information:
Device Discovery 55
Page 56

1
Go to
Group Management → Physical (Logical) Group → View All
Physical Groups
2
Click the selected physical/logical group icon and its device/group, and go
.
to the Chassis level.
3
Click
Rediscover Chassis Devices
.
The devices information in the chassis is automatically updated.
Protocol Profile
Power Center server uses protocol profile to communicate with the devices by
specifying the device connection protocol and credential information. You
can add a new profile, edit an existing profile, or delete a profile. You can
select a protocol profile to discover the devices.
Power Center supports the following connection protocol types, and includes
several optional settings:
NOTE: Get the correct protocol type and credential information from your device
administrator. The user name and password for the IPMI/WS-MAN protocol must
be the same as those used for the iDRAC/CMC web console.
• IPMI: Select IPMI protocol for the server.
–IPMI User Name
– IPMI Password
–IPMI Key
• WS-MAN: Select WS-MAN protocol for the chassis.
– WS-MAN User Name
255 characters.
–WS-MAN Password
characters.
–WS-MAN Port
to 65535.
– WS-MAN Validate Certificate
validation.
—
Maximum length is 16 characters.
—
Maximum length is 255 characters.
—
A string of 40 hex digits.
—
HTTP basic user name, maximum length is
—
HTTP basic password, maximum length is 255
—
Default value is 443, or enter a port number from 1
—
Optional. Enables device certificate
NOTE: A trusted certificate must be imported into the system before the WS-
MAN Validate Certificate option is enabled or the communication may fail. For
more information on how to install the certificate using the Dell Chassis
Device Discovery 56
Page 57

Management Controller, see "Configuration - New SSL Server Certificate
Configuration" in the Using Windows Remote Management (WinRM) to
Remotely Manage Dell PowerEdge M1000e Using the Chassis Management
Controller (CMC) technical whitepaper. It can be downloaded from
http://www.delltechcenter.com/page/dcim.modular.cmc.winrm. For more
information on how to import the certificate to Power Center, see "Managing
Certificates" in the "Security" chapter.
• SNMP v1v2c: Select an SNMP protocol version from SMMPv1, or SNMP
v2/v2c for the PDU or UPS.
– SNMP Community string
—
Required. Maximum length is 255
characters.
• SNMP v3: Select SNMP v3 for the PDU or UPS.
– SNMP User Name
– SNMP Authentication Password
—
Required. Maximum length is 255 characters.
—
Required. Maximum length is 16
characters.
– SNMP Encryption Password
—
Maximum length is 255 characters.
When the SNMP Authentication Password is empty, the SNMP
Encryption Password is also empty.
You can set up multiple protocol profiles for each protocol.
Device Discovery 57
Page 58

6
Device Management
The Device List page lists network-discovered devices and devices added
manually. From this page, you can:
• Add supported or unsupported devices to the
• Remove devices from the
• Edit device information for a single device or multiple devices
• Edit protocol information for a single device
• Filter and sort devices to meet current needs
Device List
page
Viewing Devices
The Device List page lists the following device information:
Table 6-1. Device Information
Field Description
Name Device Name. Power Center resolves this name during the
network discovery.
Status Device status, including:
•Connected
• Lost connection
• Unknown
IP Address Device IP address.
Hostname Device hostname.
Serial Number or
Service Tag
Device serial number or service tag.
• Service Tag: The service tag for Dell chassis and servers is
displayed.
• Serial Number: The serial number for Dell PDU and UPS
is displayed.
• NA: For all other devices, NA is displayed.
Device List
page
Device Management 58
Page 59

Table 6-1. Device Information
Field Description
Device Type Device type, including:
•Server
•PDU
•UPS
•Chassis
• Unsupported
Device Model Device model, for example, PowerEdge M610.
Protocol The protocol used for communication, including:
•IPMI
• SNMPv1v2c or SNMPv3
•WS-MAN
Power Capability The power monitoring and capping capability, or if the
device can be upgraded, including:
• Unknown
•None
• Monitor
• Monitor & Capping
• Monitor and Upgradable
Group The devices’ physical group.
Time of
Discovery
Description Device description.
Size of Device The physical size of device, in rack units (U).
Faceplate Power Device faceplate power.
De-rated Power Device de-rated power.
The time when the device was discovered.
Device Management 59
Page 60

NOTE: If a device is already discovered and listed in the Device List page, when
Power Center runs a discovery task and this device is discovered again, all the
device information for this device is updated in the Device List page. For more
information on device discovery, see "Adding a Device from the Network" in the
"Device Discovery" chapter.
Editing Devices
You can edit the device information of devices listed in the Power Center
management console.
To edit a single device:
1
Go to the
2
Click
3
Edit the
Faceplate Power
chassis.
4
Click
You can use the batch edit function to edit the information of multiple
devices at once.
To batch edit devices:
1
Go to the
2
Click
3
Select the devices’ checkboxes to edit them, and click
4
Enter the
for the devices.
Device List
Edit Tasks → Edit
Name, Description, IP Address
NOTE: You cannot edit the Faceplate Power and De-rated Power for a
NOTE: For IP Address and Host Name fields, enter either the IP Address or
the Host Name field, not both. If you edit the IP address, Power Center does
not check its validation. If you edit the host name, Power Center does check
its validation. Make sure you enter a valid host name. If you edit the host name
to an integer in the range of 0-4294967295, the Power Center server uses the
IP address which can be represented by this integer for device
communication. For example, if you edit the host name to 3232235777, the
Power Center server communicates with the device using IP address
192.168.1.1.
Apply
.
Device List
Edit Tasks →
Size, Faceplate Power, de-rated Power, Description
page.
.
or
de-rated Power
page.
Batch Edit
of the device.
.
or
Host Name, Size of Device
Next
.
or
Protocol
,
Device Management 60
Page 61

NOTE: 1) If you selected devices with different protocol types, then you cannot edit
the protocol information. 2) If you edit the protocol information and leave the User
Name field empty, the user name remains unchanged. 3) If you select the Clear
checkbox next to a field, the current value of this field is cleared. If you do not select
the Clear checkbox and leave this field empty, the value remains unchanged.
5
Click
Apply
.
Editing Protocol
You can edit the communication protocol of the devices listed in the Device
List page.
To edit a protocol:
1
Go to the
2
Click the device protocol link that you want to edit in the
column.
3
The Edit Protocol Information window opens. Enter the protocol details.
You must enter credential information for the protocol. For more
information on the protocol information, see "Protocol Profile" in this
chapter.
NOTE: 1) If you select the Clear checkbox next to a field, the current value of this
field is cleared. 2) If you do not select the Clear checkbox and leave the field empty,
the value remains unchanged.
4
Click
Device List
Apply
page.
Protocol
.
Deleting Devices
If you want to manually remove a duplicated device, or you do not want to
manage a device in Power Center, you can delete the device from the Device
List page.
To delete a single device or multiple devices:
1
Go to the
2
Click
3
Select the devices’ checkboxes to delete them.
4
Click
To delete all devices:
Device List
Delete Tasks →
Apply
.
page.
Delete
.
Device Management 61
Page 62

1
Go to the
2
Click
3
Read the pop-up message, and click
Device List
Delete Tasks →
page.
Delete All
.
Ye s
to continue.
Filtering Devices
You can apply a filter to show only specific devices, for example, devices of a
certain type.
To fi lt er d ev ic e s:
1
Go to the
2
Click
3
The
Range
Group
specific filtering option window.
4
In the filtering option window, use the displayed information to select
filtering options. You can use one or more options to filter devices.
•
•
•
•
•
Device List
Filter
.
Filter
window opens. Click a filtering option in the left pane -
,
Date Range, Protocol, Status, Device Type/Model, Physical
,
Faceplate/De-rated Power, or Power Capability
IP Range —
Date Range —
the dates manually following this format <YYYY-MM-DD>, or select
the dates from the calendar. Devices discovered from 00:00:00 of start
date to 00:00:00 of the next day after the end date are displayed. For
example, if you enter the filtering option 2011-01-01 as both start date
and end date, all devices discovered between 00:00:00 of 2011-01-01
and 00:00:00 of 2011-01-02 are displayed.
Protocol — Select the protocols used for communication. You can
select multiple protocols.
Status — Select device statuses. You can select multiple statuses.
Device Type/Model — Select the device type or device model. Device
Model is the specific model information of a device type. For example,
PowerEdge M610. All the models that currently exist in the
List
page are shown. If you selected both
Model
, make sure the device type matches the device model.
Otherwise, no result is shown.
page.
IP
- to display a
Enter the start and end IP address of devices.
Enter the start and end date of device discovery. Enter
Device
Device Type
and
Device
Device Management 62
Page 63

•
Physical Group —
You can select any level of the physical group, including data center,
room, aisle, rack, chassis.
•
Faceplate/De-rated Power — Enter a faceplate or de-rated power
range of devices.
•
Power Capability — Select the power capability of the device. You can
select multiple power capabilities.
5
Click
Apply
. The
Select a physical group where the device is located.
Device List
page displays the filtered devices.
Sorting Devices
By default, in the Device List pages, the devices are listed by Name in
alphabetical order (A-Z). To sort the list, click the Up or Down symbol next
to the field to list the devices in ascending or descending order. The symbol of
the current sorting field is displayed in orange.
Device Management 63
Page 64

7
Group Management
You can configure several devices as a group so that you can manage them.
Power Center enables you to create and organize your devices into two
distinct types of groups:
•Physical Group
A physical group is a group of groups/devices with a structure mapping that
represents the actual physical layout.
For more information on how to create and manage physical groups, see
the "Physical Groups" chapter.
• Logical Group
A logical group is a collection of groups and devices with a logical relation.
A logical group does not need to map with the actual physical layout.
For more information on how to create and manage logical groups, see the
"Logical Groups" chapter.
Mapping Group Structure Information
Power Center supports group stucture mapping for Dell PowerEdge rack
servers and tower servers. For more information on the specific models, see
"Supported Devices" in the "Overview" chapter.
After you have created or updated the group structure, Power Center
automatically updates the location information in the firmware of supported
devices at the following mapping structure:
• Data Center —
format: <Data Center - Room>.
•Aisle
•Rack
• Rack Slot
• Chassis
— Aisle information in Power Center.
— Rack information in Power Center.
— Chassis information in Power Center (if applicable).
Data center and Room information in Power Center,
— Rack slot information in Power Center.
Group Management 64
Page 65

NOTE: To view the updated location information on supported device, you must 1)
Make sure the device status is "Connected" in Power Center. 2) Wait a few minutes
for the location information to be updated in the firmware of the device.
Finding a Group or Device
After the data center group structure is set up, you can find a group or device
from the Power Overview or Group Management page:.
You can do the following in the Power Overview page:
• Find a physical group or device (excludes Unsupported devices).
• Find a logical group.
• View the event status. If there are critical or warning events in the group or
device, an event icon is displayed next to the group/device icon. If the
critical and warning events both exist, only the critical event icon is
displayed.
• View the power details of the group/device. For more information on power
details, see the "Power Monitoring" chapter.
•Click the
page of the selected group/device.
You can do the following in the Group Management page:
• Find a physical group.
• Find a logical group.
• Manage the selected group. For more information on how to manage the
groups, see the other sections in this chapter.
•Click the
Overview
To find a physical group or device:
Manage Group
View Power Overview
page and view the power details.
link on the top to enter the
link on the top to enter the
Group Management
Power
1 Go to Power Overview →
Group Management → Select a Physical Group
data center physical group structure on the top.
2
Click the data center and its group icon to expand the group structure.
3
Select the group or device that you are looking for.
Select a Physical Group or Device
.The page displays the
Group Management 65
. Or, go to
Page 66

4
The page displays the selected group/device at the right, and displays the
corresponding
Power Overview
or
Group Management
page of the
selected group/device.
To find a logical group:
1 Go to Power Overview
Management
→
→ Select a Logical Group
. Or, go to
Select a Logical Group. The page displays the logical
group list on the top.
2
Click a logical group icon to display its contents.
3
Select the group or device that you are looking for.
4
The page displays the selected group at the right, and displays the
corresponding
Power Overview
or
Group Management
page of the
selected group.
Group
Group Management 66
Page 67

8
Physical Groups
A physical group is a group of groups/devices with a structure mapping that
represents the actual physical layout.
As an IT/facility administrator, you may need to organize devices and groups
according to their physical layout in the data center. Power Center enables
you to monitor power/temperature information, manage policies/events at
individual device, chassis, rack, aisle, room or data center levels.
Data Center Physical Group
Power Center manages physical groups with the following group structure:
Data Center →
groups in this order.
PDU, UPS and unsupported devices can be attached at any level of the
physical group structure. You can find the PDU and UPS devices information
at the bottom of the group’s page.
You can manually create physical groups, then add devices into the groups
through the management console.
Room →
Aisle → Rack → Chassis. You must create physical
Creating Physical Group
To create a physical group:
1
Go to
Group Management → Physical Groups
Physical Group
2
Click
Add New
3
Enter a
4
You can create multiple groups at once if you click
Name>
Number
groups by adding a number (starting from 1) to it. For example, if you
enter the name GroupA and number 10, Power Center creates ten groups
named GroupA1, GroupA2 ...GroupA10.
Name
.
.
and
Description
in the
Ta s k s
section. Click
of the groups to create. Power Center automatically names the
for the data center.
Duplicate Group
, and click
Physical Groups 67
Select a
Add New <Entity
and enter the
Page 68

5
Click
Apply
.
Managing Physical Groups
Adding Devices to a Physical Group
After you create a physical group, you can add or associate devices to this
group.
To add/associate a device:
1
Click the physical group icon to open the Room Contents page. Click
New Room
2
Click the room icon to open the Aisle Contents page. Click
Aisle
3
Click the aisle icon to open the Rack Contents page. Click
, enter the Name and Description, and click
, enter the Name and Description, and click
Apply
Apply
.
Add New
.
Add New Rack
enter the Name, Description, Capacity (rack size) and Total Power
Capacity (total rack power capacity), and click
NOTE: Rack power capacity is a field that indicates the physical power
limitation in a rack; it is determined by the PDU capacity in power distribution
topology of the data center. This field also sets the upper limit (ceiling) on the
power policy that can be configured for the rack.
4
Click the rack icon to open the
Devices in Rack
Apply
.
page. The following
devices are not displayed in the Device List when you add the devices to a
rack.
• Blade servers.
• Devices without device size information. For example, a PDU or UPS, or a
device that was manually added without the device information entered.
• A device whose size exceeds the continuous available slots on the rack.
You can add a device to a rack using the following options:
Add
,
• Add a device to a rack
a
Click
Devices in Rack → Add to Rack Slot
b
Select a slot, and click
c
The
Add Device to Rack
defined to a physical group. Use the following options to organize the
device information:
.
Add Devices to Selected Slot
.
window displays any devices that are not
Physical Groups 68
Page 69

• Show additional columns: The page displays three device information
columns by default (Select, Name, Status). Click
Columns
to display all columns.
Show Additional
• Filter: Use the filtering options to filter the devices.
d
Click
Select
next to the devices to add, and click
Apply
. The selected
devices are added to the selected slot and are displayed in the Device
List.
NOTE:
NOTE: You cannot add or remove devices in a chassis; however, you can
When the device size is greater than 1U and there are available slots on
the top of the selected slot, Power Center automatically adds the devices to the
rack. If slots are not available, adding the device fails and another slot will need
to be selected.
rediscover the devices in a chassis. For more information on how to
rediscover devices, see "Rediscovering Devices in a Chassis" in the "Device
Discovery" chapter.
• Add devices to a rack in a batch
a
Click
b
Devices in Rack → Batch Add
In the
Batch Add Devices to Rack
.
window, the devices that are not
defined to any physical group are shown. You can also use the
following options to display the device information to meet your
needs:
• Show additional columns: By default, the page displays three columns
of the device information (Select, Name, Status). You can click
Additional Columns
to display all columns of the device information.
• Filter: If you need to show only specific devices from a long list of the
devices, you can use filtering options to filter the devices.
c
Click
Select
next to the device that you want to add, and then select
the slot for device by one of the following:
• Slot number: You can specify a slot number for the device. Power
Center will add the device to this slot and the slots above it according
to the device size.
• Auto: If you select
Auto
, Power Center will automatically assign slots
for selected devices according to the device size and available slots. All
selected devices are added to the rack.
Show
Physical Groups 69
Page 70

d
Repeat the previous step to select more devices and the corresponding
slots. You can select multiple devices from different pages.
e
Click
Apply
.
NOTE:
If there are not enough slots available, the batch operation of adding
devices to the rack will fail. You must re-select the devices and slots
• Add associated devices to rack
a
Click
b
Devices Associated with Rack → Add to Rack
In the
Associate a Device with a Rack
window, select the devices to
.
add.
c
Click
Apply
.
NOTE: Only PDU or UPS can be associated to the physical group.
5
The physical group is created and devices are added/associated to the
group.
NOTE: One device can only exist in one physical location.
NOTE: When adding Dell Chassis Management Controller (CMC) to a physical
group, if a blade server is found, you must manually update the credential of
the blade server. Once you supply Power Center with the correct credential,
Power Center updates its status from "lost connection" to "connected".
Editing Devices in a Physical Group
After adding or associating devices, you can edit the device information.
To edit a device, use one of the following:
•Click
•Click
•Click
Edit Tasks → Update Slots
Edit Tasks → Move
Edit Tasks → Edit
to move the device to other data center.
to edit the device.
to change the slot for the device.
Removing Devices from a Physical Group
To remove a device from the group:
1
Click
Remove
2
Select the devices’ checkboxes to remove them.
3
Click
Apply.
.
Physical Groups 70
Page 71

NOTE: After the device is removed, it still exists in the Device List page. You can
add it to any physical group or logical group when needed.
Moving Devices in a Physical Group
You can move devices to update the group structure that is similar to the
actual data center device structure when a device is moved physically in the
data center.
A server or a chassis can only be moved to another rack. PDU, UPS and
Unsupported devices can be moved to any level of the physical group
structure.
NOTE: The blades are populated automatically to the chassis when the chassis is
added to the rack. If the blades were not discovered when the chassis was added
to the rack, the blades will be shown as Disconnected in the Device List. The status
will be updated to Connected once the blades are discovered through the discovery
process. When the blade is moved physically in the chassis or from one chassis to
another, the Chassis group structure from the Power Center user interface will be
updated only after the chassis is re-discovered through the Power Center discovery
process.
To mo ve a d e vi ce :
1
Click
Move
.
2
The
Move Device
device on top, and displays a list of physical groups (data center) under it
as active links. If you move a device in the rack, click an active link to
expand the group to display the racks, and then select the rack to which
you want to move the device. If you move a device associated to a physical
group, click an active link to select another group.
3
Click
Move
window displays the physical group structure of the
. The devices are moved to the selected rack or group.
Moving a Physical Group
You can move a physical group, and update the group structure so that it is
similar to the actual data center device structure when a physical group is
moved physically in the data center. The Physical Group can be a room, an
aisle, or a rack.
You must move the physical group according to the following physical group
structure: Data Center → Room → Aisle → Rack.
To move a physical group:
Physical Groups 71
Page 72

1
Click
Move
.
2
The
Move Physical Group
the physical group on top, and displays a list of physical groups (data
center) under it as active links. Click an active link to expand the group to
display all groups that are part of that physical group, and then select a
group.
3
Click
Move
. The physical group is moved to the selected group.
window displays the physical group structure of
Editing Physical Groups
After you have created a physical group, you can edit the group information
to update it.
To edit the group information of a physical group:
1
Go to
Group Management → Physical Groups
Physical Group
2
Click
Edit
3
Edit the
4
Click
Apply
, then click the icons to select a group.
.
Name
and
Description
.
for the group.
, and click
Select a
Deleting Physical Groups
To delete a physical group:
1
Go to
Group Management → Physical Groups
Physical Group
2
Click
Delete
3
Select the groups’ checkboxes to delete them.
4
Click
Apply
, then click the icons to select a group.
.
.
, and click
Select a
NOTE: If deleting the physical group affects the policy, an event will be sent. You
can view it in the Event Logs page.
Viewing Physical Groups
To view details of the physical group, go to the Physical Groups page. There
are two scenarios for accessing the Physical Groups page:
Physical Groups 72
Page 73

• Access from the left pane of the Power Center management console: You
can click
Group Management → Select a Physical Group
to enter this
page. This page lists all of the data centers. You can click a data center’s
active link to expand the contents.
• Access from the
link on top of the
Power Overview
Power Overview
page: You can click the
Manage Group
page to access the specific group/device
content page. This page lists the detailed information of the content in
this group/device.
The Physical Groups page lists all the physical groups by name in
alphabetical order (A-Z). You can click a physical group’s active link to view
more details
• Group structure information —
Click the icons to view the group structure, including Room, Aisle, Rack,
Chassis.
•Group details
—
Click the tabs to view the details.
–Events
—
Events in the group, including Critical, Warning events. For
more information on event severity, see "Event Severity Levels" in the
"Event Management" chapter.
–Dashboards
–Power Details
– Temperature Details
– Policies
–Thresholds
–Rack
—
Power dashboard and temperature dashboard.
—
Power graphic and energy consumption summary.
—
Temperature graphic and details summary.
—
The policies created for the physical group and their status.
—
Power thresholds and temperature thresholds.
—
The information of the devices in the rack. This tab appears
when you view information at the Rack level.
– Chassis
—
The information of the devices in the chassis. This tab
appears when you view information at the Chassis level.
For more information on dashboards, power details, temperature details,
policies, and thresholds, see the "Power Monitoring" and "Temperature
Monitoring" chapters.
Physical Groups 73
Page 74

9
Logical Groups
A logical group is a collection of groups and devices with a logical relation. A
logical group does not need to map with the actual physical layout. For
example, there can be a logical group for all print file servers or email servers.
Creating a Logical Group
To create a logical group:
1 Go to Power Overview →
Group.
2
Click
Add New Logical Group
3
Enter a
4
You can create multiple groups at once if you click
Group
create. Power Center automatically names the groups by adding a number
(starting from 1) to it. For example, if you enter the name GroupA and
number 10, Power Center creates ten groups named GroupA1, GroupA2
...GroupA10.
5
Click
Name
. Click
Apply
and
Duplicate Group
.
Logical Group, and click Select a Logical
Description
.
for the logical group.
and enter the
Number
Add New Logical
of the groups to
Managing Logical Groups
After you created a logical group, you can add a physical group, device, or
another logical group to this group.
Adding a Logical Group
To add a logical group:
1
Click
Add New
2
Select the physical group, logical group, or device, and click
.
Apply
.
Logical Groups 74
Page 75

Adding Devices or Groups to a Logical Group
You can add devices or groups to a logical group. Only one device or group can
be added at a time.
Add a device or group from one of the following categories:
• Physical Group
• Logical Group
•All Devices
NOTE: Chassis are not listed in the All Devices window; you cannot add a chassis
to a logical group from the All Devices category. However, you can add a chassis
from the Physical Group category if the chassis is already added to a rack.
To add a device or group to a logical group:
1
Click a category in the left pane -
Devices
2
In the selection window, use the displayed information to select a group or
- to display a specific group/device selection window.
device.
•Physical Group:
a
The group selection window lists the physical groups as active links.
Click an active link to expand the group to display all groups that are
part of that physical group.
b
Click a physical group’s active link, and then click
c
The physical group is added to, and displayed in, the
Management: Logical Groups
• Logical Group:
a
The group selection window lists the logical groups as active links.
b
Click a logical group’s active link.
c
The logical group is added to, and displayed in, the
Management: Logical Groups
• All Devices:
a
The group selection window displays a list of all devices.
b
Click
Select
to add the device to the
Groups
page.
Physical Group, Logical Group
Select
.
Group
page.
Group
page.
Group Management: Logical
, or
All
Logical Groups 75
Page 76

Editing Logical Groups
After you created a logical group, you can edit the logical group information.
To edit a logical group:
1
Go to
Group
2
Click
3
Enter new
4
Click
Group Management → Logical Groups
, then click the icons to select a group.
Edit
.
Name
and
Apply
Description
.
for the group.
, and click
Select a Logical
Deleting Logical Groups
To delete a logical group:
1
Go to
Group Management → Logical Groups
Group
, then click the icons to select a group.
2
Click
Delete
.
3
Select the groups’ checkboxes to delete them.
4
Click
Apply
.
NOTE: If deleting the logical group affects the policy, an event will be sent. You can
view it in the Event Logs page.
, and click
Select a Logical
Viewing Logical Groups
To view details of the logical group, go to the Logical Groups page. There are
two scenarios for accessing the Logical Groups page:
• Access from the left pane of the Power Center management console: You
can click
page. This page lists all of the logical groups. You can click a logical group’s
active links to expand the contents.
• Access from the
link on top of the
group’s/device’s content page. This page lists the detailed information of
the content in this group/device.
Group Management → Select a Logical Group
Power Overview
Power Overview
page: You can click the
page to access the specific
Logical Groups 76
to enter this
Manage Group
Page 77

The Logical Groups page lists all logical groups by name in alphabetical order
(A-Z). You can click a logical group’s active link to view more details:
• Group structure information —
Click the icons to view the group structure, including physical group
structure, logical group components, and devices that are directly under
this logical group.
•Group details
—
Click the tabs to view the details.
—
–Events
All events in the logical group, including Critical, Warning
and Informative. For more information on event severity, see "Event
Severity Levels" in the "Event Management" chapter.
–Dashboards
—
Power dashboard, temperature dashboard and power
capacity details (for racks only).
–Power Details
– Temperature Details
– Policies
–Thresholds
—
Power graphic and energy consumption summary.
—
Temperature graphic and details summary.
—
The policies applied on the logical group and their status.
—
Power thresholds and temperature thresholds.
For more information on dashboards, power details, temperature details,
policies, and thresholds, see the "Power Monitoring" and "Temperature
Monitoring" chapters.
Logical Groups 77
Page 78

10
Power Monitoring
Power Center enables the monitoring of current or historical power-related
metrics (for example, power consumption or cost). This can help you
understand the power status in the data center and plan for additional power
infrastructure, cooling, and facility needs.
You can monitor power at different device/group levels, you can configure
power monitoring settings to meet your monitoring needs, and you can also
print the power status graph.
Power Monitoring Level
Power Center provides power monitoring at the following levels:
For physical groups and logical groups:
• Individual device
•Rack
•Aisle
• Room
• Data center
For logical groups only:
• User-defined logical group
Power Monitoring Configuration
You can configure power monitoring settings in Power Center, including:
• Thresholds (Average, maximum power for events)
• Device and group range (Monitor all or not)
• Sampling interval (1, 3, 6 minutes)
• Default units (Watts, or BTU per hour)
• Energy consumption (Power consumption and cost)
Power Monitoring 78
Page 79

Thresholds is useful if you want to be notified when the power of the
group/device exceeds the thresholds. Once the power value exceeds a critical
or warning threshold, the related event is sent.
To configure thresholds:
1
Go to
Power Overview → Select a Physical Group or Device
Logical Group
2
Go to
Thresholds → Power Thresholds
3
Enter values for the following:
, and click the group/device icon.
, and click
Edit
or
Select a
.
• Critical threshold for maximum power:
When the maximum power exceeds the setting, the critical-level event
"Max Power" is sent.
• Critical threshold for average power:
When the average power exceeds the setting, the critical-level event
"Average Power" is sent.
• Warning threshold for maximum power:
When the maximum power exceeds the setting, the warning-level event
"Max Power" is sent.
• Warning threshold for average power:
When the average power exceeds the setting, a warning-level event
"Average Power" is sent.
4
Click
Apply
.
After you configure the thresholds, you will see four lines with different colors
indicating the thresholds in the Power Details tab.
For more information on how to configure device/group range and sampling
interval, see "Monitoring Settings" in the "Configuring Power Center"
chapter.
For more information on how to configure default units and energy
consumption, see "Energy Consumption Settings" in the "Configuring Power
Center" chapter.
Power Monitoring 79
Page 80

Viewing Power Details
Go to Power Overview → Physical (or Logical) Groups, click the
group/device icon, and then open the Power Details tab to view its power
details.
The Power Details page displays different information for PDU and other
devices/groups. Power Center does not provide power details for UPS.
For devices/groups (Excludes PDU and UPS), by default, the Power Details
graph displays the power details for the previous hour.
Power Monitoring 80
Page 81

Yo u c a n a l s o :
View power details
for the current time window
• Click a time window tab to see the current power details.
Table 10-1. Time Window and Interval
Time Window Description Interval
15Min 15 minutes 1 minute
1H 1 hour 3 minutes
1D 1 day 1 hour
1W 1 week 6 hours
1M 1 month 1 day
3M 3 months 1 week
1Y 1 year 2 weeks
NOTE: The table above lists the interval when the sampling interval is at the default
value (1 minute). The sampling interval change will result in the interval change of
15Min and 1H time window. If you change the sampling interval to 3 minutes, the
interval of 15Min time window is 3 minutes. If you change the sampling interval to 6
minutes, the interval of 15Min time window is 3 minutes, and the interval of 1H time
window is 6 minutes. For more information on how to configure the sampling
interval, see "Monitoring Sampling Interval" in the "Configuring Power Center"
chapter.
View power details
for a different time window
• Click the arrow buttons <> to see the details for the previous/next
sampling time, or click the arrow buttons
<<>>
to see the details for the
previous/next page of results for the current time window.
You can click Average, Maximum, or Minimum to display the selected value.
•
Average:
The average value from the previous time point to the current
time point.
•
Maximum:
The maximum value from the previous time point to the
current time point.
•
Minimum:
The minimum value from the previous time point to the
current time point.
Power Monitoring 81
Page 82

For example, when you view power details in the 1H (1 hour) window, the
maximum value at 15:00 shows 500W and the time interval is 6 minutes, this
value represents the maximum power consumption from 14:54 to 15:00 is
500W.
NOTE: It is common to see some instantaneous values exceed the Power Cap
value in the Maximum line. Power Center monitors this value and controls it to
normal power range when this happens. You only need to pay attention when the
Average power value exceeds the Power Cap value.
NOTE: You can set the time interval (period from a time point to the next time point)
in the Settings page. For more information on how to configure the interval, see
"Monitoring Settings" in the "Configuring" chapter.
For racks, you can also click Power Consumption to display PDU power
consumption for all rack PDUs.
You can also click Power Policies to change a power policy.
NOTE: The Power Policies button is only enabled if you have configured a power
policy in the Policies page. For more information on how to configure a power
policy, see the "Power Policies" chapter.
You can view the following power details of the PDU devices. For more
information on supported PDU devices, see "System Requirements" in the
"Overview" chapter.
• PDU device information: Including PDU name, model and IP address.
• PDU outlet information: Including outlet number, power(W), voltage (V),
amps(A), and time of the information recorded, following this format:
<YYYY-MM-DD HH:MM:SS>. The table lists the information for each
outlet and the total power consumption for all outlets.
NOTE: For PDU outlet information, Power Center only supports the Dell Managed
Rack PDU 6605.
Viewing Energy Consumption
The Power Details page provides the following energy consumption
information:
• IT Equipment Energy —
managed devices in the selected device/group.
The total energy consumption and cost for all
Power Monitoring 82
Page 83

NOTE: Power Center can read the power consumption of a device when it is at S0
(On) state. For devices in S4/S5 state, Power Center uses a fixed value (30W) to
calculate the power consumption.
• Cooling Energy —
The estimated energy consumption and cost needed to
cool the selected device/group.
Cooling Energy = IT Equipment Energy * Cooling Multiplier
You can configure the cooling multiplier in the
Consumption
• Energy Consumed (Total)
page.
— The combined energy consumption and
Settings → Energy
costs for the IT equipment and cooling energy. The calculation formula is:
Cost = (IT Equipment Energy T1*Cooling Multiplier) *Flat Rate T1+(IT
Equipment Energy T2*Cooling Multiplier) *Flat Rate T2+°¦+(IT
Equipment Energy Tn*Cooling Multiplier) *Flat Rate Tn
NOTE:
NOTE: By default, the Cost column displays 0. You must configure the cost rate to
T1/T2/.../Tn is the time period (in hours) at a certain flat rate.
see the cost. The rate is a global setting, and can be set on the Settings → Energy
Consumption page.
NOTE: The Energy Consumption section displays information based on the values
configured in the Settings page. This information should be used as an estimate
only.
NOTE: When a device or group is newly added or created in Power Center, the
power and energy consumption data displayed in the "1W" and "1M" time windows
are different if the monitored time is less than 1 week, and the data displayed in the
"1H" and "1D" time windows are different if the monitored time is less than 1 day. This
occurs because Power Center uses different sampling intervals for different time
windows. For example, a device is added into Power Center at 2011-10-15 09:00, and
the current time is 2011-10-17 11:10. For the 1M time window (sampling interval is 1
day), the power and energy consumption is calculated from 2011-09-17 00:00 to
2011-10-17 00:00. For the 1W time window (sampling time is 1 hour), the power and
energy consumption is calculated from 2011-10-10 11:00 to 2011-10-17 11:00. There
is a 11 hour gap therefore the data displayed in the two time windows are not the
same.
Monitoring PDU Power
There are two scenarios for monitoring the PDU power:
Power Monitoring 83
Page 84

• If you view the PDU Dashboard from the
PDU Dashboard
• If you view the PDU Dashboard from the
PDU Dashboard
follows:
– The left and right boxes show the instantaneous power value of the
PDU.
– The page also lists the PDU details read from the device. It displays
NA
when the data is not provided on this PDU device.
displays all PDU information in a table.
displays the specific PDU information in a graph as
Dashboard
Dashboard
page of a group: The
page of a PDU: The
Monitoring UPS Power
There are two scenarios for monitoring the UPS power:
• If you view the UPS Dashboard from the
UPS Dashboard
displays all UPS information in a table.
Dashboard
Power Monitoring 84
page of a group: The
Page 85

• If you view the UPS Dashboard from the
UPS Dashboard
follows:
– The left and right boxes show the temperature of the UPS.
– The page also lists the UPS details read from the device. It displays
NA
when the data is not provided on this UPS device.
displays the specific UPS information in a graph as
Dashboard
page of a UPS: The
Power Dashboard
You can monitor the Power Center overall status in the Dashboards page.
To view the dashboard:
1
Go to
Power Overview → Physical/Logical Groups
2
Click the group/device icon, and click
Dashboards
.
.
Power Monitoring 85
Page 86

The dashboard graph displays:
For devices (Excludes PDU and UPS):
• The left box displays the average power consumption of the latest
sampling interval.
• The right box displays the level of this average power consumption by
comparing it with the power thresholds you set in the
Thresholds
tab:
For groups:
• The left box shows the aggregated power value of the latest sampling
interval for the devices with Monitor power capability in the group.
• The right box displays the level of this aggregated power value compared
with the power thresholds you set in the
NOTE: Aggregated power value is the power value calculated by the power data
aggregation. The calculation formula is case-by-case, and depends on whether the
data aggregation is based on time periods or groups.
Thresholds
tab.
The right box displays different colors indicating different severity levels:
• Red shows the power range that triggers a critical event.
• Orange shows the power range that triggers a warning event.
• Green shows the power range that does not trigger any event.
For more information on how to configure the sampling interval, see
"Monitoring Settings" in the "Configuring Power Center" chapter.
For more information on how to configure the thresholds, see "Power
Monitoring Configuration" in this chapter.
Power Monitoring 86
Page 87

Printing Power Monitoring/Dashboard Graph
Click Print to print the power monitoring, power dashboard graph to a PDF
file or printer.
You must set the Web browser to enable the "Print Background" option and
other printing settings, otherwise the results are printed either without a
background or with incorrect page alignment.
To enable "Print Background" in Mozilla Firefox:
1
Go to
File → Page Setup → Format & Options
2
Check the option
3
Click OK.
To enable "Print Background" in Microsoft Internet Explorer:
1
Go to
File → Page Setup
2
Check the option
3
Click OK.
When you print the graphs in Microsoft Internet Explorer 8, you need to
make sure:
• The Web browser mode is not set as Internet Explorer 7 mode.
• The following options are all selected in
–Portrait
– Print Background Colors and Images
– Enable Shrink-to-Fit
Print Background (colors & images)
.
Print Background Colors and Images
.
.
.
File → Page Setup
:
Power Monitoring 87
Page 88

11
Temperature Monitoring
Power Center enables monitoring of the current or historical temperature of
the data centers in Power Center. It can help you understand the temperature
status and identify hot spots in the data center.
You can monitor the temperature status at different device/group levels, you
can configure the temperature monitoring settings to meet your monitoring
needs, and you can print the temperature status graph.
Temperature Monitoring Level
Power Center provides temperature monitoring at the following levels:
• Device level:
You can monitor temperature-related metrics for devices.
• Physical group level:
You can monitor temperature-related metrics at the physical group level
(data center, room, aisle, chassis modular)
• Logical group level:
You can monitor temperature-related metrics at the logical group level.
Temperature Monitoring Configuration
You can configure temperature monitoring settings in Power Center,
including:
• Thresholds (Inlet temperature range for events)
• Device and group range (Monitor all or not)
• Sampling interval (1, 3, or 6 minutes)
• Default units (Celsius or Fahrenheit)
Thresholds is useful if you want to be notified when the temperature of the
group/device exceeds the thresholds. Once the temperature value exceeds a
critical or warning threshold, the related event is sent.
Temperature Monitoring 88
Page 89

To configure thresholds:
1
Go to
Power Overview → Physical (or Logical) Groups
group/device icon.
2
Go to
Thresholds → Temperature Thresholds
3
Enter values for the following:
• Critical thresholds for average inlet temperature - Greater
temperature is greater than the setting, the critical-level event "Average
Inlet Temperature" is sent.
• Critical thresholds for average inlet temperature - Less
temperature is less than the setting, the critical-level event "Average Inlet
Temperature" is sent.
• Warning thresholds for average inlet temperature - Greater
temperature is greater than the setting, the warning-level event "Average
Inlet Temperature" is sent.
• Warning thresholds for average inlet temperature - Less
temperature is less than the setting, the warning-level event "Average Inlet
Temperature" is sent.
4
Click
Apply
.
After you configured the thresholds, you will see four lines with different
colors indicating the thresholds in the Temperature Details tab.
For more information on how to configure the device/group range and
sampling interval, see "Monitoring Settings" in the "Configuring Power
Center" chapter.
For more information on how to configure the default units and energy
consumption, see "Energy Consumption Settings" in the "Configuring Power
Center" chapter.
, and click
, and click the
Edit
.
—
When the
—
When the
—
When the
—
When the
Viewing Temperature Details
Go to Power Overview → Physical (or Logical) Groups page, and click the
group/device icon, then open the Temperature Details tab to view its
temperature details.
Temperature Details:
Temperature Monitoring 89
Page 90

By default, the Temperature Details graph displays temperature details of the
previous hour. You can also:
• View temperature details of current time window
Click a time window tab to see the current temperature details.
Table 11-1. Time Window and Time Interval
Time Window Description Time Interval
15Min 15 minutes 1 minute
1H 1 hour 3 minutes
1D 1 day 1 hour
1W 1 week 6 hours
Temperature Monitoring 90
Page 91

Table 11-1. Time Window and Time Interval
Time Window Description Time Interval
1M 1 month 1 day
3M 3 months 1 week
1Y 1 year 2 weeks
NOTE: The table above lists the interval when the sampling interval is at the default
value (1 minute). The sampling interval change will result in the interval change of
15Min and 1H time window. If you change the sampling interval to 3 minutes, the
interval of 15Min time window is 3 minutes. If you change the sampling interval to 6
minutes, the interval of 15Min time window is 3 minutes, and the interval of 1H time
window is 6 minutes. For more information on how to configure the sampling
interval, see "Monitoring Sampling Interval" in the "Configuring Power Center"
chapter.
• View temperature details of a different time window
Click the arrow buttons <> to see the details of previous/next sampling
time, or click the arrow buttons
<<>>
to see the details of previous/next
page of results for the current time window.
You can click Average, Maximum, and Minimum to display the selected
value.
•
Average:
The average value from the previous time point to the current
time point.
•
Maximum:
The maximum value from the previous time point to the
current time point.
•
Minimum:
The minimum value from the previous time point to the
current time point.
For example, when you view temperature details in the 1H (1 hour) window, the
maximum value at 15:00 shows 40°C and the time interval is 6 minutes, this
value represents that the maximum temperature from 14:54 to 15:00 is 40°C.
Chassis Details:
The Chassis Details table appears when you access the Temperature Details
page on a chassis. Chassis Details lists all blade servers within the chassis and
their temperature details in a table, including:
•
Device:
Device name.
Temperature Monitoring 91
Page 92

•
Average:
•
Maximum:
•
Minimum:
NOTE: You can set the time interval (the period from a time point to the next time
point) in the Settings page. For more information on how to configure the interval,
see "Monitoring Settings" in the "Configuring" chapter.
NOTE: The Average, Maximum or Minimum field displays NA if no data is available.
For example, when the blade server is an Unsupported device.
The average value of the latest sampling interval.
The maximum value of the latest sampling interval.
The minimum value of the latest sampling interval.
Monitoring Temperature of Chassis/Blade Server
You can monitor the inlet temperature at the blade server level.
You can also monitor the inlet temperature, at the chassis level, including
average, maximum, and minimum details.
Monitoring Temperature of Devices/Groups
Power Center supports temperature monitoring of the inlet temperature span
for devices and groups. The inlet temperature span is the average inlet
temperature differential between the maximum and minimum temperature
reading for a device in a group (Celsius or Fahrenheit). You can calculate this
value according to the maximum and minimum temperature from the
Temperature Details graph.
Temperature Dashboard
The Dashboards page displays Power Center’s overall status.
To view the dashboard:
1
Go to
Power Overview → Physical/Logical Groups
2
Click the group/device icon, and click
Dashboards
Temperature Monitoring 92
.
.
Page 93

The dashboard graph displays:
For devices (Excludes PDU and UPS):
• The left box displays the average temperature status of the latest sampling
interval.
• The right box displays the level of this average temperature status by
comparing it with the temperature thresholds you set in the
Thresholds
tab:
For groups:
• The left box shows the aggregated temperature value of the latest
sampling interval for the devices with Monitor power capability in the
group.
• The right box displays the level of this aggregated temperature value by
comparing it with the temperature thresholds you set in the
Thresholds
tab.
NOTE: Aggregated temperature value is the temperature value calculated by the
temperature data aggregation. The calculation formula is case-by-case, and
depends on whether the data aggregation is based on time periods or groups.
The right box displays different colors indicating different severity levels:
• Red color shows the temperature range that triggers a critical event.
• Orange color shows the temperature range that triggers a warning event.
• Green color shows the temperature range that does not trigger any event.
For more information on how to configure the sampling interval, see
"Monitoring Settings" in the "Configuring Power Center" chapter.
Temperature Monitoring 93
Page 94

For more information on how to configure the thresholds, see "Temperature
Monitoring Configuration" in the "Temperature Monitoring" chapter.
Printing Temperature Monitoring/Dashboard Graph
Click Print to print the temperature monitoring, and temperature dashboard
graph to a PDF file or printer.
You must set the Web browser to enable the "Print Background" option and
other printing settings, otherwise the results are printed either without a
background or with incorrect page alignment.
For how to enable the "Print Background" option and other print settings, see
"Printing Power Monitoring/Dashboard Graph" in the "Power Monitoring"
chapter.
Temperature Monitoring 94
Page 95

12
Power Policies
A power policy is a set of configurations used to manage the power cap for
devices or groups. A policy is useful for defining power management in
different situations, for example:
• You can set up a policy to make sure that the power consumption does not
exceed the capacity of the circuit.
• You can set up a policy with a scheduled time according to the workload of
the device/group; for example, you can set an aggressive cap when the
workload is low, enabling a reduction of power use for your data center.
• You can set up a policy to increase the rack density. For example, you
currently have ten devices in rack A_01 that is monitored by Power Center.
By monitoring the power consumption from the
can estimate how many devices you can add to rack A_01. You can set up a
policy to cap the total power consumption of rack A_01 after you added
the devices.
Power Center supports two policy types:
• Static power policy — The power cap for each device is defined by you,
and will not be changed unless you redefine it. A static power policy
enables you to set a power cap for each device in the group. You can create
a static power policy for a rack, chassis or device.
•Dynamic power policy
allocated by Power Center when necessary, based on the power
consumption information and other power information on each device.
Power Center evaluates power consumption for each device in every
monitoring cycle to decide the necessity of changing the power cap for
each device. A dynamic power policy enables you to allocate the power
dynamically for each device in the group while maintaining the power cap
for the group. A dynamic power policy has less performance impact to a
device/group compared with a static power policy. You can create a
dynamic power policy for a logical group, data center, room, aisle, rack, or
chassis.
—
The power cap for each device is dynamically
Power Details
page, you
Power Policies 95
Page 96

How Does a Dynamic Power Policy Work?
To understand how a dynamic policy works, you need to understand the
following terms first:
• Consumption — The power a device is using.
•Power Cap
consume (may not be equal to its demand).
• Headroom
of a device or a group of devices under a power policy.
•Demand
workload.
The top priority of the dynamic power policy is to maintain the power cap of
the group. Maintaining this cap means that all devices can execute their
workloads without needing more power than the cap. The priority of the
device may not be taken into account when allocating power cap to a group of
devices if most, or the entire power cap is allocated towards maintaining the
power cap on each of the devices in the policy; if lower priority devices require
more power to maintain their cap, they may actually receive more power than
a higher-priority device. If the power cap is too restrictive and the group
power consumption exceeds the power cap, an event is sent for the power
policy. You need to reconsider the power allocation or adjust workloads when
a power policy is consistently violated by one or more devices exceeding their
power cap.
If fluctuations in device power requirements happen once the power cap is
successfully established for all devices in a power policy, a device requiring
more power may not get it as the power cap of another device in the policy
could become violated as it is lowered. If you wish to force one or more
devices in a policy to a lower cap, you can create a static power policy for the
device at a lower level. In this case, the most restrictive power cap of the
overlapping policies is applied to the device.
If there is excess available power from the power cap (known as headroom)
after the power capping requirements is met for all devices in the policy, then
this excess power can be allocated dynamically according to the priority and
demand of the device in the power policy.
—
The maximum amount of power that a device is allowed to
—
The difference between power cap and power consumption
—
Amount of power a device requests to accommodate its
Power Policies 96
Page 97

If the average power consumption of a device becomes lower than the power
cap established for the device, its power cap is evaluated and adjusted in each
monitoring cycle, and the excess power is deemed as headroom for other
devices to consume.
Power Policy Capabilities
Power Center defines the following statuses of power policy capabilities for
the devices:
• Unknown — Shown for unsupported devices or devices that were never
connected to Power Center.
•None
•Monitor
• Monitor & Capping
• Monitor and Upgradable
You can find this power policy capability status in the Power Capability
column of the Device List page.
For servers that comply with Dell iDRAC7, when there is a power policy
capability change due to a license change, Power Center will change its
information in the management console within 24 hours. There are two
scenarios:
Scenario 1. The license expires or is not imported
In this case, the following happens:
• If a policy exists on the devices, you will receive a "Server Capabilities
• The
• The power capability status of the devices is set to "None" in the
• You cannot edit the policy of this device from the
—
No power policy capability. You cannot set any policy on the
device.
—
With power monitoring capability only.
—
With power monitoring and capping capabilities.
—
With power monitoring capability, and can be
upgraded to have power capping capability.
Changed" event.
Policy
tab of the devices is set to disabled in the
page.
List
page.
can delete it.
Power Overview
Policies
page; you only
Device
Power Policies 97
Page 98

Scenario 2. You try to import a license on a device without a license
imported
In this case, the following happens:
• If a policy exists on the devices, you will receive a "Server Capabilities
Changed" event.
• The
• The power capability status of the devices is changed in the
• The policy of the devices is editable. You can access it from the
page.
page.
page.
Policy
tab of the devices is set to
Enabled
in the
Power Overview
Device List
Policies
Upgrading Device Power Policy Capability
The power policy capability of some devices can be upgraded to include
capping of power consumption, for example, Dell PowerEdge M620. These
devices show Monitor and Upgradable. To upgrade the device so that its
power consumption can be capped, go to the Device List page and click
Upgrade next to the device, then follow the instructions on the pop-up help
page to upgrade the device power capability. Once the upgrade is completed,
the power capability status changes to Monitor & Capping within 24 hours.
Creating a Policy
You can create static or dynamic policies for your device/group.
You can create static power policies for a rack, chassis or device, and create
dynamic power policies for any group/device. Power policies only apply to the
groups/devices that have Monitor & Capping power capability.
You can create multiple policies on the same device/group. This is useful
when you want to apply different policies at different time periods for the
same device/group.
To create a new policy:
1
Go to
Power Overview → Physical/Logical Groups
2
Click the rack/chassis/device icon, and go to the
3
Click
Create New Policy
.
page.
Policies
tab.
Power Policies 98
Page 99

4
The
Create New Policy
window opens, set a power cap using the following
steps:
a
Enter a policy name, maximum length of no more than 25 English
characters.
b
Select
Static
or
Dynamic
from the P
olicy Type
drop-down list. This
step is available only when you create a policy on a rack/chassis.
c
Select a fixed time period to show
Power
values to estimate a Power Cap value. The
Maximum Power
,
Lower Bound
Average Power
and
Upper Bound
and
Maximum
Average Power,
values only refer to
the devices that have Monitor & Capping power capability.
d
Enter
Power Cap Value
or
Percentage of Capability
for the
group/device:
•
Power cap value:
Bound
. The Lower Bound is the lowest minimum power consumption
Enter a value between the
Lower Bound
and
since the device/group was either discovered/added. The Upper Bound
is the maximum power consumption when the device/group is in a
maximum workload state. You cannot enter a power cap value lower
than the Lower Bound value. This value is the total power
consumption budget for devices that have Monitor & Capping power
capability.
•
Percentage of capability:
Enter a percentage (1%-100%) of the Upper
Bound value to set the power cap.
The "Power Cap Value" and "Percentage of Capability" are related values.
The following formula describes the relationship between the two values:
Upper
Upper Bound * Percentage of Capability= Power Cap Value
e
Click
Next
.
NOTE: The default power cap unit is Watts. You can change this to a different unit.
For more information on how to change the default unit, see "Default Units Settings"
in the "Configuring Power Center" chapter.
5
Allocate power for the group/device:
• For a dynamic policy, the priority (High, Medium, and Low) for the
individual devices in the group can be changed as needed. After selecting
the priority, click
Next
.
Power Policies 99
Page 100

NOTE: All devices are displayed on this page, but you only can configure priority
for the devices that have Monitor & Capping power capability.
NOTE: You can set priority levels based on the service level agreements
associated with workloads running on different devices/groups. P
reserves more of the power for the devices/groups with a higher priority when the
power cap is not completely utilized.
ower Center
• For a static policy, Power Center uses the same percentage of the Upper
Bound value as the power cap for each device by default. You can enter a
different value (Power Cap Value or Percentage of Capability), and click
Next
.
NOTE:
6
•Time Stamp
If the sum of the entered device power cap is higher than the power cap value
set in the previous step, Power Center will change the Power Cap Value and display a
message prompt.
Enter a policy schedule that includes:
—
Time of the day.
–Always
–Range
—
The policy is in effect all the time.
—
Enter the start time and end time of the day for the policy to
take effect. You can enter any time between 00:00 and 23:59.
have entered a start time that is later than the end time, for example,
23:00
-
07:00, the effective timespan will be 23:00 of the current day
to 07:00 of the next day.
• Recurrence Pattern
–Always
—
– Day of the week
—
Day of the week.
The policy is in effect from Monday to Sunday.
—
Select the days of the week for the policy to take
effect.
• Recurrence Range
–Always
–Range
After you have defined the schedule, click
7
Review the policy summary information, and click
—Start and end dates.
—
The policy is in effect all year round.
— Enter the start and end dates for the policy to take effect.
Next
.
Apply
. The new policy
is created and takes effect immediately.
If you
NOTE: The existing power cap value set in the policies (including EPR) still remain
effective on the devices even if Power Center is corrupted; this impacts the
performance of the devices with policies applied. You must back up Power Center
Power Policies 100
 Loading...