

Page 1
1
®
VCA2612
FEATURES
● LOW NOISE PREAMP:
• Low Input Noise: 1.25nV/√Hz
• Active Termination Noise Reduction
• Switchable Termination Value
• 80MHz Bandwidth
• 5dB to 25dB Gain
• Differential Input/Output
● LOW NOISE VARIABLE GAIN AMPLIFIER:
• Low Noise VCA: 3.3nV/√Hz, Differential
Programming Optimizes Noise Figure
• 24dB to 45dB Gain
• 40MHz Bandwidth
• Differential Input/Output
● LOW CROSSTALK:
52dB at Max Gain, 5MHz
● HIGH-SPEED VARIABLE GAIN ADJUST
● SWITCHABLE EXTERNAL PROCESSING
APPLICATIONS
● ULTRASOUND SYSTEMS
● WIRELESS RECEIVERS
● TEST EQUIPMENT
VCA2612
®
International Airport Industrial Park • Mailing Address: PO Box 11400, Tucson, AZ 85734 • Street Address: 6730 S. Tucson Blvd., Tucson, AZ 85706 • Tel: (520) 746-1111
Twx: 910-952-1111 • Internet: http://www.burr-brown.com/ • Cable: BBRCORP • Telex: 066-6491 • FAX: (520) 889-1510 • Immediate Product Info: (800) 548-6132
© 2000 Burr-Brown Corporation PDS-1541B Printed in U.S.A. March, 2000
TM
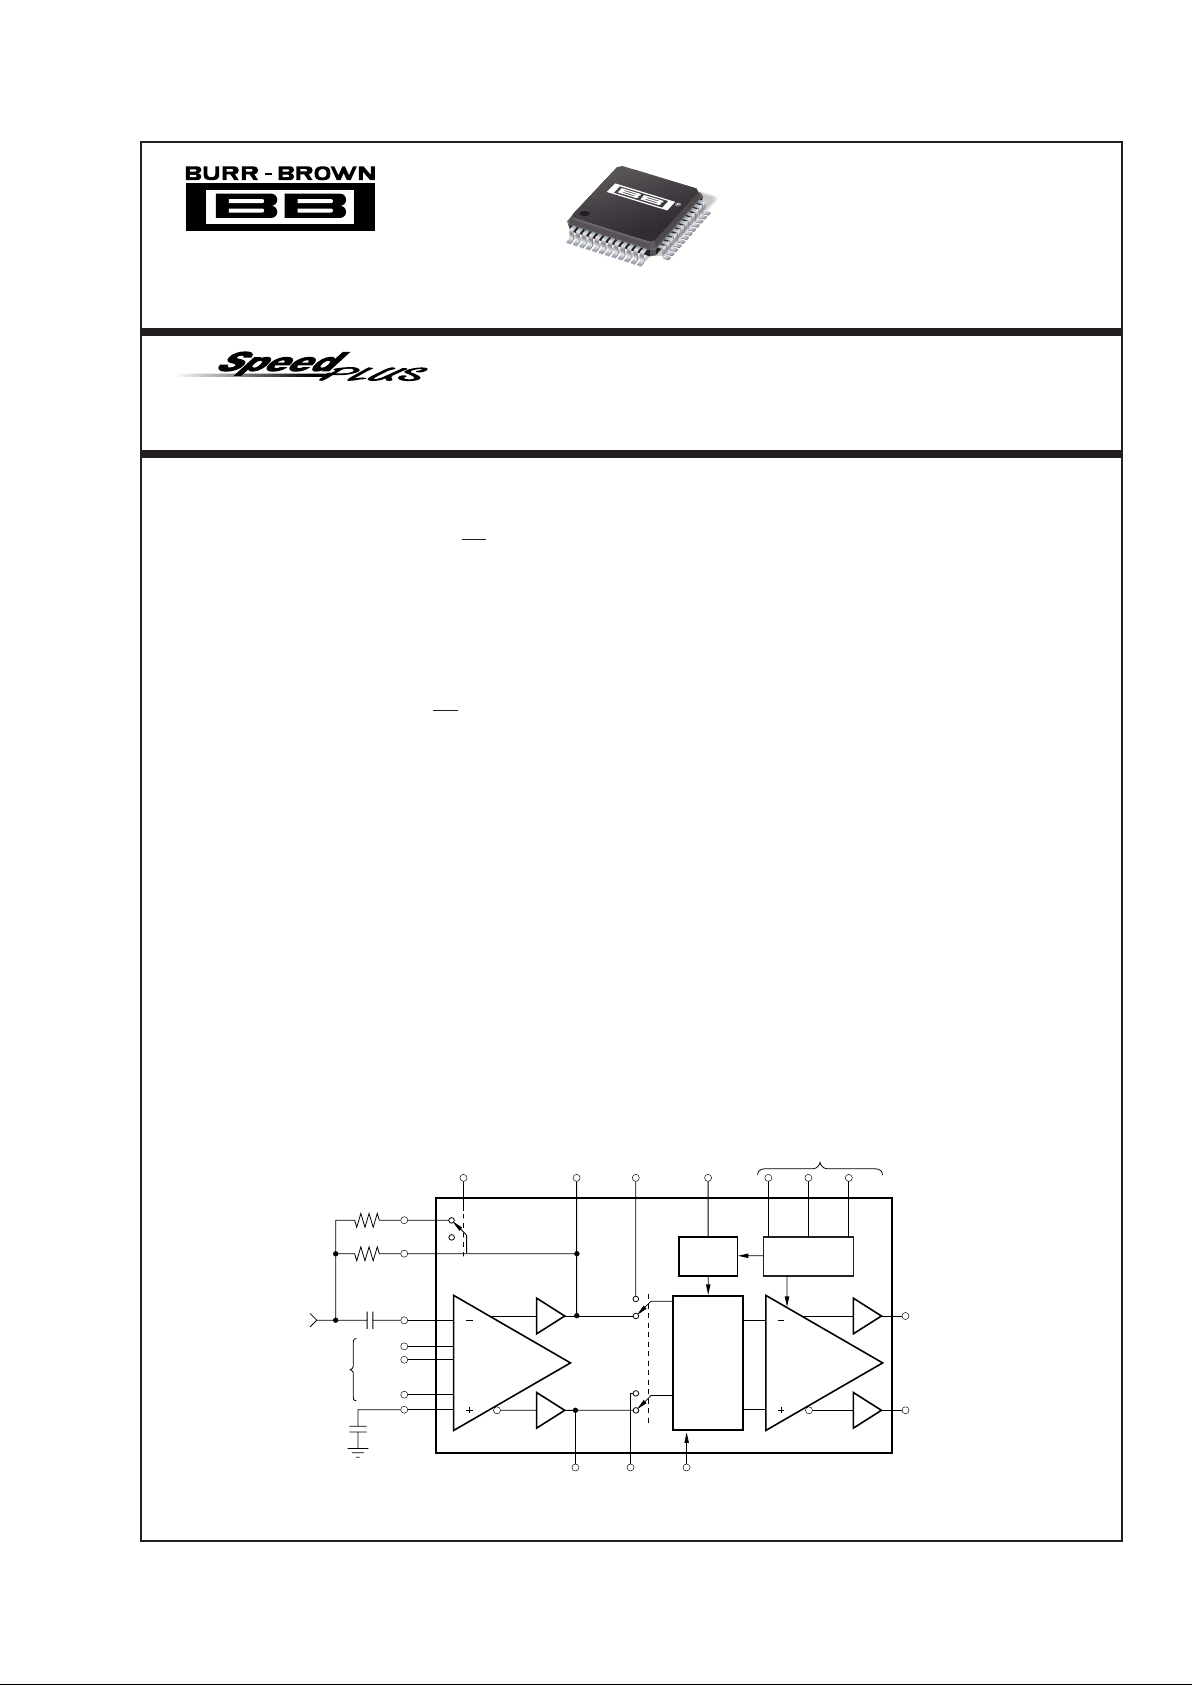
Dual, VARIABLE GAIN AMPLIFIER
with Low Noise Preamp
VCA2612
For most current data sheet and other product
information, visit www.burr-brown.com
Low Noise
Preamp
5dB to 25dB
Programmable
Gain Amplifier
24 to 45dB
Voltage
Controlled
Attenuator
Analog
Control
Maximum Gain
Select
RF
2
RF
1
FB
FBSW
LNP
IN
P
LNP
IN
N
LNP
GS1
LNP
GS2
LNP
GS3
LNP
Gain Set
Input
LNP
OUT
P
SEL
VCAINP
LNP
OUT
N VCAINN VCA
CNTL
FB
CNTL
VCA
OUT
P
VCA
OUT
N
MGS
1
MGS2MGS
3
Maximum Gain Select
VCA2612
(1 of 2 Channels)
DESCRIPTION
The VCA2612 is a highly integrated, dual receive channel, signal processing subsystem. Each channel of the
product consists of a low noise pre-amplifier (LNP) and
a Variable Gain Amplifier (VGA). The LNP circuit
provides the necessary connections to implement Active
Termination (AT), a method of cable termination which
results in up to 4.6dB noise figure improvement. Different cable termination characteristics can be accommodated by utilizing the VCA2612’s switchable LNA feedback pins. The LNP has the ability to accept both
differential and single ended inputs, and generates a
differential output signal. The LNP provides strappable
gains of 5dB, 17dB, 22dB and 25dB.
The output of the LNP can be accessed externally for
further signal processing, or fed directly into the VGA.
The VCA2612’s VGA section consists of two parts, the
Voltage Controlled Attenuator (VCA) and the Programmable Gain Amplifier (PGA). The gain and gain range
of the Programmable Gain Amplifier can be digitally
programmed. The combination of these two programmable elements results in a variable gain ranging from
0dB up to a maximum gain as defined by the user
through external connections. The output of the VGA
can be used in either a single-ended or differential mode
to drive high performance analog-to-digital converters.
The VCA2612 also features low crosstalk and outstanding distortion performance. The combination of low
noise, and gain range programmability make the
VCA2612 a versatile building block in a number of
applications where noise performance is critical. The
VCA2612 is available in a TQFP-48 package.
Page 2
2
®
VCA2612
The information provided herein is believed to be reliable; however, BURR-BROWN assumes no responsibility for inaccuracies or omissions. BURR-BROWN assumes
no responsibility for the use of this information, and all use of such information shall be entirely at the user’s own risk. Prices and specifications are subject to change
without notice. No patent rights or licenses to any of the circuits described herein are implied or granted to any third party. BURR-BROWN does not authorize or warrant
any BURR-BROWN product for use in life support devices and/or systems.
SPECIFICATIONS
At TA = +25°C, V
DD
= 5V, load resistance = 500Ω on each output to ground, MGS = 011, LNP = 22dB and fIN = 5MHz, unless otherwise noted. The input to the
preamp (LNP) is single-ended, and the output from the VCA is single-ended unless otherwise noted.
VCA2612Y
PARAMETER CONDITIONS MIN TYP MAX UNITS
PREAMPLIFIER
Input Resistance 600 kΩ
Input Capacitance 15 pF
Input Bias Current 1nA
CMRR f = 1MHz, VCA
CNTL
= 0.2V 50 dB
Maximum Input Voltage Preamp Gain = +5dB 1 Vp-p
Preamp Gain = +25dB 112 mVp-p
Input Voltage Noise
(1)
Preamp Gain = +5dB 3.5 nV/√Hz
Preamp Gain = +25dB 1.25 nV/√Hz
Input Current Noise Independent of Gain 350 fA/√Hz
Noise Figure, R
S
= 75Ω, RIN = 75Ω
(1)
RF = 550Ω, PreAmp Gain = 22dB, 6.2 dB
PGA Gain = 39dB
Bandwidth Gain = 22dB 80 MHz
PROGRAMMABLE VARIABLE GAIN AMPLIFIER
Peak Input Voltage Differential 2 Vp-p
–3dB Bandwidth 40 MHz
Slew Rate 300 V/µs
Output Signal Range R
L
≥ 500Ω Each Side to Ground 2.5 ±1V
Output Impedance f = 5MHz 1 Ω
Output Short-Circuit Current ±40 mA
Third Harmonic Distortion f = 5MHz, V
OUT
= 1Vp-p, VCA
CNTL
= 3.0V –45 –71 dBc
Second Harmonic Distortion f = 5MHz, V
OUT
= 1Vp-p, VCA
CNTL
= 3.0V –45 –63 dBc
IMD, Two-Tone V
OUT
= 2Vp-p, f = 1MHz –80 dBc
V
OUT
= 2Vp-p, f = 10MHz –80 dBc
1dB Compression Point f = 5MHz, Output Referred, Differential 6 Vp-p
Crosstalk
V
OUT
= 1Vp-p, f = 1MHz, Max Gain Both Channels
68 dB
Group Delay Variation 1MHz < f < 10MHz, Full Gain Range ±2ns
ACCURACY
Gain Slope 10.9 dB/V
Gain Error ±1
(2)
dB
Output Offset Voltage ±50 mV
GAIN CONTROL INTERFACE
Input Voltage (VCA
CNTL
) Range 0 to 3.0 V
Input Resistance 1MΩ
Response Time 45dB Gain Change, MGS = 111 0.2 µs
POWER SUPPLY
Specified Operating Range 4.75 5.0 5.25 V
Power Dissipation Operating, Both Channels 410 475 mW
NOTE: (1) For preamp driving VGA. (2) Referenced to best fit dB-linear curve.
Page 3

3
®
VCA2612
ELECTROSTATIC
DISCHARGE SENSITIVITY
This integrated circuit can be damaged by ESD. Burr-Brown
recommends that all integrated circuits be handled with
appropriate precautions. Failure to observe proper handling
and installation procedures can cause damage.
ESD damage can range from subtle performance degradation to complete device failure. Precision integrated circuits
may be more susceptible to damage because very small
parametric changes could cause the device not to meet its
published specifications.
ABSOLUTE MAXIMUM RATINGS
Power Supply (+VS) ............................................................................. +6V
Analog Input ............................................................. –0.3V to (+V
S
+ 0.3V)
Logic Input ............................................................... –0.3V to (+V
S
+ 0.3V)
Case Temperature ......................................................................... +100°C
Junction Temperature .................................................................... +150°C
Storage Temperature...................................................... –40°C to +150°C
PACKAGE SPECIFIED
DRAWING TEMPERATURE PACKAGE ORDERING TRANSPORT
PRODUCT PACKAGE NUMBER RANGE MARKING NUMBER
(1)
MEDIA
VCA2612Y TQFP-48 Surface Mount 355 –40°C to +85°C A12 VCA2612Y/250 Tape and Reel
"""""VCA2612Y/2K "
NOTE: (1) Models with a slash (/) are available only in Tape and Reel in the quantities indicated (e.g., /2K indicates 2000 devices per reel). Ordering 2000 pieces
of “VCA2612Y/2K” will get a single 2000-piece Tape and Reel.
PACKAGE/ORDERING INFORMATION
Page 4
4
®
VCA2612
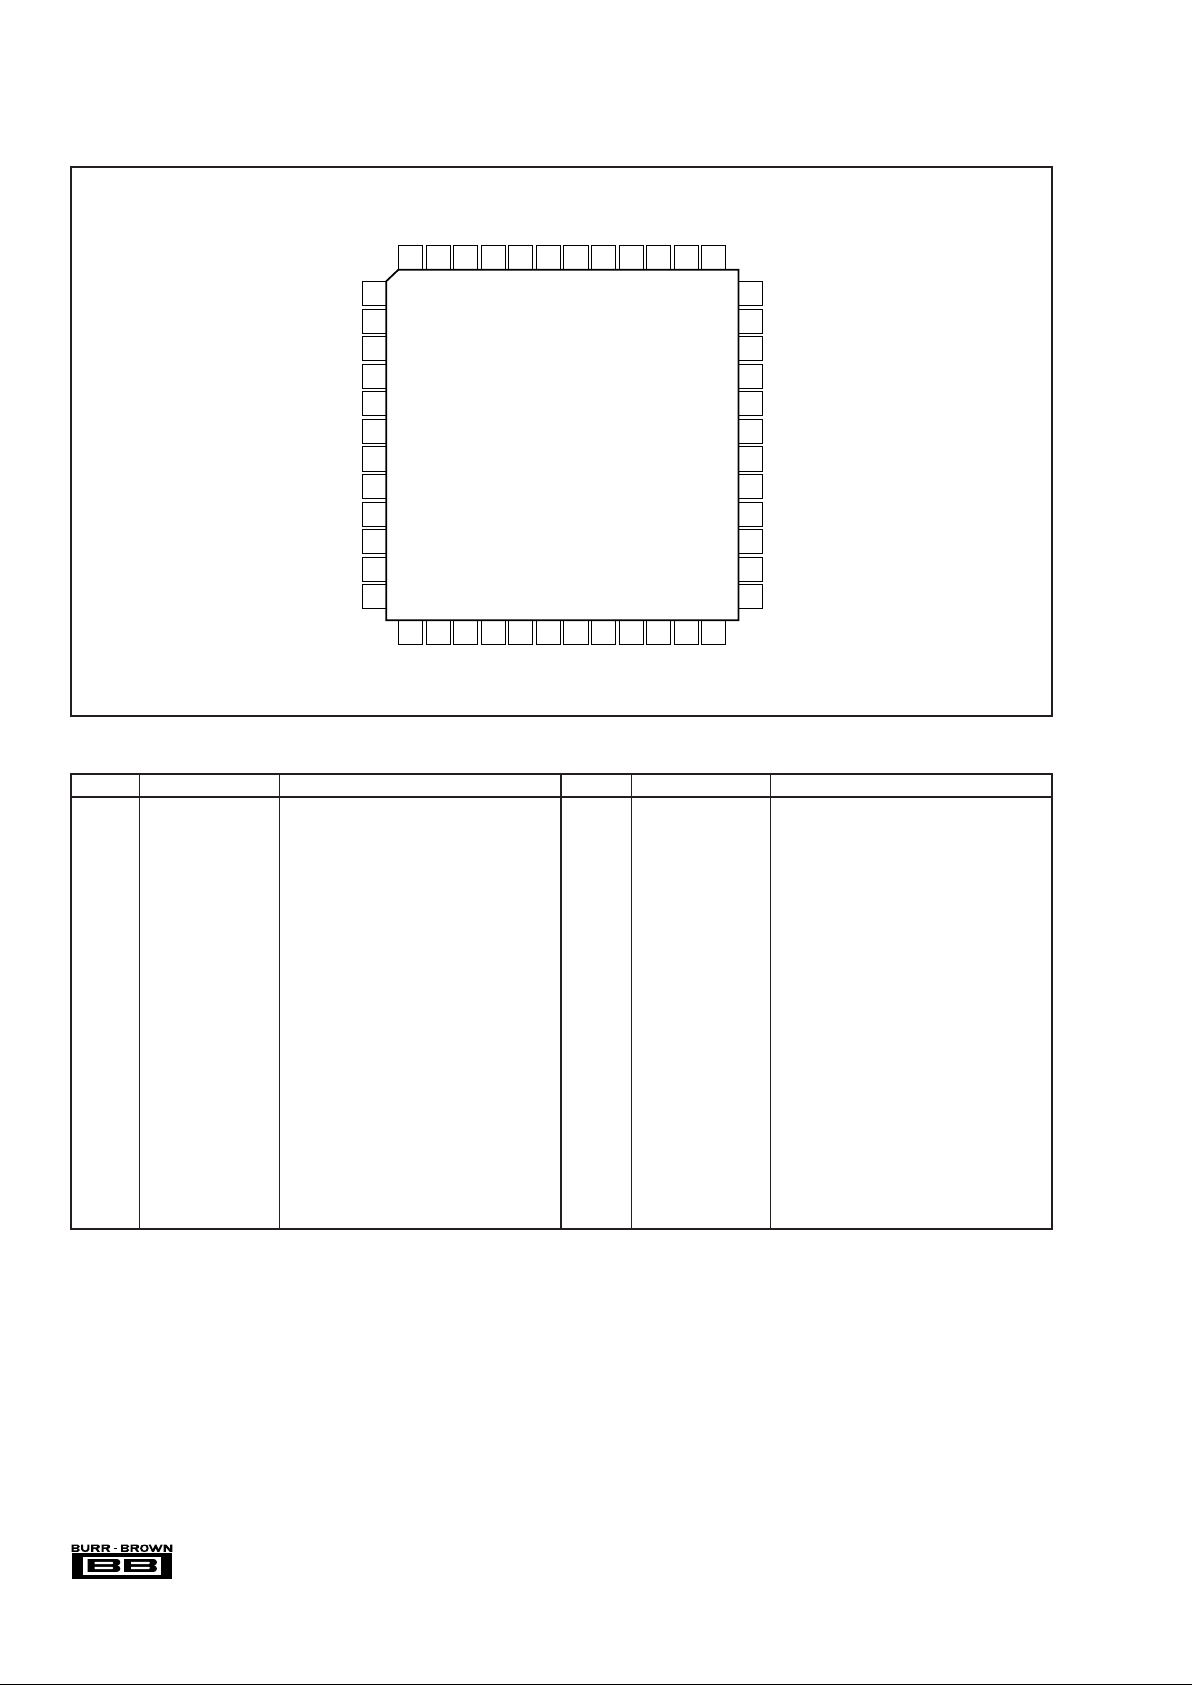
PIN CONFIGURATION
1V
DD
A Channel A +Supply
2 NC Do Not Connect
3 NC Do Not Connect
4 VCA
IN
NA Channel A VCA Negative Input
5 VCA
IN
PA Channel A VCA Positive Input
6 LNP
OUT
NA Channel A LNP Negative Output
7 LNP
OUT
PA Channel A LNP Positive Output
8 SWFBA Channel A Switched Feedback Output
9 FBA Channel A Feedback Output
10 COMP1A Channel A Frequency Compensation 1
11 COMP2A Channel A Frequency Compensation 2
12 LNP
IN
NA Channel A LNP Inverting Input
13 LNP
GS3
A Channel A LNP Gain Strap 3
14 LNP
GS2
A Channel A LNP Gain Strap 2
15 LNP
GS1
A Channel A LNP Gain Strap 1
16 LNP
IN
PA Channel A LNP Noninverting Input
17 V
DD
R +Supply for Internal Reference
18 V
BIAS
0.01µF Bypass to Ground
19 V
CM
0.01µF Bypass to Ground
20 GNDR Ground for Internal Reference
21 LNP
IN
PB Channel B LNP Noninverting Input
22 LNP
GS1
B Channel B LNP Gain Strap 1
23 LNP
GS2
B Channel B LNP Gain Strap 2
24 LNP
GS3
B Channel B LNP Gain Strap 3
25 LNP
IN
NB Channel B LNP Inverting Input
26 COMP2B Channel B Frequency Compensation 2
27 COMP1B Channel B Frequency Compensation 1
28 FBB Channel B Feedback Output
29 SWFBB Channel B Switched Feedback Output
30 LNP
OUT
PB Channel B LNP Positive Output
31 LNP
OUT
NB Channel B LNP Negative Output
32 VCA
IN
PB Channel B VCA Positive Input
33 VCA
IN
NB Channel B VCA Negative Input
34 NC Do Not Connect
35 NC Do Not Connect
36 V
DD
B Channel B +Analog Supply
37 GNDB Channel B Analog Ground
38 VCA
OUT
NB Channel B VCA Negative Output
39 VCA
OUT
PB Channel B VCA Positive Output
40 MGS
3
Maximum Gain Select 3 (LSB)
41 MGS
2
Maximum Gain Select 2
42 MGS
1
Maximum Gain Select 1 (MSB)
43 VCA
CNTL
VCA Control Voltage
44 VCA
IN
SEL VCA Input Select, HI = External
45 FBSW
CNTL
Feedback Switch Control: HI = ON,
46 VCA
OUT
PA Channel A VCA Positive Output
47 VCA
OUT
NA Channel A VCA Negative Output
48 GNDA Channel A Analog Ground
PIN
DESIGNATOR
DESCRIPTION PIN
DESIGNATOR
DESCRIPTION
PIN DESCRIPTIONS
36
35
34
33
32
31
30
29
28
27
26
25
VDDB
NC
NC
VCA
IN
NB
VCA
IN
PB
LNP
OUT
NB
LNP
OUT
PB
SWFBB
FBB
COMP1B
COMP2B
LNP
IN
NB
GNDA
VCA
OUT
NA
VCA
OUT
PA
FBSW
CNTL
VCA
IN
SEL
VCA
CNTL
MGS1MGS2MGS3VCA
OUT
PB
VCA
OUT
NB
GNDB
LNP
GS3
A
LNP
GS2
A
LNP
GS1
A
LNP
IN
PA
V
DD
R
V
BIAS
V
CM
GNDR
LNP
IN
PB
LNP
GS1
B
LNP
GS2
B
LNP
GS3
B
1
2
3
4
5
6
7
8
9
10
11
12
VDDA
NC
NC
VCA
IN
NA
VCA
IN
PA
LNP
OUT
NA
LNP
OUT
PA
SWFBA
FBA
COMP1A
COMP2A
LNP
IN
NA
48 47 46 45 44 43 42
41 40 39 38
13 14 15 16 17 18 19 20 21 22 233724
VCA2612
Page 5
5
®
VCA2612
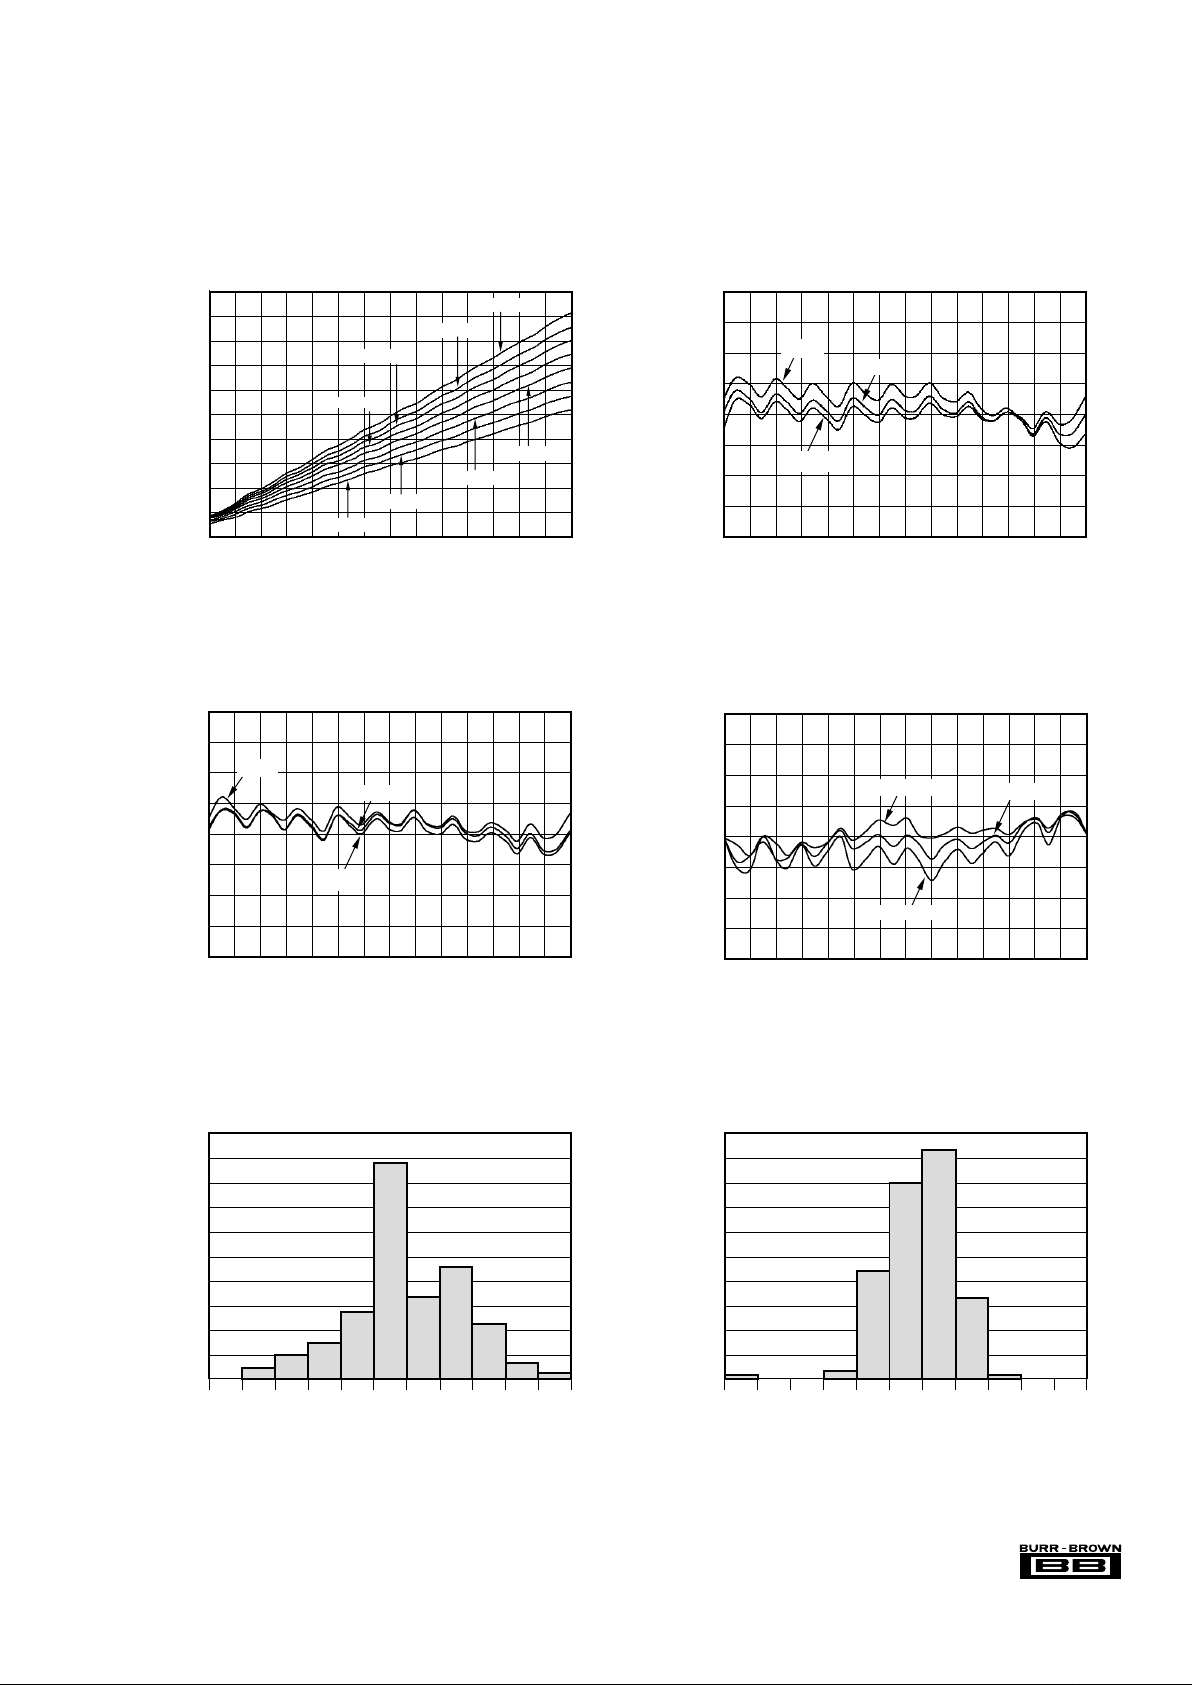
TYPICAL PERFORMANCE CURVES
At TA = +25°C, V
DD
= 5V, load resistance = 500Ω on each output to ground, MGS = 011, LNP = 22dB and fIN = 5MHz, unless otherwise noted. The input to the
preamp (LNP) is single-ended, and the output from the VCA is single-ended unless otherwise noted.
GAIN vs VCA
CNTL
VCA
CNTL
(V)
0.2 1.21.00.4 0.6 0.8 1.8 2.0 2.21.61.4 2.4 2.6 2.8 3.0
Gain (dB)
65
60
55
50
45
40
35
30
25
20
15
MGS = 111
MGS = 110
MGS = 101
MGS = 100
MGS = 011
MGS = 010
MGS = 001
MGS = 000
GAIN ERROR vs TEMPERATURE
VCA
CNTL
(V)
0.2 1.0 1.20.80.4 0.6 2.0 2.21.4 1.6 1.8 2.4 2.6 2.8 3.0
Gain Error (dB)
2.0
1.5
1.0
0.5
0
–0.5
–1.0
–1.5
–2.0
+25°C
–40°C
+85°C
GAIN ERROR vs VCA
CNTL
VCA
CNTL
(V)
0.2 1.0 1.20.80.4 0.6 2.0 2.21.4 1.6 1.8 2.4 2.6 2.8 3.0
Gain Error (dB)
2.0
1.5
1.0
0.5
0
–0.5
–1.0
–1.5
–2.0
10MHz
1MHz
5MHz
GAIN ERROR vs VCA
CNTL
VCA
CNTL
(V)
0.2 1.0 1.20.80.4 0.6 2.0 2.21.4 1.6 1.8 2.4 2.6 2.8 3.0
Gain Error (dB)
2.0
1.5
1.0
0.5
0
–0.5
–1.0
–1.5
–2.0
MGS = 011
MGS = 000
MGS = 111
GAIN MATCH: CHA to CHB = 0.2V
Delta Gain (dB)
–0.5 –0.4 –0.3 –0.2 –0.1 0.0 0.1 0.2 0.3 0.4 0.5
Units
100
90
80
70
60
50
40
30
20
10
0
GAIN MATCH: CHA to CHB = 3.0V
Delta Gain (dB)
–0.5 –0.4 –0.3 –0.2 –0.1 0.0 0.1 0.2 0.3 0.4 0.5
Units
100
90
80
70
60
50
40
30
20
10
0
Page 6
6
®
VCA2612
TYPICAL PERFORMANCE CURVES (Cont.)
At TA = +25°C, V
DD
= 5V, load resistance = 500Ω on each output to ground, MGS = 011, LNP = 22dB and fIN = 5MHz, unless otherwise noted. The input to the
preamp (LNP) is single-ended, and the output from the VCA is single-ended unless otherwise noted.
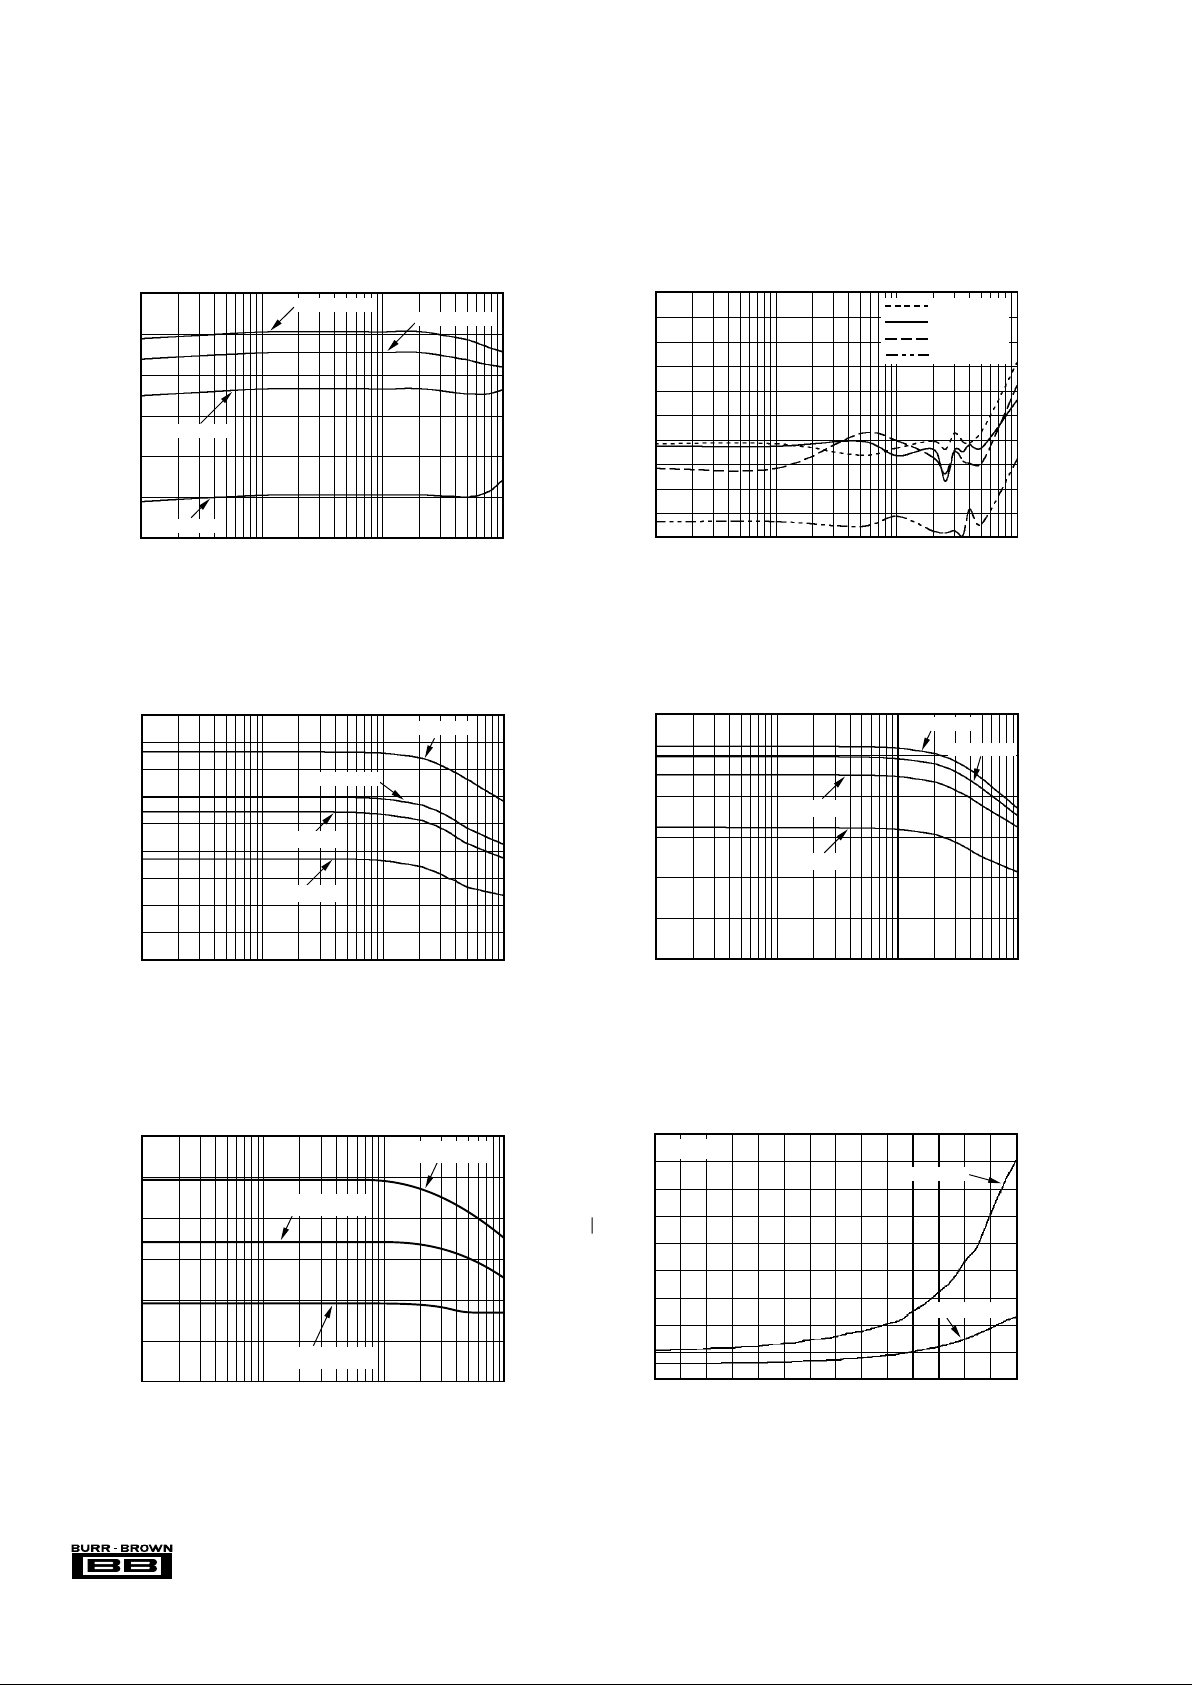
GAIN vs FREQUENCY
(Pre-Amp)
Frequency (MHz)
0.1 1 10 100
Gain (dB)
30
25
20
15
10
5
0
LNP = 25dB
LNP = 22dB
LNP = 17dB
LNP = 5dB
GAIN vs FREQUENCY
(VCA and PGA, VCA
CNTL
= 0.2V)
Frequency (MHz)
0.1 1 10 100
Gain (dB)
5.0
4.0
3.0
2.0
1.0
0.0
–1.0
–2.0
–3.0
–4.0
–5.0
MGS = 111
MGS = 100
MGS = 011
MGS = 000
GAIN vs FREQUENCY
(VCA and PGA, VCA
CNTL
= 3.0V)
Frequency (MHz)
0.1 1 10 100
Gain (dB)
45
40
35
30
25
20
15
10
5
0
MGS = 111
MGS = 100
MGS = 011
MGS = 000
GAIN vs FREQUENCY
(VCA
CNTL
= 3.0V)
Frequency (MHz)
0.1 1 10 100
Gain (dB)
60
50
40
30
20
10
0
LNP = 25dB
LNP = 22dB
LNP = 5dB
LNP = 17dB
GAIN vs FREQUENCY
(LNP = 22dB)
Frequency (MHz)
0.1 1 10 100
Gain (dB)
60
50
40
30
20
10
0
VCA
CNTL
= 3.0V
VCA
CNTL
= 1.6V
VCA
CNTL
= 0.2V
OUTPUT REFERRED NOISE vs VCA
CNTL
VCA
CNTL
(V)
0 1.0 1.20.4 0.6 0.8 1.8 2.01.4 1.6 2.2 2.4 2.6 2.8 3.0
Noise (nv/√Hz)
1800
1600
1400
1200
1000
800
600
400
200
0
RS= 50Ω
MGS = 111
MGS = 011
Page 7

7
®
VCA2612
TYPICAL PERFORMANCE CURVES (Cont.)
At TA = +25°C, V
DD
= 5V, load resistance = 500Ω on each output to ground, MGS = 011, LNP = 22dB and fIN = 5MHz, unless otherwise noted. The input to the
preamp (LNP) is single-ended, and the output from the VCA is single-ended unless otherwise noted.
INPUT REFERRED NOISE vs R
S
RS (Ω)
1 10 100 1000
Noise (nV√Hz
10.0
1.0
0.1
NOISE FIGURE vs R
S
(VCA
CNTL
= 3.0V)
R
S
(Ω)
10 100 1000
Noise Figure (dB)
11
10
9
8
7
6
5
4
3
2
1
0
NOISE FIGURE vs VCA
CNTL
VCA
CNTL
(V)
Noise Figure (dB)
30
25
20
15
10
5
0
0.2 1.0 1.20.4 0.6 0.8 1.8 2.01.4 1.6 2.2 2.4 2.6 2.8 3.0
INPUT REFERRED NOISE vs VCA
CNTL
VCA
CNTL
(V)
0.2 1.0 1.20.4 0.6 0.8 1.8 2.01.4 1.6 2.2 2.4 2.6 2.8 3.0
Noise (nV/√Hz)
24
22
20
18
16
14
12
10
8
6
4
2
0
MGS = 011
MGS = 111
RS= 50Ω
LNP vs FREQUENCY
(Differential, 2Vp-p)
Frequency (MHz)
0.1 1 10 100
Harmonic Distortion (dBc)
–45
–50
–55
–60
–65
–70
–75
–80
3rd Harmonic
2nd Harmonic
LNP vs FREQUENCY
(Single-Ended, 1Vp-p)
Frequency (MHz)
0.1 1 10 100
Harmonic Distortion (dBc)
–45
–50
–55
–60
–65
–70
–75
–80
2nd Harmonic
3rd Harmonic
Page 8

8
®
VCA2612
TYPICAL PERFORMANCE CURVES (Cont.)
At TA = +25°C, V
DD
= 5V, load resistance = 500Ω on each output to ground, MGS = 011, LNP = 22dB and fIN = 5MHz, unless otherwise noted. The input to the
preamp (LNP) is single-ended, and the output from the VCA is single-ended unless otherwise noted.
HARMONIC DISTORTION vs FREQUENCY
(Differential, 2Vp-p, MGS = 000)
Frequency (MHz)
0.1 1 10
Harmonic Distortion (dBc)
–40
–45
–50
–55
–60
–65
–70
–75
–80
–85
–90
VCA
CNTL
= 0.2V, H2
VCA
CNTL
= 0.2V, H3
VCA
CNTL
= 3.0V, H2
VCA
CNTL
= 3.0V, H3
HARMONIC DISTORTION vs FREQUENCY
(Differential, 2Vp-p, MGS = 011)
Frequency (Hz)
0.1 1 10
Harmonic Distortion (dBc)
–40
–45
–50
–55
–60
–65
–70
–75
–80
–85
–90
VCA
CNTL
= 0.2V, H2
VCA
CNTL
= 0.2V, H3
VCA
CNTL
= 3.0V, H2
VCA
CNTL
= 3.0V, H3
HARMONIC DISTORTION vs FREQUENCY
(Differential, 2Vp-p, MGS = 111)
Frequency (MHz)
0.1 1 10
Harmonic Distortion (dBc)
–30
–35
–40
–45
–50
–55
–60
–65
–70
–75
–80
VCA
CNTL
= 0.2V, H2
VCA
CNTL
= 0.2V, H3
VCA
CNTL
= 3.0V, H2
VCA
CNTL
= 3.0V, H3
HARMONIC DISTORTION vs FREQUENCY
(Single-Ended, 1Vp-p, MGS = 000)
Frequency (MHz)
0.1 1 10
Harmonic Distortion (dBc)
–40
–45
–50
–55
–60
–65
–70
–75
–80
–85
–90
VCA
CNTL
= 0.2V, H2
VCA
CNTL
= 0.2V, H3
VCA
CNTL
= 3.0V, H2
VCA
CNTL
= 3.0V, H3
HARMONIC DISTORTION vs FREQUENCY
(Single-Ended, 1Vp-p, MGS = 011)
Frequency (MHz)
0.1 1 10
Harmonic Distortion (dBc)
–40
–45
–50
–55
–60
–65
–70
–75
–80
–85
–90
VCA
CNTL
= 0.2V, H2
VCA
CNTL
= 0.2V, H3
VCA
CNTL
= 3.0V, H2
VCA
CNTL
= 3.0V, H3
HARMONIC DISTORTION vs FREQUENCY
(Single-Ended, 1Vp-p, MGS = 111)
Frequency (MHz)
0.1 1 10
Harmonic Distortion (dBc)
–30
–35
–40
–45
–50
–55
–60
–65
–70
–75
–80
–85
VCA
CNTL
= 0.2V, H2
VCA
CNTL
= 0.2V, H3
VCA
CNTL
= 3.0V, H2
VCA
CNTL
= 3.0V, H3
Page 9

9
®
VCA2612
INTERMODULATION DISTORTION
(Differential, 2Vp-p, f = 10MHz)
Frequency (MHz)
9.989.96 10 10.2 10.4
Power (dBm)
–5
–15
–25
–35
–45
–55
–65
–75
–85
–95
–105
TYPICAL PERFORMANCE CURVES (Cont.)
At TA = +25°C, V
DD
= 5V, load resistance = 500Ω on each output to ground, MGS = 011, LNP = 22dB and fIN = 5MHz, unless otherwise noted. The input to the
preamp (LNP) is single-ended, and the output from the VCA is single-ended unless otherwise noted.
–1dB COMPRESSION vs VCA
CNTL
VCA
CNTL
(V)
0.2 1.0 1.20.4 0.6 0.8 1.6 1.8 2.0 2.21.4 2.4 2.6 3.02.8
P
IN
(dBm)
0
–5
–10
–15
–20
–25
–30
–35
–40
3rd-ORDER INTERCEPT vs VCA
CNTL
VCA
CNTL
(V)
0.2 1.0 1.20.4 0.6 0.8 1.6 1.8 2.0 2.21.4 2.4 2.6 3.02.8
IP3 (dBm)
0
–5
–10
–15
–20
–25
–30
–35
–40
–45
–50
INTERMODULATION DISTORTION
(Single-Ended, 1Vp-p, f = 10MHz)
Frequency (MHz)
9.989.96 10 10.2 10.4
Power (dBm)
–5
–15
–25
–35
–45
–55
–65
–75
–85
–95
–105
HARMONIC DISTORTION vs VCA
CNTL
(Differential, 2Vp-p)
VCA
CNTL
(V)
0.2 0.4 0.6 0.8 1.0 1.2 1.4 1.6 1.8 2.0 2.2 2.4 2.6 2.8 3.0
Harmonic Distortion (dBc)
–45
–50
–55
–60
–65
–70
–75
–80
MGS = 000, H2
MGS = 011, H2
MGS = 111, H2
MGS = 000, H3
MGS = 011, H3
MGS = 111, H3
HARMONIC DISTORTION vs VCA
CNTL
(Single-Ended, 1Vp-p)
VCA
CNTL
(V)
0.2 0.4 0.6 0.8 1.0 1.2 1.4 1.6 1.8 2.0 2.2 2.4 2.6 2.8 3.0
Harmonic Distortion (dBc)
–45
–50
–55
–60
–65
–70
–75
–80
MGS = 000, H2
MGS = 011, H2
MGS = 111, H2
MGS = 000, H3
MGS = 011, H3
MGS = 111, H3
Page 10

10
®
VCA2612
TYPICAL PERFORMANCE CURVES (Cont.)
At TA = +25°C, V
DD
= 5V, load resistance = 500Ω on each output to ground, MGS = 011, LNP = 22dB and fIN = 5MHz, unless otherwise noted. The input to the
preamp (LNP) is single-ended, and the output from the VCA is single-ended unless otherwise noted.
CMRR vs FREQUENCY
(LNP only)
Frequency (MHz)
0.1 1 10 100
CMRR (dB)
0
–10
–20
–30
–40
–50
–60
–70
–80
PULSE RESPONSE (BURSTS)
(Differential, VCA
CNTL
= 3.0V, MGS = 111)
200ns/div
Output
500mV/div
Input
10V/div
OVERLOAD RECOVERY
(Differential, VCA
CNTL
= 3.0V, MGS = 111)
Input
1V/div
Output
1V/div
200ns/div
GAIN RESPONSE
(Differential, VCA
CNTL
Pulsed, MGS = 111)
Output
500mV/div
Input
2V/div
100ns/div
CMRR vs FREQUENCY
(VCA only)
Frequency (MHz)
0.1 1 10 100
CMRR (dB)
0
–10
–20
–30
–40
–50
–60
–70
–80
–90
VCA
CNTL
= 0.2V
VCA
CNTL
= 1.4V
VCA
CNTL
= 3.0V
CROSS TALK vs FREQUENCY
(Single-Ended, 1Vp-p, MGS = 011)
Frequency (MHz)
0.1 1 10
Cross Talk (dB)
0
–10
–20
–30
–40
–50
–60
–70
–80
–90
VCA
CNTRL
= 0V
VCA
CNTRL
= 1.5V
VCA
CNTRL
= 3.0V
Page 11

11
®
VCA2612
TYPICAL PERFORMANCE CURVES (Cont.)
At TA = +25°C, V
DD
= 5V, load resistance = 500Ω on each output to ground, MGS = 011, LNP = 22dB and fIN = 5MHz, unless otherwise noted. The input to the
preamp (LNP) is single-ended, and the output from the VCA is single-ended unless otherwise noted.
80
79.5
79
78.5
78
77.5
77
76.5
76
I
CC
vs TEMPERATURE
Temperature (°C)
–40 –10 5–25 35 5020 65
80 95
I
CC
(mA)
GROUP DELAY vs FREQUENCY
Frequency (MHz)
1 10 100
Group Delay (ns)
15
14
13
12
11
10
9
8
7
6
5
4
3
2
1
0
VCA
CNTL
= 3.0V
VCA
CNTL
= 0.2V
–45
–40
–35
–30
–25
–20
–15
–10
–5
0
5
10
PSRR vs FREQUENCY
Frequency (Hz)
1.E+01 1.E+031.E+02 1.E+05 1.E+061.E+04 1.E+07
PSRR (dB)
Page 12

12
®
VCA2612
VCA—OVERVIEW
The magnitude of the differential VCA input signal (from
the LNP or an external source) is reduced by a programmable attenuation factor, set by the analog VCA Control
Voltage (VCA
CNTL
) at pin 43. The maximum attenuation
factor is further programmable by using the three MGS bits
(pins 40-42). Figure 3 illustrates this dual-adjustable characteristic. Internally, the signal is attenuated by having the
analog VCA
CNTL
vary the channel resistance of a set of
shunt-connected FET transistors. The MGS bits effectively
adjust the overall size of the shunt FET by switching parallel
components in or out under logic control. At any given
maximum gain setting, the analog variable gain characteristic is linear in dB as a function of the control voltage, and
is created as a piecewise approximation of an ideal dB-linear
transfer function. The VCA gain control circuitry is common to both channels of the VCA2612.
VCALNP
Channel A
Input
VCA
Control
PGA
Channel A
Output
External
In
A
Maximum
Gain
Select
MGS
Analog
Control
VCALNP
Channel B
Input
PGA
Channel B
Output
External
In
B
FIGURE 1. Simplified Block Diagram of the VCA2612.
FIGURE 2. Recommended Signal Coupling.
0
–24
VCA Attenuation (dB)
–45
Control Voltage
Maximum Attenuation
Maximum Attenuation
FIGURE 3. Swept Attenuator Characteristic.
THEORY OF OPERATION
The VCA2612 is a dual-channel system consisting of three
primary blocks: a Low Noise Preamplifier (LNP), a Voltage
Controlled Attenuator (VCA) and a Programmable Gain
Amplifier (PGA). For greater system flexibility, an onboard
multiplexer is provided for the VCA inputs, selecting either
the LNP outputs or external signal inputs. Figure 1 shows a
simplified block diagram of the dual channel system.
LNP—OVERVIEW
The LNP input may be connected to provide active-feedback
signal termination, achieving lower system noise performance than conventional passive shunt termination. Even
lower noise performance is obtained if signal termination is
not required. The unterminated LNP input impedance is
600kΩ. The LNP can process fully differential or singleended signals in each channel. Differential signal processing
results in significantly reduced 2nd-harmonic distortion and
improved rejection of common-mode and power supply
noise. The first gain stage of the LNP is AC coupled into its
output buffer with a 44µs time constant (3.6kHz high-pass
characteristic). The buffered LNP outputs are designed to
drive the succeeding VCA directly or, if desired, external
loads as low as 135Ω with minimal impact on signal distortion. The LNP employs very low impedance local feedback
to achieve stable gain with the lowest possible noise and
distortion. Four pin-programmable gain settings are available: 5dB, 17dB, 22dB and 25dB. Additional intermediate
gains can be programmed by adding trim resistors between
the Gain Strap programming pins.
The common-mode DC level at the LNP output is nominally
2.5V, matching the input common-mode requirement of the
VCA for simple direct coupling. When external signals are
fed to the VCA, they should also be set up with a 2.5VDC
common-mode level. Figure 2 shows a circuit that demonstrates the recommended coupling method using an external
op amp. The “VCM” node shown in the drawing is the V
CM
output (pin 19). Typical R and C values are shown, yielding
a high-pass time constant similar to that of the LNP. If a
different common-mode referencing method is used, it is
important that the common-mode level be within 10mV of
the VCM output for proper operation.
V
CM
1kΩ
1kΩ
47nF
To VCA
Input
Signal
Page 13

13
®
VCA2612
The VCA2612 includes a built-in reference, common to
both channels, to supply a regulated voltage for critical areas
of the circuit. This reduces the susceptibility to power supply
variation, ripple and noise. In addition, separate power
supply and ground connections are provided for each channel and for the reference circuitry, further reducing
interchannel cross-talk.
Further details regarding the design, operation and use of
each circuit block are provided in the following sections.
LOW NOISE PREAMPLIFIER (LNP)—DETAIL
The LNP is designed to achieve a low noise figure, especially when employing active termination. Figure 4 is a
simplified schematic of the LNP, illustrating the differential
input and output capability. The input stage employs low
resistance local feedback to achieve stable low noise, low
distortion performance with very high input impedance.
Normally, low noise circuits exhibit high power consumption due to the large bias currents required in both input and
output stages. The LNP uses a patented technique that
combines the input and output stages such that they share the
same bias current. Transistors Q4 and Q5 amplify the signal
at the gate-source input of Q4, the +IN side of the LNP. The
signal is further amplified by the Q1 and Q2 stage, and then
by the final Q3 and RL gain stage, which uses the same bias
current as the input devices Q4 and Q5. Devices Q6 through
Q10 play the same role for signals on the –IN side.
The differential gain of the LNP is given in Equation (1):
R
L
93Ω
R
S1
105Ω
Q
3
Q
4
Q
5
Q
2
Q
1
R
S2
34Ω
R
S3
17Ω
LNPG
S2
+IN –IN
To Bias
Circuitry
LNPG
S1
LNPG
S3
R
L
93Ω
V
DD
–Out
Buffer Buffer
+Out
Q
8
Q
7
To Bias
Circuitry
Q
6
Q
9
Q
10
FIGURE 4. Schematic of the Low Noise Pre-Amplifier (LNP).
Gain
R
R
L
S
=•
2
(1)
PGA OVERVIEW AND OVERALL DEVICE
CHARACTERISTICS
The differential output of the VCA attenuator is then amplified by the PGA circuit block. This post-amplifier is programmed by the same MGS bits that control the VCA
attenuator, yielding an overall swept-gain amplifier characteristic in which the VCA • PGA gain varies from 0dB
(unity) to a programmable peak gain of (24, 27, 30, 33, 36,
39. 42, 45) dB.
The “GAIN vs VCA
CNTL
” curve on page 5 shows the
composite gain control characteristic of the entire VCA2612.
Setting VCA
CNTL
to 3.0V causes the digital MGS gain
control to step in 3dB increments. Setting VCA
CNTL
to 0V
causes all the MGS-controlled gain curves to converge at
one point. The gain at the convergence point is the LNP gain
less 6dB, because the measurement setup looks at only one
side of the differential PGA output, resulting in 6dB lower
signal amplitude.
ADDITIONAL FEATURES—OVERVIEW
Overload protection stages are placed between the attenuator
and the PGA, providing a symmetrically clipped output
whenever the input becomes large enough to overload the
PGA. A comparator senses the overload signal amplitude
and substitutes a fixed DC level to prevent undesirable
overload recovery effects. As with the previous stages, the
VCA is AC coupled into the PGA. In this case, the coupling
time constant varies from 5µs at the highest gain (46dB) to
59µs at the lowest gain (25dB).
Page 14

14
®
VCA2612
The LNP is capable of generating a 2Vp-p differential
signal. The maximum signal at the LNP input is therefore
2Vp-p divided by the LNP gain. An input signal greater than
this would exceed the linear range of the LNP, an especially
important consideration at low LNP gain settings.
ACTIVE FEEDBACK WITH THE LNP
One of the key features of the LNP architecture is the ability
to employ active-feedback termination to achieve superior
noise performance. Active feedback termination achieves a
lower noise figure than conventional shunt termination,
essentially because no signal current is wasted in the termination resistor itself. Another way to understand this is as
follows: Consider first that the input source, at the far end of
the signal cable has a cable-matching source resistance of
RS. Using conventional shunt termination at the LNP input,
a second terminating resistor of value RS is connected to
ground. Therefore, the signal loss is 6dB due to the voltage
divider action of the series and shunt RS resistors. The
effective source resistance has been reduced by the same
factor of 2, but the noise contribution has been reduced by
only the √2, only a 3dB reduction. Therefore, the net
theoretical SNR degradation is 3dB, assuming a noise-free
amplifier input. (In practice, the amplifier noise contribution
will degrade both the unterminated and the terminated noise
figures, somewhat reducing the distinction between them.)
Figure 5 shows an amplifier using active feedback. This
diagram appears very similar to a traditional inverting amplifier. However, the analysis is somewhat different because
the gain “A” in this case is not a very large open-loop op
amp gain; rather it is the relatively low and controlled gain
of the LNP itself. Thus, the impedance at the inverting
amplifier terminal will be reduced by a finite amount, as
given in the familiar relationship of Equation (3):
where RF is the feedback resistor (supplied externally between the LNPINP and FB terminals for each channel), A is
the user-selected gain of the LNP, and RIN is the resulting
amplifier input impedance with active feedback. In this case,
unlike the conventional termination above, both the signal
voltage and the RS noise are attenuated by the same factor of
It is also possible to create other gain settings by connecting
an external resistor between LNPGS1 on one side, and
LNPGS2 and/or LNPGS3 on the other. In that case, the
internal resistor values shown in Figure 4 should be combined with the external resistor to calculate the effective
value of RS for use in Equation (1). The resulting expression
for external resistor value is given in Equation (2).
where R
EXT
is the externally selected resistor value needed
to achieve the desired gain setting, RS1 is the fixed parallel
resistor in Figure 4, and R
FIX
is the effective fixed value of
the remaining internal resistors: RS2, RS3 or (RS2 || RS3)
depending on the pin connections.
Note that the best process and temperature stability will be
achieved by using the pre-programmed fixed gain options of
Table I, since the gain is then set entirely by internal resistor
ratios, which are typically accurate to ±0.5%, and track quite
well over process and temperature. When combining external resistors with the internal values to create an effective R
S
value, note that the internal resistors have a typical temperature coefficient of +700ppm/°C and an absolute value tolerance of approximately ±5%, yielding somewhat less predictable and stable gain settings. With or without external
resistors, the board layout should use short Gain Strap
connections to minimize parasitic resistance and inductance
effects.
The overall noise performance of the VCA2612 will vary as
a function of gain. Table II shows the typical input-and
output-referred noise densities of the entire VCA2612 for
maximum VCA and PGA gain; i.e., VCA
CNTL
set to 3.0V
and all MGS bits set to “1”. Note that the input-referred
noise values include the contribution of a 50Ω fixed source
impedance, and are therefore somewhat larger than the
intrinsic input noise. As the LNP gain is reduced, the noise
contribution from the VCA/PGA portion becomes more
significant, resulting in higher input-referred noise. However, the output-referred noise, which is indicative of the
overall SNR at that gain setting, is reduced.
NOISE (nv/√Hz)
LNP GAIN (dB) Input-Referred Output-Referred
25 1.54 2260
22 1.59 1650
17 1.82 1060
5 4.07 597
T ABLE II. Noise Performance for MGS = 11 1 and VCA
CNTL
= 3.0V .
LNP PIN STRAPPING LNP GAIN (dB)
LNPG
S1
, LNPGS2, LNPGS3 Connected Together 25
LNPGS1 Connected to LNPG
S3
22
LNPG
S1
Connected to LNPG
S2
17
All Pins Open 5
TABLE I. Pin Strappings of the LNP for Various Gains.
(3)
(2)
R
R
A
IN
F
=
+
()
1
where RL is the load resistor in the drains of Q3 and Q8, and
RS is the resistor connected between the sources of the input
transistors Q4 and Q7. The connections for various R
S
combinations are brought out to device pins LNPGS1, LNPG
S2
and LNPGS3 (pins 13-15 for channel A, 22-24 for channel
B). These Gain Strap pins allow the user to establish one of
four fixed LNP gain options as shown in Table I.
To preserve the low noise performance of the LNP, the user
should take care to minimize resistance in the input lead. A
parasitic resistance of only 10Ω will contribute 0.4nV/√Hz.
R
R R R R Gain R R
Gain R R
EXT
S L FIX L S FIX
SL
=
+•
•
22
2
11
1
–
–
Page 15

15
®
VCA2612
R
F
A
R
IN
R
IN
=
R
S
R
S
R
S
= R
S
R
F
1 + A
Active Feedback
A
Conventional Cable Termination
FIGURE 5. Configurations for Active Feedback and Con-
ventional Cable Termination.
VCA NOISE = 3.8nV√Hz, LNP GAIN = 20dB
Source Impedance (Ω)
0 300100 200 500400 600 700 800
Noise Figure (dB)
9
8
7
6
5
4
3
2
1
0
♦
×
6.0E-10
8.0E-10
1.0E-09
1.2E-09
1.4E-09
1.6E-09
1.8E-09
2.0E-09
LNP Noise
nV/√Hz
×
♦
Source Impedance (Ω)
0 300100 200 500400 600 700 800
Noise Figure (dB)
14
12
10
8
6
4
2
0
6.0E-10
8.0E-10
1.0E-09
1.2E-09
1.4E-09
1.6E-09
1.8E-09
2.0E-09
LNP Noise
nV/√Hz
×
♦
♦
×
VCA NOISE = 3.8nV√Hz, LNP GAIN = 20dB
R
S
1MΩ
C
L
V
CM
R
F
44pF
Buffer
1MΩ
V
CM
44pF
Gain
Stage
Buffer
FIGURE 6. Noise Figure for Active Termination.
FIGURE 7. Noise Figure for Conventional Termination.
FIGURE 8. Low Frequency LNP Time Constants.
two (6dB) before being re-amplified by the “A” gain setting.
This avoids the extra 3dB degradation due to the square-root
effect described above, the key advantage of the active
termination technique.
As mentioned above, the previous explanation ignored the
input noise contribution of the LNP itself. Also, the noise
contribution of the feedback resistor must be included for a
completely correct analysis. The curves given in Figures 6
and 7 allow the VCA2612 user to compare the achievable
noise figure for active and conventional termination methods. The left-most set of data points in each graph give the
results for typical 50Ω cable termination, showing the worst
noise figure but also the greatest advantage of the active
feedback method.
A switch, controlled by the FBSW
CNTL
signal on pin 45,
enables the user to reduce the feedback resistance by adding
an additional parallel component, connected between the
LNPINP and SWFB terminals. The two different values of
feedback resistance will result in two different values of
active-feedback input resistance. Thus, the active-feedback
impedance can be optimized at two different LNP gain
settings. The switch is connected at the buffered output of
the LNP and has an “ON” resistance of approximately 1Ω.
When employing active feedback, the user should be careful
to avoid low-frequency instability or overload problems.
Figure 8 illustrates the various low-frequency time constants. Referring again to the input resistance calculation of
Equation (3), and considering that the gain term “A” falls
off below 3.6kHz, it is evident that the effective LNP input
impedance will rise below 3.6kHz, with a DC limit of
approximately RF. To avoid interaction with the feedback
pole/zero at low frequencies, and to avoid the higher signal
levels resulting from the rising impedance characteristic, it
is recommended that the external RFCC time constant be set
to about 5µs.
Page 16

16
®
VCA2612
Achieving the best active feedback architecture is difficult
with conventional op amp circuit structures. The overall
gain “A” must be negative in order to close the feedback
loop, the input impedance must be high to maintain low
current noise and good gain accuracy, but the gain ratio must
be set with very low value resistors to maintain good voltage
noise. Using a two-amplifier configuration (non-inverting
for high impedance plus inverting for negative feedback
reasons) results in excessive phase lag and stability problems when the loop is closed. The VCA2612 uses a patented
architecture that achieves these requirements, with the additional benefits of low power dissipation and differential
signal handling at both input and output.
For greatest flexibility and lowest noise, the user may wish
to shape the frequency response of the LNP. The COMP1
and COMP2 pins for each channel (pins 10 and 11 for
channel A, pins 26 and 27 for channel B) correspond to the
drains of Q3 and Q8 in Figure 4. A capacitor placed between
these pins will create a single-pole low pass response, in
which the effective “R” of the “RC” time constant is approximately 186Ω.
LNP OUTPUT BUFFER
The differential LNP output is buffered by wideband class
AB voltage followers which are designed to drive low
impedance loads. This is necessary to maintain LNP gain
accuracy, since the VCA input exhibits gain-dependent
input impedance. The buffers are also useful when the LNP
output is brought out to drive external filters or other signal
processing circuitry. Good distortion performance is maintained with buffer loads as low as 135Ω. As mentioned
previously, the buffer inputs are AC coupled to the LNP
outputs with a 3.6kHz high-pass characteristic, and the DC
common mode level is maintained at the correct VCM for
compatibility with the VCA input.
VOLTAGE-CONTROLLED ATTENUATOR (VCA)—DETAIL
The VCA is designed to have a “dB-linear” attenuation
characteristic, i.e. the gain loss in dB is constant for each
equal increment of the VCA
CNTL
control voltage. Figure 9
shows a block diagram of the VCA. The attenuator is
essentially a variable voltage divider consisting of one series
input resistor, RS, and ten identical shunt FETs, placed in
parallel and controlled by sequentially activated clipping
amplifiers. Each clipping amplifier can be thought of as a
specialized voltage comparator with a “soft” transfer characteristic and well-controlled output limit voltages. The reference voltages V1 through V10 are equally spaced over the
0V to 3.0V control voltage range. As the control voltage
rises through the input range of each clipping amplifier, the
amplifier output will rise from 0V (FET completely “ON”)
to VCM –VT (FET nearly “OFF”), where VCM is the common
source voltage and VT is the threshold voltage of the FET.
As each FET approaches its “OFF” state and the control
voltage continues to rise, the next clipping amplifier/ FET
combination takes over for the next portion of the piecewiselinear attenuation characteristic. Thus, low control voltages
have most of the FETs turned “ON”, while high control
voltages have most turned “OFF”. Each FET acts to decrease the shunt resistance of the voltage divider formed by
RS and the parallel FET network.
The attenuator is comprised of two sections, with five
parallel clipping amplifier/ FET combinations in each. Special reference circuitry is provided so that the (V
CM –VT
)
limit voltage will track temperature and IC process variations, minimizing the effects on the attenuator control characteristic.
In addition to the analog VCA
CNTL
gain setting input, the
attenuator architecture provides digitally programmable adjustment in eight steps, via the three Maximum Gain Setting
(MGS) bits. These adjust the maximum achievable gain
(corresponding to minimum attenuation in the VCA, with
VCA
CNTL
= 3.0V) in 3dB increments. This function is
accomplished by providing multiple FET sub-elements for
each of the Q1 to Q10 FET shunt elements shown in Figure
9. In the simplified diagram of Figure 10, each shunt FET is
shown as two sub-elements, QNA and QNB. Selector switches,
driven by the MGS bits, activate either or both of the subelement FETs to adjust the maximum RON and thus achieve
the stepped attenuation options.
R
S
Q
1A
A1
B1
VCM
INPUT
OUTPUT
PROGRAMMABLE ATTENUATOR SECTION
B2
Q
1B
Q
2A
A2
Q
2B
Q
3A
A3
Q
3B
Q
4A
A4
Q
4B
Q
5A
A5
Q
5B
FIGURE 10. Programmable Attenuator Section.
Page 17

17
®
VCA2612
R
S
Attenuator
Input
Attenuator
Output
A1 - A10 Attenuator Stages
Control
Input
Q
1
V
CM
0dB
–4.5dB
Q
2
Q
3
C
1
V1
Q
4
Q
5
Q
S
C1 - C10 Clipping Amplifiers
Attenuation Characteristic of Individual FETs
Q
6
Q
7
Q
8
Q
9
Q
10
C
2
V2
VCM-V
T
0
V1 V2 V3 V4 V5 V6 V7 V8 V9 V10
Characteristic of Attenuator Control Stage Output
OVERALL CONTROL CHARACTERISTICS OF ATTENUATOR
–4.5dB
0dB
0.3V 3V
Control Signal
C
3
V3
C
4
V4
C
5
V5
C
6
V6
C
7
V7
C
8
V8
C
9
V9
C
10
V10
A1 A2 A3 A4 A5 A6 A7 A8 A9 A10
FIGURE 9. Piecewise Approximation to Logarithmic Control Characteristics.
Page 18

18
®
VCA2612
The VCA can be used to process either differential or singleended signals. Fully differential operation will reduce 2ndharmonic distortion by about 10dB for full-scale signals.
Input impedance of the VCA will vary with gain setting, due
to the changing resistances of the programmable voltage
divider structure. At large attenuation factors (i.e., low gain
settings), the impedance will approach the series resistor
value of approximately 135Ω.
As with the LNP stage, the VCA output is AC coupled into
the PGA. This means that the attenuation-dependent DC
common-mode voltage will not propagate into the PGA, and
so the PGA’s DC output level will remain constant.
Finally, note that the VCA
CNTL
input consists of FET gate
inputs. This provides very high impedance and ensures that
multiple VCA2612 devices may be connected in parallel
with no significant loading effects.
OVERLOAD RECOVERY CIRCUITRY—DETAIL
With a maximum overall gain of 70dB, the VCA2612 is
prone to signal overloading. Such a condition may occur in
either the LNP or the PGA depending on the various gain
and attenuation settings available. The LNP is designed to
FIGURE 12. Overload Recovery Response For Minimum Gain. FIGURE 13. Overload Recovery Response For Maximum Gain.
VCA
CNTL
= 0.2V, DIFFERENTIAL, MGS = 100
200ns/div
1V/div
Output
Input
VCA
CNTL
= 3.0V, DIFFERENTIAL, MGS = 100
200ns/div
1V/div
Output
Input
FIGURE 11. Overload Protection Circuitry.
produce low-distortion outputs as large as 1Vp-p singleended (2Vp-p differential). Therefore the maximum input
signal for linear operation is 2Vp-p divided by the LNP
differential gain setting. Clamping circuits in the LNP ensure that larger input amplitudes will exhibit symmetrical
clipping and short recovery times. The VCA itself, being
basically a voltage divider, is intrinsically free of overload
conditions. However, the PGA post-amplifier is vulnerable
to sudden overload, particularly at high gain settings. Rapid
overload recovery is essential in many signal processing
applications such as ultrasound imaging. A special comparator circuit is provided at the PGA input which detects
overrange signals (detection level dependent on PGA gain
setting). When the signal exceeds the comparator input
threshold, the VCA output is blocked and an appropriate
fixed DC level is substituted, providing fast and clean
overload recovery. The basic architecture is shown in Figure
11. Both high and low overrange conditions are sensed and
corrected by this circuit.
Figures 12 and 13 show typical overload recovery waveforms with MGS = 100, for VCA • PGA minimum gain
(0dB) and maximum gain (36dB), respectively. LNP gain is
set to 25dB in both cases.
Comparators
E = Maximum Peak Amplitude
E
A
–
From VCA
Selection
Logic
PGA
Gain = A
Output
E
A
Page 19

19
®
VCA2612
MGS VCA GAIN min to max DIFFERENTIAL VCA • PGA GAIN
SETTING VCA
CNTL
= 0V to 3V PGA GAIN min to max
000 –24dB to 0dB 24dB 0dB to 24dB
001 –27dB to 0dB 27dB 0dB to 27dB
010 –30dB to 0dB 30dB 0dB to 30dB
011 –33dB to 0dB 33dB 0dB to 33dB
100 –36dB to 0dB 36dB 0dB to 36dB
101 –39dB to 0dB 39dB 0dB to 39dB
110 –42dB to 0dB 42dB 0dB to 42dB
101 –45dB to 0dB 45dB 0dB to 45dB
TABLE III. MGS Settings.
PGA POST-AMPLIFIER—DETAIL
Figure 14 shows a simplified circuit diagram of the PGA
block. As described previously, the PGA gain is programmed
with the same MGS bits which control the VCA maximum
attenuation factor. Specifically, the PGA gain at each MGS
setting is the inverse (reciprocal) of the maximum VCA
attenuation at that setting. Therefore, the VCA • PGA
overall gain will always be 0dB (unity) when the analog
VCA
CNTL
input is set to 0V (= maximum attenuation). For
VCA
CNTL
= 3V (no attenuation), the VCA • PGA gain will
be controlled by the programmed PGA gain (24 to 45 dB in
3dB steps).
For clarity, the gain and attenuation factors are detailed in
Table III.
The PGA architecture consists of a differential, programmable-gain voltage to current converter stage followed by
transimpedance amplifiers to create and buffer each side of
the differential output. The circuitry associated with the
voltage to current converter is similar to that previously
described for the LNP, with the addition of eight selectable
PGA gain-setting resistor combinations (controlled by the
MGS bits) in place of the fixed resistor network used in the
LNP. Low input noise is also a requirement of the PGA
design due to the large amount of signal attenuation which
can be inserted between the LNP and the PGA. At minimum
VCA attenuation (used for small input signals) the LNP
noise dominates; at maximum VCA attenuation (large input
signals) the PGA noise dominates. Note that if the PGA
output is used single-ended, the apparent gain will be 6dB
lower.
R
S1
R
L
R
S2
+Out
+In
Q
11
Q
3
Q
4
Q
5
Q
1
V
CM
Q
2
–Out
Q
9
Q
8
Q
13
Q
14
Q
7
Q
6
Q
12
V
DD
V
CM
R
L
Q
10
–In
To Bias
Circuitry
To Bias
Circuitry
FIGURE 14. Simplified Block Diagram of the PGA.
 Loading...