

Page 1
40V, 2A Synchronous
Buck-Boost DC/DC
FEATURES DESCRIPTION
LTC3115-1
Converter
n
Wide VIN Range: 2.7V to 40V
n
Wide V
n
1A Output Current for VIN ≥ 3.6V, V
n
2A Output Current in Step-Down Operation
Range: 2.7V to 40V
OUT
OUT
= 5V
for VIN ≥ 6V
n
Programmable Frequency: 100kHz to 2MHz
n
Synchronizable Up to 2MHz with an External Clock
n
Up to 95% Efficiency
n
30µA No-Load Quiescent Current in Burst Mode®
Operation
n
Ultralow Noise Buck-Boost PWM
n
Internal Soft-Start
n
3µA Supply Current in Shutdown
n
Programmable Input Undervoltage Lockout
n
Small 4mm × 5mm × 0.75mm DFN Package
n
Thermally Enhanced 20-Lead TSSOP Package
n
AEC-Q100 Qualified for Automotive Applications
APPLICATIONS
n
24V/28V Industrial Applications
n
Automotive Power Systems
n
Telecom, Servers and Networking Equipment
n
FireWire Regulator
n
Multiple Power Source Supplies
The LTC®3115-1 is a high voltage monolithic synchronous
buck-boost DC/DC converter. Its wide 2.7V to 40V input
and output voltage ranges make it well suited to a wide
variety of automotive and industrial applications. A proprietary low noise switching algorithm optimizes efficiency
with input voltages that are above, below or even equal
to the output voltage and ensures seamless transitions
between operational modes.
Programmable frequency PWM mode operation provides low noise, high efficiency operation and the ability
to synchronize switching to an external clock. Switching
frequencies up to 2MHz are supported to allow use of
small value inductors for miniaturization of the application circuit. Pin selectable Burst Mode operation
reduces standby current and improves light load efficiency which, combined with a 3µA shutdown current,
make the LTC3115-1 ideally suited for battery-powered
applications. Additional features include output disconnect in shutdown, short-circuit protection and internal soft-start. The LTC3115-1 is available in thermally
enhanced 16-lead 4mm × 5mm × 0.75mm DFN and
20-lead TSSOP packages.
All registered trademarks and trademarks are the property of their respective owners. Protected
by U.S. Patents including 6404251, 6166527 and others pending.
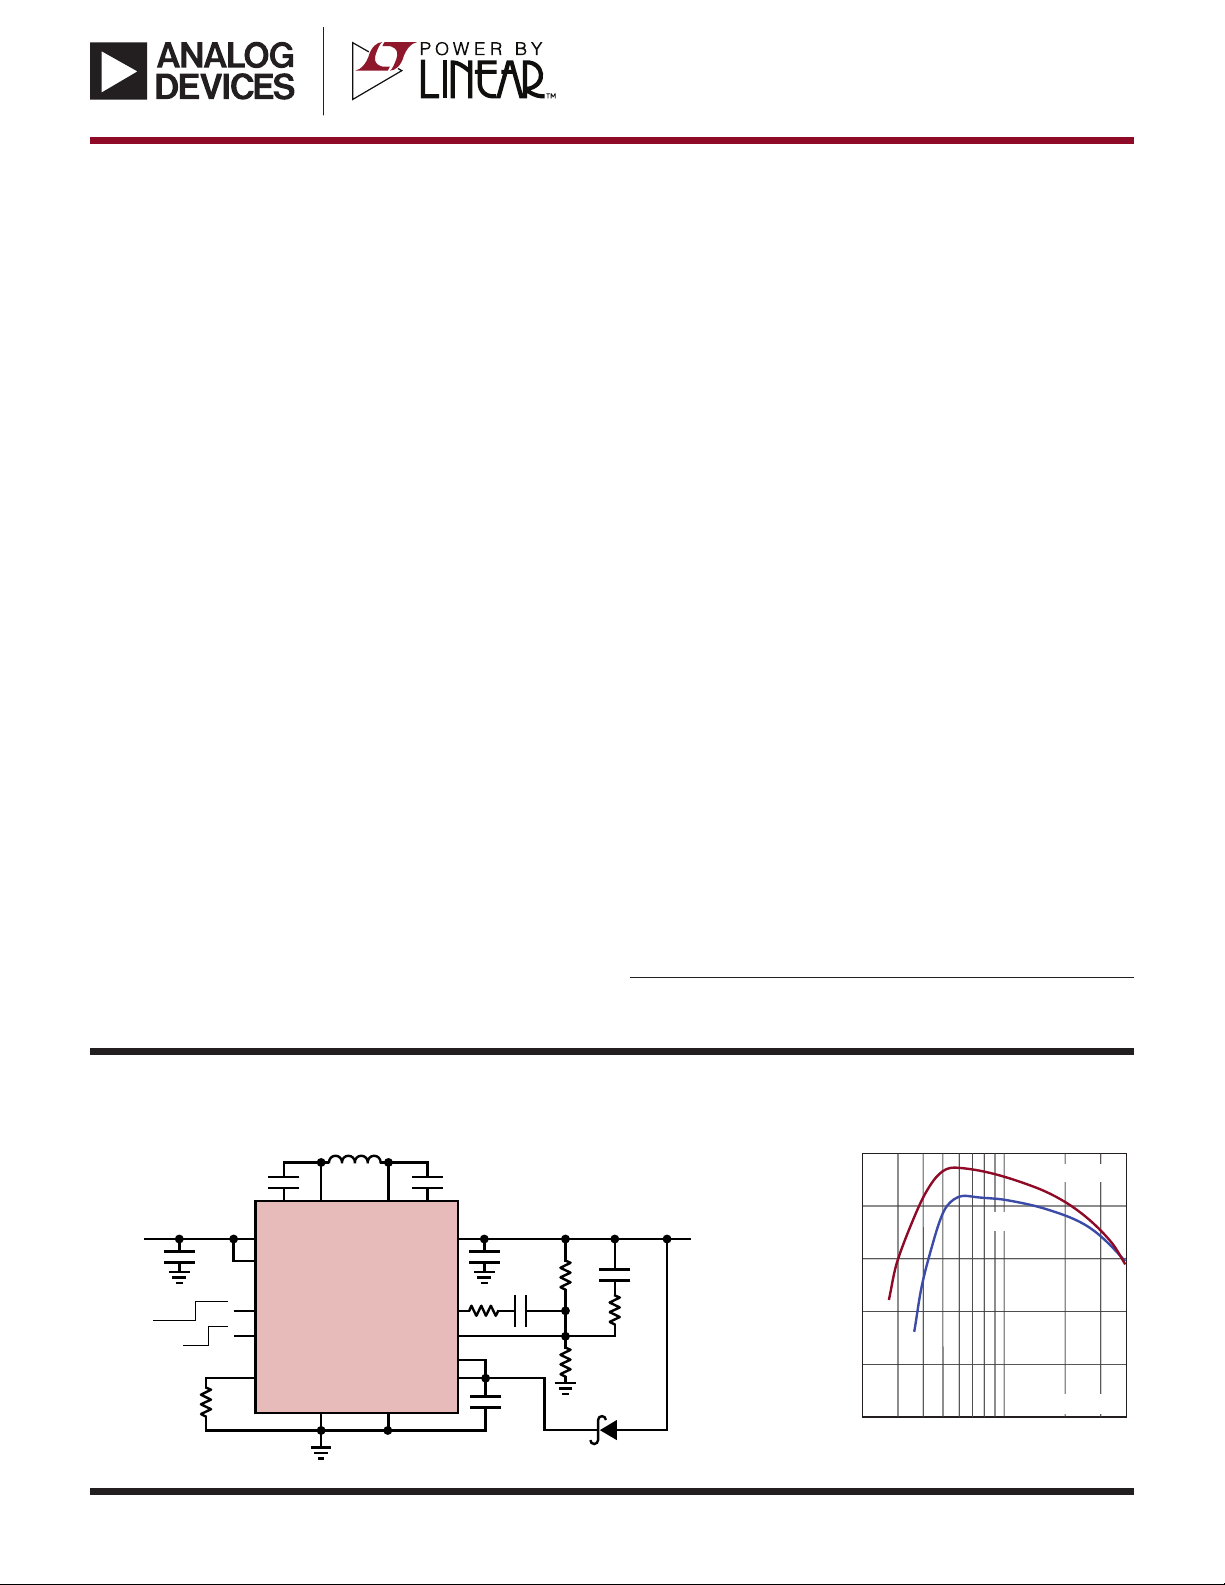
TYPICAL APPLICATION
10µH
0.1µF
SW1 SW2
2.7V TO
40V
4.7µF 47µF
BURST PWM
OFF ON
BST1 BST2
PV
IN
V
IN
PWM/SYNC
RT
47.5k
GND PGND
LTC3115-1
Efficiency vs V
95
0.1µF
5V
> 3.6V
33pF
1A V
2A V
IN
IN
≥ 6V
PV
OUT
3300pF
60.4k
VC
FBRUN
PV
CC
V
CC
4.7µF
For more information www.analog.comDocument Feedback
1M
15k
249k
(OPTIONAL)
3115 TA01a
90
85
80
EFFICIENCY (%)
75
70
2 10
INPUT VOLTAGE (V)
I
LOAD
I
= 1A
IN
LOAD
= 0.5A
V
OUT
= 5V
40
31151 TA01b
Rev. C
1
Page 2
LTC3115-1
EXPOSED PAD (PIN 21) IS PGND, MUST BE SOLDERED
TO PCB FOR RATED THERMAL PERFORMANCE
PWM/SYNC
ABSOLUTE MAXIMUM RATINGS
VIN, PVIN, PV
V
SW1
DC ........................................... –0.3V to (PVIN + 0.3V)
Pulsed (<100ns) ......................–1.5V to (PVIN + 1.5V)
V
SW2
DC .........................................–0.3V to (PV
Pulsed (<100ns) .................... –1.5V to (PV
V
............................................. –0.3V to (VIN + 0.3V)
RUN
V
.....................................V
BST1
V
.....................................V
BST2
........................................ –0.3V to 45V
OUT
OUT
OUT
– 0.3V to V
SW1
– 0.3V to V
SW2
SW1
SW2
+ 0.3V)
+ 1.5V)
+ 6V
+ 6V
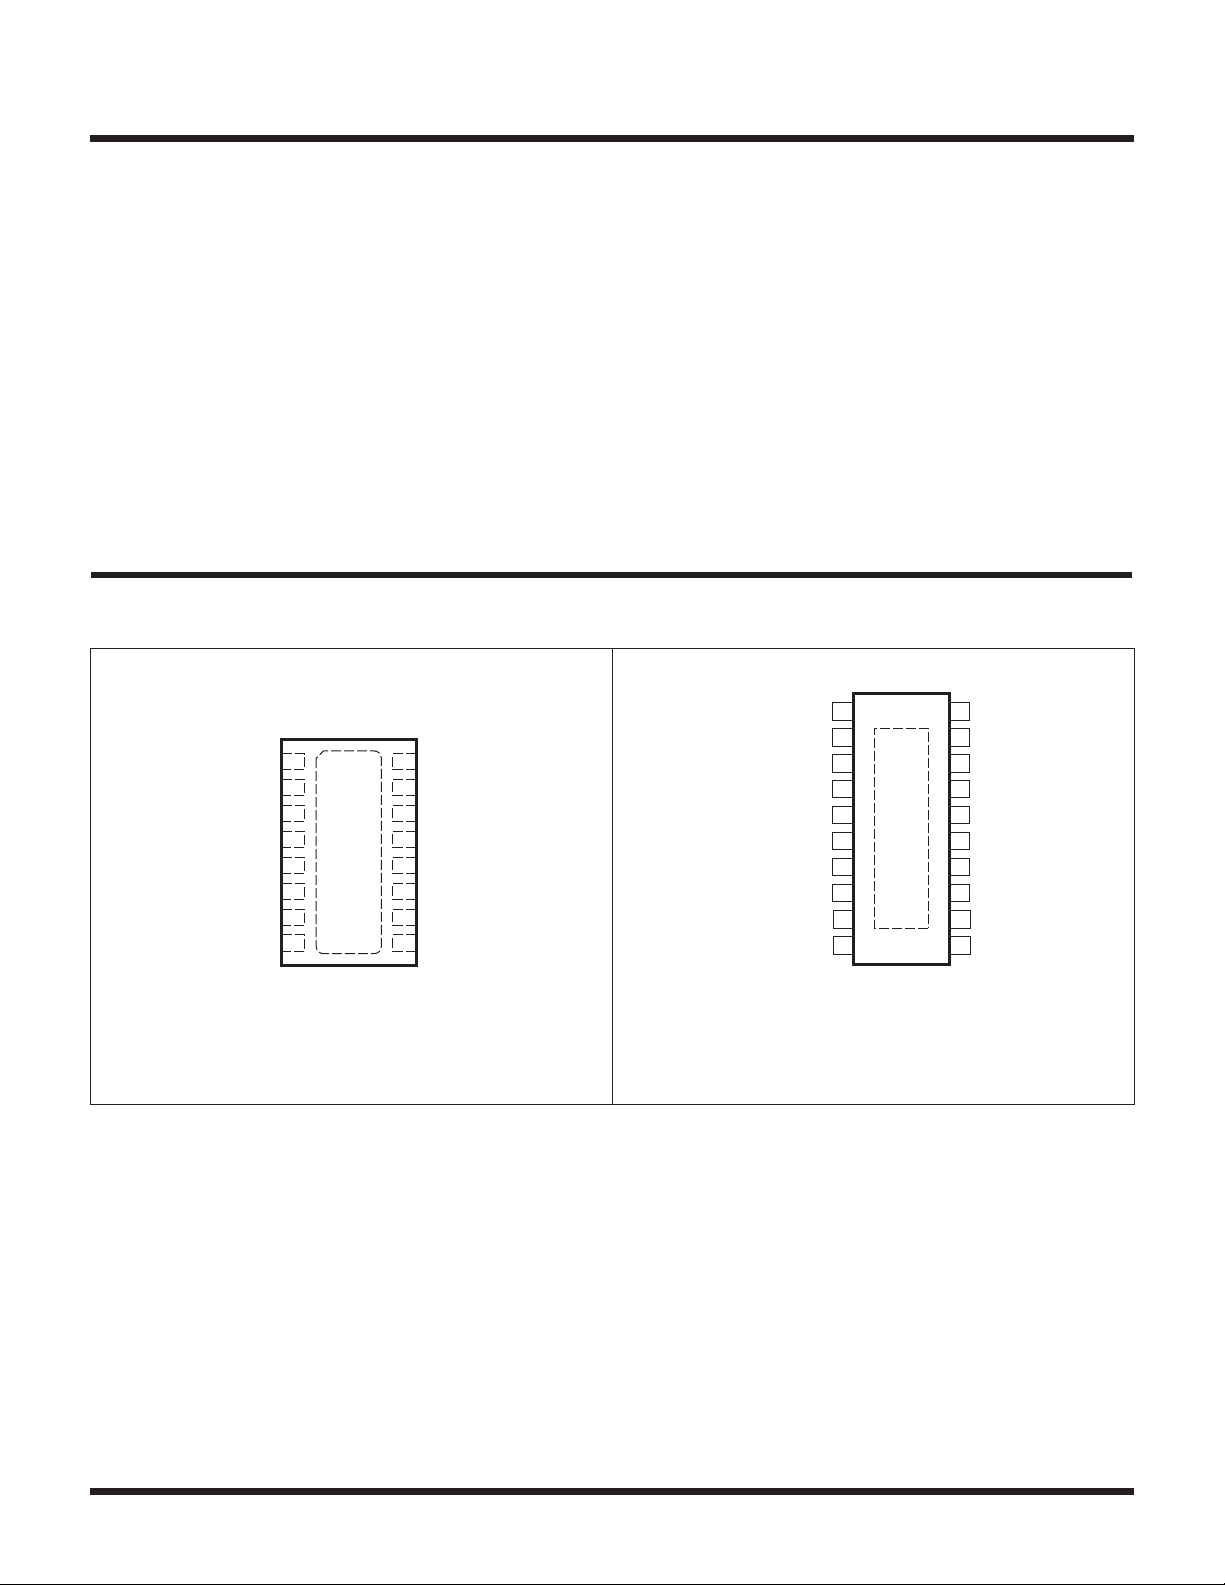
PIN CONFIGURATION
TOP VIEW
16
PWM/SYNC
15
SW1
14
PV
IN
13
BST1
17
12
BST2
11
PV
CC
10
V
IN
9
V
CC
PV
RUN
SW2
OUT
GND
GND
VC
RT
1
2
3
4
PGND
5
6
FB
7
8
(Note 1)
V
PWM/SYNC
................................................... –0.3V to 6V
Voltage, All Other Pins ................................. –0.3V to 6V
Operating Junction Temperature Range (Notes 2, 4)
LTC3115E-1/LTC3115I-1 ..................... –40°C to 125°C
LTC3115H-1 ....................................... –40°C to 150°C
LTC3115MP-1 ..................................... –55°C to 150°C
Storage Temperature Range .................. –65°C to 150°C
Lead Temperature (Soldering, 10 sec)
FE......................................................................300°C
TOP VIEW
1
PGND
RUN
SW2
PV
GND
GND
PGND
OUT
2
3
4
5
21
PGND
6
7
VC
8
FB
9
RT
10
PGND
20
19
SW1
18
PV
17
IN
BST1
16
BST2
15
PV
14
CC
V
13
IN
V
12
CC
PGND
11
16-LEAD (5mm × 4mm) PLASTIC DFN
= 125°C, θJA = 43°C/W, θJC = 4.3°C/W
T
JMAX
EXPOSED PAD (PIN 17) IS PGND, MUST BE SOLDERED TO PCB
2
DHD PACKAGE
For more information www.analog.com
FE PACKAGE
20-LEAD PLASTIC TSSOP
= 150°C, θJA = 38°C/W, θJC = 10°C/W
T
JMAX
Rev. C
Page 3
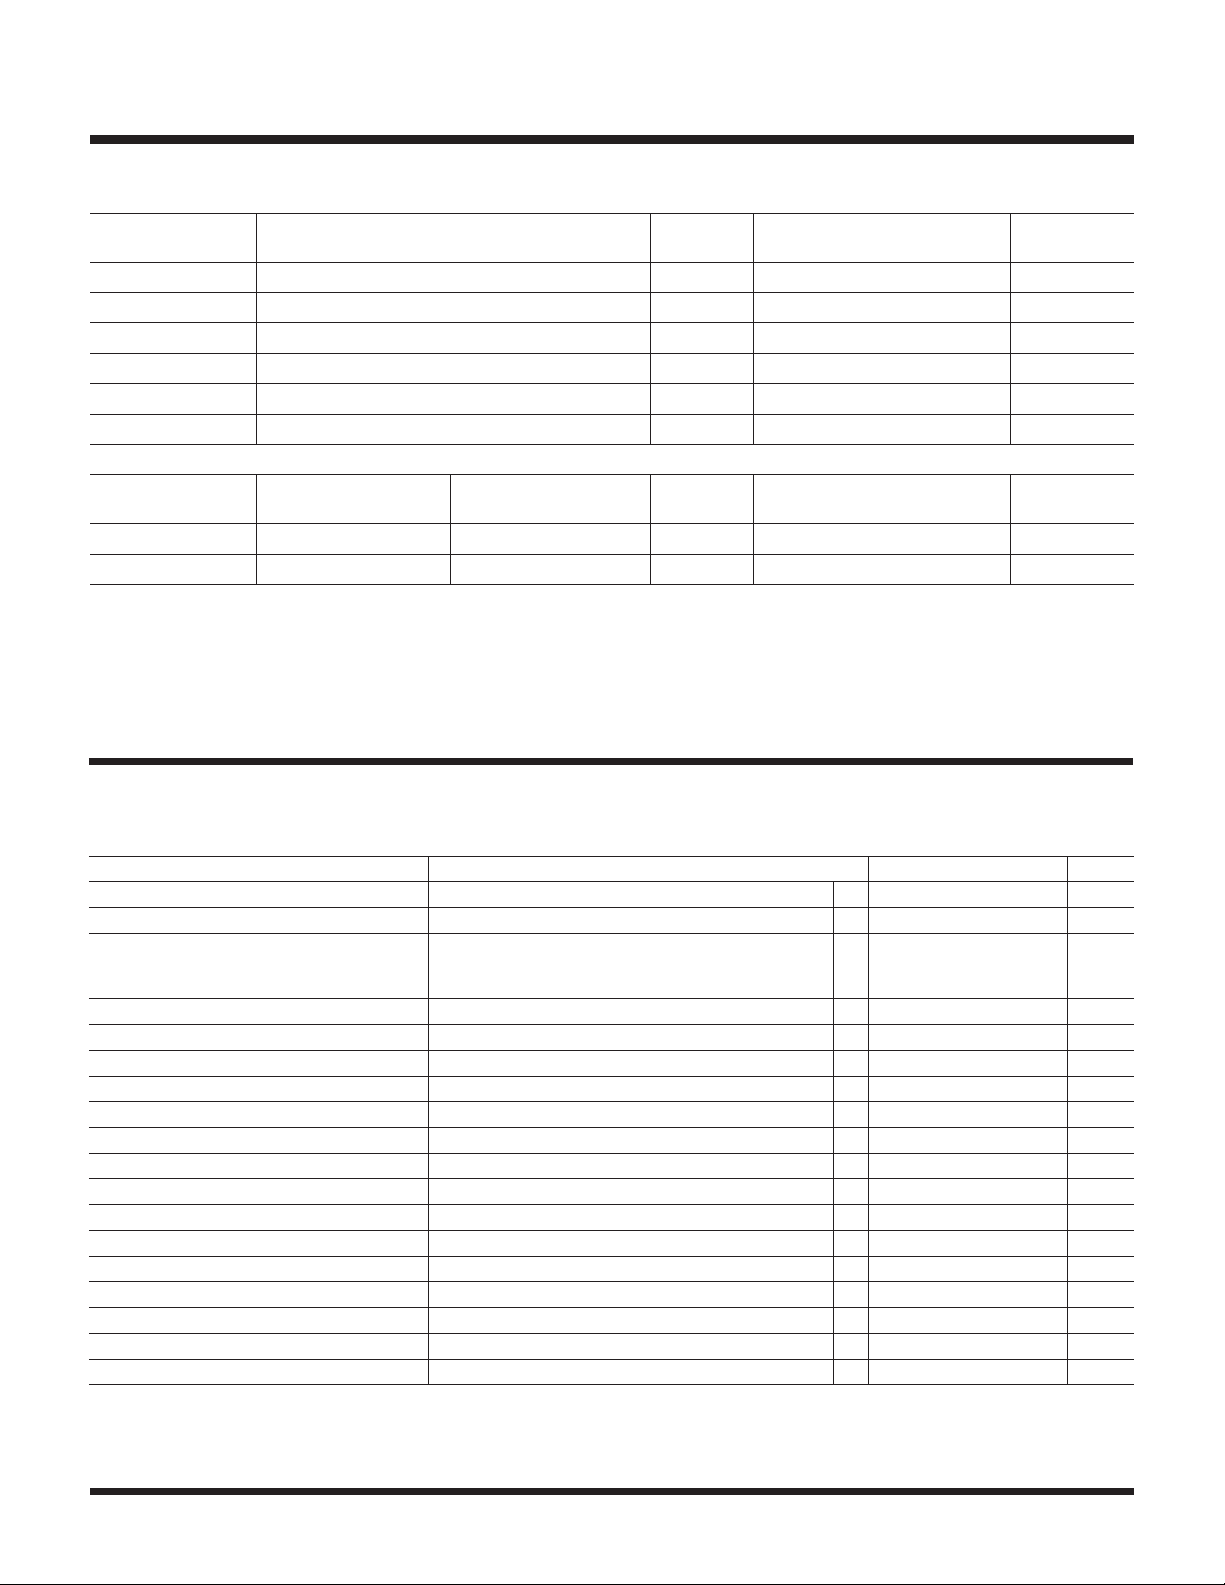
ORDER INFORMATION
LTC3115-1
PART
LEAD FREE FINISH TAPE AND REEL
LTC3115EDHD-1#PBF LTC3115EDHD-1#TRPBF 31151 16-Lead (5mm × 4mm) Plastic DFN –40°C to 125°C
LTC3115IDHD-1#PBF LTC3115IDHD-1#TRPBF 31151 16-Lead (5mm × 4mm) Plastic DFN –40°C to 125°C
LTC3115EFE-1#PBF LTC3115EFE-1#TRPBF LTC3115FE-1 20-Lead Plastic TSSOP –40°C to 125°C
LTC3115IFE-1#PBF LTC3115IFE-1#TRPBF LTC3115FE-1 20-Lead Plastic TSSOP –40°C to 125°C
LTC3115HFE-1#PBF LTC3115HFE-1#TRPBF LTC3115FE-1 20-Lead Plastic TSSOP –40°C to 150°C
LTC3115MPFE-1#PBF LTC3115MPFE-1#TRPBF LTC3115FE-1 20-Lead Plastic TSSOP –55°C to 150°C
AUTOMOTIVE PRODUCTS**
LEAD FREE FINISH TAPE AND REEL TAPE AND REEL MINI
LTC3115EDHD-1#WPBF
LTC3115IDHD-1#WPBF LTC3115IDHD-1#WTRPBF LTC3115IDHD-1#WTRMPBF 31151 16-Lead (5mm × 4mm) Plastic DFN –40°C to 125°C
Contact the factory for parts specified with wider operating temperature ranges. *The temperature grade is identified by a label on the shipping container.
Tape and reel specifications. Some packages are available in 500 unit reels through designated sales channels with #TRMPBF suffix.
**Versions of this part are available with controlled manufacturing to support the quality and reliability requirements of automotive applications. These
models are designated with a #W suffix. Only the automotive grade products shown are available for use in automotive applications. Contact your
local Analog Devices account representative for specific product ordering information and to obtain the specific Automotive Reliability reports for
thesemodels.
LTC3115EDHD-1#WTRPBF LTC3115EDHD-1#WTRMPBF 31151 16-Lead (5mm × 4mm) Plastic DFN –40°C to 125°C
MARKING* PACKAGE DESCRIPTION
PART
MARKING* PACKAGE DESCRIPTION
TEMPERATURE
RANGE
TEMPERATURE
RANGE
ELECTRICAL CHARACTERISTICS
The l denotes the specifications which apply over the specified operating
junction temperature range, otherwise specifications are for TA = 25°C (Note 2). PVIN = VIN = 24V, PV
PARAMETER CONDITIONS MIN TYP MAX UNITS
Input Operating Voltage
Output Operating Voltage
Input Undervoltage Lockout Threshold VIN Falling
VIN Rising
VIN Rising (0°C to 125°C)
Input Undervoltage Lockout Hysteresis 100 mV
VCC Undervoltage Lockout Threshold VCC Falling
VCC Undervoltage Lockout Hysteresis 200 mV
Input Current in Shutdown V
Input Quiescent Current in Burst Mode Operation VFB = 1.1V (Not Switching), V
Oscillator Frequency RT = 35.7k, V
Oscillator Operating Frequency V
PWM/SYNC Clock Input Frequency
PWM/SYNC Input Logic Threshold
Soft-Start Duration 9 ms
Feedback Voltage
Feedback Voltage Line Regulation VIN = 2.7V to 40V 0.1 %
Feedback Pin Input Current 1 50 nA
RUN Pin Input Logic Threshold
RUN Pin Comparator Threshold V
= 0V 3 10 µA
RUN
= Low 50 µA
PWM/SYNC
Rising
RUN
PWM/SYNC
= High
PWM/SYNC
= High
= 5V, unless otherwise noted.
OUT
l
2.7 40 V
l
2.7 40 V
l
l
l
l
900 1000 1100 kHz
l
100 2000 kHz
l
100 2000 kHz
l
0.5 1.0 1.5 V
l
977 1000 1017 mV
l
0.3 0.8 1.1 V
l
1.16 1.21 1.26 V
2.4
2.6
2.4 2.6 V
2.7
2.8
2.725
V
V
V
For more information www.analog.com
Rev. C
3
Page 4
LTC3115-1
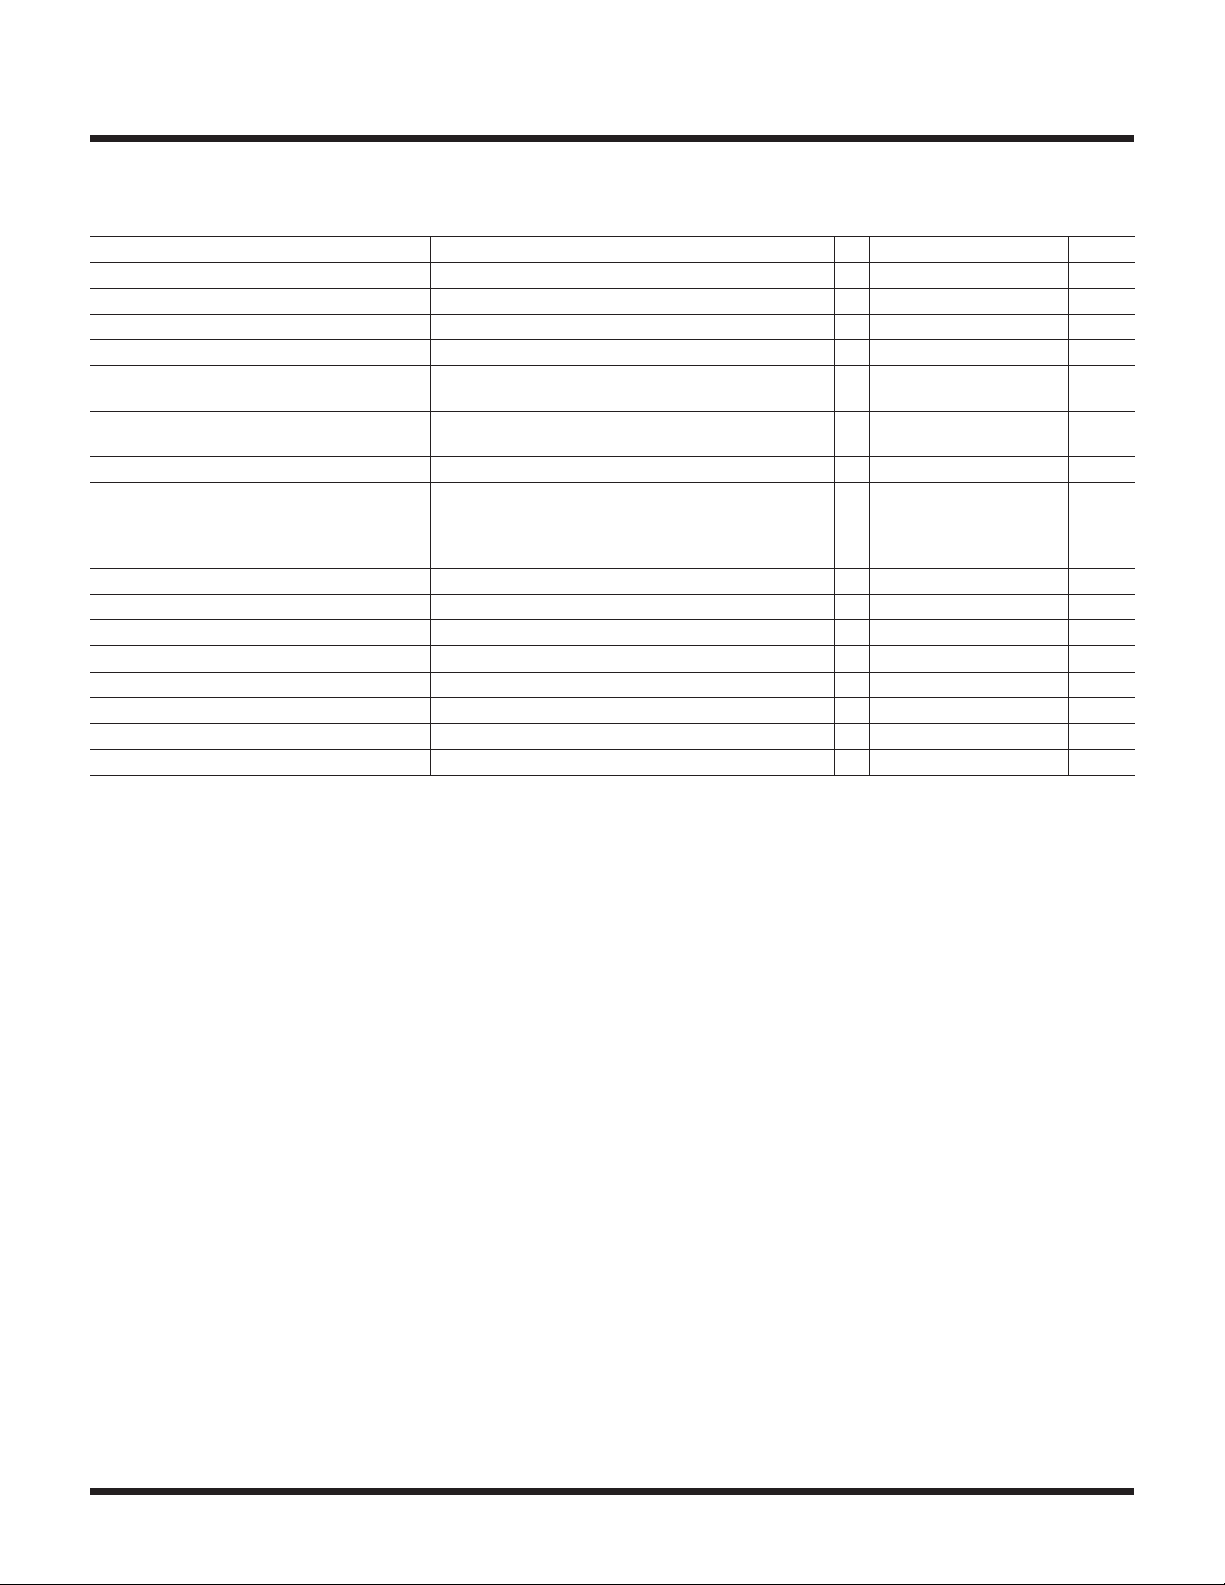
ELECTRICAL CHARACTERISTICS
The l denotes the specifications which apply over the specified operating
junction temperature range, otherwise specifications are for TA = 25°C (Note 2). PVIN = VIN = 24V, PV
RUN Pin Hysteresis Current 500 nA
RUN Pin Hysteresis Voltage 100 mV
Inductor Current Limit (Note 3)
Reverse Inductor Current Limit Current into PV
Burst Mode Inductor Current Limit (Note 3) 0.65 1.0 1.35 A
Maximum Duty Cycle Percentage of Period SW2 is Low in Boost Mode,
RT = 35.7k (Note 5)
Minimum Duty Cycle Percentage of Period SW1 is High in Buck Mode,
RT = 35.7k (Note 5)
SW1, SW2 Minimum Low Time RT = 35.7k (Note 5) 100 ns
N-Channel Switch Resistance Switch A (From PVIN to SW1)
Switch B (From SW1 to PGND)
Switch C (From SW2 to PGND)
Switch D (From PV
N-Channel Switch Leakage PVIN = PV
PVCC/VCC External Forcing Voltage 4.58 5.5 V
VCC Regulation Voltage I
VCC Load Regulation I
VCC Line Regulation I
VCC Current Limit VCC = 2.5V 50 110 mA
VCC Dropout Voltage I
VCC Reverse Current VCC = 5V, VIN = 3.6V 10 µA
VCC
VCC
VCC
VCC
OUT
= 1mA 4.33 4.45 4.58 V
= 1mA to 20mA 1.2 %
= 1mA, VIN = 5V to 40V 0.5 %
= 5mA, VIN = 2.7V 50 mV
(Note 3) 1.5 A
OUT
to SW2)
OUT
= 40V 0.1 10 µA
= 5V, unless otherwise noted.
OUT
l
2.4 3.0 3.7 A
l
90 95 %
l
150
150
150
150
0 %
mΩ
mΩ
mΩ
mΩ
Note 1: Stresses beyond those listed under Absolute Maximum Ratings
may cause permanent damage to the device. Exposure to any Absolute
Maximum Rating condition for extended periods may affect device
reliability and lifetime.
Note 2: The LTC3115-1 is tested under pulsed load conditions such
that TJ ≈ TA. The LTC3115E-1 is guaranteed to meet specifications
from 0°C to 85°C junction temperature. Specifications over the –40°C
to 125°C operating junction temperature range are ensured by design,
characterization and correlation with statistical process controls. The
LTC3115I-1 specifications are guaranteed over the –40°C to 125°C
operating junction temperature range. The LTC3115H-1 specifications are
guaranteed over the –40°C to 150°C operating junction temperature range.
The LTC3115MP-1 specifications are guaranteed over the –55°C to 150°C
operating junction temperature range. High junction temperatures degrade
operating lifetime; operating lifetime is derated for junction temperatures
greater than 125°C. The maximum ambient temperature consistent with
these specifications is determined by specific operating conditions in
conjunction with board layout, the rated package thermal resistance and
other environmental factors.
The junction temperature (TJ in °C) is calculated from the ambient
temperature (TA in °C) and power dissipation (PD in Watts) according to
the following formula:
TJ = TA + (PD • θJA)
where θJA is the thermal impedance of the package.
Note 3: Current measurements are performed when the LTC3115-1 is
not switching. The current limit values measured in operation will be
somewhat higher due to the propagation delay of the comparators.
Note 4: This IC includes overtemperature protection that is intended to
protect the device during momentary overload conditions. The maximum
rated junction temperature will be exceeded when this protection is active.
Continuous operation above the specified absolute maximum operating
junction temperature may impair device reliability or permanently damage
the device.
Note 5: Switch timing measurements are made in an open-loop test
configuration. Timing in the application may vary somewhat from these
values due to differences in the switch pin voltage during the non-overlap
durations when switch pin voltage is influenced by the magnitude and
direction of the inductor current.
4
Rev. C
For more information www.analog.com
Page 5
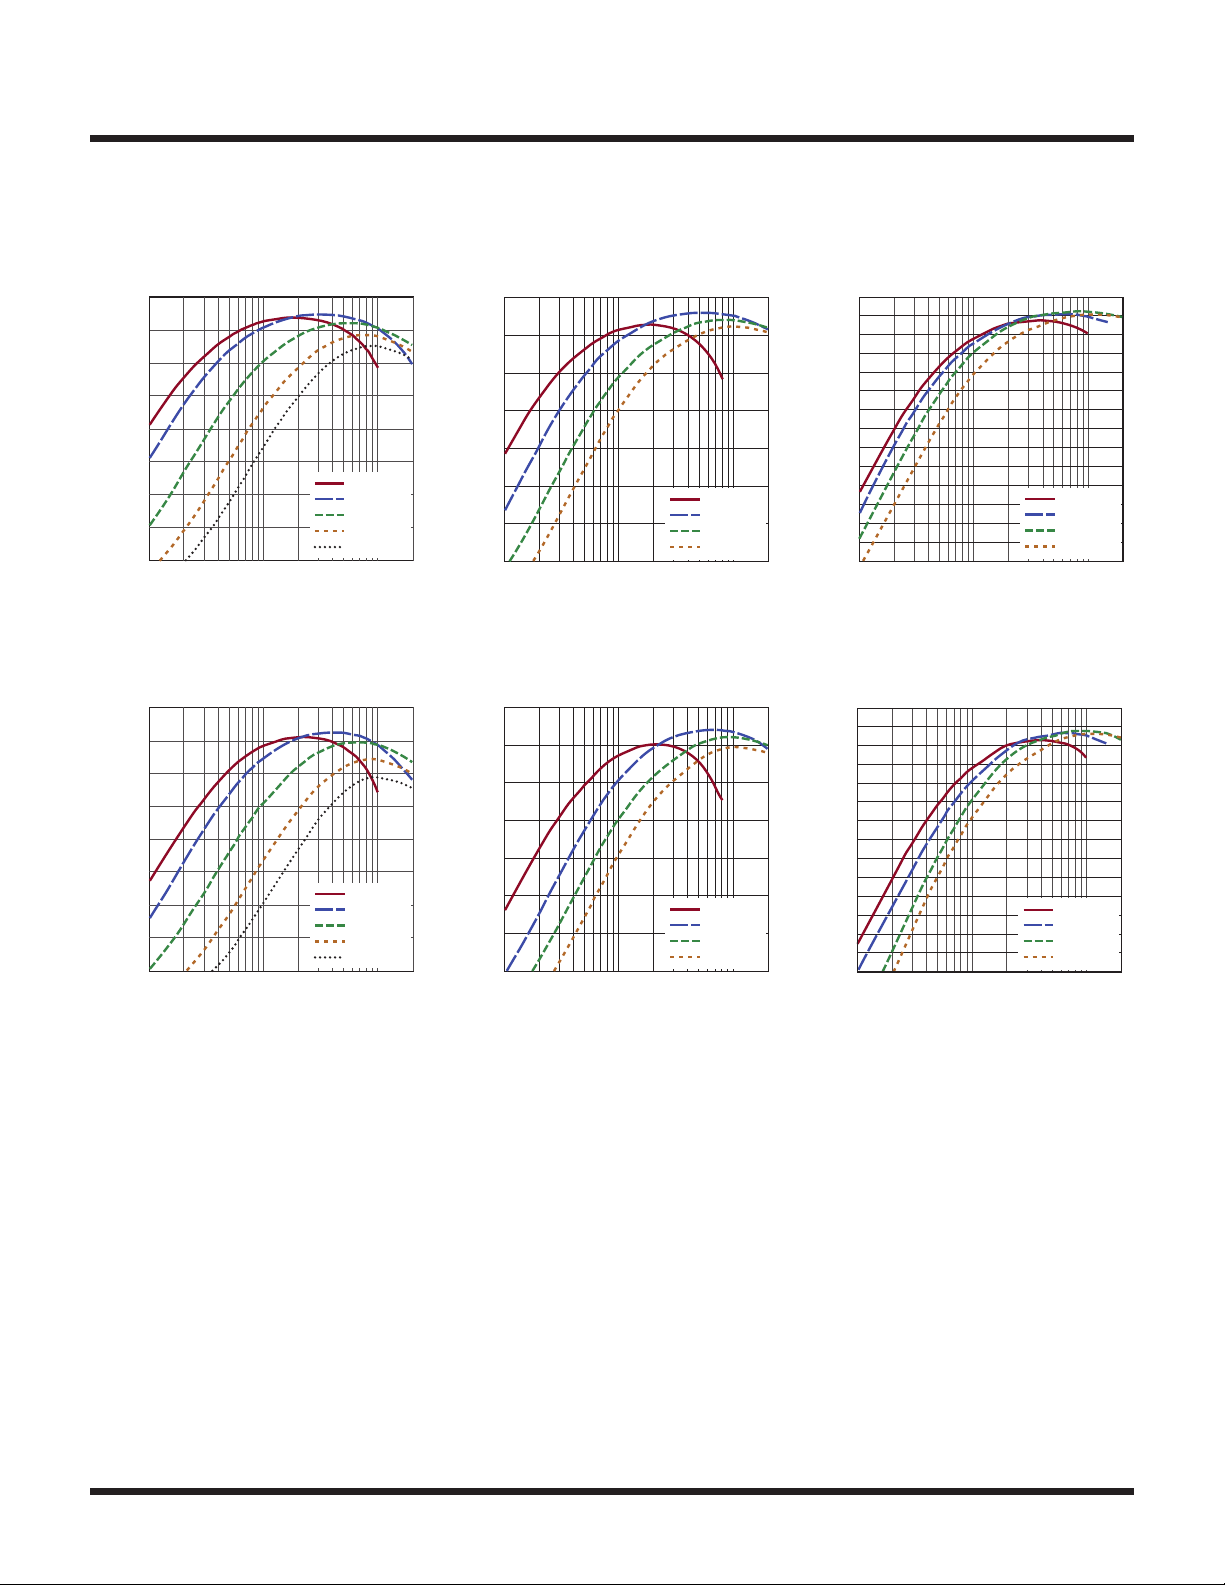
LTC3115-1
TYPICAL PERFORMANCE CHARACTERISTICS
PWM Mode Efficiency, V
fSW = 500kHz, Non-Bootstrapped
100
90
80
70
60
50
EFFICIENCY (%)
40
30
20
0.01
0.10 1
LOAD CURRENT (A)
PWM Mode Efficiency, V
fSW = 1MHz, Non-Bootstrapped
100
90
80
70
60
50
EFFICIENCY (%)
40
30
20
0.01
0.1 1
LOAD CURRENT (A)
= 5V,
OUT
VIN = 3.6V
V
IN
V
IN
V
IN
V
IN
= 5V,
OUT
VIN = 3.6V
V
IN
V
IN
V
IN
V
IN
= 5V
= 12V
= 24V
= 36V
31151 G01
= 5V
= 12V
= 24V
= 36V
31151 G04
PWM Mode Efficiency,
V
= 12V, fSW = 500kHz
OUT
100
90
80
70
60
EFFICIENCY (%)
50
40
30
0.01
LOAD CURRENT (A)
PWM Mode Efficiency,
V
= 12V, fSW = 1MHz
OUT
100
90
80
70
60
EFFICIENCY (%)
50
40
30
0.01
LOAD CURRENT (A)
0.1 1
0.1 1
(TA = 25°C unless otherwise specified)
PWM Mode Efficiency,
V
= 24V, fSW = 500kHz
OUT
100
90
80
70
60
EFFICIENCY (%)
VIN = 5V
= 12V
V
IN
= 24V
V
IN
= 36V
V
IN
31151 G02
50
40
30
0.01
LOAD CURRENT (A)
PWM Mode Efficiency,
V
= 24V, fSW = 1MHz
OUT
100
90
80
70
60
EFFICIENCY (%)
VIN = 5V
= 12V
V
IN
= 24V
V
IN
= 36V
V
IN
31151 G05
50
40
30
0.01
0.1 1
LOAD CURRENT (A)
VIN = 12V
V
IN
V
IN
V
IN
0.1 1
VIN = 12V
V
IN
V
IN
V
IN
= 18V
= 24V
= 36V
31151 G03
= 18V
= 24V
= 36V
31151 G06
For more information www.analog.com
Rev. C
5
Page 6
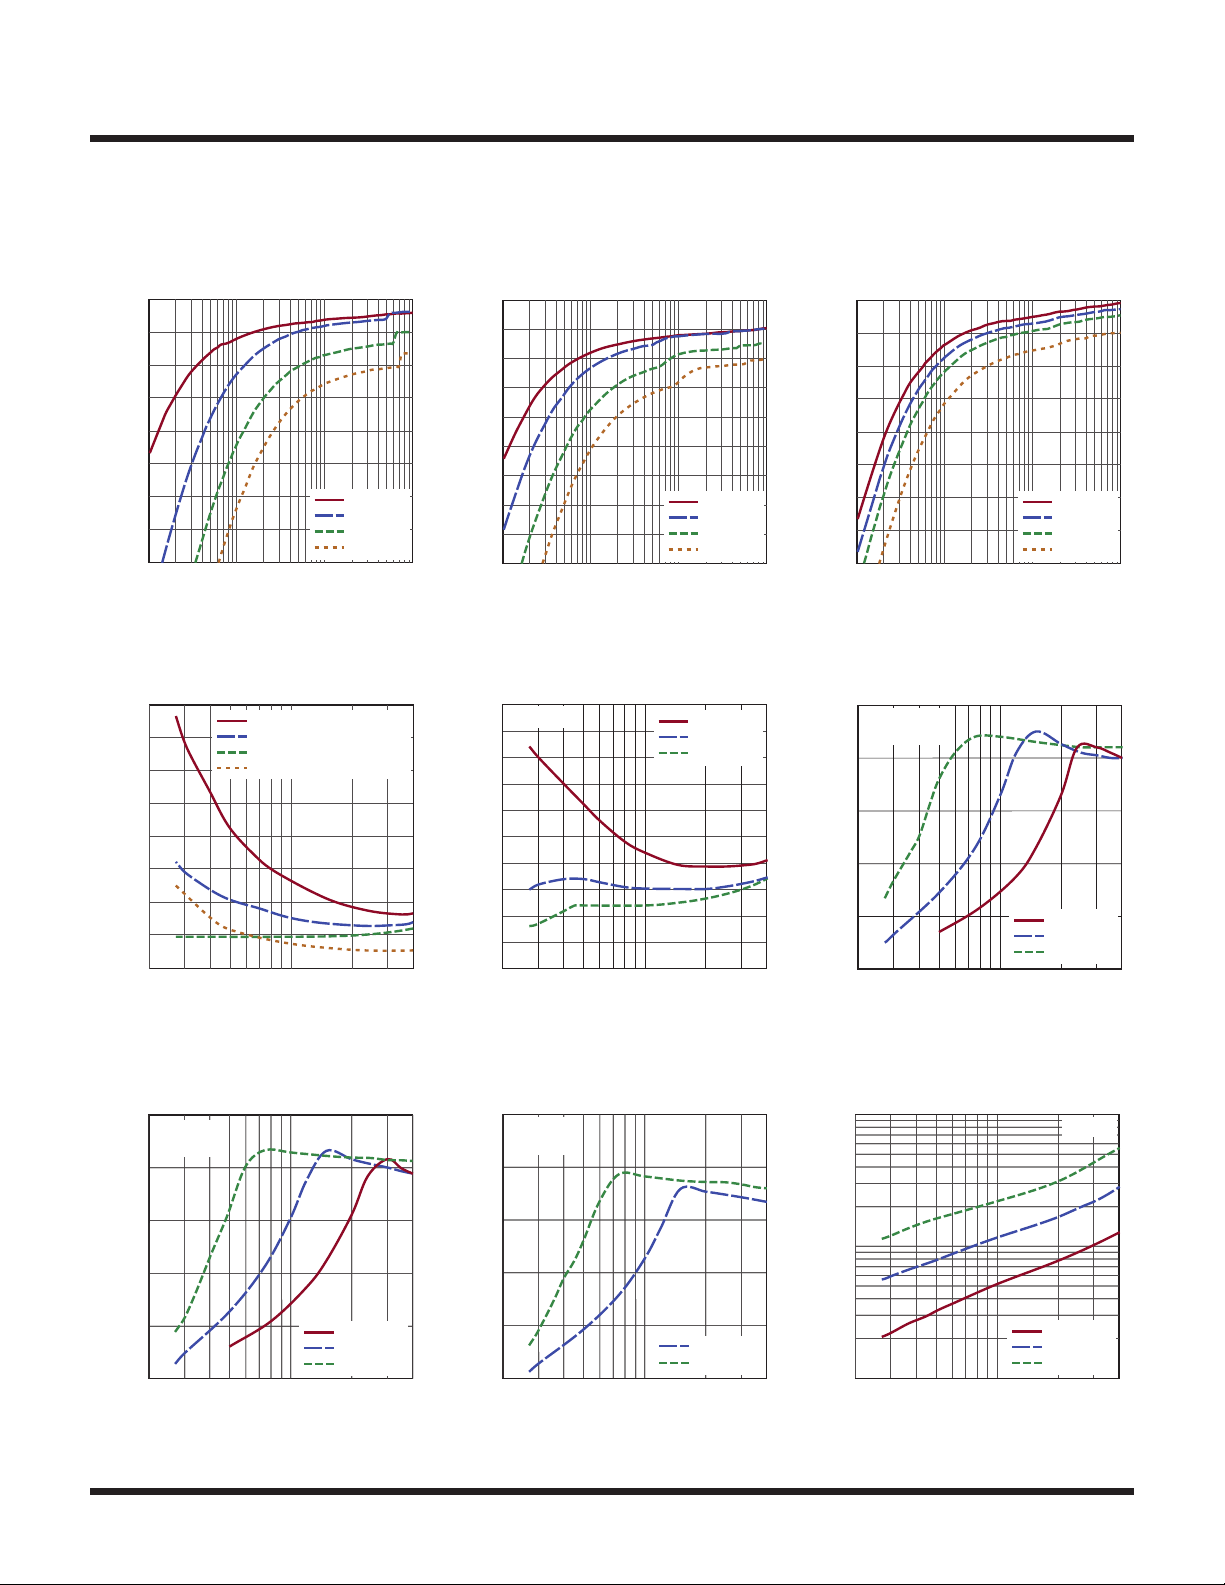
LTC3115-1
EFFICIENCY (%)
90
EFFICIENCY (%)
EFFICIENCY (%)
31151 G12
LOAD CURRENT (A)
2.5
LOAD CURRENT (A)
2.5
31151 G48
TYPICAL PERFORMANCE CHARACTERISTICS
Burst Mode Efficiency, V
L = 15µH, Non-Bootstrapped
85
80
75
70
65
60
55
50
0.1
1 10 100
LOAD CURRENT (mA)
Burst Mode No-Load Input
Current vs V
400
350
300
250
200
150
INPUT CURRENT (µA)
100
50
0
2
IN
V
= 24V
OUT
= 15V
V
OUT
= 5V
V
OUT
= 5V, BOOTSTRAPPED
V
OUT
10 40
INPUT VOLTAGE (V)
= 5V,
OUT
VIN = 3.6V
V
IN
V
IN
V
IN
= 12V
= 24V
= 36V
31151 G07
31151 G10
Burst Mode Efficiency,
V
= 12V, L = 15µH
OUT
95
90
85
80
75
70
65
60
55
50
0.1
1 10 100
LOAD CURRENT (mA)
PWM Mode No-Load Input
Current vs V
50
f
= 1MHz
SW
45
40
35
30
25
20
15
INPUT CURRENT (mA)
10
5
0
2
IN
INPUT VOLTAGE (V)
V
V
V
10 40
(TA = 25°C unless otherwise specified)
Burst Mode Efficiency,
V
= 24V, L = 15µH
OUT
90
85
80
75
70
65
VIN = 5V
= 12V
V
IN
= 24V
V
IN
= 36V
V
IN
31151 G08
60
55
50
0.1
1 10 100
LOAD CURRENT (mA)
Maximum Load Current
vs VIN, PWM Mode
2.5
OUT
OUT
OUT
= 24V
= 12V
= 5V
31151 G11
L = 22µH
= 500kHz
f
SW
2.0
1.5
1.0
LOAD CURRENT (A)
0.5
0
2 10
INPUT VOLTAGE (V)
VIN = 12V
= 18V
V
IN
= 24V
V
IN
= 36V
V
IN
V
= 24V
OUT
= 12V
V
OUT
= 5V
V
OUT
31151 G09
40
6
Maximum Load Current
vs VIN, PWM Mode
L = 15µH
= 1MHz
f
SW
2.0
1.5
1.0
0.5
0
2 10
INPUT VOLTAGE (V)
Maximum Load Current
vs VIN, PWM Mode
L = 5.2µH
= 2MHz
f
SW
2.0
1.5
1.0
V
= 24V
OUT
= 12V
V
OUT
= 5V
V
OUT
40
31151 G47
0.5
0
2 10
INPUT VOLTAGE (V)
V
= 12V
OUT
= 5V
V
OUT
40
Maximum Load Current
vs VIN, Burst Mode Operation
1000
100
LOAD CURRENT (mA)
10
2 10
INPUT VOLTAGE (V)
L = 22µH
V
OUT
V
OUT
V
OUT
= 32V
= 12V
= 5V
40
31151 G13
Rev. C
For more information www.analog.com
Page 7

LTC3115-1
16
31151 G17
1.0
31151 G20
CHANGE FROM V
= 24V (%)
1.0
CHANGE IN VOLTAGE FROM ZERO LOAD (%)
0.5
31151 G18
CHANGE IN VOLTAGE FROM I
= 0mA (%)
0
35
31151 G15
TYPICAL PERFORMANCE CHARACTERISTICS
Combined VCC/PVCC Supply
Efficiency vs Switching Frequency
95
90
85
80
EFFICIENCY (%)
NON-BOOTSTRAPPED
75
70
0
BOOTSTRAPPED
500
SWITCHING FREQUENCY (kHz)
1000
PWM MODE
L = 47µH
= 24V
V
IN
= 5V
V
OUT
= 0.5A
I
LOAD
1500
31151 G14
2000
Combined VCC/PVCC Supply
Current vs Temperature Output Voltage Load Regulation
12.0
11.9
11.8
11.7
11.6
11.5
CURRENT (mA)
11.4
CC
/PV
11.3
CC
V
11.2
11.1
11.0
–50
0
50
TEMPERATURE (°C)
VIN = 6V
= 5V
V
OUT
= 1MHz
f
SW
100
150
Current vs Switching Frequency
30
25
20
CURRENT (mA)
15
CC
/PV
10
CC
V
5
0
0
0.4
0.3
0.2
0.1
0
–0.1
–0.2
–0.3
–0.4
–0.5
0
500 1000 2000
SWITCHING FREQUENCY (kHz)
0.5
VIN = 36V
= 24V
V
OUT
1
LOAD CURRENT (A)
VIN = 12V
V
OUT
1500
1.5
(TA = 25°C unless otherwise specified)
Combined VCC/PVCC Supply
= 5V
Current vs V
14
12
10
8
CURRENT (mA)
CC
6
/PV
CC
4
V
2
0
2.5
CC
fSW = 1MHz
fSW = 500kHz
3 3.5 4.5
4
VCC (V)
Output Voltage Line Regulation
0.5
0.4
= 20V (%)
IN
0.3
0.2
0.1
0
–0.1
–0.2
–0.3
–0.4
–0.5
CHANGE IN OUTPUT VOLTAGE FROM V
2
0
10
20
INPUT VOLTAGE (V)
5
5.5
31151 G16
30
40
31151 G19
VCC Voltage vs Temperature
0.8
0.6
0.4
0.2
0
–0.2
–0.4
CHANGE FROM 25°C (%)
–0.6
–0.8
–1.0
–50
0
TEMPERATURE (°C)
50
100
150
VCC Regulator Load Regulation
–0.5
CC
–1.0
–1.5
–2.0
–2.5
10
0
20
ICC (mA)
30
For more information www.analog.com
VCC Regulator Line Regulation
0.8
0.6
0.4
0.2
IN
0
–0.2
–0.4
–0.6
–0.8
–1.0
40
50
31151 G21
0
10
20
INPUT VOLTAGE (V)
30
40
31151 G22
Rev. C
7
Page 8
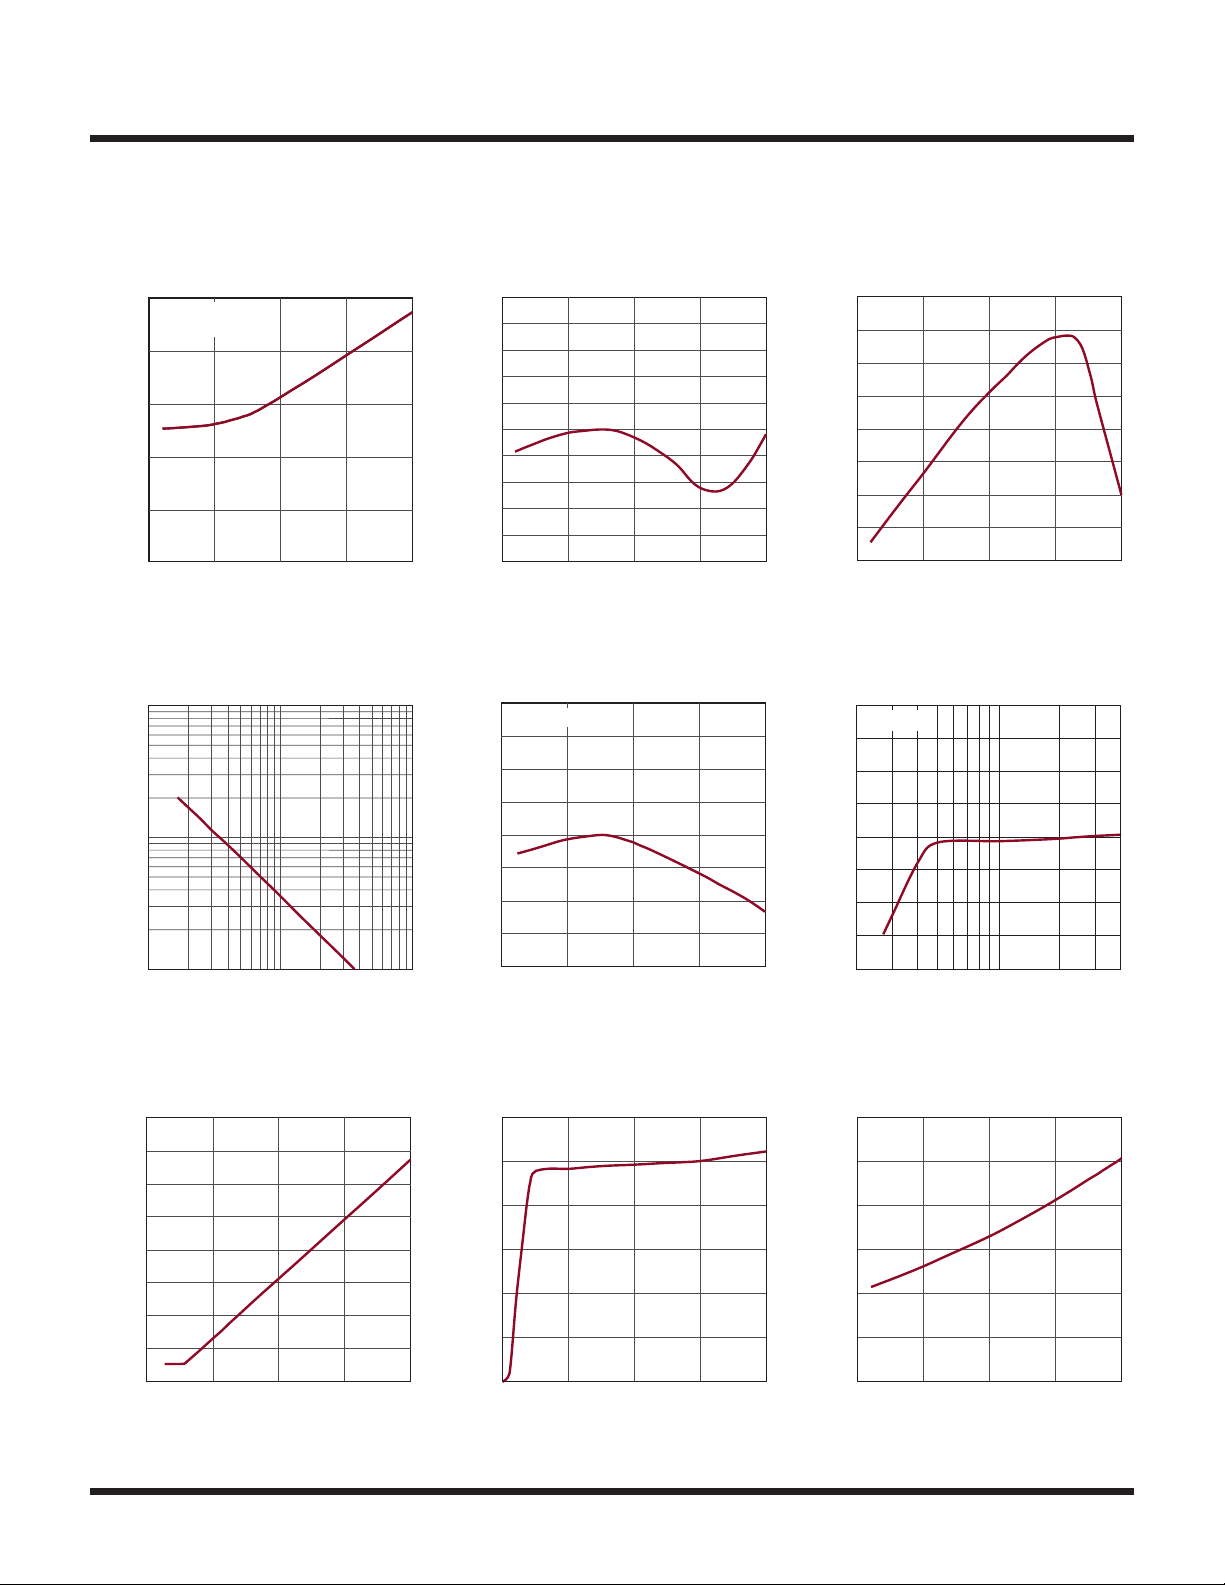
LTC3115-1
CHANGE FROM 25°C (%)
1.0
31151 G24
2.0
31151 G26
31151 G28
CURRENT INTO RUN PIN (µA)
31151 G29
COMBINED V
/PV
CURRENT (µA)
3.0
31151 G31
TYPICAL PERFORMANCE CHARACTERISTICS
VCC Regulator Dropout Voltage
vs Temperature
0.25
VIN = 4V
= 20mA
I
VCC
0.20
0.15
0.10
DROPOUT VOLTAGE (V)
0.05
0
–50
0
50
TEMPERATURE (°C)
Oscillator Frequency vs R
10000
1000
SWITCHING FREQUENCY (kHz)
100
10
100 1000
RT (kΩ)
100
150
31151 G23
T
RUN Pin Threshold
vs Temperature
0.8
0.6
0.4
0.2
0
–0.2
–0.4
–0.6
–0.8
–1.0
–50
0
TEMPERATURE (°C)
Oscillator Frequency
vs Temperature
2.0
fSW = 1MHz
1.5
1.0
0.5
0
–0.5
CHANGE FROM 25°C (%)
–1.0
–1.5
–2.0
–50
0
TEMPERATURE (°C)
50
50
100
100
(TA = 25°C unless otherwise specified)
RUN Pin Hysteresis Current
vs Temperature
1.5
1.0
0.5
0
–0.5
CHANGE FROM 25°C (%)
–1.0
–1.5
150
–2.0
–50
0
50
TEMPERATURE (°C)
Oscillator Frequency vs VIN
2.0
fSW = 1MHz
1.5
1.0
0.5
= 24V (%)
IN
0
–0.5
–1.0
CHANGE FROM V
–1.5
150
31151 G27
–2.0
2
10 40
VIN (V)
100
150
31151 G25
RUN Pin Current
vs RUN Pin Voltage
7
V
IN
6
5
4
3
2
1
0
–1
0
8
= 40V
10
RUN PIN VOLTAGE (V)
20
Shutdown Current on VIN/PVIN
vs Input Voltage
V
= 0V
RUN
2.5
2.0
IN
1.5
IN
1.0
0.5
30
40
0
0
10 20 30 40
INPUT VOLTAGE (V)
31151 G30
Power Switch Resistance
vs Temperature
300
250
200
150
100
50
POWER SWITCH (A-D) RESISTANCE (mΩ)
0
–50
0 50 100 150
TEMPERATURE (°C)
Rev. C
For more information www.analog.com
Page 9

LTC3115-1
CHANGE FROM 25°C (%)
5
31151 G34
31151 G35
MINIMUM LOW TIME (ns)
200
MINIMUM LOW TIME (ns)
MAXIMUM DUTY CYCLE (%)
31151 G32
31151 G33
DIE TEMPERATURE CHANGE FROM AMBIENT (°C)
31151 G49
DIE TEMPERATURE CHANGE FROM AMBIENT (°C)
2
31151 G50
TYPICAL PERFORMANCE CHARACTERISTICS
Power Switch Resistance
vs V
CC
170
165
160
155
150
145
POWER SWITCH (A-D) RESISTANCE (mΩ)
140
2.5
3.5 4 4.5
3
VCC (V)
SW1, SW2 Minimum Low Time
vs Temperature
110
fSW = 1MHz
108
NO LOAD
106
104
102
100
98
96
MINIMUM LOW TIME (ns)
94
92
90
–50
0
50
TEMPERATURE (°C)
100
5 5.5
150
FB Voltage vs Temperature
1.0
0.8
0.6
0.4
0.2
0
–0.2
–0.4
CHANGE FROM 25°C (%)
–0.6
–0.8
–1.0
–50
0
50
TEMPERATURE (°C)
SW1, SW2 Minimum Low Time
vs V
180
160
140
120
100
CC
fSW = 300kHz
fSW = 1MHz
80
60
2.5
3
fSW = 2MHz
3.5 4 4.5
VCC (V)
100
(TA = 25°C unless otherwise specified)
Inductor Current Limit Thresholds
vs Temperature
4
3
SWA
CURRENT
LIMIT
SWB
CURRENT
LIMIT
50
150
2
1
0
–1
–2
–3
–4
–5
–50
0
TEMPERATURE (°C)
SW1, SW2 Minimum Low Time
vs Switching Frequency
180
160
5 5.5
31151 G36
140
120
100
VCC = 4.4V
80
60
500 1000 2000
0
SWITCHING FREQUENCY (kHz)
VCC = 2.7V
100
1500
150
31151 G37
SW2 Maximum Duty Cycle
vs Switching Frequency
95
94
93
92
91
90
500
0
SWITCHING FREQUENCY (kHz)
1000
Die Temperature Rise vs Load
Current, V
60
50
40
30
20
10
0
1500
2000
31151 G38
0
For more information www.analog.com
= 5V, fSW = 750kHz
OUT
VIN = 36V
= 24V
V
IN
= 12V
V
IN
= 6V
V
IN
= 3.6V
V
IN
STANDARD DEMO PCB
L = 15µH MSS1048
0.5 1 1.5 2
LOAD CURRENT (A)
Die Temperature Rise vs Load
Current, V
100
90
80
70
60
50
40
30
20
10
0
0
= 5V, fSW = 1.5MHz
OUT
VIN = 36V
= 24V
V
IN
= 12V
V
IN
= 6V
V
IN
= 3.6V
V
IN
STANDARD DEMO PCB
L = 15µH MSS1048
0.5 1 1.5
LOAD CURRENT (A)
Rev. C
9
Page 10
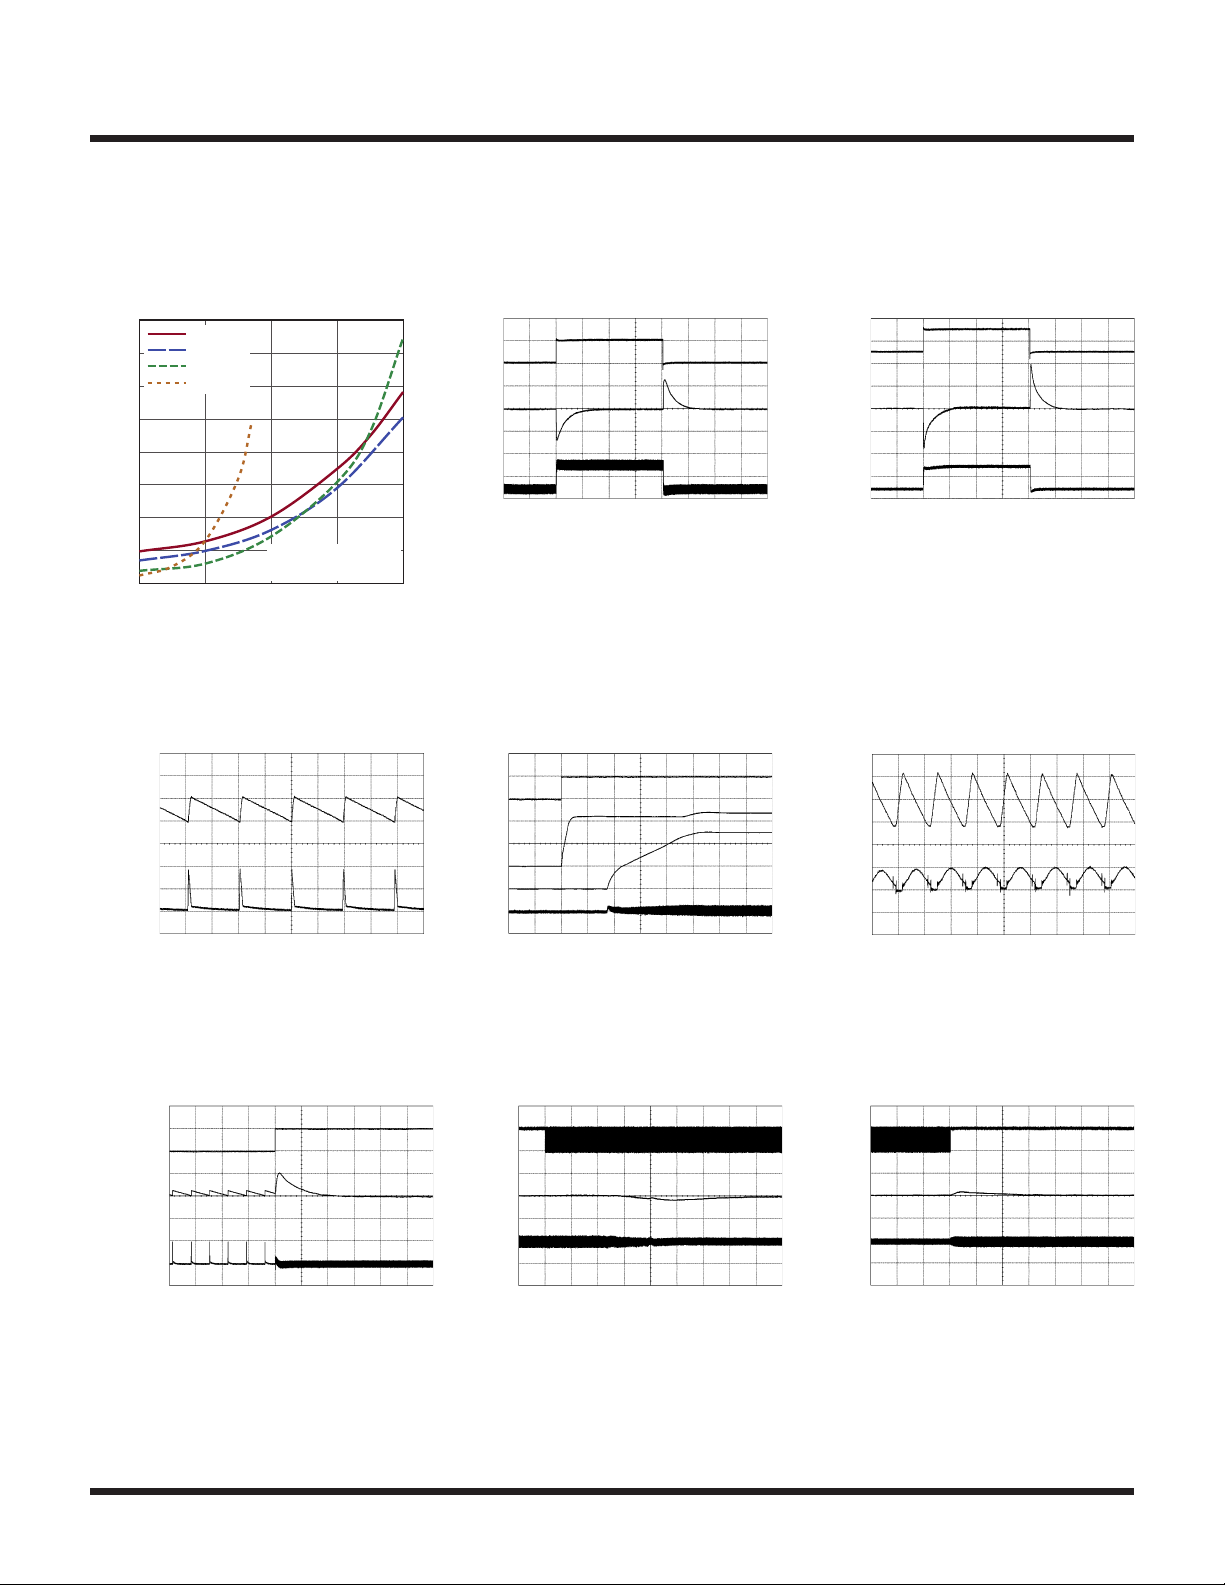
LTC3115-1
APPLICATION
31151 G42
INDUCTOR
(200mV/DIV)
APPLICATION
31151 G44
DIE TEMPERATURE CHANGE FROM AMBIENT (°C)
80
2
31151 G51
TYPICAL PERFORMANCE CHARACTERISTICS
Die Temperature Rise vs Load
Current, V
70
60
50
40
30
20
10
0
0
= 12V, fSW = 750kHz
OUT
VIN = 36V
= 24V
V
IN
= 12V
V
IN
= 6V
V
IN
STANDARD DEMO PCB
L = 15µH MSS1048
0.5 1 1.5
LOAD CURRENT (A)
Output Voltage Ripple in
Burst Mode Operation,
VIN = 24V, V
OUT
= 5V
CURRENT
(200mV/DIV)
INDUCTOR
CURRENT
Load Transient (0A to 1A),
VIN = 24V, V
LOAD
(1A/DIV)
V
OUT
(1A/DIV)
FRONT PAGE
APPLICATION
Soft-Start Waveforms
= 5V
OUT
200µs/DIV
(TA = 25°C unless otherwise specified)
Load Transient (0A to 1A),
31151 G39
LOAD
CURRENT
(1A/DIV)
V
OUT
(200mV/DIV)
INDUCTOR
CURRENT
(2A/DIV)
VIN = 3.6V, V
FRONT PAGE
APPLICATION
= 5V
OUT
200µs/DIV
Output Voltage Ripple in PWM
Mode, VIN = 24V, V
OUT
31151 G40
= 5V
V
RUN
V
OUT
(50mV/DIV)
INDUCTOR
CURRENT
(0.5A/DIV)
L = 15µH
C
= 22µF
OUT
= 25mA
I
LOAD
20µs/DIV
31151 G41
Burst Mode Operation to PWM
Mode Output Voltage Transient
V
PWM/SYNC
(5V/DIV)
V
OUT
INDUCTOR
CURRENT
(1A/DIV)
FRONT PAGE
500µs/DIV
(5V/DIV)
V
CC
(2V/DIV)
V
OUT
(2V/DIV)
CURRENT
(1A/DIV)
V
PWM/SYNC
(5V/DIV)
V
OUT
(200mV/DIV)
INDUCTOR
CURRENT
(1A/DIV)
FRONT PAGE
2ms/DIV
Phase-Locked Loop Acquisition,
VIN = 24V 1.2MHz Clock
FRONT PAGE
APPLICATION
50µs/DIV
31151 G45
INDUCTOR
CURRENT
(100mA/DIV)
V
OUT
(5mV/DIV)
V
PWM/SYNC
(5V/DIV)
V
OUT
(200mV/DIV)
INDUCTOR
CURRENT
(1A/DIV)
L = 22µH
C
= 22µF
OUT
= 2A
I
LOAD
= 750kHz
f
SW
1µs/DIV
Phase-Locked Loop Release,
VIN = 24V, 1.2MHz Clock
FRONT PAGE
APPLICATION
50µs/DIV
31151 G43
31151 G46
10
Rev. C
For more information www.analog.com
Page 11

LTC3115-1
PIN FUNCTIONS
RUN (Pin 1/Pin 2): Input to Enable and Disable the IC and
Set Custom Input UVLO Thresholds. The RUN pin can be
driven by an external logic signal to enable and disable
the IC. In addition, the voltage on this pin can be set by
a resistor divider connected to the input voltage in order
to provide an accurate undervoltage lockout threshold.
The IC is enabled if RUN exceeds 1.21V nominally. Once
enabled, a 0.5µA current is sourced by the RUN pin to provide hysteresis. To continuously enable the IC, this pin can
be tied directly to the input voltage. The RUN pin cannot
be forced more than 0.3V above VIN under any condition.
SW2 (Pin 2/Pin 3): Buck-Boost Converter Power Switch
Pin. This pin should be connected to one side of the buckboost inductor.
PV
(Pin 3/Pin 4): Buck-Boost Converter Power Output.
OUT
This pin should be connected to a low ESR capacitor with
a value of at least 10µF. The capacitor should be placed as
close to the IC as possible and should have a short return
path to ground. In applications with V
subject to output overload or short-circuit conditions, it
is recommended that a Schottky diode be installed from
SW2 (anode) to PV
to output short circuits through an inductive load, it is rec
ommended that a Schottky diode be installed from ground
(anode) to PV
is driven below ground during the short-circuit transient.
GND (Pins 4, 5/Pins 5, 6): Signal Ground. These pins are
the ground connections for the control circuitry of the IC
and must be tied to ground in the application.
VC (Pin 6/Pin 7): Error Amplifier Output. A frequency
compensation network must be connected between this
pin and FB to stabilize the voltage control loop.
FB (Pin 7/Pin 8): Feedback Voltage Input. A resistor
divider connected to this pin sets the output voltage
for the buck-boost converter. The nominal FB voltage is
1000mV. Care should be taken in the routing of connections to this pin in order to minimize stray coupling to the
switch pin traces.
RT (Pin 8/Pin 9): Oscillator Frequency Programming Pin.
A resistor placed between this pin and ground sets the
switching frequency of the buck-boost converter.
OUT
(cathode) to limit the extent that PV
OUT
(DHD/FE)
> 20V that are
OUT
(cathode). In applications subject
-
OUT
VCC (Pin 9/Pin 12): Low Voltage Supply Input for IC
Control Circuitry. This pin powers internal IC control circuitry and must be connected to the PVCC pin in the application. A 4.7µF or larger bypass capacitor should be connected between this pin and ground. The VCC and PVCC
pins must be connected together in the application.
VIN (Pin 10/Pin 13): Power Supply Connection for Internal
Circuitry and the VCC Regulator. This pin provides power
to the internal VCC regulator and is the input voltage sense
connection for the VIN divider. A 0.1µF bypass capacitor
should be connected between this pin and ground. The
bypass capacitor should be located as close to the IC as
possible and should have a short return path to ground.
PVCC (Pin 11/Pin 14): Internal VCC Regulator Output. This
pin is the output pin of the internal linear regulator that
generates the VCC rail from VIN. The PVCC pin is also the
supply connection for the power switch gate drivers. If
the trace connecting PVCC to VCC cannot be made short
in length, an additional bypass capacitor should be connected between this pin and ground. The VCC and PVCC
pins must be connected together in the application.
BST2 (Pin 12/Pin 15): Flying Capacitor Pin for SW2. This
pin must be connected to SW2 through a 0.1µF capacitor.
This pin is used to generate the gate drive rail for power
switch D.
BST1 (Pin 13/Pin 16): Flying Capacitor Pin for SW1. This
pin must be connected to SW1 through a 0.1µF capacitor.
This pin is used to generate the gate drive rail for power
switch A.
PVIN (Pin 14/Pin 17): Power Input for the Buck-Boost
Converter. A 4.7µF or larger bypass capacitor should
be connected between this pin and ground. The bypass
capacitor should be located as close to the IC as possible
and should via directly down to the ground plane. When
powered through long leads or from a high ESR power
source, a larger bulk input capacitor (typically 47µF to
100µF) may be required.
SW1 (Pin 15/Pin 18): Buck-Boost Converter Power
Switch Pin. This pin should be connected to one side of
the buck-boost inductor.
For more information www.analog.com
Rev. C
11
Page 12
LTC3115-1
PIN FUNCTIONS
(DHD/FE)
PWM/SYNC (Pin 16/Pin 19): Burst Mode/PWM Mode
Control Pin and Synchronization Input. Forcing this pin
high causes the IC to operate in fixed frequency PWM
mode at all loads using the internal oscillator at the frequency set by the RT Pin. Forcing this pin low places the
IC into Burst Mode operation for improved efficiency at
light load and reduced standby current. If an external clock
signal is connected to this pin, the buck-boost converter
will synchronize its switching with the external clock
using fixed frequency PWM mode operation. The pulse
width (negative or positive) of the applied clock should
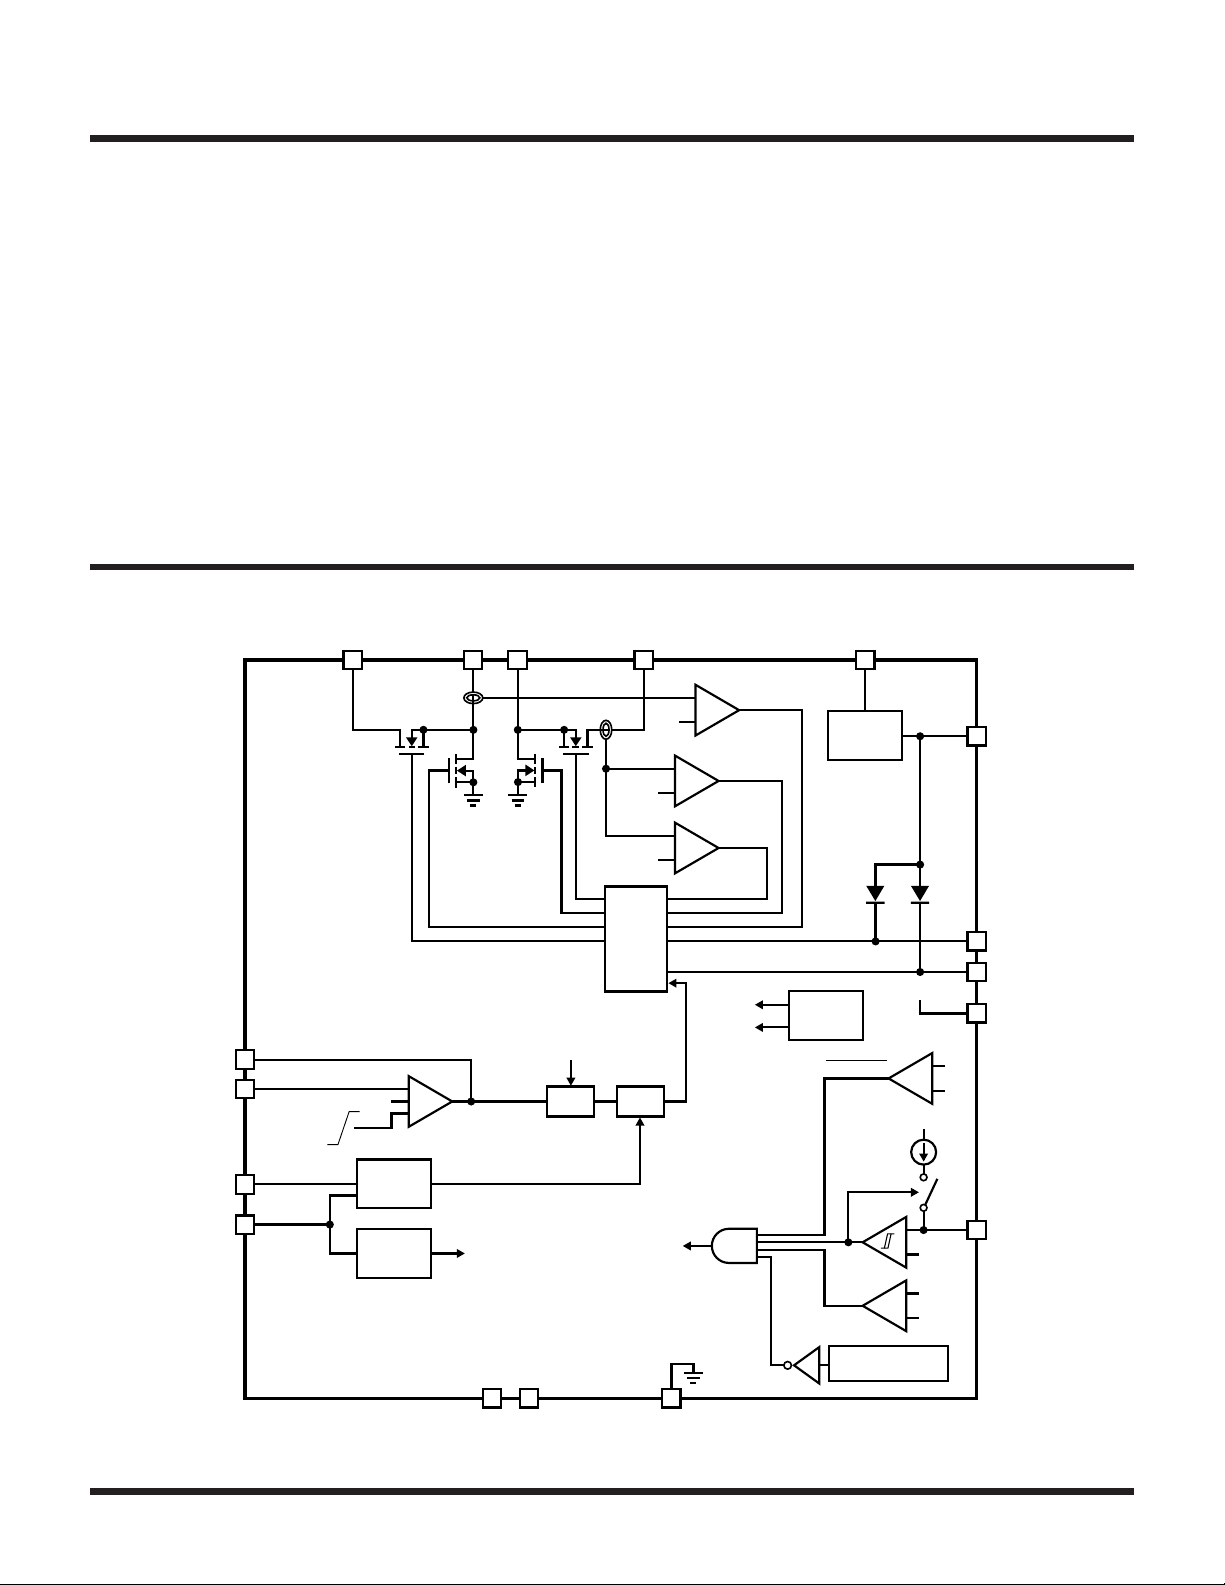
BLOCK DIAGRAM
Pin numbers are shown for the DHD package only.
2
14
PV
IN
15
PGND
SW1
SW2
DA
CB
PGND
be at least 100ns. The maximum operating voltage for the
PWM/SYNC pin is 5.5V. The PWM/SYNC pin can be connected to VCC to force it high continuously.
PGND (Exposed Pad Pin 17/Pins 1, 10, 11, 20, Exposed
Pad Pin 21): Power Ground Connections. These pins
should be connected to the power ground in the application. The exposed pad is the power ground connection. It
must be soldered to the PCB and electrically connected
to ground through the shortest and lowest impedance
connection possible and to the PCB ground plane for
rated thermal performance.
–1.5A
3
PV
OUT
3A
+
+
–
CURRENT
LIMIT
REVERSE
CURRENT
LIMIT
–
ZERO
CURRENT
+
0A
–
10
V
REVERSE
BLOCKING
LDO
IN
PVCC*
11
DRIVES
VC
6
FB
7
SOFT-START
RT
8
PWM/SYNC
16
AND VCC MUST BE CONNECTED TOGETHER IN THE APPLICATION
*PV
CC
THE EXPOSED PAD IS AN ELECTRICAL CONNECTION AND MUST BE SOLDERED
TO THE BOARD AND ELECTRICALLY CONNECTED TO GROUND
1000mV
RAMP
OSCILLATOR
MODE
SELECTION
–
+
+
BURST/PWM
(PWM MODE IF PWM/SYNC
IS HIGH OR SWITCHING)
GND
5
GND
V
IN
÷
EXPOSED
GATE
PWM
CHIP
ENABLE
PAD
BST2
12
BST1
13
V
CC
*
V
1.21V
1000mV
PGND
174
BANDGAP
REFERENCE
INPUT UVLO
UVLO
OVERTEMPERATURE
CC
9
V
+
IN
2.4V
–
V
IN
0.5µA
RUN
+
–
+
–
1.21V
V
CC
2.4V
1
3115 BD
Rev. C
12
For more information www.analog.com
Page 13
OPERATION
LTC3115-1
INTRODUCTION
The LTC3115-1 is a monolithic buck-boost converter
that can operate with input and output voltages from as
low as 2.7V to as high as 40V. Four internal low resistance N-channel DMOS switches minimize the size of the
application circuit and reduce power losses to maximize
efficiency. Internal high side gate drivers, which require
only the addition of two small external capacitors, further
simplify the design process. A proprietary switch control
algorithm allows the buck-boost converter to maintain output voltage regulation with input voltages that are above,
below or equal to the output voltage. Transitions between
these operating modes are seamless and free of transients
and subharmonic switching. The LTC3115-1 can be configured to operate over a wide range of switching frequencies, from 100kHz to 2MHz, allowing applications to be
optimized for board area and efficiency. With its configurability and wide operating voltage range, the LTC3115-1 is
ideally suited to a wide range of power systems especially
those requiring compatibility with a variety of input power
sources such as lead-acid batteries, USB ports, and industrial supply rails as well as from power sources which have
wide or poorly controlled voltage ranges such as FireWire
and unregulated wall adapters.
The LTC3115-1 has an internal fixed-frequency oscillator
with a switching frequency that is easily set by a single
external resistor. In noise sensitive applications, the converter can also be synchronized to an external clock via
the PWM/SYNC pin. The LTC3115-1 has been optimized
to reduce input current in shutdown and standby for applications which are sensitive to quiescent current draw,
such as battery-powered devices. In Burst Mode operation, the no-load standby current is only 50µA (typical)
and in shutdown the total supply current is reduced to
3µA (typical).
fixed-frequency switching spectrum. A proprietary switching algorithm provides seamless transitions between
operating modes and eliminates discontinuities in the
average inductor current, inductor current ripple, and
loop transfer function throughout all regions of operation.
These advantages result in increased efficiency, improved
loop stability, and lower output voltage ripple in comparison to the traditional 4-switch buck-boost converter.
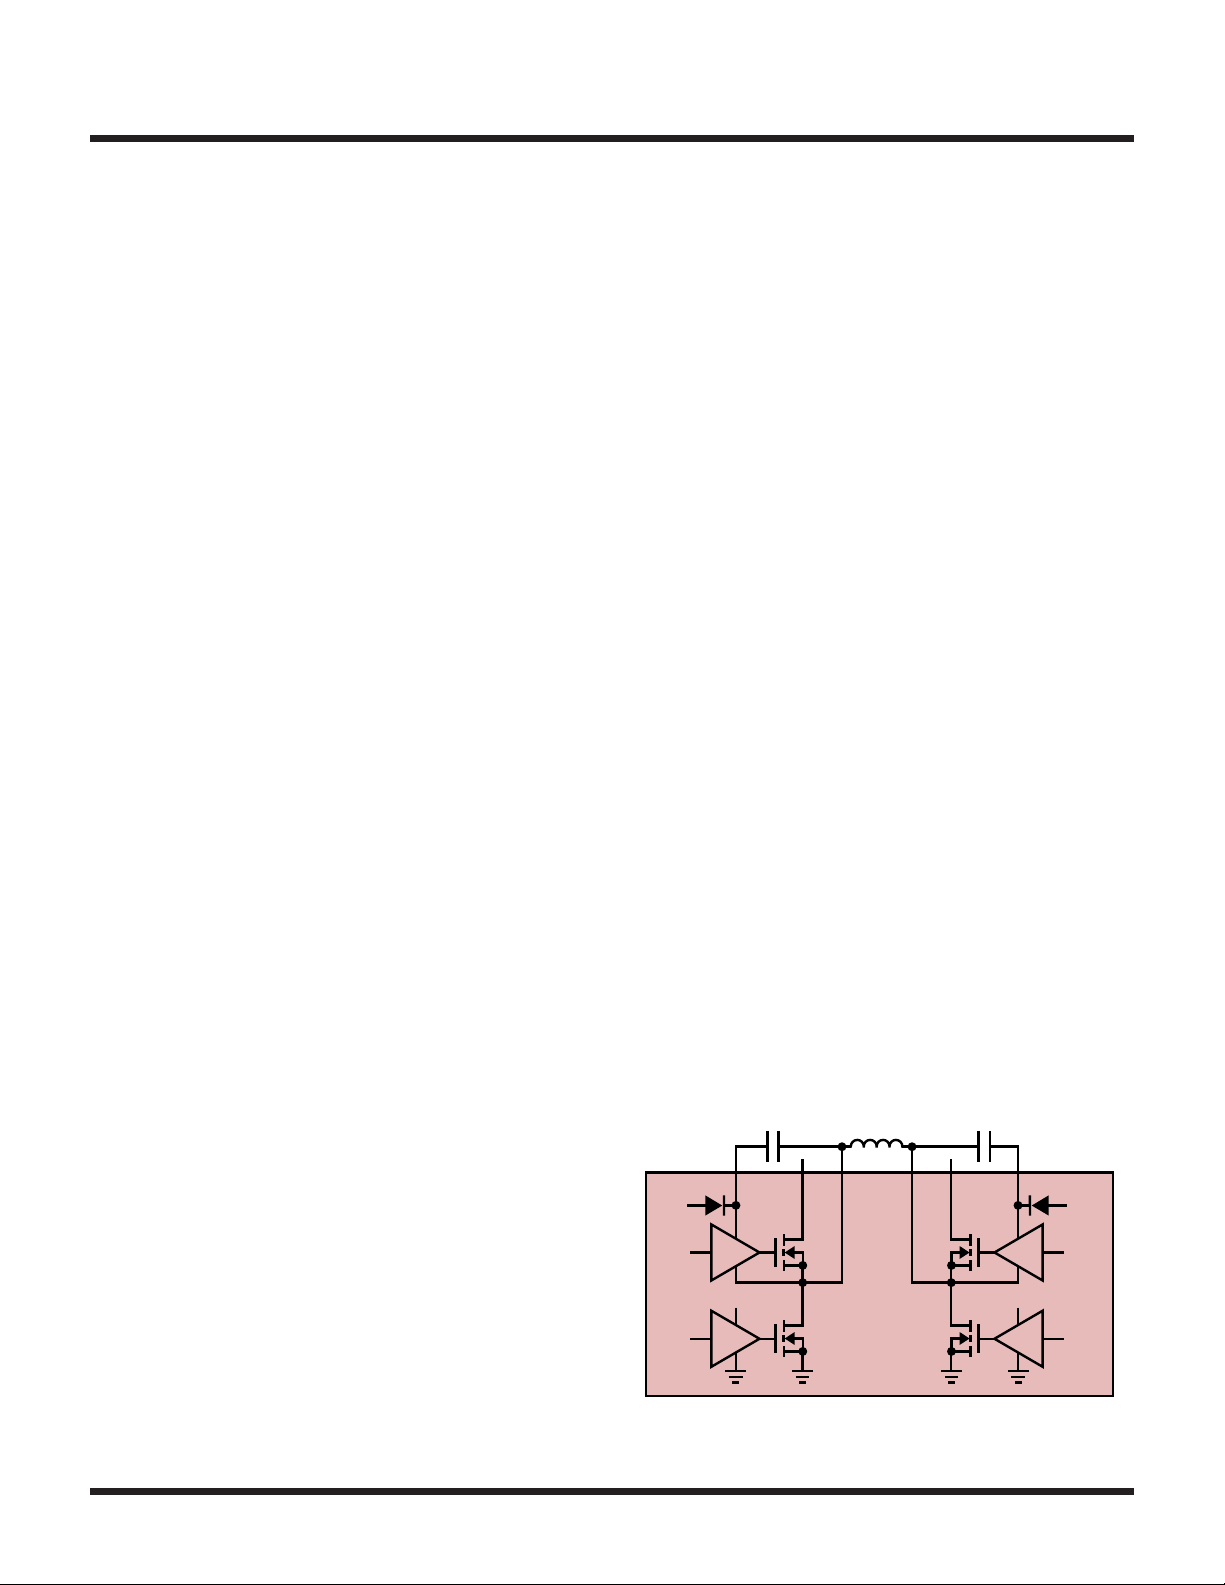
Figure1 shows the topology of the LTC3115-1 power stage
which is comprised of four N-channel DMOS switches and
their associated gate drivers. In PWM mode operation
both switch pins transition on every cycle independent
of the input and output voltage. In response to the error
amplifier output, an internal pulse width modulator generates the appropriate switch duty cycles to maintain regulation of the output voltage.
When stepping down from a high input voltage to a lower
output voltage, the converter operates in buck mode and
switch D remains on for the entire switching cycle except
for the minimum switch low duration (typically 100ns).
During the switch low duration switch C is turned on which
forces SW2 low and charges the flying capacitor, C
BST2
, to
ensure that the voltage of the switch D gate driver supply
rail is maintained. The duty cycle of switches A and B are
adjusted to provide the appropriate buck mode duty cycle.
If the input voltage is lower than the output voltage, the
converter operates in boost mode. Switch A remains on
for the entire switching cycle except for the minimum
switch low duration (typically 100ns) while switches C
and D are modulated to maintain the required boost mode
C
BST1
BST1
PV
CC
L
SW1 SW2
IN
C
BST2
OUT
BST2PV
PV
CC
PV
PWM MODE OPERATION
With the PWM/SYNC pin forced high or driven by an external clock, the LTC3115-1 operates in a fixed-frequency
pulse width modulation (PWM) mode using a voltage
mode control loop. This mode of operation maximizes
the output current that can be delivered by the converter,
reduces output voltage ripple, and yields a low noise
For more information www.analog.com
A
PV
CC
PGND PGND
Figure1. Power Stage Schematic
LTC3115-1
B
D
C
PV
CC
31151 F01
Rev. C
13
Page 14
LTC3115-1
OPERATION
duty cycle. The minimum switch low duration ensures
that flying capacitor C
is charged sufficiently to main
BST1
-
tain the voltage on the BST1 rail.
Oscillator and Phase-Locked Loop
The LTC3115-1 operates from an internal oscillator with a
switching frequency that is configured by a single external
resistor between the RT pin and ground. For noise sensitive applications, an internal phase-locked loop allows
the LTC3115-1 to be synchronized to an external clock
signal applied to the PWM/SYNC pin. The phase-locked
loop is only able to increase the frequency of the internal
oscillator to obtain synchronization. Therefore, the RT
resistor must be chosen to program the internal oscillator to a lower frequency than the frequency of the clock
applied to the PWM/SYNC pin. Sufficient margin must
be included to account for the frequency variation of the
external synchronization clock as well as the worst-case
variation in frequency of the internal oscillator. Whether
operating from its internal oscillator or synchronized to
an external clock signal, the LTC3115-1 is able to operate
with a switching frequency from 100kHz to 2MHz, providing the ability to minimize the size of the external components and optimize the power conversion efficiency.
Error Amplifier and VIN Divider
The LTC3115-1 has an internal high gain operational
amplifier which provides frequency compensation of the
control loop that maintains output voltage regulation. To
ensure stability of this control loop, an external compensation network must be installed in the application circuit.
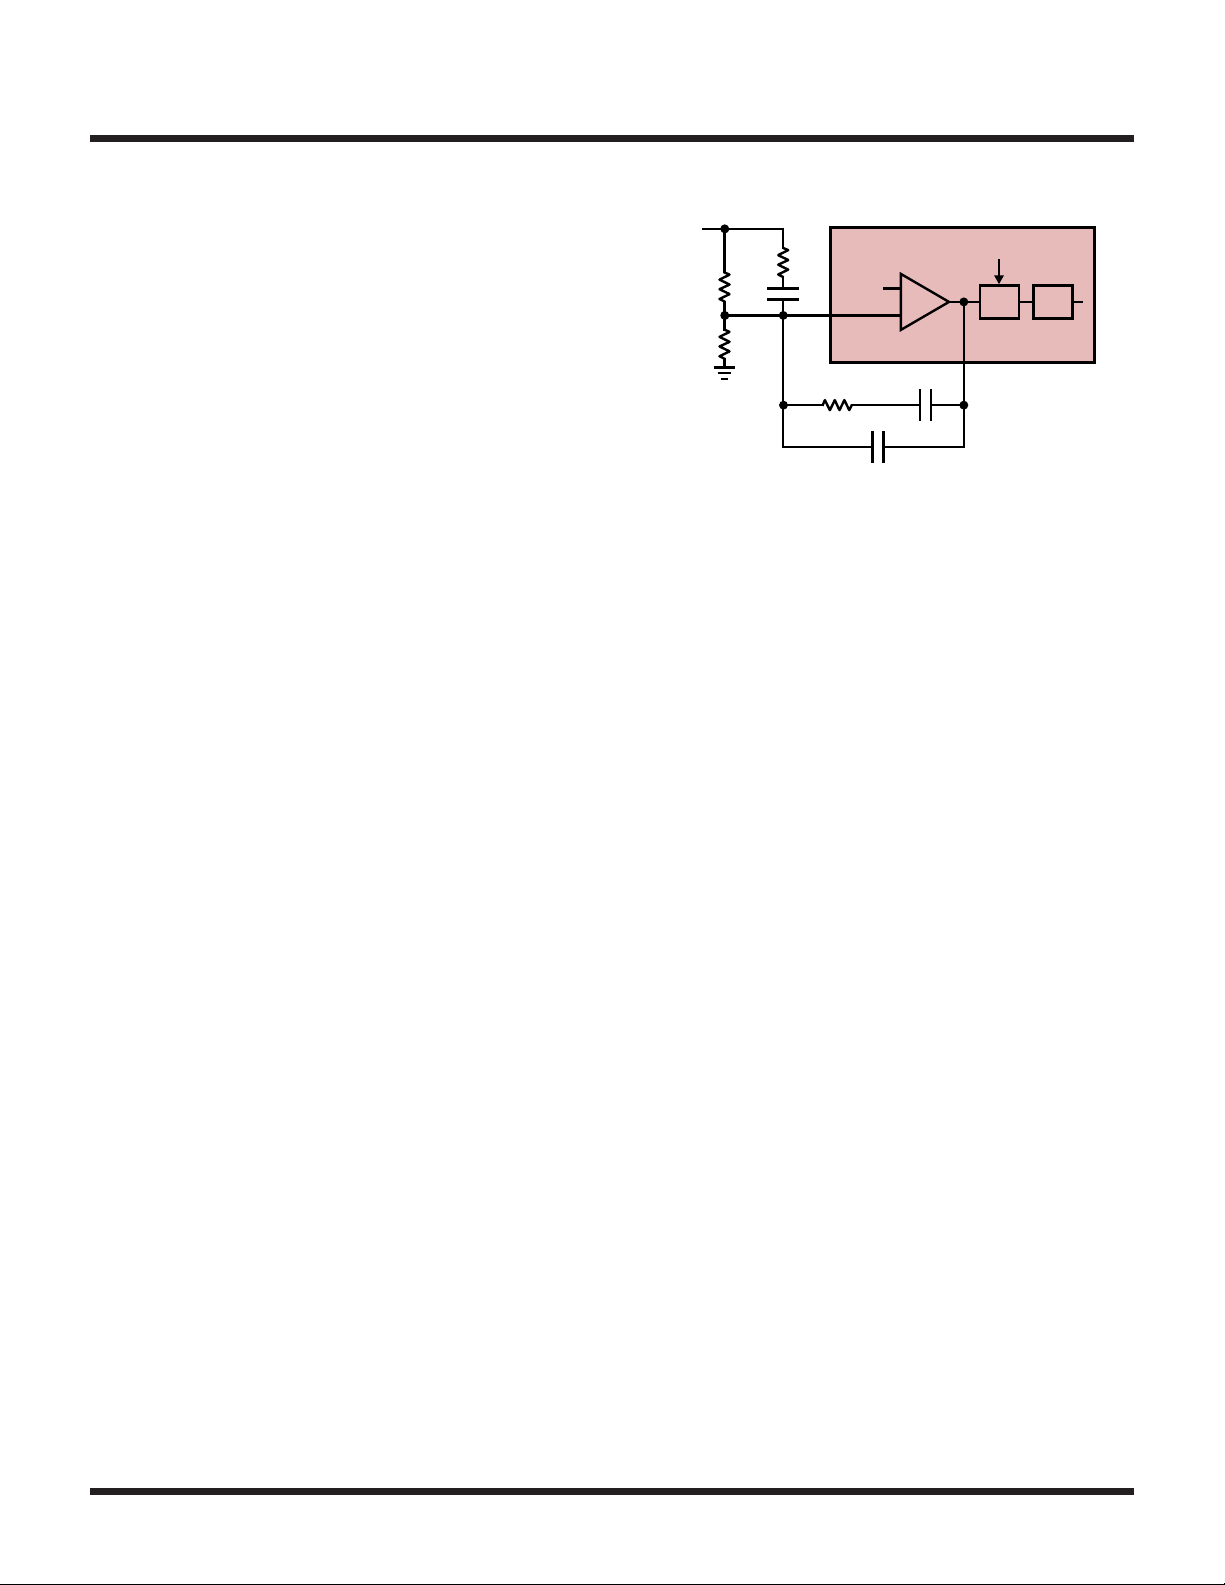
A Type III compensation network as shown in Figure2 is
recommended for most applications since it provides the
flexibility to optimize the converter’s transient response
while simultaneously minimizing any DC error in the output voltage.
As shown in Figure2, the error amplifier is followed by
an internal analog divider which adjusts the loop gain by
the reciprocal of the input voltage in order to minimize
loop-gain variation over changes in the input voltage.
This simplifies design of the compensation network and
optimizes the transient response over the entire range of
input voltages. Details on designing the compensation
V
OUT
R
TOP
R
BOT
Figure2. Error Amplifier and Compensation Network
LTC3115-1
R
FF
1000mV
C
FF
FB
R
FB
C
POLE
+
–
C
FB
V
IN
÷ PWM
VC
31151 F02
network in LTC3115-1 applications can be found in the
Applications Information section of this data sheet.
Inductor Current Limits
The LTC3115-1 has two current limit circuits that are
designed to limit the peak inductor current to ensure that
the switch currents remain within the capabilities of the IC
during output short-circuit or overload conditions. The primary inductor current limit operates by injecting a current
into the feedback pin which is proportional to the extent
that the inductor current exceeds the current limit threshold (typically 3A). Due to the high gain of the feedback
loop, this injected current forces the error amplifier output
to decrease until the average current through the inductor is approximately reduced to the current limit threshold. This current limit circuit maintains the error amplifier in an active state to ensure a smooth recovery and
minimal overshoot once the current limit fault condition
is removed. However, the reaction speed of this current
limit circuit is limited by the dynamics of the error amplifier. On a hard output short, it is possible for the inductor
current to increase substantially beyond the current limit
threshold before the average current limit has time to react
and reduce the inductor current. For this reason, there is a
second current limit circuit which turns off power switch
A if the current through switch A exceeds approximately
160% of the primary inductor current limit threshold. This
provides additional protection in the case of an instantaneous hard output short and provides time for the primary
current limit to react. In addition, if V
falls below 1.85V,
OUT
the inductor current limit is folded back to half its nominal
value in order to minimize power dissipation.
14
Rev. C
For more information www.analog.com
Page 15

OPERATION
LTC3115-1
Reverse Current Limit
In PWM mode operation, the LTC3115-1 synchronously
switches all four power devices. As a result, in addition to
being able to supply current to the output, the converter
has the ability to actively conduct current away from the
output if that is necessary to maintain regulation. If the
output is held above regulation, this could result in large
reverse currents. This situation can occur if the output
of the LTC3115-1 is held up momentarily by another
supply as may occur during a power-up or power-down
sequence. To prevent damage to the part under such conditions, the LTC3115-1 has a reverse current comparator
that monitors the current entering power switch D from
the load. If this current exceeds 1.5A (typical) switch D
is turned off for the remainder of the switching cycle in
order to prevent the reverse inductor current from reaching unsafe levels.
Output Current Capability
The maximum output current that can be delivered by the
LTC3115-1 is dependent upon many factors, the most
significant being the input and output voltages. For V
= 5V and VIN ≥ 3.6V, the LTC3115-1 is able to support
up to a 1A load continuously. For V
12V, the LTC3115-1 is able to support up to a 2A load
continuously. Typically, the output current capability is
greatest when the input voltage is approximately equal
to the output voltage. At larger step-up voltage ratios, the
output current capability is reduced because the lower
duty cycle of switch D results in a larger inductor current
being needed to support a given load. Additionally, the
output current capability generally decreases at large stepdown voltage ratios due to higher inductor current ripple
which reduces the maximum attainable inductor current.
The output current capability can also be affected by
inductor characteristics. An inductor with large DC resistance will degrade output current capability, particularly
in boost mode operation. Larger value inductors generally
maximize output current capability by reducing inductor current ripple. In addition, higher switching frequencies (especially above 750kHz) will reduce the maximum
output current that can be supplied (see the Typical
Performance Characteristics for details).
= 12V and VIN ≥
OUT
OUT
Burst Mode OPERATION
When the PWM/SYNC pin is held low, the buck-boost
converter employs Burst Mode operation using a variable frequency switching algorithm that minimizes the
no-load input quiescent current and improves efficiency
at light load by reducing the amount of switching to the
minimum level required to support the load. The output
current capability in Burst Mode operation is substantially
lower than in PWM mode and is intended to support light
standby loads (typically under 50mA). Curves showing
the maximum Burst Mode load current as a function of
the input and output voltage can be found in the Electrical
Characteristics section of this data sheet. If the converter
load in Burst Mode operation exceeds the maximum Burst
Mode current capability, the output will lose regulation.
Each Burst Mode cycle is initiated when switches A and
C turn on producing a linearly increasing current through
the inductor. When the inductor current reaches the Burst
Mode current limit (1A typically) switches B and D are
turned on, discharging the energy stored in the inductor
into the output capacitor and load. Once the inductor current reaches zero, all switches are turned off and the cycle
is complete. Current pulses generated in this manner are
repeated as often as necessary to maintain regulation of
the output voltage. In Burst Mode operation, the error
amplifier is not used but is instead placed in a low current
standby mode to reduce supply current and improve light
load efficiency.
SOFT-START
To minimize input current transients on power-up, the
LTC3115-1 incorporates an internal soft-start circuit with
a nominal duration of 9ms. The soft-start is implemented
by a linearly increasing ramp of the error amplifier reference voltage during the soft-start duration. As a result,
the duration of the soft-start period is largely unaffected
by the size of the output capacitor or the output regulation voltage. Given the closed-loop nature of the soft-start
implementation, the converter is able to respond to load
transients that occur during the soft-start interval. The
soft-start period is reset by thermal shutdown and UVLO
events on both VIN and VCC.
For more information www.analog.com
Rev. C
15
Page 16

LTC3115-1
5MΩ
OPERATION
VCC REGULATOR
An internal low dropout regulator generates the 4.45V
(nominal) VCC rail from VIN. The VCC rail powers the internal control circuitry and power device gate drivers of the
LTC3115-1. The VCC regulator is disabled in shutdown
to reduce quiescent current and is enabled by forcing
the RUN pin above its logic threshold. The VCC regulator includes current limit protection to safeguard against
short circuiting of the VCC rail. For applications where the
output voltage is set to 5V, the VCC rail can be driven from
the output rail through a Schottky diode. Bootstrapping in
this manner can provide a significant efficiency improvement, particularly at large voltage step down ratios, and
may also allow operation down to a lower input voltage.
The maximum operating voltage for the VCC pin is 5.5V.
When forcing VCC externally, care must be taken to ensure
that this limit is not exceeded.
UNDERVOLTAGE LOCKOUT
To eliminate erratic behavior when the input voltage is
too low to ensure proper operation, the LTC3115-1 incorporates internal undervoltage lockout (UVLO) circuitry.
There are two UVLO comparators, one that monitors VIN
and another that monitors VCC. The buck-boost converter
is disabled if either VIN or VCC falls below its respective
UVLO threshold. The input voltage UVLO comparator has
a falling threshold of 2.4V (typical). If the input voltage
falls below this level all switching is disabled until the
input voltage rises above 2.6V (nominal). The VCC UVLO
has a falling threshold of 2.4V. If VCC falls below this
threshold the buck-boost converter is prevented from
switching until VCC rises above 2.6V.
Depending on the particular application circuit it is possible that either of these UVLO thresholds could be the
factor limiting the minimum input operating voltage of
the LTC3115-1. The dominant factor depends on the voltage drop between VIN and VCC which is determined by
the dropout voltage of the VCC regulator and is proportional to the total load current drawn from VCC. The load
current on the VCC regulator is principally generated by
the gate driver supply currents which are proportional to
operating frequency and generally increase with larger
input and output voltages. As a result, at higher switching
frequencies and higher input and output voltages the VCC
regulator dropout voltage will increase, making it more
likely that the VCC UVLO threshold could become the limiting factor. Curves provided in the Typical Performance
Characteristics section of this data sheet show the typical
VCC current and can be used to estimate the VCC regulator
dropout voltage in a particular application. In applications
where VCC is bootstrapped (powered by V
auxiliary supply rail through a Schottky diode) the minimum input operating voltage will be limited only by the
input voltage UVLO threshold.
RUN PIN COMPARATOR
In addition to serving as a logic-level input to enable the
IC, the RUN pin features an accurate internal comparator allowing it to be used to set custom rising and falling
input undervoltage lockout thresholds with the addition
of an external resistor divider. When the RUN pin is driven
above its logic threshold (typically 0.8V) the VCC regulator
is enabled which provides power to the internal control
circuitry of the IC and the accurate RUN pin comparator
is enabled. If the RUN pin voltage is increased further
so that it exceeds the RUN comparator threshold (1.21V
nominal), the buck-boost converter will be enabled.
If the RUN pin is brought below the RUN comparator
threshold, the buck-boost converter will inhibit switching,
but the VCC regulator and control circuitry will remain
powered unless the RUN pin is brought below its logic
threshold. Therefore, in order to place the part in shutdown and reduce the input current to its minimum level
(3µA typical) it is necessary to ensure that the RUN pin
is brought below the worst-case logic threshold (0.3V).
The RUN pin is a high voltage input and can be connected
directly to VIN to continuously enable the part when the
input supply is present. If the RUN pin is forced above
approximately 5V it will sink a small current as given by
the following equation:
V
– 5V
I
RUN
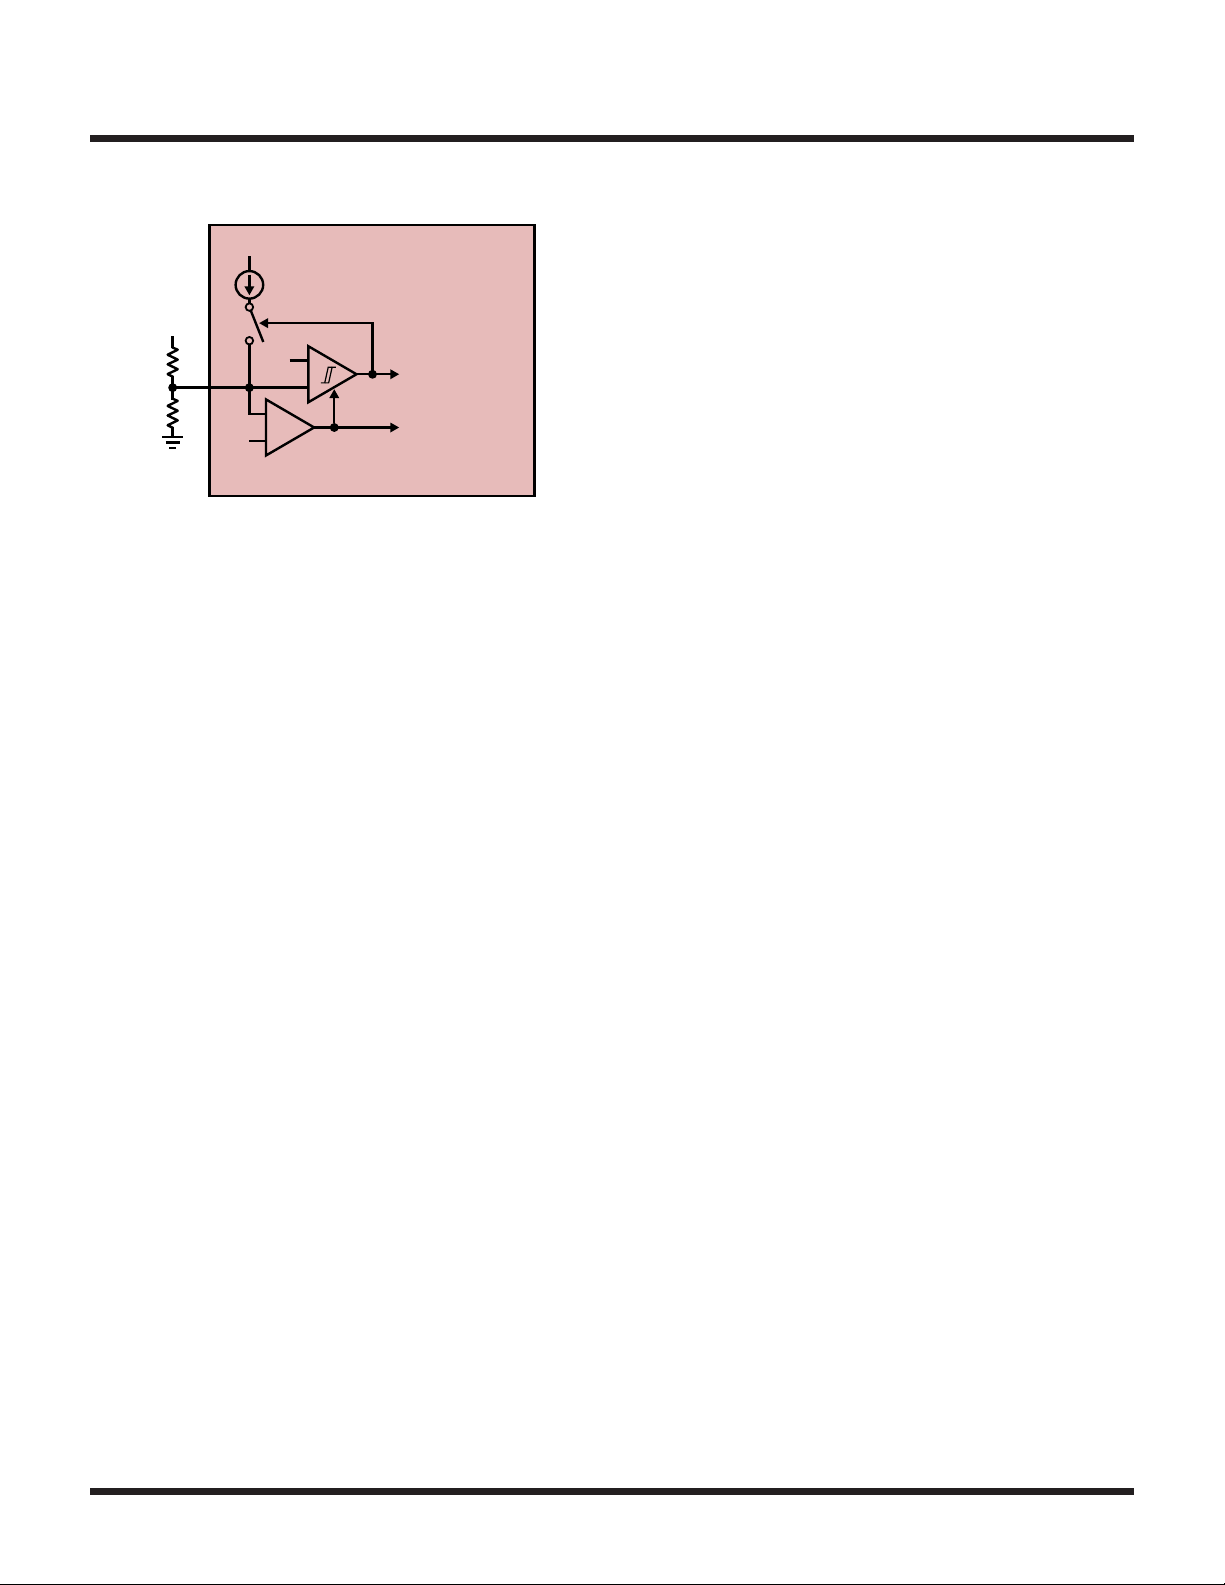
With the addition of an external resistor divider as shown
in Figure3, the RUN pin can be used to establish a custom
RUN
≅
or by an
OUT
16
Rev. C
For more information www.analog.com
Page 17
OPERATION
31151 F03
LTC3115-1
V
IN
0.5µA
V
IN
RUN
0.8V
1.21V
+
–
INPUT LOGIC
THRESHOLD
R1
R2
Figure3. Accurate RUN Pin Comparator
–
+
LTC3115-1
ENA
ENABLE
SWITCHING
ENABLE
V
REGULATOR AND
CC
CONTROL CIRCUITS
input undervoltage lockout threshold. The buck-boost converter is enabled when the RUN pin reaches 1.21V which
allows the rising UVLO threshold to be set via the resistor divider ratio. Once the RUN pin reaches the threshold
voltage, the comparator switches and the buck-boost
converter is enabled. In addition, an internal 0.5µA (typical) current source is enabled which sources current out
of the RUN pin raising the RUN pin voltage away from
the threshold. In order to disable the part, VIN must be
reduced sufficiently to overcome the hysteresis generated
by this current as well as the 100mV hysteresis of the
RUN comparator. As a result, the amount of hysteresis can
be independently programmed without affecting the rising
UVLO threshold by scaling the values of both resistors.
THERMAL CONSIDERATIONS
The power switches in the LTC3115-1 are designed to
operate continuously with currents up to the internal current limit thresholds. However, when operating at high
current levels there may be significant heat generated
within the IC. In addition, in many applications the VCC
regulator is operated with large input-to-output voltage
differentials resulting in significant levels of power dissipation in its pass element which can add significantly to
the total power dissipated within the IC. As a result, careful consideration must be given to the thermal environment of the IC in order to optimize efficiency and ensure
that the LTC3115-1 is able to provide its full-rated output
current. Specifically, the exposed die attach pad of both
the DHD and FE packages should be soldered to the PC
board and the PC board should be designed to maximize
the conduction of heat out of the IC package. This can be
accomplished by utilizing multiple vias from the die attach
pad connection to other PCB layers containing a large area
of exposed copper.
If the die temperature exceeds approximately 165°C, the
IC will enter overtemperature shutdown and all switching
will be inhibited. The part will remain disabled until the
die cools by approximately 10°C. The soft-start circuit is
re-initialized in overtemperature shutdown to provide a
smooth recovery when the fault condition is removed.
For more information www.analog.com
Rev. C
17
Page 18

LTC3115-1
OUT
APPLICATIONS INFORMATION
The standard LTC3115-1 application circuit is shown
as the typical application on the front page of this data
sheet. The appropriate selection of external components is
dependent upon the required performance of the IC in each
particular application given considerations and trade-offs
such as PCB area, cost, output and input voltage, allowable
ripple voltage, efficiency and thermal considerations. This
section of the data sheet provides some basic guidelines
and considerations to aid in the selection of external components and the design of the application circuit.
VCC Capacitor Selection
The VCC output on the LTC3115-1 is generated from the
input voltage by an internal low dropout regulator. The VCC
regulator has been designed for stable operation with a
wide range of output capacitors. For most applications,
a low ESR ceramic capacitor of at least 4.7µF should be
utilized. The capacitor should be placed as close to the
pin as possible and should connect to the PVCC pin and
ground through the shortest traces possible. The PVCC
pin is the regulator output and is also the internal supply
pin for the gate drivers and boost rail charging diodes.
The VCC pin is the supply connection for the remainder
of the control circuitry. The PVCC and VCC pins must be
connected together on the application PCB. If the trace
connecting VCC to PVCC cannot be made via a short connection, an additional 0.1µF bypass capacitor should be
placed between the VCC pin and ground using the shortest
connections possible.
Inductor Selection
The choice of inductor used in LTC3115-1 application
circuits influences the maximum deliverable output current, the magnitude of the inductor current ripple, and
the power conversion efficiency. The inductor must have
low DC series resistance or output current capability and
efficiency will be compromised. Larger inductance values
reduce inductor current ripple and will therefore generally yield greater output current capability. For a fixed DC
resistance, a larger value of inductance will yield higher
efficiency by reducing the peak current to be closer to the
average output current and therefore minimize resistive
losses due to high RMS currents. However, a larger inductor value within any given inductor family will generally
have a greater series resistance, thereby counteracting
this efficiency advantage. In general, inductors with larger
inductance values and lower DC resistance will increase
the deliverable output current and improve the efficiency
of LTC3115-1 applications.
An inductor used in LTC3115-1 applications should have
a saturation current rating that is greater than the worstcase average inductor current plus half the ripple current.
The peak-to-peak inductor current ripple for each operational mode can be calculated from the following formula,
where f is the switching frequency, L is the inductance,
and t
is the switch pin minimum low time. The switch
LOW
pin minimum low time can be determined from curves
given in the Typical Performance Characteristics section
of this data sheet.
∆I
∆I
L(P-P)(BUCK)
L(P-P)(BOOST )
OUT
L
V
IN
L
VIN– V
V
OUT
1
OUT
V
IN
– V
V
f
1
IN
– t
f
V
=
=
– t
LOW
LOW
In addition to its influence on power conversion efficiency,
the inductor DC resistance can also impact the maximum
output current capability of the buck-boost converter particularly at low input voltages. In buck mode, the output
current of the buck-boost converter is generally limited
only by the inductor current reaching the current limit
threshold. However, in boost mode, especially at large
step-up ratios, the output current capability can also be
limited by the total resistive losses in the power stage.
These include switch resistances, inductor resistance, and
PCB trace resistance. Use of an inductor with high DC
resistance can degrade the output current capability from
that shown in the Typical Performance Characteristics section of this data sheet. As a guideline, in most applications
the inductor DC resistance should be significantly smaller
than the typical power switch resistance of 150mΩ.
Different inductor core materials and styles have an impact
on the size and price of an inductor at any given current
rating. Shielded construction is generally preferred as it
minimizes the chances of interference with other circuitry.
The choice of inductor style depends upon the price, sizing, and EMI requirements of a particular application.
Rev. C
18
For more information www.analog.com
Page 19
APPLICATIONS INFORMATION
(
)
LTC3115-1
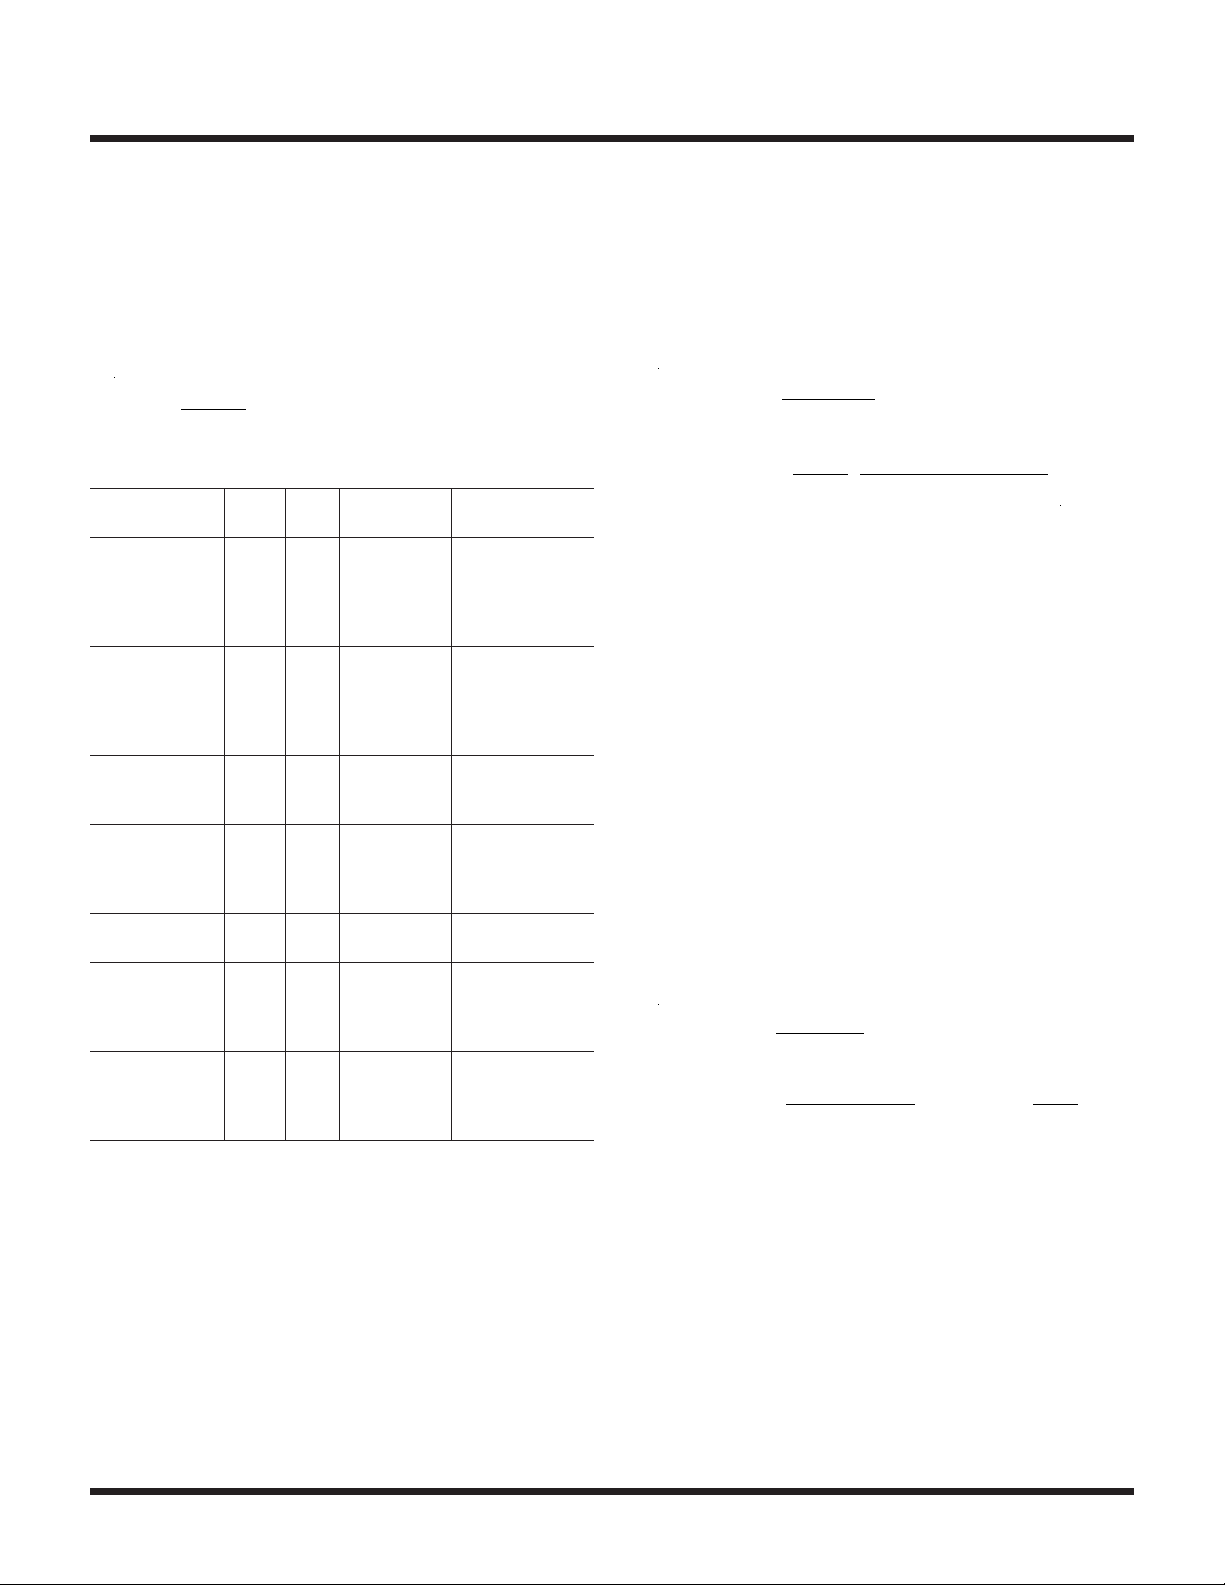
Table1 provides a small sampling of inductors that are
well suited to many LTC3115-1 applications.
In applications with V
a minimum inductance value, L
≥ 20V, it is recommended that
OUT
, be utilized where f is
MIN
the switching frequency:
=
12H
f /Hz
VALUE
(µH)
4.7
6.8
22
15
15
10
8.2
22
18
10
10
39
4.7
15
6.8
15
18
4.7
33
15
DCR
(mΩ)
65
75
70
50
50
40
74
54
30
23
78
105
24.7
46
36
56
42
33
49
40
MAX DC
CURRENT (A)
3.2
2.8
3.3
3.0
3.6
3.18
3.4
2.9
3.0
3.3
3.0
3.0
3.4
3.6
2.9
3.3
3.0
2.9
2.7
3.2
SIZE (mm)
W × L × H
6.2 × 6.2 × 2.5
6.2 × 6.2 × 3.5
10.2 × 10.5 × 3.8
12.9 × 9.4 × 5.2
10.5 × 10.4 × 4.0
10.3 × 10.5 × 3.0
7.3 × 6.7 × 3.0
10.3 × 10.5 × 4.0
12 × 12 × 4.2
10 × 10 × 4.2
8.3 × 8.3 × 3
10.3 × 10.3 × 5
8.3 × 8.3 × 3
9.8 × 9.8 × 5
7.6 × 7.6 × 5
10.3 × 10.3 × 4
12.3 × 12.3 × 4.5
7.3 × 7.3 × 3.2
12 × 12 × 6
10 × 10 × 3.8
L
MIN
Table1. Representative Surface Mount Inductors
PART NUMBER
Coilcraft
LPS6225
LPS6235
MSS1038
D03316P
Cooper-Bussmann
CD1-150-R
DR1030-100-R
FP3-8R2-R
DR1040-220-R
Panasonic
ELLCTV180M
ELLATV100M
Sumida
CDRH8D28/HP
CDR10D48MNNP
CDRH8D28NP
Taiyo-Yuden
NR10050T150M
TOKO
B1047AS-6R8N
B1179BS-150M
892NAS-180M
Würth
7447789004
744771133
744066150
is the capacitance, t
time, and I
of t
as a function of switching frequency and tempera-
LOW
is the output current. Curves for the value
LOAD
is the switch pin minimum low
LOW
ture can be found in Typical Performance Characteristics
section of this data sheet.
I
LOADtLOW
=
C
I
LOAD
=
fC
OUT
OUT
V
– VIN+t
OUT
V
LOW
OUT
fV
IN
∆V
P-P(BUCK )
∆V
P-P(BOOST)
The output voltage ripple increases with load current and
is generally higher in boost mode than in buck mode.
These expressions only take into account the output voltage ripple that results from the output current being discontinuous. They provide a good approximation to the
ripple at any significant load current but underestimate
the output voltage ripple at very light loads where output
voltage ripple is dominated by the inductor current ripple.
In addition to output voltage ripple generated across the
output capacitance, there is also output voltage ripple
produced across the internal resistance of the output
capacitor. The ESR-generated output voltage ripple is proportional to the series resistance of the output capacitor
and is given by the following expressions where R
ESR
is
the series resistance of the output capacitor and all other
terms are as previously defined.
I
LOA DRESR
=
1– t
LOW
I
LOADRESRVOUT
=
VIN1– t
(
≅I
f
LOW
LOADRESR
≅I
LOADRESR
f
)
V
OUT
V
IN
∆V
P-P(BUCK)
∆V
P-P(BOOST)
Output Capacitor Selection
A low ESR output capacitor should be utilized at the buckboost converter output in order to minimize output voltage ripple. Multilayer ceramic capacitors are an excellent
option as they have low ESR and are available in small
footprints. The capacitor value should be chosen large
enough to reduce the output voltage ripple to acceptable
levels. Neglecting the capacitor ESR and ESL, the peakto-peak output voltage ripple can be calculated by the following formulas, where f is the switching frequency, C
For more information www.analog.com
OUT
Input Capacitor Selection
The PVIN pin carries the full inductor current and provides
power to internal control circuits in the IC. To minimize
input voltage ripple and ensure proper operation of the IC,
a low ESR bypass capacitor with a value of at least 4.7µF
should be located as close to this pin as possible. The
traces connecting this capacitor to PVIN and the ground
plane should be made as short as possible. The VIN pin
provides power to the VCC regulator and other internal
circuitry. If the PCB trace connecting VIN to PVIN is long, it
Rev. C
19
Page 20
LTC3115-1
APPLICATIONS INFORMATION
may be necessary to add an additional small value bypass
capacitor near the VIN pin.
When powered through long leads or from a high ESR
power source, a larger value bulk input capacitor may
be required. In such applications, a 47µF to 100µF electrolytic capacitor in parallel with a 1µF ceramic capacitor
generally yields a high performance, low cost solution.
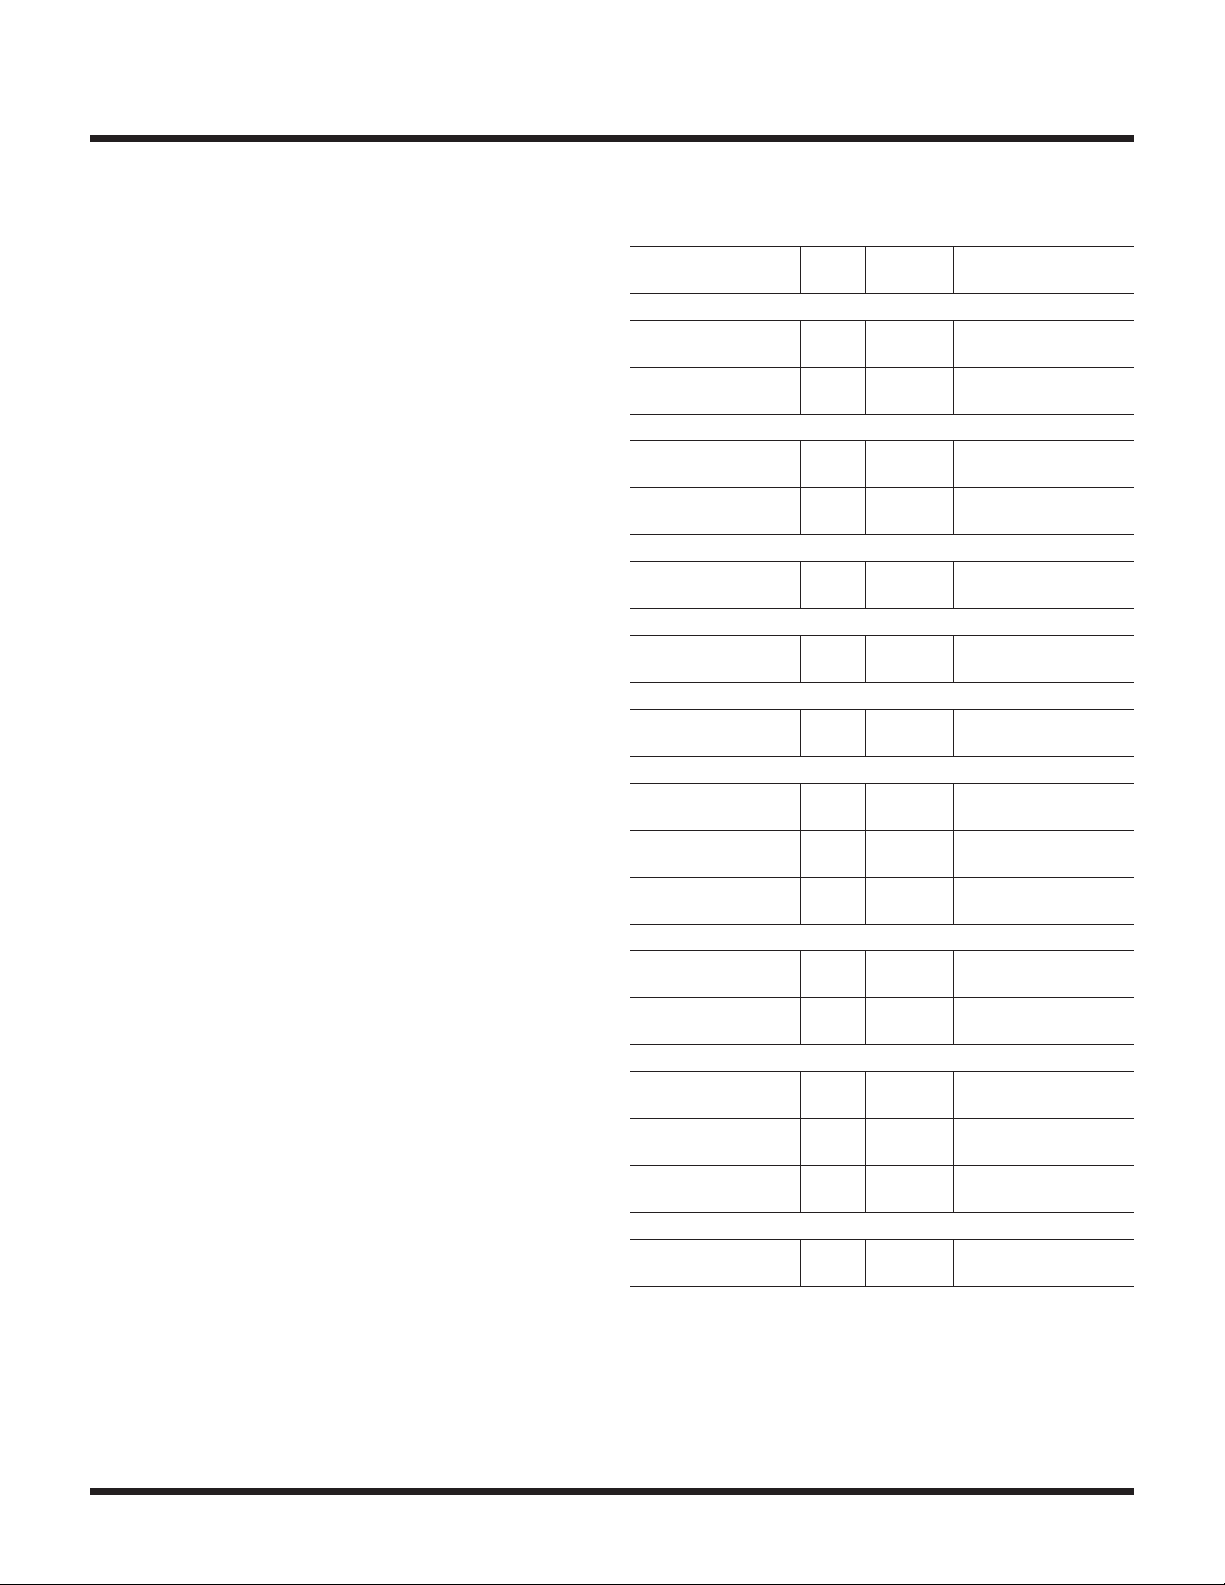
Recommended Input and Output Capacitors
The capacitors used to filter the input and output of the
LTC3115-1 must have low ESR and must be rated to
handle the large AC currents generated by switching converters. This is important to maintain proper functioning
of the IC and to reduce output voltage ripple. There are
many capacitor types that are well suited to such applications including multilayer ceramic, low ESR tantalum,
OS-CON and POSCAP technologies. In addition, there
are certain types of electrolytic capacitors such as solid
aluminum organic polymer capacitors that are designed
for low ESR and high AC currents and these are also well
suited to LTC3115-1 applications (Table2). The choice of
capacitor technology is primarily dictated by a trade-off
between cost, size and leakage current. Notice that some
capacitors such as the OS-CON and POSCAP technologies can exhibit significant DC leakage currents which
may limit their applicability in devices which require low
no-load quiescent current in Burst Mode operation.
Ceramic capacitors are often utilized in switching converter applications due to their small size, low ESR, and
low leakage currents. However, many ceramic capacitors
designed for power applications experience significant
loss in capacitance from their rated value with increased
DC bias voltages. For example, it is not uncommon for
a small surface mount ceramic capacitor to lose more
than 50% of its rated capacitance when operated near
its rated voltage. As a result, it is sometimes necessary
to use a larger value capacitance or a capacitor with a
higher voltage rating than required in order to actually
realize the intended capacitance at the full operating voltage. To ensure that the intended capacitance is realized
in the application circuit, be sure to consult the capacitor
vendor’s curve of capacitance versus DC bias voltage.
Table2. Representative Bypass and Output Capacitors
MANUFACTURER,
PART NUMBER
AVX
12103D226MAT2A 22 25 3.2 × 2.5 × 2.79
TPME226K050R0075 22 50 7.3 × 4.3 × 4.1
Kemet
C2220X226K3RACTU 22 25 5.7 × 5.0 × 2.4
A700D226M016ATE030 22 16 7.3 × 4.3 × 2.8
Murata
GRM32ER71E226KE15L
Nichicon
PLV1E121MDL1 82 25 8 × 8 × 12
Panasonic
ECJ-4YB1E226M 22 25 3.2 × 2.5 × 2.5
Sanyo
25TQC22MV 22 25 7.3 × 4.3 × 3.1
16TQC100M 100 16 7.3 × 4.3 × 1.9
25SVPF47M 47 25 6.6 × 6.6 × 5.9
Taiyo Yuden
UMK325BJ106MM-T 10 50 3.2 × 2.5 × 2.5
TMK325BJ226MM-T 22 25 3.2 × 2.5 × 2.5
TDK
KTJ500B226M55BFT00 22 50 6.0 × 5.3 × 5.5
C5750X7R1H106M 10 50 5.7 × 5.0 × 2.0
CKG57NX5R1E476M 47 25 6.5 × 5.5 × 5.5
Vishay
94SVPD476X0035F12 47 35 10.3 × 10.3 × 12.6
VALUE
(µF)
VOLTAGE
(V)
22 25 3.2 × 2.5 × 2.5
SIZE L × W × H (mm),
TYPE, ESR
X5R Ceramic
Tantalum, 75mΩ
X7R Ceramic
Alum. Polymer, 30mΩ
X7R Ceramic
Alum. Polymer, 25mΩ
X5R Ceramic
POSCAP, 50mΩ
POSCAP, 45mΩ
OS-CON, 30mΩ
X5R Ceramic
X5R Ceramic
X7R Ceramic
X7R Ceramic
X5R Ceramic
OS-CON, 30mΩ
20
Rev. C
For more information www.analog.com
Page 21
APPLICATIONS INFORMATION
R2
LTC3115-1
Programming Custom Input UVLO Thresholds
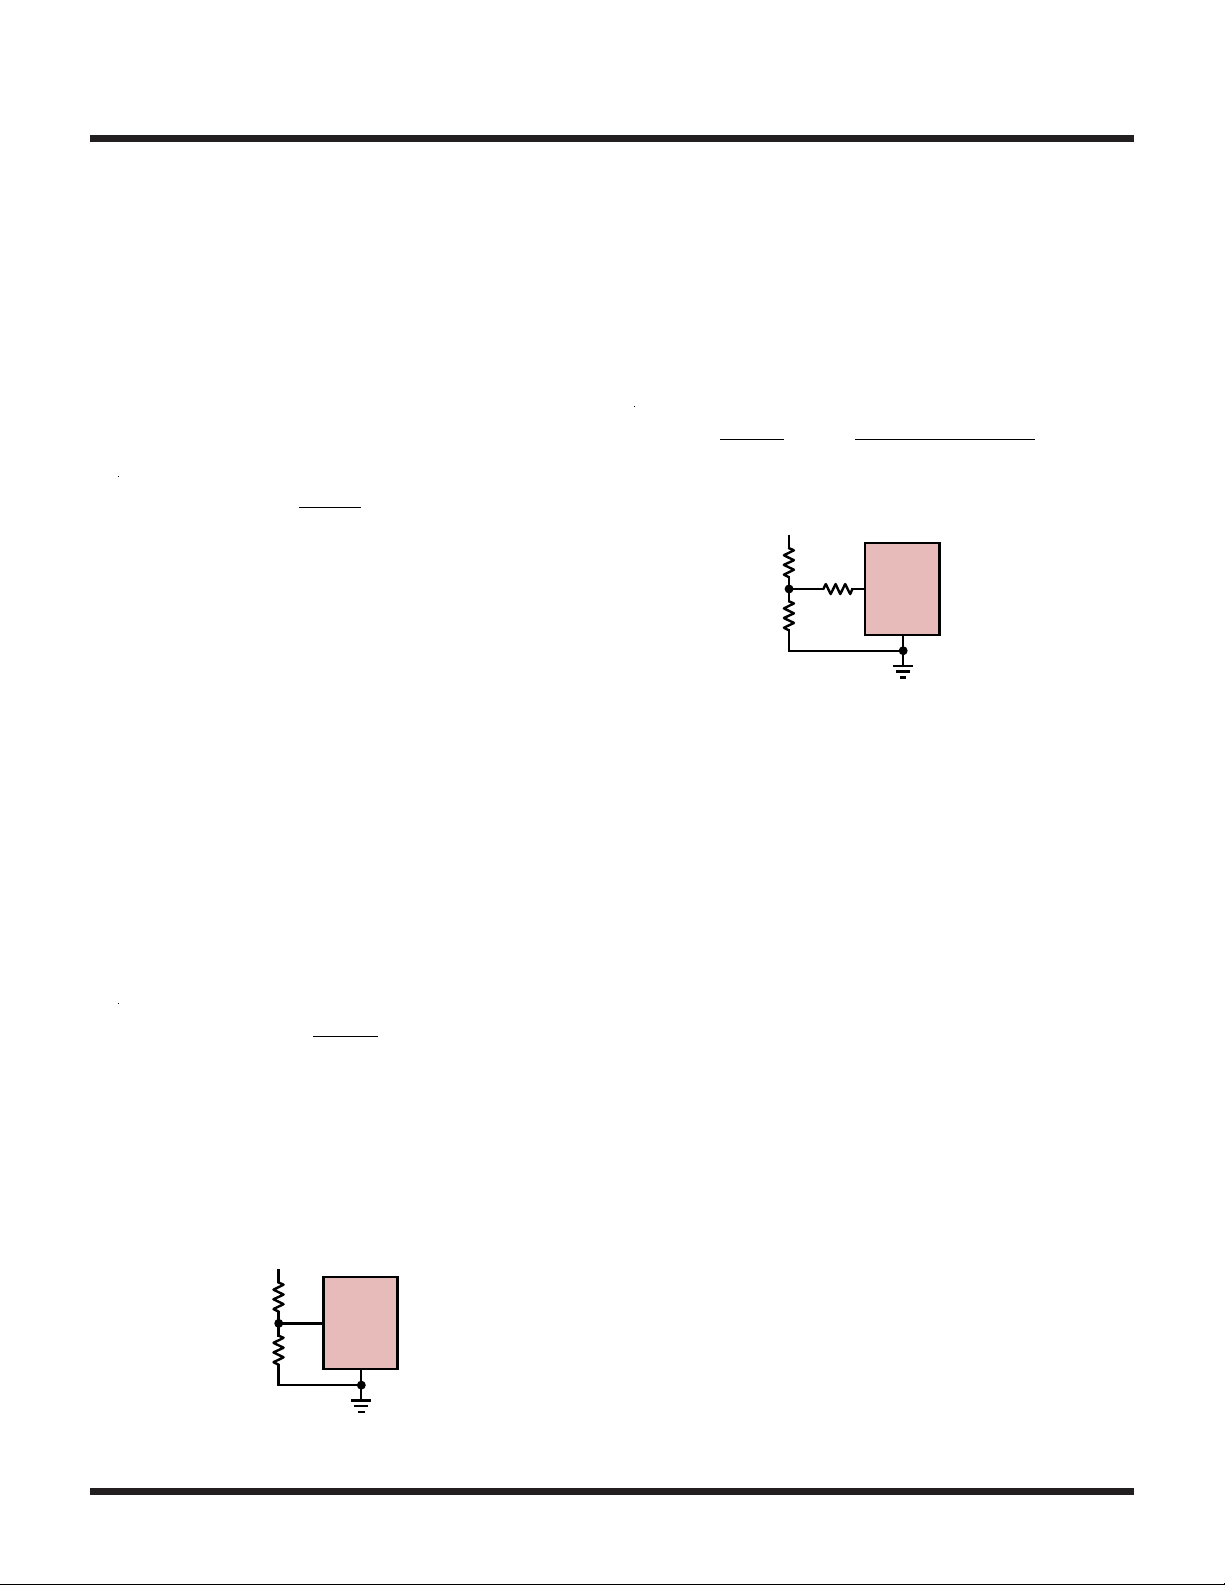
With the addition of an external resistor divider connected
to the input voltage as shown in Figure4, the RUN pin
can be used to program the input voltage at which the
LTC3115-1 is enabled and disabled.
For a rising input voltage, the LTC3115-1 is enabled when VIN
reaches the threshold given by the following equation, where
R1 and R2 are the values of the resistor divider resistors:
V
TH(RISING)
=1.21V
R1+R2
R2
To ensure robust operation in the presence of noise, the
RUN pin has two forms of hysteresis. A fixed 100mV
of hysteresis within the RUN pin comparator provides a
minimum RUN pin hysteresis equal to 8.3% of the input
turn-on voltage independent of the resistor divider values.
In addition, an internal hysteresis current that is sourced
from the RUN pin during operation generates an additive
level of hysteresis which can be programmed by the value
of R1 to increase the overall hysteresis to suit the requirements of specific applications.
Once the IC is enabled, it will remain enabled until the
input voltage drops below the comparator threshold by
the hysteresis voltage, V
, as given by the follow-
HYST
ing equation where R1 and R2 are values of the divider
resistors:
R1+R2
V
= R1• 0.5µA+
HYST
0.1V
Therefore, the rising UVLO threshold and amount of hysteresis can be independently programmed via appropriate
selection of resistors R1 and R2. For high levels of hysteresis, the value of R1 can become larger than is desirable
in a practical implementation (greater than 1MΩ to 2MΩ).
V
IN
LTC3115-1
R1
RUN
R2
Figure4. Setting the Input UVLO Threshold and Hysteresis
GND
31151 F04
In such cases, the amount of hysteresis can be increased
further through the addition of an additional resistor, RH,
as shown in Figure5.
When using the additional RH resistor, the rising RUN pin
threshold remains as given by the original equation and
the hysteresis is given by the following expression:
R
V
HYST
R1+R2
=
Figure5. Increasing Input UVLO hysteresis
R2
0.1V+
V
IN
R1
R2
R2+RHR1+R1R2
H
LTC3115-1
R
H
RUN
GND
3115 F05
R2
0.5µA
(
)
To improve the noise robustness and accuracy of the
UVLO thresholds, the RUN pin input can be filtered by
adding a 1000pF capacitor from RUN to GND. Larger valued capacitors should not be utilized because they could
interfere with operation of the hysteresis.
Bootstrapping the VCC Regulator
The high and low side gate drivers are powered through the
PVCC rail which is generated from the input voltage through
an internal linear regulator. In some applications, especially
at higher operating frequencies and high input and output
voltages, the power dissipation in the linear VCC regulator
can become a key factor in the conversion efficiency of the
converter and can even become a significant source of thermal heating. For example, at a 1.2MHz switching frequency,
an input voltage of 36V, and an output voltage of 24V, the
total PVCC/VCC current is approximately 18mA as shown in
the Typical Performance Characteristics section of this data
sheet. As a result, this will generate 568mW of power dissipation in the VCC regulator which will result in an increase in die
temperature of approximately 24° above ambient in the DFN
package. This significant power loss will have a substantial
impact on the conversion efficiency and the additional heating
may limit the maximum ambient operating temperature for
the application.
Rev. C
For more information www.analog.com
21
Page 22
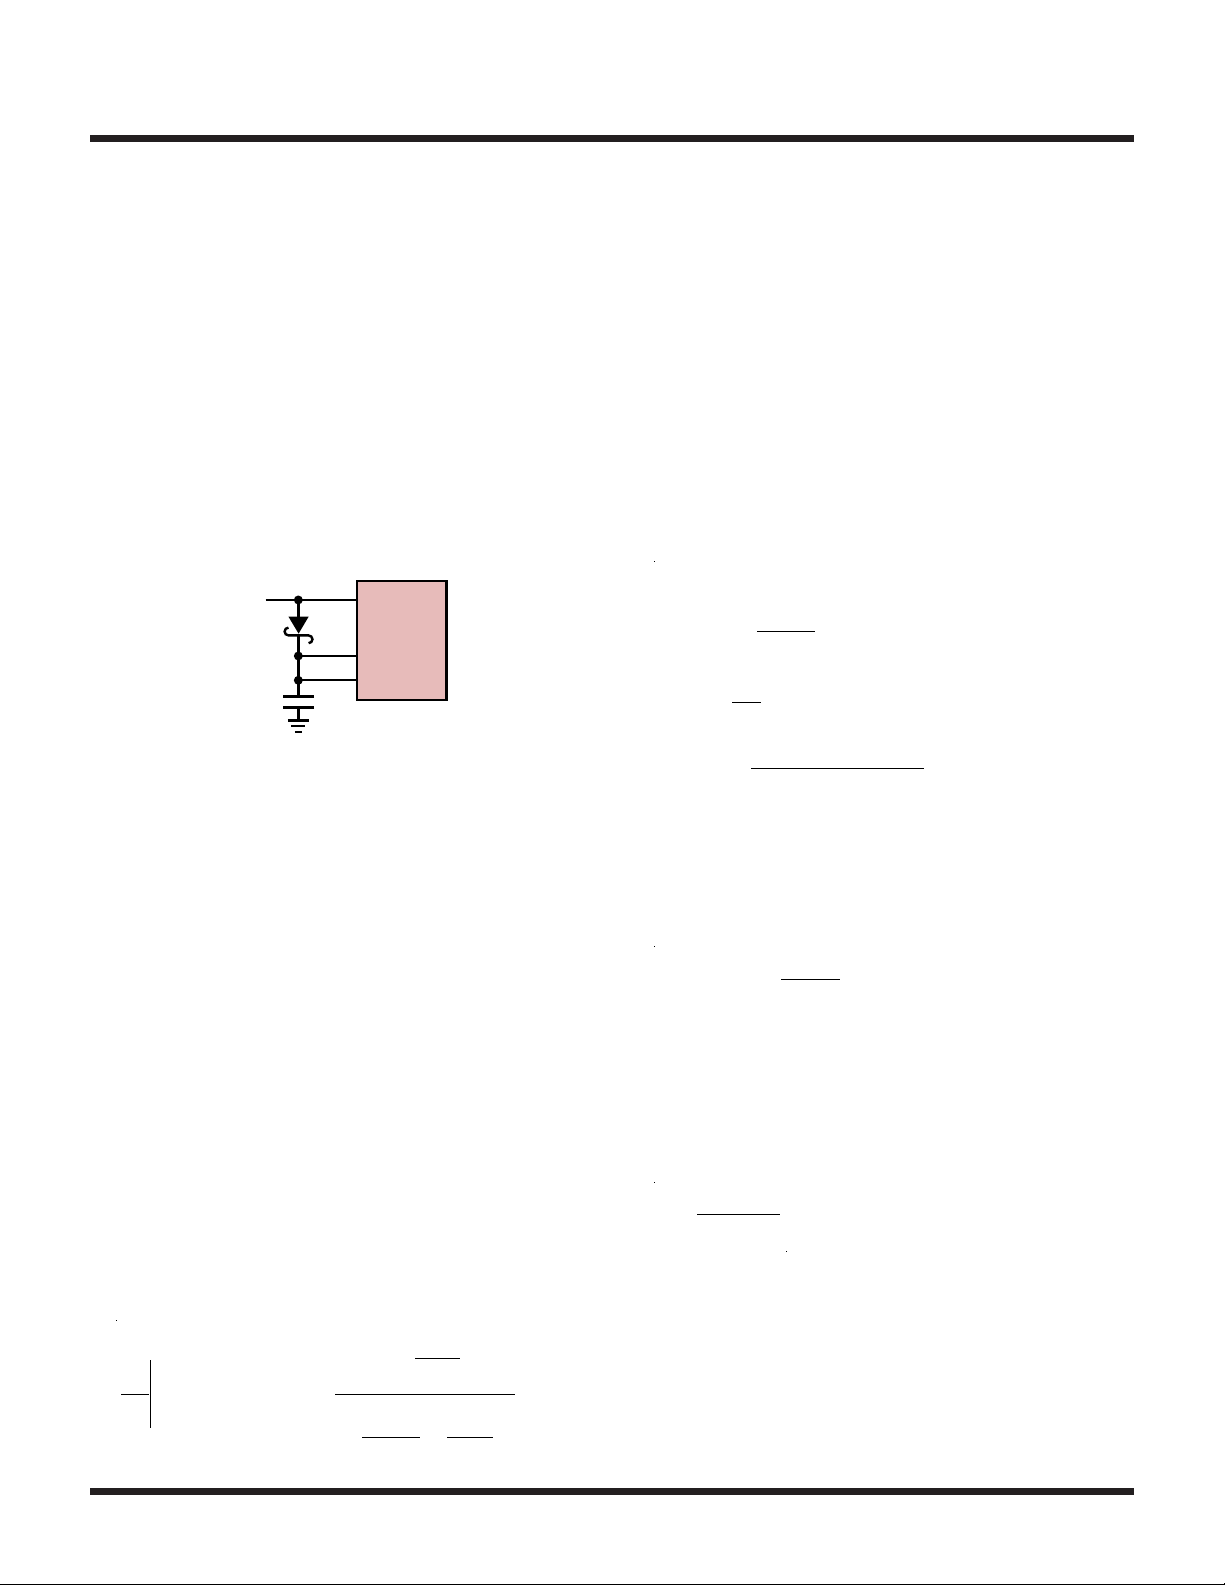
LTC3115-1
( )
( )
R
S
1
O
APPLICATIONS INFORMATION
A significant performance advantage can be attained in
applications which have the converter output voltage programmed to 5V if the output voltage is utilized to power
the PVCC and VCC rails. This can be done by connecting a Schottky diode from V
to PVCC/VCC as shown
OUT
in Figure6. With this bootstrap diode installed, the gate
driver currents are generated directly by the buck-boost
converter at high efficiency rather than through the internal linear regulator. To minimize current drawn from the
output, the internal VCC regulator contains reverse blocking circuitry which minimizes the current into the PVCC/
VCC pins when they are driven above the input voltage.
4.7µF
PV
OUT
LTC3115-1
V
CC
PV
CC
31151 F06
CC
V
OUT
Figure6. Bootstrapping PVCC and V
Buck Mode Small-Signal Model
The LTC3115-1 uses a voltage mode control loop to
maintain regulation of the output voltage. An externally
compensated error amplifier drives the VC pin to generate
the appropriate duty cycle of the power switches. Use of
an external compensation network provides the flexibility
for optimization of closed loop performance over the wide
variety of output voltages, switching frequencies, and
external component values supported by the LTC3115-1.
The small-signal transfer function of the buck-boost converter is different in the buck and boost modes of operation and care must be taken to ensure stability in both
operating regions. When stepping down from a higher
input voltage to a lower output voltage, the converter
will operate in buck mode and the small-signal transfer
function from the error amplifier output, VC, to the converter output voltage is given by the following equation:
s
Q
2πf
+
Z
2πf
2
s
O
1+
1+
2πf
s
O
V
O
V
C
BUCKMODE
=G
BUCK
The gain term, G
, is comprised of three different com-
BUCK
ponents: the gain of the analog divider, the gain of the pulse
width modulator, and the gain of the power stage as given
by the following expressions where VIN is the input voltage
to the converter, f is the switching frequency, R is the load
resistance, and t
is the switch pin minimum low time.
LOW
Curves showing the switch pin minimum low time can be
found in the Typical Performance Characteristics section of
this data sheet. The parameter RS represents the average
series resistance of the power stage and can be approximated as twice the average power switch resistance plus
the DC resistance of the inductor.
G
G
G
G
= G
BUCK
DIVIDER
=
PWM
POWER
DIVIDERGPWM
19.8V
=
V
IN
3
1– t
( )
1– t
LOW
V
LOW
2V
=
IN
f
f
R
R+R
G
POWER
S
Notice that the gain of the analog divider cancels the input
voltage dependence of the power stage. As a result, the
buck mode gain is well approximated by a constant as
given by the following equation:
G
BUCK
= 29.7
R+R
≅ 29.7 =29.5dB
The buck mode transfer function has a single zero which
is generated by the ESR of the output capacitor. The zero
frequency, fZ, is given by the following expression where
RC and CO are the ESR and value of the output filter capacitor respectively.
fZ=
2π RCC
In most applications, an output capacitor with a very low
ESR is utilized in order to reduce the output voltage ripple
to acceptable levels. Such low values of capacitor ESR
result in a very high frequency zero and as a result the
zero is commonly too high in frequency to significantly
impact compensation of the feedback loop.
Rev. C
22
For more information www.analog.com
Page 23

APPLICATIONS INFORMATION
LOW
(
)
IN
OUT
LTC3115-1
The denominator of the buck mode transfer function
exhibits a pair of resonant poles generated by the LC
filtering of the power stage. The resonant frequency of
the power stage, fO, is given by the following expression
where L is the value of the inductor:
1
fO=
2π
R+R
S
LCOR+R
(
1
≅
2π
)
C
LC
1
O
The quality factor, Q, has a significant impact on compensation of the voltage loop since a higher Q factor produces
a sharper loss of phase near the resonant frequency. The
quality factor is inversely related to the amount of damping in the power stage and is substantially influenced
by the average series resistance of the power stage, RS.
Lower values of RS will increase the Q and result in a
sharper loss of phase near the resonant frequency and will
require more phase boost or lower bandwidth to maintain
an adequate phase margin.
R+R
LC
(
Q =
RRCCO+L +CORSR+R
O
R+R
(
)
C
)
S
(
)
C
LC
L
+COR
O
S
≅
Boost Mode Small-Signal Model
When stepping up from a lower input voltage to a higher
output voltage, the buck-boost converter will operate in
boost mode where the small-signal transfer function from
control voltage, VC, to the output voltage is given by the
following expression.
s
2πf
2πf
1–
Z
s
Q
O
V
O
V
C
BOOSTMODE
=G
BOOST
1+
1+
2πf
+
2πf
s
s
RHPZ
O
2
In boost mode operation, the transfer function is characterized by a pair of resonant poles and a zero generated by
the ESR of the output capacitor as in buck mode. However,
in addition there is a right half plane zero which generates
increasing gain and decreasing phase at higher frequencies. As a result, the crossover frequency in boost mode
operation generally must be set lower than in buck mode
in order to maintain sufficient phase margin.
The boost mode gain, G
, is comprised of three com-
BOOST
ponents: the analog divider, the pulse width modulator
and the power stage. The gain of the analog divider and
PWM remain the same as in buck mode operation, but
the gain of the power stage in boost mode is given by the
following equation:
2
V
G
POWER
≅
1– t
OUT
f
V
IN
By combining the individual terms, the total gain in boost
mode can be reduced to the following expression. Notice
that unlike in buck mode, the gain in boost mode is a
function of both the input and output voltage.
G
BOOST
≅
29.7V
2
OUT
2
V
In boost mode operation, the frequency of the right half
plane zero, f
, is given by the following expression.
RHPZ
The frequency of the right half plane zero decreases at
higher loads and with larger inductors.
2
2
f
R 1– t
(
f
=
RHPZ
LOW
2π L V
V
)
IN
2
In boost mode, the resonant frequency of the power
stage has a dependence on the input and output voltage
as shown by the following equation.
2
RV
RS+
1
fO=
2π
LCOR+R
IN
2
V
OUT
(
1
V
≅
2π
)
C
IN
•
V
OUT
1
LC
Finally, the magnitude of the quality factor of the power
stage in boost mode operation is given by the following
expression.
2
RV
R RS+
LC
O
Q=
L+CORSR
V
OUT
IN
2
Rev. C
For more information www.analog.com
23
Page 24
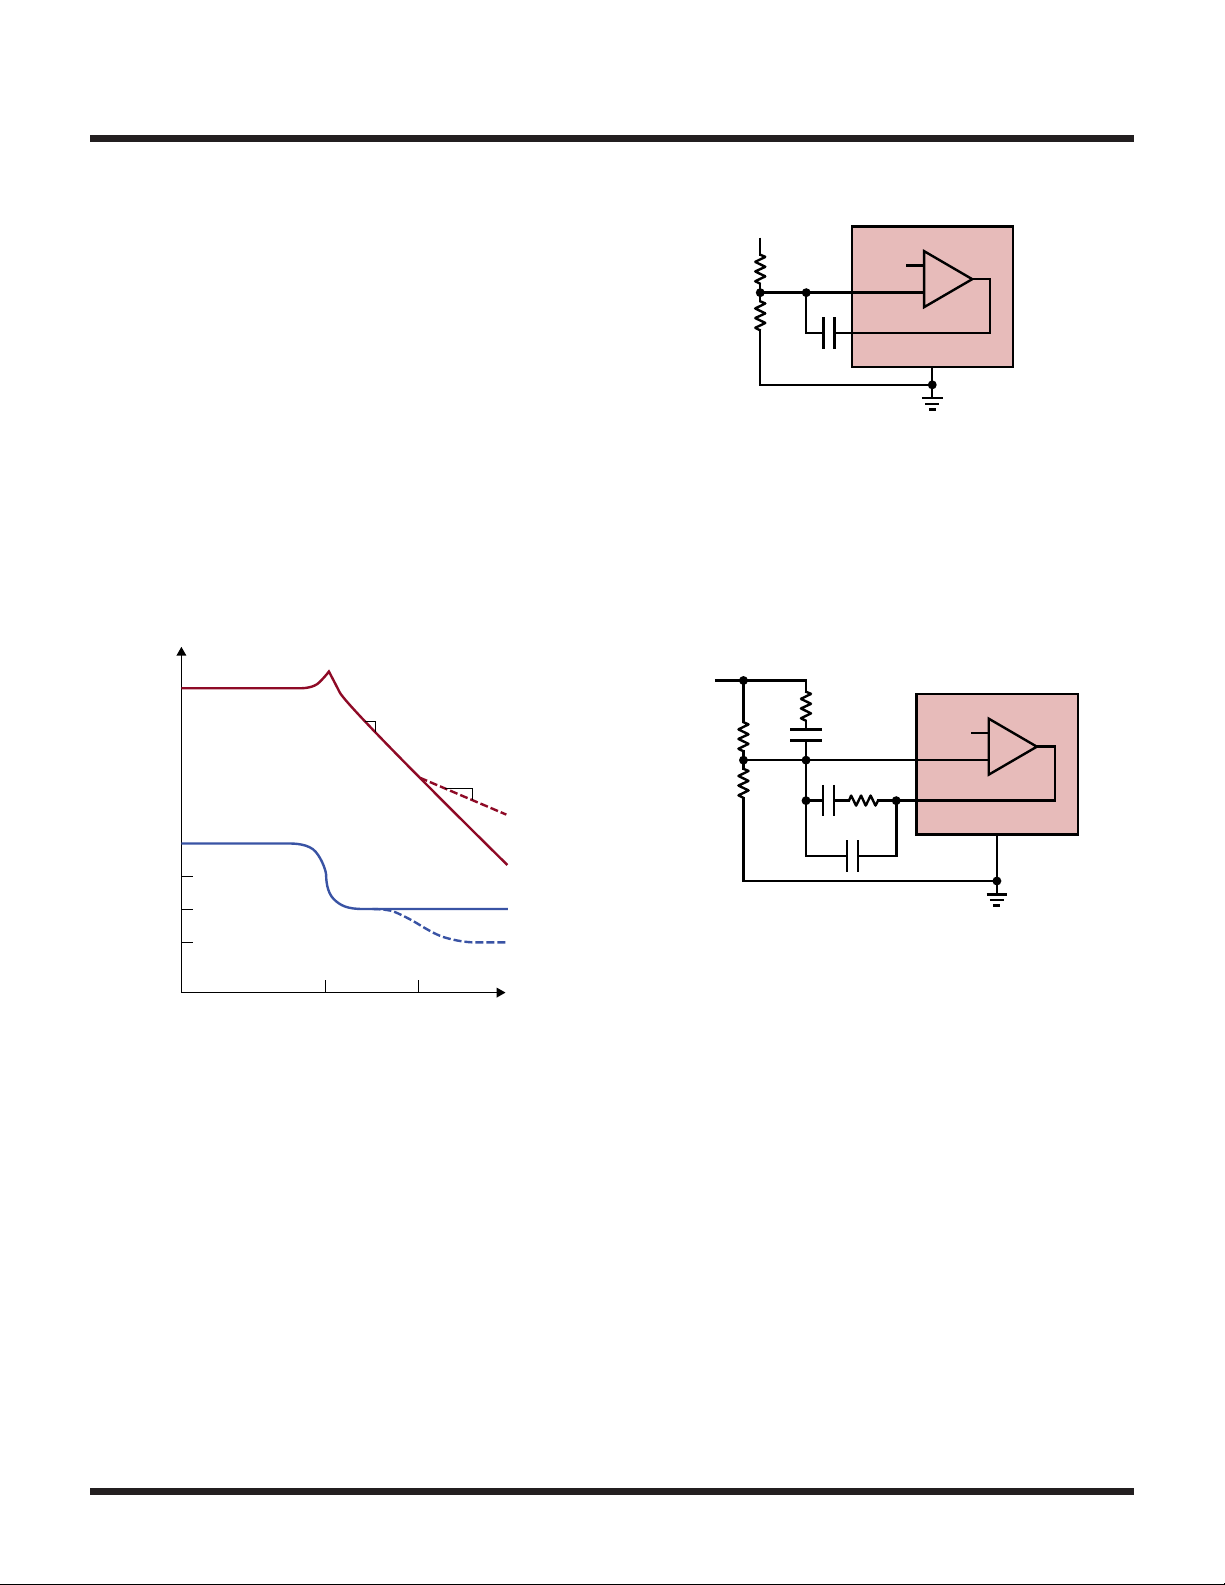
LTC3115-1
APPLICATIONS INFORMATION
Compensation of the Voltage Loop
The small-signal models of the LTC3115-1 reveal that the
transfer function from the error amplifier output, VC, to
the output voltage is characterized by a set of resonant
poles and a possible zero generated by the ESR of the
output capacitor as shown in the Bode plot of Figure7.
In boost mode operation, there is an additional right half
plane zero that produces phase lag and increasing gain at
higher frequencies. Typically, the compensation network
is designed to ensure that the loop crossover frequency is
low enough that the phase loss from the right half plane
zero is minimized. The low frequency gain in buck mode
is a constant, but varies with both VIN and V
mode.
in boost
OUT
V
OUT
R
TOP
C1
R
BOT
1000mV
FB
VC
LTC3115-1
+
–
GND
31151 F08
Figure8. Error Amplifier with Type I Compensation
In most applications, the low bandwidth of the Type I
compensated loop will not provide sufficient transient
response performance. To obtain a wider bandwidth feedback loop, optimize the transient response, and minimize
the size of the output capacitor, a Type III compensation
network as shown in Figure9 is required.
GAIN
–40dB/DEC
–20dB/DEC
0°
–90°
–180°
–270°
PHASE
BOOST MODE
f
O
BUCK MODE
f
RHPZ
31151 F07
f
Figure7. Buck-Boost Converter Bode Plot
For charging or other applications that do not require an
optimized output voltage transient response, a simple
Type I compensation network as shown in Figure8 can
be used to stabilize the voltage loop. To ensure sufficient
phase margin, the gain of the error amplifier must be
low enough that the resultant crossover frequency of the
control loop is well below the resonant frequency.
V
OUT
R
FF
R
TOP
R
BOT
C
FF
C
FB
R
FB
C
POLE
1000mV
FB
VC
LTC3115-1
+
–
GND
31151 F09
Figure9. Error Amplifier with Type III Compensation
A Bode plot of the typical Type III compensation network
is shown in Figure10. The Type III compensation network
provides a pole near the origin which produces a very high
loop gain at DC to minimize any steady-state error in the
regulation voltage. Two zeros located at f
ZERO1
and f
ZERO2
provide sufficient phase boost to allow the loop crossover
frequency to be set above the resonant frequency, fO, of
the power stage. The Type III compensation network also
introduces a second and third pole. The second pole, at
frequency f
, reduces the error amplifier gain to a
POLE2
zero slope to prevent the loop crossover from extending
too high in frequency. The third pole at frequency f
POLE3
provides attenuation of high frequency switching noise.
24
Rev. C
For more information www.analog.com
Page 25
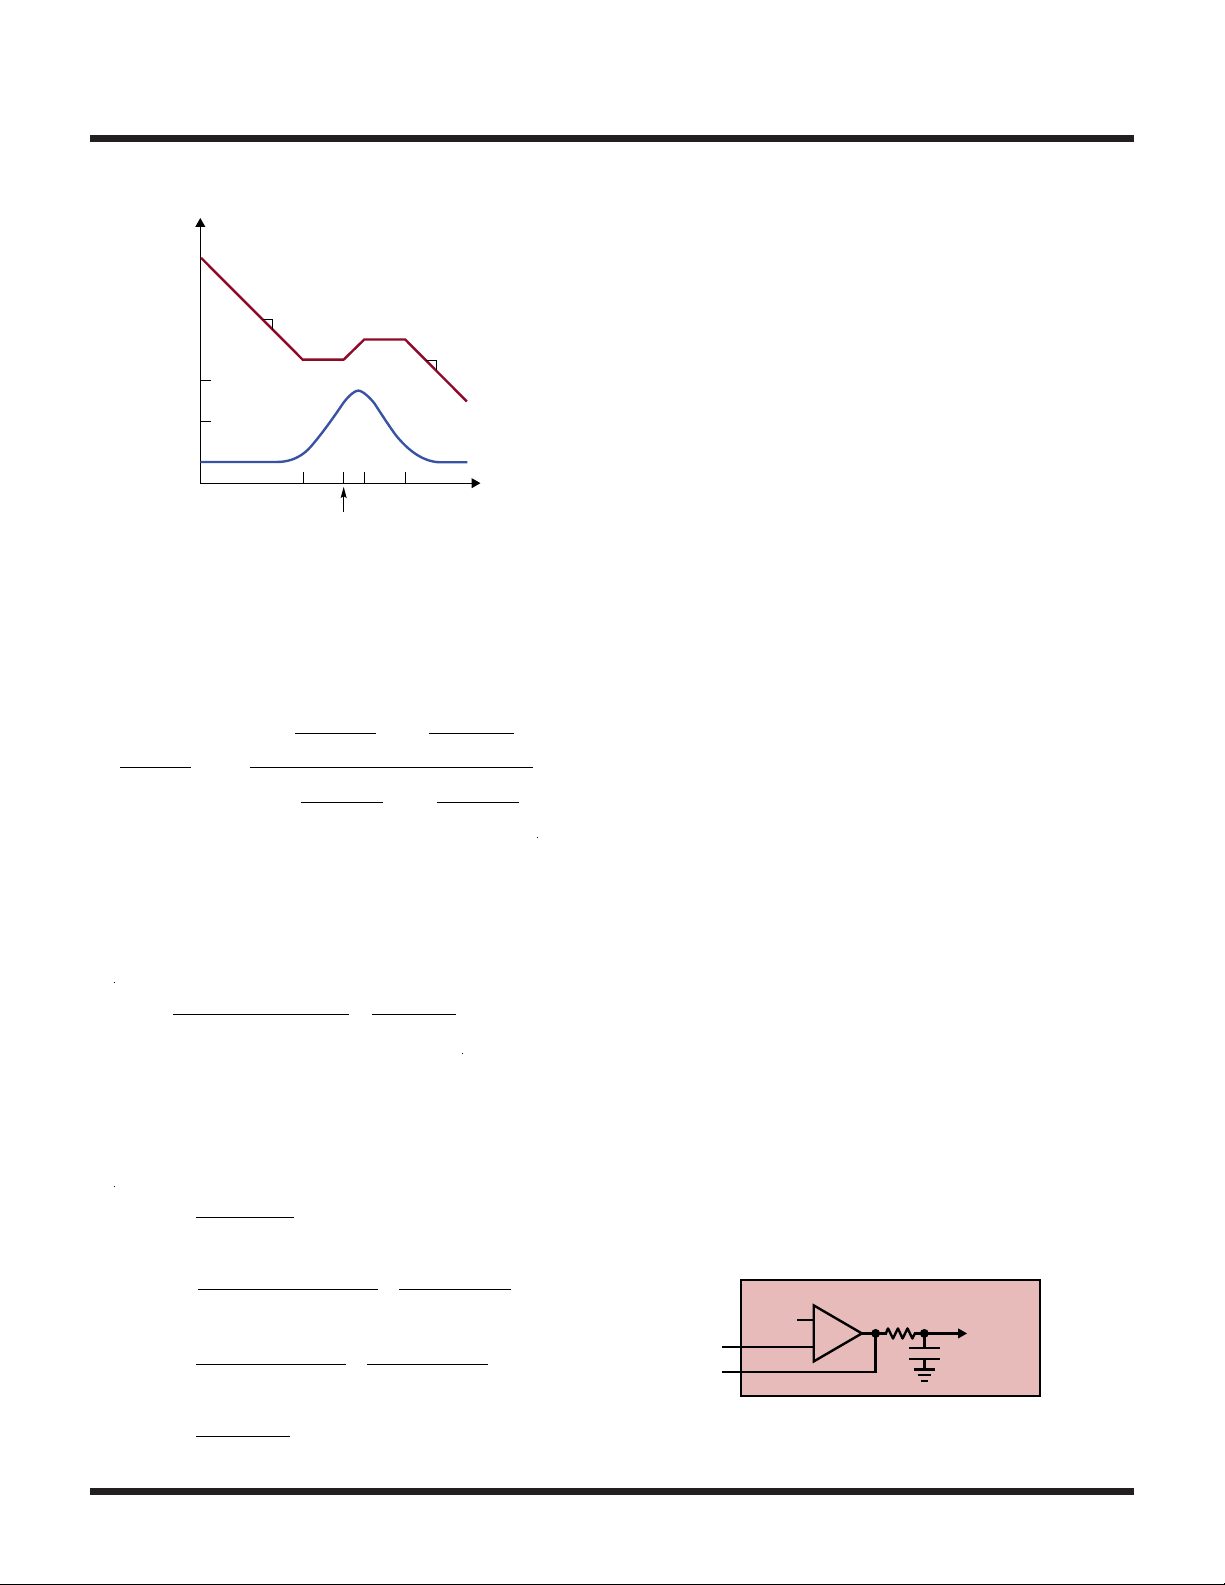
APPLICATIONS INFORMATION
1
1
1
2πC
R
31151 F11
GAIN
–20dB/DEC
TOP
1+
1+
2π R
POLE
–20dB/DEC
31151 F10
2πf
2πf
C
FB
TOP
1
s
ZERO2
s
POLE3
1
R
FB
f
C
FF
90°
0°
PHASE
–90°
f
ZERO1
Figure10. Type III Compensation Bode Plot
f
ZERO2
f
POLE2fPOLE3
The transfer function of the compensated Type III error
amplifier from the input of the resistor divider to the output of the error amplifier, VC, is:
1+
2πf
EA
s 1+
2πf
VC(s)
V
OUT
= G
(s)
s
ZERO1
s
POLE2
The error amplifier gain is given by the following equation.
The simpler approximate value is sufficiently accurate in
most cases since CFB is typically much larger in value
than C
GEA=
POLE
.
R
CFB+C
(
TOP
POLE
≅
R
)
The pole and zero frequencies of the Type III compensation network can be calculated from the following equations where all frequencies are in Hz, resistances are in
ohms, and capacitances are in farads.
f
f
f
f
ZERO1
ZERO2
POLE2
POLE3
=
2π RFBC
=
2π R
C
=
2πCFBC
=
FB
1
FB
TOP
+C
+R
POLE
POLE
FF
R
(
FB
≅
C
)
FF
≅
2π C
1
LTC3115-1
In most applications the compensation network is
designed so that the loop crossover frequency is above
the resonant frequency of the power stage, but sufficiently
below the boost mode right half plane zero to minimize
the additional phase loss. Once the crossover frequency is
decided upon, the phase boost provided by the compensation network is centered at that point in order to maximize the phase margin. A larger separation in frequency
between the zeros and higher order poles will provide a
higher peak phase boost but may also increase the gain of
the error amplifier which can push out the loop crossover
to a higher frequency.
The Q of the power stage can have a significant influence on
the design of the compensation network because it determines how rapidly the 180° of phase loss in the power
stage occurs. For very low values of series resistance, RS,
the Q will be higher and the phase loss will occur sharply.
In such cases, the phase of the power stage will fall rapidly
to –180° above the resonant frequency and the total phase
margin must be provided by the compensation network.
However, with higher losses in the power stage (larger RS)
the Q factor will be lower and the phase loss will occur more
gradually. As a result, the power stage phase will not be as
close to –180° at the crossover frequency and less phase
boost is required of the compensation network.
The LTC3115-1 error amplifier is designed to have a
fixed maximum bandwidth in order to provide rejection
of switching noise to prevent it from interfering with the
control loop. From a frequency domain perspective, this
can be viewed as an additional single pole as illustrated in
Figure11. The nominal frequency of this pole is 300kHz.
For typical loop crossover frequencies below about 50kHz
the phase contributed by this additional pole is negligible.
However, for loops with higher crossover frequencies this
additional phase loss should be taken into account when
designing the compensation network.
LTC3115-1
R
1000mV
FB
VC
+
–
Figure11. Internal Loop Filter
FILT
C
FILT
INTERNAL
VC
Rev. C
For more information www.analog.com
25
Page 26

LTC3115-1
APPLICATIONS INFORMATION
Loop Compensation Example
This section provides an example illustrating the design of
a compensation network for a typical LTC3115-1 application circuit. In this example a 5V regulated output voltage is generated with the ability to supply a 500mA load
from an input power source ranging from 3.5V to 30V.
To reduce switching losses a 750kHz switching frequency
has been chosen for this example. In this application the
maximum inductor current ripple will occur at the highest input voltage. An inductor value of 8.2µH has been
chosen to limit the worst-case inductor current ripple to
approximately 600mA. A low ESR output capacitor with
a value of 20µF is specified to yield a worst-case output
voltage ripple (occurring at the worst-case step-up ratio
and maximum load current) of approximately 12mV. In
summary, the key power stage specifications for this
LTC3115-1 example application are given below.
f = 0.75MHz, t
VIN = 3.5V to 30V
V
C
L = 8.2µH, RL = 45mΩ
With the power stage parameters specified, the compen-
sation network can be designed. In most applications, the
most challenging compensation corner is boost mode
operation at the greatest step-up ratio and highest load
current since this generates the lowest frequency right
half plane zero and results in the greatest phase loss.
Therefore, a reasonable approach is to design the compensation network at this worst-case corner and then
verify that sufficient phase margin exists across all other
operating conditions. In this example application, at VIN =
3.5V and the full 500mA load current, the right half plane
zero will be located at 81kHz and this will be a dominant
factor in determining the bandwidth of the control loop.
The first step in designing the compensation network
is to determine the target crossover frequency for the
= 5V at 500mA
OUT
= 20µF, RC = 10mΩ
OUT
LOW
= 0.1µs
compensated loop. A reasonable starting point is to
assume that the compensation network will generate a
peak phase boost of approximately 60°. Therefore, in
order to obtain a phase margin of 60°, the loop crossover frequency, fC, should be selected as the frequency
at which the phase of the buck-boost converter reaches
–180°. As a result, at the loop crossover frequency the
total phase will be simply the 60° of phase provided by
the error amplifier as shown:
Phase Margin = φ
= –180° + 60° + 180° = 60°
Similarly, if a phase margin of 45° is required, the target
crossover frequency should be picked as the frequency
at which the buck-boost converter phase reaches –195°
so that the combined phase at the crossover frequency
yields the desired 45° of phase margin.
This example will be designed for a 60° phase margin
to ensure adequate performance over parametric variations and varying operating conditions. As a result, the
target crossover frequency, fC, will be the point at which
the phase of the buck-boost converter reaches –180°.
It is generally difficult to determine this frequency analytically given that it is significantly impacted by the Q
factor of the resonance in the power stage. As a result,
it is best determined from a Bode plot of the buck-boost
converter as shown in Figure12. This Bode plot is for the
LTC3115-1 buck-boost converter using the previously
specified power stage parameters and was generated
from the small-signal model equations using LTspice®
software. In this case, the phase reaches –180° at 24kHz
making fC = 24kHz the target crossover frequency for the
compensated loop.
From the Bode plot of Figure12 the gain of the power
stage at the target crossover frequency is 19dB. Therefore,
in order to make this frequency the crossover frequency
in the compensated loop, the total loop gain at fC must
be adjusted to 0dB. To achieve this, the gain of the compensation network must be designed to be –19dB at the
crossover frequency.
BUCK-BOOST
+ φ
ERRORAMPLIFIER
+ 180°
26
Rev. C
For more information www.analog.com
Page 27
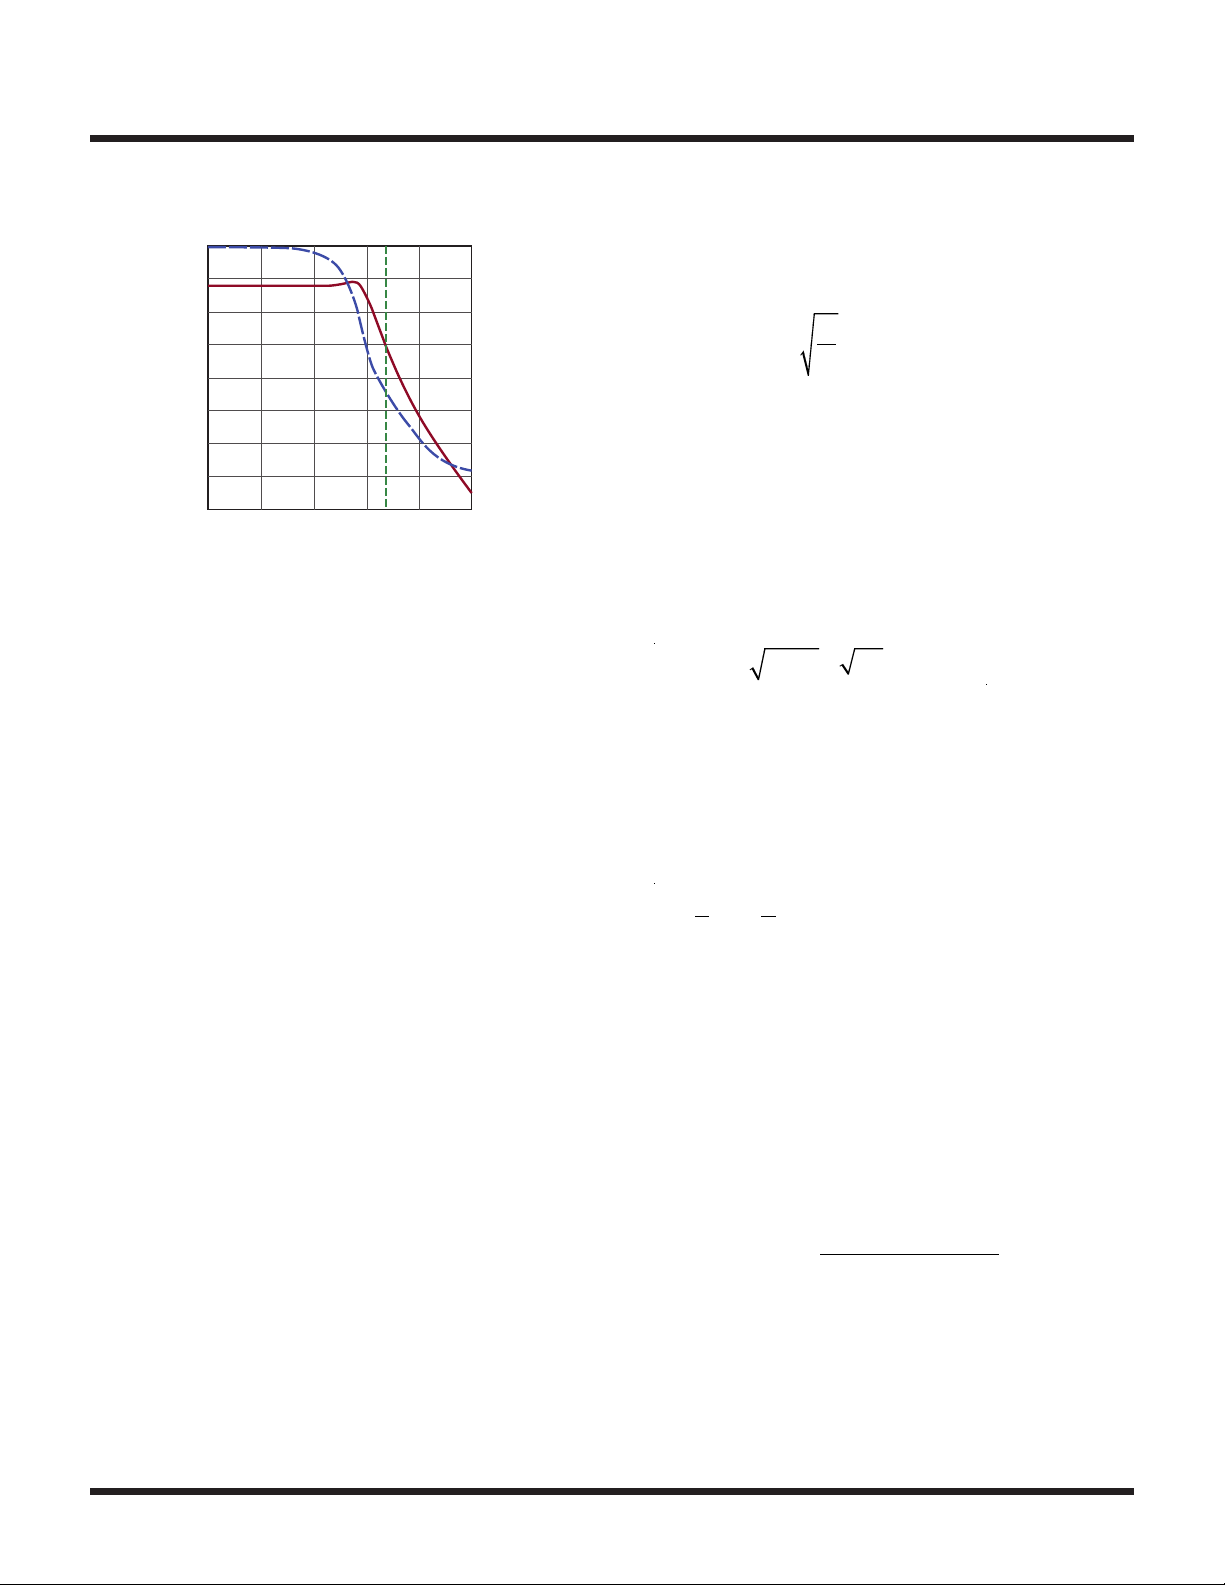
APPLICATIONS INFORMATION
P
(
)
GAIN (dB)
PHASE (DEG)
LTC3115-1
50
40
GAIN
30
20
10
0
–10
–20
–30
Figure12. Converter Bode Plot, VIN = 3.5V, I
100 1k 100k
10
PHASE
10k
FREQUENCY (Hz)
f
C
31151 F12
0
–40
–80
–120
–160
–200
–240
–280
–320
1M
LOAD
= 500mA
At this point in the design process, there are three constraints that have been established for the compensation
network. It must have –19dB gain at fC = 24kHz, a peak
phase boost of 60° and the phase boost must be centered
at fC = 24kHz. One way to design a compensation network
to meet these targets is to simulate the compensated error
amplifier Bode plot in LTspice for the typical compensation
network shown on the front page of this data sheet. Then,
the gain, pole frequencies and zero frequencies can be
iteratively adjusted until the required constraints are met.
Alternatively, an analytical approach can be used to design
a compensation network with the desired phase boost,
center frequency and gain. In general, this procedure can
be cumbersome due to the large number of degrees of
freedom in a Type III compensation network. However the
design process can be simplified by assuming that both
compensation zeros occur at the same frequency, fZ, and
both higher order poles (f
POLE2
and f
) occur at the
POLE3
common frequency, fP . In most cases this is a reasonable
assumption since the zeros are typically located between
1kHz and 10kHz and the poles are typically located
near each other at much higher frequencies. Given this
assumption, the maximum phase boost, f
, provided
MAX
by the compensated error amplifier is determined simply
by the amount of separation between the poles and zeros
as shown by the following equation:
f
–1
φ
= 4 tan
MAX
P
f
Z
– 270°
A reasonable choice is to pick the frequency of the poles,
fP , to be about 50 times higher than the frequency of the
zeros, fZ, which provides a peak phase boost of approximately φ
= 60° as was assumed previously. Next, the
MAX
phase boost must be centered so that the peak phase
occurs at the target crossover frequency. The frequency
of the maximum phase boost, f
CENTER
, is the geometric
mean of the pole and zero frequencies as:
f
CENTER
= fP• fZ= 50 • fZ≅ 7 • f
Z
Therefore, in order to center the phase boost given a factor of 50 separation between the pole and zero frequencies, the zeros should be located at one seventh of the
crossover frequency and the poles should be located at
seven times the crossover frequency as given by the following equations:
1
fZ=
7
= 7 • fC= 7 24kHz
f
• fC=
1
(
7
24kHz
= 3.43kHz
)
= 168kHz
This placement of the poles and zeros will yield a peak
phase boost of 60° that is centered at the crossover frequency, fC. Next, in order to produce the desired target
crossover frequency, the gain of the compensation network at the point of maximum phase boost, G
CENTER
,
must be set to –19dB. The gain of the compensated error
amplifier at the point of maximum phase gain is given by:
G
CENTER
= 10log
( )
2πf
2πf
3
R
( )
Z
P
TOPCFB
dB
2
Rev. C
For more information www.analog.com
27
Page 28

LTC3115-1
GAIN (dB)
PHASE (DEG)
15
90
APPLICATIONS INFORMATION
Assuming a multiple of 50 separation between the pole
frequencies and zero frequencies this can be simplified
to the following expression:
G
CENTER
= 20log
2πfCR
50
TOPCFB
dB
This equation completes the set of constraints needed
to determine the compensation component values.
Specifically, the two zeros, f
located near 3.43kHz. The two poles, f
ZERO1
and f
ZERO2
POLE2
, should be
and f
POLE3
,
should be located near 168kHz and the gain should be set
to provide a gain at the crossover frequency of G
CENTER
= –19dB.
The first step in defining the compensation component
values is to pick a value for R
that provides an accept-
TOP
ably low quiescent current through the resistor divider.
A value of R
= 1MΩ is a reasonable choice. Next, the
TOP
value of CFB can be found in order to set the error amplifier gain at the crossover frequency to –19dB as follows:
G
CENTER
= –19.1dB
Next, CFF can be chosen to set the second zero, f
ZERO2
, to
the common zero frequency of 3.43kHz.
1
3.43kHz
(
)
≅ 47 pF
)
CFF=
2π 1M Ω
(
Finally, the resistor value RFF can be chosen to place the
second pole at 168kHz.
1
(
168Hz
(
)
≅ 20.0kΩ
)
RFF=
2π 47pF
Now that the pole frequencies, zero frequencies and gain
of the compensation network have been established, the
next step is to generate a Bode plot for the compensated
error amplifier to confirm its gain and phase properties.
A Bode plot of the error amplifier with the designed compensation component values is shown in Figure13. The
Bode plot confirms that the peak phase occurs at 24kHz
and the phase boost at that point is 57.7°. In addition,
the gain at the peak phase frequency is –19.3dB which is
close to the design target.
C
FB
=20log
=
2π 24kHz
(
2π 24kHz
(
50
1MΩ
(
)
)
alog
50
1MΩ
(
)
–19.1
20
C
)
FB
≅ 3.0nF
The compensation poles can be set at 168kHz and the
zeros at 3.43kHz by using the expressions for the pole
and zero frequencies given in the previous section. Setting
the frequency of the first zero, f
, to 3.43kHz results
ZERO1
in the following value for RFB:
RFB=
2π 3nF
This leaves the free parameter, C
f
to the common pole frequency of 168kHz as given:
POLE1
C
=
POLE
2π 15.4kΩ
1
(
3.43kHz
(
)
1
(
168kHz
(
)
≅ 15.4kΩ
)
POLE
)
, to set the frequency
≅ 62pF
10
5
0
–5
–10
–15
–20
–25
–30
–35
–40
10
100 1k 10k 100k
Figure13. Compensated Error Amplifier Bode Plot
PHASE
GAIN
FREQUENCY (Hz)
f
C
3115 F13
1M
60
30
0
–30
–60
–90
Rev. C
28
For more information www.analog.com
Page 29
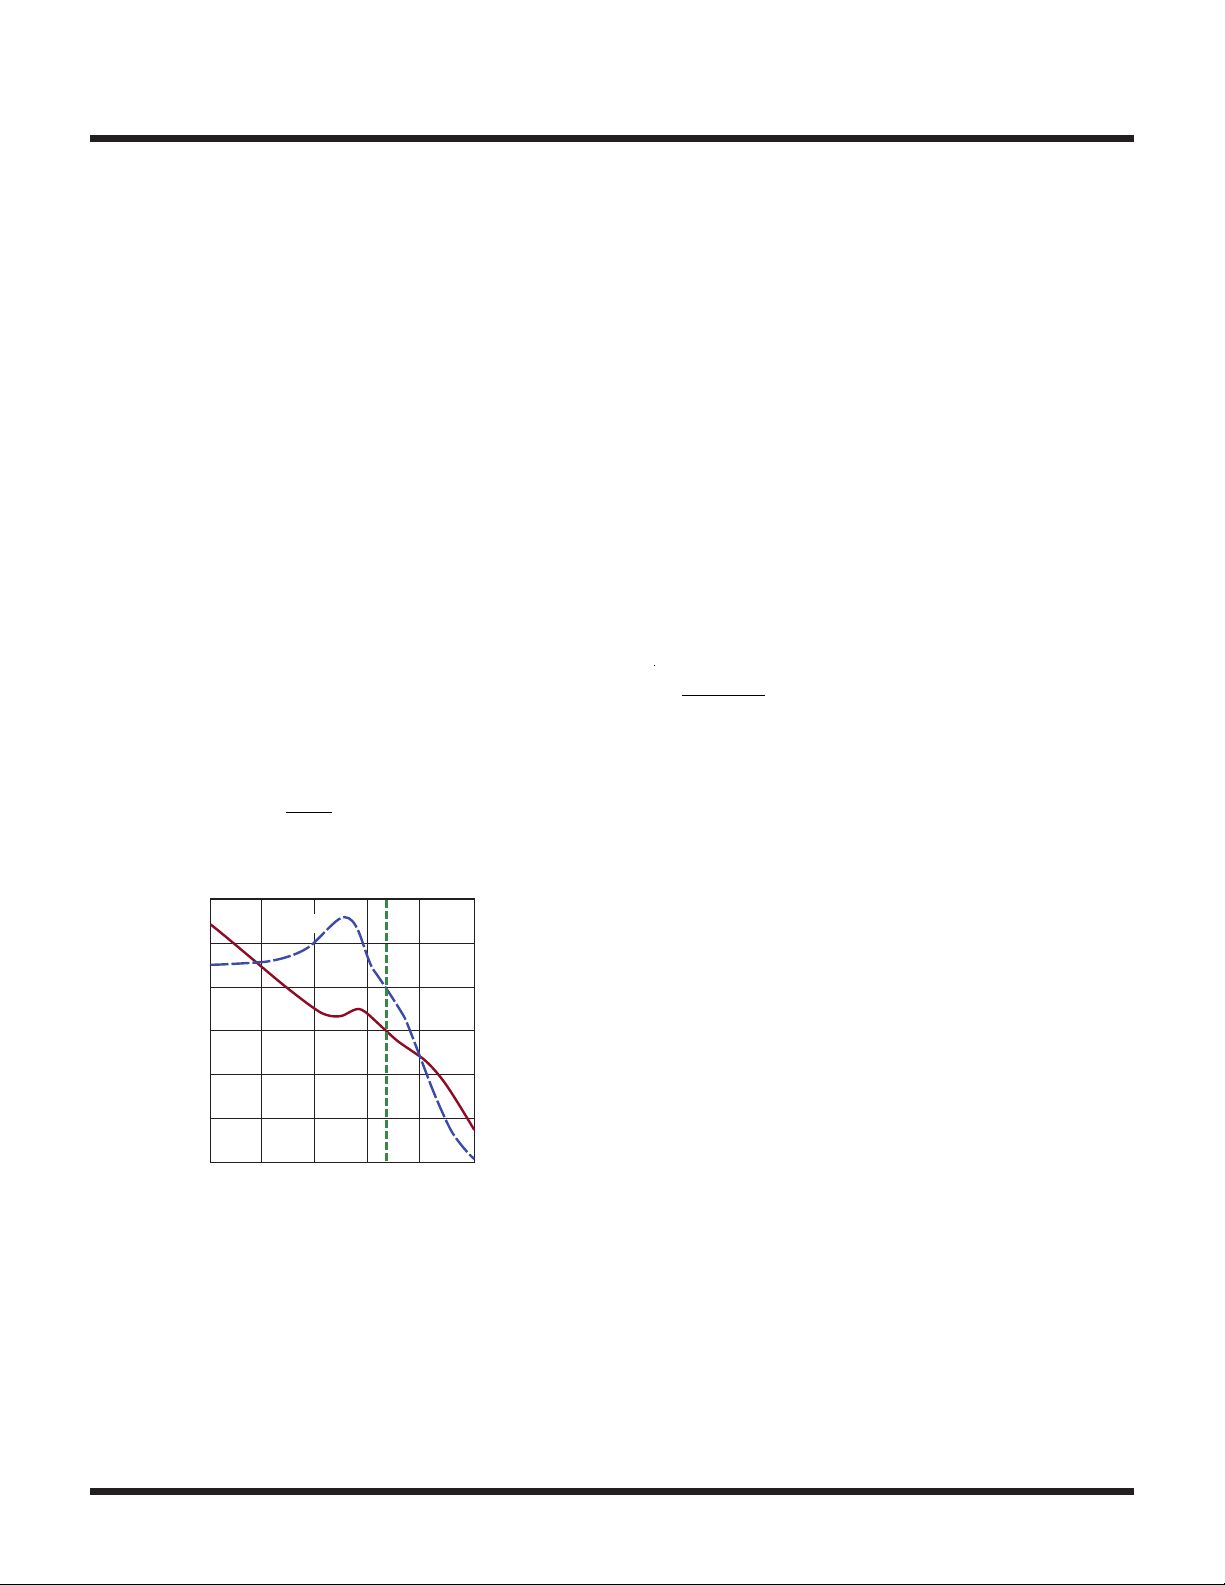
APPLICATIONS INFORMATION
GAIN (dB)
PHASE (DEG)
T
(
)
LTC3115-1
The final step in the design process is to compute the
Bode plot for the entire loop using the designed compensation network and confirm its phase margin and
crossover frequency. The complete loop Bode plot for
this example is shown in Figure14. The loop crossover
frequency is 22kHz which is close to the design target and
the phase margin is approximately 60°.
The Bode plot for the complete loop should be checked
over all operating conditions and for variations in component values to ensure that sufficient phase margin exists
in all cases. The stability of the loop should also be confirmed via time domain simulation and by evaluating the
transient response of the converter in the actual circuit.
Output Voltage Programming
The output voltage is set via the external resistor divider
comprised of resistors R
TOP
and R
as show in Figure8
BOT
and Figure9. The resistor divider values determine the
output regulation voltage according to:
V
= 1.000V 1+
OUT
60
40
20
–20
0
R
R
PHASE
GAIN
TOP
BOT
180
120
60
0
–60
In addition to setting the output voltage, the value of
R
is instrumental in controlling the dynamics of the
TOP
compensation network. When changing the value of this
resistor, care must be taken to understand the impact this
will have on the compensation network.
In addition, the Thevenin equivalent resistance of the
resistor divider controls the gain of the current limit. To
maintain sufficient gain in this loop, it is recommended
that the value of R
be chosen to be 1MΩ or larger.
TOP
Switching Frequency Selection
The switching frequency is set by the value of a resistor
connected between the RT pin and ground. The switching
frequency, f, is related to the resistor value by the following equation where RT is the resistance:
35.7MHz
f =
R
/ kΩ
Higher switching frequencies facilitate the use of smaller
inductors as well as smaller input and output filter capacitors which results in a smaller solution size and reduced
component height. However, higher switching frequencies
also generally reduce conversion efficiency due to the
increased switching losses.
In addition, higher switching frequencies (above 750kHz)
will reduce the maximum output current that can be supplied (see Typical Performance Characteristics for details).
For applications with V
≥ 20V, a maximum switching
OUT
frequency of 1MHz is recommended.
–40
f
–60
10
100 1k 10k 100k
FREQUENCY (Hz)
Figure14. Complete Loop Bode Plot
C
–120
–180
1M
31151 F14
For more information www.analog.com
Rev. C
29
Page 30
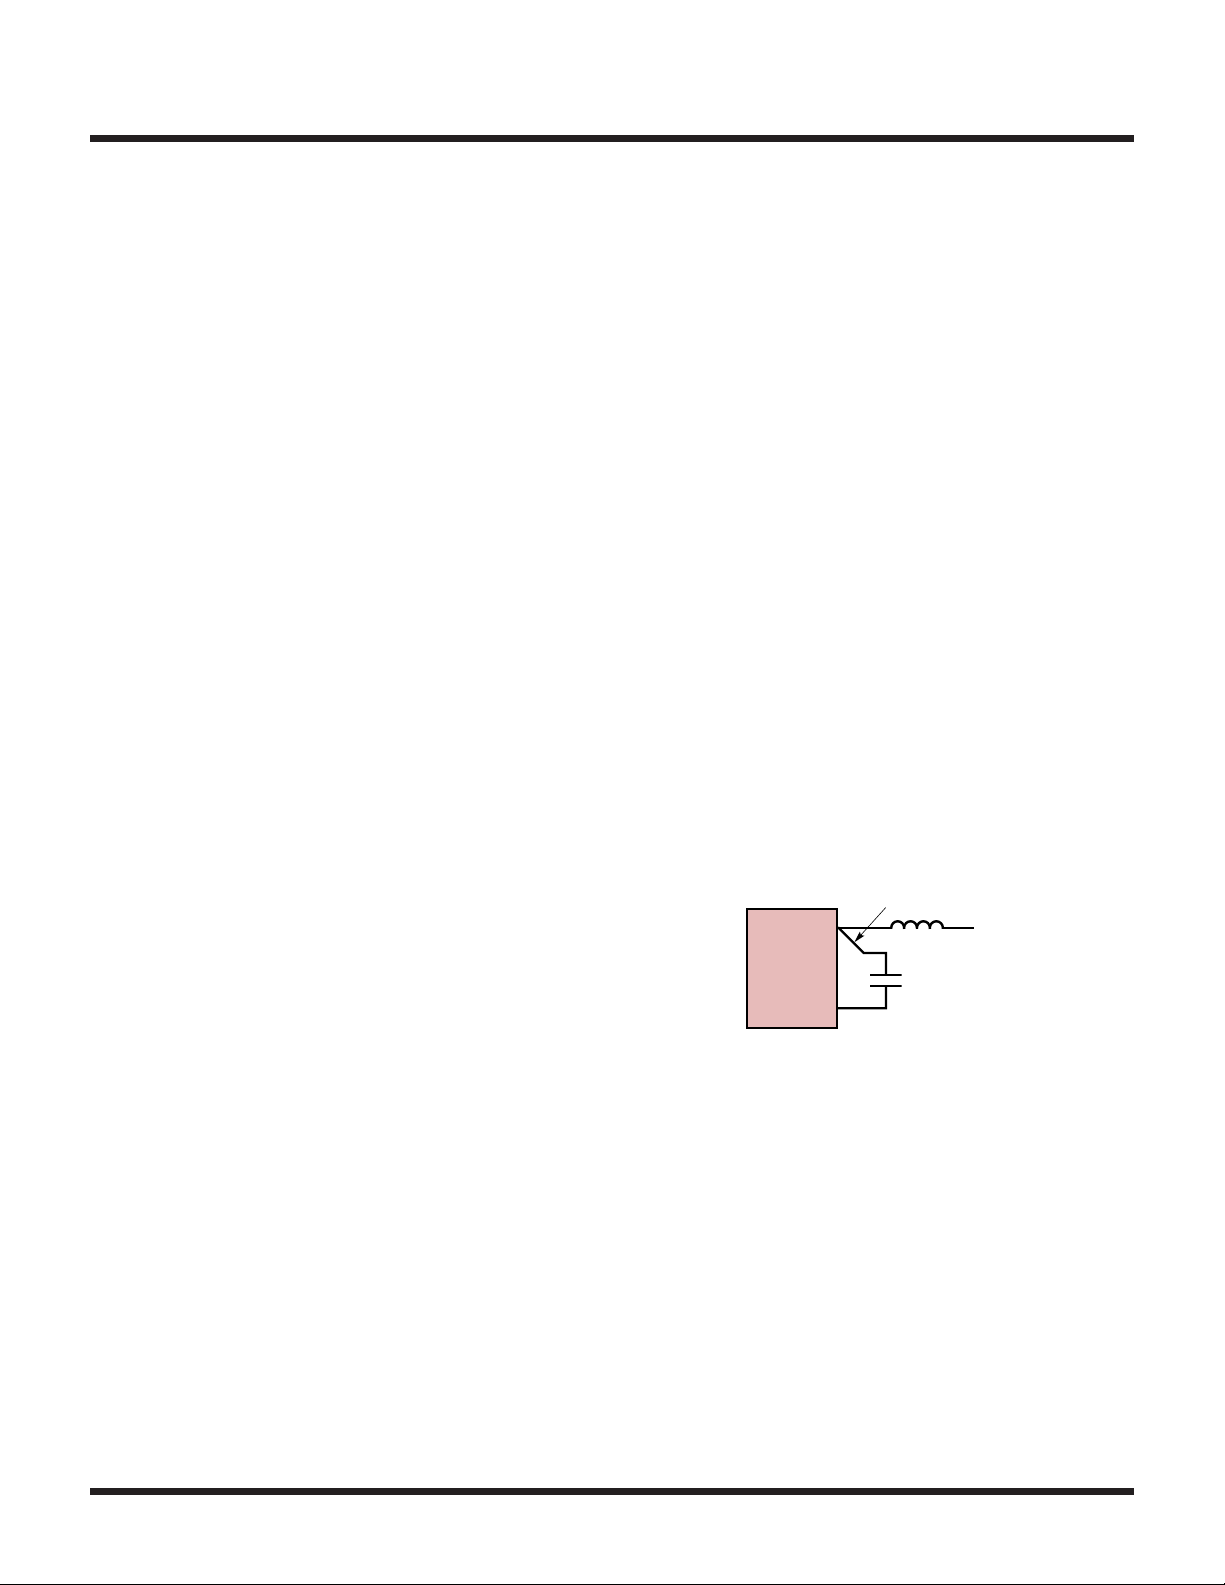
LTC3115-1
31151 F15
APPLICATIONS INFORMATION
PCB Layout Considerations
The LTC3115-1 buck-boost converter switches large currents at high frequencies. Special attention should be paid
to the PC board layout to ensure a stable, noise-free and
efficient application circuit. Figure16 and Figure17 show
a representative PCB layout for each package option to
outline some of the primary considerations. A few key
guidelines are provided below:
1. The parasitic inductance and resistance of all circulating
high current paths should be minimized. This can be
accomplished by keeping the routes to all bold components in Figure16 and Figure17 as short and as wide
as possible. Capacitor ground connections should via
down to the ground plane by way of the shortest route
possible. The bypass capacitors on PVIN, PV
OUT
and
PVCC/VCC should be placed as close to the IC as possible
and should have the shortest possible paths to ground.
2. The exposed pad is the electrical power ground
connection for the LTC3115-1 in the DHD package.
Multiple vias should connect the backpad directly to
the ground plane. In addition, maximization of the metallization connected to the backpad will improve the
thermal environment and improve the power handling
capabilities of the IC in both the FE and DHD packages.
3. The components shown in bold and their connections
should all be placed over a complete ground plane to
minimize loop cross-sectional areas. This minimizes
EMI and reduces inductive drops.
5. To prevent large circulating currents in the ground plane
from disrupting operation of the LTC3115-1, all smallsignal grounds should return directly to GND by way
of a dedicated Kelvin route. This includes the ground
connection for the RT pin resistor, and the ground connection for the feedback network as shown in Figure16
and Figure17.
6. Keep the routes connecting to the high impedance,
noise sensitive inputs FB and RT as short as possible
to reduce noise pick-up.
7. The BST1 and BST2 pins transition at the switching
frequency to the full input and output voltage respectively. To minimize radiated noise and coupling, keep
the BST1 and BST2 routes as short as possible and
away from all sensitive circuitry and pins (VC, FB, RT).
In many applications the length of traces connecting to
the boost capacitors can be minimized by placing the
boost capacitors on the back side of the PC board and
routing to them via traces on an internal copper layer.
8 Connections from the BST1 and BST2 capacitors must
Kelvin directly back to the respective SW pin as shown
in Figure15.
THIS ROUTE MUST KELVIN CONNECT
DIRECTLY BACK TO THE SW2 PIN
SW2
LTC3115-1
0.1µF
BST2
4. Connections to all of the components shown in bold
should be made as wide as possible to reduce the
series resistance. This will improve efficiency and
maximize the output current capability of the buckboost converter.
30
For more information www.analog.com
Figure15. Kelvin BST Connections
9. If the optional Schottky diode from SW2 to PV
OUT
utilized, the Schottky should be placed as close to the
SW2 and PV
pins as possible and connected with
OUT
the shortest possible traces.
is
Rev. C
Page 31
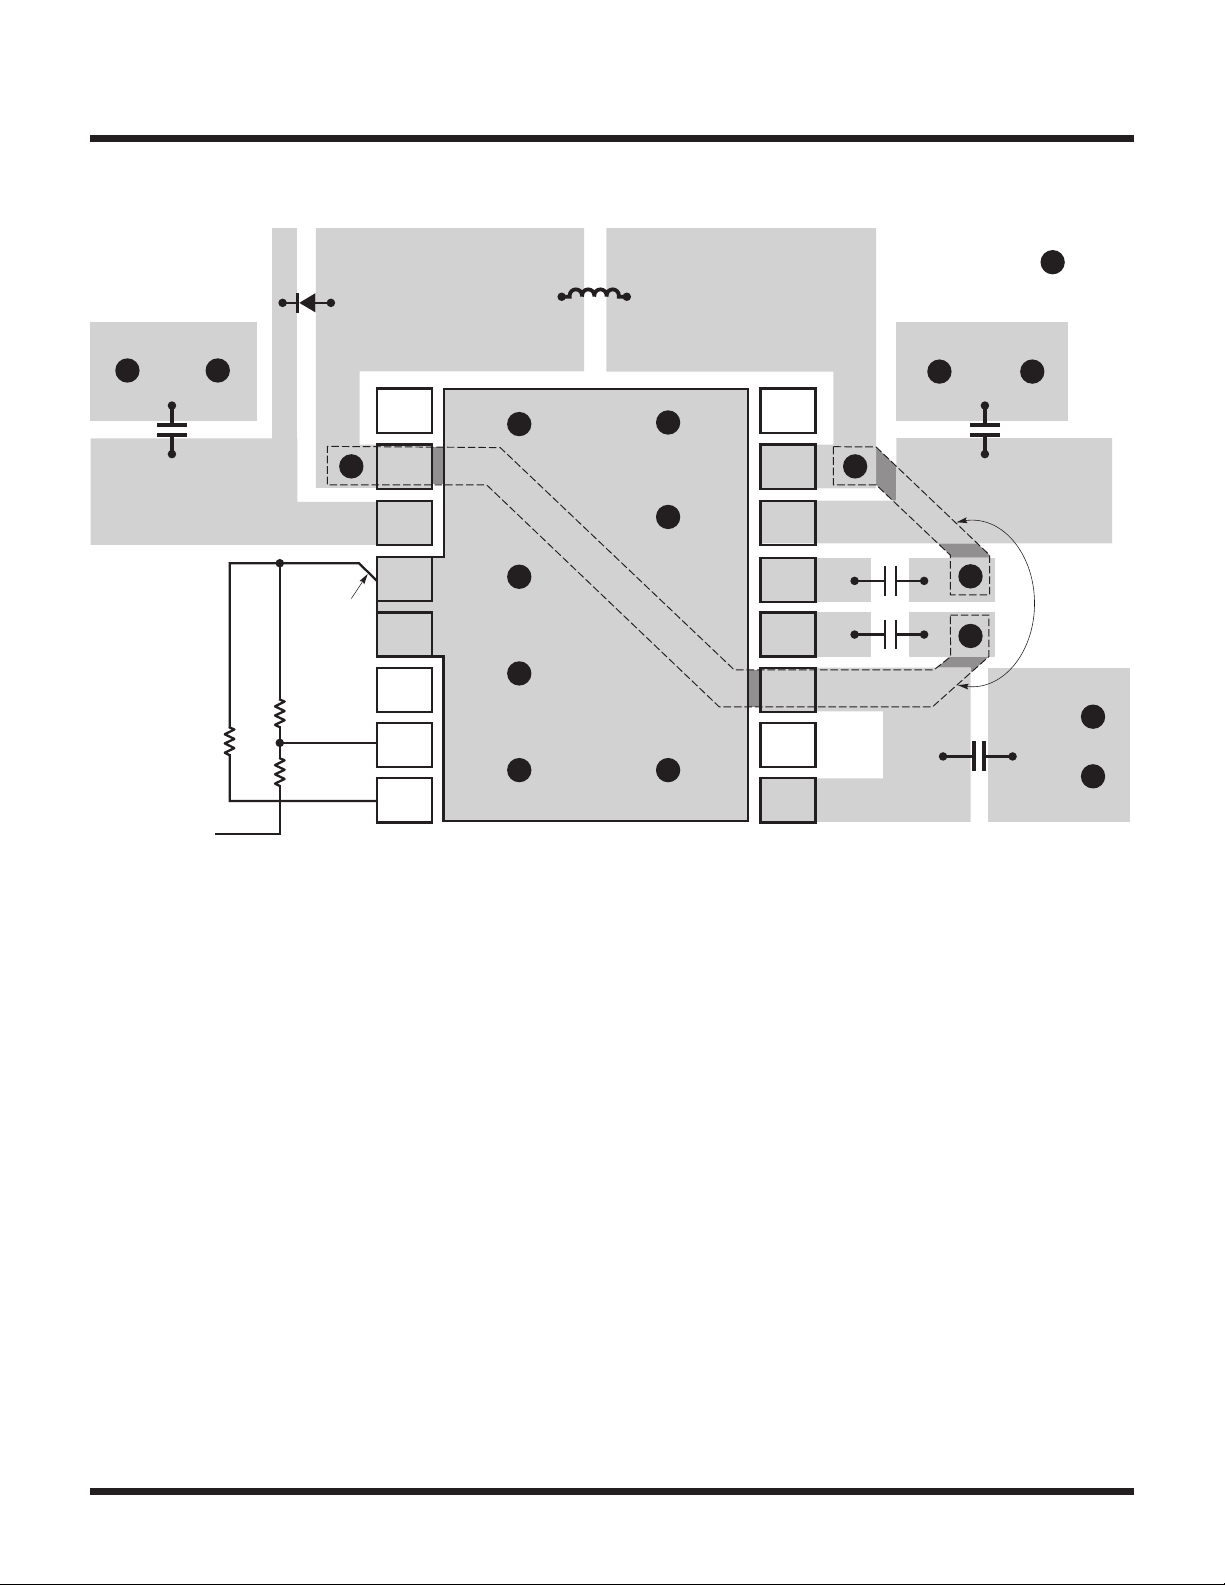
APPLICATIONS INFORMATION
OPTIONAL SCHOTTKY DIODE
LTC3115-1
VIA TO GROUND PLANE
(AND TO INNER LAYER
WHERE SHOWN)
[1]
RUN
[2]
V
OUT
KELVIN
BACK TO
GND PIN
R
BOT
R
T
R
TOP
KELVIN
TO V
OUT
SW2
[3]
PV
OUT
[4]
GND
[5]
GND
[6]
VC
[7]
FB
[8]
RT
UNINTERRUPTED GROUND PLANE SHOULD EXIST UNDER ALL COMPONENTS SHOWN IN
BOLD AND UNDER TRACES CONNECTING TO THOSE COMPONENTS
[17]
PGND
[16]
PWM/
SYNC
[15]
SW1
[14]
PV
[13]
BST1
[12]
BST2
[11]
PV
[10]
V
IN
[9]
V
CC
V
IN
IN
C
BST1
C
BST2
CC
INNER PCB
LAYER ROUTES
31151 F16
Figure16. PCB Layout Recommended for the DHD Package
For more information www.analog.com
Rev. C
31
Page 32
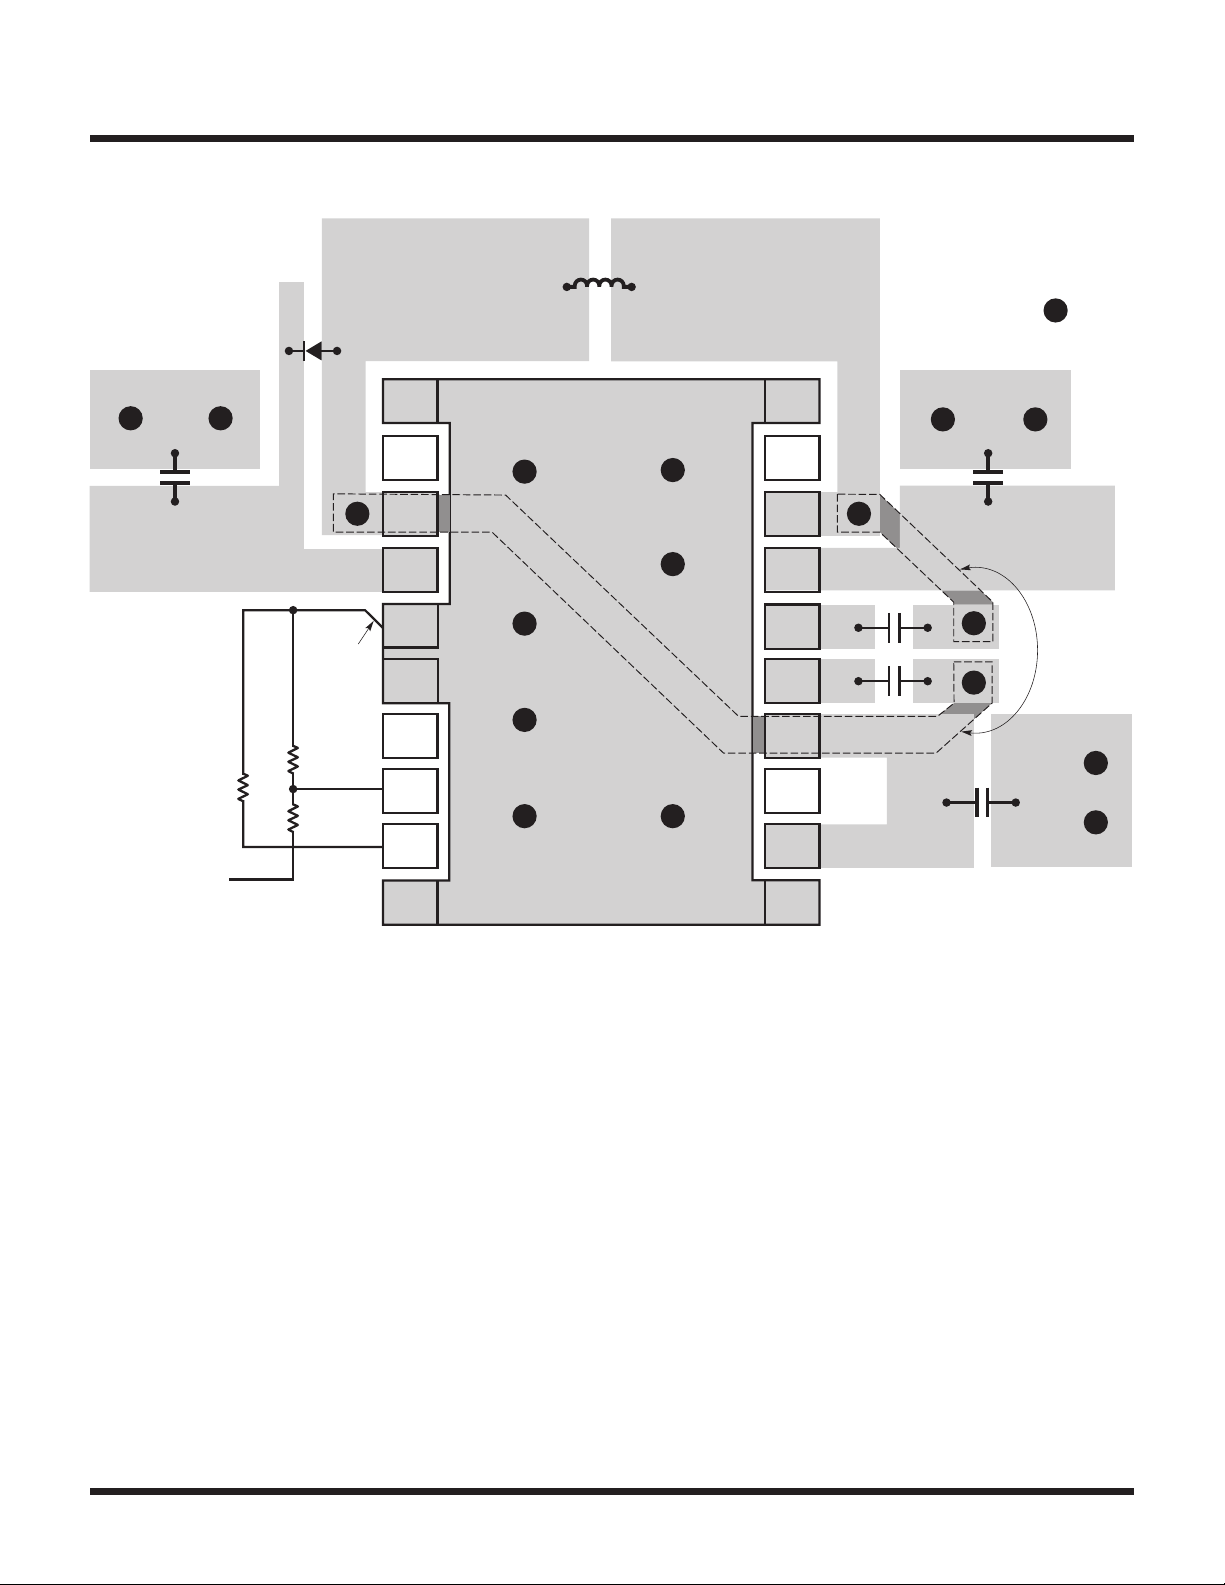
LTC3115-1
APPLICATIONS INFORMATION
OPTIONAL SCHOTTKY DIODE
VIA TO GROUND PLANE
(AND TO INNER LAYER
WHERE SHOWN)
[1]
PGND
[2]
RUN
[3]
V
OUT
KELVIN
BACK TO
GND PIN
R
BOT
R
T
R
TOP
KELVIN
TO V
OUT
SW2
[4]
PV
OUT
[5]
GND
[6]
GND
[7]
VC
[8]
FB
[9]
RT
[10]
PGND
UNINTERRUPTED GROUND PLANE SHOULD EXIST UNDER ALL COMPONENTS SHOWN IN
BOLD AND UNDER TRACES CONNECTING TO THOSE COMPONENTS
[21]
PGND
[20]
PGND
[19]
PWM/
SYNC
[18]
SW1
[17]
PV
[16]
BST1
[15]
BST2
[14]
PV
[13]
V
IN
[12]
V
CC
[11]
PGND
V
IN
IN
C
BST1
C
BST2
CC
INNER PCB
LAYER ROUTES
31151 F17
32
Figure17. PCB Layout Recommended for the FE Package
Rev. C
For more information www.analog.com
Page 33
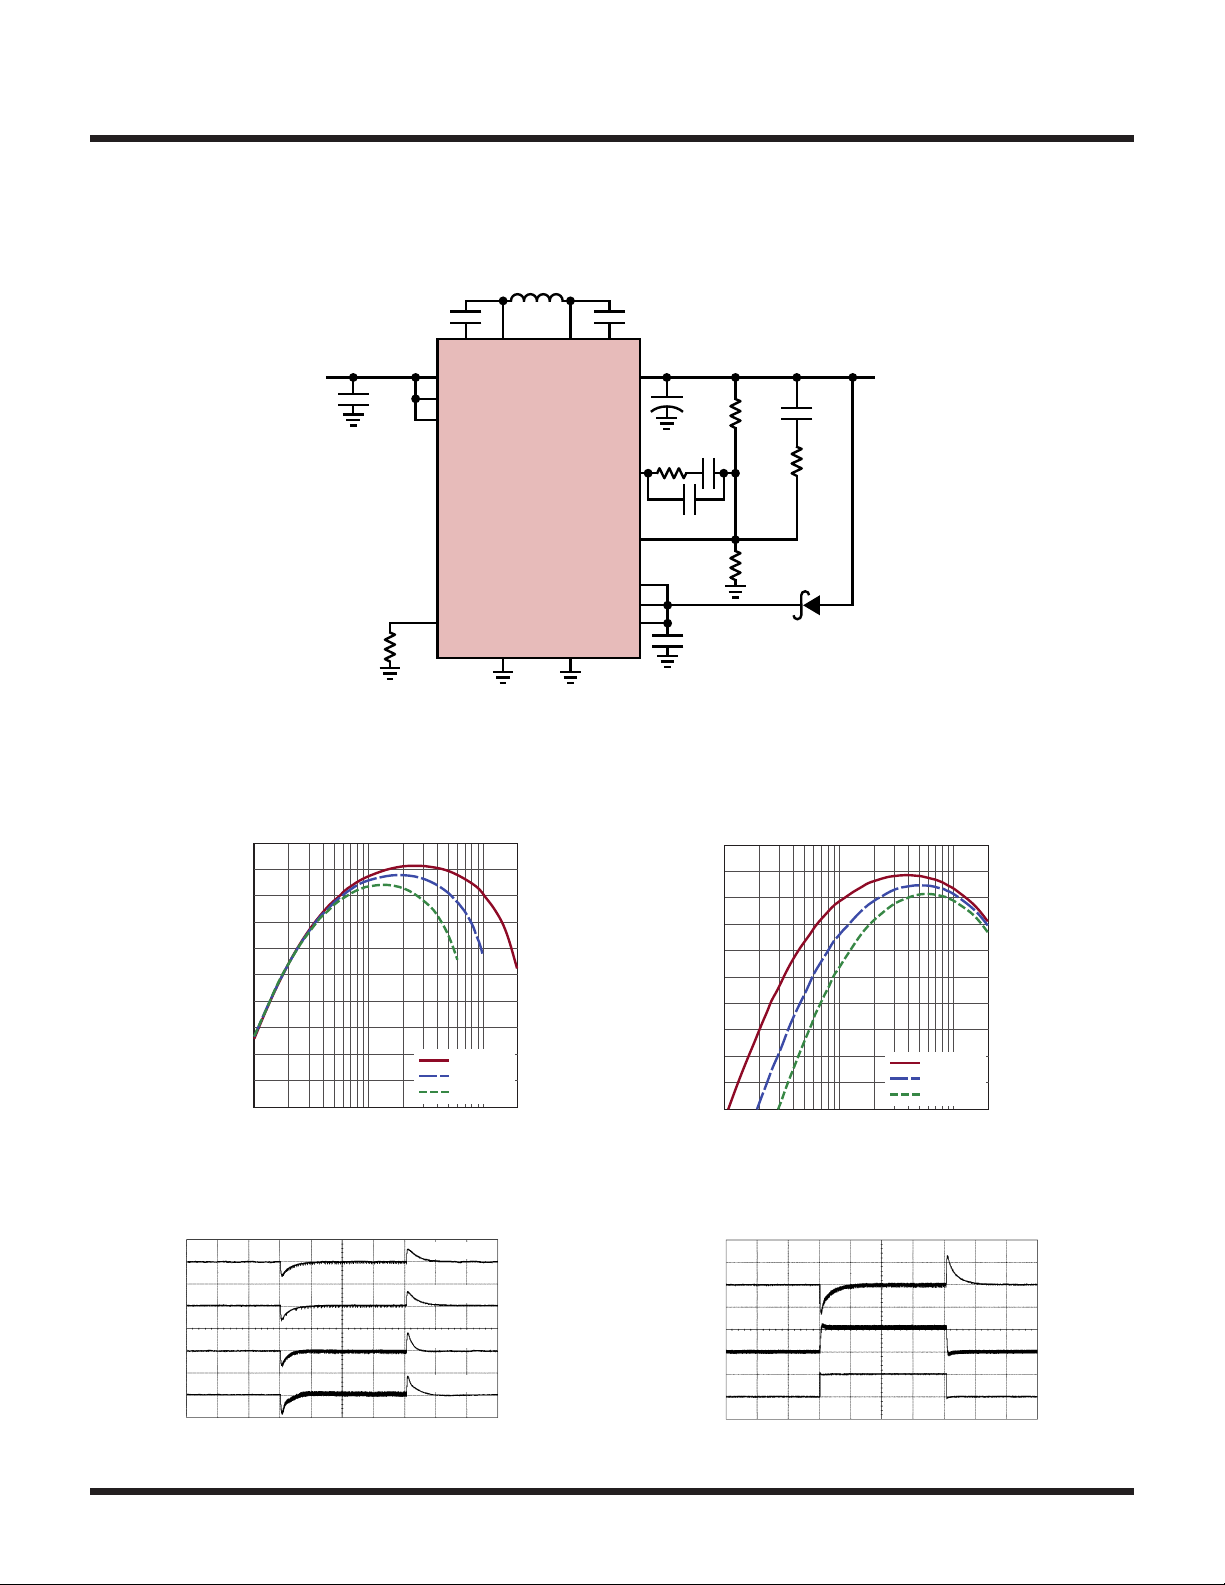
TYPICAL APPLICATIONS
(200mV/DIV)
(200mV/DIV)
(200mV/DIV)
(200mV/DIV)
2ms/DIV
INDUCTOR CURRENT
2ms/DIV
31151 TA02e
Wide Input Voltage Range (2.7V to 40V), High Efficiency 300kHz, Low Noise 5V Regulator
2.7V TO
40V
C
IN
10µF
R
T
121k
L1
33µH
C
BST1
0.1µF
SW1 SW2
BST1 BST2
PV
IN
V
IN
RUN
LTC3115-1
PWM/SYNC
RT
GND PGND
: MURATA GRM55DR61H106K
C
IN
: POSCAP 6TPB330M (7.3mm × 4.3mm × 2.8mm)
C
O
D1: PANASONIC MA785
L1: COILCRAFT MSS1260
C
BST2
0.1µF
PV
OUT
VC
FB
PV
CC
V
CC
+
93.1k
LTC3115-1
5V
1A V
> 3.6V
IN
≥ 6V
2A V
C
O
R
330µF
R
FB
3300pF
27pF
C1
4.7µF
TOP
1M
C
FB
R
BOT
249k
D1
C
82pF
R
FF
249k
FF
IN
31151 TA02a
PWM Mode Efficiency
vs Load Current
100
95
90
85
80
75
70
EFFICIENCY (%)
65
60
55
50
0.01
Transient for a 0A to 1A Load Step
OUT
V
OUT
V
OUT
V
OUT
V
OUT
0.1 1
LOAD CURRENT (A)
VIN = 5V
= 3.6V
V
IN
= 2.7V
V
IN
VIN = 36V
VIN = 12V
VIN = 5V
VIN = 3.6V
31151 TA02d
31151 TA02b
LOAD CURRENT
100
EFFICIENCY (%)
V
OUT
V
OUT
(200mV/DIV)
(2A/DIV)
(2A/DIV)
95
90
85
80
75
70
65
60
55
50
PWM Mode Efficiency
vs Load Current
0.01
LOAD CURRENT (A)
Transient for a 0A to 2A Load Step, VIN = 24VV
VIN = 12V
V
IN
V
IN
0.1 1
= 24V
= 36V
31151 TA02c
Rev. C
For more information www.analog.com
33
Page 34
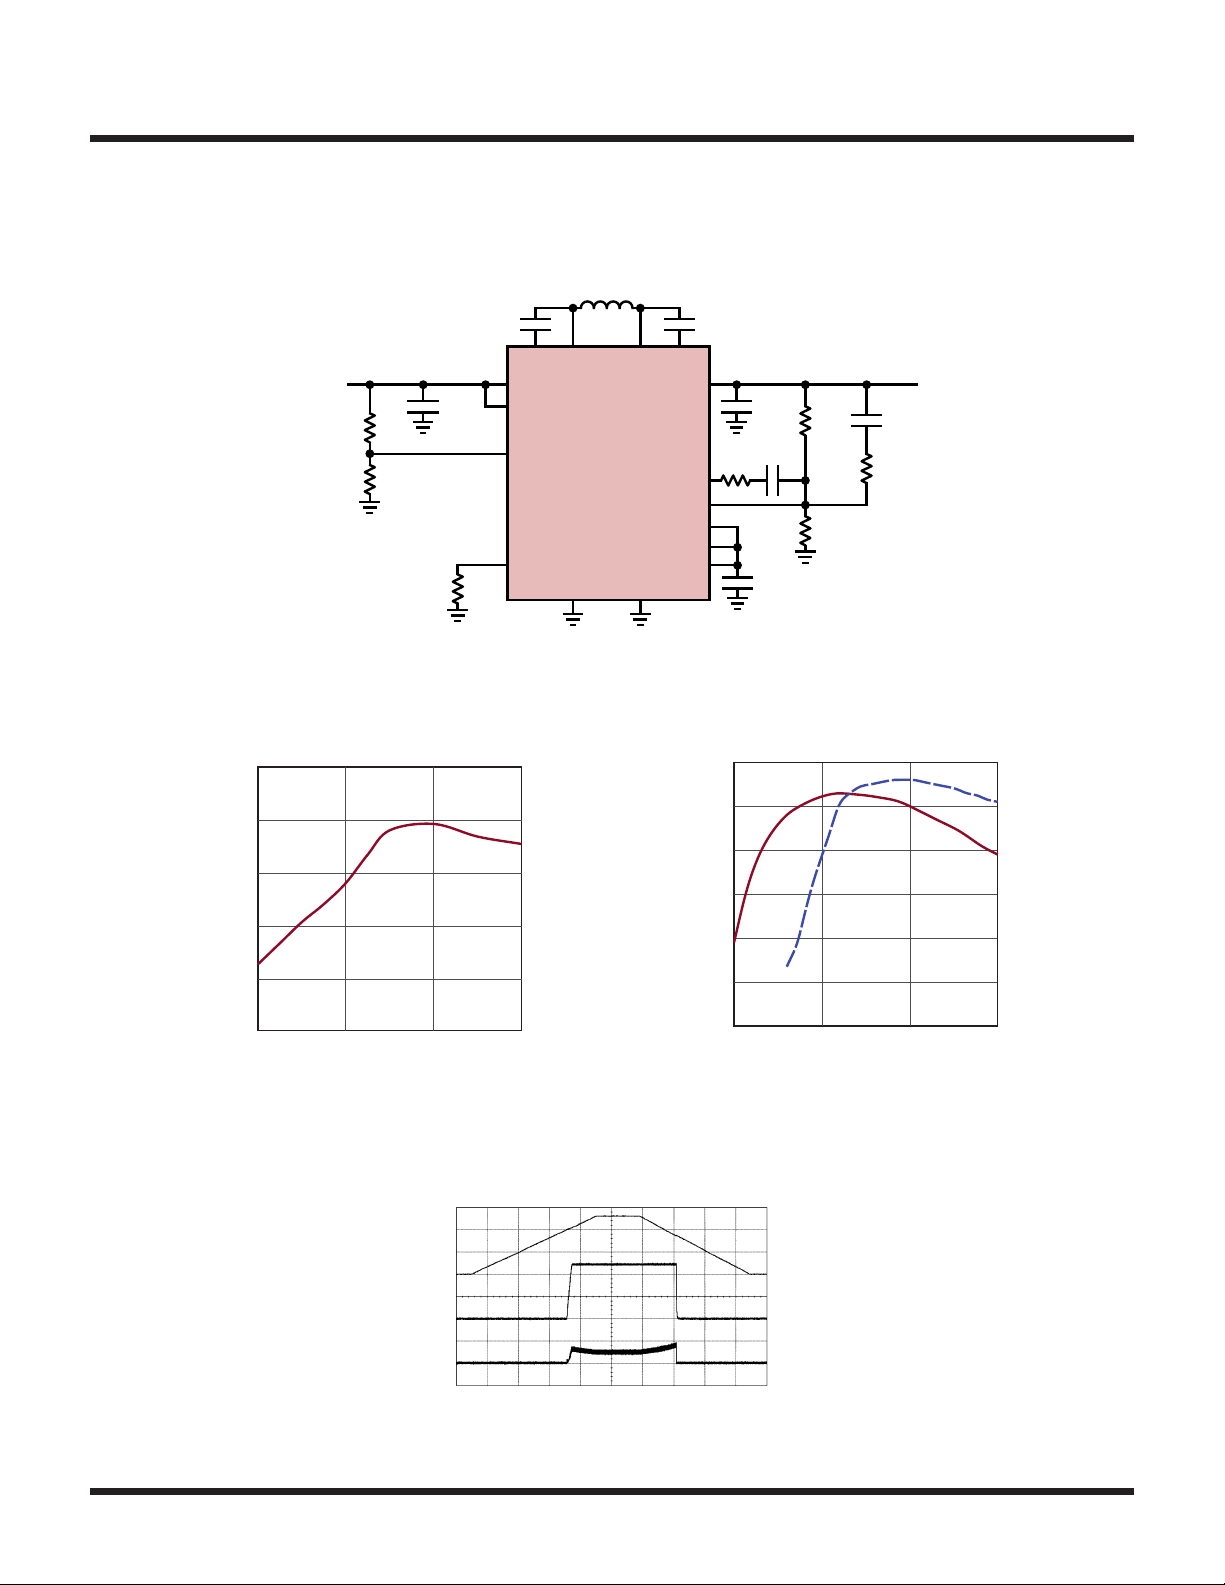
LTC3115-1
LOAD CURRENT (A)
31151 TA03b
2.5
92
31151 TA03c
40
INDUCTOR
50ms/DIV
31151 TA03d
TYPICAL APPLICATIONS
Wide Input Voltage Range (10V to 40V) 1MHz 24V Supply at 500mA
10V TO 40V
UVLO
PROGRAMMED
TO 10V (1.3V
HYSTERESIS)
R1
953k
R2
130k
C
IN
10µF
C
BST1
0.1µF
BST1 BST2
SW1 SW2
PV
IN
V
IN
RUN
RT
R
T
35.7k
GND PGND
L1: WÜRTH 744 066 150
L1
15µH
LTC3115-1
PV
OUT
PWM/SYNC
PV
V
VC
FB
CC
CC
C
BST2
0.1µF
R
10k
FB
C
O
10µF
C
FB
3300pF
C1
4.7µF
31151 TA03a
R
TOP
1M
R
BOT
43.2k
R
10k
C
FF
22pF
FF
24V
500mA
Maximum Load Current vs V
2.0
1.5
1.0
0.5
0
10
20
INPUT VOLTAGE (V)
IN
90
88
86
EFFICIENCY (%)
84
82
30
40
80
= 0.5A
I
LOAD
10
Efficiency vs V
I
= 1A
LOAD
20 30
INPUT VOLTAGE (V)
IN
Power-Up/Down Waveforms,
I
= 0.5A
LOAD
V
IN
(5V/DIV)
V
OUT
(10V/DIV)
34
CURRENT
(2A/DIV)
Rev. C
For more information www.analog.com
Page 35
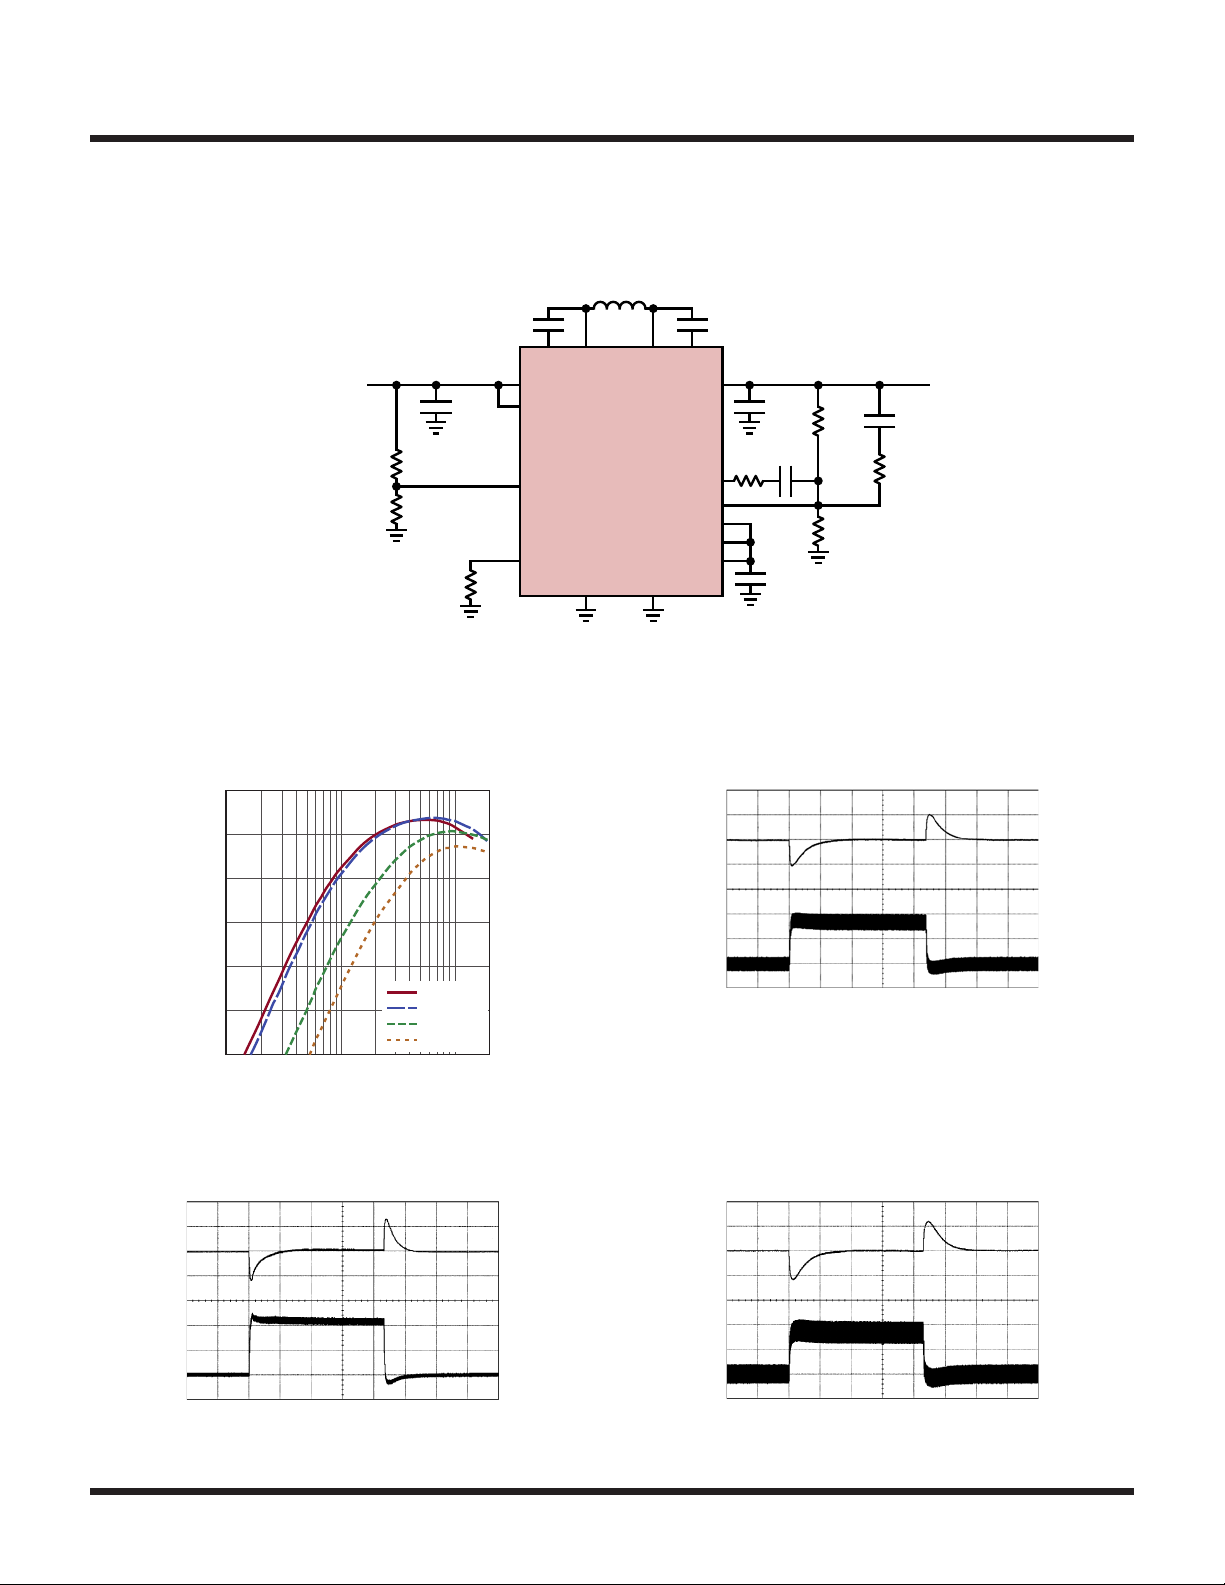
TYPICAL APPLICATIONS
(500mV/DIV)
500µs/DIV
31151 TA04e
Industrial 12V 1MHz Regulator with Custom Input Undervoltage Lockout Thresholds
10V TO
40V
ENABLED WHEN V
REACHES 10.6V
DISABLED WHEN V
FALLS BELOW 8.7V
R1
IN
2M
R2
IN
255k
C
IN
10µF
C
BST1
0.1µF
SW1 SW2
BST1 BST2
PV
IN
V
IN
RUN
RT
R
T
35.7k
GND PGND
: MURATA GRM55DR61H106K
C
IN
: TDK CKG57NX5R1H226M
C
O
L1: WÜRTH 744065100
L1
10µH
LTC3115-1
PV
OUT
PWM/SYNC
PV
V
VC
FB
CC
CC
C
BST2
0.1µF
R
FB
40.2k
C
O
22µF
C
FB
820pF
C1
4.7µF
31151 TA04a
R
TOP
1M
R
BOT
90.9k
LTC3115-1
12V
1.4A
C
FF
33pF
R
FF
10k
V
OUT
(500mV/DIV)
PWM Mode Efficiency
vs Load Current 0A to 1.5A Load Step, VIN = 24V
100
V
90
80
70
EFFICIENCY (%)
60
50
40
0.01
0.1 1
LOAD CURRENT (A)
VIN = 10.6V
= 12V
V
IN
= 24V
V
IN
= 36V
V
IN
31151 TA04b
OUT
(500mV/DIV)
INDUCTOR
CURRENT
(1A/DIV)
500µs/DIV
0A to 1.5A Load Step, VIN = 10.6V 0A to 1.5A Load Step, VIN = 40V
V
OUT
31151 TA04c
INDUCTOR
CURRENT
(1A/DIV)
500µs/DIV
31151 TA04d
For more information www.analog.com
INDUCTOR
CURRENT
(1A/DIV)
Rev. C
35
Page 36

LTC3115-1
10ms/DIV
31151 TA05b
INDUCTOR
500µs/DIV
EFFICIENCY (%)
100
31151 TA05d
TYPICAL APPLICATIONS
24V 750kHz Industrial Rail Restorer
V
(5V/DIV)
V
OUT
(5V/DIV)
20V TO 40V
OPEN
DRAIN
OUTPUT
ON OFF
R1
500k
Regulated Output Voltage from a
Time Varying Input Rail 0A to 1.5A Load Step, VIN = 20V
IN
C
BST1
0.1µF
C
10µF
20V
PV
IN
V
RUN
C
: OS-CON 35SVPF82M
O
L1: TOKO 892NBS-220M
40V
L1
22µH
BST1 BST2
SW1 SW2
IN
IN
LTC3115-1
GND PGND
PV
PWM/SYNC
PV
C
BST2
0.1µF
OUT
VC
FB
RT
CC
V
CC
CURRENT
(1A/DIV)
(1V/DIV)
CURRENT
(2A/DIV)
LOAD
V
OUT
*
+
1µF
R
FB
25k
100pF
R
47.5k
C1
4.7µF
31151 TA05a
*OPTIONAL: INSTALL IN
APPLICATIONS SUBJECT TO
OUTPUT OVERLOAD OR
SHORT-CIRCUIT CONDITIONS
C
O
R
82µF
C
3300pF
T
TOP
1M
FB
R
BOT
43.2k
R
51k
C
FF
47pF
FF
24V
1.5A
31151 TA05c
36
Efficiency vs Load Current
90
80
70
60
50
40
30
20
0.01
For more information www.analog.com
0.10 1
LOAD CURRENT (A)
VIN = 20V
= 24V
V
IN
= 36V
V
IN
Rev. C
Page 37
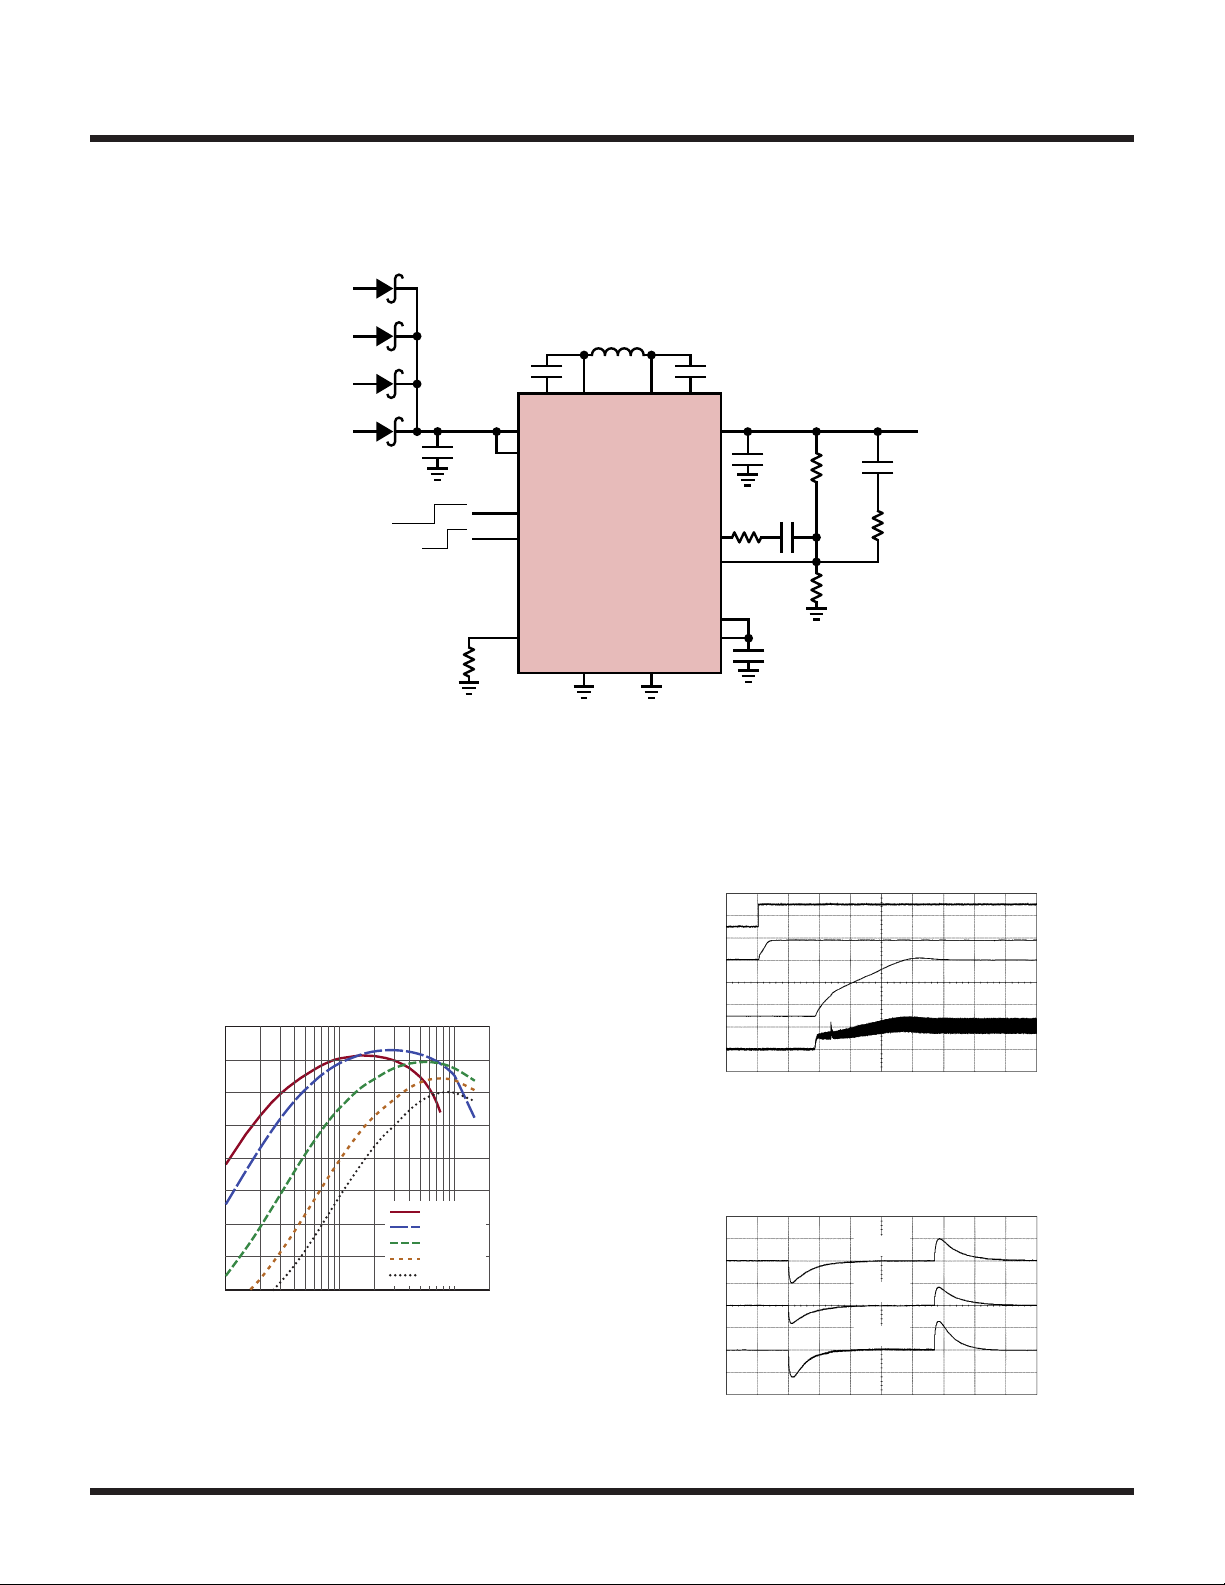
TYPICAL APPLICATIONS
EFFICIENCY (%)
100
31151 TA06b
(200mV/DIV)
(200mV/DIV)
(200mV/DIV)
1ms/DIV
31151 TA06d
(500mA/DIV)
2ms/DIV
31151 TA06c
USB, FireWire, Automotive and Unregulated Wall Adapter to Regulated 5V (750kHz)
D1
USB
4.1V TO 5.5V
FireWire
8V TO 36V
AUTOMOTIVE
3.6V TO 40V
WALL ADAPTER
4V TO 40V
D2
D3
D4
BURST PWM
OFF ON
10µF
C
BST1
0.1µF
BST1 BST2
SW1 SW2
PV
IN
V
IN
PWM/SYNC
RUN
RT
R
T
47.5k
GND PGND
L1
10µH
LTC3115-1
LTC3115-1
C
BST2
0.1µF
R
51k
C
FF
47pF
FF
5V
750mA
PV
OUT
VC
FB
PV
CC
V
CC
R
100k
FB
C
O
47µF
×2
C
FB
4700pF
C1
4.7µF
31151 TA06a
R
TOP
1M
R
249k
BOT
Efficiency vs Load Current,
from Automotive Input
90
80
70
60
50
40
30
20
0.01
0.1 1
LOAD CURRENT (A)
VIN = 3.6V
= 5V
V
IN
= 12V
V
IN
= 24V
V
IN
= 36V
V
IN
: MURATA GRM55DR61H106K
C
IN
: GRM43ER60J476
C
O
D1-D4: B360A-13-F
L1: COILCRAFT LPS6225
Soft-Start Waveform, VIN = 24V, I
V
RUN
(5V/DIV)
V
CC
(5V/DIV)
V
OUT
(2V/DIV)
INDUCTOR
CURRENT
LOAD
= 0.5A
Output Voltage Transient Response,
750mA Load Step, Powered from Automotive Input
V
OUT
V
OUT
V
OUT
VIN = 36V
VIN = 12V
VIN = 3.6V
For more information www.analog.com
Rev. C
37
Page 38
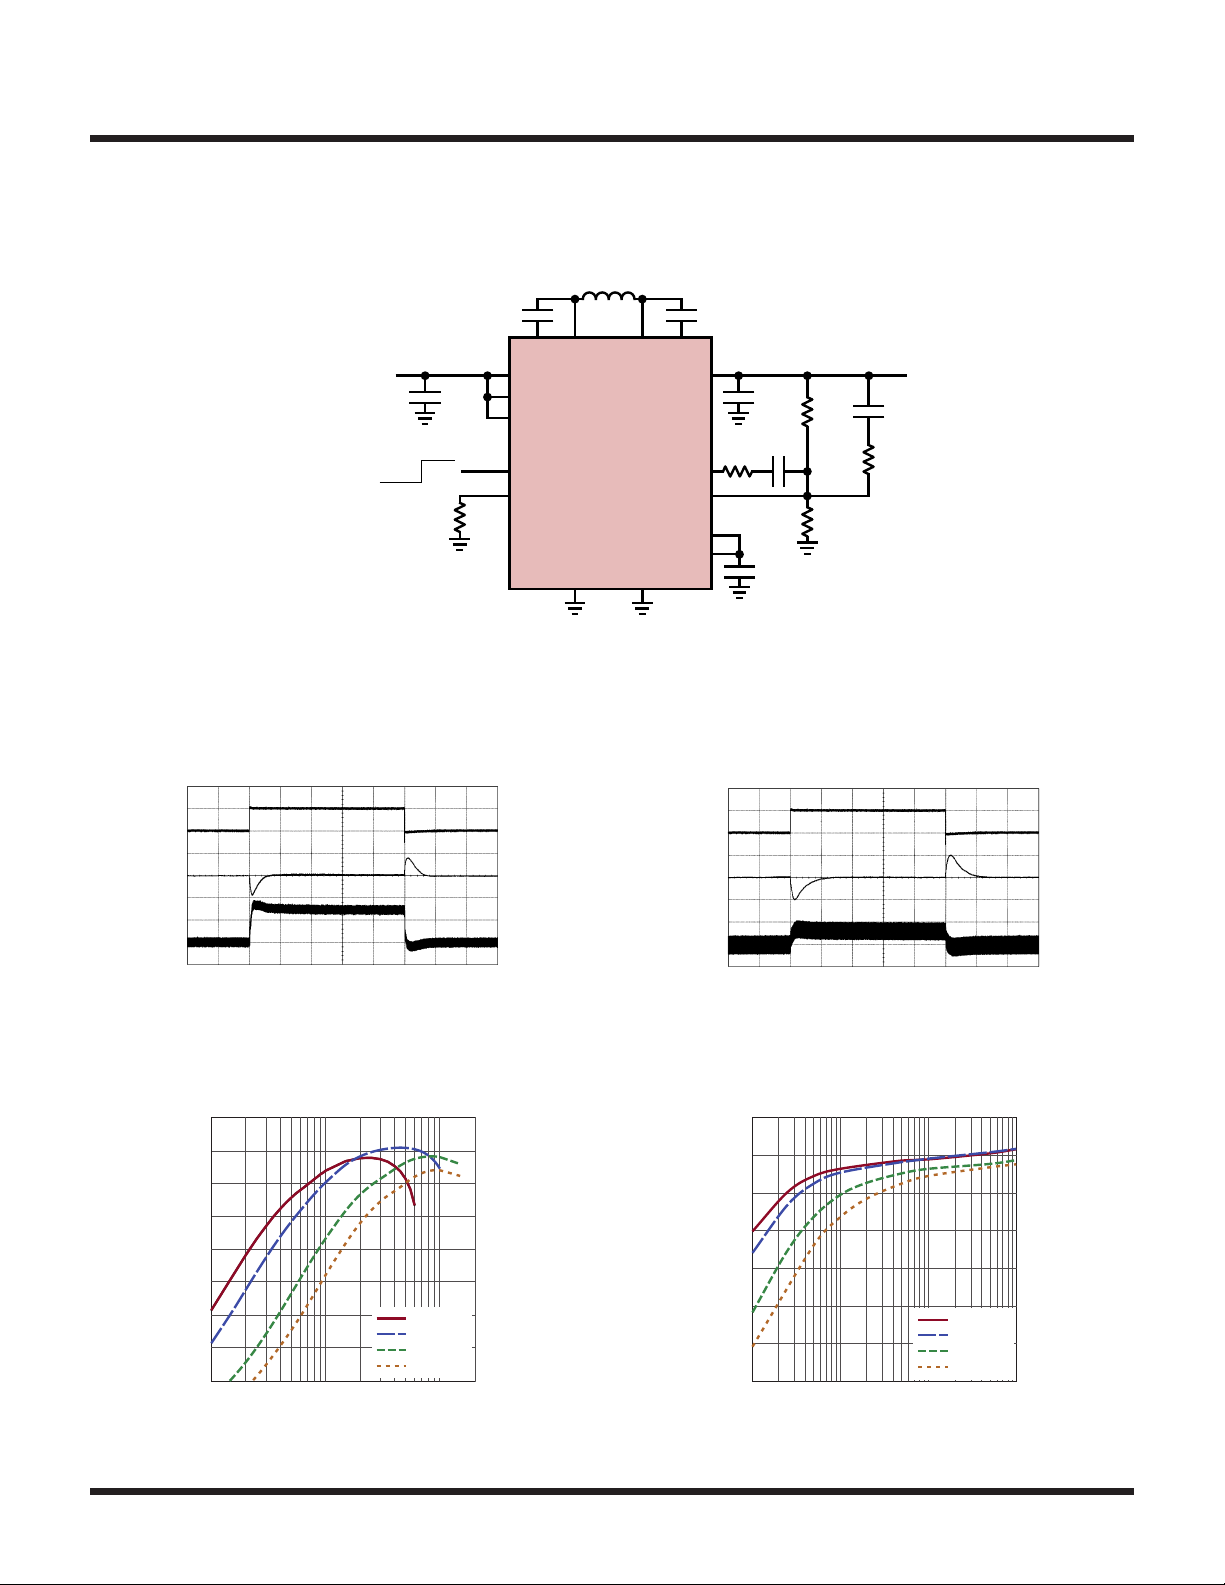
LTC3115-1
LOAD CURRENT
200µs/DIV
31151 TA07b
LOAD CURRENT
200µs/DIV
31151 TA07c
EFFICIENCY (%)
100
31151 TA07d
EFFICIENCY (%)
90
100
31151 TA07e
TYPICAL APPLICATIONS
6V TO 40V
Miniature Size 1.5MHz 12V Supply
L1
4.7µH
C
BST1
0.1µF
BST1 BST2
SW1 SW2
PV
C
I
4.7µF
R
23.7k
IN
V
IN
RUN
LTC3115-1
PWM/SYNC
RT
T
GND PGND
C
: MURATA GRM55DR61H106K
O
L1: WÜRTH 7447789004
C
BST2
0.1µF
PV
OUT
VCBURST PWM
FB
PV
CC
V
CC
R
15k
FB
C
O
10µF
C
FB
1000pF
C1
4.7µF
R
TOP
1M
R
BOT
90.9k
31151 TA07a
12V AT 500mA
1A V
C
FF
33pF
R
FF
15k
> 10V
IN
Load Step Transient Response, 0mA to 500mA,
VIN = 6V
(500mA/DIV)
V
OUT
(500mV/DIV)
INDUCTOR
CURRENT
(1A/DIV)
Efficiency vs Load Current, PWM Mode Efficiency vs Load Current, Burst Mode Operation
90
80
70
60
50
40
30
20
0.01
0.1 1
LOAD CURRENT (A)
VIN = 6V
= 10V
V
IN
= 24V
V
IN
= 36V
V
IN
Load Step Transient Response, 0mA to 500mA,
VIN = 24V
(500mA/DIV)
V
OUT
(500mV/DIV)
INDUCTOR
CURRENT
(1A/DIV)
80
70
60
50
40
30
20
0.1
1 10
LOAD CURRENT (mA)
VIN = 6V
= 10V
V
IN
= 24V
V
IN
= 36V
V
IN
38
Rev. C
For more information www.analog.com
Page 39

PACKAGE DESCRIPTION
4.50 ±0.05
3.10 ±0.05
2.44 ±0.05
(2 SIDES)
4.34 ±0.05
(2 SIDES)
RECOMMENDED SOLDER PAD PITCH AND DIMENSIONS
LTC3115-1
DHD Package
16-Lead Plastic DFN (5mm × 4mm)
(Reference LTC DWG # 05-08-1707 Rev A)
0.70 ±0.05
PACKAGE
OUTLINE
0.25 ±0.05
0.50 BSC
PIN 1
TOP MARK
(SEE NOTE 6)
0.200 REF
5.00 ±0.10
(2 SIDES)
4.00 ±0.10
(2 SIDES)
0.75 ±0.05
NOTE:
1. DRAWING PROPOSED TO BE MADE VARIATION OF VERSION (WJGD-2) IN JEDEC
PACKAGE OUTLINE MO-229
2. DRAWING NOT TO SCALE
3. ALL DIMENSIONS ARE IN MILLIMETERS
4. DIMENSIONS OF EXPOSED PAD ON BOTTOM OF PACKAGE DO NOT INCLUDE
MOLD FLASH. MOLD FLASH, IF PRESENT, SHALL NOT EXCEED 0.15mm ON ANY SIDE
5. EXPOSED PAD SHALL BE SOLDER PLATED
6. SHADED AREA IS ONLY A REFERENCE FOR PIN 1 LOCATION ON THE
TOP AND BOTTOM OF PACKAGE
2.44 ±0.10
(2 SIDES)
0.00 – 0.05
BOTTOM VIEW—EXPOSED PAD
R = 0.115
4.34 ±0.10
(2 SIDES)
TYP
0.25 ±0.05
0.50 BSC
169
18
0.40 ±0.10
PIN 1
NOTCH
(DHD16) DFN REV A 1113
For more information www.analog.com
Rev. C
39
Page 40
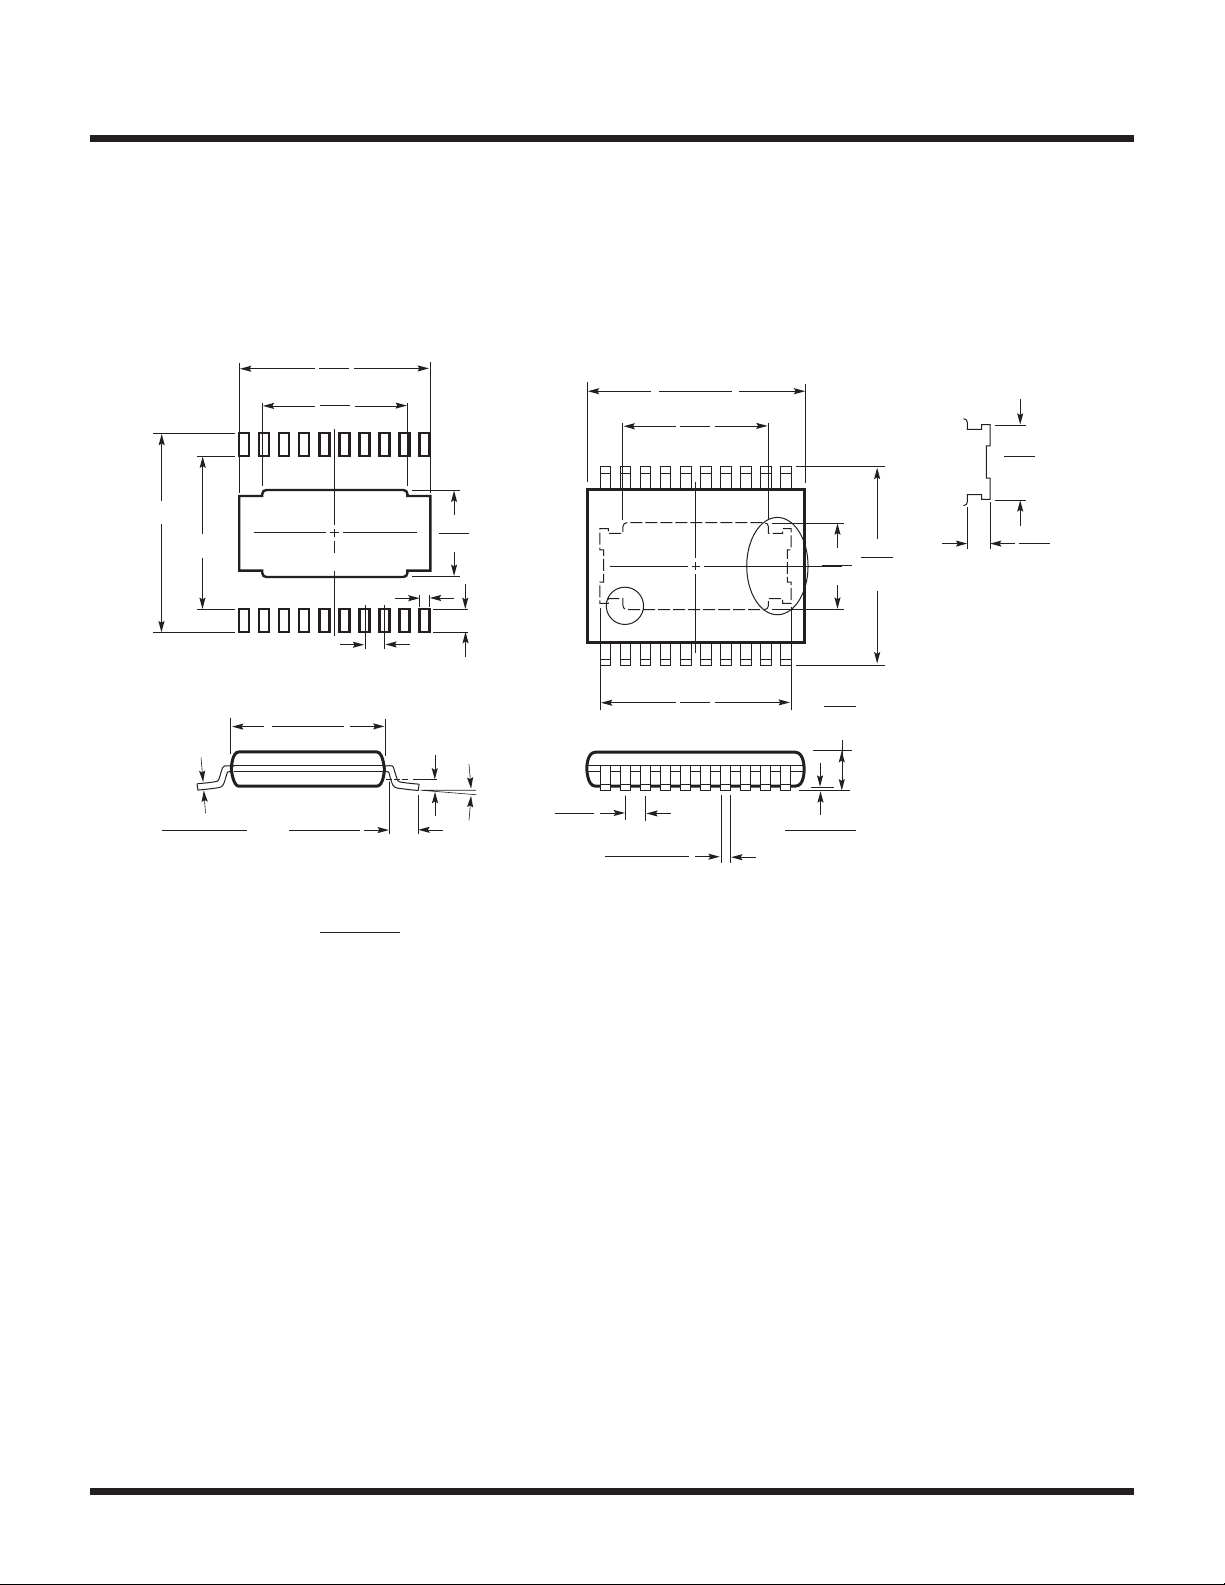
LTC3115-1
PACKAGE DESCRIPTION
6.07
(.239)
4.95
(.195)
6.60 ±0.10
4.50 ±0.10
RECOMMENDED SOLDER PAD LAYOUT
SEE NOTE 4
4.30 – 4.50*
(.169 – .177)
0.45 ±0.05
0.65 BSC
0.25
REF
FE Package
20-Lead Plastic TSSOP (4.4mm)
(Reference LTC DWG # 05-08-1663 Rev L)
Exposed Pad Variation CA
6.40 – 6.60*
(.252 – .260)
4.95
(.195)
20 1918 17 16 15
2.74
(.108)
1.05 ±0.10
1 3 45678 9 10
2
0° – 8°
6.07
(.239)
DETAIL A
DETAIL A
111214 13
6.40
2.74
(.252)
(.108)
BSC
1.20
(.047)
MAX
DETAIL A IS THE PART OF
THE LEAD FRAME FEATURE
FOR REFERENCE ONLY
NO MEASUREMENT PURPOSE
1.98
(.078)
REF
0.56
(.022)
REF
0.09 – 0.20
(.0035 – .0079)
NOTE:
1. CONTROLLING DIMENSION: MILLIMETERS
2. DIMENSIONS ARE IN
3. DRAWING NOT TO SCALE
0.50 – 0.75
(.020 – .030)
MILLIMETERS
(INCHES)
0.65
(.0256)
BSC
0.195 – 0.30
(.0077 – .0118)
TYP
4. RECOMMENDED MINIMUM PCB METAL SIZE
FOR EXPOSED PAD ATTACHMENT
*DIMENSIONS DO NOT INCLUDE MOLD FLASH. MOLD FLASH
SHALL NOT EXCEED 0.150mm (.006") PER SIDE
0.05 – 0.15
(.002 – .006)
FE20 (CA) TSSOP REV L 0117
40
Rev. C
For more information www.analog.com
Page 41

LTC3115-1
REVISION HISTORY
REV DATE DESCRIPTION PAGE NUMBER
A 4/13 Clarified Efficiency graph
Clarified Absolute Maximum Rating table, Package Drawing and Order Information
Clarified Electrical Characteristics table
Clarified Pin Functions
Clarified Compensation formula
B 5/15 Clarified Figure3
Clarified G
Clarified Loop Compensation Example
Clarified PCB Layout Considerations
Added LTC3114-1 to Related Parts list
C 6/19 Added AEC-Q100 automotive models 1,3
BUCK
formula
1
2
3
11
25
17
22
26
30, 31, 32
42
Information furnished by Analog Devices is believed to be accurate and reliable. However, no responsibility is assumed by Analog
Devices for its use, nor for any infringements of patents or other rights of third parties that may result from its use. Specifications
subject to change without notice. No license is granted by implication or otherwise under any patent or patent rights of Analog Devices.
For more information www.analog.com
Rev. C
41
Page 42
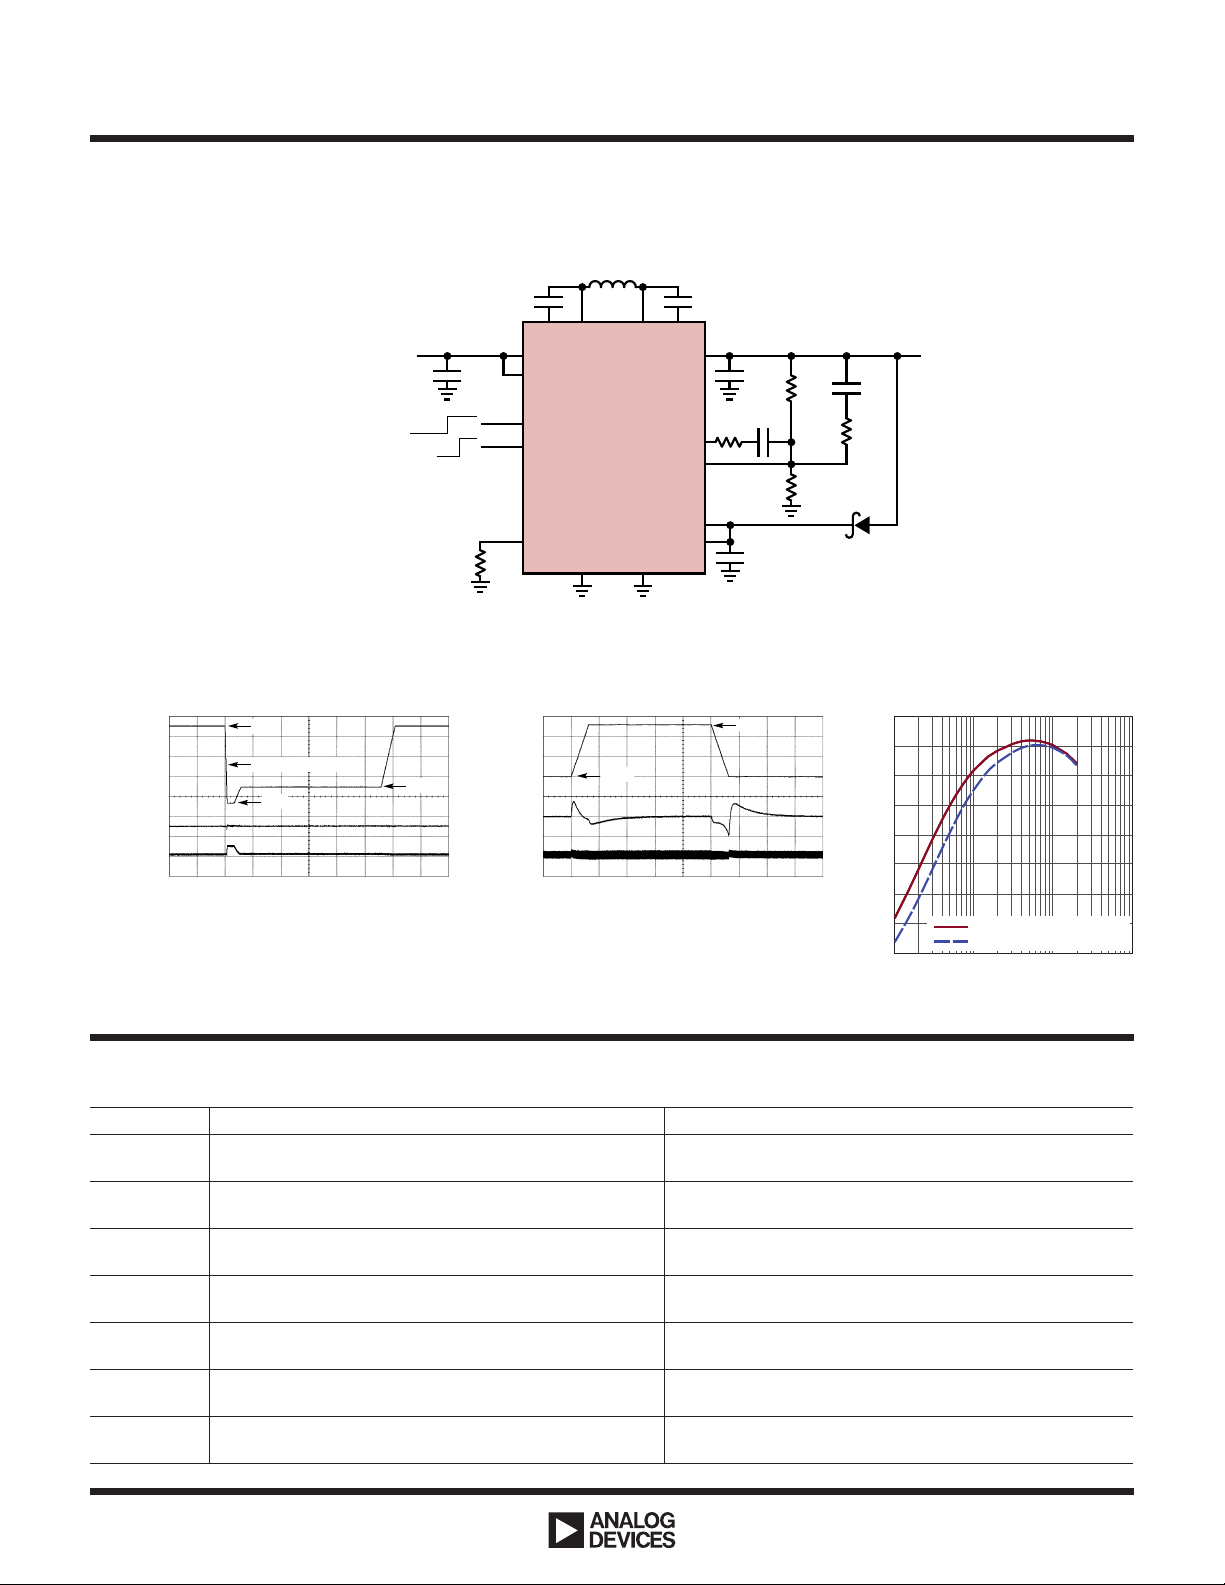
LTC3115-1
200ms/DIV
31151 TA08b
(200mV/DIV)
2ms/DIV
31151 TA08c
EFFICIENCY (%)
100
31151 TA08d
TYPICAL APPLICATION
750kHz Automotive 5V Regulator with Cold Crank Capability
AUTOMOTIVE
3.6V TO 40V
: MURATA GRM55DR61H106K
C
IN
: MURATA GRM43ER60J476K
C
O
D1: PANASONIC MA785
L1: SUMIDA CDRH8D43HPNP
Cold Crank Line Transient with 1A Load Load Dump Line Transient with 1A Load
12V
V
(2V/DIV)
V
OUT
(200mV/DIV)
INDUCTOR
CURRENT
(1A/DIV)
IN
15ms FALL TIME
4.5V
L1
6.8µH
C
BST1
0.1µF
BST1 BST2
SW1 SW2
PV
R
T
47.5k
V
(10V/DIV)
V
OUT
CURRENT
(1A/DIV)
IN
V
IN
PWM/SYNC
RUN
RT
IN
LTC3115-1
GND PGND
13.8V
C
IN
10µF
BURST PWM
OFF ON
*OPTIONAL-INSTALL D1 FOR IMPROVED EFFICIENCY AND LOWER INPUT OPERATING VOLTAGE
6V
INDUCTOR
C
BST2
0.1µF
PV
OUT
VC
FB
PV
V
C
O
R
47µF
R
FB
1000pF
54.9k
CC
CC
C1
4.7µF
31151 TA08a
40V
TOP
1M
C
FB
R
BOT
249k
5V
1A
C
FF
33pF
R
FF
42.2k
D1*
Efficiency vs Load Current
VIN = 12V
90
80
70
60
50
40
30
20
0.01
WITH BOOTSTRAP DIODE
WITHOUT BOOTSTRAP DIODE
0.1 1
LOAD CURRENT (A)
RELATED PARTS
PART NUMBER DESCRIPTION COMMENTS
LTC3114-1 1A (I
LTC3112 2.5A (I
LTC3113 3A (I
LTC3127 1A (I
LTC3789 High Efficiency, Synchronous, 4-Switch Buck-Boost Controller VIN: 4V to 38V, V
LTC3785 ≤10A (I
LTC3534 7V, 500mA (I
42
), 40V Synchronous Buck-Boost DC/DC Converter VIN = 2.2V to 40V, V
OUT
and TSSOP Packages
), 15V Synchronous Buck-Boost DC/DC Converter VIN: 2.7V to 15V, V
OUT
TSSOP Packages
), 2MHz Synchronous Buck-Boost DC/DC Converter VIN: 1.8V to 5.5V, V
OUT
and TSSOP Packages
), 1.2MHz Buck-Boost DC/DC Converter with
OUT
Programmable Input Current Limit
96% Efficiency VIN: 1.8V to 5.5V, V
ISD < 4µA, MSOP and DFN Packages
SSOP-28, QFN-28 Packages
), High Efficiency, 1MHz Synchronous, No R
OUT
Buck-Boost Controller
), 1MHz Synchronous Buck-Boost DC/DC
OUT
Converter
SENSE
™
VIN: 2.7V to 10V, V
QFN Package
94% Efficiency, VIN: 2.4V to 7V, V
ISD < 1µA, DFN and GN Packages
For more information www.analog.com
= 2.7V to 40V, IQ = 30µA, ISD < 3µA, DFN
OUT
: 2.5V to 14V, IQ = 40µA, ISD < 1µA, DFN and
OUT
: 1.8V to 5.25V, IQ = 30µA, ISD < 1µA, DFN
OUT
: 1.8V to 5.25V, IQ = 35µA,
OUT
: 0.8V to 38V, IQ = 3mA, ISD < 60µA,
OUT
: 2.7V to 10V, IQ = 86µA, ISD < 15µA,
OUT
: 1.8V to 7V, IQ = 25µA,
OUT
www.analog.com
ANALOG DEVICES, INC. 2012-2019
Rev. C
06/19
 Loading...