

Page 1
User Guide
PC tool
Software for addressing, calibration and
parameterization of Basic, Premium and Heavy
Duty gas detection units and gas detection
controller configuration
GDIR.danfoss.com
Page 2

User Guide | Danfoss Gas Detection - PC tool
Contents Page
1. Application possibilities of the software ...........................................................3
2. Scope of delivery .................................................................................3
3. Installation .......................................................................................3
4. Main window with short description ..............................................................3
5. Establish the connection..........................................................................5
5.1 Local bus ...................................................................................5
5.2 Field Bus = Danfoss Controller . . . . . . . . . . . . . . . . . . . . . . . . . . . . . . . . . . . . . . . . . . . . . . . . . . . . . . . . . . . . . . .7
5.2.1 Display of possible error messages .........................................................8
5.2.2 Context menu in the Central Bus...........................................................9
6. Parameters.....................................................................................10
6.1 Addressing ............................................................................... 10
6.1.1 Addressing of gas detection controller ...................................................10
6.1.2 Addressing of expansion module ........................................................ 10
6.1.3 Addressing of gas detection units........................................................11
6.2 Measuring point MP parameters...........................................................12
6.2.1 MP parameters description .............................................................. 13
6.3 Relay parameters.......................................................................... 14
6.3.1 MP parameters description .............................................................. 15
6.4 System parameters........................................................................ 16
7. Calibration at the local bus...................................................................... 18
7.1 Register tab „Report“ ...................................................................... 18
7.2 Register tab „Zero“ ........................................................................ 19
7.3 Register tab „Gain“ ........................................................................ 20
8. Operating data .................................................................................24
9. History of the data logger....................................................................... 25
10. Notes and general information ................................................................27
2 | DKRCI.PS.S00.C1.02 | 520H12961
© Danfoss | DCS (MWA) | 2018.06
Page 3
User Guide | Danfoss Gas Detection - PC tool
1
Application possibilities of
the software
2
Scope of delivery
3
Installation
4
Main window with short
description
1. Addressing of the Basic, Premium and Heavy
Duty GD Units.
2. Calibration of gain and zero-point of the Basic,
Premium and Heavy Duty GD devices.
3. Configuration of application parameters of the
Basic, Premium and Heavy Duty GD devices.
The PC tool software has to be started from the
USB stick in order to use the available functions.
on the USB stick there are binary data files that
must be opened and/or changed - otherwise; no
functions can be perfomed.
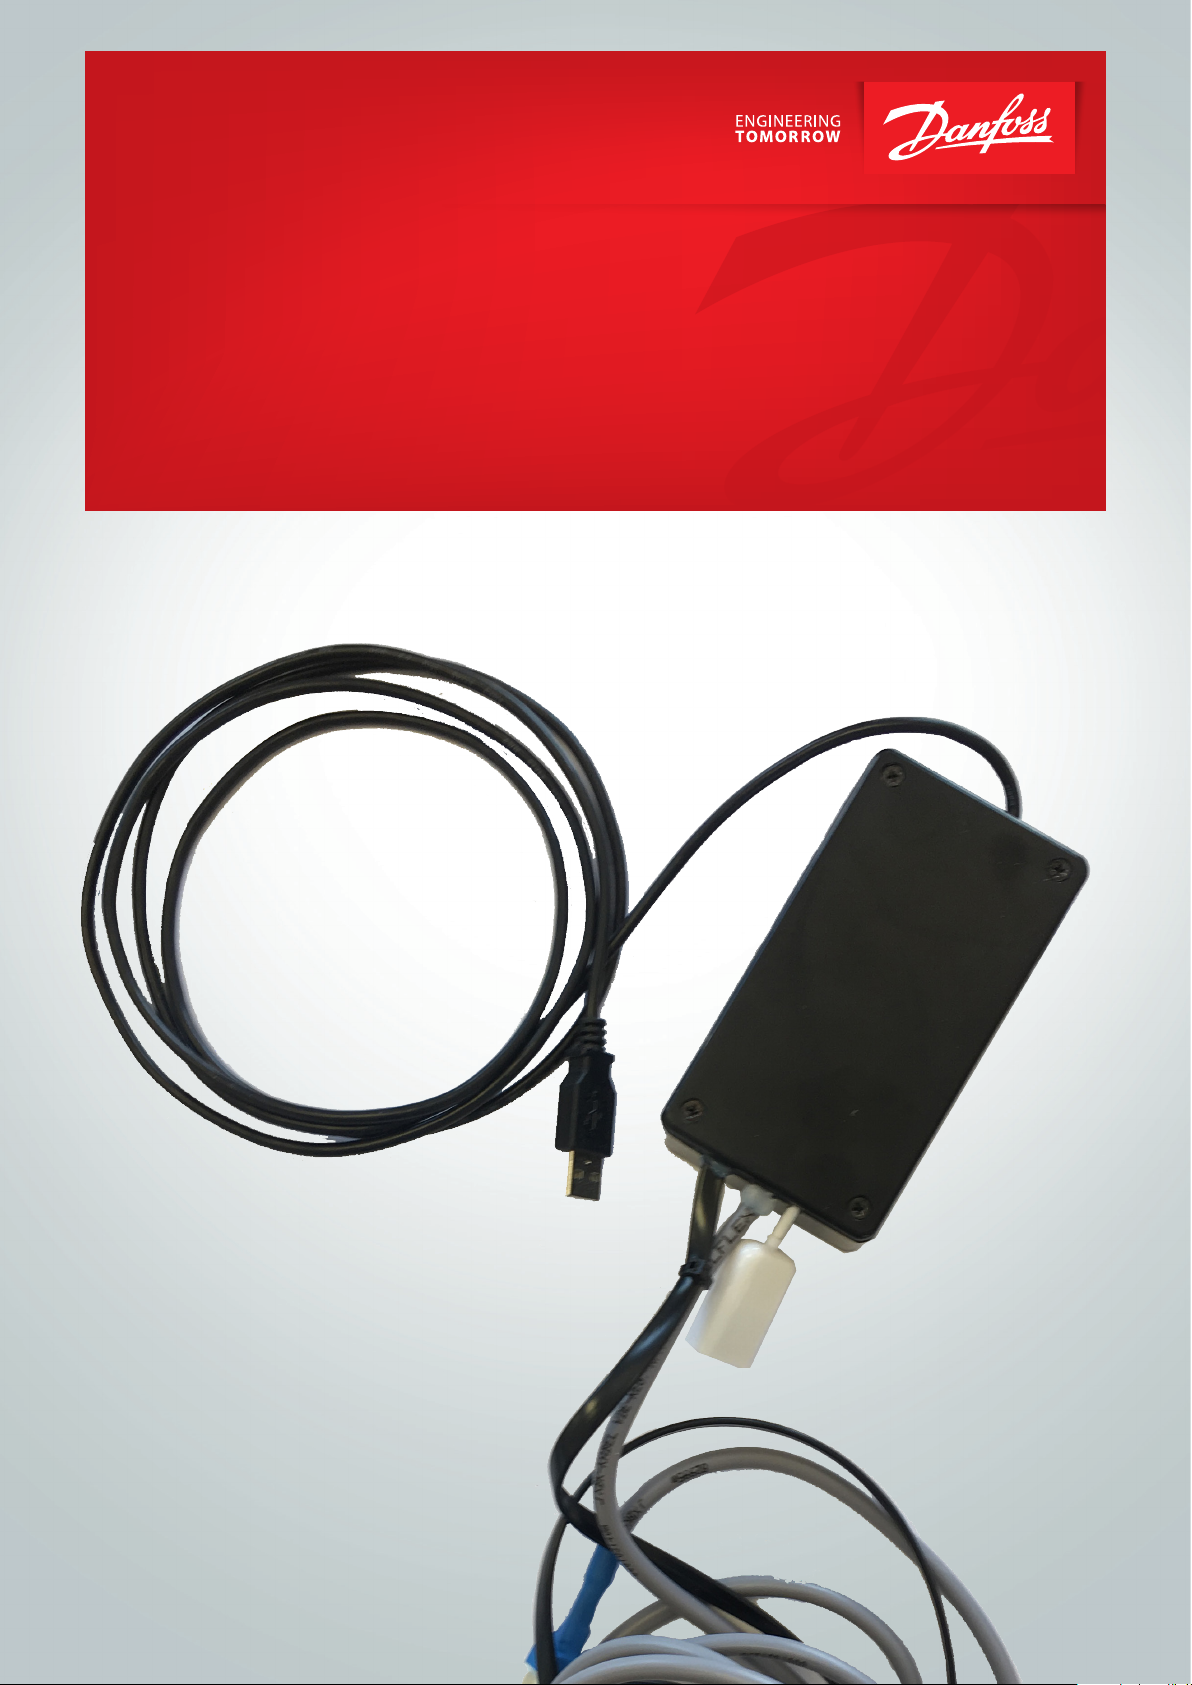
Connect your PC via a USB cable to the adapter
that will automatically start to install the driver
for the USB-RS485 adapter. A virtual COM port
will be generated and this new port number
is required later for configuring the PC tool
Software.
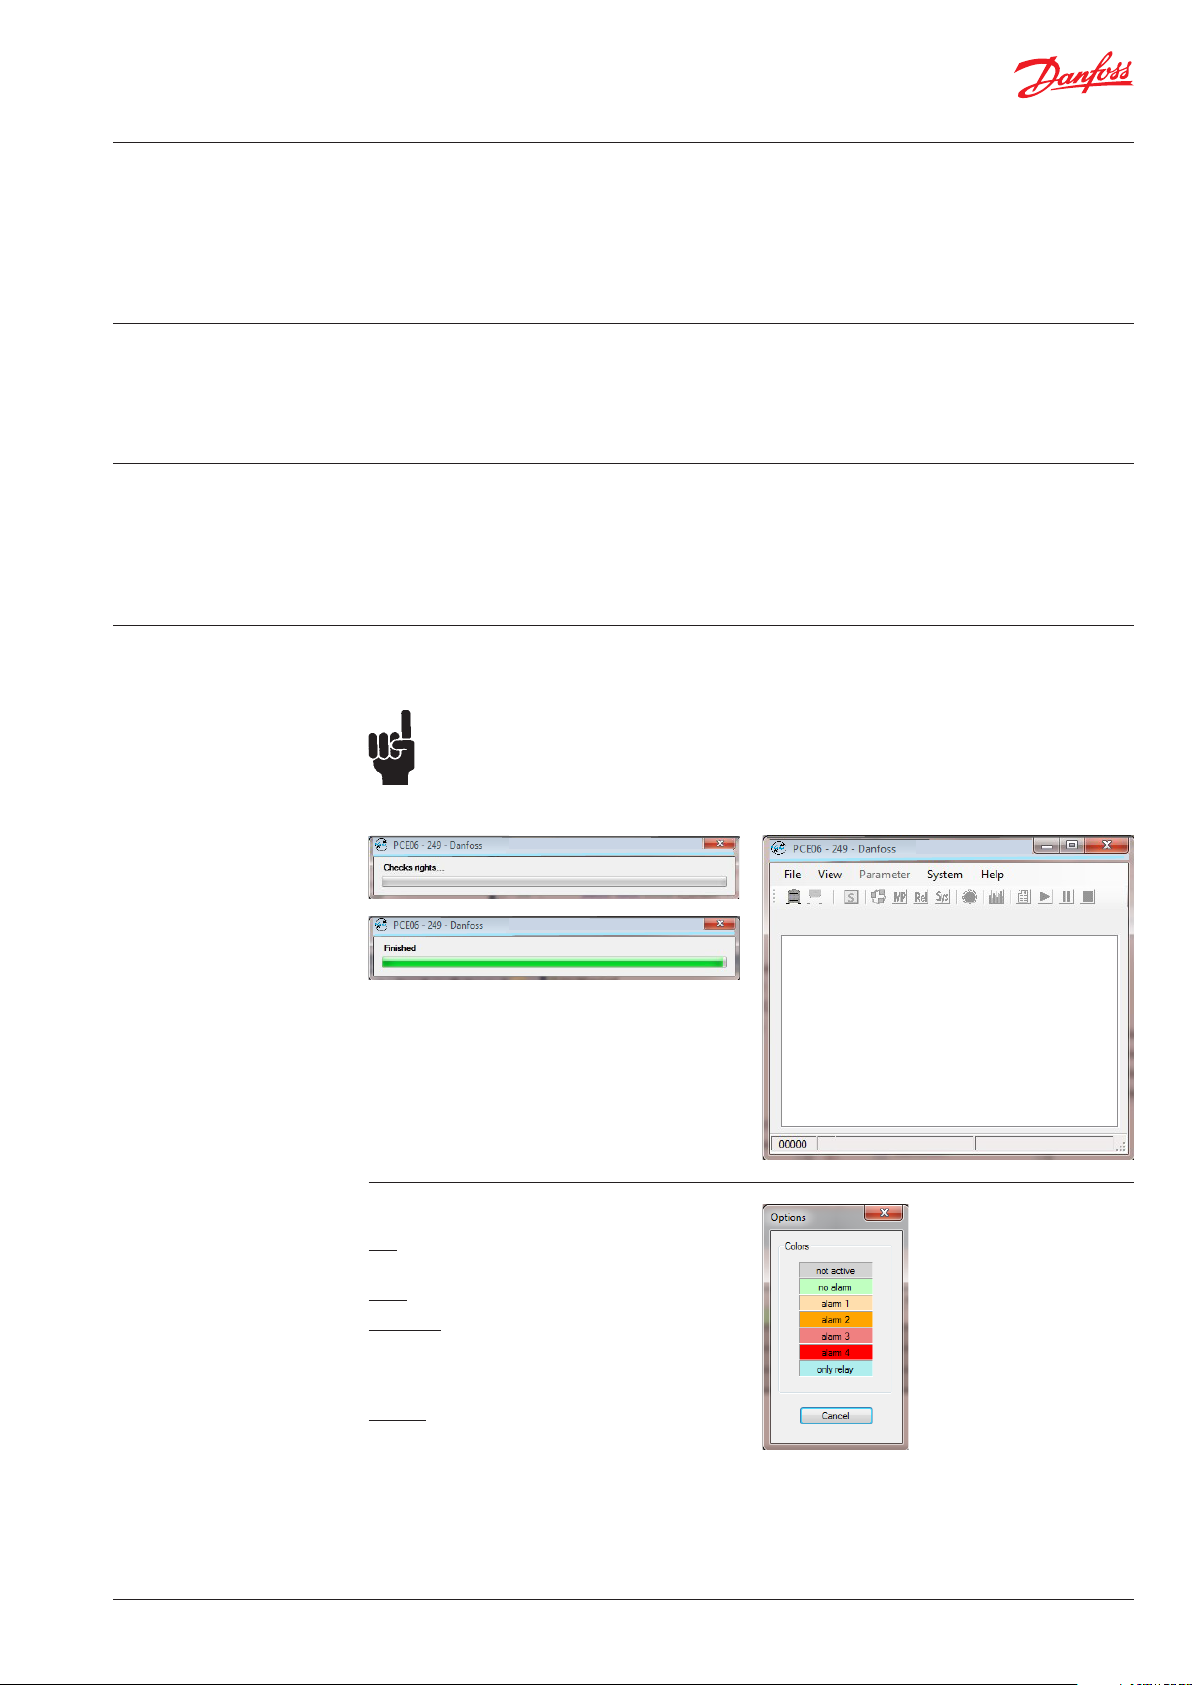
Before the main window starts, the User rights
are checked.
Attention:
If the PC Tool software is not started from
the USB stick or if the rights check fails,
the software will be closed again without
showing the main window.
4. Long-term recording on hard disk in .csv
format.
5. Monitoring of all measured values at a glance,
live.
6. Print of Calibration reports.
7. Gas detector controller configuration
The PC software is an alternative solution to the
Danfoss handheld service tool.
Please use the included USB-RS485 adapter to
physically connect the PC to the sensor.
It is not necessary to install the PC tool Software,
since all parts of the program will be started
during runtime.
The PC tool will run on WINDOWS 7, 8 and 10.
The main window opens only after successful
verification.
The company name and the name of the
software will appear in the window head.
Menu bar:
File has only one submenu ‘Exit’ for quitting the
application.
View has two subitems:
Language
Here you can change the display language.
British English, German and USA English are
currently available.
Options
All possible background colours are listed here
(see image to the right).
© Danfoss | DCS (MWA) | 2018.06
DKRCI.PS.S00.C1.02 | 520H12961 | 3
Page 4
User Guide | Danfoss Gas Detection - PC tool
4
Main window with short
description (continued)
Parameters has four submenus:
Addressing opens the dialog for setting the
address of the connected device.
The icon on the toolbar stands for this menu
item.
MP Parameters opens the dialog where you can
manage the settings for the single measuring
points in the gas detection system.
The icon on the toolbar stands for this menu
item.
Relay Parameters opens the dialog where you can
manage the settings for the single relay outputs
in the gas detection system.
The icon on the toolbar stands for this menu
item.
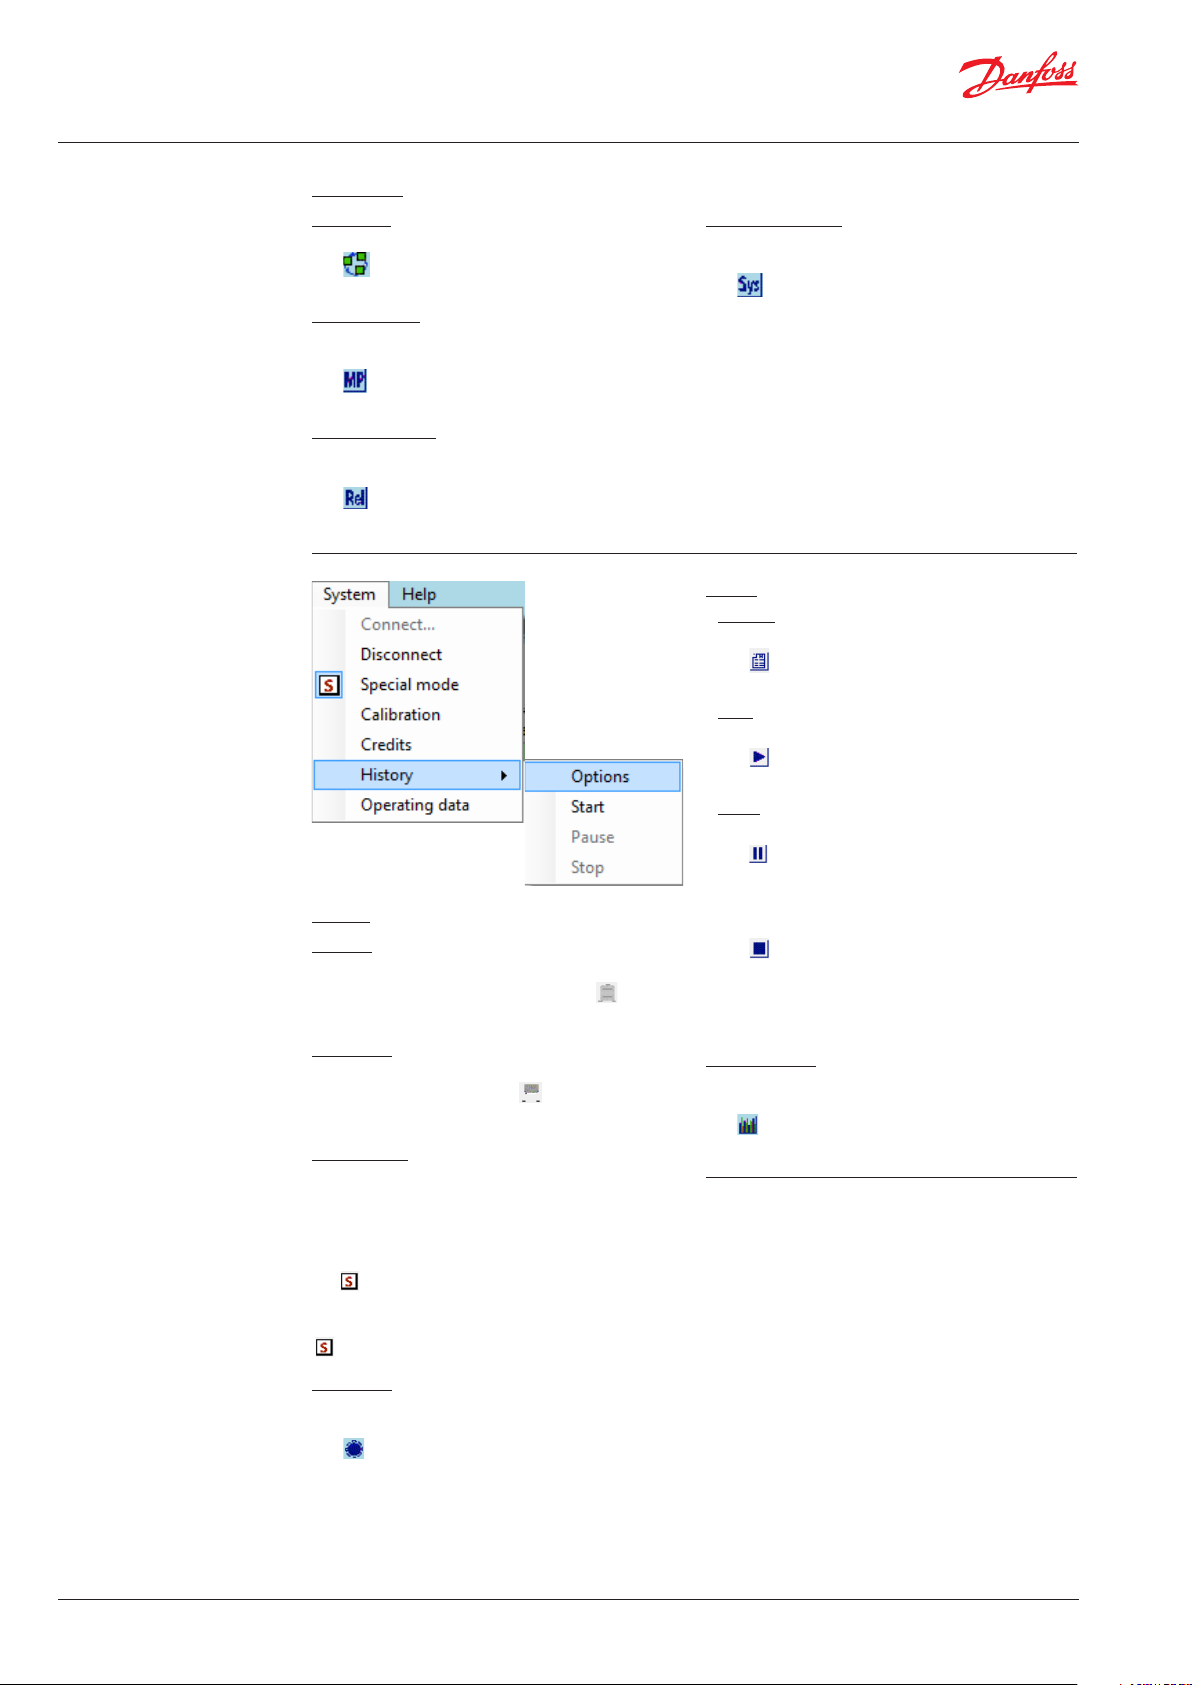
System has seven submenus:
Connect opens the dialog where you can set the
serial COM port.
You can also access this dialog via the icon on
the toolbar.
Disconnect does not open a new dialog window,
but interrupts the connection to the COM port.
It is also possible to use the icon on the
toolbar to cut the connection.
Special mode does not open a dialog window
either, but sets the connected device into special
mode. If activated again, the special mode
is cancelled and the device will return to the
measurement mode.
The special mode can be switched on or off with
the icon on the toolbar.
If the device is in special mode, the colour of the
menu bar and toolbar changes to blue and the
icon will be displayed in the system menu.
Calibration opens the calibration dialog. The
functions of this window are specified in detail
later.
The icon on the toolbar stands for this menu
item.
System Parameters opens the dialog where you
can manage the system parameters of the gas
detection system.
The icon on the toolbar stands for this menu
item.
The menu items are only active if the connection
to the gas detection controller or gas detection
unit is established. The functions are specified in
the following chapters.
History contains four submenus:
Options starts the history dialog where you can
change all settings for data recording.
The icon on the toolbar stands for this menu
item.
Start - with a click on the start button the
recording is started.
The icon on the toolbar stands for this menu
item.
Pause - with a click on the pause button the
recording is interrupted.
The icon on the toolbar stands for this menu
item.
Stop - with a click on the stop button the
recording is stopped.
The icon on the toolbar stands for this menu
item.
The functions of the history window are
described in detail later.
Operating data opens the operating data dialog.
The functions of this window are described in
detail later.
The icon on the toolbar stands for this menu
item.
Under the toolbar, there is a system tray
displaying error messages concerning the
communication with the connected device.
The middle section of the main window varies
according to the connected device. This is
described in detail later.
At the very bottom of the status bar the following
information is displayed:
Software version of the master
The system tray where currently only the
information on the history is displayed.
Connected COM port with baud rate.
4 | DKRCI.PS.S00.C1.02 | 520H12961
© Danfoss | DCS (MWA) | 2018.06
Page 5
User Guide | Danfoss Gas Detection - PC tool
NH3
5
Establish the connection
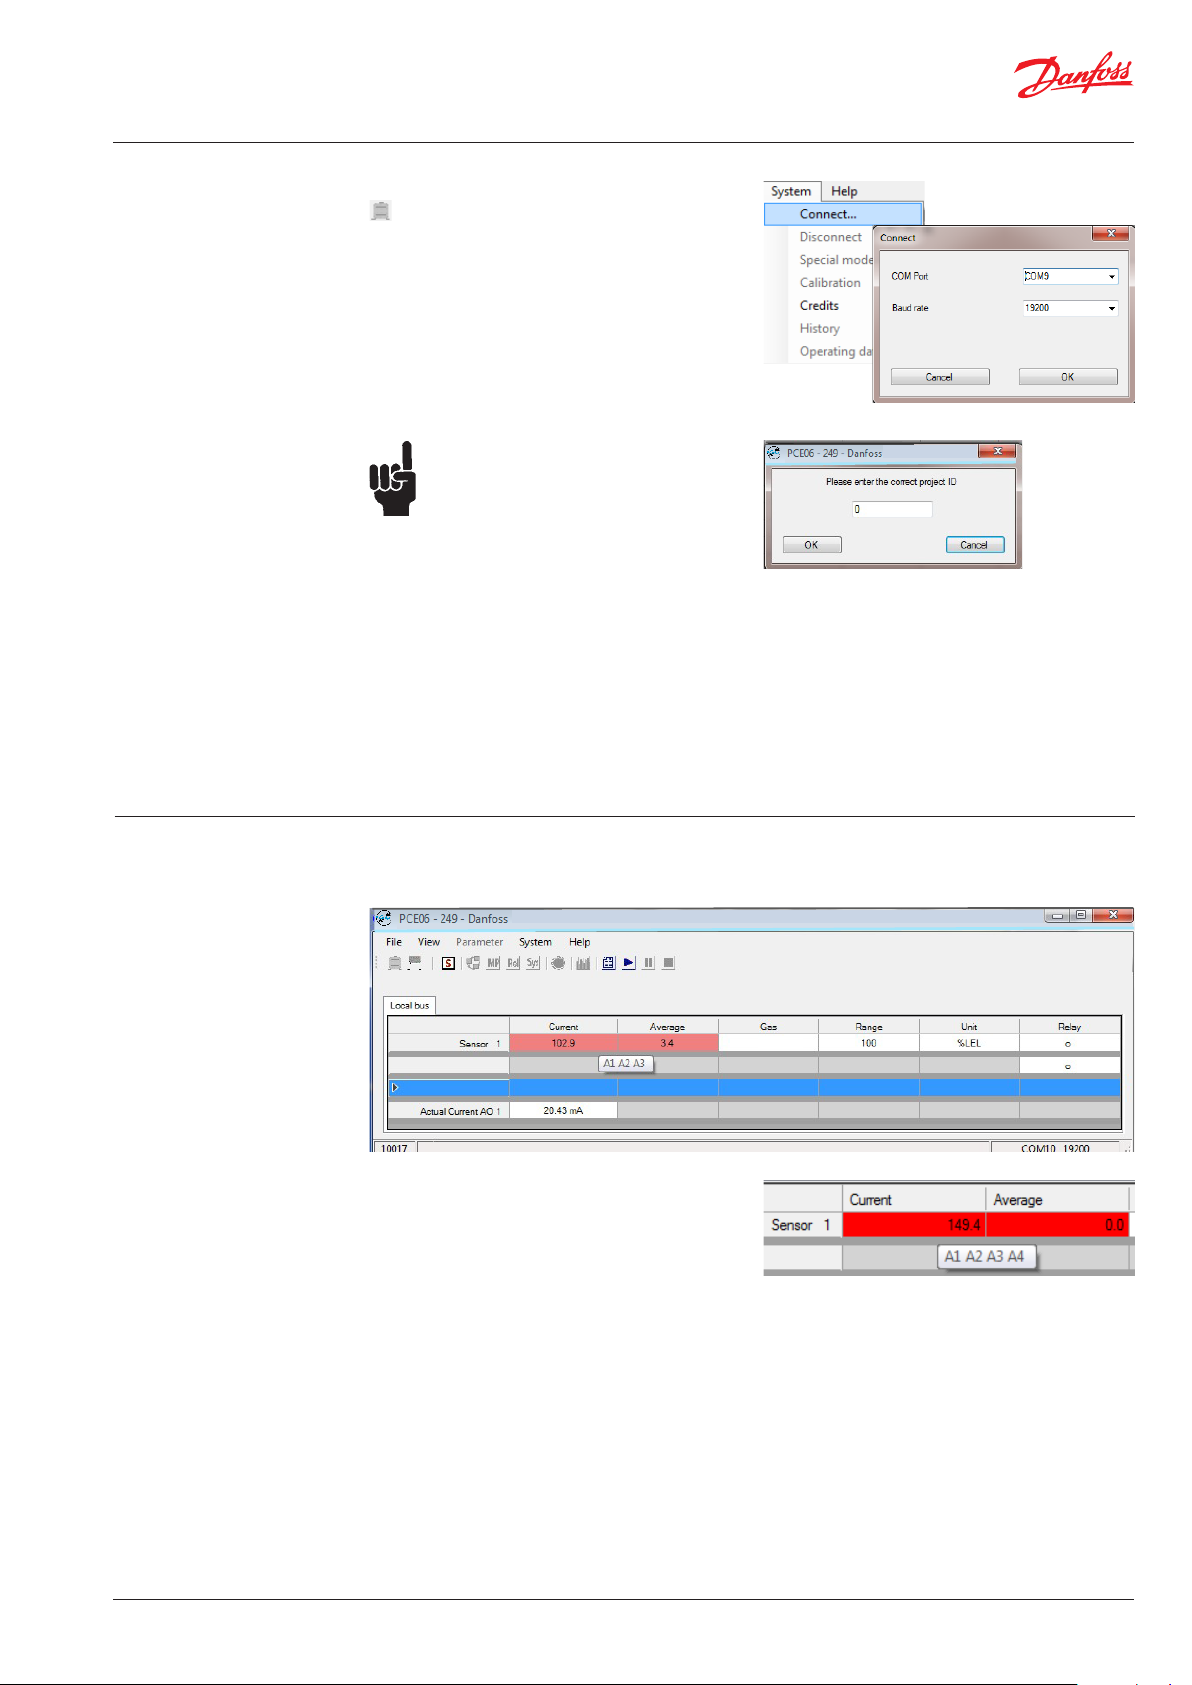
When you click on the Connect button or on the
icon, the application opens the dialog for
setting the serial port.
Only those COM ports that are active on the PC
are displayed. By clicking OK you can establish
the connection to the COM port.
The display in the main window varies
depending on the connected device.
Attention:
If the authorization key (password) of
the PC tool software differs from the
authorization key of the connected
device, a window will appear showing
the input screen for plant ID (password).
Password: 5468
The mask remains open until you
have entered the correct plant ID and
confirmed with OK or cancelled the input
by using the cancel button.
If you click cancel, the application will
close!
If you enter the correct plant ID, the
input screen will release the application
and you can use all functions to the full
extent.
5.1
Local bus
The Danfoss PC tool is connected via the COM
port to the devices of the IO class (Basic, Premium
and Heavy Duty).
A table with four lines appears in the middle of
the main window. The first column of the table
is a header column for each line. If the sensor is
activated, the text “Sensor X” will appear in this
column with X being a number between 1 and 4.
Otherwise the header column remains empty.
The following columns give more information on
the connected digital sensor head or the analog
input.
Current and average value:
The current and average values of the connected
digital sensor head or the analog input are
displayed here. If the alarm thresholds are set to
0, the alarm evaluation will not take place and the
readings will be displayed without alarm (usually
backlighted in green).
If the threshold values are set greater than zero at
the measuring point, a local alarm evaluation is
active and the alarms are marked with different
background colours. In addition, a tool tip
displaying the active alarms will appear, if you
click in the cell.
© Danfoss | DCS (MWA) | 2018.06
DKRCI.PS.S00.C1.02 | 520H12961 | 5
Page 6

User Guide | Danfoss Gas Detection - PC tool
5.1
Local bus (Continued)
Gas:
The gas type of the connected digital Sensor
head or the analog input is displayed here.
Range:
The measuring range of the connected digital
Sensor head or the analog input is displayed
here.
Unit:
The unit of the connected digital Sensor head or
the analog input is displayed here.
Relay:
The last column (Relay) shows the current status
of available relays of the connected device.
means that the relay coil is de-energized
means that the relay is energized.
The indicator reflects the actual energization
state of the relays, regardless of the
parameterization.
For devices with more than 1 input signal
(Premium) the read-back information (current
value) of the analog output signals appears in the
line 4.
It has already been converted to the current
range of 4-20 mA (measuring range 4-20 mA).
6 | DKRCI.PS.S00.C1.02 | 520H12961
© Danfoss | DCS (MWA) | 2018.06
Page 7
User Guide | Danfoss Gas Detection - PC tool
5.2
Field Bus = Danfoss Controller
The PC tool is connected via the COM port to the
Danfoss Controller.
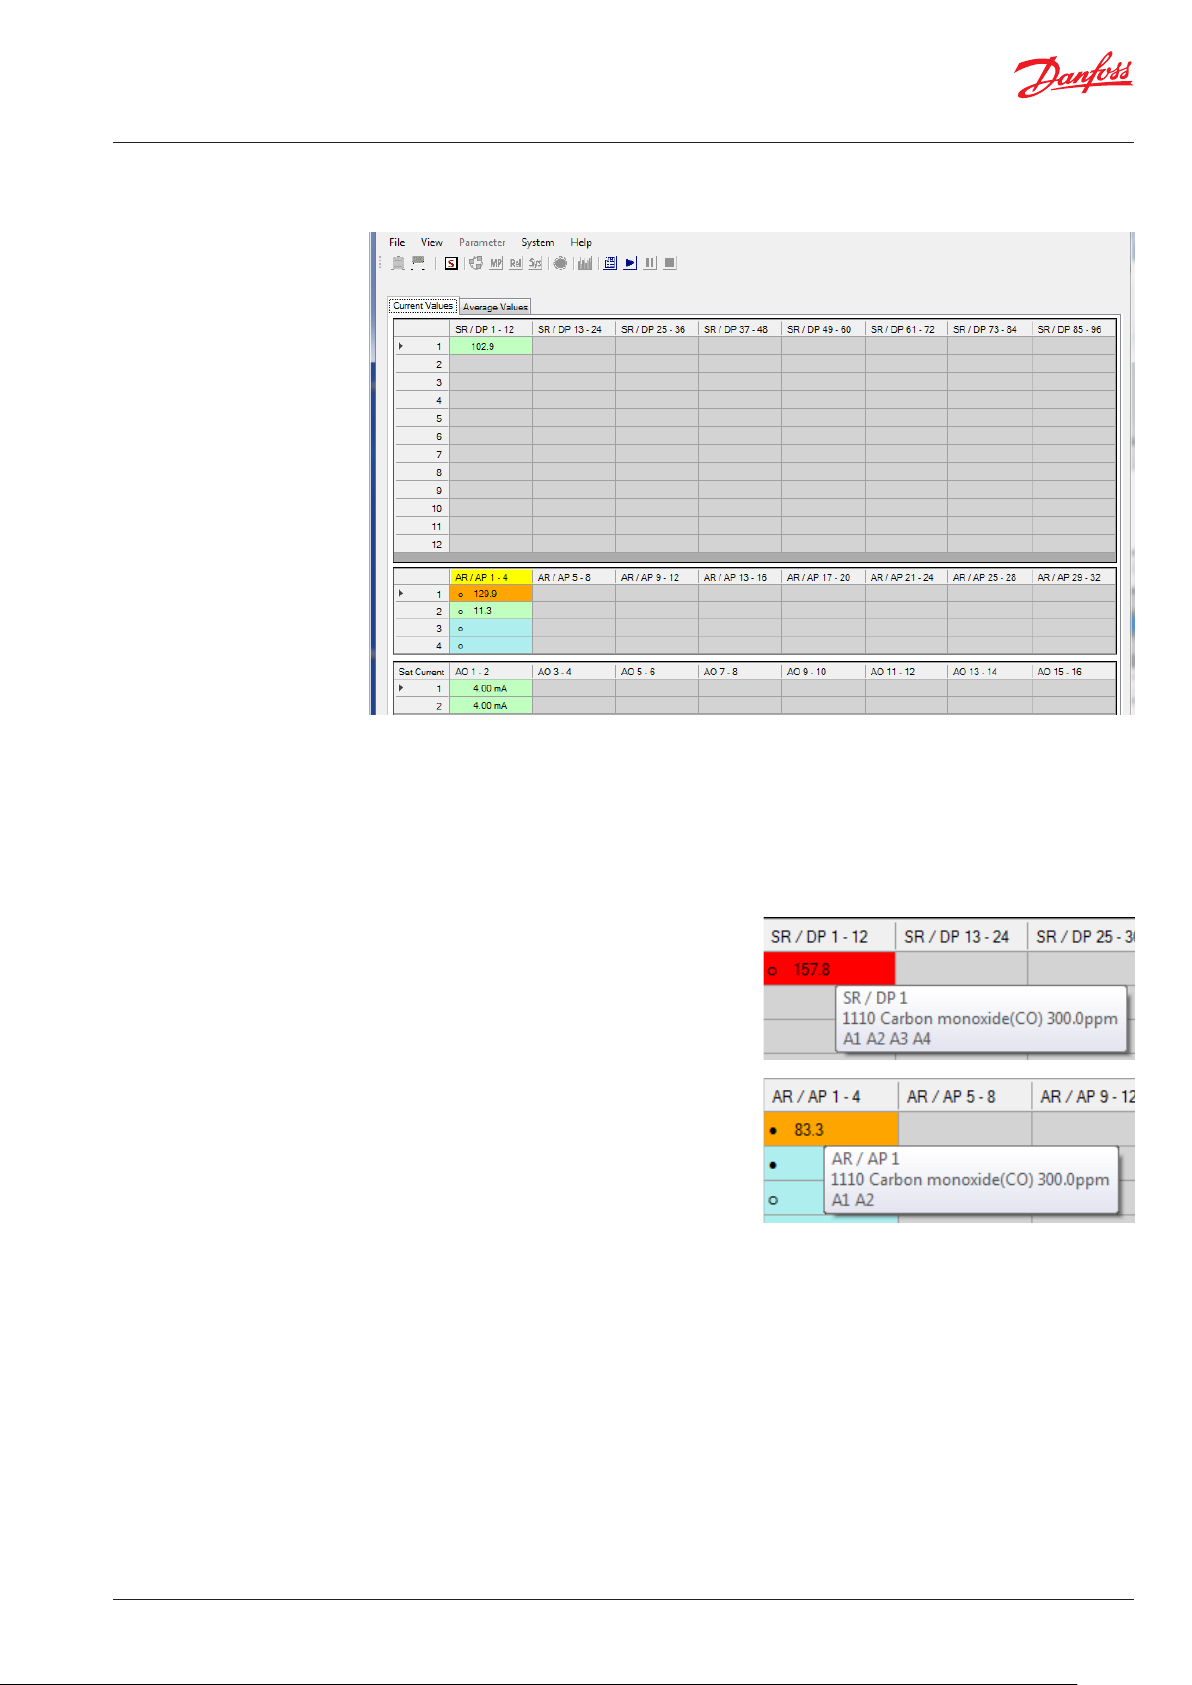
In the middle of the main window two tabs
appear containing two tables and a block each.
The first tab shows the current values and the
second the averages. Both tabs are constructed
identically, so only the tab with current values is
described herein.
The first larger table shows the current values
of the 96 possible digital measuring point
addresses. The second table displays the current
values of a total of 32 possible analog measuring
point addresses.
or information concerning the relay status.
These icons may only appear if the relay is used
at this address. The icons reflect the energization
state of the relay, regardless of the parameter
setting operating/quiescent current or the relay
contacts used.
The alarm status is shown by the coloured
background of the cell.
The cells of inactive measuring points are grey
and empty.
The cells with inactive measuring points, but
with active relays are shown with light blue
background colour and the relay status.
The cells with active measuring points display
the actual value with different background
colours depending on the alarm status of the
measurement point. The definitions of the
colours can be looked up in Options.
In addition to the current value each cell contains
further information about the respective
measuring point: The following icons may be
displayed on the left next to the current value:
# means that this measuring point needs
maintenance. The maintenance for analog
measurement points is monitored and
reported by the EP module, so here the display
is simultaneous for all four possible analog
measuring points.
© Danfoss | DCS (MWA) | 2018.06
DKRCI.PS.S00.C1.02 | 520H12961 | 7
Page 8
User Guide | Danfoss Gas Detection - PC tool
5.2
Field Bus = Danfoss Controller
(Continued)
5.2.1
Display of possible error
messages
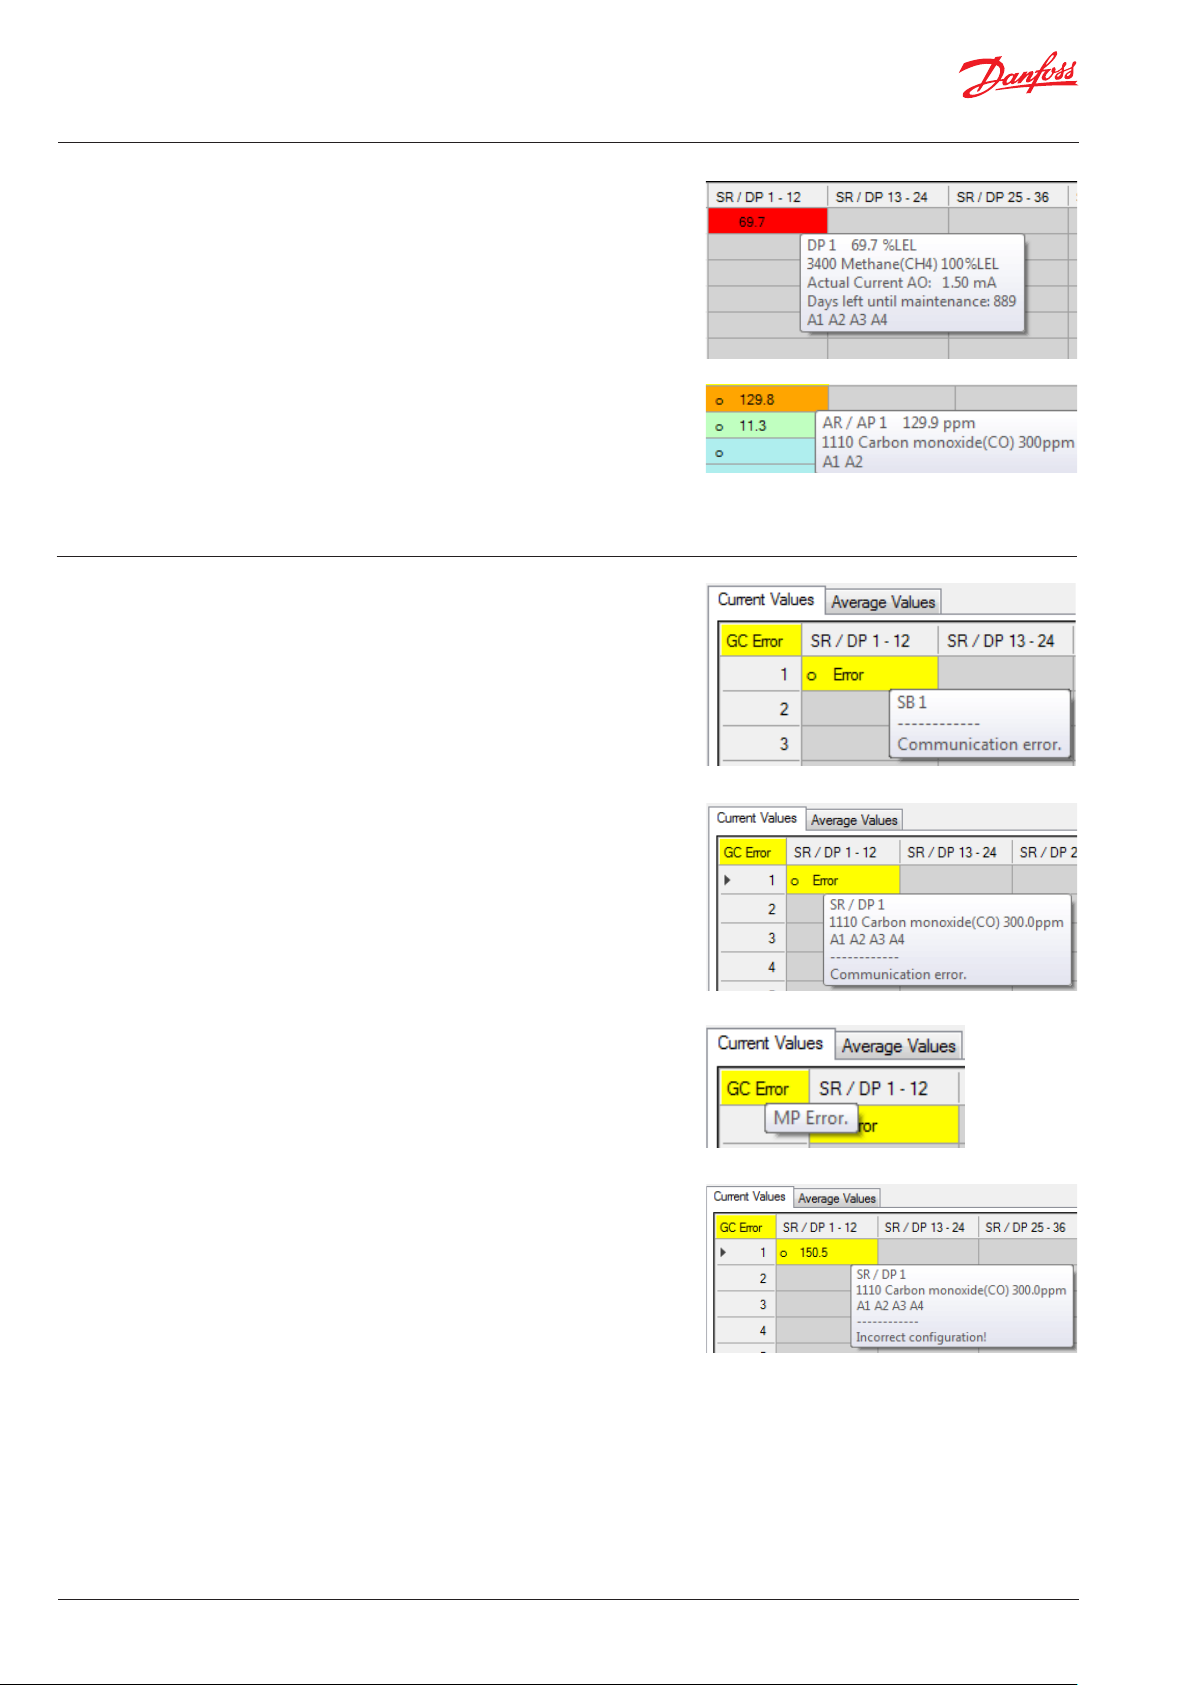
When the mouse pointer hovers over the cell, a
tool tip window pops up showing the following
additional information:
- Relay or measuring point address including the
current measuring value
- Nomenclature number with the gas type of the
connected measuring point
- Measuring range and unit of the connected
measuring point
- Active alarms
- Present current of the analog output
- Number of days left until next maintenance
The lower block displays the control information
(set point) of the 16 possible analog outputs.
It has already been converted to the output
current range of 0-22 mA (measuring range 4-20
mA).
A distinction is made between system errors and
measuring point errors.
Messages only concerning the measured value
will appear in the cell instead of the valid current
value. This also includes the communication error
to the sensor board or the digital sensor head.
Messages generated by the gas detection
controller will appear in the upper left corner of
the table. The messages are displayed in the form
of an error code. The detailed breakdown can be
read in the tool tip.
If there is an error at a measuring point, the gas
detection controller, too, will generate an error
message; therefore, the two messages always
occur together.
If the current value is displayed, but highlighted
in yellow, then there is a configuration conflict
between gas detection controller and gas
detection unit.
An automatic measuring point configuration was
deliberately omitted in order to obtain a high
level of security when configuring.
The installer must consciously enter the
configuration of each measuring point
accordingly.
8 | DKRCI.PS.S00.C1.02 | 520H12961
© Danfoss | DCS (MWA) | 2018.06
Page 9
User Guide | Danfoss Gas Detection - PC tool
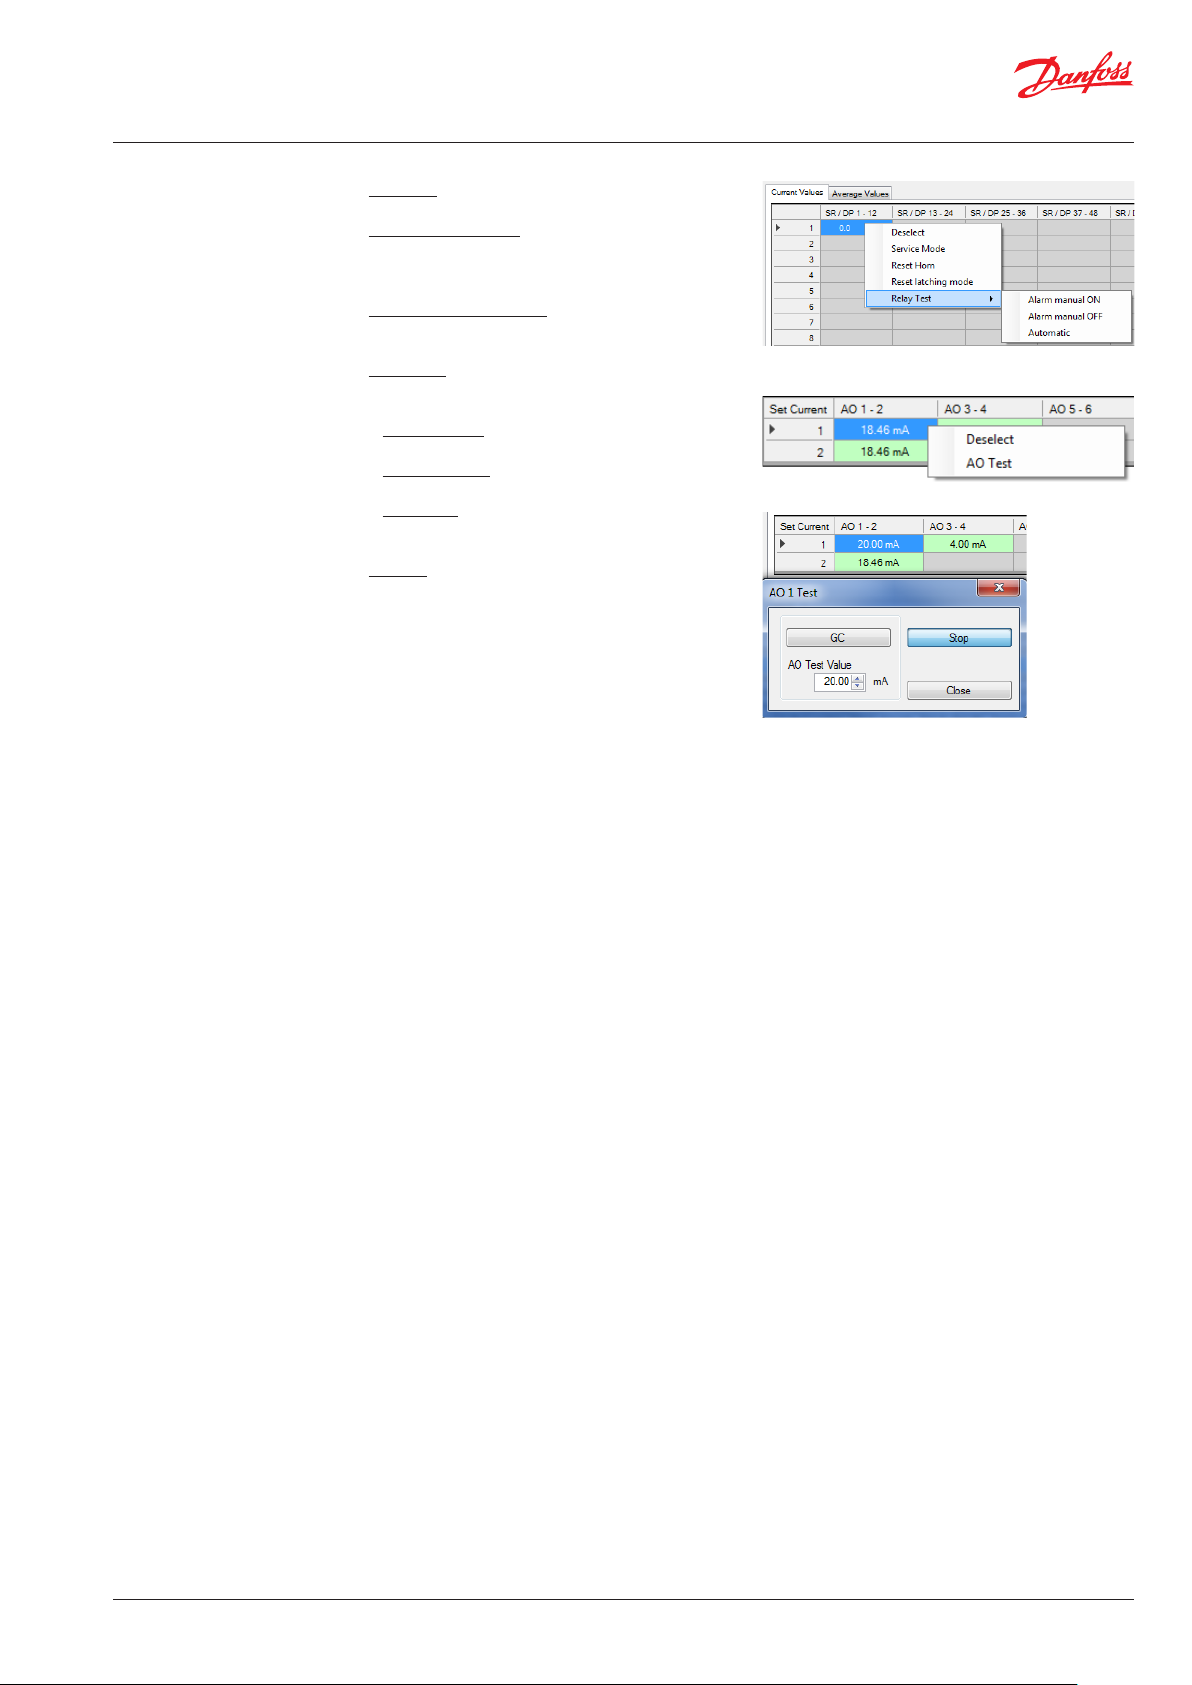
5.2.2
Context menu in the Central Bus
Deselect: The highlighted area is free again.
Acknowledge horn: Allows acknowledgment of
the horn with the address of the selected cell via
the software interface.
Acknowledge latching: Allows acknowledgment
of the latching selected address.
Relay test: Appears only if special mode is
activated and relays are available. It has three
osubmenus:
Alarm Test ON: Turns the relay into the alarm
state.
Alarm Test OFF: Turns the relay into the alarm-
free state.
Automatic: Turns the test function off. The relay
returns to its normal function.
AO test: Appears only if special mode and the
analog output are activated.
Allows testing of the analog output by setting a
fixed value.
- The left button sets the device, where the AO
should be tested; usually the software takes
over the setting automatically.
- The test value for the AO is set in the AO test
value field in the range of 0 - 22 mA.
- The upper right button starts or stops the
transmission of the test value.
- The bottom right button closes the window
for the AO test; if the transfer of the test value
is still active, it will be interrupted.
© Danfoss | DCS (MWA) | 2018.06
DKRCI.PS.S00.C1.02 | 520H12961 | 9
Page 10

User Guide | Danfoss Gas Detection - PC tool
6
Parameters
6.1
Addressing
6.1.1
Addressing of gas detection
controller
6.1.2
Addressing of expansion
module
Attention:
Due to the hard real-time behaviour the
parameter data can only be exchanged if
the device is in special mode.
Therefore, the parameter buttons are
only enabled in special mode.
This dialog opens via Parameters Addressing
or via the quick access toolbar with the icon .
The device to which the PC tool is connected to
The slave address of the gas detection controller
is assigned here.
Here the slave address is assigned to an
expansion module. It is required on the field
bus for communication with the central gas
via COM port will always be addressed. With
the Change button, the new address and any
configuration is taken over.
It is required on the M-Bus for communication
with an alarm master unit.
controller. Addresses from 1 to 7 are allowed,
since there is a maximum of seven expansion
modules.
In addition, the configuration of the expansion
module is set here.
1. column:
Number of analog input with respect to the
connected device. Corresponds to MP number
1 - 4 in MP Parameters.
2. column:
Four analog inputs can be set. They are available
at all times, so the addresses are always reserved
and the buttons AP (X) to AP (X+3) are always
active. The first four analog inputs can only be
set in the controller, so the AP addresses of the
expansion module with address 1 start in line 1
with address AP 5.
3. column:
Since there are only analog inputs, the buttons in
the third column always remain analog.
4. column:
Active: Here you can enable or disable the
analog inputs. Corresponds to the settings in the
MP Parameters menu.
5. column:
Gas type: Here you can select the gas type of the
connected analog sensor. Corresponds to the
settings in the MP Parameters menu.
6. column:
Measuring range: Here you can set the
measuring range of the connected analog sensor.
Corresponds to the settings in the MP Parameters
menu.
10 | DKRCI.PS.S00.C1.02 | 520H12961
© Danfoss | DCS (MWA) | 2018.06
Page 11

User Guide | Danfoss Gas Detection - PC tool
6.1.3
Addressing of gas detection
units
Here the slave address is assigned to a sensor
board. It is required on the field bus for
communication with the GC central device.
Addresses are allowed from 1- 96, because there
1. column:
MP number related to the connected device.
Corresponds to the MP number 1 – 4 in MP
Parameters, with Premium units having a
maximum of two measuring points.
Therefore, the P3 and P4 is always inactive and
greyed out.
can be a maximum of 96 digital measuring
points.
In addition; the desired configuration of the
sensor boards is set here.
2. column:
Up to two DP can be set. With each additional
measuring point the sensor board occupies
an additional address on the field bus. With
two activated measuring points the addresses
X, X + 1 are occupied. These addresses must
not be assigned to any other sensor board! The
superordinate controller can detect address
errors (multiple uses) only via incorrect bus data.
3. column:
Here you can set whether the measured values
should come from the digital sensor head or the
analog input.
4. column:
Active: Since each additional measuring point
occupies one address on the field bus, it is
assumed that this measuring point is physically
present and is therefore automatically activated
when addressed. However, it can be deactivated
manually.
5. column:
Gas type: Here you can select the gas type of the
measuring point. Double gas type configurations
are not allowed, therefore gas types already used
are deactivated in the selection list, displayed
greyed out and can only be used as analog
measurement points several times.
Corresponds to the setting in the MP Parameters.
6. column:
Measuring range: The measuring range of the
measuring point is set here. Corresponds to the
setting in the MP Parameters. It is essential that
it corresponds to the measuring range of the
sensor heads.
© Danfoss | DCS (MWA) | 2018.06
DKRCI.PS.S00.C1.02 | 520H12961 | 11
Page 12

User Guide | Danfoss Gas Detection - PC tool
6.2
Measuring point MP parameters
In the upper part of the dialog are all buttons
and input fields for the activation of a measuring
point:
1. MP address: The address of the measuring
point to be parameterized is entered here.
2. Selection field for the target
device where the parameters
have to be read.
Sb/PX/ MSx = Gas detection units
Ep Module = Expansion Module
GC central unit = Danfoss controller
Note: Parameters can only
be written into a device
directly connected to the PC tool.
3. Button for Digital / Analog:
If digital is set, the addresses 1-96 can be set for
the digital measuring points in MP Address. If
analog is set, the addresses 1-32 can be set for
the analog measuring points in MP Address.
Two buttons are placed in the middle of the
upper half of the dialog:
1. Read MP: Here you load the parameters of
each measuring point from the selected device in
the dialog interface.
2. Write MP: Here you can upload the settings
from the dialog interface into the connected
device. This button is inactive, if you have
selected a device one level down.
If you want to enter the same parameters for a
plurality of measuring points, you do not need to
upload them individually.
In the dialog, there is a button called Duplicate.
In this area there are also two input fields and
a button for specifying a start and end address.
The specified addresses are included when
transferring.
The Step button defines whether all measuring
points between the start and the end address
should be transmitted or only every second or
every third address.
All input fields must contain numbers.
If you make no or incorrect parameter entries
and you click on an Upload button, the fields
containing errors, are highlighted in yellow, an
info button appears and the device or file
function will not be executed (forcing a correct
and plausible input).
By clicking on the info button, a message
box pops up containing the detailed error
description.
12 | DKRCI.PS.S00.C1.02 | 520H12961
© Danfoss | DCS (MWA) | 2018.06
Page 13

User Guide | Danfoss Gas Detection - PC tool
6.2
Measuring point MP parameters
(Continued)
6.2.1
MP parameters description
On the top right there is the file area with two
buttons:
Export: With this button the parameters of all
measuring points are successively read without
showing them in the dialog interface. At the
start of transmission, the button changes its text
to Cancel, so you can cancel the transfer at any
time by clicking on the same button; but then
the read data will be lost. The remaining buttons
are deactivated until the transmission has been
completed.
When the reading is finalized, you are prompted
to save the file in the .csv format. If you cancel
the storage process, all read data will be lost. For
storing them in a file, they have to be read again!
At the end of the specified filename, the text, MP’
is appended to make sure that the measuring
point parameters are stored here.
Import: After clicking on this button, you are
prompted to select the file you want to load.
Once the correct file is selected, all measuring
point parameters are consecutively uploaded to
the controller. All buttons are disabled during
this process.
If an incorrectly structured file is selected, the
transfer will not be admitted.
© Danfoss | DCS (MWA) | 2018.06
In the middle of the dialog are all input fields for setting the measuring point parameters:
1. Active or Inactive indicates whether the measuring point should be activated (physically present).
2. Unlock or Lock indicates whether the measuring point should be (temporarily) blocked.
3. Gas Type: Here the gas type is assigned to the measuring point.
4. Measuring Range: Here the measuring range is assigned to the measuring point.
5. Threshold 1 - Threshold 4: Values of the alarm thresholds, each with its own function box for
- Alarm release at in- or decreasing concentrations
- Alarm release by current (CV) or average (AV) value.
6. Hysteresis: The measured value has to exceed or to fall below the alarm threshold by the
hysteresis value, so that the alarm will be deleted.
7. CV ON Delay Time (sec): Switch-on delay for the release by the current value in seconds (not
applicable for Heavy duty units, it is always 0)
8. CV OFF Delay Time (sec.): Switch-off delay for the release by the current value in seconds
9. Average Value Overlay / No AV Overlay: Average value overlay is only available for gas type CO.
10. Analog Output: Assignment of MP to one or two analog outputs
11. Alarm / Fault / Latching
- Assignment of relay to alarm (Alarm Relays AR 1 - 32 or Signal Relays SR 1 - 96)
- Setting of alarms in case of an error of the measuring point
- Alarm latching when the gas concentration is again < alarm threshold (requires manual
acknowledgment by the operator)
The information about the current operation is displayed at the very bottom of the status field.
DKRCI.PS.S00.C1.02 | 520H12961 | 13
Page 14

User Guide | Danfoss Gas Detection - PC tool
6.3
Relay parameters
Same as for the measuring point parameters, all buttons and input fields for activation of a relay are
located in the upper part of the dialog:
1. Relay Address: Address of the relay to be parameterized.
2. Selection field for the targetdevice from which the
parameters have to be read.
Note: Parameters can only be written in the device directly connected to the PC tool.
3. Button for Alarm Relay / Signal Relay
(only GC central unit):
If Alarm Relay is set, you can set addresses from 1 to 32 for the alarm relays in Relay Address. If
Signal Relay is set, you can set addresses from 1 to 96 for the signal relays in Relay Address.
In the middle of the upper half of the dialog there are two buttons:
1. Read Relay: Here you download the parameters of the corresponding relay from the controller
into the dialog interface.
2. Write Relay: With this button you can write the final settings into the controller, with the
parameters being stored under the specified relay address.
Same as for the measuring point parameters, there is also the Duplicate button and two input fields
for start and end address. Here the relay settings from the start to the end address are transmitted into
the controller.
With the Export button all relay parameters are read by the controller and you are prompted to save
the data in a CSV file. If you cancel the storage, all read data will be lost. The transmission can be
interrupted at any time the same way as for the measuring point parameters.
A previously selected file can be uploaded to the controller by means of the import button.
14 | DKRCI.PS.S00.C1.02 | 520H12961
© Danfoss | DCS (MWA) | 2018.06
Page 15
User Guide | Danfoss Gas Detection - PC tool
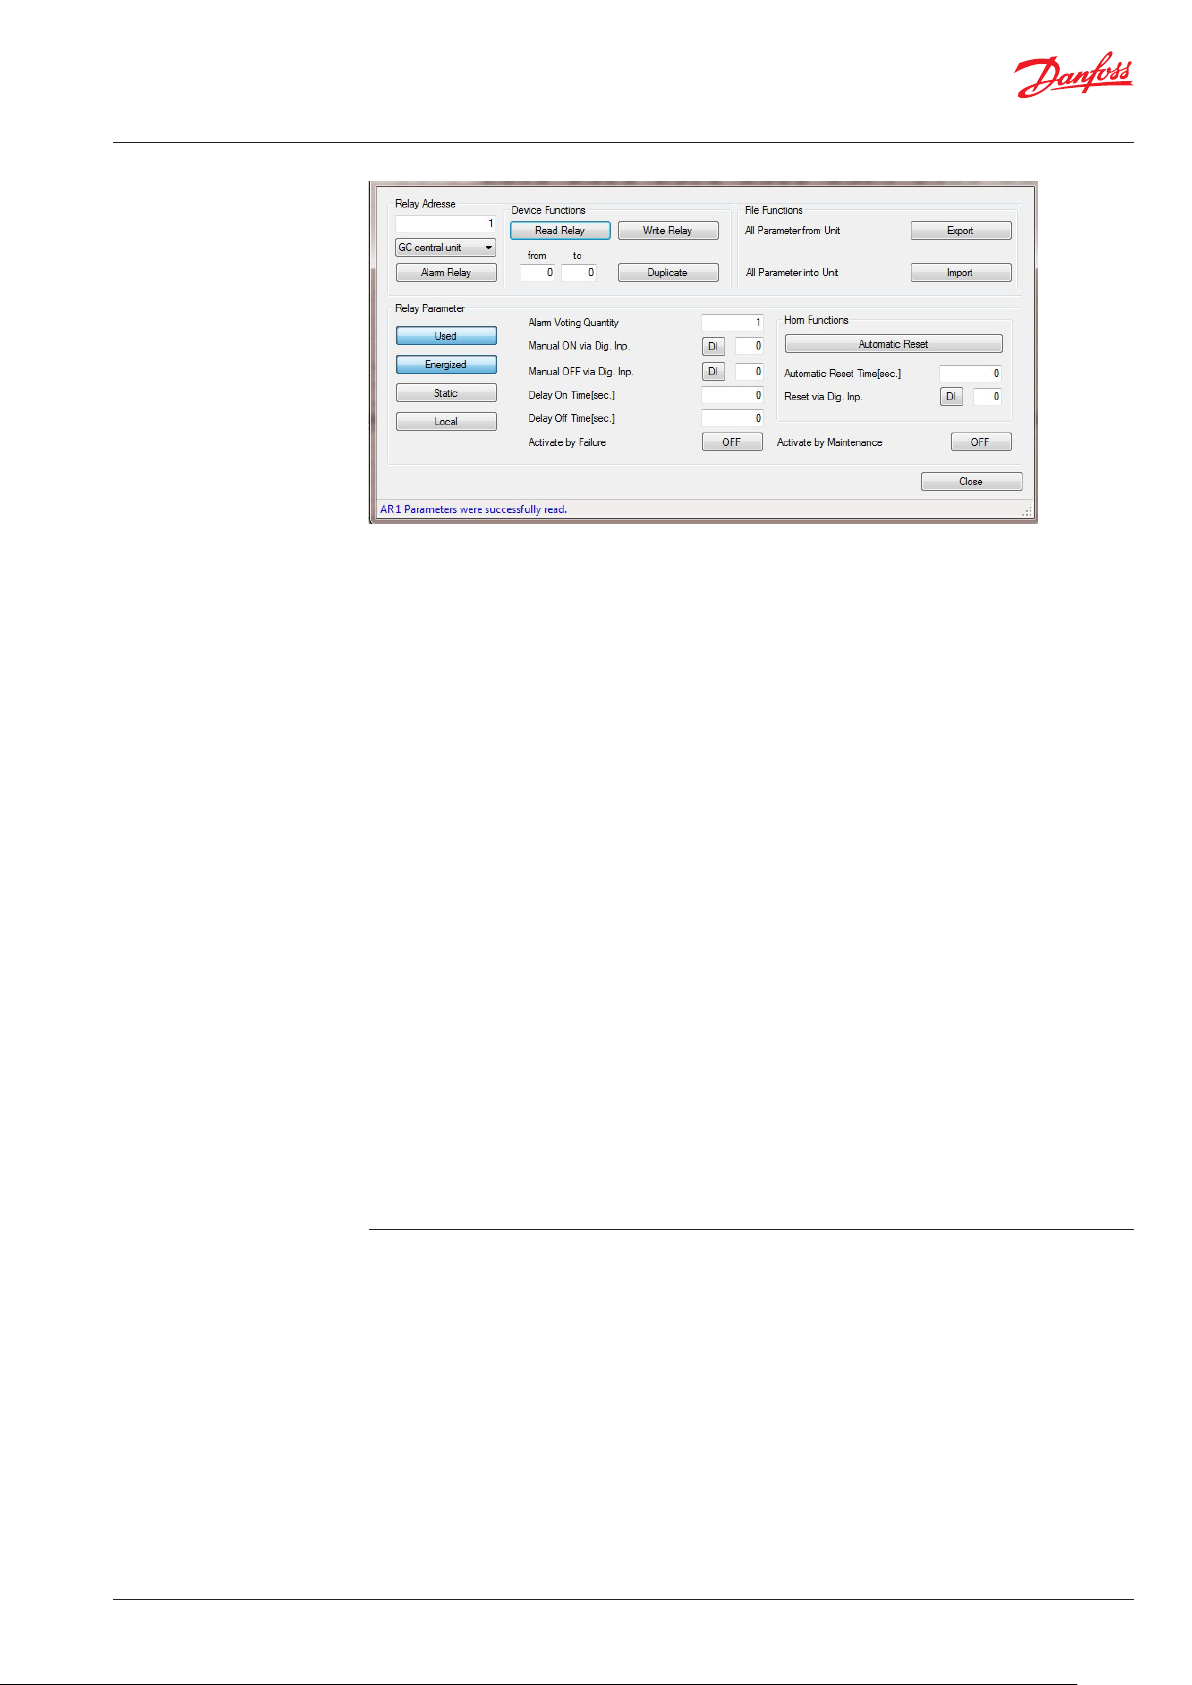
6.3.1
MP parameters description
Same as for the MP parameters, all input fields for setting parameters of a relay are located in the
middle of the dialog:
1. Used / Unused:
Indicates whether the relay is physically available.
2. Energized / De-energized: Operating or quiescent current
3. Static / Flashing: Static or flashing mode
4. Local / Remote:
Control mode of the relay:
Own alarm evaluation (local) or override by the GC central unit (remote)
5. Alarm Trigger Quantity: The relay switches only when the number of active alarms has been
reached. Only if all alarms are cleared, the relay switches off again.
6. External relay, manual ON / OFF:
BI(1-96) / DI(1-32) distinguishes between the digital inputs of Gas detection units and expansion
modules.
a.Manual ON via DI: External ON function via digital input
b.Manual OFF via DI: External OFF function via digital input
7. Delay On: Delay time for switching-on in seconds
8. Delay Off: Delay time for switching-off in seconds
9. Horn function:
a. Automatic Reset / Automatic Return: The text of the time specification adapts depending
on the selection.
b. Time for automatic reset / Time for automatic return: is specified in seconds.
c. Reset via DI: The horn is deactivated via the specified digital input DI.
(Distinction: DI = GC and EP modules, all other field modules = BI)
If no time is set (0) and no digital input selected (0), the horn functions are inactive.
10. ON / OFF at Failure: If ON is set, this relay will always switch together with the collective fault
message.
11. ON / OFF at Maintenance: If ON is set, this relay will switch together with the maintenance
message of the devices.
At the very bottom of the status field the information about the current operation is displayed.
© Danfoss | DCS (MWA) | 2018.06
DKRCI.PS.S00.C1.02 | 520H12961 | 15
Page 16
User Guide | Danfoss Gas Detection - PC tool
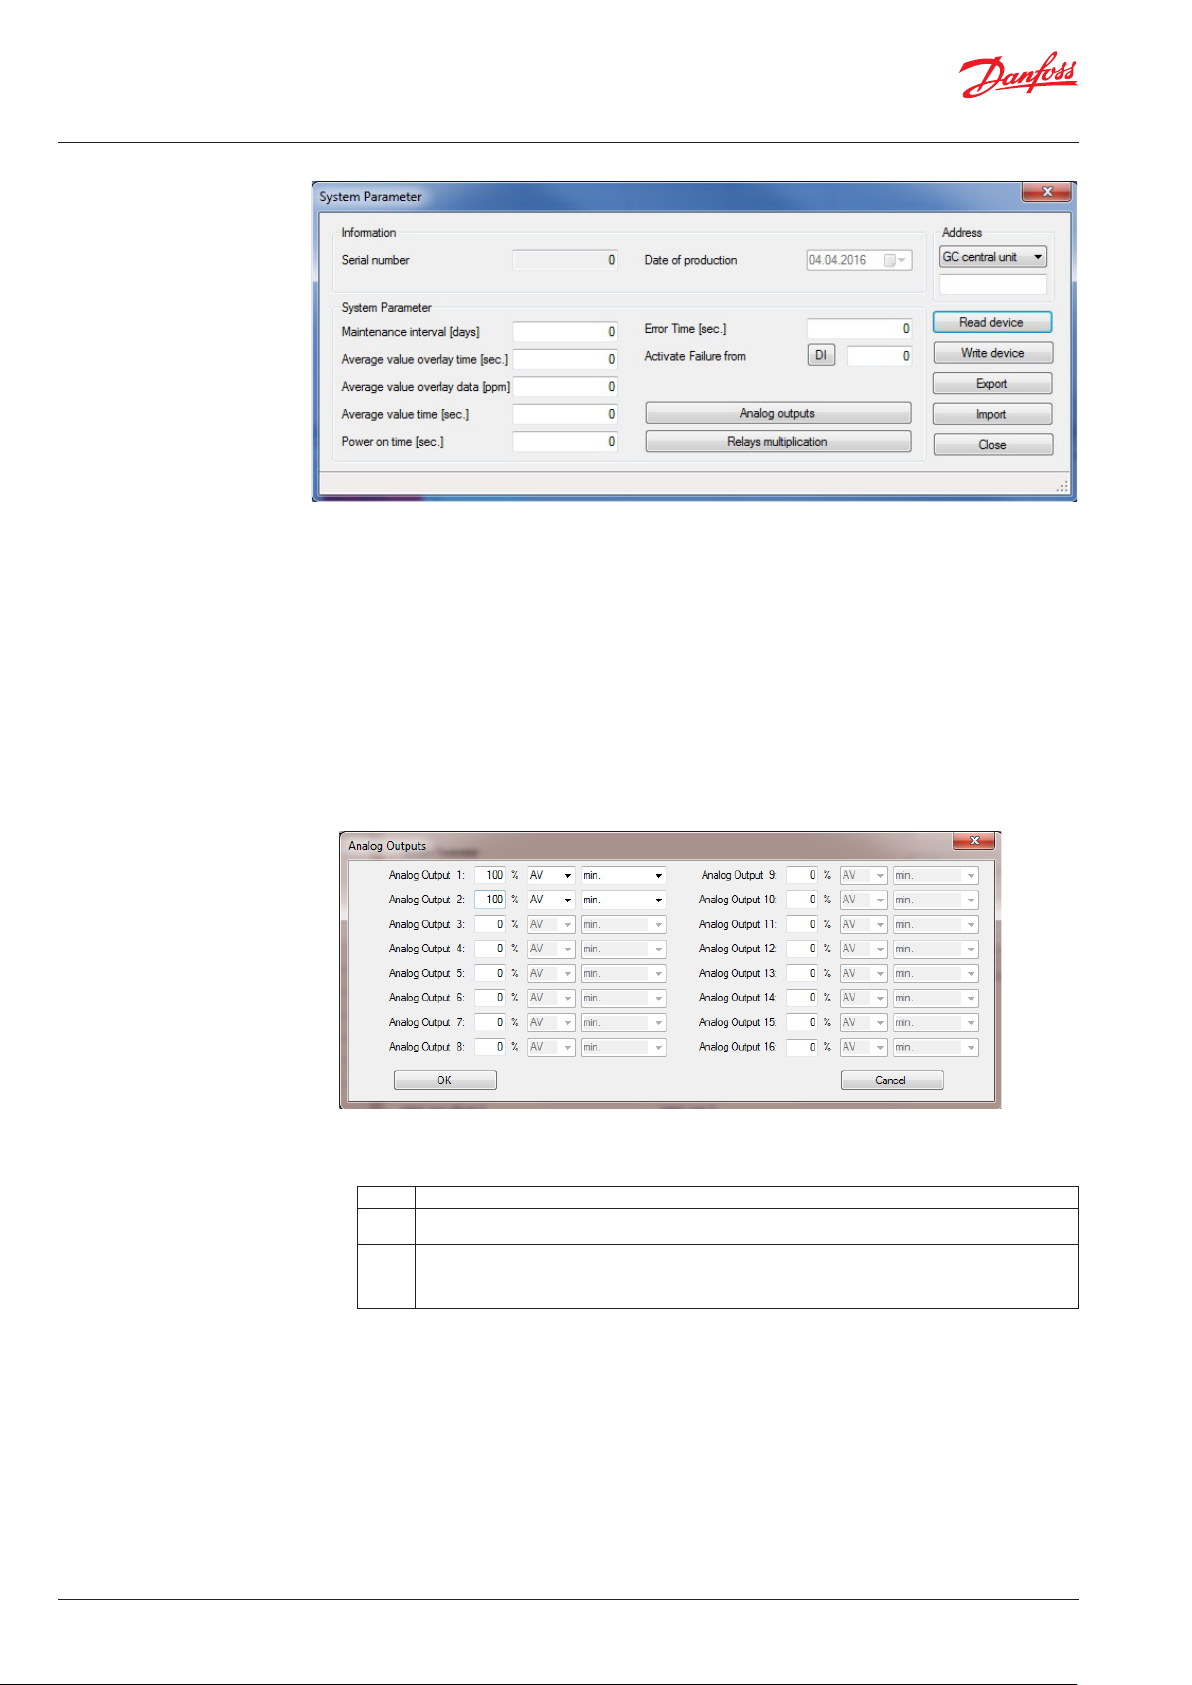
6.4
System parameters
The values on the the upper left of the window can only be read.
1. Serial number
2. Date of production
In the left middle area are the input fields for the system parameters:
1. Maintenance interval: The service interval is entered during each maintenance in the field
(current remaining days until maintenance).
2. Average value overlay: Averaging overlay in seconds and ppm
3. Average value time: Time base for averaging in seconds
4. Power On Time: Start delay of alarm evaluation after switching-on in seconds
5. Error time in seconds: Is currently not implemented.
6. Activate failure via DI: Activation of collective fault relays by external DI
7. Analog outputs: Button for opening an additional dialog for the analog outputs.
8. Here, a total of 16 available analog outputs can be configured.
The following values can be set per each analog output:
a. Scaling range:
b. Source for the values to be output: Current or average value.
c. Definition, which signal of all assigned MP will be output:
Min.(= minimum gas signal); average (= average calculation); Max.(= maximum gas signal)
With a click on the OK button the settings for the analog inputs are accepted internally.
The settings are written later together with other system parameters.
16 | DKRCI.PS.S00.C1.02 | 520H12961
0 Analog output not active
1 Analog output active, but is overridden by the GC central unit (Setting is not available in GC controller as it and
only it can control)
10-100 Analog output active
The value indicates the factor how the measuring range is scaled to 4-20 mA, e.g. 100% requires 100% of the
range scaled to 4-20mA
10% only requires 10% of the range scaled to 4-20mA
© Danfoss | DCS (MWA) | 2018.06
Page 17
User Guide | Danfoss Gas Detection - PC tool
6.4
System parameters (Continued)
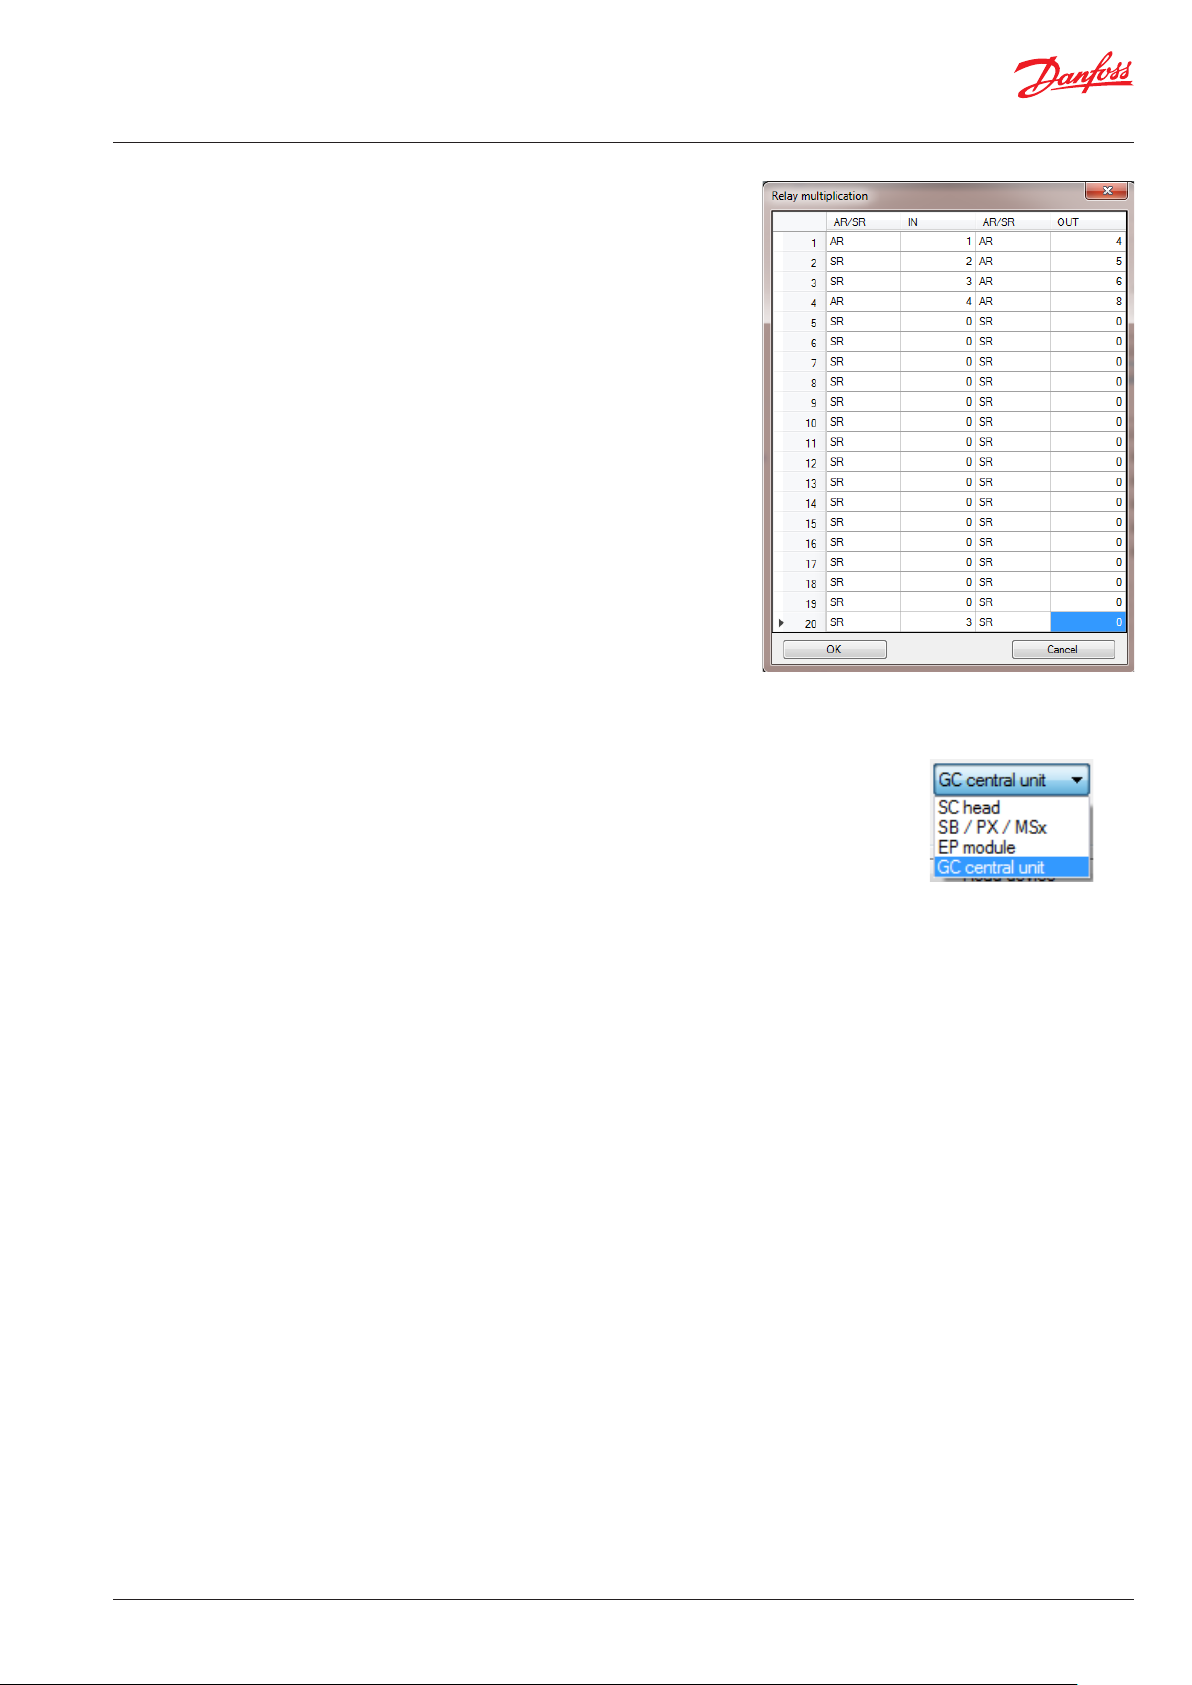
9. Relay Multiplication: is opening an
additional dialog for the relay multiplication.
This feature is available only in the Danfoss
controller.
With the relay multiplication table it is
possible to assign additional relay functions
to an alarm in the system. This corresponds
to one reproduction of the source relay per
entry.
The additional relay then follows the state
of the source relay, but uses its own
relay parameters to allow different needs
of the doubled relay. The source relay can
be configured e.g. as a safety function
relay in de-energized mode whereas the
doubled relay may be defined with flashing
function or as horn function relay.
There is a maximum of 20 entries (Controller)
and three entries (Premium units) for IN and
OUT relays. It is possible on the one hand to
multiply one relay to further relays
or on the other hand to double max. 15
relays (Controller). In the column IN (source),
the relay that has been assigned is set to an
alarm in MP Parameters.
In the column OUT (target) the additionally
required relay is entered.
Next in the dialog System Parameters:
At the right side is the control range with buttons:
1. Address: Just as with the two previous parameter dialogs the system
dialog contains the control range of the addresses with the difference
that system parameters can also be read from a sensor head.
2. Input field for the address the parameters should be read from.
Note: Parameters can only be written in the device directly connected to the PC tool.
Just as with the two previous parameter dialogs, there are two buttons “Read device” and “Write device”.
With these buttons the system parameters are read from the device into the dialog or written back
into the device.
Unlike the other parameter dialogs, there is no Duplicate button, because the system parameters only
exist once.
The System Parameters dialog also has two file buttons to save the settings into a file or to upload
them from a file.
Unlike the other parameter dialogs, the system parameters are saved from the dialog interface into a
CSV file and uploaded from the file into the dialog interface.
© Danfoss | DCS (MWA) | 2018.06
DKRCI.PS.S00.C1.02 | 520H12961 | 17
Page 18
User Guide | Danfoss Gas Detection - PC tool
7
Calibration at the local bus
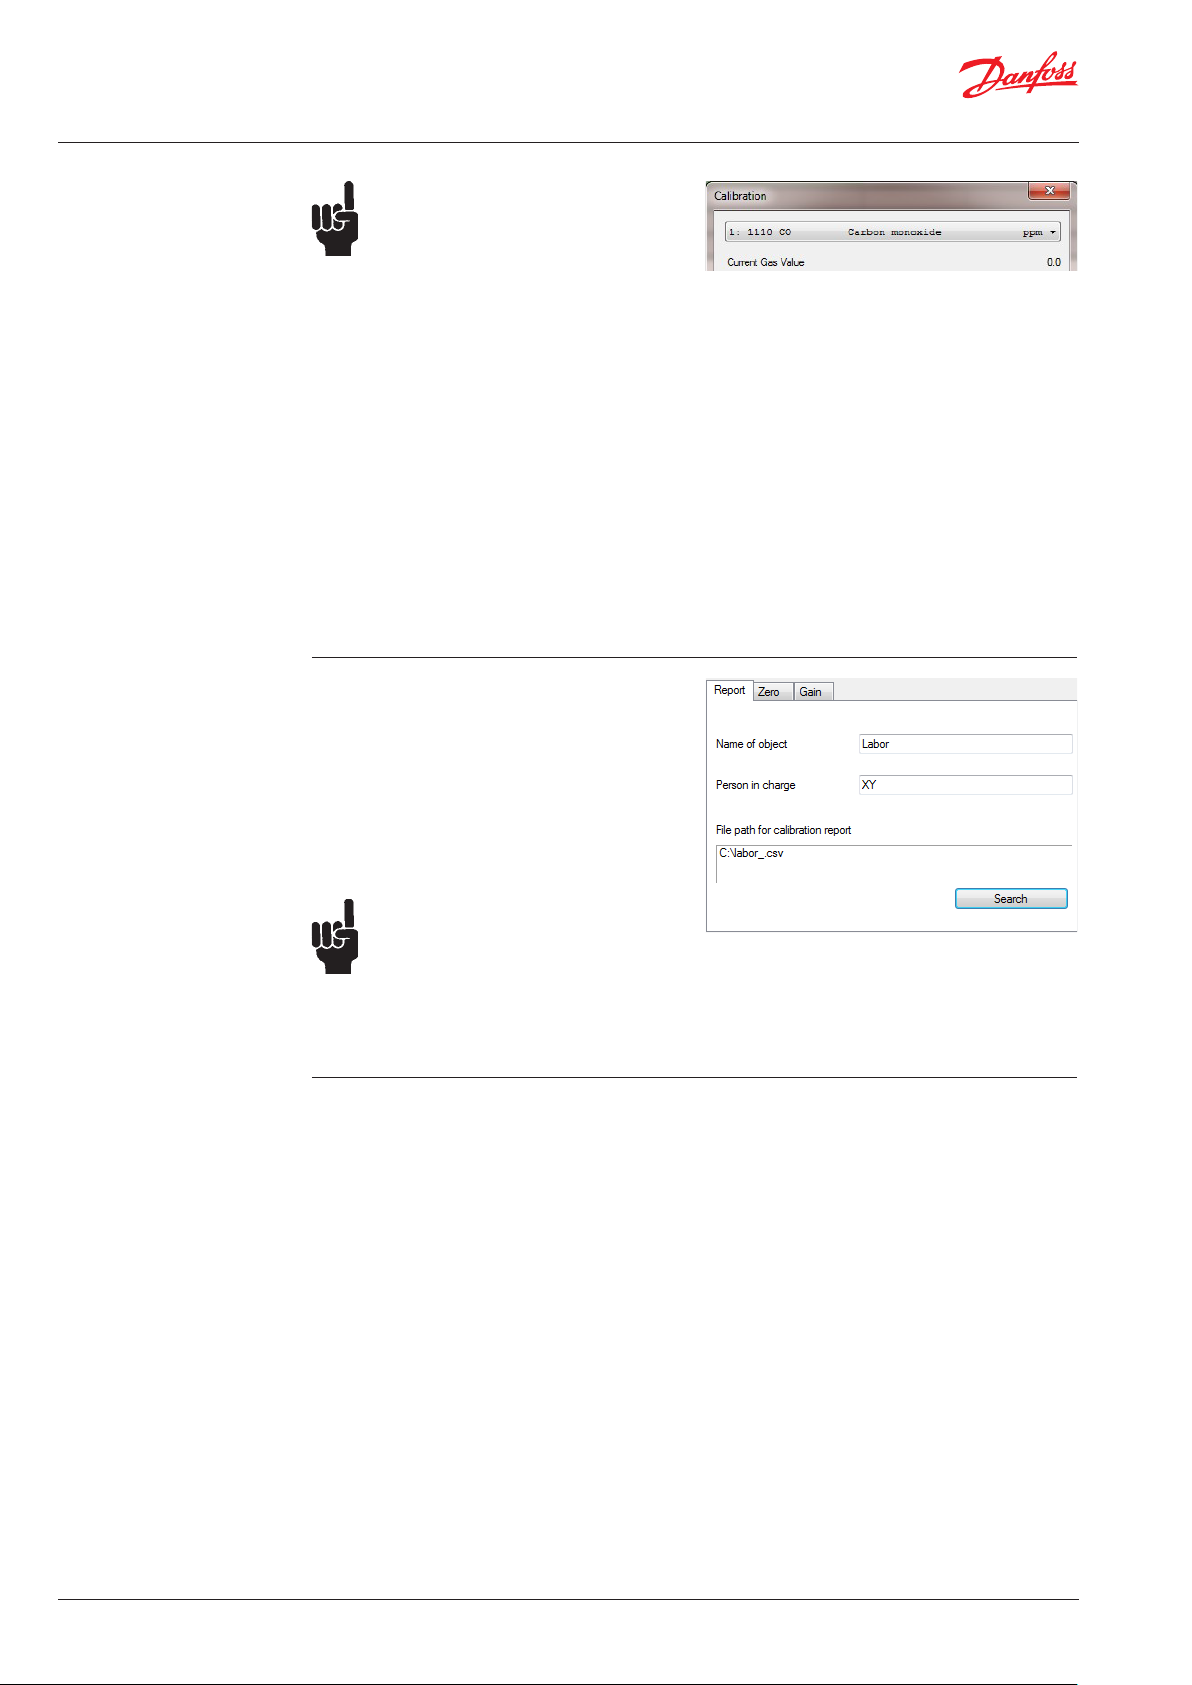
7.1
Register tab „Report“
Attention:
The calibration function can only be
used when the device is in special mode.
Therefore, the menu item and the button
for calibration are only active in special
mode.
Using this dialog, the sensor heads can be
recalibrated. The calibration is carried out via the
local bus. Please connect the PC software via the
COM port to the sensor board.
In the upper part of the dialog is a selection box
where you can define the target head. Directly
under it the current value of the set head is
displayed.
In the middle of the dialog there are three
register tabs: Report, Zero and Gain. Directly
below that you can find the system tray with
information on the calibration process. At the
bottom right the close button which quit the
dialog.
The tab Report contains:
- Name of object
Here you can enter the name of the current
object.
- Person in charge
Here you can enter the name of the responsible
person.
- a box with the path to the location of the
calibration report. The file path can be selected
via the Search button.
Attention:
The entries in these fields are important
for the calibration, as this information will
appear in the calibration report.
The software prevents you from
switching to the calibration register tabs
before the object information fields have
not been completed.
18 | DKRCI.PS.S00.C1.02 | 520H12961
© Danfoss | DCS (MWA) | 2018.06
Page 19
User Guide | Danfoss Gas Detection - PC tool
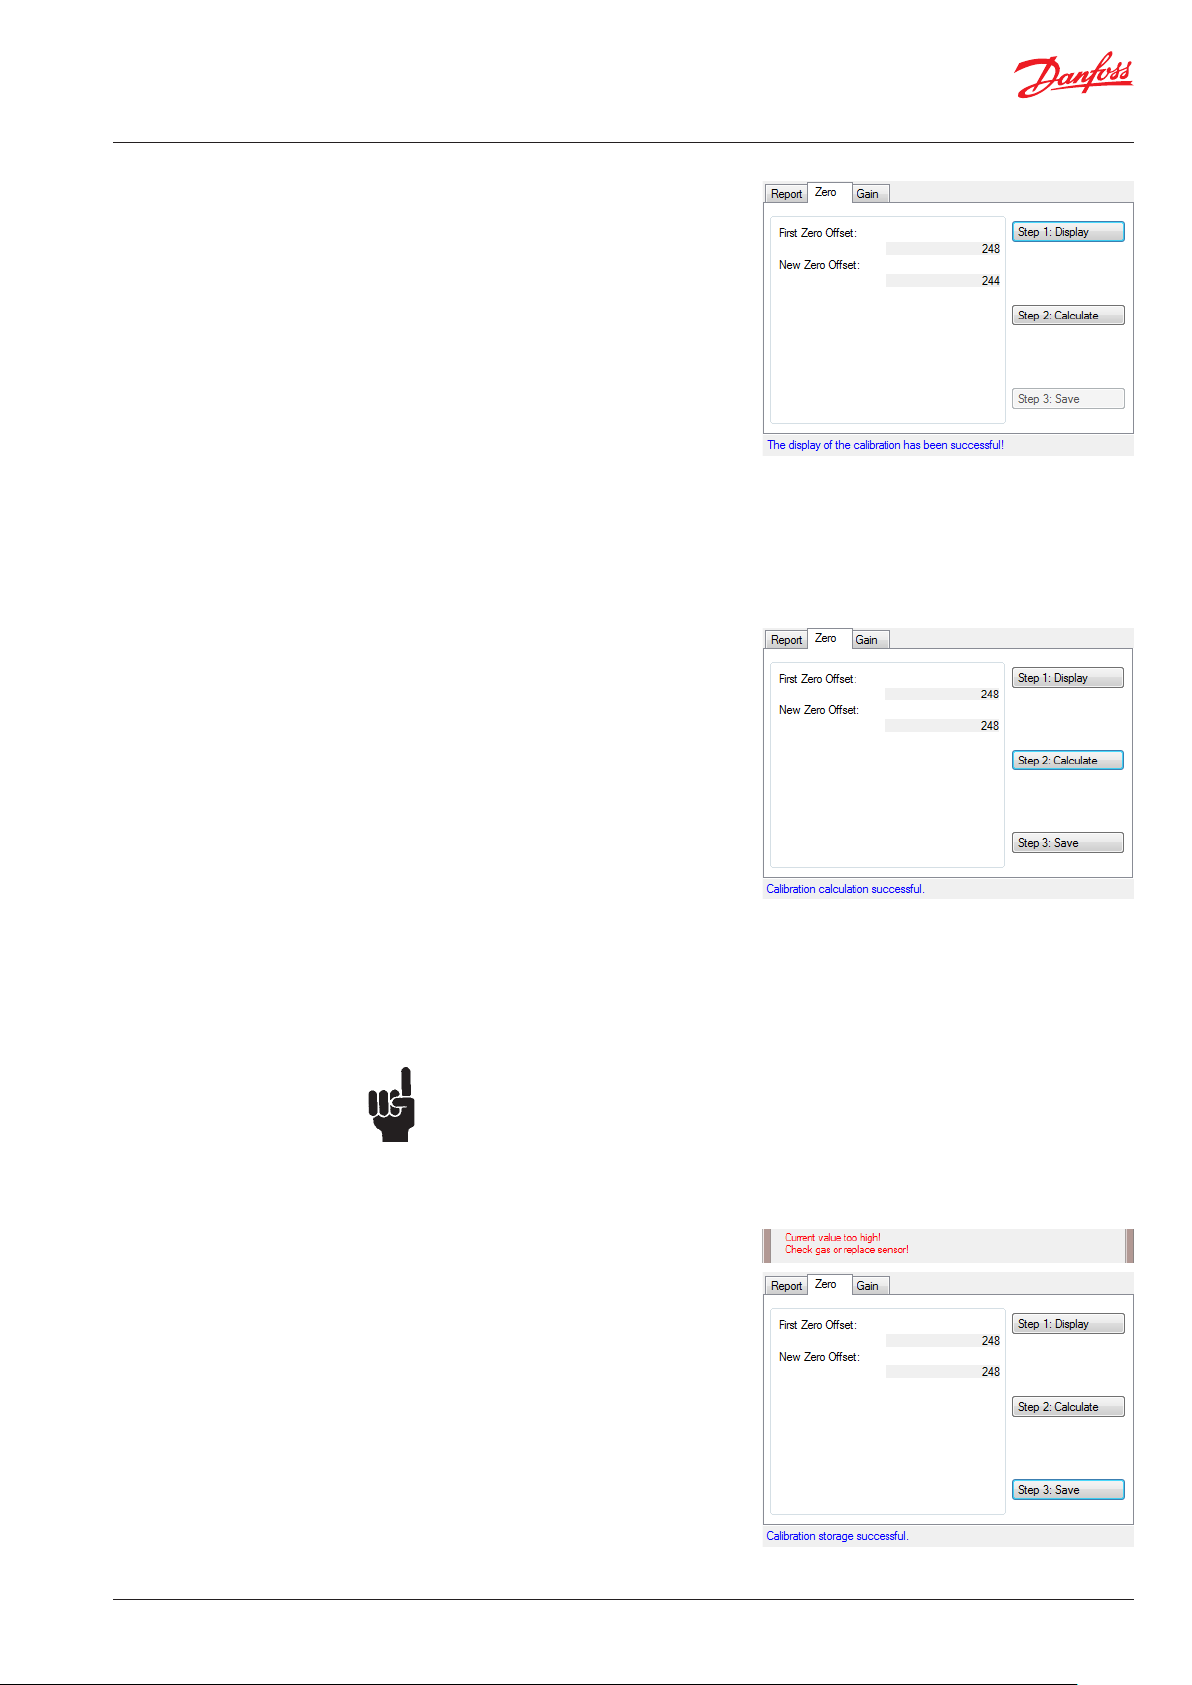
7.2
Register tab „Zero“
The tab Zero contains:
- First Zero Offset
Here the first zero offset is displayed.
- New Zero Offset
Is displayed as soon as it is successfully
calculated.
- Three buttons:
Step 1: Display
Step 2: Calculate
Step 3: Save
Prior to calibrating the zero point, you have to
display the current values by clicking on the
button Step 1: Display
If the values could be read successfully,
the corresponding message is displayed in the
system tray, and only then the button Step 2:
Calculate is enabled. The current values for the
display are permanently read, and the current
status is always shown in the window. No need
for pressing the button again.
When clicking on the button Step 2: Calculate
the zero calibration switches into the calculation
mode. The calculation of the new zero offset
is permanently executed and displayed in the
associated field. The values are therefore always
updated.
When the calculation has been successfully
completed, the current value in Current gas
value drops to 0 and the button Step 3: Save is
activated.
If you cancel the calibration now by closing the
dialog box or by changing over to another tab, a
message box will be activated asking if you want
to quit this function without saving. With the Yes
button you will definitely cancel the function,
with the No button you will return to the current
dialog.
If you cancel the function definitely or disconnect
the device, the recalculated zero offset value
is lost. After exiting the special mode, the last
stored zero offset is used again.
© Danfoss | DCS (MWA) | 2018.06
Note:
For calibrating the zero point, you need
zero gas or sample gas-free ambient air.
The measured value must not exceed
the 10% mark of the measuring range!
Sensors with higher deviation can no
longer be used.
In this case, the appropriate error message
appears in the system tray and the button “Step
3: Save” is disabled.
Use the button “Step 3: Save” for saving the
new zero offset which will be employed with
immediate effect. This can also be seen with
the display of all measuring points in the main
window. The permanent calculation mode has
finished now.
DKRCI.PS.S00.C1.02 | 520H12961 | 19
Page 20
User Guide | Danfoss Gas Detection - PC tool
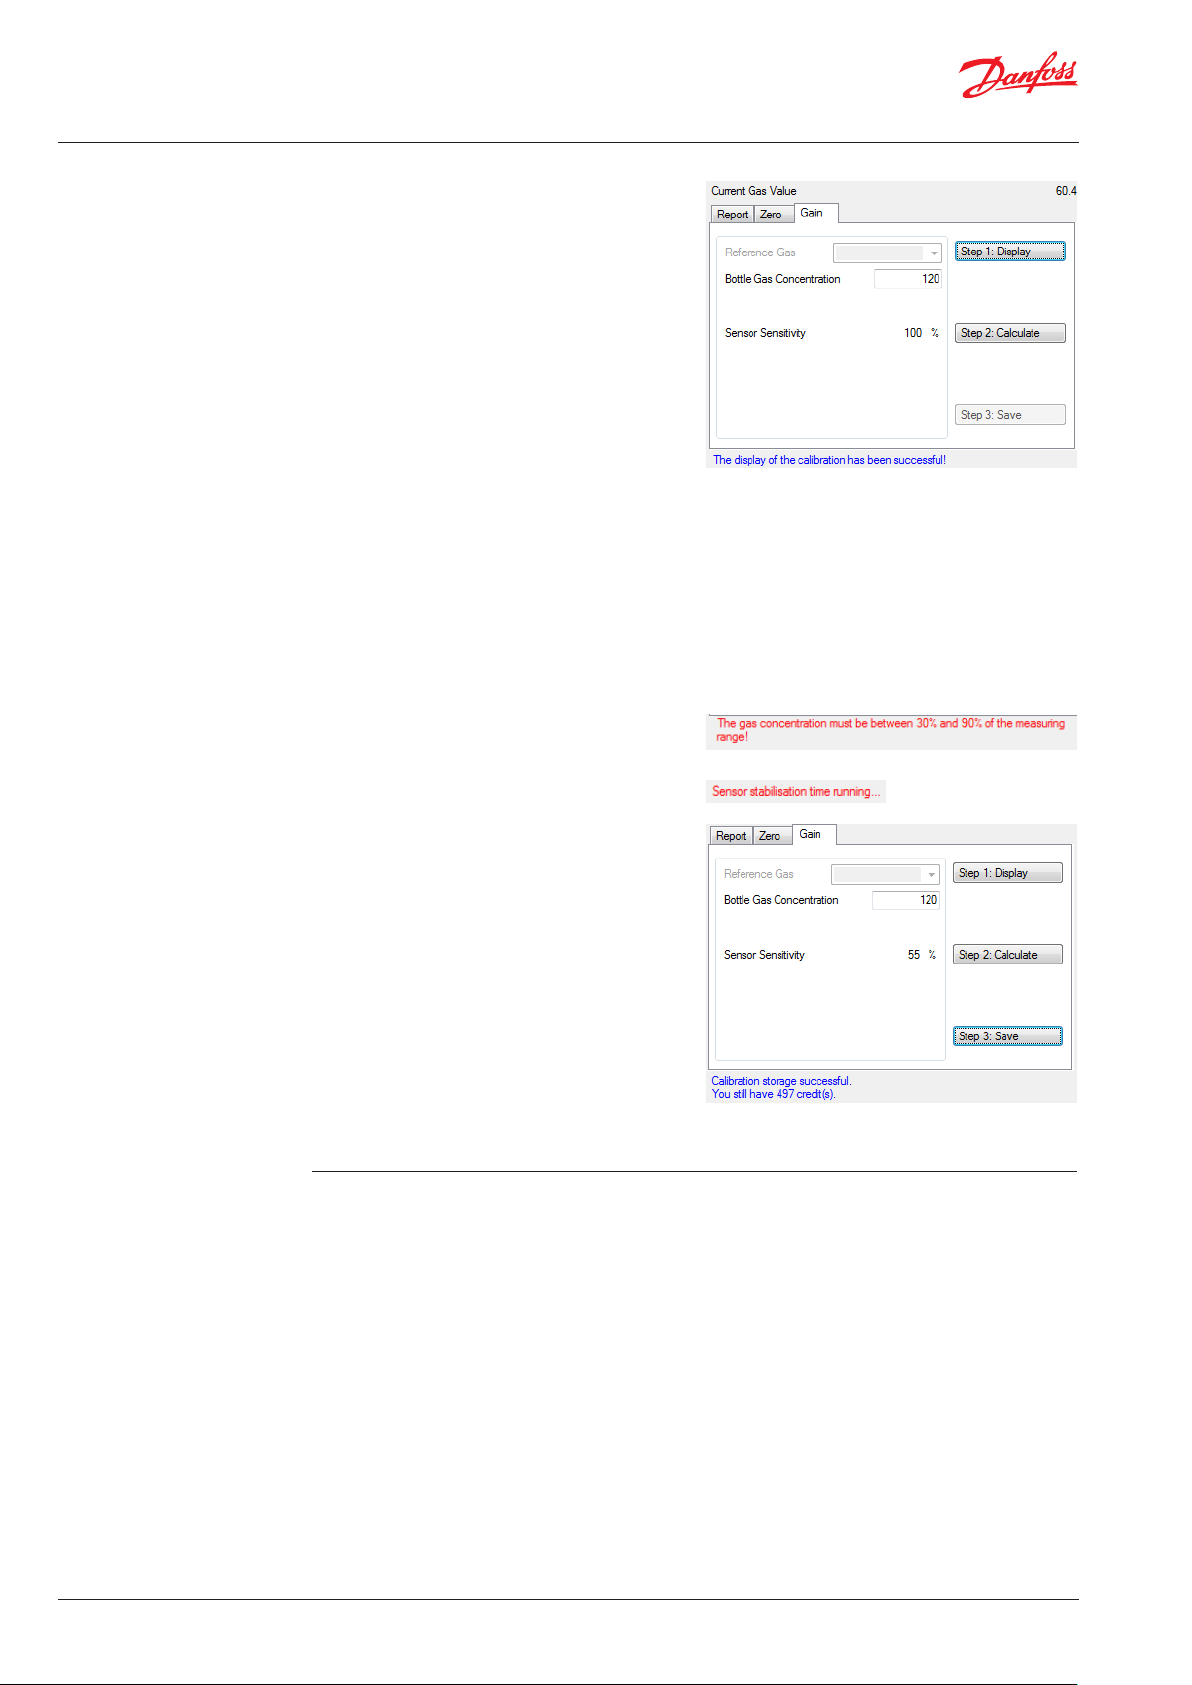
7.3
Register tab „Gain“
The tab Gain contains:
- Reference gas:
Currently not implemented, intended for the
calibration with reference gas.
- Test Gas Concentration
Enter the concentration of the test gas here.
- Sensor Sensitivity
Is displayed in %.
- Three buttons:
Step 1: Display
Step 2: Calculate
Step 3: Save
Prior to calibrating the gain, you have to display
the current values by clicking on the button
Step 1: Display If the values could be read
successfully, the corresponding message will be
displayed in the system tray, and only then the
button Step 2: Calculate is enabled. The current
values for the display are permanently read, and
the current status is always shown in the window.
No need for pressing the button again.
When clicking on the button Step 2: Calculate
the gain calibration switches to the calculation
mode. The calculation of the new gain is
permanently executed and is based on the test
gas concentration.
If the value of the entered test gas concentration
is too high or too low, an error message will
appear.
The current status for the calculation is displayed
in the system tray beneath the tab.
When the calculation has been successful, the
current sensor sensitivity is displayed, the actual
value in Current gas value accepts the value of the
test gas concentration and the button Step 3:
Save is enabled.
If you cancel the calibration now by closing the
dialog box or by changing over to another tab, a
message box will be activated asking if you want
to quit this function without saving. With the Yes
button you will definitely cancel the function,
with the No button you will return to the current
dialog.
If you cancel the function definitely or disconnect
the device, the recalculated gain factor is lost.
After exiting the special mode, the last stored
gain factor is used again.
20 | DKRCI.PS.S00.C1.02 | 520H12961
© Danfoss | DCS (MWA) | 2018.06
Page 21
User Guide | Danfoss Gas Detection - PC tool
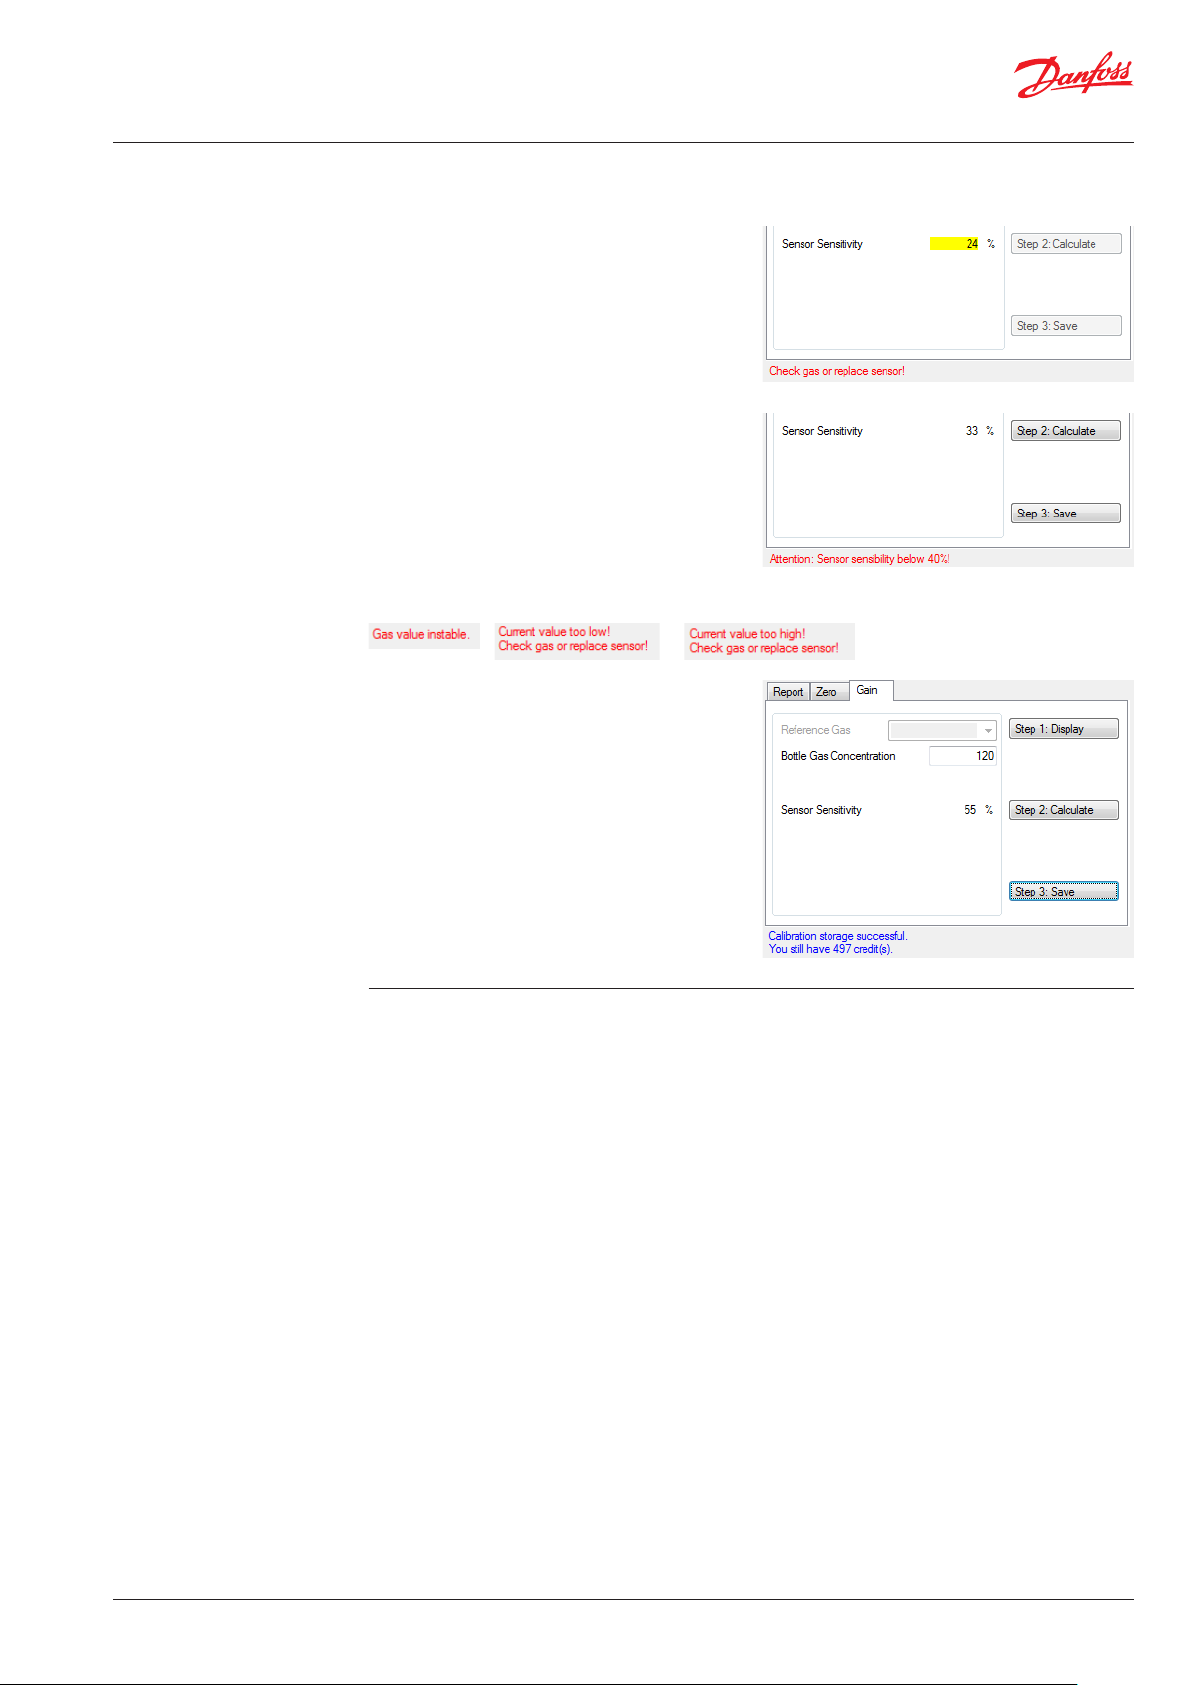
7.3
Register tab „Gain“ (Continued)
If the gain calibration was not successful, there
might be several reasons:
- If the sensor sensitivity is below 30%, the
calibration of the gain is cancelled. The sensor
is either too old and you can no longer calibrate
its gain, or there is no calibration gas present
on the sensor. Storage is not allowed in this
case, therefore, the buttons are disabled.
- If the sensor sensitivity is higher than 30%, but
lower than 40%, the gain is calibrated, but it is
noted that the sensor is defective; furthermore,
you should check if calibration gas is present on
the sensor.
- The calibration of gain is not possible with the
following error messages either.
Use the button Step 3: Save for saving the
new gain factor which will be employed with
immediate effect. This can also be seen with
the display of all measuring points in the main
window. The permanent calculation mode has
finished now.
© Danfoss | DCS (MWA) | 2018.06
DKRCI.PS.S00.C1.02 | 520H12961 | 21
Page 22
User Guide | Danfoss Gas Detection - PC tool
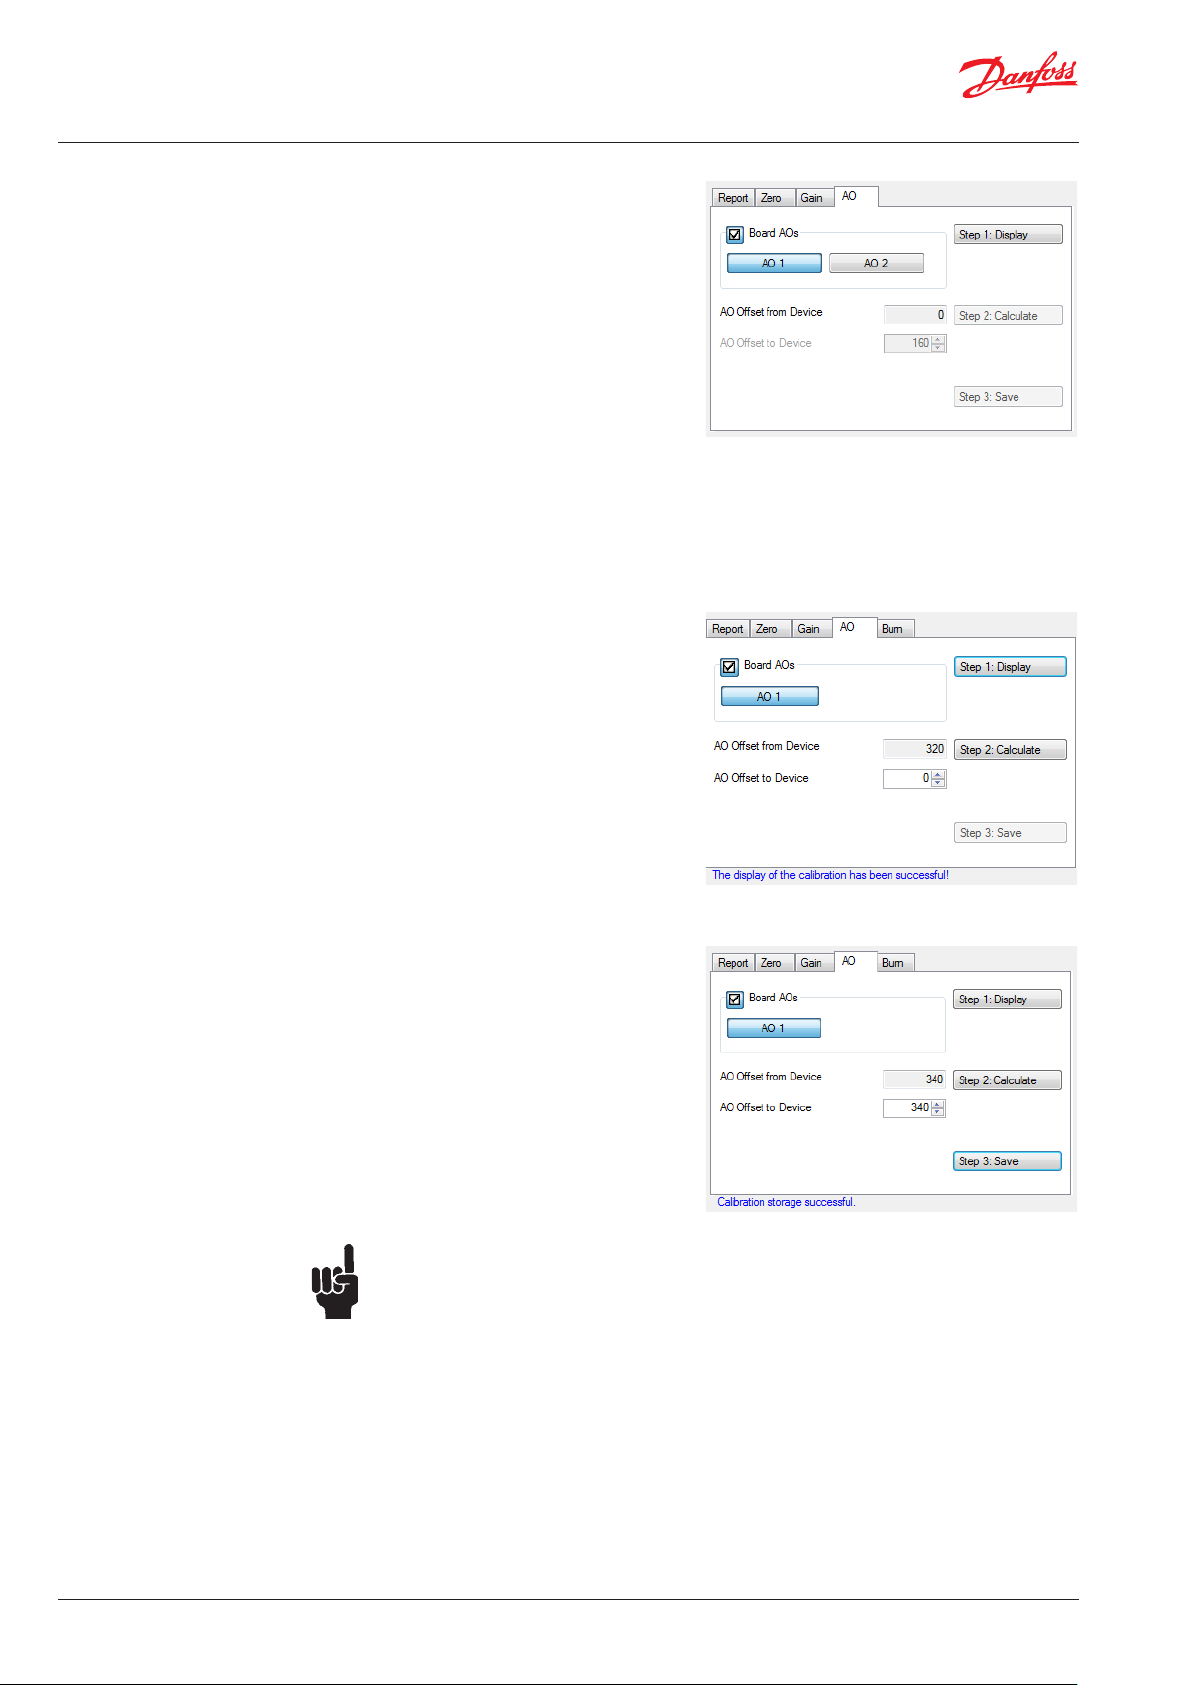
7.4
Zero-point calibration of the
analog output
The tab AO contains:
- Board AOs
Here you can set whether the analog output of
the connected device should be calibrated. If
the box is not ticked, the device, in which
the AO should be calibrated, will be set via the
selection field of the measurement points.
- AO1 and AO2:
Depending on the connected device type
there is either only the AO1 or additionally the
AO2.
- AO Offset from device
Here the current offset of the analog output is
displayed.
- AO Offset to device
Here the new offset is set in the range of 160 to
700 (AD converter value)
- Three buttons:
Step 1: Display
Step 2: Calculate
Step 3: Save
Prior to calibrating the AO zero-point, you must
display the current values by clicking on the
button Step 1: Display. If the values could be
read successfully, the corresponding message
will be displayed in the system tray, and only then
the button Step 2: Calculate will be enabled. The
current values for the display are permanently
read, and the current status is always shown in
the window. No need for pressing the button
again.
When clicking on the button Step 2: Calculate
the AO zero-point calibration switches to the
calculation mode. The calculation of the new
signal zero offset is permanently executed and
displayed in the corresponding box. The values
are therefore always updated.
When the calculation has been successful, the
actual value is not added to it and the button
Step 3: Save is enabled.
If you cancel the calibration now by closing the
dialog box or by changing over to another tab, a
message box will be activated asking if you want
to quit this function without saving. With the Yes
button you will definitely cancel the function,
with the No button you will return to the current
dialog.
If you cancel the function definitely or disconnect
the device, the recalculated zero offset is lost.
After exiting the special mode, the last stored
zero offset is used again.
Note:
To calibrate the analog output zero, you
need an amperimeter to change it until
the value corresponds to the desired
zero.
If the calculation was not successful, the
corresponding error message appears in the
system tray and the button Step 3: Save is
disabled.
With the Step 3: Save button the new zero offset
is stored and will be used immediately.
22 | DKRCI.PS.S00.C1.02 | 520H12961
© Danfoss | DCS (MWA) | 2018.06
Page 23
User Guide | Danfoss Gas Detection - PC tool
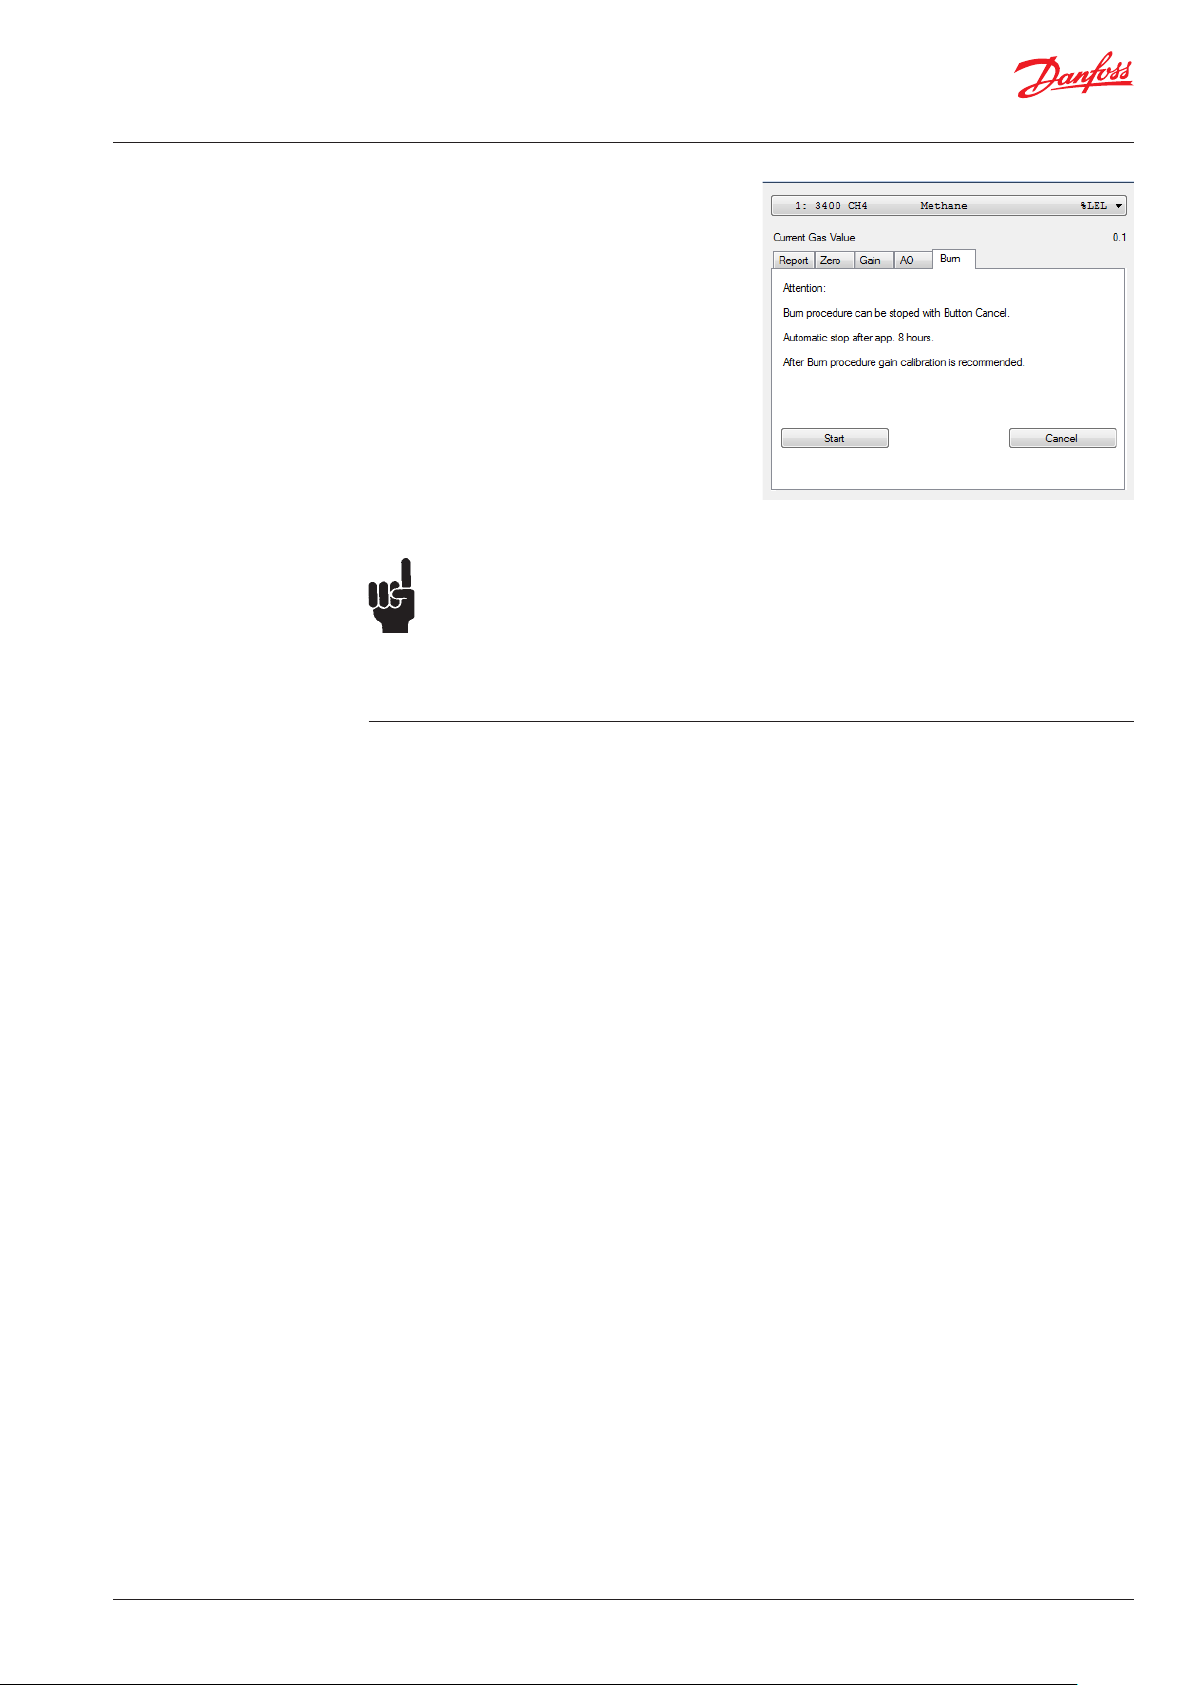
7.5
Register tab “Burn” (selfcleaning by burning)
This tab Burn is for starting the process of heating
a pellistor sensor up for self-cleaning.
- The Start button sets the command for
burning free.
- The Cancel button interrupts the burning
process.
The buttons are only enabled for Pellistor sensors.
The function is for heating catalytic bead sensors
(pellistors) up to a higher temperature for a
certain time in order to remove any residues on
the heating wire.
It is used if the sensors show too low sensitivity
on some or all combustible gases due to dirt on
the filament.
Before starting the burn-off, a combustible test
gas - the best would be hydrogen - has to be
applied to the pellistor with a calibration cap in
order to intensify the combustion.
Note:
The burning cannot improve or undo the
natural aging!
The operation can be stopped with Cancel at any
time.
© Danfoss | DCS (MWA) | 2018.06
DKRCI.PS.S00.C1.02 | 520H12961 | 23
Page 24
User Guide | Danfoss Gas Detection - PC tool
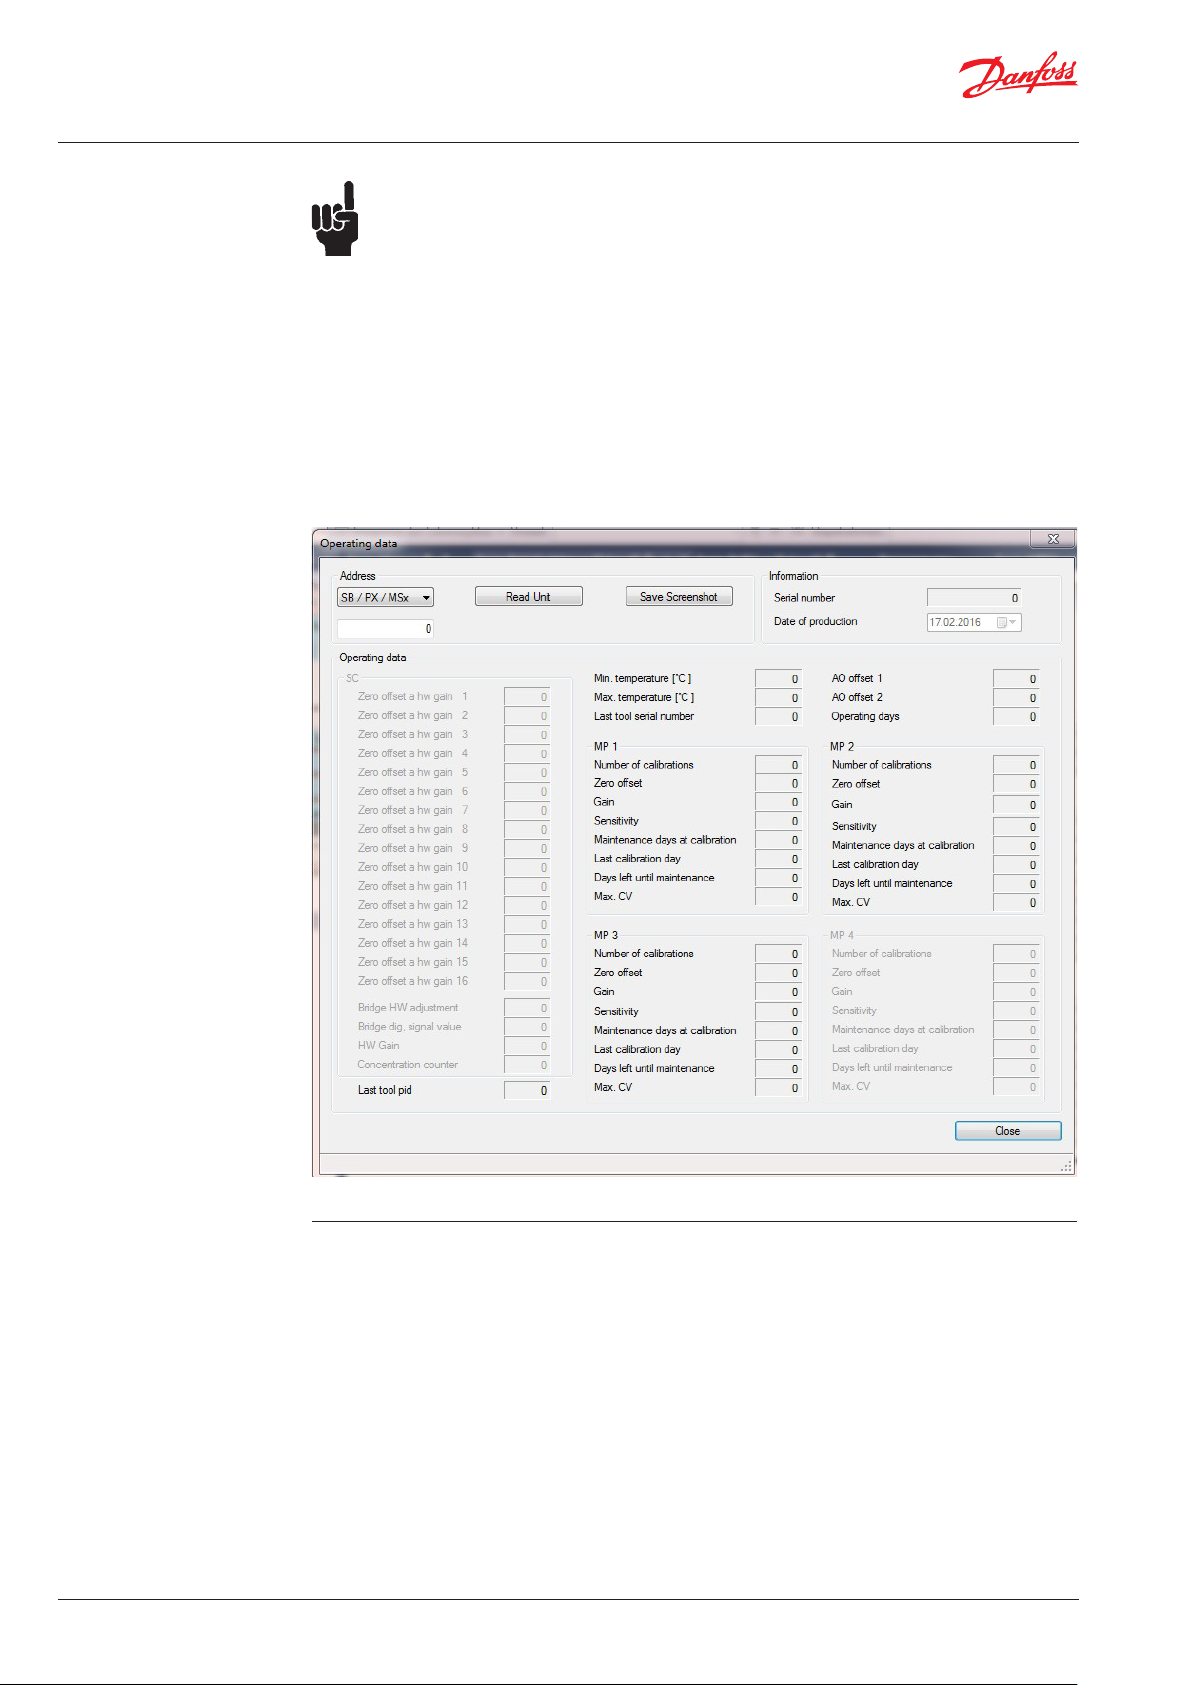
8
Operating data
Note:
The operating data can only be
exchanged with the device if the device
is in the special mode. Therefore, the
operating data buttons are only enabled
in the special mode.
At the top left of the dialog there is the address
activation area. It contains the following entry
options:
- Selection box Device Type: Device type the
operating data are read from.
- Selection box Address: Address the operating
data are read from.
Just as for the Parameters you can read out the
operating data across hierarchical levels.
- Read Unit and Write file. The function for
storing the file is not yet implemented.
The information area concerning the device is
located to the right of the address field.
- Serial number
- Date of production
Grey fields are not valid for the read-out device.
The large operating data area is divided into
several sections.
SC area
Here only the operating data of a head are
displayed.
• Concentration counter
MP x
Here the operating data are displayed based on
a measuring point.
• Number of calibrations
• Zero offset: current zero offset.
• Gain: current gain
• Sensitivity: compared to new condition
• Maintenance days at calibration
• Last calibration day: operating day at the last
calibration.
24 | DKRCI.PS.S00.C1.02 | 520H12961
• Days left until maintenance: Number of days
remaining until the next maintenance
• Max CV: Maximum current value
All other fields are displayed along with each
device:
• Last Tool PID: Marking of the tool the last
calibration was performed with.
• Min. temperature
• Max. temperature
• Last tool serial number
• AO offset x
• Operating days
The Close button closes the window.
© Danfoss | DCS (MWA) | 2018.06
Page 25
User Guide | Danfoss Gas Detection - PC tool
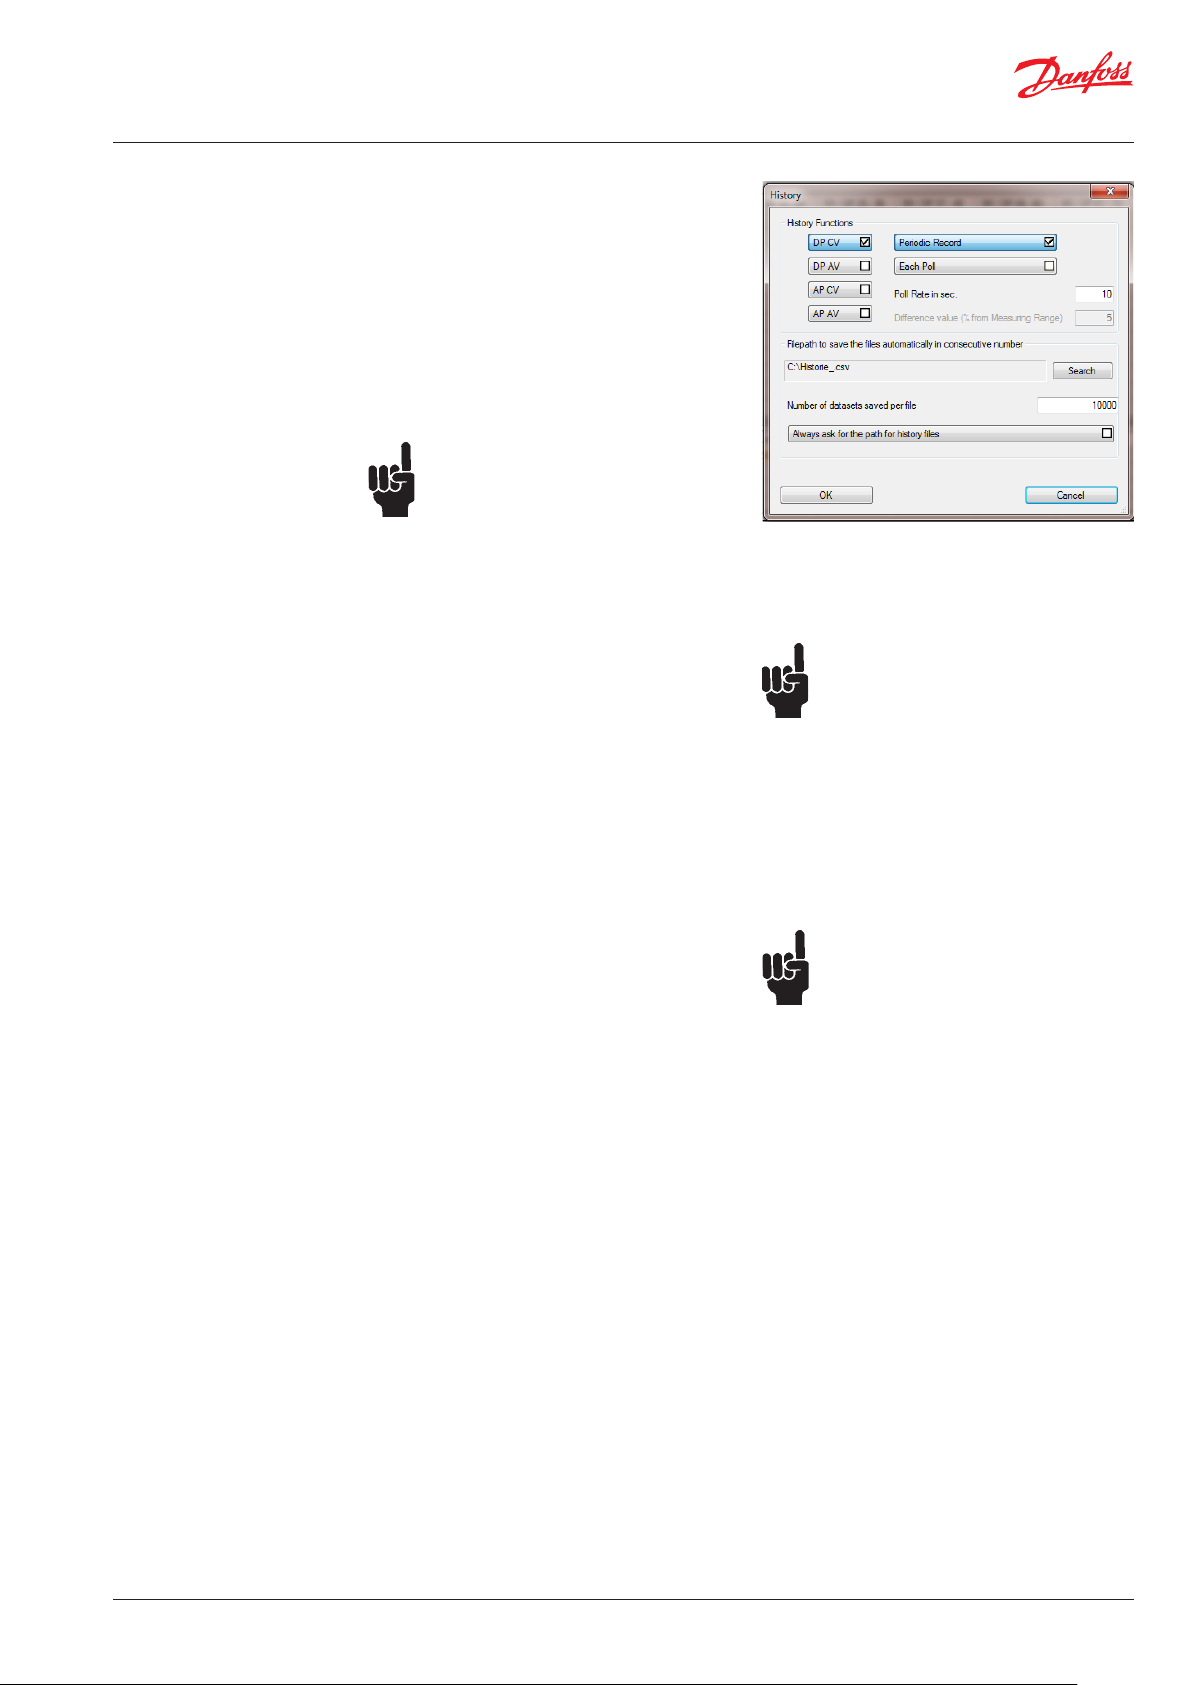
9
History of the data logger
Options:
In the upper half, you can manage all settings
for the measured value control of all measuring
points:
- If only the current value or the average value, or
both are monitored.
- If Periodic Record is active, monitoring is
continuously performed at certain time
intervals.
- If Each Poll is active, storage is performed with
each measurement cycle.
Note:
This setting is not recommended for
extended periods of time, since the data
transfer between the devices is very fast
and the PC cannot keep up the speed.
- Poll rate in sec. represents the time interval in
which the data are written. As the PC timer
is not synchronized with the timer of the
device, there may be minimal time delays when
recording.
- If Periodic Record is not active, the values are
written by the data logger only if the measured
value changes by the Difference value.
In the bottom half, the path is indicated where
the audit records are stored automatically.
Separate files for digital measurement points (DP)
and analog measurement points (AP) are started.
The corresponding files are marked by the
abbreviation DP or AP in the filename.
A consecutive number is automatically added
to the specified name of the file, so that the file
is not overwritten. If there are already files with
the same name in the specified directory, the
numbers will continue.
E.g.
- If the files 1, 2 and 3 are in the directory, the
PC tool software will start saving the
file with number 4.
- If the files 1, 3, and 6 are in the directory, the
file 2 will be written first, then 4, then 5, 7, 8,
9, etc., so that the gaps are filled! This has the
disadvantage that it will not be represented in
chronological order (e.g. with Excel Diagram).
Each automatically saved file contains as many
records as indicated in the field Number of
datasets saved per file.
If Always ask for the path of history files is
active, a file storing dialog will appear when
starting the history, in order to control the path
right from the start.
Note:
Each dataset is directly written into
the file. Therefore, the file must not be
opened during the ongoing operation of
history!
The user must have access rights for the
specified path, otherwise the file will not
be written.
The imported data are stored with the OK button.
This function of the PC tool allows you to
record and monitor the measured values of all
connected digital and analog measurement
points.
Note:
Missing or incorrect settings will have
a serious impact on the monitoring!
© Danfoss | DCS (MWA) | 2018.06
DKRCI.PS.S00.C1.02 | 520H12961 | 25
Page 26

User Guide | Danfoss Gas Detection - PC tool
9
History of the data logger
(Continued)
Start:
This menu item or button starts the history.
The following information appears at the very
bottom of the main window in the status bar.
- A green LED changing to red from time to time.
The green LED indicates that history is enabled.
If the LED changes to red, a record is just being
written into the file.
- Two numbers separated by a minus.
The first number represents the number of
records in the current file with digital measuring
points (DP).
The second number represents the number
of records in the current file with analog
measuring points (AP).
- The specified path where the files are stored.
Pause:
This menu item or button interrupts the
recording. It is useful if you want to view the file
in between. If you resume the recording with the
start button, the current file will continue to be
written.
Stop:
This menu item or button stops the recording.
A new file is started after restarting.
Attention:
If the LED flashes green-red, but the
numbers remain at 0, the software
tries to write the history files, but fails.
In this case, please check access rights
to the path or run the PC tool as an
administrator.
Attention:
If the file was opened, please pay
attention to closing the file before
restarting.
Structure of Files:
Regardless of whether only digital or only analog
measuring points or both are recorded, the files
are of an identical structure.
- The first column contains the date and time
with hours, minutes and seconds.
- The second column indicates the measurement
values as current and / or average values.
- From the third column on, the measured values
are displayed. 96 entries for digital measuring
points and 32 entries for the analog measured
values.
The measured values are displayed according
to the measuring range. If the system contains
mixed measurement points, the scaling of the
measured values may be different according to
the measuring range.
A minus instead of the measured value means
that the measurement points are not activated.
If there is an error at a measuring point, it is
shown in form of a hexadecimal error code.
E.g.: 0x8100 Underrange
26 | DKRCI.PS.S00.C1.02 | 520H12961
© Danfoss | DCS (MWA) | 2018.06
Page 27

User Guide | Danfoss Gas Detection - PC tool
10
Notes and general
information
It is important to read this user manual
thoroughly and clearly in order to understand
the information and instructions. The Danfoss
Gas Detection units must be used within product
specification capabilities. The appropriate
operating and maintenance instructions and
recommendations must be followed.
Due to on-going product development, Danfoss
reserves the right to change specifications
without notice. The information contained herein
is based upon data considered to be accurate.
However, no guarantee is expressed or implied
regarding the accuracy of this data.
Installers’ Responsibilities
It is the installer’s responsibility to ensure that
all Danfoss Gas Detection units are installed in
compliance with all national and local codes
and OSHA requirements. Installation should
be implemented only by technicians familiar
with proper installation techniques and with
codes, standards and proper safety procedures
for control installations and the latest edition of
the National Electrical Code (ANSI/NFPA70). It is
also essential to follow strictly all instructions as
provided in the installation guides.
Maintenance
It is recommended to check the Danfoss Gas
Detection units regularly. Due to regular
maintenance any performance deviations may
easily be corrected. Re-calibration and part
replacement in the field may be implemented by
a qualified technician and with the appropriate
tools.
© Danfoss | DCS (MWA) | 2018.06
DKRCI.PS.S00.C1.02 | 520H12961 | 27
Page 28

28 | DKRCI.PS.S00.C1.02 | 520H12961
© Danfoss | DCS (MWA) | 2018.06
 Loading...