

Page 1
Operating Guide
How to build software with the data log
Summary
Description
In software made using MCXDesign, it is possible to add a data log function. This function only works
with MCX061V and MCX152V.
The data is saved in internal memory or/and in SD card memory and can be read through a WEB
connection or by a PC using a decode program.
MCXDesign part
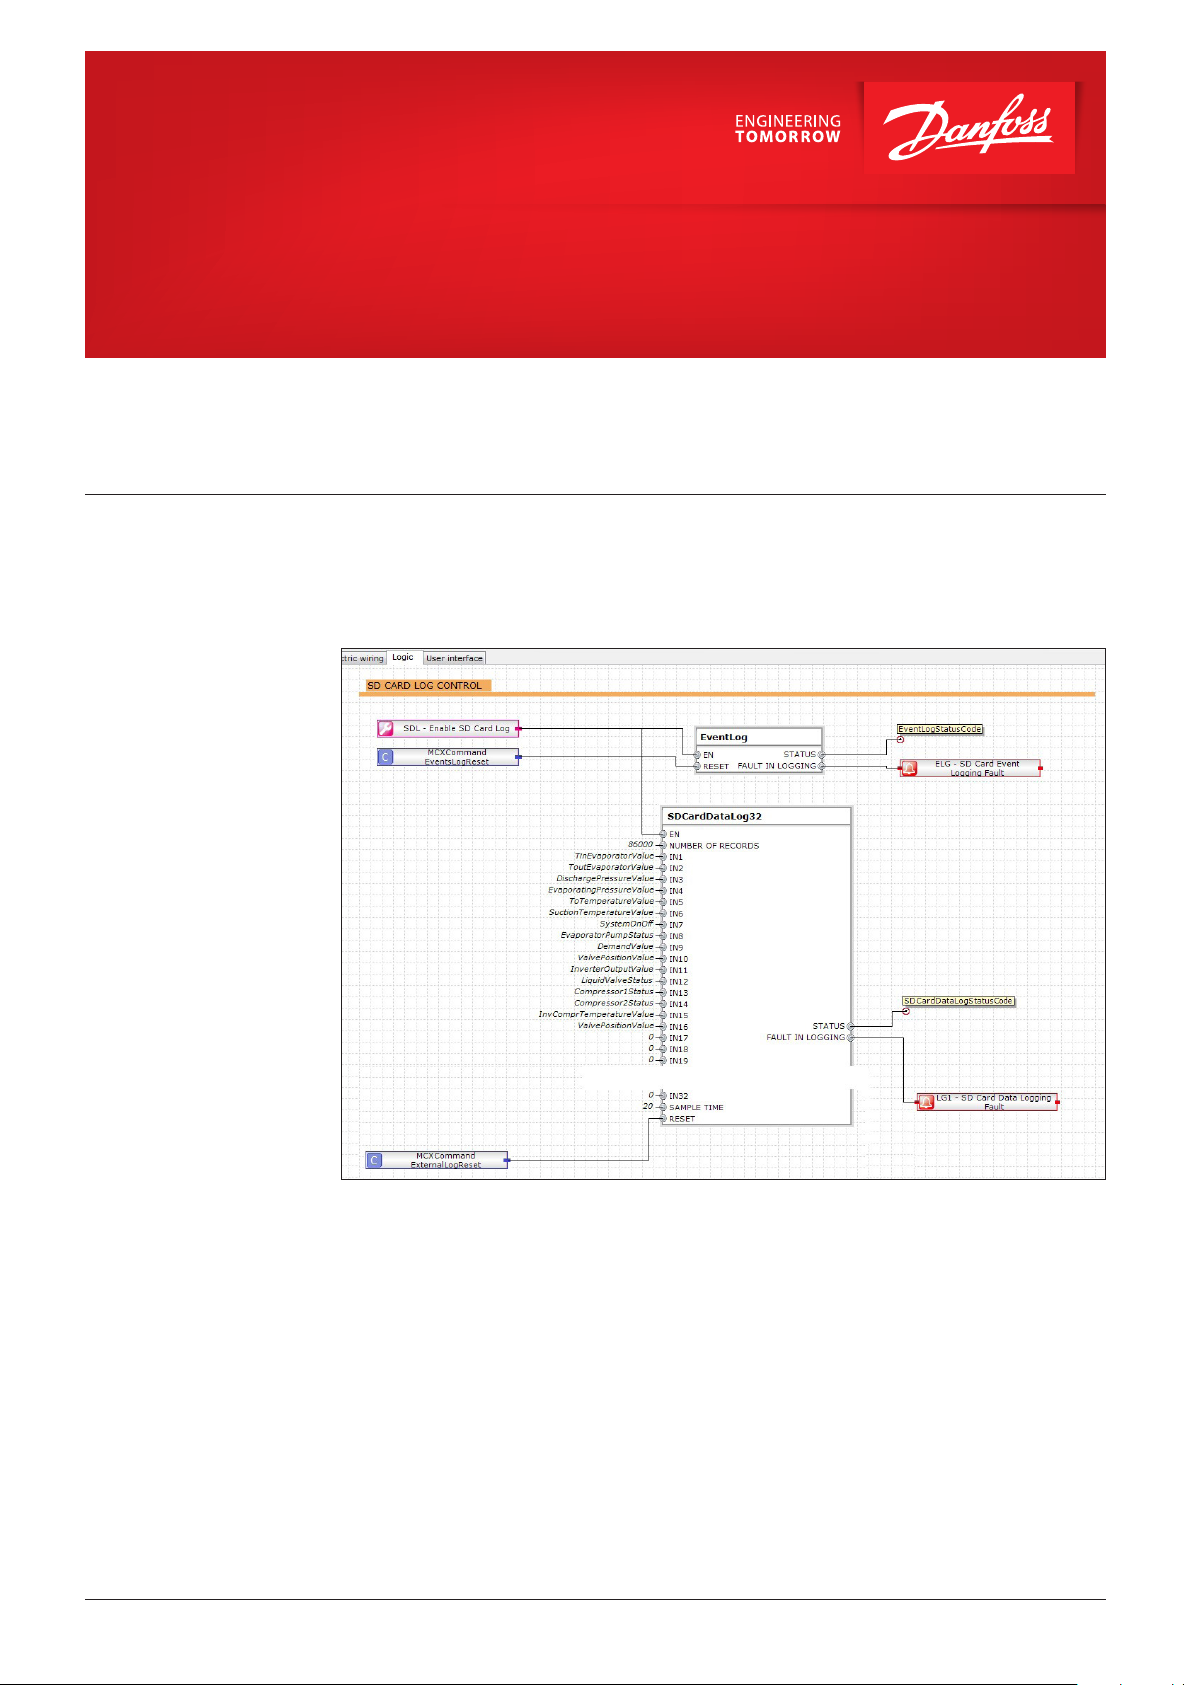
1. In the “LogLibrary” there are three bricks that enable the addition of data logging to software
made using MCXDesign: one brick is for events and the others enable the selection of variables and
of memory for storing the data.
2. Software with data logging looks like the image below:
Note: The data logging feature is only available in the MCX hardware (it cannot be simulated using the
software simulation).
3. The “EventLog” brick and “SDCardDataLog32” brick save the file to the SD memory, and the
Note: For additional information, please refer to the bricks’ help.
© Danfoss | Climate Solutions | 2021.11
“MemoryDataLog16” brick saves the file to MCX internal memory.
AQ397141290559en-000101 | 1
Page 2
Operating Guide | How to build software with the data log
Reading the file through the decode program
1. The files saved on the SD card can be read through a WEB connection or using a batch file.
However, the file saved on the internal memory can be read only through WEB.
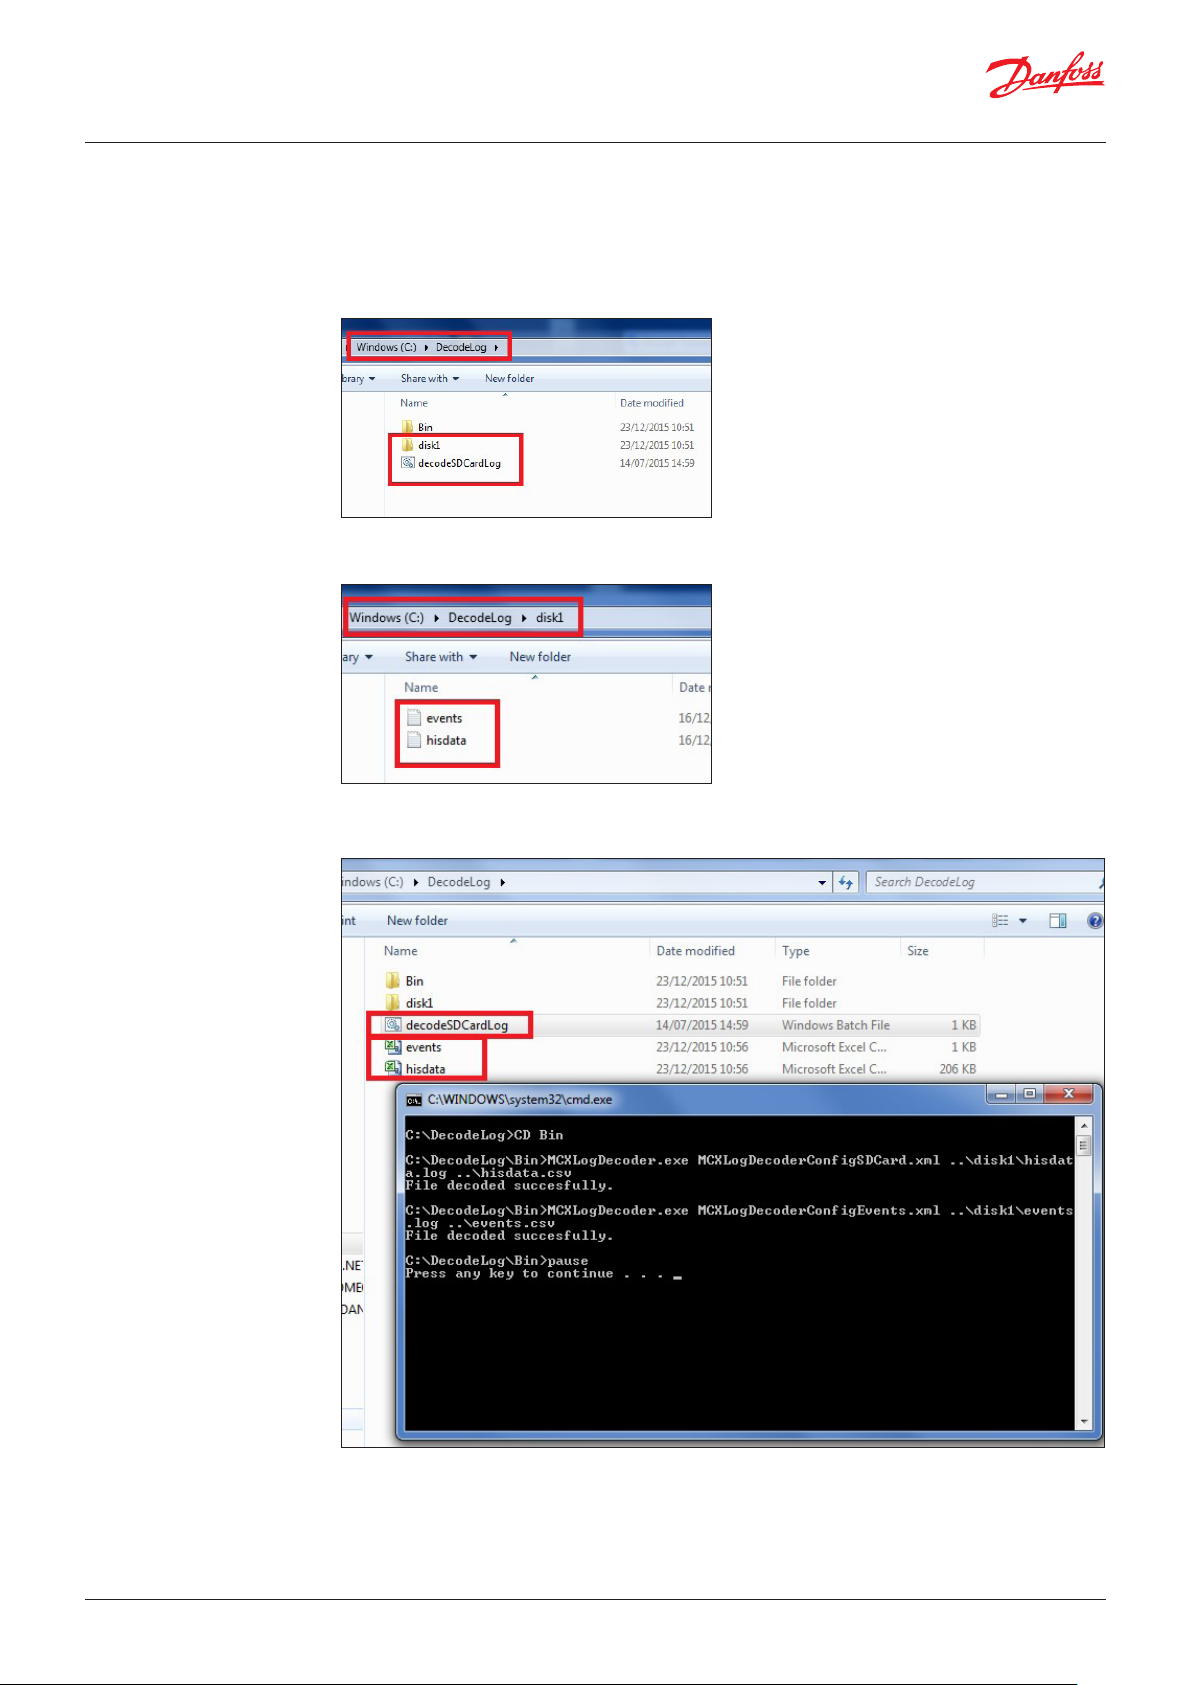
2. To read the files on the SD card using a decode program, download the “DecodeLog” folder
available on the MCX site and save it to the C disk:
3. Extract the memory card from the MCX and copy and paste the files to the SD card in the
“DecodeLog/Disck1” folder:
4. From the “DecodeLog” folder, run the batch file “decodeSDCardLog”. This will generate the .csv
files with encoded data:
2 | AQ397141290559en-000101
© Danfoss | Climate Solutions | 2021.11
Page 3

Operating Guide | How to build software with the data log
5. Events are recorded in the events.csv file. There are six columns:
a. Event time: the time of the event (start alm, stop alm, parameters change and RTC change)
b. EventNodeID: the ID of the MCX
c. EventType: a numerical description of the event type
• -2: Reset of MCX history alarm
• -3: RTC set
• -4: Start alarm
• -5: Stop alarm
• 1000: Parameters change (note: the change can be detected only when it is made through a
user interface)
d. Var1: a numerical description of the variable. To decrypt it, open the “AGFDefine.c” file in the
“App” folder of the MCXDesign software. In this file there are two sections with an ID indication:
one is for the parameters and the other is for the alarm. If the event type is 1000, refer to the
index parameters' list; if the event type is -4 or -5, refer to the index alarms' list. These lists
contain the variable names corresponding to each ID (not to the variable description – for the
variable description, refer to MCXShape).
© Danfoss | Climate Solutions | 2021.11
f. Var2: used to record the parameter value before and after the change. This number is a double
integer; in the high part there is the new parameter value and in the low part there is the old
value.
g. Var3: not used.
AQ397141290559en-000101 | 3
Page 4

Operating Guide | How to build software with the data log
6. Recorded in the hisdata.csv file are all the variables defined in MCXDesign in relation to the sample
time in the order defined in the brick:
Reading the file in WEB
1. To read these files in WEB, use the latest MCXWeb pages available at the MCX web site. In the
Configuration/History menu, set up the variables to monitor (max. 15).
2. In the Configuration/History menu you must define:
a. Node: not important.
b. Parameters: can be chosen only from the variables stored in the log file. This setting is used to
take information about the variable’s decimal point and unit of measure.
c. Colour: defines the line colour in the graph.
d. File: defines the file where the variable value is taken from.
e. Position: the position (column) of the variable in the file (see also point 9):
4 | AQ397141290559en-000101
© Danfoss | Climate Solutions | 2021.11
Page 5

3. From the history menu, data can be graphed and exported in a .csv file:
a. Choose the variable to graph.
b. Define “Data” and “Period”.
c. Draw.
d. Export to create a .csv file.
Note: The graph also has events (yellow flags); use the mouse to click a flag in order to get additional
information about the event.
© Danfoss | Climate Solutions | 2021.11
AQ397141290559en-000101 | 5
 Loading...