

Page 1
User Guide
DECS 2.0
English version
www.danfoss.com
Page 2

2 | © Danfoss | 2021.01 BC091586469017en-020402
Page 3

Thank you for buying a Danfoss product
Table of Contents
1.0 Introduction ................................................................................................................................................4
2.0 Menus ............................................................................................................................................................8
3.0 How to get an overview of your heating installation ...................................................................9
4.0 How to change the settings of your heating installation ........................................................ 11
5.0 How to view statistics for your heating installation ................................................................... 15
BC091586469017en-020402 © Danfoss | 2021.01 | 3
Page 4

1.0 Introduction
Operating the DECS 2.0 system
The Danfoss Energy Control System (DECS) is a web-based software program that enables the
user to remote control and monitor the parameter settings in the controllers and also monitor
actual, reference and historical values of sensors and meters connected to the controller.
This user guide is intended for private end users of district heating installations who want to
monitor their heat consumption and make changes to the controller parameters. It describes
the most common functions which a private end user will usually make use of. Please consult
the DECS 2.0 Operating Guide for a description of all available features.
The heating installation can be monitored and controlled from everywhere as DECS provides
an intuitive user interface that is accessible from a web browser on a PC, laptop or smartphone
connected to the internet.
To operate the DECS 2.0 system, open the web browser and enter the public IP address of the
DECS 2.0 server in the address field. The user interface will then be shown in the web browser.
If you need help re. the IP address, please contact your network administrator.
Alternatively, the district heating utility may have assigned a domain name to the DECS 2.0
server. In this case the domain name (URL) should be entered into the address field of the web
browser instead of the IP address.
Please use one of the following web browsers for full compatibility:
* Mozilla Firefox
* Internet Explorer
* Google Chrome
Web browser must comply with requirements of Atvise SCADA Client software.
For details about specific browser versions compatible with Atvise please visit
http://www.atvise.com/en/vendors/compatibilitylist
For information on supported versions, please contact your system integrator or provider.
4 | © Danfoss | 2021.01 BC091586469017en-020402
Page 5
1.0 Introduction
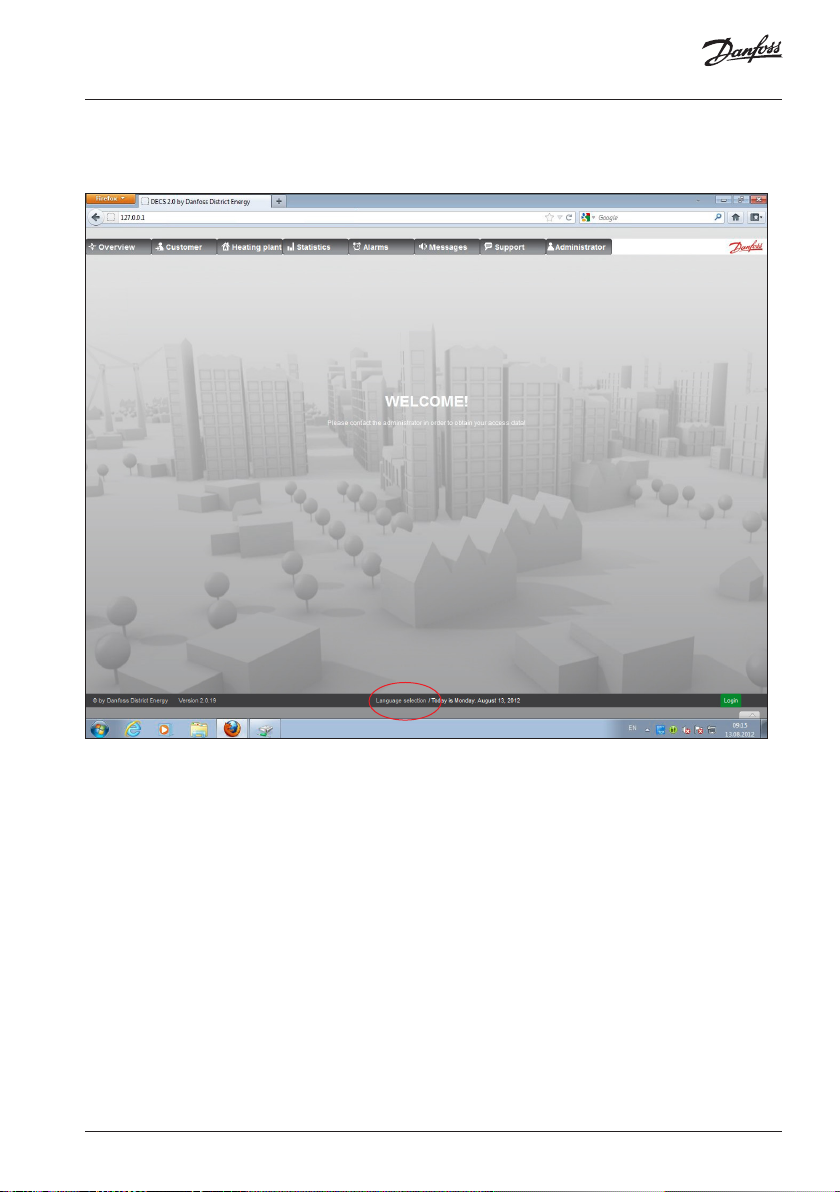
Language selection
All users have registered a default user language.
The language can though be changed simply by pressing the ‘Language selection’ button
next to the date (see indication on the picture). This selection will overwrite the originally set
default user language.
There are 3 languages available: English, German, and Italian.
The language can be changed at any time during operation, but any selections in tables, menus
etc. will be lost as the display will refresh when another language is selected.
Page 6
1.0 Introduction
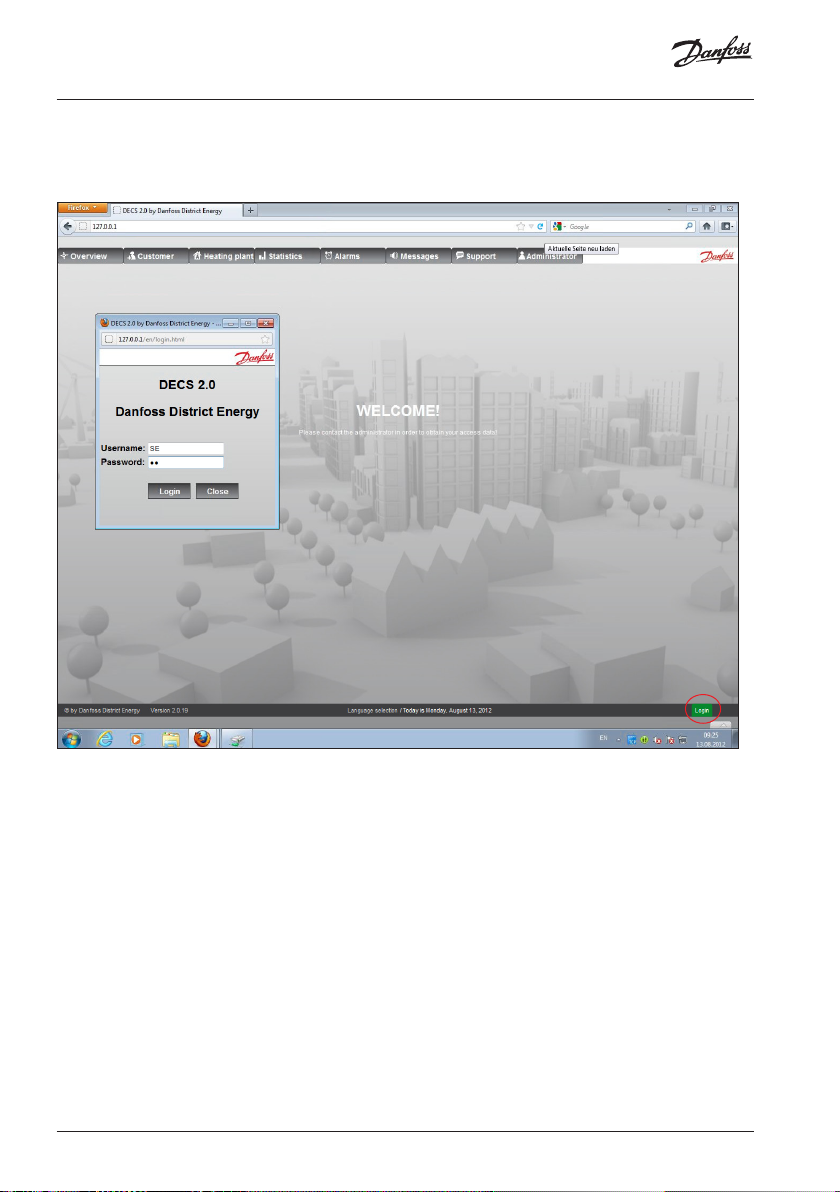
Login
You have to log in to your user account in DECS to access the monitoring and control features.
The district heating utility administrates the user accounts and will have to provide you with
a username and password.
Click the green ‘Login’ button in the lower right corner of the screen to login (see indication
on the picture).
When the login window appears on the screen, please enter your username and password and
click the ‘Login’ button.
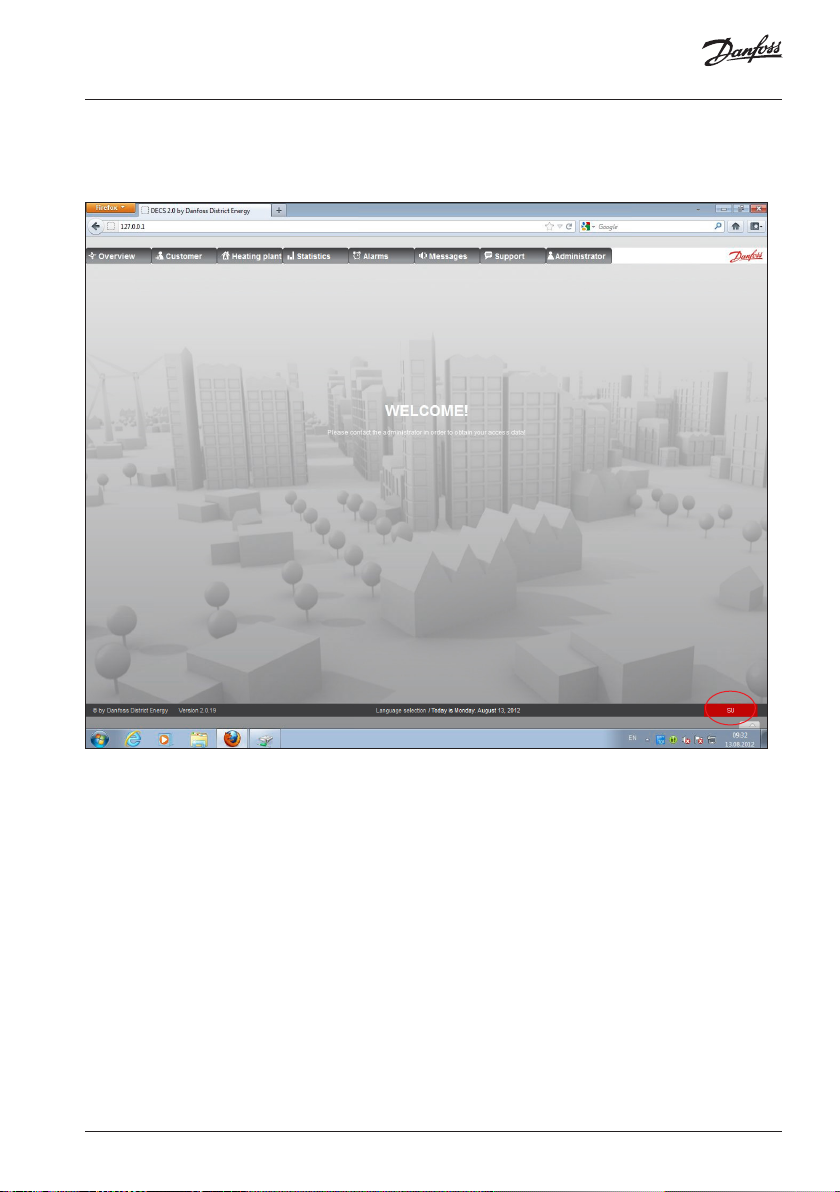
The green ‘Login’ button in the lower right corner of the screen now turns red to indicate that
you have successfully logged into your user account in DECS.
6 | © Danfoss | 2021.01 BC091586469017en-020402
Page 7
1.0 Introduction
Logout
After login the function of the login button changes to a logout function.
By pressing the button you will logout of the system and return to the main display.
If the web page for DECS 2.0 is closed, logout will also occur.
In addition, logout will occur after a set time of inactivity.
Page 8

2.0 Menus
All monitoring and control features of DECS 2.0 are made available via the top menu. The top
menu can have up to 8 sections, but the availability of the sections and also the availability of
features within each section may vary as it depends on the privileges assigned to your user
account by the district heating utility.
1. Overview: Quick overview of the district heating grid
2. Customer: Customer information and monitoring possibilities
3. Heating plant: To include heating plant displays, including the attached
available information
4. Statistics: Graphical and tabular statistics information
5. Alarm: For monitoring alarms coming from the district heating
controllers
6. Messages: For monitoring information related to the DECS 2.0 software
7. Support: Support related to the DECS 2.0 software, district heating
controllers, district heating grid
8. Administrator: Adding new places, heat meter read-out data selection,
user management of DECS 2.0, updating time stamp for the
district heating controllers. Software update for controllers
that support remote software update.
The following chapters describe the sections relevant to the private end users.
Please consult the DECS 2.0 Operating Guide for a description of all available features in all
sections.
8 | © Danfoss | 2021.01 BC091586469017en-020402
Page 9

3.0 How to get an overview of your heating installation
You are able to get an overview of your heating installation by clicking the ‘Customer’ section
in the top menu (see indication on the picture).
As a private end user you will only be able to see your own heating installation in the list of
customers.
Your customer information will be shown in the ‘Customer Display’ section (see indication on
the picture).
Click the ‘Controller – Overview’ button to continue (see indication on the picture).
Page 10

3.0 How to get an overview of your heating installation
When clicking the ‘Controller - overview’ button, an overview of the installation for this specific
customer is shown.
The available information on the overview picture might differ from the example shown
depending on the installed district heating controller and on which application the controller
is running.
You are always able to see the flow diagram for your heating installation and you will typically
also be able to see the operation mode of each available heating circuit, flow temperatures,
outside temperature and status of pumps.
10 | © Danfoss | 2021.01 BC091586469017en-020402
Page 11

4.0 How to change the settings of your heating installation
You are able to change some of the settings of your heating installation via DECS. As a private
end user you will typically not have access to all settings as some settings need to be managed
by the district heating utility operator.
Click the ‘Customer’ section in the top menu (see indication on the picture).
As a private end user you will only be able to see your own heating installation in the list of
customers.
Your customer information will be shown in the ‘Customer Display’ section (see indication on
the picture).
Click the ‘Controller – Settings’ button to continue (see indication on the picture).
Page 12

4.0 How to change the settings of your heating installation
When clicking the ‘Controller – Settings’ button, an overview of the settings for this specific
customer’s heating installation is shown.
The available settings on the overview picture might differ from the example shown depending
on the installed district heating controller, on which application the controller is running and
on the privileges assigned to your user account.
The controller settings are divided into 3 sections:
1. Setup
2. Time
3. Administration
12 | © Danfoss | 2021.01 BC091586469017en-020402
Page 13

4.0 How to change the settings of your heating installation
1.
Configuration target values
Here the ‘configuration target values’ of the selected controller are visualized.
A group of settings can be selected in the dropdown menus for each heating circuit
(see indication on the picture). In this way you can customize the view of the settings
to your preferences.
To change the settings please click on the ‘Change’ button (see indication on the
picture).
The available settings might differ from the example shown depending on the installed
district heating controller, on which application the controller is running and on the
privileges assigned to your user account.
Page 14

4.0 How to change the settings of your heating installation
2.
Heating time tables
In this section you can determine the heating times for each available heating circuit.
To change the heating time table please click on the ‘Change’ button (see indication on
the picture).
In the same way you are able to view and change the time tables for the boiler and
circulation pump by clicking the ‘Heating time table, boiler’ and ‘Heating time table,
circulation pump’ in the ‘Controller – Settings’ screen.
By clicking the ‘Holiday – circulation – boiler load time’ button in the ‘Controller –
Settings’ screen you can determine the time for the controller to go into holiday mode
and whether the controller automatically shall switch between winter and summer
time.
You can also select the language of the controller, boiler charging time, duration of water
circulation including the time duration and which days to start the water circulation.
The available time tables might differ from the example shown depending on the
installed district heating controller, on which application the controller is running and
on the privileges assigned to your user account.
14 | © Danfoss | 2021.01 BC091586469017en-020402
Page 15

5.0 How to view statistics for your heating installation
The statistics section provides a set of features to display historical values of all sensors and
heat meters connected to the heating installation. The values can be shown in both graphical
and tabular form.
Click the ‘Statistics’ section in the top menu (see indication on the picture).
As a private end user you will only be able to find and select your own heating installation in
the list of customers.
You will find your heating installation by selecting your ‘Place’ and then select the customer in
the list by double-clicking on it (see indication on the picture).
Your customer information will now be shown in the ‘Customer Display’ section (see indication
on the picture). This is the general procedure for selecting the customer to be monitored and
controlled.
The statistics can now be viewed in two different ways depending on which button is clicked
(see indication on the picture):
1. Evaluation (graphic)
2. Evaluation (tabular)
Page 16

5.0 How to view statistics for your heating installation
1.
Evaluation (graphic)
You can do a graphical evaluation of all values from the sensors and heat meters by
specifying the time period, the sensors and heat meters to be evaluated.
The time period is specified with a start and end date/time (see indication on the
picture).
The available sensors for temperature, flow, pressure etc. are shown in a list and you
may select one or more of these sensors to be shown graphically (see indication on the
picture).
If heat consumption needs to be evaluated as well, then select one or more of the
available heat meters in the list (see indication on the picture).
Finally, click the ’Adjust graphics’ button to create the graphs.
The graphs can be printed by clicking the ‘Print’ button.
16 | © Danfoss | 2021.01 BC091586469017en-020402
Page 17

5.0 How to view statistics for your heating installation
2.
Evaluation (tabular)
By using the tabular evaluation function you will have the values from the sensors and
heat meters displayed in a tabular form for the specified period of time.
The time period is specified with a start and end date/time (see indication on the
picture).
The available sensors for temperature, flow, pressure etc. are shown in a list and you
may select one or more of these sensors to be evaluated in the table (see indication on
the picture).
Click the ‘Table’ button to view the table of sensor values (see indication on the picture).
If heat consumption needs to be evaluated as well, then select one or more of the
available heat meters in the list (see indication on the picture).
Then click the ’Heat meter table’ button to create the table of heat meter values (see
picture on the next page).
When the graphs or tables are shown on the screen they can be printed by clicking the
‘Print’ button.
Page 18

5.0 How to view statistics for your heating installation
2.
Evaluation (tabular) - Table heat meter
18 | © Danfoss | 2021.01 BC091586469017en-020402
Page 19

Disposal note
This symbol on the product indicates that it may not be disposed of as
household waste.
It must be handed over to the applicable take-back scheme for the
recycling of electrical and electronic equipment.
• Dispose of the product through channels provided for this purpose.
• Comply with all local and currently applicable laws and regulations.
Page 20

Additional documentation for the DECS 2.0
Danfoss Energy Control system is available on
www.heating.danfoss.com
*087H9111*
20 | © Danfoss | DHS-SMDT/DK | 2021.01
BC091586469017en-020402
 Loading...