

Page 1

Urika®-GX System Administration Guide
(2.2.UP00)
S-3016
Page 2

Contents
Contents
1 About the Urika®-GX System Administration Guide............................................................................................... 7
2 The Urika-GX System.............................................................................................................................................9
2.1 Administrative Components of Urika-GX...................................................................................................9
2.2 Network Components.............................................................................................................................. 10
2.3 File Systems............................................................................................................................................ 11
2.4 System Nodes......................................................................................................................................... 12
2.5 Restrictions on Use................................................................................................................................. 12
3 System Management............................................................................................................................................15
3.1 Check the Current Service Mode............................................................................................................ 15
3.2 Urika-GX Component Naming Conventions............................................................................................15
3.3 System Management Workstation (SMW)...............................................................................................17
3.3.1 Power On the System Management Workstation (SMW).......................................................... 17
3.3.2 About the Integrated Dell Remote Access Controller (iDRAC).................................................. 17
3.3.3 Control System Management Workstation (SMW) Power with the iDRAC8 Web Console........17
3.3.4 Synchronize the System Management Workstation (SMW) to the Site NTP Server..................20
3.3.5 Synchronize Time of Day on System Nodes..............................................................................21
3.3.6 Reboot a Stopped System Management Workstation (SMW)................................................... 22
3.4 Hardware Supervisory System (HSS)..................................................................................................... 22
3.4.1 Hardware Supervisory System (HSS) Architecture Overview....................................................24
3.4.2 The xtdiscover Command.......................................................................................................... 25
3.4.3 Hardware Supervisory System (HSS) Component Location Discovery..................................... 25
3.4.4 Hardware Supervisory System (HSS) Daemons........................................................................26
3.4.5 Hardware Supervisory System (HSS) Administration and Diagnostic Commands
Supported on Urika-GX.............................................................................................................27
3.4.6 Hardware Supervisory System (HSS) Environments................................................................. 30
3.4.7 High Speed Network (HSN) Management................................................................................. 32
3.4.8 Create Direct Connection between the System Management Workstation (SMW) and a
Compute Node Console............................................................................................................32
3.4.9 Disable Hardware Components................................................................................................. 33
3.4.10 Enable Hardware Components................................................................................................ 33
3.4.11 Set Hardware Components to EMPTY...................................................................................... 34
3.4.12 Stop Components Using the Hardware Supervisory System (HSS)........................................ 34
3.4.13 Unlock Hardware Components................................................................................................ 35
3.4.14 Capture and Analyze System-level and Node-level Dumps.....................................................35
3.4.15 Collect Debug Information From Hung Nodes Using the xtnmi Command.............................. 36
S3016 2
Page 3

Contents
3.4.16 Find Node Information..............................................................................................................36
3.4.17 Request and Display System Routing......................................................................................37
3.4.18 Initiate a Network Discovery Process.......................................................................................38
3.4.19 Power Up a Rack or Dual Aries Network Card (dANC)............................................................38
3.4.20 Check the Status of System Components................................................................................38
3.4.21 Check Compute Node High Speed Network (HSN) Connection..............................................39
3.4.22 Monitor the Health of PCIe Channels.......................................................................................39
3.4.23 Poll a Response from an HSS Daemon, Manager, or the Event Router..................................39
3.4.24 View Component Alert, Warning, and Location History............................................................40
3.4.25 Display Alerts and Warnings.................................................................................................... 40
3.4.26 Display Error Codes................................................................................................................. 40
3.4.27 Display Component State Information......................................................................................41
3.4.28 Clear Component Flags........................................................................................................... 41
3.4.29 Flash Management on Urika-GX..............................................................................................41
3.4.30 Create and Modify the authorized_keys File Using the xtcc-ssh-keys Command....... 42
3.4.31 Change the Passwords of RC, dANCCs and iSCB using the xtccpasswd Command.......... 42
3.4.32 Gather Troubleshooting Information Using the xtdumpsys Command.....................................43
3.5 Dual Aries Network Card (dANC) Management...................................................................................... 43
3.6 Analyze Node Memory Dump Using the kdump and crash Utilities on a Node.....................................44
3.7 Cray Lightweight Log Management (LLM) System................................................................................. 45
3.8 Urika-GX Node Power Management....................................................................................................... 45
3.9 Power Up the Urika-GX System.............................................................................................................. 46
3.10 Power Down the Urika-GX System....................................................................................................... 49
3.11 Urika-GX CLI Commands for Managing Services................................................................................. 51
3.12 Remote HDFS Remote Access and Multihoming on Urika-GX.............................................................54
3.13 Update the InfluxDB Data Retention Policy...........................................................................................54
3.14 Service to Node Mapping...................................................................................................................... 55
3.15 Image Management with Docker and Kubernetes................................................................................ 59
3.15.1 Execute Spark Jobs on Kubernetes......................................................................................... 60
3.15.2 Multi-tenant Spark Thrift Server on Urika-GX...........................................................................62
4 System Monitoring................................................................................................................................................ 65
4.1 System Monitoring Tools......................................................................................................................... 65
4.2 Monitor Resource Utilization and Node Status Using Nagios................................................................. 66
4.2.1 Configure SSL/TLS for Nagios Core.......................................................................................... 67
4.2.2 Configure the Nagios Server to Send Email Notifications.......................................................... 70
4.2.3 Change the Default Log File Path and Rotation Interval............................................................ 73
4.2.4 Configure Email Alerts................................................................................................................74
4.2.5 Modify Nagios Plug-in Threshold............................................................................................... 75
S3016 3
Page 4

Contents
4.3 Get Started with Using Grafana...............................................................................................................77
4.4 Default Grafana Dashboards...................................................................................................................79
4.5 Update InfluxDB Security Settings.......................................................................................................... 90
4.6 Update the InfluxDB Data Retention Policy.............................................................................................91
4.7 Configuration Settings of Grafana........................................................................................................... 93
4.8 Change the Default Timezone Displayed on Grafana............................................................................. 93
4.9 Create a New Grafana Dashboard.......................................................................................................... 95
4.10 Add a New Graph to the Grafana Dashboard....................................................................................... 97
4.11 Start InfluxDB Before Hadoop Services.............................................................................................. 100
4.12 Monitor Subrack Attributes.................................................................................................................. 101
4.13 Analyze Node Memory Dump Using the kdump and crash Utilities on a Node.................................102
4.14 Retrieve System Status Information Using the urika-check-platform Command.................................103
4.15 iSCB Description................................................................................................................................. 104
4.15.1 Log on to the iSCB................................................................................................................. 104
4.15.2 iSCB Command Reference.................................................................................................... 105
5 Resource Management...................................................................................................................................... 124
5.1 Manage Resources on Urika-GX...........................................................................................................124
5.2 Use Apache Mesos on Urika-GX ..........................................................................................................126
5.2.1 Access the Apache Mesos Web UI.......................................................................................... 128
5.3 Use mrun to Retrieve Information About Marathon and Mesos Frameworks........................................129
5.4 Launch an HPC Job Using mrun........................................................................................................... 133
5.5 Manage Long Running Services Using Marathon................................................................................. 133
5.6 Manage the Spark Thrift Server as a Non-Admin User......................................................................... 136
5.7 Manage Jobs Using the Cray Application Management UI................................................................... 137
5.7.1 Overview of the Cray Application Management UI...................................................................138
6 Cray DVS............................................................................................................................................................140
6.1 Introduction to DVS............................................................................................................................... 140
6.1.1 Use Cray DVS on Urika-GX..................................................................................................... 141
6.1.2 DVS ioctl Interfaces..................................................................................................................141
6.1.3 DVS Client Mount Point Options.............................................................................................. 143
6.1.4 DVS Environment Variables..................................................................................................... 149
6.1.5 Modes.......................................................................................................................................150
6.1.6 Resiliency and Diagnostics...................................................................................................... 154
6.1.7 Caveats.................................................................................................................................... 157
6.1.8 Administrative Tasks.................................................................................................................158
7 Security...............................................................................................................................................................175
7.1 Authentication and Authorization...........................................................................................................175
7.2 Urika-GX Service Modes....................................................................................................................... 177
S3016 4
Page 5

Contents
7.2.1 Modify the Service Mode..........................................................................................................180
7.2.2 User Interface Access in the Secure Service Mode................................................................. 181
7.3 Security Architecture Overview............................................................................................................. 181
7.4 Set up Passwordless SSH.....................................................................................................................182
7.5 Tenancy................................................................................................................................................. 183
7.5.1 Configure a Bridge Port............................................................................................................185
7.5.2 Tenant Management.................................................................................................................189
7.5.3 Tenant Virtual Machine States..................................................................................................195
7.5.4 Tenant Management CLI Commands.......................................................................................196
7.5.5 Execution of Lustre Sub-Commands Inside Tenant VMs......................................................... 198
7.5.6 Get Started with Tenant Management......................................................................................199
7.5.7 Multi-Tenancy........................................................................................................................... 202
7.5.8 Multi-tenant HDFS....................................................................................................................203
7.6 Authorized User Management...............................................................................................................205
7.7 Guidance on LDAP Forwarding.............................................................................................................208
7.8 Authentication Mechanisms...................................................................................................................216
7.9 Change Default Passwords................................................................................................................... 217
7.9.1 Default Urika-GX System Accounts......................................................................................... 219
7.9.2 Change the Default Nagios Password..................................................................................... 220
7.9.3 Change the Default iDRAC8 Password....................................................................................221
7.9.4 Change the Default System Management Workstation (SMW) Passwords.............................223
7.9.5 Change LDAP Password on Urika-GX.....................................................................................224
7.9.6 Reset a Forgotten Password for the Cray Application Management UI...................................224
7.9.7 Reset an Administrator LDAP Password on Systems Using Urika-GX 1.2UP01 and Earlier
Releases................................................................................................................................. 225
7.9.8 Reset an Administrator LDAP Password when the OLC Schema Password is Unknown....... 226
7.9.9 Reset an Administrator LDAP Password when the OLC Scheme Password is Known........... 228
7.10 Tableau Authorization and Authentication Mechanisms...................................................................... 229
7.11 Enable SSL..........................................................................................................................................229
7.12 Enable SSL for Spark Thrift Server of a Tenant.................................................................................. 234
7.13 Install a Trusted SSL Certificate on Urika-GX..................................................................................... 235
7.14 Enable LDAP Authentication on Urika-GX ......................................................................................... 236
7.14.1 Enable LDAP for Connecting Tableau to HiveServer2........................................................... 238
7.15 Enable SQL Standard based Authorization for HiveServer2...............................................................239
7.16 File System Permissions..................................................................................................................... 240
7.17 Urika-GX Security Quick Reference Information................................................................................. 240
7.18 Port Assignments................................................................................................................................ 241
8 Troubleshooting.................................................................................................................................................. 245
S3016 5
Page 6

Contents
8.1 System Management Log File Locations.............................................................................................. 245
8.2 Default Log Settings.............................................................................................................................. 246
8.3 Analytic Applications Log File Locations............................................................................................... 248
8.4 Security Related Troubleshooting Information.......................................................................................250
8.4.1 Save and Restore Tenant Information......................................................................................254
8.4.2 LDAP Server Start-up Issues................................................................................................... 256
8.5 Modify the Secret of a Mesos Framework............................................................................................. 256
8.6 Clean Up Log Data................................................................................................................................ 257
8.7 Diagnose and Troubleshoot Orphaned Mesos Tasks............................................................................258
8.8 Troubleshoot Common Analytic and System Management Issues ...................................................... 259
8.9 Troubleshoot mrun Issues.....................................................................................................................268
8.10 Troubleshoot: Application Hangs as a Result of NFS File Locking..................................................... 270
8.11 Troubleshoot: DVS does not Start after Data Store Move...................................................................270
8.12 Troubleshoot: DVS Ignores User Environment Variables....................................................................271
8.13 Clear Leftover hugetlbf Files................................................................................................................271
8.14 Remove Temporary Spark Files from SSDs........................................................................................271
S3016 6
Page 7

About the Urika
®
-GX System Administration Guide
1
This publication contains administrative information about using the Cray® Urika®-GX system.
About the Urika®-GX System Administration Guide
Typographic Conventions
Monospace
Monospaced Bold
Oblique or Italics Indicates user-supplied values in commands or syntax definitions.
Proportional Bold Indicates a graphical user interface window or element.
\ (backslash) At the end of a command line, indicates the Linux® shell line continuation character
Indicates program code, reserved words, library functions, command-line prompts,
screen output, file/path names, key strokes (e.g., Enter and Alt-Ctrl-F), and
other software constructs.
Indicates commands that must be entered on a command line or in response to an
interactive prompt.
(lines joined by a backslash are parsed as a single line). Do not type anything after
the backslash or the continuation feature will not work correctly.
Scope and Audience
The audience of this publication is system administrators of the Urika®-GX system. This publication is not
intended to provide detailed information about open source products used in the system. References to online
documentation are included where applicable.
Record of Revision
Date Addressed Release
September, 2018
May, 2018
December, 2017
April, 2017
December, 2016
August, 2016
March, 2016
2.2UP00
2.1UP00
2.0UP00
1.2UP00
1.1UP00
1.0UP00
0.5UP00
Record of Revision
This revision includes updates to Tableau related topics.
S3016 7
Page 8

About the Urika®-GX System Administration Guide
Trademarks
The following are trademarks of Cray Inc. and are registered in the United States and other countries: CRAY and
design, SONEXION, Urika-GX, Urika-XA, Urika-GD, and YARCDATA. The following are trademarks of Cray Inc.:
APPRENTICE2, CHAPEL, CLUSTER CONNECT, CRAYDOC, CRAYPAT, CRAYPORT, DATAWARP, ECOPHLEX,
LIBSCI, NODEKARE. The following system family marks, and associated model number marks, are trademarks
of Cray Inc.: CS, CX, XC, XE, XK, XMT, and XT. The registered trademark LINUX is used pursuant to a
sublicense from LMI, the exclusive licensee of Linus Torvalds, owner of the mark on a worldwide basis. Other
trademarks used in this document are the property of their respective owners.
S3016 8
Page 9

The Urika-GX System
2
The Urika-GX system is a big data analytics platform optimized for analytic workflows. It combines a highly
advanced hardware platform with a comprehensive analytic software stack to help derive optimal business value
from data. The Urika-GX platform provides the tools required for capturing and organizing a wide variety of data
types from different sources and enables analyzing big data and discovering hidden relationships.
The Urika-GX system also features a number of workload management tools as well as an optimized system
administration tool for performing monitoring and management tasks.
For a list of features of the Urika-GX system, see S-3017, "Urika®-GX System Overview".
2.1
Urika-GX platforms have been developed by tightly integrating commodity hardware components, open-source
software, and Cray proprietary hardware, to provide users a high performance, scalable and open compute
platform.
Major administrative components of Urika-GX include:
● System Management Workstation (SMW) - The SMW is a server that acts as a single-point interface to a
The Urika-GX System
Administrative Components of Urika-GX
system administrator's environment. It provides an interface for performing administrative and monitoring
capabilities.
○ Hardware Supervisory System (HSS) - HSS is an integrated system of hardware and software
components that are used for managing and monitoring the system.
○ Cobbler - Cobbler is used on Urika-GX for provisioning and deployment.
● Rack Controller (RC) - The RC monitors the environmental sensors within the rack and manages
communication between the SMW and other physical system components, including the rack, sub-rack and
dANC (Dual Aries Network Card).
● Intelligent Subrack Control Board (iSCB) - The iSCB status command can be used to monitor the physical
attributes of the sub-rack, such as the power supply, amperage, fan status, and temperature.
● Aries Network Card Controller (ANCC) - Each sub-rack chassis of the Urika-GX system contains two
dANCs (dual Aries Network Cards). Each dANC contains 2 Aries chips, an Advanced RISC Machines (ARM)
processor, and a number of environmental sensors to help monitor the system.
● Integrated Dell Remote Access Controller (iDRAC) - The iDRAC is a hardware that provides advanced
agentless system management functionality for the SMW. It operates independently of the SMW's CPU and
operating system. The version of iDRAC used on the Urika-GX system is iDRAC8.
● System Monitoring and Performance Analysis Tools - Urika-GX ships with Grafana and Nagios. These
tools enable monitoring system resources and viewing performance statistics of various system components.
For more information, see S-3015, "Urika®-GX Analytic Applications Guide".
S3016 9
Page 10

The Urika-GX System
● Data Analytic Components - Urika-GX features a number of data analytic tools that help perform analytic
tasks, including managing and monitoring clusters, executing Hadoop and SPARK jobs, performing graph
analytics, etc. For more information, see S-3015, "Urika®-GX Analytic Applications Guide" and S-3010,
"Cray™ Graph Engine User Guide".
● Security and Tenant Management Tools - Secret files used on the system are managed by the Urika-GX
Secret Manager. Tenancy is implemented through the use of a tenant VM that runs on physical nodes and
provides controlled access to services on the physical nodes through a command proxy mechanism. For
more information, refer to Urika-GX Service Modes on page 177 and Tenancy on page 183.
NOTE: Only Spark and HDFS commands can be executed within a tenant VM in this release. All the
commands for flexing the cluster, mrun and Cray Graph Engine (CGE) CLI commands cannot be
executed within a tenant VM.
In addition, Urika-GX features a number of CLI scripts that facilitate system management and monitoring the
system.
2.2 Network Components
There are 3 networks deployed on the Urika®-GX platform:
● Aries High Speed Network (HSN) - The Aries HSN provides high speed application and data network
connectivity between nodes. This network provides node interconnect via high bandwidth, low latency DMA
access. The hardware to support this network consists of an Aries Interface Board (AIB) connected to an
available PCIe slot on each Urika-GX node and integrated into the node chassis assembly. The AIB is
connected to the dANC integrated in the Urika-GX sub-rack. Copper cables provide an all-to-all connection of
all dANCs in the system.
● Operational Ethernet network- The operational Ethernet network is used for ingesting user data. This
network is comprised of a single unit 48-port GigE switch that provides dual 1GigE and/or dual 10GigE
interfaces to the site network. Urika-GX's login nodes do not route through this switch and need to be directly
connected to the site network. The operational network allows node connectivity externally from Urika-GX to
the site network. The Urika-GX compute and I/O nodes are connected to a single managed Brocade ICX
6450-48, 48 port switch with a single power supply. Connectivity of this network to the site network is made
possible by two available Gigabit Ethernet ports and/or two 10 Gigabit Ethernet ports on the ICX 6450-48
switch.
The operational network can also be used to access data streaming applications and services directly from
compute nodes.
● Management Ethernet network - The management Ethernet network is primarily used for system
management, and not for user data. The management Ethernet network is comprised of two stacked 1U 48port switches, which are located at the top of the Urika-GX rack, and can optionally contain redundant switch
power supplies. These switches provide GigE management Ethernet connectivity to every node, System
Management Workstation (SMW), Rack Controller (RC), Intelligent Subrack Control Board (iSCB), Power
Distribution Units (PDUs), Dual Aries Network Cards (dANCs) and to the operational network that connects to
the nodes.
The Urika-GX system also contains the following subnets:
○ SMW subnet, which provides connectivity to the SMW and the RC.
○ Rack subnet, which provides connectivity to the dANCs and iSCB module.
This network is supported by two managed Brocade ICX 6450-48, 48 port switches stacked together with two
10gigE optical interconnects. Each switch contains a single power supply, and can optionally contain
S3016 10
Page 11

The Urika-GX System
redundant switch power supplies. The following VLANs are defined for this network to support management
network traffic:
○ VLAN 102 - Uses ports 1-5 on each ICX 6450-48 switch. This is a dual-mode (tagged dual-mode for
VLAN 102 and tagged for VLAN 103) VLAN. Untagged traffic on these ports belongs to VLAN 102. Traffic
can be tagged for VLAN 103. The SMW HSS interface, the RC for a given rack, and the PDUs for a given
rack are connected to these ports.
○ VLAN 103 Ports 6-12 on each ICX 6450-48 switch. Untagged traffic on these ports belongs to VLAN 103.
The iSCBs and dANC cards are connected to these ports.
○ VLAN 104 Ports 13-48 on each ICX 6450-48 switch.
NOTE: Traffic on this VLAN may be reduced if VLAN 105 is needed for storage as long as each
compute node is connected to VLAN 104
Untagged traffic on these ports belongs to VLAN 104. The compute nodes and the SMW node-side
network are connected to these ports.
○ VLAN 105 Some number of Ports 13-48 on each ICX 6450-48 switch, as needed for storage
management. Untagged traffic on these ports belongs to VLAN 105. The Storage Management Ports are
connected to these ports.
○ VLAN 1 (default) is unused.
Traffic from the SMW to the subcomponents in the rack subnet, and vice versa, is routed through the
corresponding RC.
For additional information, see the Urika®-GX Hardware Guide.
2.3 File Systems
Supported file system types on Urika-GX include:
● Internal file systems
○ Hadoop Distributed File System (HDFS) - Hadoop uses HDFS for storing data. HDFS is highly fault-
tolerant, provides high throughput access to application data, and is suitable for applications that have
large data sets. Urika-GX also features tiered HDFS storage. HDFS data is transferred over the Aries
network.
○ Network File System (NFS) - The Urika-GX SMW hosts NFS, which is made available to every node via
the management network.
○ /mnt/lustre - This is a directory that hosts Lustre file system data if DAL/Sonexion is used.
CAUTION: Avoid using NFS for high data transfers and/or large writes as this will cause the network
to operate much slower or timeout. NFS, as configured for Urika-GX home directories, is not capable
of handling large parallel writes from multiple nodes without data loss. Though It is possible to
configure NFS to handle parallel writes, it would require a hard mount, which would have undesired
consequences.
File Locations
● Home directories are mounted on (internal) NFS, with limited space
● Distributed file system (Lustre), if provisioned, is mounted at /mnt/lustre and is suitable for larger files.
Lustre mounts are isolated, with individual tenants having their own mount point.
S3016 11
Page 12

The Urika-GX System
2.4 System Nodes
Each Urika-GX node is a logical grouping of a processor, memory, and a data routing resource. Nodes can be
categorized as compute, I/O, service and login nodes.
Table 1. Node Types and Descriptions
Node Type Description
Compute nodes Compute nodes run application programs.
I/O nodes I/O nodes facilitate connecting to the supported external storage system.
Login nodes Users log in to the Urika-GX system via login nodes and virtual machines
(VMs). Login nodes store users' local files and facilitate launching jobs from the
command line. They also offer the environment for users to build, compile, and
monitor analytics applications.
Service nodes Service nodes handle support functions such as user login and I/O.
All Urika-GX nodes run the CentOS operating system (version 7.3) as well as portions of the Cray Linux
Environment (CLE).
2.5 Restrictions on Use
Hardware Considerations
The following items should be kept under consideration when using Urika-GX hardware:
● High speed network/management network switches must not be modified as this network is internal to UrikaGX.
● Moving the system from the rack Cray supplies to customer provided racks is not supported.
● Sub-rack and SMW hardware configuration must not be changed.
● PCIe devices should not be modified.
● Hardware and drivers installed on the SMW and nodes should not be modified.
● PDUs installed on the system should not be replaced.
Contact Cray Support if it is required to swap nodes between slots. The following options are supported:
● Connecting to the internal PDU power switches.
● Changing the hosts names of login nodes and the SMW.
● The single top of rack switch used for the operational network may be modified to meet site-specific needs.
This switch is expected to be used to enable a direct connection from the site network to the compute and I/O
nodes to support data ingestion and streaming analytics. This network may be modified to reflect site-specific
IP addresses and node names that would be directly exposed to the site network. For information on how to
configure the operational network, contact Cray support.
S3016 12
Page 13

The Urika-GX System
● The available space in the rack can be used for additional hardware, however proper power and cooling for
that gear needs to be ensured.
Contact Cray Support for information related to:
● Optionally switching to higher bandwidth NICs on the login nodes or SMW connections to the site network.
● Changing the internal range of Cray's IP addresses in case there is a conflict.
Software Considerations
The following items should be kept under consideration when using Urika-GX software:
● Spark Shells using Kubernetes (i.e., those launched under the secure service mode) will be limited to 16
cores and 60 GiB memory and this cannot be overridden at the command line. This is due to a limitation of
the lack of native Spark Shell support in the Spark on Kubernetes project that Cray has provided a
workaround for in this release.
● Modifying the iSCB firmware is not supported.
● Modifying switch firmware (both Ethernet/InfiniBand) is not supported.
● Modifying node BIOS settings is not supported.
● Modifying the kernel and/or kernel modules is not supported.
● Deleting any factory installed software is not supported.
● Changing the default configurations of Mesos, Marathon, mrun, and Grafana is not supported.
● Launching of Docker containers through Docker commands is not supported. Users must use the Marathon
interface for launching containers. For more information, refer to S-3015, "Urika®-GX Analytic Applications
Guide".
● Building and managing new Docker images is currently not supported on Urika-GX. For more information,
contact Cray Support.
Before installing any additional software on the Urika-GX system, a ticket should be opened with Cray Support to
verify that the software will have no impact on the system. The following options are supported:
● Adding CentOS 7 packages that do not cause dependency issues with the Cray installed software. Only Crayprovided Linux updates and YUM repositories should be used.
● Installing additional HDP 2.6.1.0-129 compliant packages and modifying these packages for integrating into
the existing software stack. This applies in the default service mode for HDP related items, except Spark. For
more information, refer to Urika-GX Service Modes on page 177
● Tuning Hadoop and Spark configuration parameters listed in section "Tunable Hadoop and Spark
Configuration Parameters" of S-3015, "Urika®-GX Analytic Applications Guide".
NOTE: Contact Cray Support if it is required to modify additional software configurations.
Security Considerations
If the Urika GX system is running in the secure mode in production, Cray does not recommend toggling back to
the default mode while in production because, in the default mode, the security assurances provided by secure
mode are not in place, and the security of data that was protected by secure mode may be compromised while
running in the default mode. Cray cannot extend the secure mode security assurances to any system that has run
in a production state in the default mode until that system has been fully re-deployed.
The following actions are not supported:
S3016 13
Page 14

The Urika-GX System
● It is recommended not to make any changes to the default set of Kubernetes and Kerberos configurations
without consulting Cray Support, as doing so can adversely affect the functionality of the system in the secure
service mode.
● Enabling of the PermitUserEnvironment option in sshd_config(5) or the passing of environment
variables beyond those listed on the ssh(1) manual page.
● Changing any settings listed in /etc/environment into login sessions on Urika-GX physical nodes outside
of the system through the login mechanism.
● Modifying the list of whitelist commands. For a list of commands that are part of the whitelist, see Tenancy on
page 183
● Tenant NameNode configuration is managed automatically by the Urika-GX tenant management scripts.
Manually altering the configurations of the tenant NameNode is not supported.
● Tenant names may only contain:
○ the letters a-z
○ the numbers 0-9
○ the characters '-' and '.'
NOTE: The name 'default' is reserved for the sample tenant configuration and cannot be used as a
tenant name.
● The following items need to be kept under consideration while using the ux-tenant-alter-vm command:
○ Number of CPUs: At least 2 CPUs need to remain available when the number of CPUs is changed by this
script. That is, if there are N number of CPUs, a maximum of N-2 CPUs can be assigned to a VM.
○ Amount of memory: At least 50% of the memory must remain available after a VM has been assigned
memory using this command.
S3016 14
Page 15

System Management
3
System Management
3.1 Check the Current Service Mode
Prerequisites
This procedure requires root privileges on the SMW.
About this task
Urika-GX supports two service modes, which dictate the list of services available. These modes include:
● Default
● Secure
Use the following instructions to determine the service mode the system is currently running in.
Procedure
1. Log on to the SMW as root.
# ssh root@hostname-smw
2. Display the current service mode by using one of the following options:
● Execute the urika-state command. This displays the current service mode as well as the status of all
the services that are supported in that mode.
● Execute the urika-service-mode command.
# urika-service-mode
Current mode is: default
For more information, refer to the urika-service-mode and urika-state man pages.
3.2
The following table contains the component naming format for Urika®-GX systems:
Urika-GX Component Naming Conventions
S3016 15
Page 16

Table 2. Urika-GX Component Naming Conventions
Component/Subject Naming Pattern Range
System Management
SMW
Wild card, similar to s0.
Wild card, which refers to all the
compute nodes
Wild card, which refers to all the
service nodes
Machine partition
Rack
Sub-rack. There are up to 4 subracks per rack. Each sub-rack
contains up to 2 dual Aries Network
Card (dANC) cards, up to 16
compute nodes, and up to 2
Intelligent Subrack Control Boards
(iSCBs)
Intelligent Subrack Control Board
(iSCB)
Dual Aries Network Card (dANC).
There are up to 2 dANCs per subrack, accommodating up to 16
nodes
s0
all
all_comp
all_serv
pP p0
rR R:0 to 161
rRsS S:0 to 3
rRsSiI I:0 to 1
rRsScC C:0 to 1
N/A
N/A
N/A
N/A
High Speed Network (HSN) cable.
The "j" name is visible on the cable
connector face plate
Aries ASIC within a dANC card
Aries link control block within an
Aries ASIC.
Network Interface Controller (NIC)
within an Aries ASIC
Node within a dANC card
Accelerator within a node
Board Management Control (BMC)
within a node
Tenant Naming Conventions
Tenant names may only contain:
● the letters a-z
rRsScCjJ J:0-15
rRsScCaA A:0 to 1
rRsScCaAlRC R:0 to 5
C:0 to 7
rRsScCaAnN N:0 to 3
rRsScCnN N:0 to 7
rRsScCnNaA A:0 to 7
rRsScCnNbB B:0
S3016 16
Page 17

System Management
● the numbers 0-9
● the characters '-' and '.
NOTE: The name default is reserved for the sample tenant configuration and cannot be used as a
tenant name.
3.3 System Management Workstation (SMW)
The System Management Workstation (SMW) is the system administrator's console for managing a Cray system.
The SMW is a server that runs the CentOS (version 7.3) operating system, Cray developed software, and thirdparty software. The SMW is also a point of control for the Hardware Supervisory System (HSS). The HSS data is
stored on an internal hard drive of the SMW.
The SMW provides shell and web access to authorized users to perform administrative and monitoring tasks. The
Nagios Core service also runs on the SMW.
Most system logs are collected and stored on the SMW. The SMW plays no role in computation after the system
is booted. From the SMW an administrator can initiate the boot process, access the database that keeps track of
system hardware, analyze log messages, and perform standard administrative tasks.
CAUTION: The SMW is a critical system component, which facilitates the operation of other hardware
and software components. Therefore, it is important that all instructions in this publication be followed
before making any changes/reconfigurations to the SWM, as well as before restarting the SMW.
3.3.1 Power On the System Management Workstation (SMW)
The SMW can be turned on by:
● Physically turning the SMW on via the power button.
● Using the iDRAC.
CAUTION:
The SMW is a critical system component, which facilitates the operation of other hardware and software
components. Therefore, it is important that all instructions in this publication be followed before making
any changes/reconfigurations to the SWM, as well as before restarting the SMW.
3.3.2
The iDRAC is a systems management hardware and software solution that provides remote management
capabilities, crashed system recovery, and power control functions for the System Management Workstation
(SMW). The iDRAC alerts administrators to server issues, helps them perform remote server management, and
reduces the need for physical access to the server. The iDRAC also facilitates inventory management and
monitoring, deployment and troubleshooting. To help diagnose the probable cause of a system crash, the iDRAC
can log event data and capture an image of the screen when it detects that the system has crashed.
About the Integrated Dell Remote Access Controller (iDRAC)
For more information about the iDRAC, refer to online documentation at http://www.dell.com.
S3016 17
Page 18

System Management
3.3.3 Control System Management Workstation (SMW) Power with the iDRAC8 Web
Console
Prerequisites
Ensure that the SMW is up and running.
About this task
Use the iDRAC's web console to start up and shut down the System Management Workstation (SMW).
Procedure
1. Point a browser to the site-specific iDRAC IP address, such as https://system-smw-ras
The iDRAC console's login screen appears.
2. Enter root and initial0 in the Username and Password fields respectively. These are the default
credentials that should only be used if the default credentials have not been changed.
S3016 18
Page 19
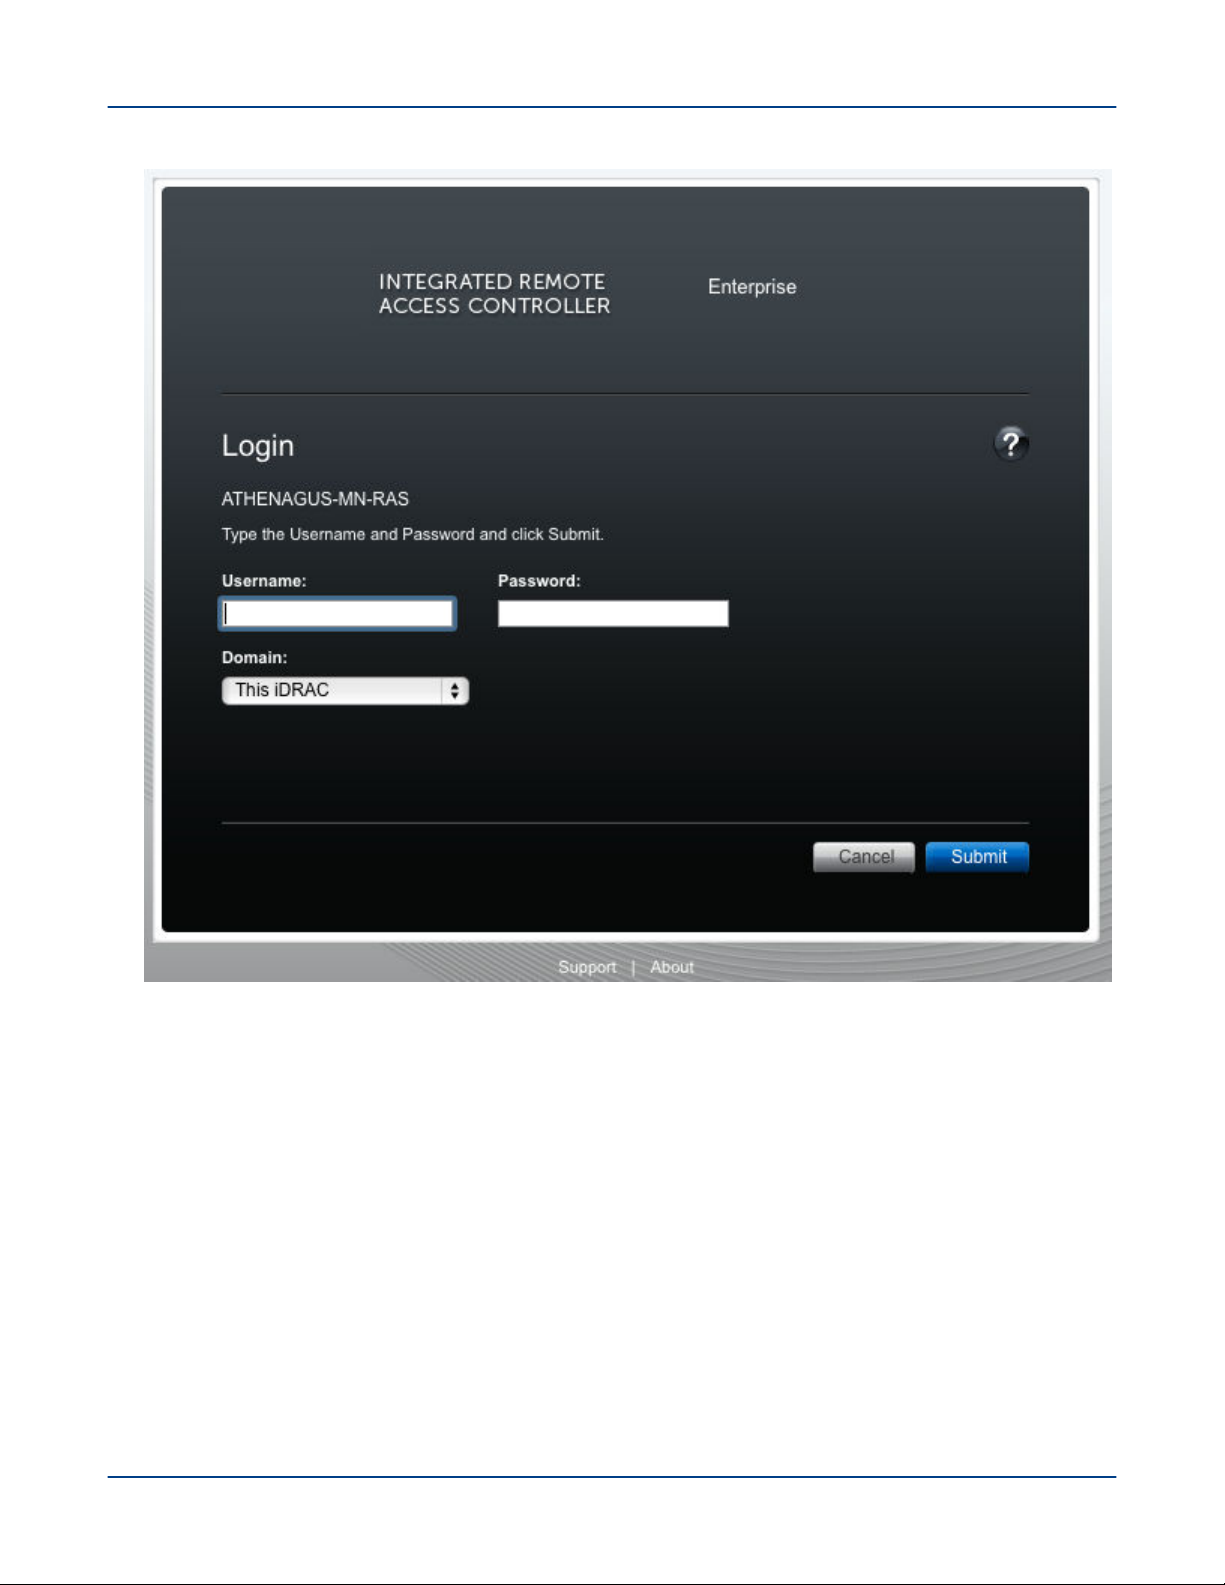
Figure 1. iDRAC Login Screen
System Management
3. On the Quick Launch Tasks section of the iDRAC UI, click on Power ON/ OFF link to control the SMW's
power.
S3016 19
Page 20
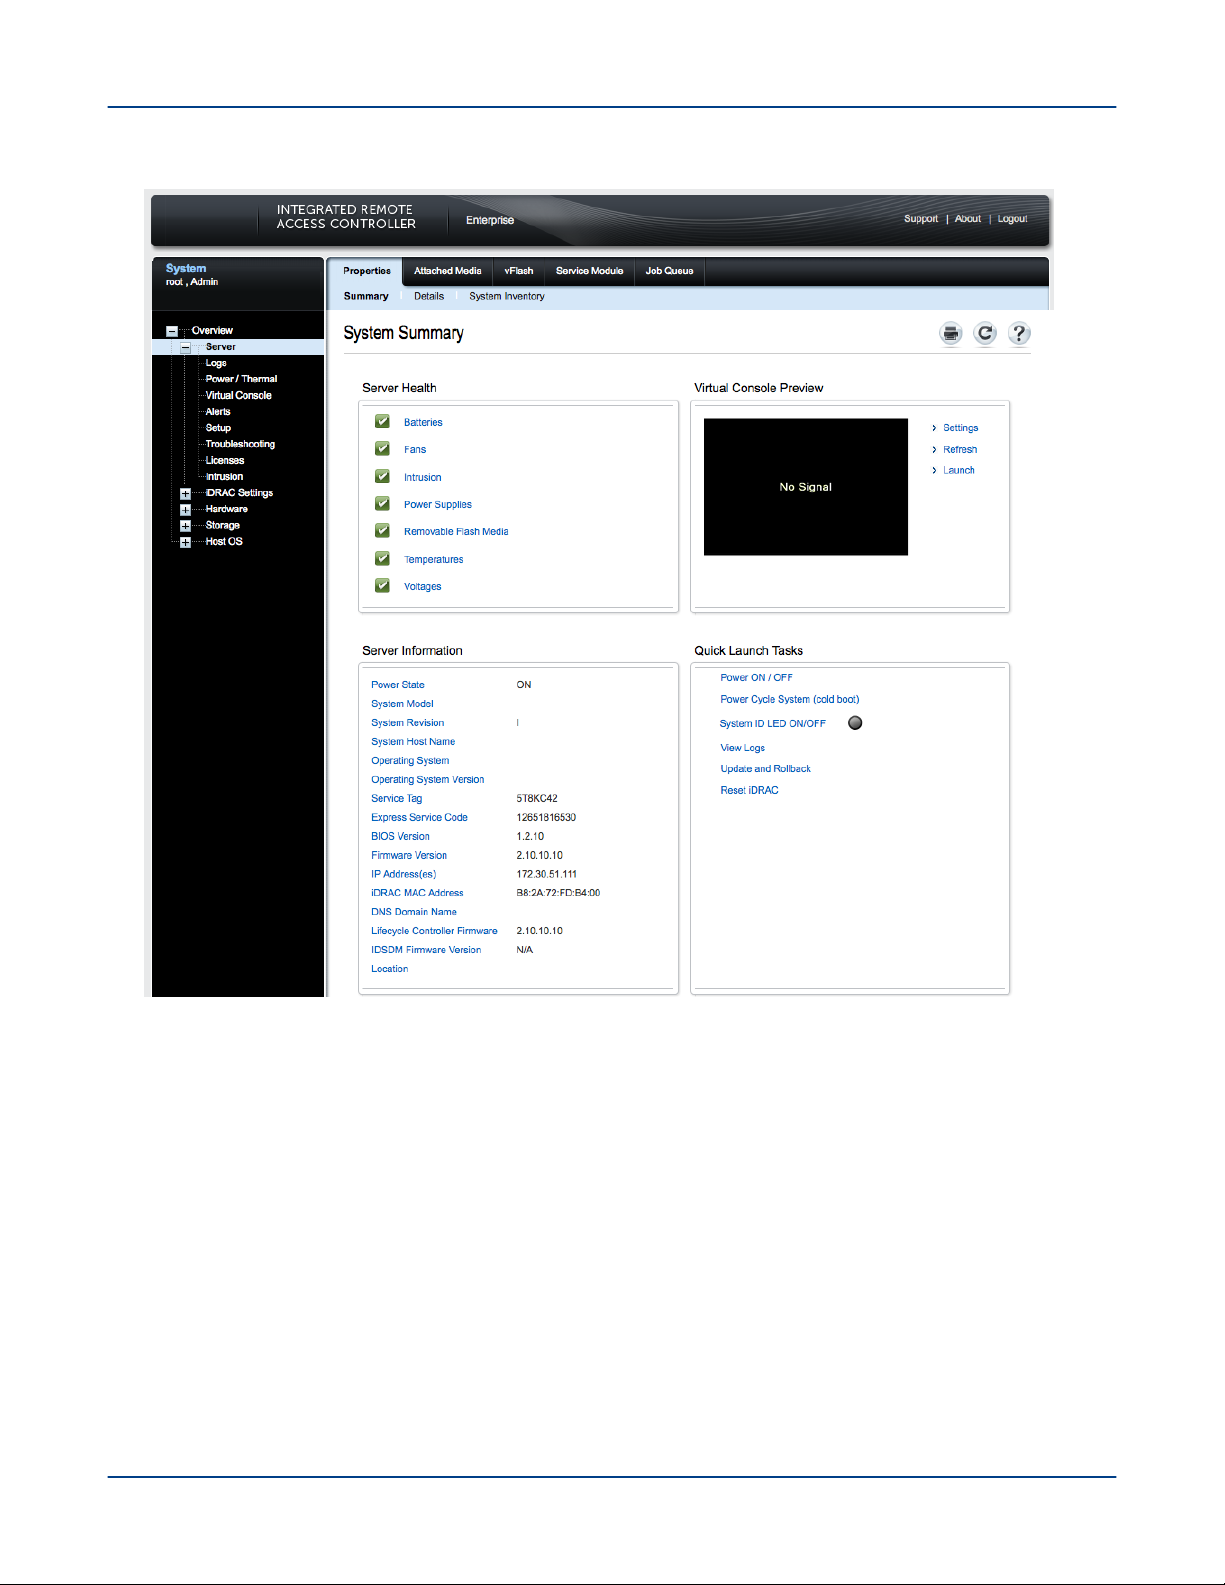
Figure 2. iDRAC Console
System Management
For more information about the iDRAC, visit http://www.dell.com
3.3.4 Synchronize the System Management Workstation (SMW) to the Site NTP Server
Prerequisites
This procedure requires root privileges.
About this task
The components of the Cray system synchronize time with the System Management Workstation (SMW) through
Network Time Protocol (NTP). By default, the NTP configuration of the SMW is configured to stand alone;
however, the SMW can optionally be configured to synchronize with a site NTP server. Follow this procedure to
configure the SMW to synchronize to a site NTP server.
S3016 20
Page 21

System Management
Procedure
1. Log on to the SMW as root.
2. Stop the NTP server by issuing the systemctl stop ntpd command.
smw:~ # systemctl stop ntpd
3. Edit the /etc/ntp.conf file on the SMW to point to the new server.
4. Update the clocks
smw:~ # ntpdate timeserver
5. Restart the NTP server by issuing the systemctl start ntpd command:
smw:~ # systemctl start ntpd
The SMW can continue to update the rest of the system by proxy. By default, the SMW qualifies as a stratum
3 (local) NTP server. For more information about NTP, refer to the Linux documentation.
6. Sync the hardware clock
smw:~ # hwclock --systohc
7. Verify that the SMW has jitter from the NTP server
smw:~ # ntpq -p
3.3.5 Synchronize Time of Day on System Nodes
Prerequisites
This procedure needs to be carried out as root.
About this task
Follow this procedure to configure Urika-GX compute nodes to synchronize to a site NTP server. This procedure
is specific to a 48 node system.
Procedure
1. Stop the NTP server by issuing the systemctl stop ntpd command.
# pdsh -w nid000[00-47] " systemctl stop ntpd"
2. Edit the /etc/ntp.conf file on the SMW to point to the new server.
3. Update the clocks
# pdsh -w nid000[00-47] " ntpdate -s smw"
S3016 21
Page 22

4. Sync the hardware clock
# pdsh -w nid000[00-47] "hwclock --systohc "
5. Restart the NTP server by issuing the systemctl start ntpd command:
# pdsh -w nid000[00-47] " systemctl start ntpd"
System Management
3.3.6
Reboot a Stopped System Management Workstation (SMW)
About this task
The SMW is an integral player in monitoring and maintaining optimal High Speed Network (HSN) traffic. If the
SMW is down or being rebooted (i.e., not fully working), the Aries Network Card Controllers (ANCCs) will
automatically throttle the high-speed network because the ANCCs are no longer hearing SMW heartbeats. This is
done in order to prevent possible network congestion, which normally requires the SMW to be up in order to
respond to such congestion. Once the SMW is up again, the ANCCs will unthrottle the network. (No attempt is
made to prevent loss of data or to carry out operations that occur when the SMW is offline). The consequences of
throttling are that the network will perform much more slowly than normal.
When the SMW comes up, it restarts, establishes communications with all external interfaces, restores the proper
state in the state manager, and continues normal operation without user intervention.
For a scheduled or unscheduled shutdown and reboot of the SMW, it is necessary to have a backup of
configuration files so that if one or more of the files in use becomes corrupted, a clean set of files is available with
which to reboot.
Procedure
1. Ensure that there are no resiliency actions taking place (by executing tail -f /var/opt/cray/log/p0-
default/nlrd-YYYYMMDD) at the time of a graceful SMW shutdown, otherwise wait until the action is
finished.
# tail -f /var/opt/cray/log/p0-default/nlrd-YYYYMMDD
2. Boot the SMW.
3.4
HSS is an integrated system of hardware and software that monitors the hardware components of the system and
proactively manages the health of the system. HSS communicates with nodes and management processors over
an internal (private) Ethernet network that operates independently of the Cray Aries High Speed Network (HSN).
HSS includes the following components:
● HSS network
● HSS Command Line Interface (CLI)
● Aries Network Card Controllers (ANCCs)
Hardware Supervisory System (HSS)
S3016 22
Page 23

System Management
● Rack controllers
● HSS daemons
● HSS database
● Various logs
HSS performs a number of administrative tasks, such as:
● Monitoring certain hardware system components
● Managing hardware and software failures
● Starting up and shutting down nodes
● Managing the High Speed Network (HSN)
● Maintaining system component states
● Managing the hardware inventory
HSS Command Line Interface
HSS has a command-line interface to manage and view the system from the SMW. For complete usage
information, see the xtcli(8) man page.
Dual Aries Network Card (dANC) Controllers and Rack Controllers
A dANC control processor is hierarchically the lowest component of the monitoring system. The dANC Cray
network card contains two Aries ASICs and an ANCC. There are 2 dANC cards per sub-rack, and hence 4 Aries
ASICs, which support 16 nodes. The dANC monitors the general health of components, including items such as
voltages, temperature, and various failure indicators. A version of Linux optimized for embedded controllers runs
on each dANC controller.
Each rack has a rack control processor (rack controller) that monitors and controls the rack power and
communicates with all dANC controllers in the rack. It sends a periodic heartbeat to the SMW to indicate rack
health.
The rack controller connects to the dANC controllers via the Ethernet switch on each blade by an Ethernet cable
and routes HSS data to and from the SMW. RC runs the same version of embedded Linux as the dANCs. The
SMW, rack controllers, iSCBs, and ANCCs are all interconnected via Ethernet
The monitoring system uses periodic heartbeats. Processes send heartbeats within a time interval. If the interval
is exceeded, the system monitor generates a fault event that is sent to the state manager. The fault is recorded in
the event log, and the state manager sets an alert flag for the component (dANC controller or rack controller) that
spawned it.
The rack and dANC controllers use NTP to keep accurate time with the SMW.
HSS Daemons
HSS daemons on the SMW and the controllers act to monitor and control the state of the system, and to respond
to incidents such as hardware failures. The data path between the HSS CLI and the various daemons is via HSS
events.
Cray System Network Routing Utility
The rtr command performs a variety of routing-related tasks for the High Speed Network (HSN). Tasks include:
S3016 23
Page 24

System Management
● Generating and applying HSN routes
● Verifying that routes can be generated for the current configuration
● Verifying that generated routes are free of cyclic dependencies
● Dumping out a variety of routing-related and link-related information
HSS Database
The HSS database is a MariaDB relational database that contains the state of all the physical system
components, including the System Management Workstation (SMW), Rack Controller (RC), Intelligent Subrack
Control Board (iSCB), nodes, and the Aries Network Card Controller (ANCC). The state manager reads and
writes the system state to the HSS database. The state manager keeps the database up-to-date with the current
state of components and retrieves component information from the database when needed.
Log Files
Event Logs The event router records events to the event log in the /var/opt/cray/log/event-yyyymmdd
file.
Log rotation takes place at specific time intervals. By default, one file is generated per day.
Dump Logs
SMW Logs SMW logs are stored in /var/opt/cray/log/p0-default on the SMW, and include logs for
The xtdumpsys writes logs into the/var/opt/cray/dump directory by default.
xtconsole, xtconsumer, xtnlrd, etc.
3.4.1 Hardware Supervisory System (HSS) Architecture Overview
HSS hardware on the Urika-GX system consists of a System Management Workstation (SMW), which is a rackmounted Intel-based server running CentOS along with an Ethernet network that connects the SMW to a rack
controller (RC) via a switch. The RC connects to one Aries Network Card Controller (ANCC) on each dual Aries
Network Card (dANC) and consists of a mini PC running Linux. The ANCC has a 32-bit processor. Each hardware
component in the HSS system runs a version of Linux with the relevant HSS software installed. RC is used to
route data downstream from the SMW to the ANCCs and Intelligent Subrack Control Boards (iSCBs), and
upstream from the ANCCs and iSCBs to the SMW.
HSS control and monitoring is performed by the SMW over the HSS Ethernet via a stacked managed switch,
which uses VLANs to connect the SMW to the ANCCs, RC, and iSCBs.
The Urika-GX system can consist of 1, 2 or 3 sub-racks per rack, and 2 dANCs per sub-rack, resulting in a
maximum of 6 dANCs per rack. Each dANC has 2 Aries ASICs, each of which has 4 NICs to support a single
node per NIC connected by PCIe Gen 3.
HSS infrastructure software stack executes on the RC, SMW, and the ANCC to control and monitor the Aries
ASIC.
Resiliency Communication Agent (RCA)
RCA is a messaging service that connects compute nodes to the HSS event and messaging system, and allows
compute nodes to subscribe to and inject HSS events and messages.
S3016 24
Page 25

System Management
Inventory Management
HSS keeps track of hardware inventory to identify which hardware components are up and running. It uses the
xthwinv command to retrieve hardware component information.
Hardware Discovery
HSS plays an integral role in system hardware discovery. HSS components that play a role in this process include
the HSS database and the xtdiscover command. For more information, see the xtdiscover(8) man page.
Hardware Supervisory System (HSS) Ethernet/Management Network
The HSS network provides interconnectivity between the System Management Workstation (SMW), Rack
Controllers (RCs), and dual Aries Network Cards (dANCs) in a hierarchical fashion.
3.4.2
The xtdiscover command automatically discovers the hardware components on a Cray system and creates
entries in the system database to reflect the current hardware configuration. The xtdiscover command
identifies missing or non-responsive cabinets and empty or non-functioning Dual Aries Network Cards (dANCs).
The xtdiscover command and the state manager ensure that the system status represents the real state of the
hardware. When xtdiscover has finished, a system administrator can use the xtcli command to display the
current configuration. No previous configuration of the system is required; the hardware is discovered and made
available. Modifications can be made to components after xtdiscover has finished creating entries in the
system database.
The xtdiscover interface steps a system administrator through the discovery process.
Prior to performing component discovery, the xtdiscover command will need to make sure that the Hardware
Supervisory System (HSS) networking is set up properly, using a user-provided block of IP address space. This
information is used to create the /etc/hosts file and DHCP entries for the HSS network. This setup typically
only needs to be done once unless the address block is moved, or a new rack is added.
If there are changes to the system hardware, such as populating a previously empty dANC, or adding an
additional rack, then xtdiscover must be executed again, and it will perform an incremental discovery of the
hardware changes. A full-system xtdiscover is not intended to be run while the High Speed Network (HSN) is
actively routing traffic. When new blades are added during system operation with xtwarmswap, however, a minixtdiscover is automatically run to make the required updates to the database.
The xtdiscover Command
TIP: Simply adding an additional rack within an existing address block will not affect the address
assignments for the existing racks. If it is intended to add additional racks in the future, it is better to
configure networking for all of them all at once. The xtdiscover command will automatically detect
whether each rack is presently in the system and will set the system state accordingly.
For more information, see the xtdiscover(8) man page.
3.4.3
Each Urika®-GX system rack is numbered starting at 0. Each sub-rack within a rack has a dip switch that can set
the rack and sub rack number. The iSCB conveys the rack and sub-rack numbers to the Aries Network Cards
(ANCs) via an I2C bus. The Dual Aries Network Card (dANC) blade has a slot-sense bit which tells it which dual
dANC number it is within the sub-rack (0 or 1). The dANC uses the rack, sub-rack, and dANC number to
construct its hostname. The Rack Controller (RC) determines its rack number from the location of the Intelligent
Subrack Control Board (iSCB), encoded in a DHCP request sent by the iSCB and seen by RC.
Hardware Supervisory System (HSS) Component Location Discovery
S3016 25
Page 26

System Management
3.4.4 Hardware Supervisory System (HSS) Daemons
HSS daemons and applications exchange information with the event router. They are located
at: /opt/cray/hss/default/bin and are started when the System Management Workstation (SMW) boots.
They can be managed via systemd and can be stopped and started via systemctl stop hss and
systemctl start hss respectively. HSS daemons are configured dynamically by executing the
xtdaemonconfig command.
Key HSS daemons include:
● State manager daemon (state_manager) - Performs HSS system hardware state management.
● Event router daemon (erd) and (erdh) - Performs HSS message routing.
● Node ID manager daemon (nid_mgr) - Manages node IDs and NIC addresses for every node in the system.
State Manager
HSS maintains the state of all components that it manages. The state manager, state_manager, runs on the
SMW and uses a relational database (also referred to as the HSS database) to maintain/store the system state.
The state manager keeps the database up-to-date with the current state of components and retrieves component
information from the database when needed. Thus, the dynamic system state persists between SMW boots. The
state manager uses the Lightweight Log Manager (LLM). The log data from state manager is written
to: /var/opt/cray/log/sm-yyyymmdd. The default setting for state manager is to enable LLM logging. The
state manager performs the following functions:
● Updates and maintains component state information
● Monitors events to update component states
● Detects and handles state notification upon failure
● Provides state and configuration information to HSS applications.
The state manager performs the aforementioned tasks on behalf of:
● System nodes
● Aries chips
● Aries HSN Links
● dual Aries Network Card (dANC)
● Rack controller (RC)
● Intelligent Subrack Control Board (iSCB)
In summary, the state manager subscribes to and listens for HSS events, records changes of states, and shares
those states with other daemons.
The Event Router (erd)
HSS functions are event-driven. The event router daemon, erd runs on the SMW, rack controllers, and dANC
controllers. HSS commands and daemons subscribe to events and inject events into the HSS system by using
the services of the erd. The event router starts as each of the devices (SMW, rack controller, dANC controller)
are started.
S3016 26
Page 27

System Management
When the event router on the SMW receives an event from either a connected agent or from another event router
in the hierarchy, the event is logged and then processed. HSS CLI commands use events to query and control
HSS daemons.
Node ID (NID) Manager
The nid_mgr generates a list of mapping between node logical IDs and physical Network Interface Controller
(NIC) IDs and distributes this information to the blade controllers. Along with the ability to assign NIDs
automatically, the nid_mgr supports a mechanism that allows an administrator to control the NID assignment;
this is useful for handling unique configurations. Administrator-controlled NID assignment is accomplished through
the NID assignment file, nids.ini.
CAUTION: The nids.ini file can have a major impact on the functionality of a Cray system and should
only be used or modified at the recommendation of Cray support personnel. Setting up this file incorrectly
can make the Cray system unroutable.
Typically after a NID mapping is defined for a system, this mapping is used until some major event occurs, such
as a hardware configuration change. This may require the NID mapping to change, depending on the nature of
the configuration change. Adding additional racks does not typically result in a new mapping.
Since the operating system always uses NIDs, HSS converts these to NIC IDs when sending them on to the HSS
network and converts them to NIDs when forwarding events from HSS network to a node.
3.4.5 Hardware Supervisory System (HSS) Administration and Diagnostic Commands
Supported on Urika-GX
The following HSS commands are supported on Urika®-GX and need to be invoked from the System
Management Workstation (SMW) to control HSS operations. Usage information for all of these commands can be
viewed using the -h option, man pages are available where noted.
Table 3. HSS Administration Commands
Command Description
capmc
hss_make_default_initrd.athena.rc
hss_make_default_initrd.athena.danc
hssbootlink
Cray advanced power monitoring and control utility. See
the capmc(8) man page for more information.
Creates the Rack Controller (RC) image.
Creates the dual Aries Network Card (dANC) image.
Links a Linux kernel bzImage file, an initramfs file,
and a parameters file so that they can be booted on a
Controller by using PXE boot on an SMW.
hssclone
hssds_init
hsspackage
make_node_inventory
Clones the master image directory.
Creates the Hardware Supervisory System (HSS) data
store; ensures the proper HSS data store user
credentials are created and that the data store is ready
for operation.
Facilitates creation of controller boot images.
Generates an inventory of Urika-GX nodes.
S3016 27
Page 28

Command Description
System Management
nid2nic
rtr
xtagent
xtalive
xtbounce
xtcablecheck
xtccpasswd
xtcc-ssh-keys
Prints all nid-to-nic_address mappings. See the
nid2nic(8) man page for more information.
Performs system routing. See the rtr(8) man page
for more information.
Generic agent for accessing the event router.
Checks for life of HSS daemons. See the xtalive(8)
man page for more information.
Initializes Aries and HSN links. Powers down nodes as
needed. See the xtbounce(8) man page for more
information.
Compares the link endpoint pairs as known to the
routing software with the link ID values set in MMRs in
each LCB in the Aries ASIC to insure the HSN is cabled
correctly.
Changes the password for all Rack Controllers (RCs),
Dual Aries Network Card Controllers (dANCCs), and
Intelligent Subrack Control Boards (iSCBs) on UrikaGX. It must be run as root.
Creates and modifies the authorized_keys file for
Rack Controllers (RCs) and dANCCs.
xtchecklink
xtclass
xtclear
xtcli
xtcon
xtconsole
xtconsumer
xtdaemonconfig
xtdiscover
xtdumpsys
Checks HSN and PCIe link health.
Displays the network topology class for this system.
Clears component flags in the State Manager. For more
information, see the xtclear(8) man page.
Controls dANC and node power, displays status and
sets administrative component status. See the
xtcli(8) man page for more information.
Provides a two-way connection to the console of a
node. For more information, see the xtcon(8) man
page.
Displays console text from one or more nodes.
Displays HSS events.
Configures HSS daemons dynamically.
Discovers and configures the Cray system hardware.
This command is also used to populate the HSS
database and set up HSS IP networking. For more
information, see the xtdiscover(8) man page.
Gathers information when a system node stops
responding or fails.
xterrorcode
xtfileio
Displays event error codes.
Performs file transfer to/from HSS controllers.
S3016 28
Page 29

Command Description
System Management
xtfile2mem/xtmem2file
xtgenid
xtgenevent
xthwerrlog
xthwerrlogd
xtlogfilter
xtmemio
xtnetwatch
xtnid2str
xtnlrd
xtnmi
Reads CPU or Aries memory and saves it in a file.
Performs binary file-to-MMR/node memory and vice
versa.
Generates HSS physical IDs.
Injects arbitrary HSS events into the event stream.
Displays hardware errors retrieved from xthwerrlogd
in user-friendly format.
Monitors HW error log messages sent by the ANCC and
by nodes.
Filters information from event router log files.
Performs reads or writes to Aries MMRs or node
memory.
Watches the Cray system interconnection network for
link control block (LCB) and router errors.
Converts node identification numbers to physical
names. See the xtnid2str(8) man page for more
information.
Responds to fatal Aries and HSN errors by rerouting the
system.
Sends a non-maskable interrupt to target nodes. See
the xtnmi(8) man page for more information.
xtpcimon
rackfw
xtshow
xtsignal
xtwarmswap
xthwinv
xtls
xtpe
There are a number of HSS diagnostics commands supported on Urika-GX. These commands need to be run
from a compute node.
WARNING: All HSS diagnostics commands are intended for use by Cray Service Personnel only.
Improper use of these restricted commands can cause serious damage to the system.
Monitors health of PCIe channels for Urika-GX systems.
Flashes all devices in the Urika-GX system via out-ofband (OOB). See the rackfw(8) man page for more
information.
Shows components with selected characteristics. See
the xtshow(8) man page for more information.
Sends a signal number or software interrupt to a remote
process.
Allows Cray dANC cards or high-speed network cables
to be warm swapped. See the xtwarmswap(8) man
page for more information.
Retrieves hardware component information for selected
modules.
Generates a summary of HSN link errors.
Generates a summary of PCIe link errors.
S3016 29
Page 30

Table 4. HSS Diagnostic Commands
Command Description
System Management
xtbte_ata
xtbte_ato
xtfma_ata
xtfma_ato
xtfma_amo
xtfbc
xtbte_perf
Perform system stress test to ensure that all logical endpoints go to
all other end points using BTE put and/or get transactions.
Runs a number of applications individually or collectively as a suite
to ensure that a system is ready for executing jobs after hardware
or software upgrades or after power cycles.
Ensures that all logical endpoints go to all other end points using
FMA put and/or get transactions.
Ensures that all logical endpoints target one end point using FMA
Put and/or Get transactions. A round robin approach is used to step
through each end point in the configuration.
Checks all AMO operations using an All-to-All algorithm. It tests
AMOs with PUT (non-fetching) and GET (fetching) attributes.
Ensures that both the FMA and BTE logic blocks are tested. The
test relies on the Generic Network Interface (GNI) API to directly
communicate with the Cray network application-specific integrated
circuit (ASIC).
Determines the one hop connections between nodes. It then
performs BTE transfers over these one hop connections and
determines the time taken to do so. The time duration is checked
against an expected value for the link type. The actual data
transferred is also verified.
3.4.6 Hardware Supervisory System (HSS) Environments
The HSS infrastructure environment is composed of a number of daemons, processes, and commands that help
control and monitor physical system components.
HSS daemons supported on Urika-GX are listed in the following tables:
Table 5. ANCC HSS Daemons
Daemon Description
Aries Network Card Controller (ANCC) System Daemon
(anccsysd)
ANCC Router Daemon (anccrtrd) Handles requests from rtr on the System
ANCC Bandwidth Throttle Daemon (anccbwtd) Monitors High Speed Network (HSN) traffic and
Controls power and state of the dual Aries
Network Card (dANC) components, including
Aries initialization and health monitoring.
Management Workstation (SMW) to stage or
install Aries Routes.
reports congestion indicators, assists in
controlling congestion.
S3016 30
Page 31

System Management
Daemon Description
ANCC Network Daemon (anccnwd) Monitors the Aries HSN link status, and reports
soft and fatal errors.
ANCC PCIe Monitor Daemon (anccpcimond) Monitors the Aries PCIe errors and status.
ANCC User-space Driver Daemon Acts as the ANCC JTAG/MMR/Node Memory
access driver.
ANCC Environment Monitor Daemon (anccmond) Monitors various environmental sensors.
ERD File System Client (erfsc) Acts as the ERFS dANC-level client.
Event Router Daemon (erd) Performs HSS message routing
Controller Vitality Check Daemon (cvcd) Monitors memory consumption, CPU utilization,
file system usage, etc.
Table 6. Rack Controller HSS Daemon
Daemon Description
Rack Controller System Daemon (rcsysd) Monitors ANCC heartbeats, emits heartbeat for
the State Manager, controls dANC power
operations, and monitors the iSCB's health.
Controller Vitality Check Daemon (cvcd) Monitors memory consumption, CPU utilization,
file system usage, etc.
ERD File System Client (erfsc) Acts as the ERFS RC-level client.
ERD File System Daemon (erfsd) Facilitates the ERD file system
Event Router Daemon (erd) Performs HSS message routing
Table 7. SMW HSS Daemons
Daemon Description
State Manager (state_manager) Performs HSS system hardware state
management.
ERD File System daemon (erfsd) Facilitates the ERD file system.
Event Router Daemon (erd) Performs HSS message routing
NID Manager (nid_mgr) Manages node IDs and NIC addresses for every
node in the system.
NOTE: SMW HSS daemons are started and stopped via the systemctl start hss and systemctl
stop hss commands respectively.
S3016 31
Page 32
System Management
Additional Supporting HSS Daemons
The following supporting HSS daemons are started via the systemctl start hss command and log
to /var/opt/cray/log/p0-default on the SMW.
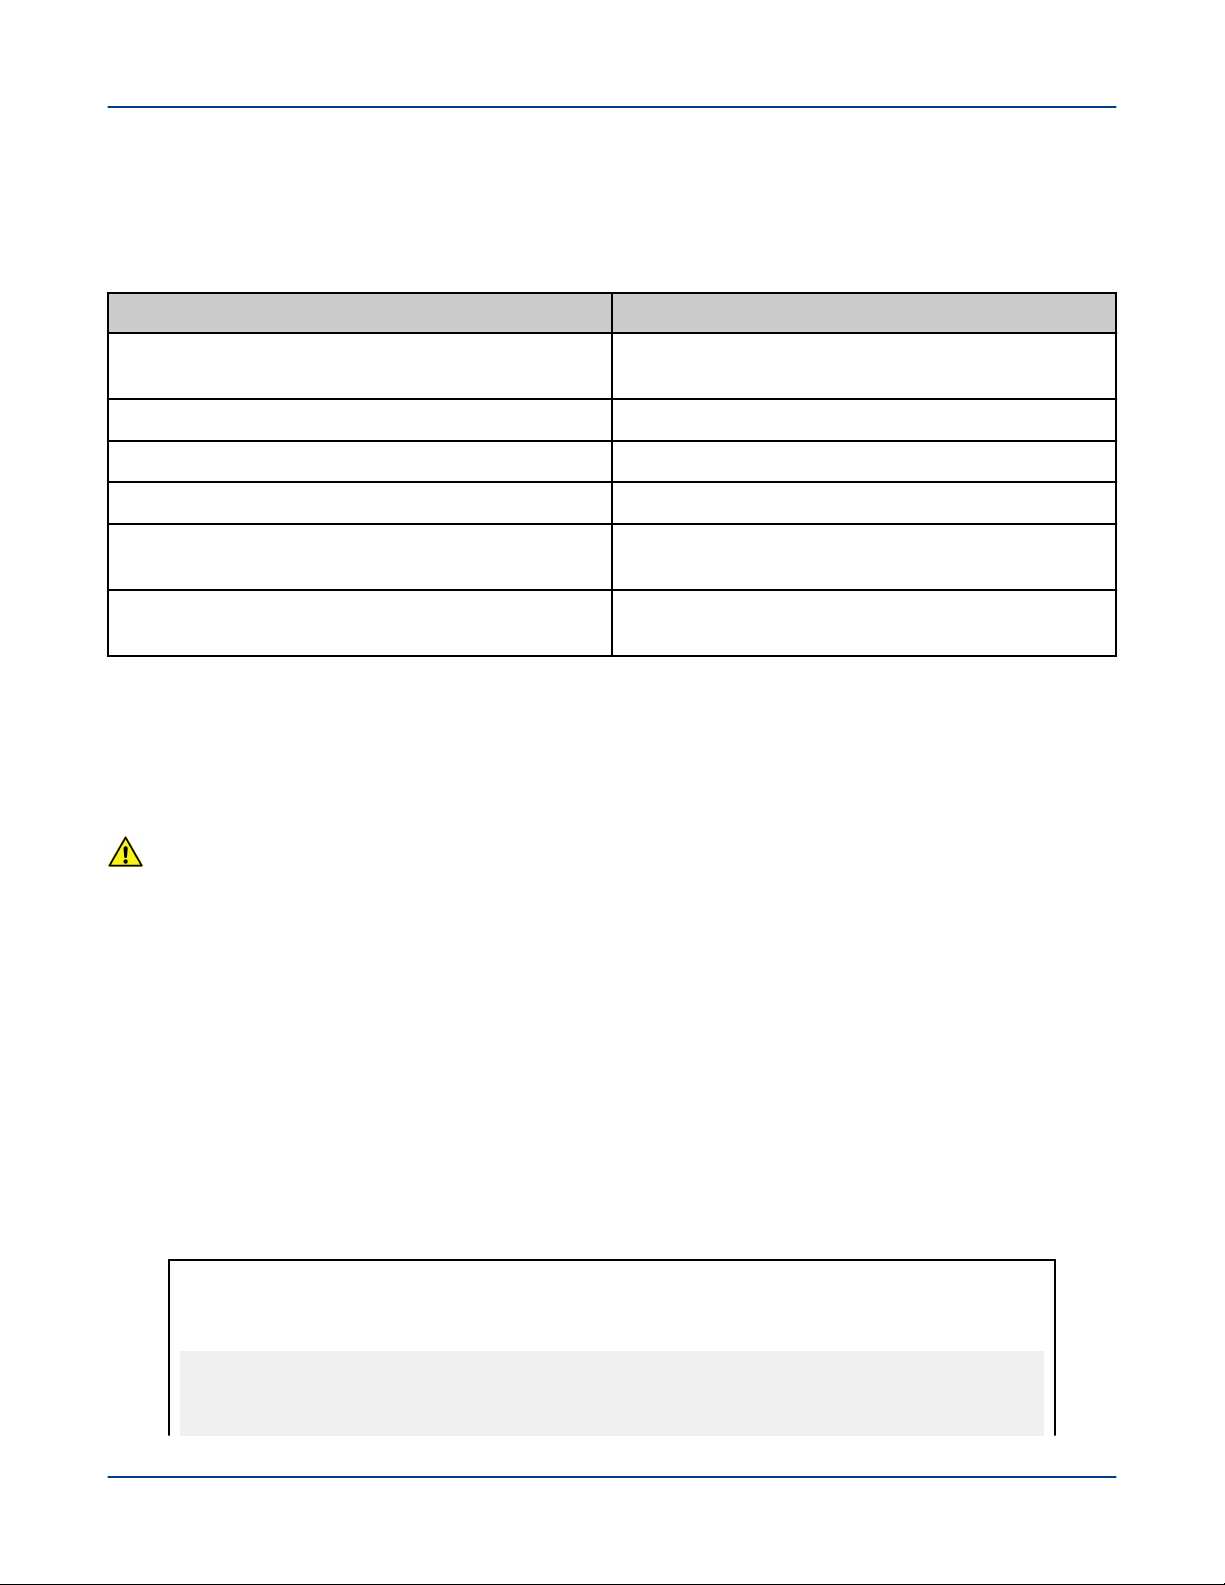
Table 8. Supporting HSS Daemons
Daemon Description
Network Link Resiliency Daemon (xtnlrd) Assists in manual and automatic hardware swap-in/
swap-out.
Event Monitor (xtconsumer) Monitors and logs a configurable set of HSS events.
HSN Error Monitor (xtnetwatch) Monitors HSN hardware for errors and logs them.
PCIe Link Error Monitor (xtpcimon) Monitors for PCIe errors on various devices.
Hardware Error Logger (xthwerrlogd) Monitors HW error log messages sent by the ANCC
and by nodes.
Node Console Logger (xtconsole) Records node console output for every node in the
system.
3.4.7
The Cray HSN is composed of a number of custom components developed by Cray that provide high-bandwidth,
low-latency communication between all the compute processing elements of the system.
The HSN, which interconnects Aries chips, is configured by executing the xtbounce command to initialize the
Aries and HSN links, followed by the rtr command to calculate Aries routes.
Aries chips are auto-initialized by the anccsysd daemon when the dANC powers on, or whenever anccsysd
restarts.
3.4.8
High Speed Network (HSN) Management
CAUTION: xtbounce should never be executed when nodes are up as this command will not gracefully
shut nodes down, and will cause them to crash. For more information about using this command, contact
Cray Support.
Create Direct Connection between the System Management Workstation (SMW) and a Compute Node Console
The xtcon command is a console interface for system nodes. When it is executing, the xtcon command
provides a two-way connection to the console of any running node.
Connect SMW to node r0s0c1n0
For this example, connect the SMW to the console of node r0s0c1n0:
smw:~> # xtcon r0s0c1n0
--- Console for component r0s0c1n0. Use ^] to quit ---
CentOS release 6.5 (Final)
S3016 32
Page 33

System Management
Kernel 2.6.32-431.el6_1.0000.8835-cray_ari_athena_c_cos on an x86_64
nid00008 login: root
Password:
Last login: Wed Sep 23 17:44:55 on ttyS0
[root@nid00008 ~]#
See the xtcon(8) man page for additional information.
3.4.9 Disable Hardware Components
If links, nodes, or Cray ASICs have hardware problems, the system administrator can direct the system to ignore
the components with the xtcli disable command.
By default, when enabling a component, this command takes into consideration the hierarchy of components,
performs the action upon the identified component(s), and cascades that action to any subcomponent of the
identified component(s), unless the -n option is specified.
The xtcli disable command has the following form, where idlist is a comma-separated list of components
(in cname format) that the system is to ignore. The system disregards these links or nodes.
xtcli disable [{-t type [-a] } | -n] [-f] idlist
IMPORTANT: The -n option with the xtcli disable command must be used carefully because this
may create invalid system state configurations.
NOTE: The force option (-f) in some cases may cause issues with network resiliency operations.
Disabling of a rack, chassis, or dual Aries Network Card (dANC) will fail if any nodes under the component are in
the ready state, unless the force option (-f) is used. An error message will indicate the reason for the failure. If
the system is currently routed and the nodes are running, blades should not be disabled unless they are first
removed from the high-speed network via the xtwarmswap with the --remove option. For this reason, the
disabling will fail if any Aries LCBs are currently in the on state. The nodes must be shut down or halted prior to
running xtwarmswap command with the --remove option.
For more information, see S-3018, "Urika®-GX Network Resiliency Guide".
Disabling of a node in the ready state will fail, unless the force option (-f) is used. An error message will indicate
the reason for the failure.
The state of empty components will not change when using the disable command, unless the force option (-f)
is used.
For detailed information about using the xtcli disable command, see the xtcli(8) man page.
3.4.10
Enable Hardware Components
If links, nodes, or Cray ASICs that have been disabled are later fixed, the system administrator can add them
back to the system with the xtcli enable command.
The xtcli enable command has the following form, where idlist is a comma-separated list of components
(in cname format) for the system to recognize.
xtcli enable [{-t type [-a] } | -n] [-f] idlist
S3016 33
Page 34

System Management
IMPORTANT: The -n option with the xtcli disable command must be used carefully because this
may create invalid system state configurations.
The state of empty components does not change when using the xtcli enable command, unless the force
option (-f) is used.
The state of off means that a component is present on the system. If the component is a dANC controller, node,
or ASIC, then this will also mean that the component is powered off. If the administrator disables a component,
the state shown becomes disabled. When the xtcli enable command is used to enable that component for
use once again, its state switches from disabled to off. In the same manner, enabling an empty component
means that its state switches from empty to off.
On a running/routed system, dANCs that were not enabled when the network was brought up should not be
enabled with the xtcli enable command, as they will not be routed into the Aries High Speed Network (HSN).
Instead they should be added to the HSN with the --add option of the xtwarmswap command. This will
automatically enable the blade when it is successfully routed into the system.
For more information, see the xtcli(8) man page.
3.4.11
Use the xtcli set_empty command to set a selected component to the EMPTY state. HSS managers and the
xtcli command ignore empty or disabled components.
Setting a selected component to the EMPTY state is typically done when a component, usually a blade, is
physically removed. By setting it to EMPTY, the system ignores it and routes around it.
Only blades that are not currently routed into the HSN (i.e. removed with the xtwarmswap command) should be
set to empty while the system is running, and only if the plan is to then physically remove the dANC from the
system, otherwise the xtcli disable command should be used.
For more information, see the xtcli(8) man page.
Set Hardware Components to EMPTY
IMPORTANT: The -n option with the xtcli disable command must be used carefully because this
may create invalid system state configurations.
Set a dANC to the EMPTY state
crayadm@smw> xtcli set_empty -a r0s0c1n0
3.4.12
Stop Components Using the Hardware Supervisory System (HSS)
WARNING: Power down the rack(s) with software commands. Tripping the circuit breakers may result in
damage to system components and to the file systems, and has an effect similar to that of abruptly
powering-off any Unix system.
WARNING: Before powering down a Dual Aries Network Card (dANC) or a rack, ensure the operating
system is not running on any nodes associated with dANCs.
The xtcli power down command powers down the specified rack and/or dANCs within the specified partition,
chassis, or list of dANCs. Racks must be in the READY state to receive power commands. The xtcli power
S3016 34
Page 35

System Management
down command uses the following form, where physIDlist is a comma-separated list of racks or dANCs
present on the system:
crayadm@smw:~> xtcli power down physIDlist
WARNING: Although a dANC is powered off, the Hardware Supervisory System (HSS) in the rack is alive
and has power.
For information about powering down a component, see the xtcli_power(8) man page.
Power down a specified dANC
For this example, power down a dANC with the ID r0s0c0:
crayadm@smw:~> xtcli power down r0s0c0
3.4.13
It may be required to unlock components when a daemon unexpectedly dies while holding a lock.
Use the HSS xtcli lock command to unlock components. This command is useful when a daemon
unexpectedly dies while holding a lock.
The system administrator can manually check for locks with the xtcli lock show command and then unlock
them. Unlocking a component does not print out the state manager session ID. The -u option must be used to
unlock a component as follows:
crayadm@smw> xtcli lock -u lock_number
Where lock_number is the value given when initiating the lock; it is also indicated in the xtcli lock show
query. Unlocking does nothing to the state of the component other than to release locks associated with it.
Unlock Hardware Components
Unlock rack r0
crayadm@smw> xtcli -u r0
3.4.14
The xtdumpsys command collects and analyzes information from a Cray system that is failing or has failed, has
crashed, or is hung. Analysis is performed on, for example, event log data, active heartbeat probing, voltages,
temperatures, health faults, in-memory console buffers, and high-speed interconnection network errors. When
failed components are found, detailed information is gathered from them.
Capture and Analyze System-level and Node-level Dumps
To collect similar information for components that have not failed, invoke the xtdumpsys command with the -add option and name the components from which to collect data. The HSS xtdumpsys command saves dump
information in /var/opt/cray/dump/timestamp by default.
NOTE: When using the --add option to add multiple components, separate components with spaces, not
commas.
S3016 35
Page 36
System Management
The following example shows usage of the xtdumpsys command:
crayadm@smw> xtdumpsys --add r0s2c1
The xtdumpsys command is written in Python and supports plug-ins written in Python. A number of plug-in
scripts are included in the software release. Call xtdumpsys --list to view a list of included plug-ins and their
respective directories. The xtdumpsys command also now supports the use of configuration files to specify
xtdumpsys presets, rather than entering them via the command line.
For more information, see the xtdumpsys(8) man page.
3.4.15
The sole purpose of the xtnmi command is to collect debug information from unresponsive nodes. As soon as
that debug information is displayed to the console, the node panics.
For additional information, see the xtnmi(8) man page.
Collect Debug Information From Hung Nodes Using the xtnmi Command
CAUTION: This is not a harmless tool to use to repeatedly get information from a node at various times;
only use this command when debugging data from nodes that are in trouble is needed. The xtnmi
command output may be used to determine problems such as a core hang. xtnmi will stop a running
node. It is best used when a node is not running correctly and debugging information is needed, or to stop
a node that is running incorrectly.
An example of using the xtnmi(8) command is:
smw$ xtnmi r0s1c0n4,r0s0c1s2
The following ID(s) will be NMI'd: r0s1c0n4,r0s0c1s2.
All expected responses (1) were received.
3.4.16 Find Node Information
Translate Between Physical ID Names and Integer NIDs
To translate between physical ID names (rnames) and integer NIDs, generate a system map on the System
Management Workstation (SMW) and filter the output, enter the following command:
crayadm@smw> rtr --system-map | grep rname | awk '{ print $1 }'
For more information, see the rtr(8) man page.
Find Node Information Using the xtnid2str Command
The xtnid2str command converts numeric node identification values to their physical names (cnames). This
allows conversion of Node ID values, ASIC NIC address values, or ASIC ID values.
For additional information, see the xtnid2str(8) man page.
S3016 36
Page 37

System Management
Find the physical ID for node 12
smw# xtnid2str 12
node id 0xc = 'r0s0c1n4'
Find the physical ID for nodes 0, 1, 2, and 3
smw# xtnid2str 0 1 2 3
node id 0x0 = 'r0s0c0n0'
node id 0x1 = 'r0s0c0n1'
node id 0x2 = 'r0s0c0n2'
node id 0x3 = 'r0s0c0n3'
Find Node Information Using the nid2nic Command
The nid2nic command prints the nid-to-nic address mappings, nic-to-nid address mappings, and a specific
physical_location-to-nic address and nid mappings.
For information about using the nid2nic command, see the nid2nic(8) man page.
3.4.17
Use the HSS rtr command to request routing for the HSN, to verify current route configuration, or to display
route information between nodes. Upon startup, rtr determines whether it is making a routing request or an
information request.
For more information, see the rtr(8) man page.
Request and Display System Routing
Display routing information
The --system-map option to rtr writes the current routing information to stdout or to a
specified file. This command can also be helpful for translating node IDs (NIDs) to physical ID
names.
crayadm@smw> rtr --system-map
Route the entire system
The rtr -R | --route-system command sends a request to perform system routing. If no
components are specified, the entire configuration is routed as a single routing domain based on
the configuration information provided by the state manager. If a component list (idlist) is
provided, routing is limited to the listed components. The state manager configuration further
limits the routing domain to omit disabled blades, nodes, and links and empty blade slots.
crayadm@smw> rtr --route-system
CAUTION: The rtr -R command should not be executed if the system nodes have already been booted
and are using the Aries network.
S3016 37
Page 38

System Management
CAUTION: Be sure the Aries ASCIs have been initialized using the xtbounce command and that the
HSN links have been initialized.
3.4.18 Initiate a Network Discovery Process
Use the HSS rtr --discover command to initiate a network discovery process.
crayadm@smw> rtr --discover
The discovery process must be done on the system as a whole—it cannot be applied to individual partitions.
Therefore, discovery will immediately fail if the system does not have partition p0 enabled.
The rtr --discover process should be used under the following circumstances:
● During an initial install, after successful execution of xtdiscover
● During the installation of additional cabinets in an existing installation, after the successful execution of
xtdiscover
● During an upgrade of optical cabling in a system, after all recabling is complete
The rtr --discover process is NOT required under the following circumstances:
● On any single group system at any time, even those listed above
● During a warmswap operation
See the rtr(8) man page for additional information.
3.4.19
The xtcli power up command powers up the specified rack and/or dual Aries Network Card (dANC) within the
specified partition, chassis, or list of dANCs. Racks must be in the READY state to receive power commands.
The xtcli power up command has the following form, where physIDlist is a comma-separated list of racks
or dANCs present on the system.
xtcli power up physIDlist
For more information, see the xtcli_power(8) man page.
Power Up a Rack or Dual Aries Network Card (dANC)
IMPORTANT: Change the state of the hardware only when the operating system is not running or is shut
down.
Power up dANC in r1s2c0
crayadm@smw:~> xtcli power up r1s2c0
3.4.20 Check the Status of System Components
Check the status of the system or a component with the xtcli status command on the System Management
Workstation (SMW). By default, the xtcli status command returns the status of nodes.
S3016 38
Page 39

System Management
The xtcli status command has the following form:
xtcli status [-n] [-m] [{-t type -a}] node_list
Where type may be: cc, bc, cage, node, aries, aries_lcb, pdc, or qpdc. The list must have component IDs
only and contain no wild cards.
For more information, see the xtcli(8) man page.
crayadm@smw:~> xtcli status -t node r0s0c1n1
Network topology: class 0
Network type: Aries
Nodeid: Service Core Arch| Comp state [Flags]
----------------------------------------------------------------- r0s0c1n1: - ATHE| ready [noflags|]
------------------------------------------------------------------
3.4.21 Check Compute Node High Speed Network (HSN) Connection
Use the Linux ping command to verify that a compute node is connected to the the HSN. The command must be
run from a node, not the System Management Workstation (SMW).
For more information, see the Linux ping(8) man page.
Verify that a compute node is connected to the network
nid00007:~> ping nid00015
PING nid00015 (10.128.0.16) 56(84) bytes of data.
64 bytes from nid00015 (10.128.0.16): icmp_seq=1 ttl=64 time=0.032 ms
64 bytes from nid00015 (10.128.0.16): icmp_seq=2 ttl=64 time=0.010 ms
3.4.22
Processors are connected to the high-speed interconnect network (HSN) ASIC through PCIe channels.
The xtpcimon command runs on the SMW and is started when the system is initialized.
Any PCIe-related errors are reported to stdout, unless directed to a log file.
If the optional /opt/cray/hss/default/etc/xtpcimon.ini initialization file is present, the xtpcimon
command uses the settings provided in the file.
3.4.23
The xtalive command can be used to ensure that the HSS has connectivity to the ANCCs and that, by default,
anccsysd is running and responding to events on the ANCCs.
Monitor the Health of PCIe Channels
Poll a Response from an HSS Daemon, Manager, or the Event Router
For more information, see the xtalive(8) man page.
S3016 39
Page 40

System Management
Check the state manager
crayadm@smw> xtalive -l smw -a sm s0
3.4.24 View Component Alert, Warning, and Location History
Use the xtcli comp_hist command to display component alert, warning, and location history. Either an error
history, which displays alerts or warnings found on designated components, or a location history may be
displayed.
Display the location history for component r1s0c1n2
crayadm@smw> xtcli comp_hist -o loc r1s0c1n2
For more information, see the xtcli(8) man page.
3.4.25
Use the xtshow command to display alerts and warnings. Type commands as xtshow --option_name, where
option_name is alert, warn, or noflags.
Alerts are not propagated through the system hierarchy, only information for the component being examined is
displayed. For example, invoking the xtshow --alert command for a cabinet does not display an alert for a
node. Similarly, checking the status of a node does not detect an alert on a cabinet.
Display Alerts and Warnings
Show all alerts on the system
crayadm@smw:~> xtshow --alert
Alerts and warnings typically occur while the HSS xtcli command operates; these alerts and warnings are listed
in the command output with an error message. After they are generated, alerts and warnings become part of the
state for the component and remain set until manually cleared.
For additional information, see the xtshow(8) man page.
3.4.26
When an HSS event error occurs, the related message is displayed on the SMW. The xterrorcode command
on the SMW displays a single error code or the entire list of error codes.
Display Error Codes
Display HSS error codes
crayadm@smw> xterrorcode errorcode
A system error code entered in a log file is a bit mask; invoking the xterrorcode bitmask_code_number
command on the SMW displays the associated error code.
S3016 40
Page 41

System Management
Display an HSS error code using its bit mask number
crayadm@smw> xterrorcode 131279
Maximum error code (RS_NUM_ERR_CODE) is 447
code = 207, string = 'Node Voltage Fault'
3.4.27 Display Component State Information
Use the HSS xtshow command to identify the state of components. Commands are typed as xtshow -option_name.
Identify all nodes in the disabled state
crayadm@smw:~> xtshow --disabled
L1s that are disabled...
Cages that are disabled...
r0s3: - ATHE| disabled [noflags|]
L0s that are disabled...
Nodes that are disabled...
Aries that are disabled...
AthenaISCBs that are disabled...
r0s3i0: - ATHE| disabled [noflags|]
AriesLcbs that are disabled...
The --disabled option in the preceding example shows all the disabled hardware components. For
more information, see the xtshow(8) man page.
3.4.28 Clear Component Flags
Use the xtclear command to clear system information for selected components. Type commands as xtclear
--option_name, where option_name is alert, reserve, or warn.
Clear all warnings in specified cabinet
For this example, clear all warnings in cabinet c13-2:
smw:~> xtclear --warn r1
Alerts, reserves, and warnings must be cleared before a component can operate. Clearing an alert on a
component frees its state.
For more information, see the xtclear(8) man page.
3.4.29
Flash Management on Urika-GX
HSS is responsible for flashing all devices in the Urika®-GX system via an out-of-band (OOB) mechanism. This
can be achieved via the System Management Workstation (SMW) rackfw command, which is a flash tool. The
SMW flash tool is used to flash firmware of the following components:
S3016 41
Page 42

System Management
● Intelligent Subrack Control Board (iSCB) image
● Aries Network Card Controller (ANCC) image
● Dual Aries Network Card (dANC) FPGA
The rackfw command generates a summary output similar to the following on completion of an update or query.
Flash the dANC, iSCB image and ANCC image
crayadm@smw:~> rackfw
---ANCC STATUS--------------------r0s0c0: OK
r0s0c1: OK
r0s1c0: MISMATCH
r0s1c1: OK
---ISCB STATUS--------------------r0s0i0: OK 1.0rc4
r0s1i0: MISMATCH 1.0rc3
---SUMMARY------------------------ 1 ANCCs out of date
3 ANCCs current
1 ISCBs out of date
1 ISCBs current
For more information, see the rackfw(8) man page.
3.4.30 Create and Modify the authorized_keys File Using the xtcc-ssh-keys
Command
The xtcc-ssh-keys command creates and modifies the authorized_keys file for Rack Controllers (RCs)
and Dual Aries Network Card Controllers (dANCCs) on Urika-GX systems. Due to constraints on volatile memory
storage, it does not update the authorized_keys file for the Intelligent Subrack Control Boards (iSCBs). It must
be run as root.
The xtcc-ssh-keys command takes no options. When run, it invokes the user-selected text editor (specified by
the VISUAL or EDITOR environment variables and defaulting to vi) on a file maintained by Cray HSS. This file has
the format described in sshd(8) under the heading "AUTHORIZED_KEYS FILE FORMAT". Adding a public key
to this file permits a user authenticating using the corresponding private key to connect to the RCs and dANCCs
without using a password. Once the file has been written from within the editor, the changes will take effect on
booted controllers within one minute.
For more information, see the xtcc-ssh-keys(8) man page.
3.4.31 Change the Passwords of RC, dANCCs and iSCB using the
xtccpasswd
Command
The xtccpasswd command changes the password for all Rack Controllers (RCs), Dual Aries Network Card
Controllers (dANCCs), and Intelligent Subrack Control Boards (iSCBs) on Urika-GX systems. It must be run as
S3016 42
Page 43

System Management
root. This command allows an administrator to grant access to the SMW without granting access to the controller
network nodes.
If xtccpasswd is run without options, it prompts for a new password (which will not be echoed to the screen) and
then confirms it. If the two entered passwords match exactly, a salted hash of the password is written to a file
maintained by Cray HSS. Within one minute, all booted controllers in the Urika-GX system will be using the new
password.
For more information, see the xtccpasswd (8) man page.
3.4.32
The xtdumpsys command collects and analyzes information from a Cray system that is failing or has failed, has
crashed, or is hung. Analysis is performed on, for example, event log data, active heartbeat probing, voltages,
temperatures, health faults, in-memory console buffers, and high-speed interconnection network errors. When
failed components are found, detailed information is gathered from them. To collect similar information for
components that have not failed, invoke the xtdumpsys command with the --add option and name the
components from which to collect data.
For more information, see the xtdumpsys(8) man page.
Gather Troubleshooting Information Using the xtdumpsys Command
NOTE: Only the crayadm account can execute the xtdumpsys command.
3.5 Dual Aries Network Card (dANC) Management
There are a number of components that are used to perform dANC management on Urika-GX.
dANC Power
By default, the dANCs power up when the rack is powered up. They can however be turned off and on via the
xtcli power command.
CAUTION: Powering off a dANC on a booted and routed system will route out that card out of the Aries
High Speed Network (HSN) and make all 8 nodes (served by that dANC card) unusable.
dANC uBoot
The Linux U-boot utility supports booting a Linux image on the ARM processor (located on the dANC controller)
via net boot or flash boot.
There are 3 valid boot modes for the ANCC and iSCB, as listed below:
1. Boot from flash. This is the default mode.
2. Netboot and write image to flash . This mode is used for software upgrades
3. Netboot and do not write to flash. This is a development option.
The Urika®-GX rackfw tool enables recovery mode for dANC booting. It will also allow for initializing/setting the
boot mode in NVRAM as follows:
● Set 1 of 3 ANCC boot modes listed above. If the nvRAM is uninitialized or corrupted, it is required to initialize
the nvRAM.
S3016 43
Page 44

System Management
● Set the default ANCC image location/path, or the iSCB image
● Reboot specified device (ANCC0, ANCC1, iSCB0 or iSCB1)
dANC Scrub Devices
The Urika-GX system supports scrubbing of non-volatile devices on the dANC. This includes the DANFPGA and
dANC flash devices. The DANFPGA FPGA image and flash tool is included in the dANC ARM image and is flashed
after the ARM has booted Linux.
dANC Monitoring
The dANC monitoring daemon, anccmond executes on the Dual Aries Network Card Controller (dANCC) and
performs the following functions:
● Monitors Aries, AOC and board temperatures.
● Monitors the AOC and board power.
● Sends events to HSS ERD.
● Provides threshold warnings to iSCB via an I2C bus.
● Sets up the temperature and voltages as a poll mechanism, so that the iSCB can poll for the data.
The HSS thresholds can be modified on the SMW using the HSS xtdaemonconfig command.
3.6
Analyze Node Memory Dump Using the
kdump and crash
Utilities on a Node
The kdump and crash utilities may be used to analyze the memory on any Urika®-GX compute node. The kdump
command is used to dump node memory to a file. kdump is the Linux kernel's built-in crash dump mechanism. In
the event of a kernel crash, kdump creates a memory image (also known as vmcore) that can be analyzed for
the purposes of debugging and determining the cause of a crash. Dumped image of the main memory, exported
as an Executable and Linkable Format (ELF) object, can be accessed either directly during the handling of a
kernel crash (through /proc/vmcore), or it can be automatically saved to a locally accessible file system, to a
raw device, or to a remote system accessible over the network. kdump is configured to automatically generate
vmcore crash dumps on node crashes. These dumps can be found on the node in the crash partition, mounted to
nid000XX:/mnt/crash/var/crash/datestamp/*, where XX ranges from 00-15 for a rack containing a
single sub-rack, 00-31 for a rack containing 2 sub-racks, and 00-47 for a rack containing 3 sub-racks. After
kdump completes, the crash utility can be used on the dump file generated by kdump. The xtdumpsys SMW
utility can be used to extract vmcores from the cluster and store them on the SMW for crash analysis as well.
NOTE: Cray recommends executing the kdump utility only if a node has panicked or is hung, or if a dump
is requested by Cray.
On the Urika-GX compute nodes, kdump's system facing configuration files are set to have a kdump file
stored on a local hard drive partition that is mounted as /mnt/crash so the kernel crash dumps are
store in /mnt/crash/var/crash. Urika-GX has two local HDDs. kdump stores the vmcore collections
on one of these drives. It is advised not to modify the /etc/kdump.conf or /etc/sysconfig/kdump
configuration files.
S3016 44
Page 45

System Management
Using kdump
● Starting kdump - Log on to the desired node and use the following command to start the kdump utility:
$ service kdump start
● Stopping kdump - Log on to the desired node and use the following command to stop the kdump utility:
$ service kdump stop
● Checking the status of kdump - Log on to the desired node and use the following command to check the
status of the kdump utility:
$ service kdump status
For more information, see the kdump(8) and crash(8) man pages.
3.7
The Cray Lightweight Log Management (LLM) system is the log infrastructure for Cray systems and must be
enabled for systems to successfully log events. At a high level, a library is used to deliver messages to rsyslog
utilizing the RFC 5424 protocol; rsyslog transports those messages to the SMW and places the messages into
log files.
By default, LLM has a log trimming mechanism enabled called xttrim.
3.8
A number of CLI scripts can be used to control node power. In addition, CLI scripts and the Nagios UI can be
used to monitor node status on the Urika-GX system.
The command described in this section all need to be executed on the SMW as root.
Cray Lightweight Log Management (LLM) System
Urika-GX Node Power Management
Start Up a Single Node
Use the ux-nid-power-on command to start up a node. For example, use the following command to start up
node 47:
$ ux-nid-power-on 47
Start Up All Nodes
Use the ux-nid-power-on script to start up all the nodes at once. For more information, see the ux-nidpower-on man page
# ux-nid-power-on
Stop a Single Node
Ensure that the analytics services are stopped on the node and Lustre is unmounted. Use the ux-nid-poweroff command to stop a running node. For example, use the following command to stop node 47:
S3016 45
Page 46

System Management
# ux-nid-power-off 47
Stop All Nodes
Ensure that the analytics services are stopped on the node and Lustre is unmounted. Use the ux-nid-poweroff script to stop all the nodes at once.
# ux-nid-power-off
For more information, see the ux-nid-power-off man page.
Check the Status of Nodes
Node status can be viewed using the following mechanisms:
● By using the xtcli status command. For more information, see the xtcli(8) man page
● By using the ux-nid-status command. For more information, see the ux-nid-status and ux-nid-
cobbler-status man pages.
● By using the Nagios UI at http://machine-smw/nagios/
3.9
Power Up the Urika-GX System
Prerequisites
This procedure requires root access. The examples of this procedure assumes that the instructions are being
carried out on a 3 sub-rack (48 node) system.
About this task
The instructions documented in the procedure can be used for powering up the Urika®-GX system. For detailed
information, or for troubleshooting issues, please contact Cray Support.
Procedure
1. Physically power on the Power Distribution Units (PDUs).
2. Turn on the System Management Workstation (SMW).
It is recommended to wait a few minutes to allow the RC to boot and to verify that the RC has been turned on.
This can be achieved by executing the following command:
root@smw:~ xtalive -l l1
The expected response was received.
The statement: "The expected response was received" indicates that the RC has been turned on.
3. Ensure that alert or reserved is not displayed in the Flags column of results when the following
command is executed:
root@smw:~ xtcli status -t l0 s0
S3016 46
Page 47

System Management
If alerts are discovered and cleared, wait a few seconds and execute the xtcli -t l0 s0 command again
to ensure the alerts did not return. If they do return, contact Cray Support. If the errors do not return, the
underlying transient problem can be ignored.
If alerts are discovered and cleared, wait a few seconds and execute the xtcli -t l0 s0 command again
to ensure the alerts did not return. If they do return, contact Cray Support. If the errors do not return, the
underlying transient problem can be ignored.
4. Power up the Aries Network Card Controllers (ANCCs) by executing the following command:
root@smw:~ xtcli power up s0
5. Verify that the dANCs are in the 'ready' state. Also ensure that alert or reserved is not displayed in the
Flags column of results when the following command is executed:
root@smw:~ xtcli status -t l0 s0
if alert or reserved is displayed in the Flags column of results when the preceding command is
executed, use the xtclear_alert or xtclear_reserve command to clear those statuses.
6. Ensure that the ANCCs are powered on by executing the command:
root@smw:~ xtalive
All 6 expected responses were received.
The above response may vary, depending on the number of sub-racks in the system. The previous example
displays a response the system would return if there are 3 sub-racks in the rack.
7. Become the crayadm user.
root@smw:~ su - crayadm
8. Initialize the High Speed Network (HSN) by executing the command:
crayadm@smw:~ xtbounce --linktune s0
This may step a few minutes to finish executing.
9. Use the HSS rtr command to request routing for the HSN
crayadm@smw:~ rtr -R s0
10. Exit to become the root user again.
crayadm@smw:~ exit
11.
12. Power on all the compute nodes of the system by executing the ux-nid-power-on script.
For more information, see the ux-nid-power-on man page.
root@smw:~ ux-nid-power-on all
Once all the node IDs have reported that they are up, wait for 5 or so minutes. The login nodes take longer
than the rest of the nodes.
S3016 47
Page 48

System Management
13. Optional: Start the tenant VMs. For more information, see the ux-tenant-start man page.
14. Resolve any issues related to the Romana service.
root@smw:~ main_romana_df_gateway.yml
15. Verify that the compute nodes have been turned on.
root@smw:~ xtcli status s0
All the nodes should send a response. If a response is not received from all the nodes, do not proceed.
16. Execute the following command:
root@smw:~ pall uptime |sort
Once all the node IDs have reported that they are up, wait for 5 or so minutes. The login nodes take longer
than the rest of the nodes.
17. Mount Lustre
root@smw:~ pall mount /mnt/lustre
Here pall is an alias for pdsh -w and should be configured
in /etc/profile.d/smw_deploy_profile.sh
18. Confirm that the required nodes have a mount point by executing the following command:
root@smw:~ pall df -k |grep lustre |sort
19. Start up the analytic applications using the urika-start script.
For more information, see the urika-start man page.
root@smw:~ urika-start
This starts up all the analytic applications installed on the system.
20. Pause for 5 minutes or so.
It is important to allow Hadoop to perform the required set up before proceeding. Hadoop will initially be in
safe mode when it starts.
21. Verify that the analytic services have started.
root@smw:~ urika-inventory
22. Confirm services are up on all the expected nodes and that all processes are listed as online when the
urika-state command is executed.
root@smw:~ urika-state
23. Optional: Check the general health of the system.
root@smw:~ urika-check-platform
S3016 48
Page 49

System Management
3.10 Power Down the Urika-GX System
Prerequisites
Instructions in this procedure require root access. This procedure assumes that the instructions are being carried
out on a 3 sub-rack system.
About this task
The instructions documented in the procedure should be following in the order listed to power off the Urika®-GX
system. For detailed information, or for troubleshooting issues, please contact Cray Support. It is assumed that
the instructions in procedure are being carried out on a 48 node system. Please use node IDs according to the
actual system configuration.
Procedure
1. Log on to the System Management Workstation (SMW) as root.
2. Power down the analytic applications using the urika-stop script.
root@smw:~ urika-stop
For more information, see the urika-stop man page.
3. Execute the urika-state command to ensure that analytic applications have shut down.
The HA Proxy service may still be running.
root@smw:~ urika-state
For more information, see the urika-state man page.
4. Unmount all external Lustre mounts.
This may not be required if /mnt/lustre or a Sonexion storage system are not used. For more information,
contact support.
root@smw:~ pall umount /mnt/lustre
5. Optional: Log on to a storage node (nid00031 on a 3 sub-rack system), switch to the lustre-utils
directory and stop Lustre if using a Direct Attached Lustre (DAL) storage system.
This step is needed only if a Direct Attached Lustre (DAL) is used. Do not perform this step if using the
Sonexion storage system.
root@nid00031:~ cd /etc/opt/cray/lustre-utils
root@nid00031:~ ./lustre_control stop -a
6. Log on to the SMW.
7. Stop all the tenant VMs.
S3016 49
Page 50

System Management
root@smw:~ ux-tenant-status -R -F name,state|grep -v =notfound|awk \
'{print $1}'|awk -F= '{print $2}'|xarg
8. Execute the ux-nid-power-off command to power off all the nodes.
root@smw:~ ux-nid-power-off all
For more information about the ux-nid-power-off command, see the ux-nid-power-off man page.
9. Log on to the SMW and execute the capmc node_status command.
It is important to wait until all the nodes are in the off state before proceeding. This process takes around
5-10 minutes. The capmc command should be executed on a different shell environment than that used to
execute the ux-nid-power-off command. if a new shell is used for executing the ux-nid-power-off
command, the /root/admin.openrc file would need to be sourced again, as shown in the previous step.
root@smw:~ capmc node_status
10. Ensure that [noflags|] is displayed in the Flags column of the results when the following commands are
executed:
root@smw:~ xtcli status -t node s0
Network topology: class 0
Network type: Aries
Nodeid: Service Core Arch| Comp state [Flags]
--------------------------------------------------------------------------------
--- r0s0c0n0: - ATHE| off [noflags|]
r0s0c0n1: - ATHE| off [noflags|]
r0s0c0n2: - ATHE| off [noflags|]
r0s0c0n3: - ATHE| off [noflags|]
r0s0c0n4: - ATHE| off [noflags|]
r0s0c0n5: - ATHE| off [noflags|]
r0s0c0n6: - ATHE| off [noflags|]
r0s0c0n7: - ATHE| off [noflags|]
r0s0c1n0: - ATHE| off [noflags|]
...
11. Power down the dual Aries Network Cards (dANCs) by executing the following command:
root@smw:~ xtcli power down s0
12. Ensure that [noflags|] is displayed in the Flags column of the results when the following command is
executed
root@smw:~ xtcli status -t aries s0
Network topology: class 0
Network type: Aries
Nodeid: Service Core Arch| Comp state [Flags]
--------------------------------------------------------------------------------
--- r0s0c0n0: - ATHE| off [noflags|]
r0s0c0n1: - ATHE| off [noflags|]
r0s0c0n2: - ATHE| off [noflags|]
r0s0c0n3: - ATHE| off [noflags|]
r0s0c0n4: - ATHE| off [noflags|]
r0s0c0n5: - ATHE| off [noflags|]
r0s0c0n6: - ATHE| off [noflags|]
S3016 50
Page 51

System Management
r0s0c0n7: - ATHE| off [noflags|]
r0s0c1n0: - ATHE| off [noflags|]
...
13. Turn off the SMW.
root@smw:~ shutdown -h
14. Ensure that Sonexion is unmounted before shutting down breakers on rack, if Lustre is installed on the same
rack.
15. Physically power down the rack by turning off the Power Distribution Units (PDUs).
3.11
Urika-GX features a number of scripts for controlling and monitoring installed analytic applications. The
commands need to be run as root from the SMW.
Urika-GX CLI Commands for Managing Services
urika-start
The urika-start command is used to start analytic services on the Urika-GX system. This command can be
used to start services on one node, a number of nodes, or on all the system nodes. To specify more than one
node, specify the node IDs separated by commas. The list of services that are started using this command
depends on the service mode (default or secure) that the system is running in. This command starts all the
running services (supported in the current service mode) if used without any options. To start a specific service,
use the -s or --service option to specify the name of that service.
Using the urika-start command without the -s option will not start the Docker or Spark Thrift Server services.
Use the -s option to start these services, as shown below:
urika-start -s spark_thrift
urika-start -s docker
CAUTION: Before starting the Spark History server, it is required to start the following services in the
order listed:
1. HDFS NameNode
2. HDFS DataNode
For more information, see the urika-start(8) man page.
Start all the services on all the nodes
# urika-start
Start all the services on a particular node
S3016 51
Page 52

System Management
# urika-start --limit nid00014
Start all the services on a few nodes.
# urika-start --limit nid00014, nid00015
Start a particular service (HUE in this example) on all the nodes:
# urika-start --service hue
Start a particular service (HUE in this example) on a particular node:
# urika-start --service hue
urika-stop
The urika-stop command is used to stop analytic services running on one node, a number of nodes or on all
the Urika-GX system nodes. To specify more than one node, specify the node IDs separated by commas. To stop
a specific service, use the -s or --service option to specify the name of that service. This command stops all
the running analytic services if used without any options.
For more information, see the urika-stop man page.
Stop all the running services on all the nodes.
# urika-stop
Stop all the running services on a particular node.
# urika-stop --limit nid00014
Stop all the services on a few nodes.
# urika-stop --limit nid00014, nid00015
Stop a particular service (Spark in this example) on all the nodes:
# urika-stop --service spark
Stop a particular service (Spark in this example) on a particular node.
# urika-stop --service spark
S3016 52
Page 53

System Management
urika-inventory
The urika-inventory command displays the list of analytic services running on each node, as well as the IP
address of each node. For more information, see the urika-inventory(8) man page.
Display the list of services running on each Urika-GX node:
# urika-inventory
urika-rev
The urika-rev command displays the version of deployed analytic components on Urika-GX nodes and checks
if a different version of a software component is installed on individual nodes.
For more information, see the urika-rev(8) man page.
Display the version components deployed on Urika-GX:
# urika-rev
urika-state
The urika-state command displays the status of Urika-GX analytic services and the service mode the system
is operating in.
For more information, see the urika-state(8) man page.
Display status of services:
# urika-state
Sequence of Execution of Scripts
The urika-state command can be used to view the state services running on Urika-GX. Use this command to
ensure that the following dependencies are met:
● Before executing the start -s mesos_master command, ensure that the ZooKeeper service is up and
running.
● Before executing the stop -s mesos_master command, ensure that the Marathon and Mesos slave
services have already been stopped
● Before executing the start -s mesos_slave command, ensure that the ZooKeeper and Mesos Master
services are up and running.
In addition, it is recommended to stop the Mesos slave service before stopping Marathon via the urika-stop -
s marathon command. The urika-stop -s mesos_slave command does not have any dependencies,
though any running tasks would be lost. Therefore, it is recommended to ensure that all the existing jobs finish
running before executing the stop -s mesos_slave command.
S3016 53
Page 54

System Management
Additional Scripts
● ux-nid-deploy - Deploys a new image to one or more nodes. For more information, see the ux-niddeploy man page.
● ux-nid-undeploy - Wipes out all data from the node. For more information, see the ux-nid-undeploy
man page.
● ux-nid-partition-add - Partitions a node. For more information, see the ux-nid-partition-add man
page.
● ux-nid-partiition-view - Displays node partitions. For more information, see the ux-nid-
partiition-view man page.
3.12
● Multihoming - Urika-GX compute nodes can be multihomed between the Aries HSN and the operational
● Remote HDFS Access - HDFS can be set up on Urika-GX to enable external access.
For assistance in enabling the aforementioned features, please contact Cray Support.
3.13
Remote HDFS Remote Access and Multihoming on Urika-GX
network.
Update the InfluxDB Data Retention Policy
Prerequisites
This procedure requires root privileges. Before performing this procedure, use the urika-state command to
ensure that the system is operating in the service mode that supports using InfluxDB. For more information, see
the urika-state man page and refer to Urika-GX Service Modes on page 177.
About this task
The data retention policy for InfluxDB defaults to infinite, i.e. data is never deleted. As a result, Spark and Hadoop
Grafana dashboards may take longer to load and InfluxDB may take up more space than necessary. To reduce
the amount of space being used by InfluxDB, the data retention policy for each database needs to be reduced, as
described in this procedure. Reducing the data retention policy for Spark and Hadoop databases can reduce the
load time of the Spark and Hadoop Grafana dashboards.
Procedure
1. Log on to login2 and become root.
2. Switch to the /var/lib/influxdb/data directory.
# cd /var/lib/influxdb/data
3. Use the du command to show how much space being used.
S3016 54
Page 55

System Management
The sizes below are shown as examples. Actual sizes on the system may vary.
$ du -sh *
14G Cray Urika GX
1.5G CrayUrikaGXHadoop
906M CrayUrikaGXSpark
21M _internal
#
4. Connect to InfluxDB to view the current data retention policy.
# /bin/influx
Visit https://enterprise.influxdata.com to register for updates, InfluxDB
server management, and monitoring.
Connected to http://localhost:8086 version 0.12.2
InfluxDB shell 0.12.2
> show retention policies on "Cray Urika GX"
name duration shardGroupDuration replicaN default
default 0 168h0m0s 1 true
5. Update the data retention policy according to requirements.
In this example the data retention duration is changed from 0 (forever) to 2 weeks (504 hours).
> alter retention policy default on "Cray Urika GX" Duration 2w
> show retention policies on "Cray Urika GX"
name duration shardGroupDuration replicaN default
default 504h0m0s 24h0m0s 1 true
> exit
The change will take a while to be applied. The default is 30 minutes.
6. Verify that the data retention change has taken effect
# du -sh *
3G Cray Urika GX
1.5G CrayUrikaGXHadoop
906M CrayUrikaGXSpark
21M _internal
3.14
The list of services available for use depends on the security mode the system is running under. For more
information, refer to Urika-GX Service Modes on page 177.
Table 9. Urika-GX Service to Node Mapping (2 Sub-rack System)
Service to Node Mapping
Node ID(s) Service(s) Running on Node /Role of Node
nid00000
● ZooKeeper
● ncmd
● Mesos Master
● Marathon
S3016 55
Page 56

System Management
Node ID(s) Service(s) Running on Node /Role of Node
● Primary HDFS NameNode
● Hadoop Application Timeline Server
● Collectl
● nrpe
● kubelet
nid000[01-07, 09-13, 17-29]
nid00008
● Collectl
● Mesos Slave
● Data Node
● YARN Node Manager (if running)
● nrpe
● kubelet
● ZooKeeper
● Secondary HDFS NameNode
● Mesos Master
● Oozie
● Hive Server2
● Spark Thrift Server
● Hive Metastore
● WebHCat
● Postgres database
● Marathon
● YARN Resource Manager
● Collectl
● nrpe
● kubelet
nid00014 (Login node 1)
● HUE
● HAProxy
● Collectl
● Urika-GX Applications Interface UI
● Cray Application Management UI
● Jupyter Notebook
● Service for flexing a YARN cluster
● Documentation and Learning Resources UI
● nrpe
S3016 56
Page 57

System Management
Node ID(s) Service(s) Running on Node /Role of Node
● kubelet
● Kubernetes Controller
nid00015, nid00031 (I/O nodes) These are nodes that run Lustre clients and nrpe
nid00016
nid00030 (Login node 2)
● ZooKeeper
● Mesos Master
● Marathon
● Hadoop Job History Server
● Spark History Server
● Collectl
● nrpe
● kubelet
● HUE
● HA Proxy
● Collectl
● Service for flexing a YARN cluster
● Grafana
● InfluxDB
● nrpe
● kubelet
Table 10. Urika-GX Service to Node Mapping (3 Sub-rack System)
Node ID(s) Service(s) Running on Node /Role of Node
nid00000
nid00001-nid00015, nid00017nid00029, nid00033-nid00045
● ZooKeeper
● ncmd
● Mesos Master
● Marathon
● Primary HDFS NameNode
● Hadoop Application Timeline Server
● Collectl
● nrpe
● kubelet
● Collectl
● Mesos Slave
S3016 57
Page 58

System Management
Node ID(s) Service(s) Running on Node /Role of Node
● Data Node
● YARN Node Manager (if running)
● nrpe
● kubelet
nid00016
nid00030 (Login node 1)
● ZooKeeper
● Mesos Master
● Marathon
● Hadoop Job History Server
● Spark History Server
● Collectl
● nrpe
● kubelet
● HUE
● HA Proxy
● Collectl
● Urika-GX Applications Interface UI
● Jupyter Notebook
● Service for flexing a YARN cluster
● Documentation and Learning Resources UI
● nrpe
● kubelet
● Kubernetes Controller
nid00031, nid00047 (I/O nodes) These are nodes that run Lustre clients
● kubelet
nid00032
● ZooKeeper
● Secondary NameNode
● Mesos Master
● Oozie
● Hive Server2
● Hive Metastore
● WebHcat
● Postgres database
● Marathon
● YARN Resource Manager
S3016 58
Page 59

System Management
Node ID(s) Service(s) Running on Node /Role of Node
● Collectl
● Spark Thrift Server
● nrpe
● kubelet
nid00046 (Login node 2)
For additional information, use the urika-inventory command as root on the SMW to view the list of services
running on node, as shown in the following example:
# urika-inventory
For more information, see the urika-inventory man page.
3.15
Image Management with Docker and Kubernetes
● HUE
● HA Proxy
● Collectl
● Grafana
● InfluxDB
● Service for flexing a YARN cluster
● nrpe
● kubelet
About Docker
Docker provides the ability to package and run an application in a loosely isolated environment called a container.
The isolation and security enables running many containers simultaneously on a given host. Because of the
lightweight nature of containers, users can run more containers on a given hardware combination than if using
virtual machines.
Images shipped with the system are managed by Docker when Urika-GX is operating under the default service
mode. The SMW hosts Urika-GX's container repository, which is a container itself and can only host Cray
developed containers currently.
NOTE: Building and managing new Docker images is currently not supported on Urika-GX.
For more information, visit https://www.docker.com.
About Kubernetes
Kubernetes is used for automating deployment, scaling and management of containerized applications. It groups
containers that make up an application into logical units for easy management and discovery. It performs
container management tasks, such as, running containers across many different machines, scaling up or down by
S3016 59
Page 60

System Management
adding or removing containers when demand changes, keeping storage consistent with multiple instances of an
application, distributing load between the containers and launching new containers on different machines if
something fails.
On Urika-GX, Kubernetes is used to manage containers in the secure service mode.
NOTE: Currently, Kubernetes supports only Spark images on Urika-GX.
For more information, visit https://kubernetes.io/.
About the Cray Spark Image
In order to run Spark on Kubernetes, Urika-GX ships with customized Spark images, which are based on the
Spark version used on the system.
3.15.1 Execute Spark Jobs on Kubernetes
Spark jobs run inside containers, which are managed via Kubernetes on the Urika-GX system. This section
provides some examples for executing Spark jobs, retrieving output, and viewing logs etc.
The system needs to be running in the secure mode and the user needs to be logged on a login node to run the
examples shown in this section.
Running a Spark Pi Example Job
The following examples shows how to run a simple Spark Pi job inside a container. It uses
spark.app.name as the Spark job's name.
$ spark-submit --class org.apache.spark.examples.SparkPi \
--conf spark.app.name=spark-pi \
local:///opt/spark/examples/target/scala-2.11/jars/sparkexamples_2.11-2.2.0-k8s-0.5.0.jar
The path to the JAR file must be relative to the path inside the container, not the path that exists
on the system. Inside the container, the Spark home directory is /opt/spark instead
of /opt/cray/spark2/default.
The preceding command produces output similar to the following (only a portion of the output is
shown below for brevity):
2018-02-26 16:16:47 INFO HadoopStepsOrchestrator:54 - Hadoop Conf
directory: /etc/hadoop/conf
2018-02-26 16:16:47 INFO HadoopConfBootstrapImpl:54 HADOOP_CONF_DIR defined. Mounting Hadoop specific files
2018-02-26 16:16:48 WARN NativeCodeLoader:62 - Unable to load
native-hadoop library for your platform... using builtin-java
classes where applicable
2018-02-26 16:16:48 INFO LoggingPodStatusWatcherImpl:54 - State
changed, new state:
pod name: spark-pi-1519683406605-driver
namespace: username
labels: spark-app-selector ->
spark-027d506894bd4b2ca86692f03f9fab5a, spark-role -> driver
pod uid: bceaf8b2-1b42-11e8-8b39-001e67d33475
creation time: 2018-02-26T22:16:48Z
service account name: spark
volumes: spark-local-dir-0-tmp, hadoop-properties, spark-token-
S3016 60
Page 61

System Management
pxz79
node name: N/A
start time: N/A
container images: N/A
phase: Pending
status: []
.......
The output of the Spark Driver can be viewed by executing kubectl logs pod_name and
looking at the pod's logs. The pod's name is displayed near the top of the console output, as
shown in the preceding example. Execute the kubectl logs pod_name command and grep
the output, as shown below:
$ kubectl logs spark-pi-1519683406605-driver | grep "is roughly"
Pi is roughly 3.1351356756783786
Spark Executor pods are cleaned up and deleted after they finish running. Therefore, their output
is not accessible.
Running a Spark Pi Example Job
A Pyspark pi example job is very similar to a Scala Spark PI, but information is specified slightly
differently. If there are any JAR files, they should be provided via the --jars flag.
$ bin/spark-submit --conf spark.app.name=pyspark-pi \
--jars local:///opt/spark/examples/target/scala-2.11/jars/sparkexamples_2.11-2.2.0-k8s-0.5.0.jar \
local:///opt/spark/examples/src/main/python/pi.py
Execute the kubectl logs pod_name command and grep the output, as shown below:
# kubectl logs pyspark-pi-1519684161476-driver | grep "is roughly"
Pi is roughly 3.141600
Using HDFS
The HADOOP_CONF_DIR parameter will automatically be set to the appropriate value for the current user during
Spark start up.
How to Run Jobs and Use the Resource Staging Server
Simply provide the location of the Spark jar and files on the local file system and they will be loaded into the Spark
Resource Staging Server so that resources will be available inside the Spark container.
$ bin/spark-submit --class TriangleCounts --conf
spark.app.name=spark-triangles \
/home/users/builder/nid00006/workspace/socrates-cactus-spark-tests/
target/scala-2.11/spark-tests_2.11-1.0.jar \
/user/builder/datasets/cactus-spark-triangles/small-triangles.txt
Check the results using the pod name.
S3016 61
Page 62
System Management
$ kubectl logs spark-triangles-1520878896538-driver | grep "riangles:"
numTriangles: 10624230
Number of triangles: 3541410
Resource Configuration for Spark Jobs
The following Spark configuration settings may be used to control the amount of resources that Spark will request
from Kubernetes for any job launched using spark-submit under the secure service mode, i.e., under
Kubernetes:
Table 12. Spark Configuration Settings and their Default Values
Configuration Setting Default Value Notes
spark.executor.instances
spark.executor.cores
spark.executor.memory
spark.driver.cores
spark.driver.memory
5 Number of Spark executor
containers that will be
launched to provide job
execution under
Kubernetes
1 Number of cores
requested per executor
96g Amount of memory
requested per executor
1
16g Amount of memory
Number of cores
requested for the driver
This should be increased if
a job does a lot of work in
the driver e.g.
aggregations, result
collection
requested per driver
CAUTION: Please be aware that due to Kubernetes's service scheduling mechanism, there are always
some services running on all the nodes, using fractional CPU cycles. This may block any requests that
attempt to use the maximum number of cores on the system because a small fraction of those cores is
already allocated.
If a job is not showing any progress, find out the current status of the associated Kubernetes pod by
running kubectl describe pod pod-name. If there are insufficient resources to launch a job, the
system will return a message similar to the following at the end of the output:
Warning FailedScheduling 55s (x8 over 1m) default-scheduler 0/16 nodes are available: 1
PodToleratesNodeTaints, 16 Insufficient cpu.
S3016 62
Page 63

System Management
3.15.2 Multi-tenant Spark Thrift Server on Urika-GX
Urika-GX enables tenants to have a tenant-isolated Hive MetaStore, in addition to the Spark Thrift Server. The
metastore allows schema to be shared between spark-sql shells and Spark Thrift clients. The Spark Thrift
Server is an 'on demand' service, meaning that users launch it as required and stop it when it is not needed. The
tenant metastore is a pod comprised of two containers running within the tenant's namespace. One of these
containers runs the Hive metastore service, while the other runs a Postgres database.
NOTE:
The metastore allows schema to be shared between spark-sql shells and Spark Thrift clients
Hive Metastore Management
Tenant specific metastores are created as part of the tenant creation process. Tenants can use the following
commands within their VM to interact with the metastore:
● check-metastore - Checks the status of the metastore, indicates to the user whether or not it is running
and the IP address of the metastore.
● start-metastore - Starts the tenant metastore, if there is not one already running.
● stop-metastore - Stops the tenant metastore service.
CAUTION: The metastore must be running in order for the Thrift Server to launch successfully.
Spark Thrift Server Management
Tenants can use the following commands within their VM to interact with the Spark Thrift Server:
● start-thriftserver - Configures the tenant specific Spark Thrift Server and launches the Spark Thrift
Server spark job in the tenant's Kubernetes namespace
● stop-thriftserver - Stops the tenant specific Spark Thrift Server job and does requisite cleanup.
The Spark Thrift Server is a shared service within a tenant, therefore only one Spark Thrift Server instance per
tenant should be running.
Limitations
The current version of Spark on Urika-GX lacks support for long running spark jobs with secure HDFS. As a
result, a Spark Thrift Server instance can only run as long as the HDFS delegation tokens are valid for. Currently
this period is 1 day. After this time, the Spark Thrift Server instance can no longer query data in secure HDFS. If
this happens, the Spark Thrift Server instance must be restarted using the stop/start commands above.
Authentication/Authorization
Tenant users authenticate to the Spark Thrift Server using their LDAP credentials. The Spark Thrift Server relies
on tenant membership for authorizing users. Therefore, if a user is added as a member to a tenant via the ux-
tenant-add-user command, the user will be automatically granted access to the Spark Thrift Server. No
separate authorization mechanisms are necessary.
Administering Tenant Spark Thrift Server Components
It may prove useful for a system administrator to be able to check the status of a tenants Spark Thrift Server
and/or metastore. They may do so using kubectl commands from the login node.
To see the state of the Kubernetes POD containing the Spark Thrift Server driver:
S3016 63
Page 64

System Management
root@login1# kubectl get pods -n TENANT-VM thrift-server-TENANT-VM --show-all
To see if the Spark Thrift Server has fully initialized, assuming the previous command showed the POD was
"Running"
root@login1# kubectl logs -n TENANT-VM thrift-server-TENANT-VM | grep 'Started
ThriftHttpCLIService
To see the state of the Kubernetes POD containing the Metastore server:
root@login1# kubectl get pods -n <TENANT-VM> metastore-TENANT-VM --show-all
The status should be 'Running' and the Status '2/2' (indicating both containers were successfully started).
To see if the Metastore server has fully initialized, assuming the previous command showed the POD was
"Running"
root@login1# kubectl logs -c hive -n <TENANT-VM> metastore-TENANT-VM | grep
'schemaTool completed'
S3016 64
Page 65

System Monitoring
4
System Monitoring
4.1 System Monitoring Tools
Urika-GX provides many tools for monitoring system components, resources and services.
Table 13. Monitoring Tools
Monitoring Tool Monitored Component/Service/Resource
HSS Helps monitor physical system components, such as
PCIe channels and Dual Aries Network Card (dance).
iSCB Helps monitor sub-rack level attributes, such as power
supply, amperage, fan status, and temperature info are
monitored via the iSCB.
CAUTION: iSCB CLI commands other than
the status command should NOT be
executed on the Urika-GX system, unless
advised by Cray Support. For more
information, contact Cray support.
The capmc, ux-nid-cobbler-status and ux-
nid-status commands
Nagios Helps monitor:
Grafana Provides information about utilization of system
urika-state command Retrieves the status of analytic applications.
S3016 65
Helps monitor node status.
● CPU - per node and aggregated
● Memory - per node and aggregated
● Storage
○ Lustre
○ SSD and HDD per node and aggregated
● Management, operational and Aries network
bandwidth used
● Node status
resources, such as CPU, memory, I/O, etc.
Page 66

System Monitoring
4.2 Monitor Resource Utilization and Node Status Using Nagios
Prerequisites
● As an admin, run the following command to add user nagios to the tenant VM before using Nagios:
# ux-tenant-add-user -u nagios -s /bin/bash tenant
● Ensure that the Nagios service is running.
About this task
Nagios is used on Urika-GX to monitor:
● Node status
● Usage of:
○ CPU (per node and aggregated)
○ Memory (per node and aggregated)
○ Bandwidth (per node and aggregated) of management, HSS, operational networks and the Aries High
Speed Network (HSN) network. Also provides per node and aggregated bandwidth for the Aries High
Speed network.
○ Lustre, HDD and SSD storage (per node and aggregated)
In addition, Nagios can be used on Urika-GX to create and send alert notifications.
For more information, refer to Tenant Management on page 189
Procedure
1. Access the Nagios UI by pointing a browser at http://machine-smw/nagios/
2. Enter crayadm as the user name and initial0 as the password to log on to the UI.
These are the default credentials for logging on to the Nagios UI on Urika-GX.
If the system is switched to the secure service mode, the administrator will need to run the following
command to add user nagios to the tenants:
# ux-tenant-add-user -u nagios -s /bin/bash
3. Use the Nagios UI menu options to perform monitoring tasks, such as viewing reports and logs, as well as
node, system, storage and network status.
The following figure displays the Services page of the Nagios UI. The chart icon in the Service column can
be used for viewing metrics/statistical data, exporting page content as PDFs, viewing reports etc.
S3016 66
Page 67
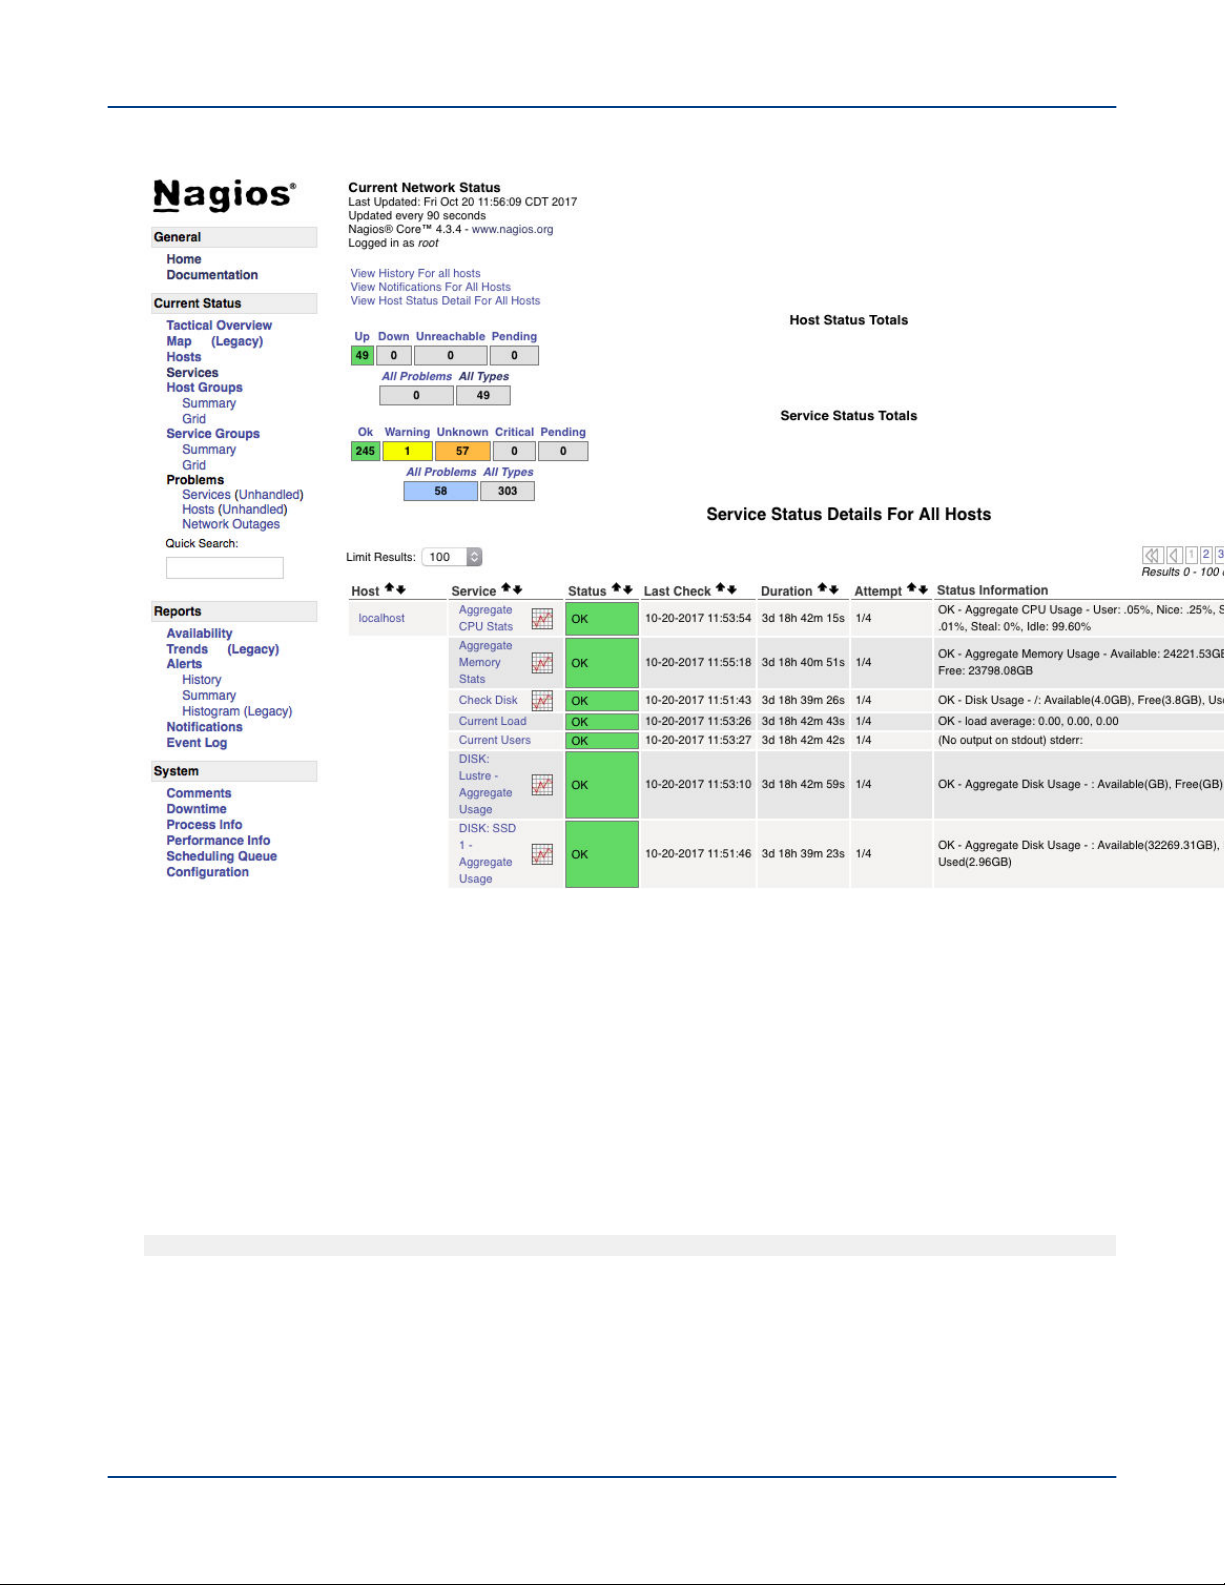
Figure 3. Nagios Services Page
System Monitoring
Select the Documentation link on the Nagios UI and visit and https://www.nagios.org and pnp4nagios.org for
more information.
4.2.1 Configure SSL/TLS for Nagios Core
Prerequisites
● This procedure requires root privileges.
● Ensure that the mod_ssl package is installed on the system. If it is not, install it by executing the following as
root on the SMW:
# yum install -y mod_ssl
About this task
This procedure describes how to configure the Nagios Core server to use certificates for SSL/TLS. It can also to
be used for troubleshooting SSL/TLS connection related issues.
S3016 67
Page 68

System Monitoring
Procedure
1. Log on to the SMW as root.
All of the remaining steps will be performed from within the root user's home directory to ensure the created
files are not accessible to anyone except the root user.
2. Switch to the user's home directory.
# cd ~
3. Generate a private key file.
# openssl genrsa -out keyfile.key 2048
4. Generate certificate request file.
# openssl req -new -key keyfile.key -out certrequest.csr
Press the Enter key for all the prompts, but enter hostname-smw for Common Name.
In the example, notice that core-013.domain.local has been used, which means that this is the address
to use when the Nagios Core server is accessed via the web browser, otherwise the system will return
warnings in the web browser.
You are about to be asked to enter information that will be incorporated
into your certificate request.
What you are about to enter is what is called a Distinguished Name or a DN.
There are quite a few fields but you can leave some blank
For some fields there will be a default value,
If you enter '.', the field will be left blank.
----Country Name (2 letter code) [XX]:AU
State or Province Name (full name) []:NSW
Locality Name (eg, city) [Default City]:Sydney
Organization Name (eg, company) [Default Company Ltd]:My Company Pty Ltd
Organizational Unit Name (eg, section) []:
Common Name (eg, your name or your server's hostname) []:core-013.domain.local
Email Address []:
Please enter the following 'extra' attributes
to be sent with your certificate request
A challenge password []:
An optional company name []:
As it can been see above, a password was not supplied as it is not necessary.
5. Sign the certificate request.
At this point, the newly created certificate request needs to be signed by a CA.
● Use a trusted CA company
If the certificate is to be obtained from a trusted company like VeriSign, send them a copy of the certificate
request, which can be viewed by executing the following command:
cat certrequest.csr
S3016 68
Page 69

System Monitoring
Provide the CA with everything returned by the above, including the following lines:
-----BEGIN CERTIFICATE REQUEST----- and -----END CERTIFICATE REQUEST-----
After receiving the signed certificate, copy the certificate into a new file called certfile.crt. The
certificate received will contain a lot of random text. Paste that into the new file, which can be modified
using any editor, such as vi.
vi certfile.crt
Paste everything, including the following lines:
-----BEGIN CERTIFICATE----- and -----END CERTIFICATE-----
Save the file and close the editor. Proceed to step 6.
● Use a Microsoft Windows CA - If Microsoft Windows CA is to be used to sign the certificate request,
follow the steps in https://support.nagios.com/kb/article.php?id=597 to obtain acertfile.crt file and
then proceed to the step 6.
● Self sign the certificate - Self-sign the certificate by executing the following command:
# openssl x509 -req -days 365 -in certrequest.csr -signkey keyfile.key -out
certfile.crt
This should produce output saying that the signature was OK and that it retrieved the private key. Selfsigning will result in 'connection not secure' warnings, as expected. Add an exception for this
certificate.
6. Copy the certificate files to the correct location and set permissions
# cp certfile.crt /etc/pki/tls/certs/
# cp keyfile.key /etc/pki/tls/private/
# chmod go-rwx /etc/pki/tls/certs/certfile.crt
# chmod go-rwx /etc/pki/tls/private/keyfile.key
The SSL file might already exist in /etc/apache2/2.2/conf.d/ssl.conf. If this is the case, ignore the
following commands:
# cp /etc/apache2/2.2/samples-conf.d/ssl.conf /etc/apache2/2.2/conf.d/
# chmod +w /etc/apache2/2.2/conf.d/ssl.conf
7. Update the Apache configuration.
a. Open the /etc/httpd/conf.d/ssl.conf file.
# vi /etc/httpd/conf.d/ssl.conf
b. Locate these lines.
SSLCertificateFile /etc/pki/tls/certs/certfile.crt
c. Modify the preceding lines to:
SSLCertificateKeyFile /etc/pki/tls/private/keyfile.key
d. Save the file.
S3016 69
Page 70

System Monitoring
8. Restart the Apache web server for the new certificate key to be used.
===== CentOS 5.x / 6.x | RHEL 5.x / 6.x | Oracle Linux 5.x / 6.x =====
# service httpd restart
===== CentOS 7.x | RHEL 7.x | Oracle Linux 7.x =====
# systemctl restart httpd.service
9. Allow port 443 inbound traffic on the local firewall so that the Nagios Core web interface can be reached.
===== CentOS 5.x / 6.x | RHEL 5.x / 6.x | Oracle Linux 5.x / 6.x =====
# iptables -I INPUT -p tcp --destination-port 443 -j ACCEPT
# service iptables save
# p6tables -I INPUT -p tcp --destination-port 443 -j ACCEPT
# service ip6tables save
===== CentOS 7.x | RHEL 7.x | Oracle Linux 7.x =====
# firewall-cmd --zone=public --add-port=443/tcp
# firewall-cmd --zone=public --add-port=443/tcp --permanent
10. Test the connection to the server by directing a web browser to https://serveNname/.
There is no nagios/ extension in the URL. This is to test the connection to Apache to verify that the
certificate works.
If a self-signed certificate warning is returned, add a security exception. The Apache test web page will be
displayed upon success. The Nagios Core server can now be accessed by directing a web browser at
https://serverName/nagios/. More detailed information about this can be found in the following KB
article: https://support.nagios.com/kb/article.php?id=598. If an error is returned, check the firewall and
backtrack through this document, making sure all the steps have been performed.
If a user points a browser at http://serverName, they will be directed to https://serverName, which
can cause certificate warnings. If it is required to redirect them to https://serverName.domain.com,
change the RewriteRule in the /etc/httpd/conf/httpd.conf file.
RewriteRule (.*) https://serverName.domain.com%{REQUEST_URI}
11. Restart the HTTPD service.
4.2.2 Configure the Nagios Server to Send Email Notifications
Prerequisites
This procedure requires administrative privileges.
About this task
Use the instructions in this procedure to create Email alerts for sending notifications to users when needed.
Procedure
1. Log on to the SMW as root.
S3016 70
Page 71

System Monitoring
2. Stop the Nagios service.
# service nagios stop
3. Add the user's contact name, alias, and Email to the /usr/local/nagios/etc/objects/contacts.cfg
file using the following format:
define contact {
contact_name Contact1
alias ContactNameAlias
email email-address
service_notification_period 24x7
service_notification_options w,u,c,r,f,s
service_notification_commands notify-service-by-email
host_notification_period 24x7
host_notification_options d,u,r,f,s
host_notification_commands notify-host-by-email
}
define contact {
contact_name Contact2
alias ContactNameAlias2
email email-address
service_notification_period 24x7
service_notification_options w,u,c,r,f,s
service_notification_commands notify-service-by-email
host_notification_period 24x7
host_notification_options d,u,r,f,s
host_notification_commands notify-host-by-email
}
The service_notification_options directive is used to define the service states for which notifications
can be sent out to this contact. Valid options are a combination of one or more of the following:
● w: Notify on WARNING service states
● u: Notify on UNKNOWN service states
● c: Notify on CRITICAL service states
● r: Notify on service RECOVERY (OK states)
● f: Notify when the service starts and stops FLAPPING
● n (none): Do not notify the contact on any type of service notifications
The host_notification_options directive is used to define the host states for which notifications can be
sent out to this contact. Valid options are a combination of one or more of the following:
● d: Notify on DOWN host states
● u: Notify on UNREACHABLE host states
● r: Notify on host RECOVERY (UP states)
● f: Notify when the host starts and stops FLAPPING
● s: Send notifications when host or service scheduled downtime starts and ends
● n (none): Do not notify the contact on any type of host notifications.
By default, a contact and a contact group are defined for administrators in the contacts.cfg file and all the
services and hosts will notify the administrators. Add suitable Email ID for the administrator in the
contacts.cfg file.
S3016 71
Page 72

System Monitoring
4. Add the details (as shown in the following example) to add a group to which the mail needs to be sent:
define contactgroup{
contactgroup_name Group1
alias GroupAlias
members Contact1,Contact2
}
5. Specify the contact name and contact group name for the services for which the notification needs to be sent
in the /usr/local/nagios/etc/objects/templates.cfg file.
define host{
name gluster-generic-host
use linux-server
notifications_enabled 1
notification_period 24x7
notification_interval 120
notification_options d,u,r,f,s
register 0
contact_groups Group1
contacts Contact1,Contact2
}
define service {
name gluster-service
use generic-service
notifications_enabled 1
notification_period 24x7
notification_options w,u,c,r,f,s
notification_interval 120
register 0
_gluster_entity Service
contact_groups Group1
contacts Contact1,Contact2
}
Notifications for individual services can be configured by editing the corresponding node configuration file. For
example, to configure notification for the brick service, edit the corresponding node configuration file as shown
below:
define service {
use brick-service
_VOL_NAME VolumeName
__GENERATED_BY_AUTOCONFIG 1
notes Volume : VolumeName
host_name RedHatStorageNodeName
_BRICK_DIR brickpath
service_description Brick Utilization - brickpath
contact_groups Group1
contacts Contact1,Contact2
}
S3016 72
Page 73

System Monitoring
6. Edit the /usr/local/nagios/etc/objects/commands.cfg file to add $NOTIFICATIONCOMMENT$\n
after the $SERVICEOUTPUT$\n option in notify-service-by-email and in the notify-host-by-
email command definition.
# 'notify-service-by-email' command definition
define command{
command_name notify-service-by-email
command_line /usr/bin/printf "%b" "***** Nagios *****\n
\nNotification Type: $NOTIFICATIONTYPE$\n\nService: $SERVICEDESC$\nHost:
$HOSTALIAS$\nAddress: $HOSTADDRESS$\nState: $SERVICESTATE$\n\nDate/Time:
$LONGDATETIME$\n\nAdditional Info:\n\n$SERVICEOUTPUT$\n $NOTIFICATIONCOMMENT$
\n" | /bin/mail -s "** $NOTIFICATIONTYPE$ Service Alert: $HOSTALIAS$/
$SERVICEDESC$ is $SERVICESTATE$ **" $CONTACTEMAIL$
}
This section can also be modified to change the service which sends mail. To do so, change /bin/mail -s
to the preferred mail service, for example /bin/sendmail.
7. Restart the Nagios service.
# service nagios restart
The Nagios server sends notifications during status changes to the mail addresses specified in the file. It is
important to note that:
● By default, the system ensures three occurrences of the event before sending mail notifications.
● By default, Nagios mail notifications are sent using the /bin/mail command. To change this, modify the
definition for the notify-host-by-email and notify-service-by-email commands in
the /usr/local/nagios/etc/objects/commands.cfg file and configure the mail server
accordingly.
4.2.3
Change the Default Log File Path and Rotation Interval
Prerequisites
This procedure requires root privileges.
About this task
Nagios log files are located at /usr/local/nagios/var/nagios.log by default. This procedure provides
instructions for modifying this path. In addition, this procedure provides instructions for adjusting the default log
level and the default location of archived log files.
Procedure
1. Log on to the SMW as root.
# ssh root@machine-smw
2. Stop the Nagios service if it is running.
# service nagios stop
S3016 73
Page 74

System Monitoring
3. Switch to the /usr/local/nagios/etc directory.
# cd /usr/local/nagios/etc
4. Use an editor to modify the nagios.cfg configuration file as desired.
● Locate the line log_file=/usr/local/nagios/var/nagios.log This line specifies the default path
to the log file. Modify the path as desired.
● Locate the line log_rotation_method=d. This line specifies the rotation interval. d stands for daily.
Modify this line as desired. The other options are defined in the comments block above it.
● Locate the line log_archive_path=/usr/local/nagios/var/archives. This is where rotated log
files are archived. Modify the path as desired.
5. Save and quit the nagios.cfg file.
6. Restart the Nagios service.
# service nagios restart
4.2.4
Configure Email Alerts
Prerequisites
This procedure requires root privileges.
About this task
This procedure provides instructions for updating certain Nagios configuration files for configuring alerts.
Specifically, it describes how to modify the contacts.cfg file to update and define a list of contacts for sending
Email alerts to. In addition, it describes how to modify the localhost.cfg and node_services.cfg files to
configure alerts for services running on nodes.
Procedure
1. Log in to the SMW as root.
# ssh root@machine-smw
2. Stop the Nagios service if it is running.
# service nagios stop
3. Switch to the /usr/local/nagios/etc/objects directory.
# cd /usr/local/nagios/etc
4. Use an editor to modify the contacts.cfg configuration file as desired.
S3016 74
Page 75

System Monitoring
A contact group will be defined by default in the contacts.cfg file.
define contactgroup{
contactgroup_name admins
alias Nagios Administrators
members admin1
}
5. Add as many members as needed.
Multiple contact groups can be defined if needed.
A contact is defined in this file by default.
define contact{
contact_name admin1 ; Short name of user
use generic-contact ; Inherit default values from generic-contact
template (defined above)
alias full name ; Full name of user
email [email protected] ; <<***** Change this to the required email
address *****
}
6. Updated the alias and Email as desired.
7. Save and quit the contacts.cfg file.
8. Open localhost.cfg and find the service that alerting needs to be set up for.
The following example shows how to set up the service for aggregate CPU usage.
define service{
use local-service
host_name localhost
service_description Aggregate CPU Stats
check_command check_cpu_aggr!0.5!0.8
notifications_enabled 1
notification_period 24x7
notification_options w,u,c,r,f
notification_interval 60
contact_groups admins
contacts admin1
}
9. Define the notification period, interval, options, the contact groups and contacts as desired.
For more information, refer to https://access.redhat.com/documentation/en-US/Red_Hat_Storage/3/html/
Console_Administration_Guide/Configuring_Nagios_to_Send_Mail_Notifications.html
10. Save and quit the localhost.cfg file.
11. Restart the Nagios service.
# service nagios restart
12. Repeat this process for node_services.cfg file as well.
S3016 75
Page 76

System Monitoring
4.2.5 Modify Nagios Plug-in Threshold
Prerequisites
This procedure requires root privileges.
About this task
Each Cray plugin requires thresholds for the metrics they monitor. All plugins require a warning and critical
level, set via parameters. Some require a third parameter. These plugins include cray_check_disk,
cray_check_disk_aggr, and cray_check_network. Executing the plugin with the -h option will list the
available options and the arguments to pass in for these options. For example, ./cray_check_disk -h. A
brief description of what each plugin measures will also be available via the -h option. The plugins are located
in /usr/local/nagios/libexec on either the SMW or one of the nodes. The warning and critical levels are
digits (up to 4 decimal points) between 0.0 and 1.0, which represent the percentage of the metric.
The following plugins are configurable on the SMW at the default path /usr/local/nagios/libexec:
cray_check_cpu_aggr
●
cray_check_disk
●
cray_check_disk_aggr
●
cray_check_memory_aggr
●
cray_check_network
●
● cray_check_node_state.
The following plugins are configurable on each of the nodes at the default path
(/usr/local/nagios/libexec):
● cray_check_aries (only available on compute nodes)
cray_check_cpu
●
cray_check_disk
●
cray_check_memory
●
For details on configuring custom services and hosts please refer to Nagios documentation.
Procedure
1. Log on to the SMW as root.
# ssh root@machine-smw
2. Stop the Nagios service if it is running.
# service nagios stop
3. Switch to the /usr/local/nagios/etc/objects directory.
4. Modify the localhost.cfg file as needed.
S3016 76
Page 77

System Monitoring
There is a define service block as shown below for the aggregate CPU plug-in.
define service{
use local-service
host_name localhost
service_description Aggregate CPU Stats
check_command check_cpu_aggr!0.5!0.8
}
Here, a custom command name is defined, the name being arbitrary. In this example it it called
check_cpu_aggr, which is the last line shown above. It is followed by an exclamation mark, a number,
another exclamation mark, and another number. The ‘!’ separates the parameters required by the plugin (-w
and –c), and the numbers are the arguments to these plugins (i.e. the warning and critical levels). So in
this instance, the warning level is set to 0.5 and critical to 0.8
5. Adjust the warning and critical levels for this plugin
6. Save and quit the localhost.cfg file.
7. Restart the Nagios service.
# service nagios restart
8. Switch to the /usr/local/nagios/etc directory.
9. Modify the nrpe.conf configuration file as needed.
a. Define the command name and the path including the arguments to the plugins to be executed by this
command.
The command for the cray_check_cpu plugin is shown below:
command[check_cpu]=/usr/local/nagios/libexec/cray_check_cpu -w 0.5 -c 0.8
In the preceding example, -w is the warning level, whereas -c is the critical level.
b. Update the thresholds as needed.
10. Save and quit the nrpe.conf file.
11. Restart the nrpe service.
# service nrpe restart
12. Repeat this process for all the nodes and services in those nodes that need adjusting.
4.3
Grafana is a feature-rich metrics, dashboard, and graph editor. It provides information about utilization of system
resources, such as CPU, memory, I/O, etc.
Major Grafana components and UI elements include:
Get Started with Using Grafana
S3016 77
Page 78

System Monitoring
● Dashboard - The Dashboard consolidates all the visualizations into a single interface. Urika-GX ships with
pre-defined dashboards for resource utilization information. For information about these dashboards, see
Default Grafana Dashboards on page 79.
● Panels - The Panel is the basic visualization building block of the GUI. Panels support a wide variety of
formatting options and can be dragged, dropped, resized, and rearranged on the Dashboard.
● Query Editor - Each Panel provides a Query Editor for the data source, which is InfluxDB on the Urika-GX
system. Information retrieved from the Query Editor is displayed on the Panel.
● Data Source - Grafana supports many different storage back-ends for retrieving time series data. Each Data
Source has a specific Query Editor that is customized for the features and capabilities that the particular
Data Source exposes. Urika-GX currently supports InfluxDB as its data source.
● Organization - Grafana supports multiple organizations in order to support a wide variety of deployment
models. Each Organization can have one or more Data Sources. All Dashboards are owned by a particular
Organization.
● User - A User is a named account in Grafana. A user can belong to one or more Organizations, and can be
assigned different levels of privileges via roles.
● Row - A Row is a logical divider within a Dashboard, and is used to group Panels together.
Roles
Users and Organizations can be assigned roles to specify permissions/privileges. These roles and their
privileges are listed in the following table:
Table 14. Grafana Roles and Permissions
Role Edit roles View graphs
Admin Yes Yes Yes Yes Yes (These
Viewer (default
role)
Editor No Yes Yes Yes Yes (These
Read only editor No Yes Yes Yes No
Each role type can also export performance data via the dashboard. When a new user signs up for the first time,
the default role assigned to the user is that of a Viewer. The admin can then change the new user's role if needed.
All users have a default role of a Viewer when they first log on to Grafana. Administrators can change roles
assigned to users as needed using the Admin menu.
No Yes No No No
Edit/create
copy of
existing graphs
Add new
graphs to
existing
dashboards
Create new/
import existing
dashboards
dashboards
persist between
sessions)
dashboards get
deleted when the
editor logs out)
S3016 78
Page 79
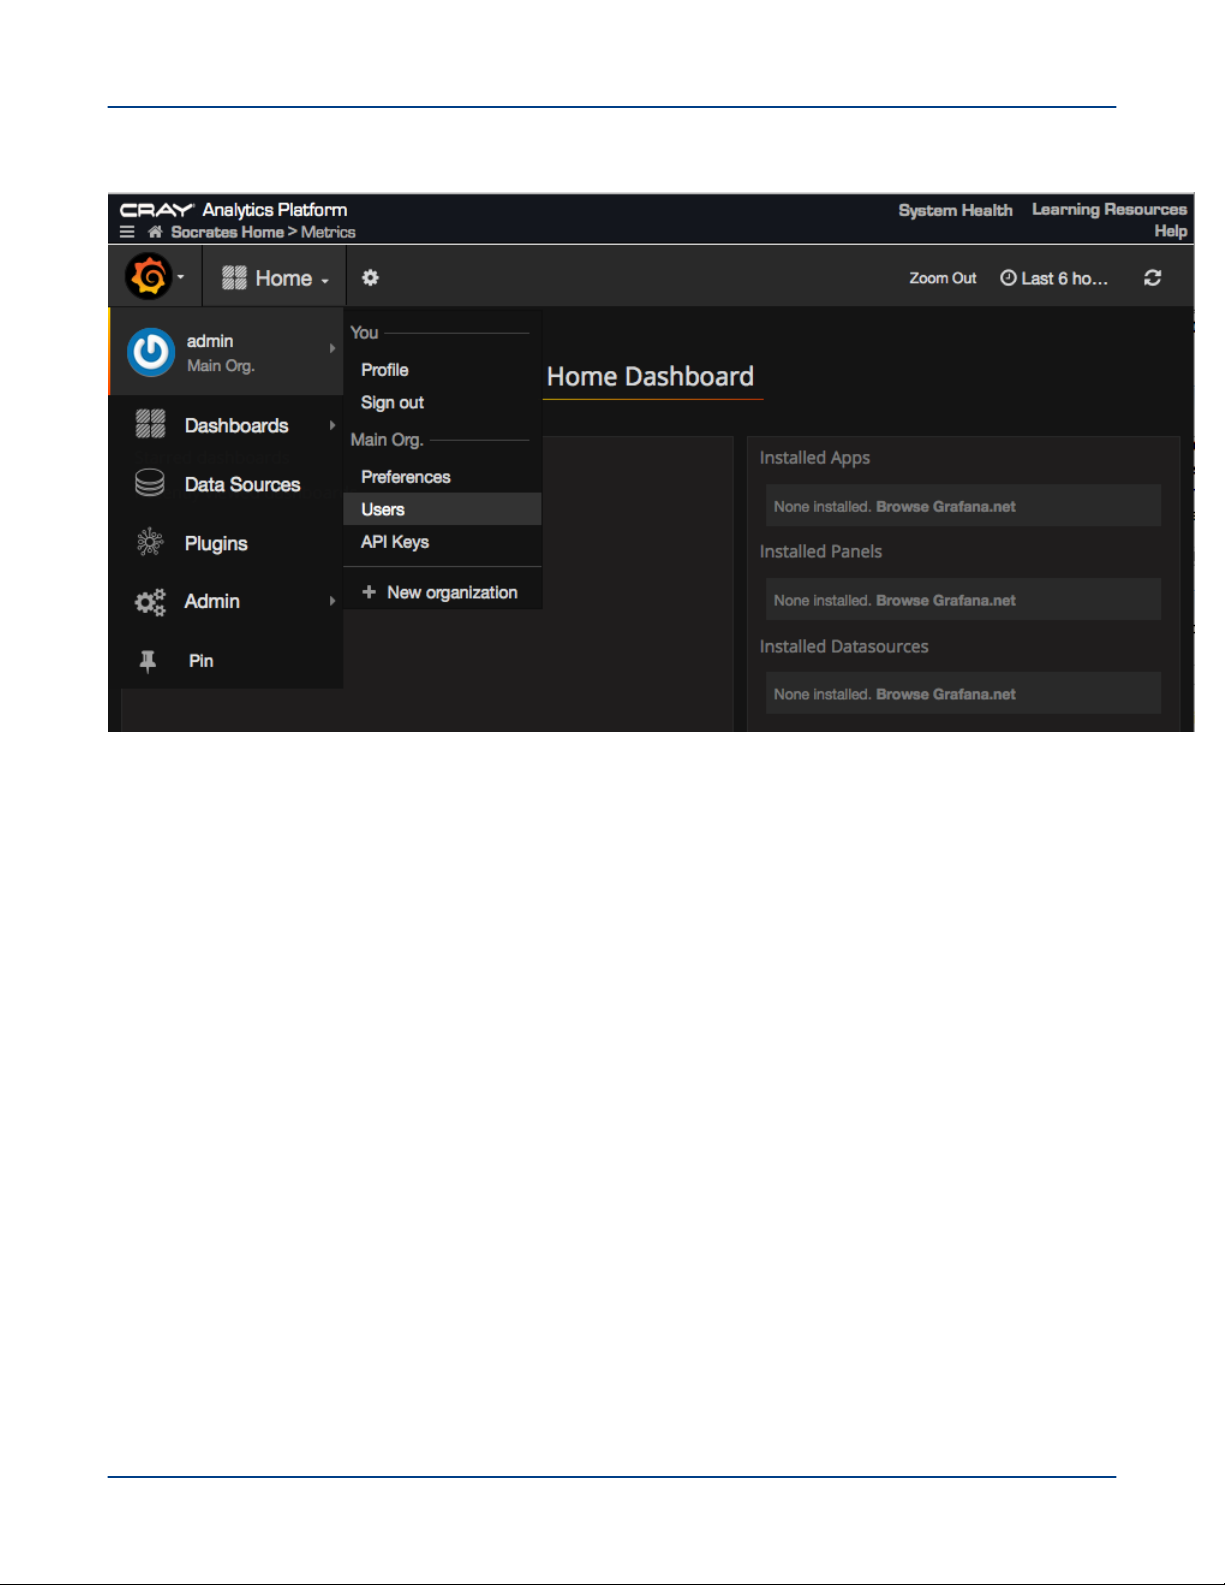
Figure 4. Change User Roles Using the Admin Menu
System Monitoring
Since the time displayed on the Grafana UI uses the browser's timezone and that displayed on the Spark History
server's UI uses the Urika-GX system's timezone, the timezones displayed on the two UIs may not be the same.
By default, Grafana's refresh rate is turned off on the Urika-GX system. Sometimes the Hadoop and Spark
Grafana dashboards take longer to load than expected. The usual cause of this issue is the time it takes InfluxDB
to return all of the requested data. To reduce the time for the Hadoop and Spark dashboards to display data, refer
to Update the InfluxDB Data Retention Policy on page 54. Reducing the amount of data retained makes Grafana
dashboards display faster.
4.4 Default Grafana Dashboards
The default set of Grafana dashboards shipped with Urika-GX include:
● Aggregate Compute Node Performance Statistics - Displays graphs representing statistical data related to
network, CPU, and I/O utilization for all Urika-GX nodes.
This dashboard contains the following graphs:
○ CPU AND MEMORY
▪ CPU utilization - Displays the overall CPU utilization for all nodes.
▪ Memory utilization - Displays the overall memory used by all nodes.
○ FILE SYSTEM DATA RATES
▪ SSD Reads/Writes Bytes/Second - Displays SSD utilization for all nodes.
S3016 79
Page 80
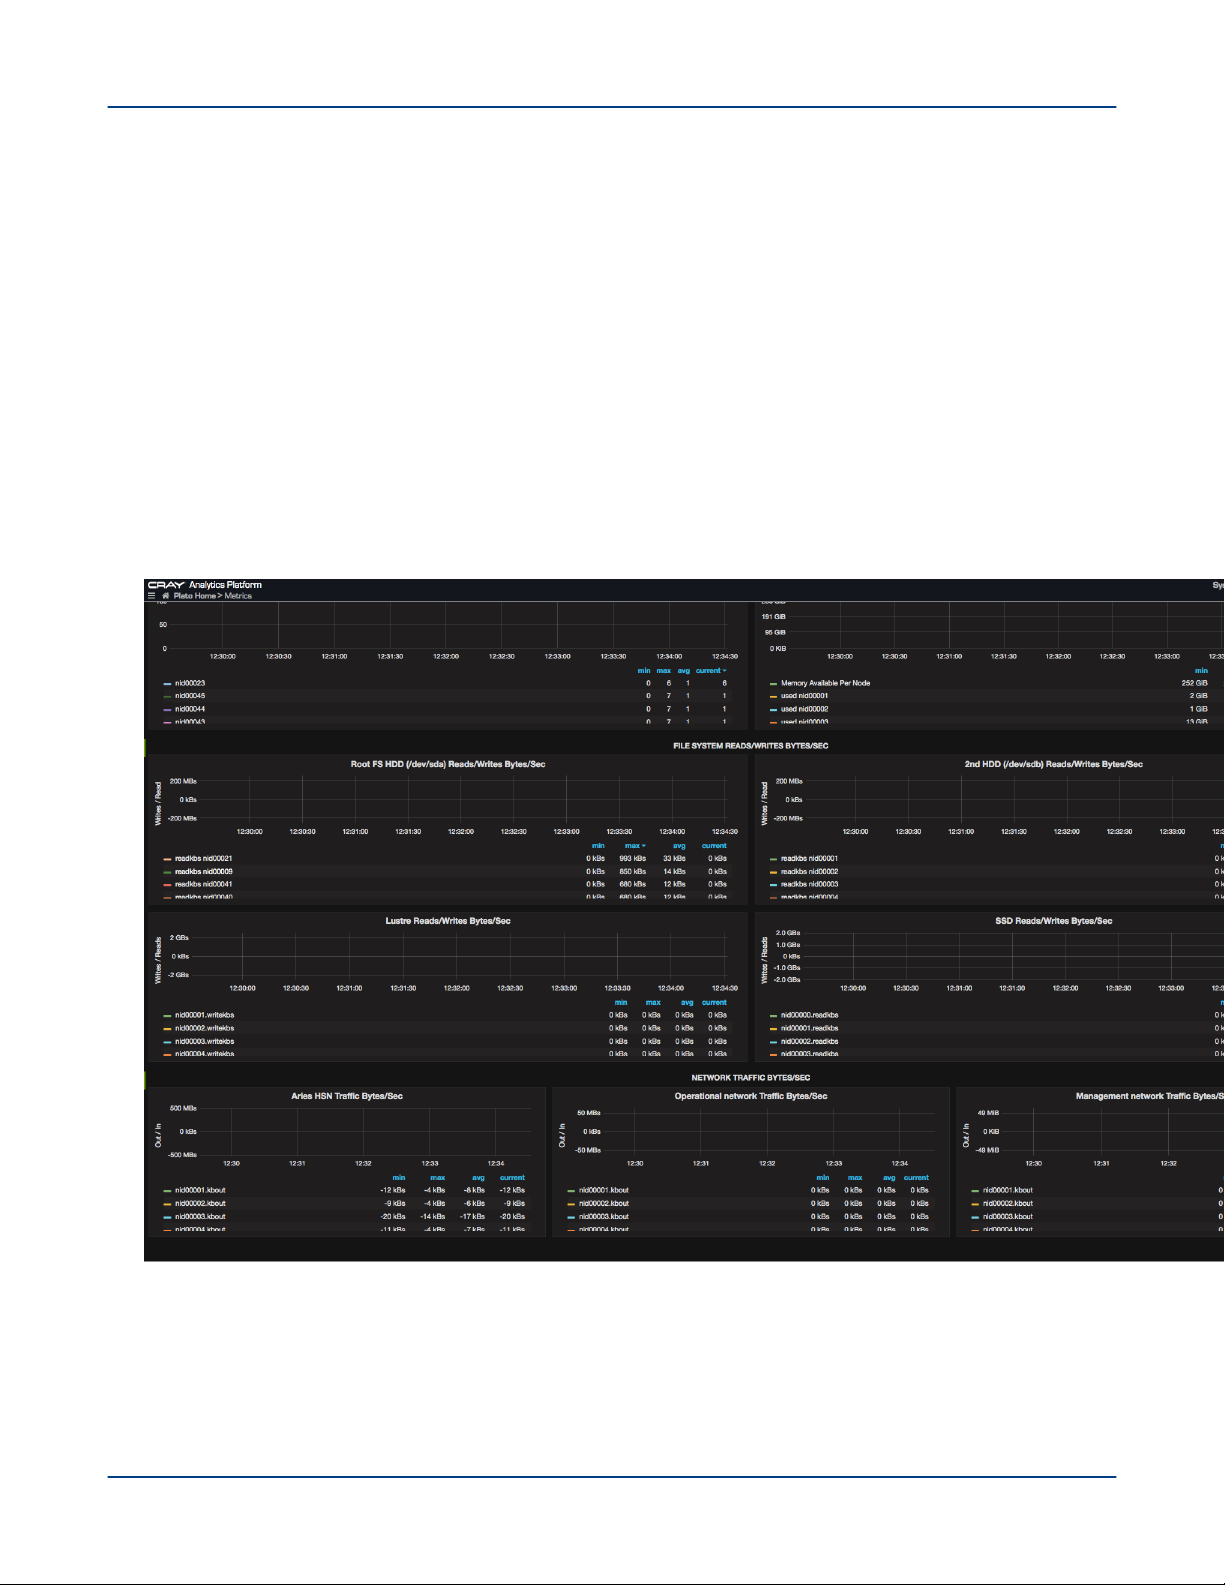
System Monitoring
▪ Second Hard Drive (/dev/sdb) Reads/Writes Bytes/Sec - Displays utilization of secondary hard
disk space for all nodes.
▪ Root FS HDD (/dev/sda) Reads/Writes Bytes/Sec - Displays utilization of root files system on the
hard drive for all nodes.
▪ Lustre Reads/Writes Bytes/Second - Displays the aggregate Lustre I/O for all the nodes.
○ NETWORK READS AND WRITES
▪ Aries HSN Bytes/Sec In/Out - Displays the overall Aries network TCP traffic information for nodes.
Note that non-TCP Aries traffic, including most traffic generated by CGE, is not shown here.
▪ Operational network Bytes/sec In/Out - Displays the overall operational network traffic information
for all nodes.
▪ Management network Bytes/sec In/Out - Displays the overall management network traffic
information for all nodes.
Figure 5. Aggregate Compute Node Performance Statistics
● Basic Metrics - Displays graphs representing statistical data related to network, CPU, and I/O utilization for
the Urika-GX system, as a whole.
TIP: It is recommended that administrators use the Basic Metrics dashboard before using other
dashboards to retrieve a summary of the system's health.
This dashboard contains the following graphs:
S3016 80
Page 81

System Monitoring
○ CPU AND MEMORY
▪ Used and File Cached Memory - Displays the used and file cached memory for each node.
▪ CPU Utilization User + System - Displays the CPU utilization by the user and system for each node
○ FILE SYSTEM DATA RATES
▪ Root File System Hard Drive (/dev/sda) Reads/Writes Bytes/Sec (200MB/sec max) - Displays
information about the usage of memory on the root file system for each node.
▪ 2nd Hard Drive (/dev/sdb) Read/Writes - Displays information about the usage of memory on the
secondary hard drive of each node.
▪ Lustre Read/Writes Bytes/Second - Displays the number of Lustre reads/writes for each node.
▪ SSD Read/Writes Bytes/Second - Displays the number of reads/writes of the SSDs installed on the
system.
○ NETWORK READS/WRITES
▪ Aries HSN Bytes/Sec In/Out - Displays the Aries network TCP traffic information for each node.
Note that non-TCP Aries traffic, including most traffic generated by CGE, is not shown here.
▪ Operational network Bytes/sec In/Out - Displays the overall operational network traffic information
for each node.
▪ Management network Bytes/sec In/Out - Displays the overall management network traffic
information for each node.
○ FILE SYSTEM UTILIZATION
▪ Root File System Hard Drive (/dev/sda) Reads/Writes Bytes/Sec (200MB/sec max) - Displays
information about the usage of memory on the root file system for each node.
▪ 2nd Hard Drive (/dev/sdb) Read/Writes - Displays information about the usage of memory on the
secondary hard drive of each node.
▪ Lustre Read/Writes Per/Second - Displays the number of Lustre reads/writes for each node.
▪ SSD Read/Writes Per/Second - Displays the number of reads/writes of each node's SSDs.
○ NETWORK ERRORS AND DROPED PACKETS
▪ Aries HSN Dropped Packets and Errors Per Sec - Displays the number of dropped packets/errors
per second for the Aries network TCP traffic information for each node. Note that non-TCP Aries
traffic, including most traffic generated by CGE, is not shown here.
▪ Operational network Dropped Packets and Errors Per Sec - Displays the number of dropped
packets/errors per second for the operational network TCP traffic information for each node.
▪ Management network Dropped Packets and Errors Per Sec - Displays the number of dropped
packets/errors per second for the management network TCP traffic information for each node.
S3016 81
Page 82
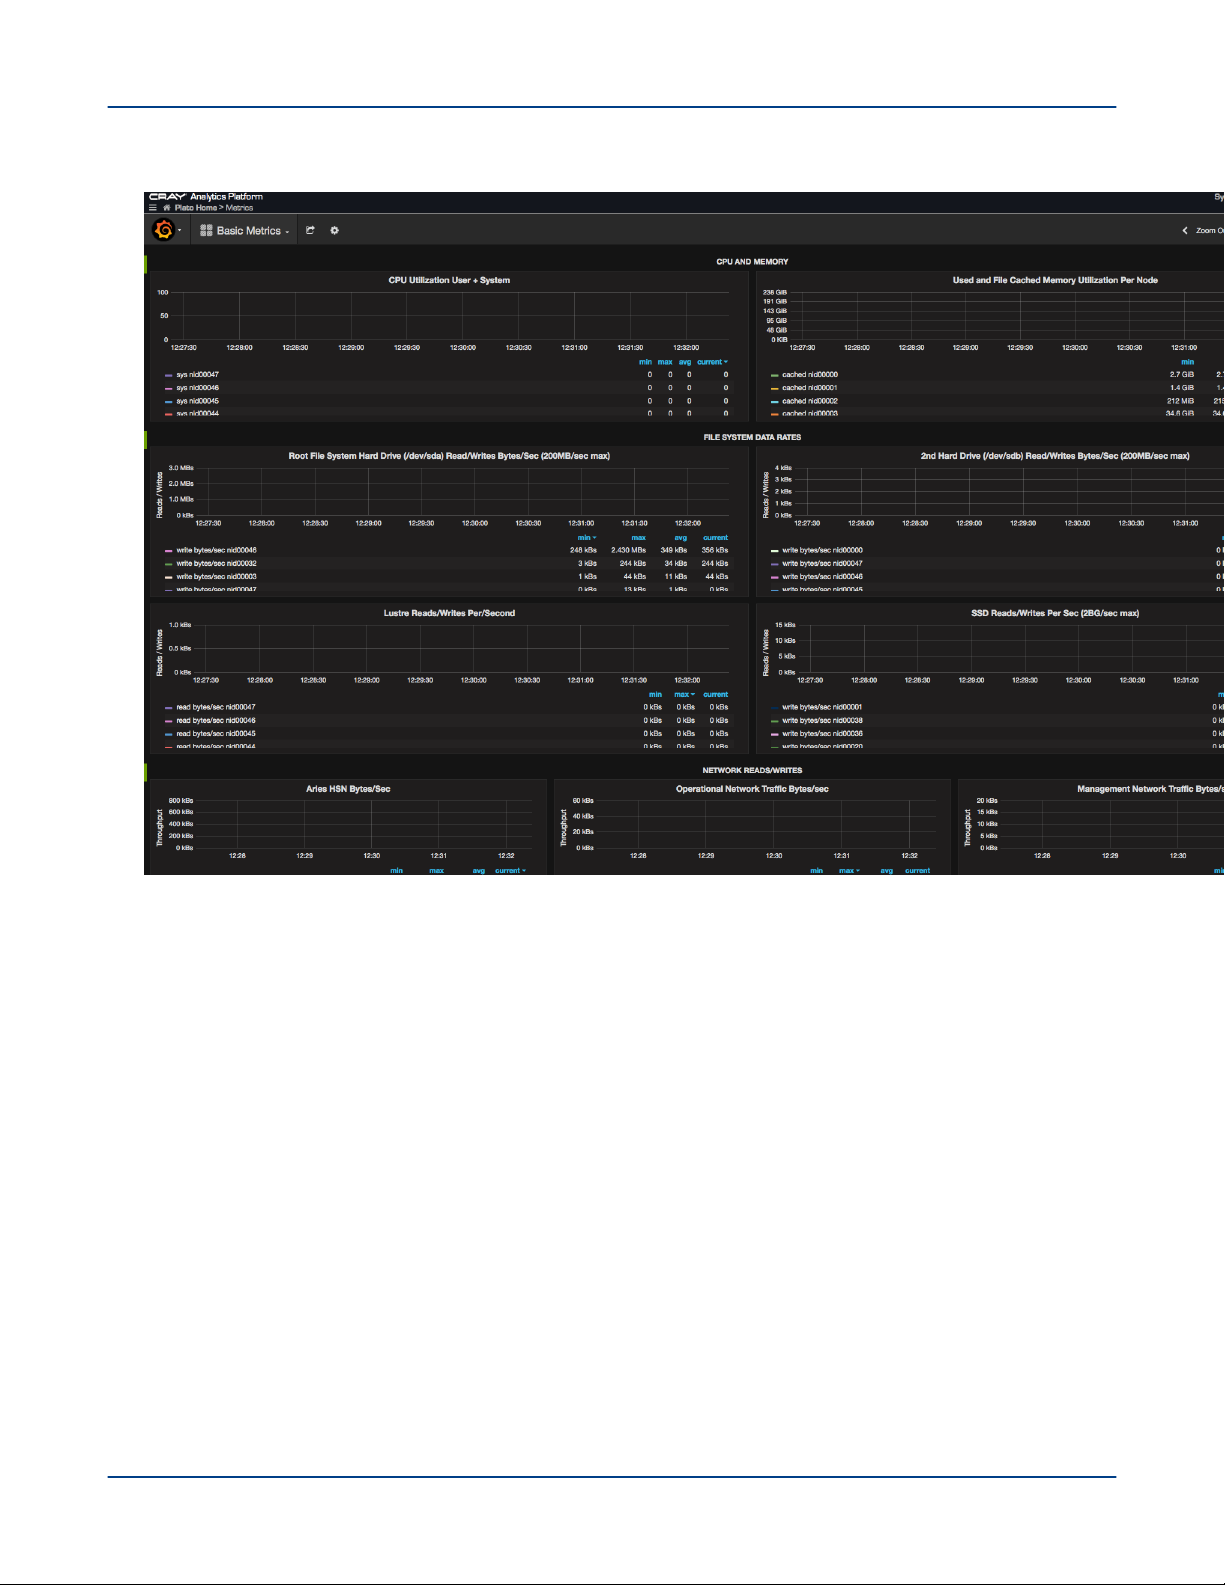
Figure 6. Basic Metrics Dashboard
System Monitoring
● Compute Node Performance Statistics - Displays graphs representing statistical data related to network,
CPU, and I/O utilization for all Urika-GX compute nodes.
This dashboard contains the following graphs:
○ ▪ CPU MEMORY UTILIZATION
▪ CPU utilization - Displays the overall CPU utilization for all the compute nodes.
▪ Memory utilization - Displays the overall memory (in KB or GB) used by all the compute nodes.
○ FILE SYSTEM READS/WRITE BYTES/SEC
▪ Root File System Hard Drive (/dev/sda) Reads/Writes Bytes/Sec (200MB/sec max) - Displays
information about the usage of memory on the root file system by compute nodes..
▪ 2nd Hard Drive (/dev/sdb) Read/Writes - Displays information about the usage of memory by
compute nodes on the secondary hard drive.
▪ Lustre Read/Writes Per/Second - Displays the number of Lustre reads/writes by compute nodes.
▪ SSD Read/Writes Per/Second - Displays the number of reads/writes of the compute node SSDs
installed on the system.
○ NETWORK READS/WRITES
S3016 82
Page 83
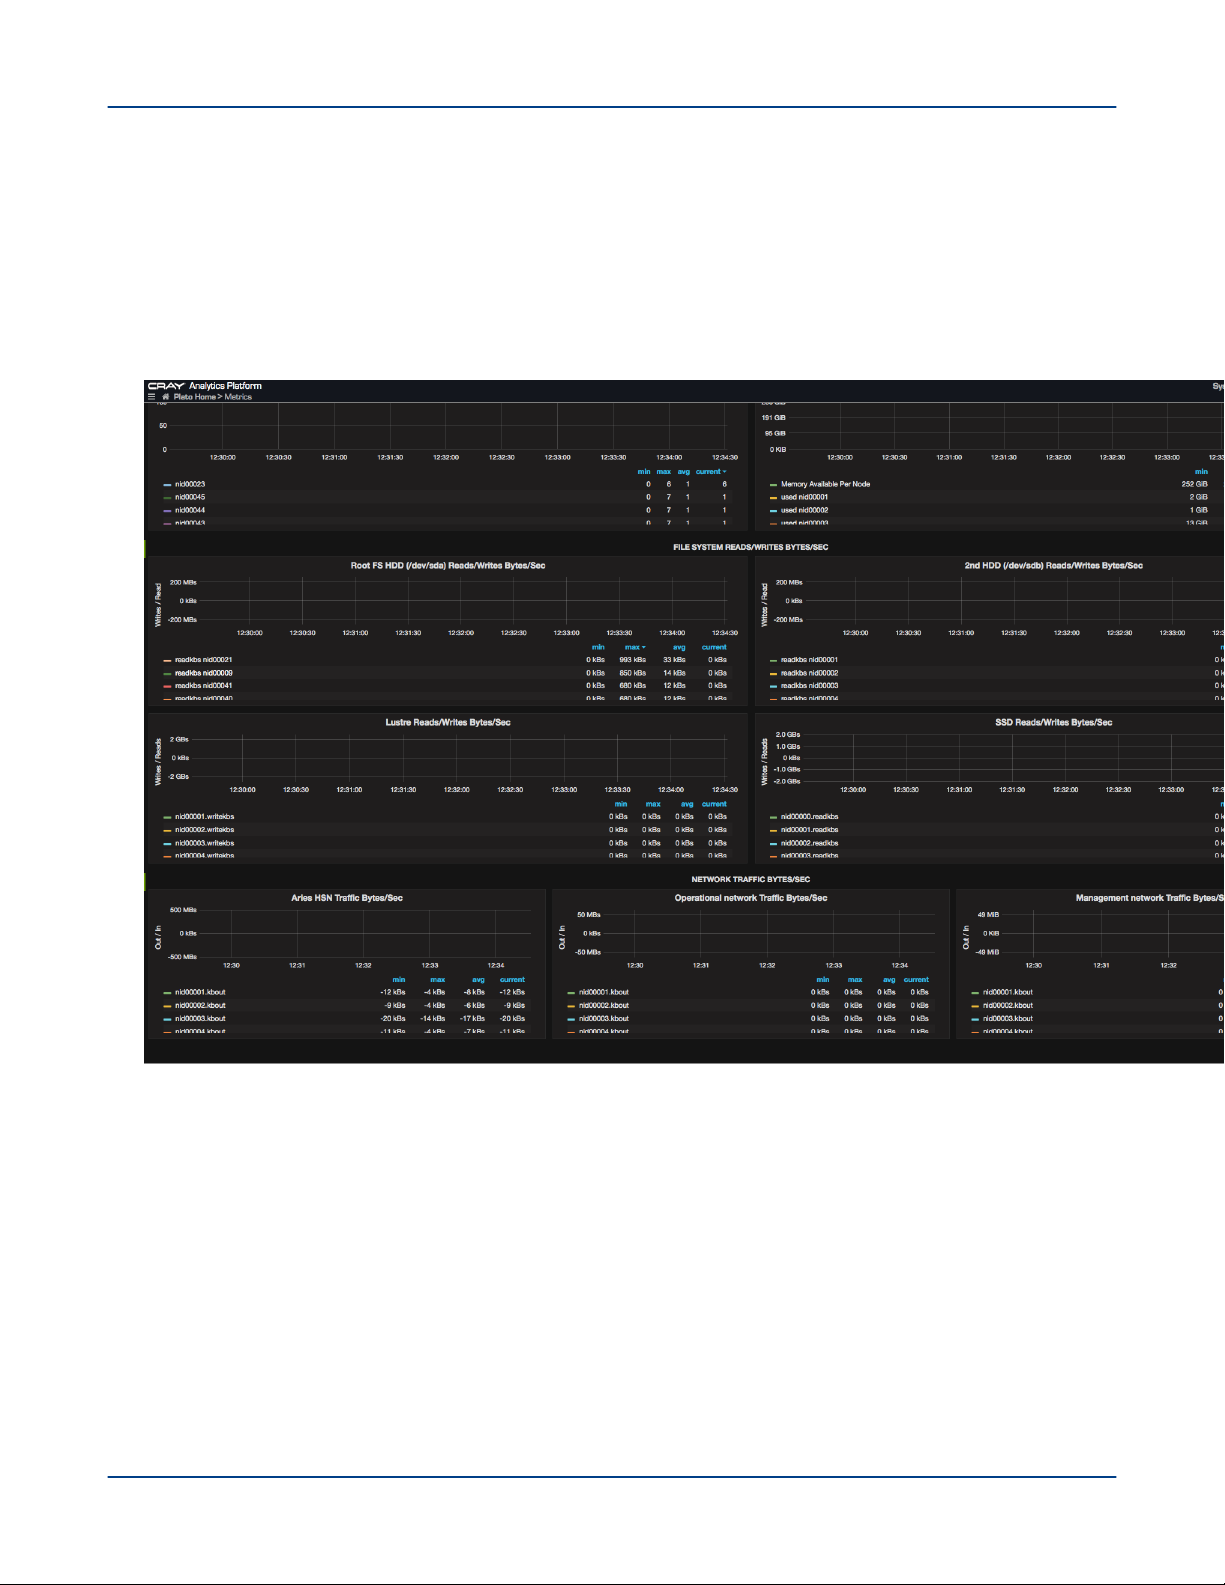
System Monitoring
▪ Aries HSN Bytes/Sec In/Out - Displays the Aries network TCP traffic information for compute nodes.
Note that non-TCP Aries traffic, including most traffic generated by CGE, is not shown here.
▪ Operational network Bytes/sec In/Out - Displays the overall operational network traffic information
for compute nodes.
▪ Management network Bytes/sec In/Out - Displays the overall management network traffic
information for compute nodes.
Figure 7. Compute Node Performance Statistics
● Hadoop Application Metrics - This section contains the following graphs:
○ Node Manager Memory Usage - Displays the average memory usage per application in mega bytes per
second (MBPS). The Y-axis is in MBPS.
○ Node Manager Core Usage - Displays the average CPU usage per application in MilliVcores . The Y-
axis refers to MilliVcores.
S3016 83
Page 84
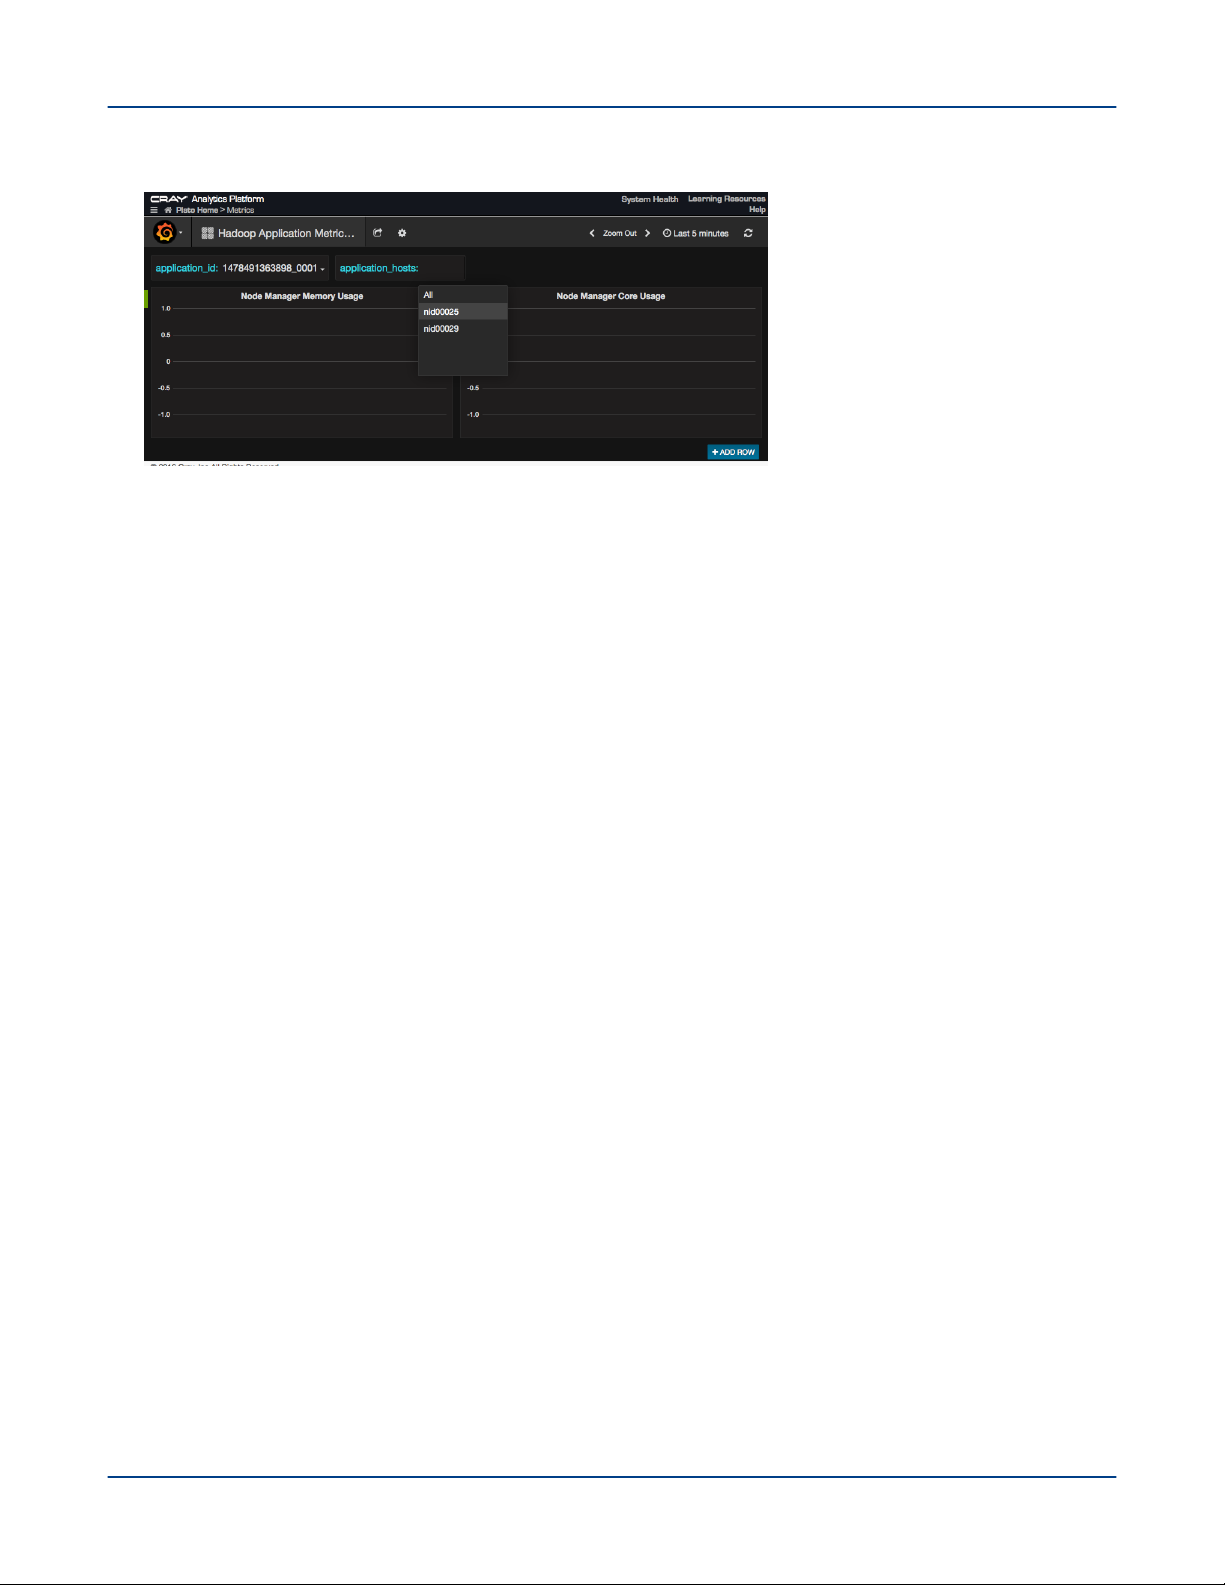
System Monitoring
Figure 8. Hadoop Applications Metrics Dashboard
● Hadoop Cluster Metrics - Displays graphs representing statistical data related to Hadoop components, such
as HDFS Data Nodes and HDFS Name Nodes.
This dashboard contains the following sections:
○ Cluster BlockReceivedAndDeletedAvgTime - Displays the average time in milliseconds for the hdfs
cluster to send and receive blocks. The Y-axis represents time in milliseconds.
○ NumActive Node Manager - Displays the number of Node Managers up and running in the Hadoop
cluster at a given time. The Y-axis represents a linear number.
○ AllocatedContainers - Displays the number of allocated YARN containers by all the jobs in the hadoop
cluster. The Y-axis represents a linear number.
○ DataNode Bytes Read/Write - Displays the number of bytes read or write per node from local client in
the hadoop cluster. The Y-axis refers to a linear number. Read is shown on the positive scale. Write is
shown on the negative scale.
○ Data Node Remote bytes Read/Written - Displays the number of bytes read or written per node from
remote clients in the Hadoop cluster. The Y-axis represents a linear number. The number of reads are
shown on the positive scale. The number of writes are shown on the negative scale.
S3016 84
Page 85
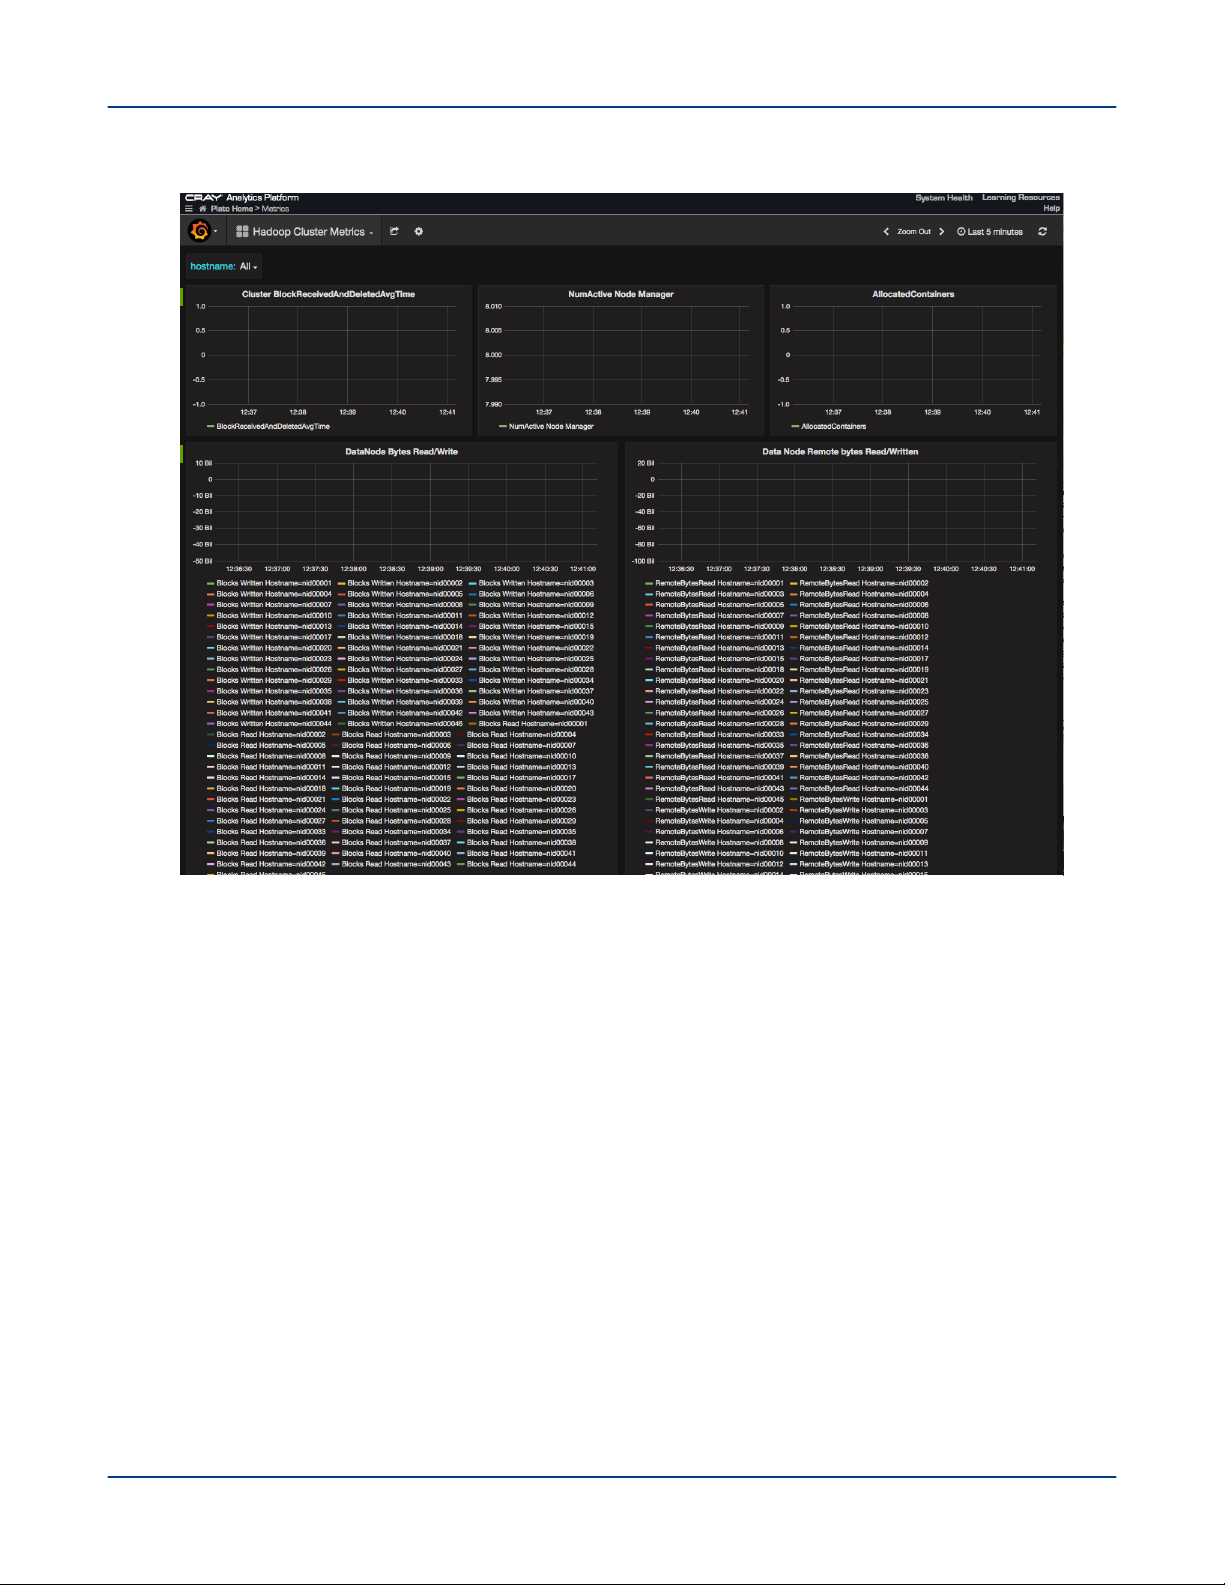
○
Figure 9. Hadoop Cluster Metrics Dashboard
System Monitoring
● Non-compute Node Performance Statistics - Displays graphs representing statistical data related to
network, CPU, and I/O utilization for all the non-compute (I/O and login) nodes of Urika-GX.
This dashboard contains the following graphs:
○ CPU MEMORY UTILIZATION
▪ CPU utilization - Displays the overall CPU utilization for I/O and login (non-compute) nodes.
▪ Memory utilization - Displays the overall memory (in KB or GB) used by all the I/O and login nodes.
○ FILE SYSTEM READS/WRITE BYTES/SEC
▪ Root File System Hard Drive (/dev/sda) Reads/Writes Bytes/Sec (200MB/sec max) - Displays
information about the usage of memory on the root file system by I/O and login nodes.
▪ 2nd Hard Drive (/dev/sdb) Read/Writes - For I/O and login nodes, displays information about the
usage of memory by compute nodes on the secondary hard drive.
▪ Lustre Read/Writes Bytes/Second - Displays the number of Lustre reads/writes by I/O and login
nodes.
▪ SSD Read/Writes Bytes/Second - Displays the number of SSD reads/writes of the I/O and login
nodes.
○ NETWORK READS/WRITES
S3016 85
Page 86
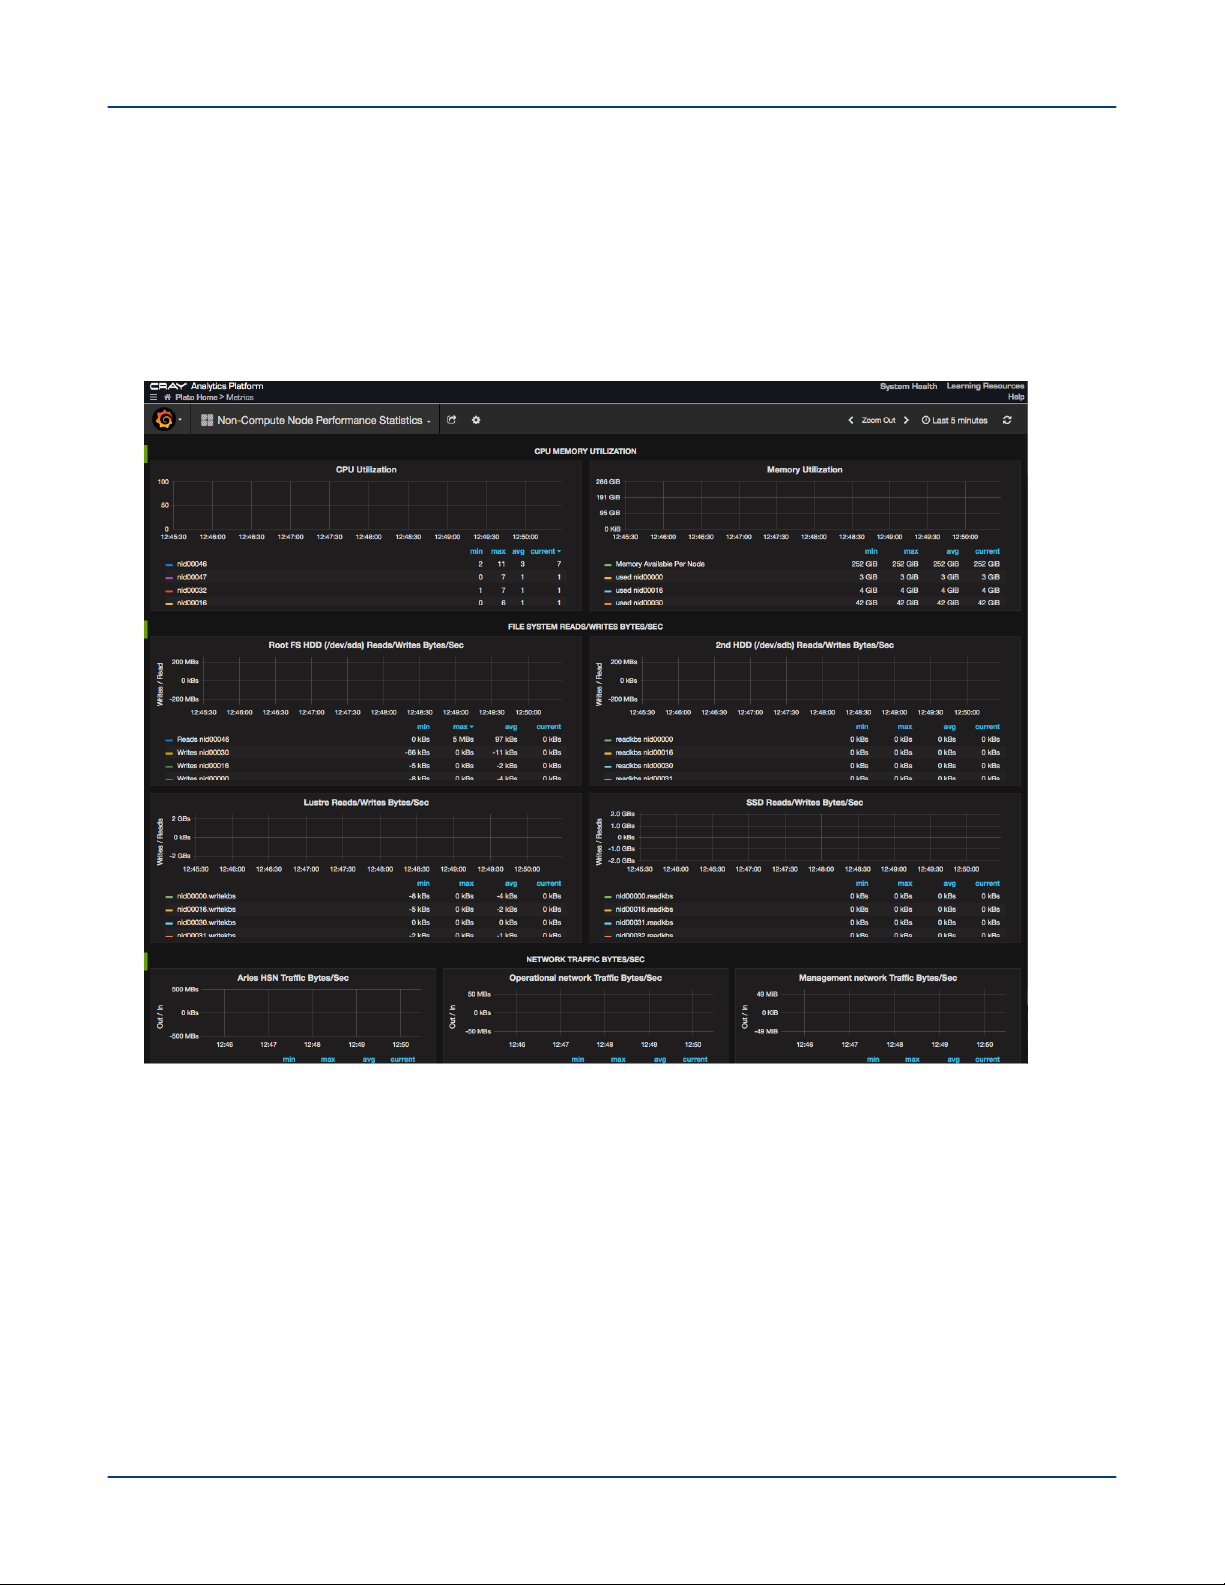
System Monitoring
▪ Aries HSN Bytes/Sec In/Out - Displays the Aries network TCP traffic information for I/O and login
nodes. Note that non-TCP Aries traffic, including most traffic generated by CGE, is not shown here.
▪ Operational network Bytes/sec In/Out - Displays the overall operational network traffic information
for I/O and login nodes.
▪ Management network Bytes/sec In/Out - Displays the overall management network traffic
information for I/O and login nodes.
Figure 10. Non-compute Node Performance Statistics
● Per Node Performance Statistics - Displays graphs representing statistical data related to network, CPU,
and I/O utilization for individual Urika-GX nodes. The node's hostname can be selected using the hostname
drop down provided on the UI.
This dashboard contains the following graphs:
○ CPU utilization - Displays the CPU utilization for the selected node.
○ Memory utilization - Displays the memory (in KB or GB) used by the selected node.
○ Root File System Hard Drive (/dev/sda) Reads/Writes Bytes/Sec- Displays the HDD SDA utilization for
the selected node.
○ 2nd Hard Drive (/dev/sdb) Read/Writes - Displays the HDD SDB utilization for the selected node.
○ SSD Read/Writes Bytes/Second - Displays the number of SSD reads/writes per second for each node.
S3016 86
Page 87
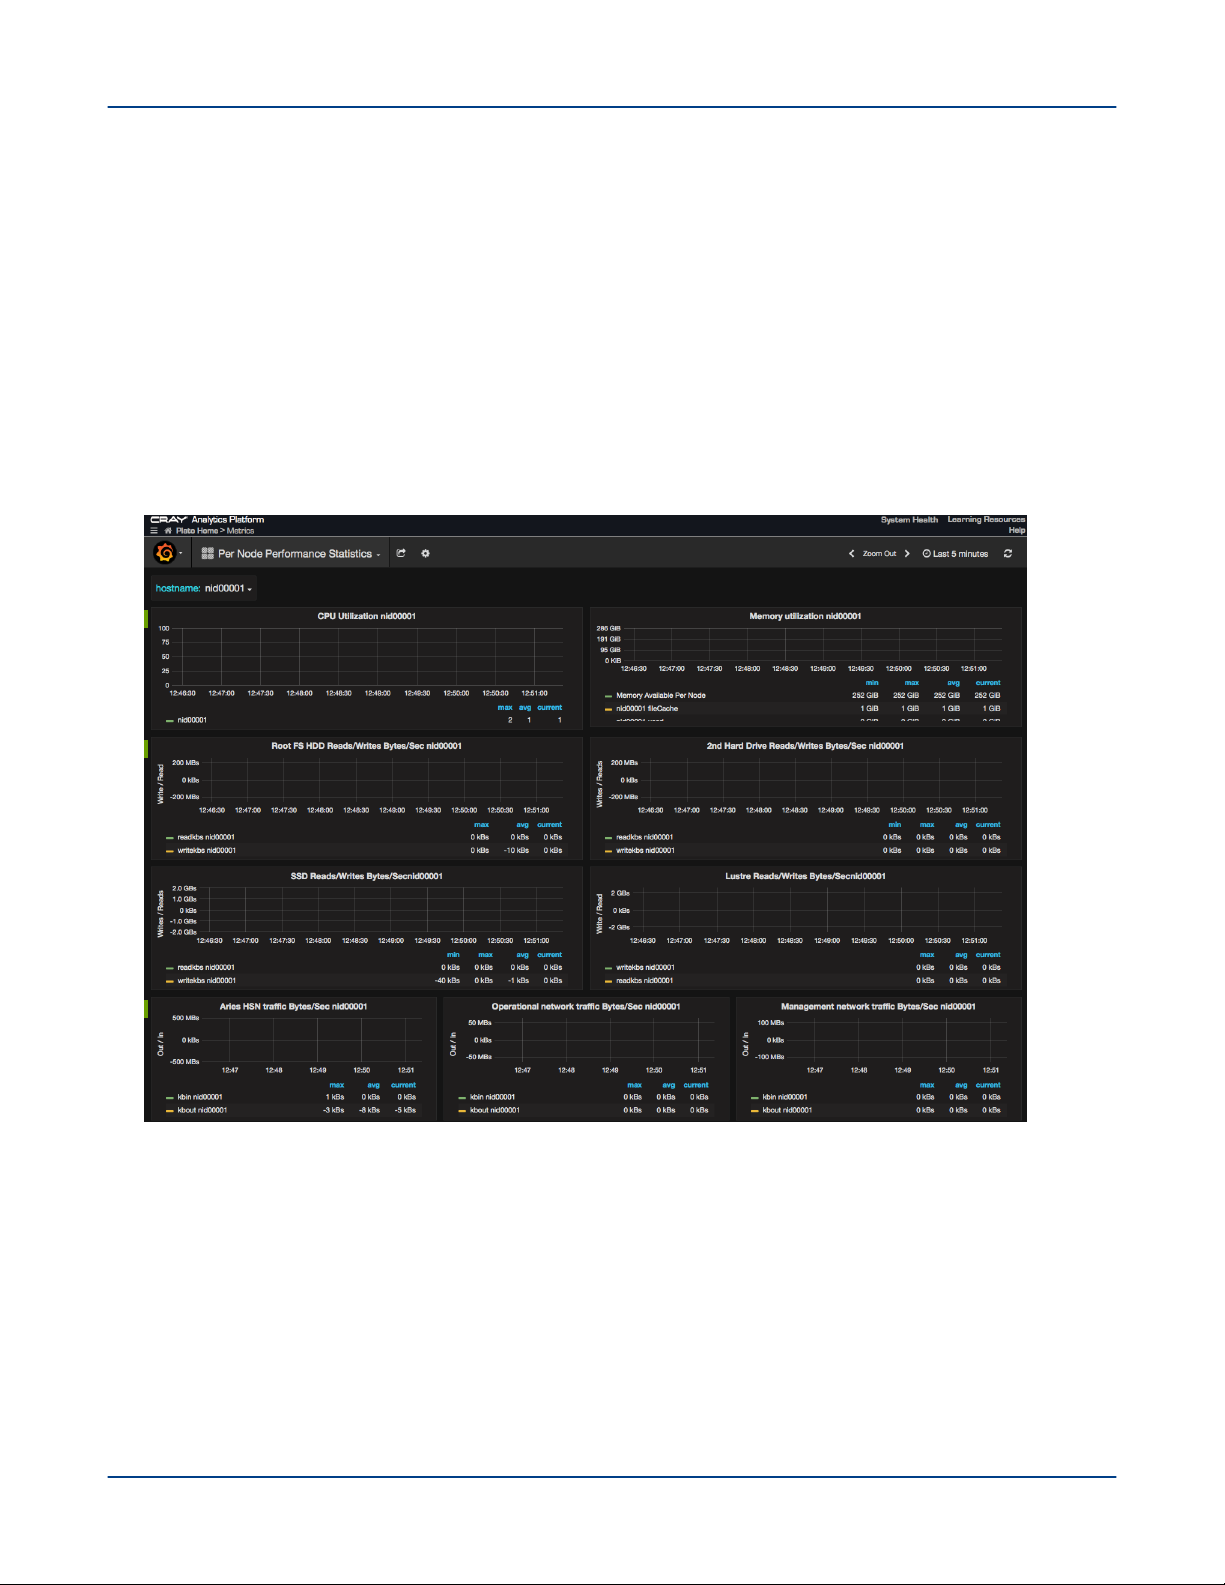
System Monitoring
○ Lustre Read/Writes Bytes/Second - Displays the number of Lustre reads/writes by the selected node.
○ Aries HSN Bytes/Sec In/Out - Displays the Aries network TCP traffic information for the selected node.
Note that non-TCP Aries traffic, including most traffic generated by CGE, is not shown here.
○ Operational network Bytes/sec In/Out - Displays the overall operational network traffic information for
the selected node.
○ Management network Bytes/sec In/Out - Displays the overall management network traffic information
for the selected node.
○ NFS HDFS Lustre Percentage Used - Displays the percentage of NFS, HDFS and Lustre used by the
selected node.
○ File System Percent Used - Displays the percentage of file system used by the selected node.
Figure 11. Per Node Performance Statistics
● SMW Metrics/ - Displays graphs representing statistical data related to SMW's resources, such as the CPU's
memory utilization, root file system, etc.
This dashboard contains the following sections:
○ CPU and MEMORY UTILIZATION - Displays the memory consumption by the SMW's CPU.
▪ User/System CPU Utilization MACHINE_NAME
▪ Memory utilization
○ Root File System Data Rates and Utilization - Displays memory usage and data rate of the SMW's root
file system.
S3016 87
Page 88
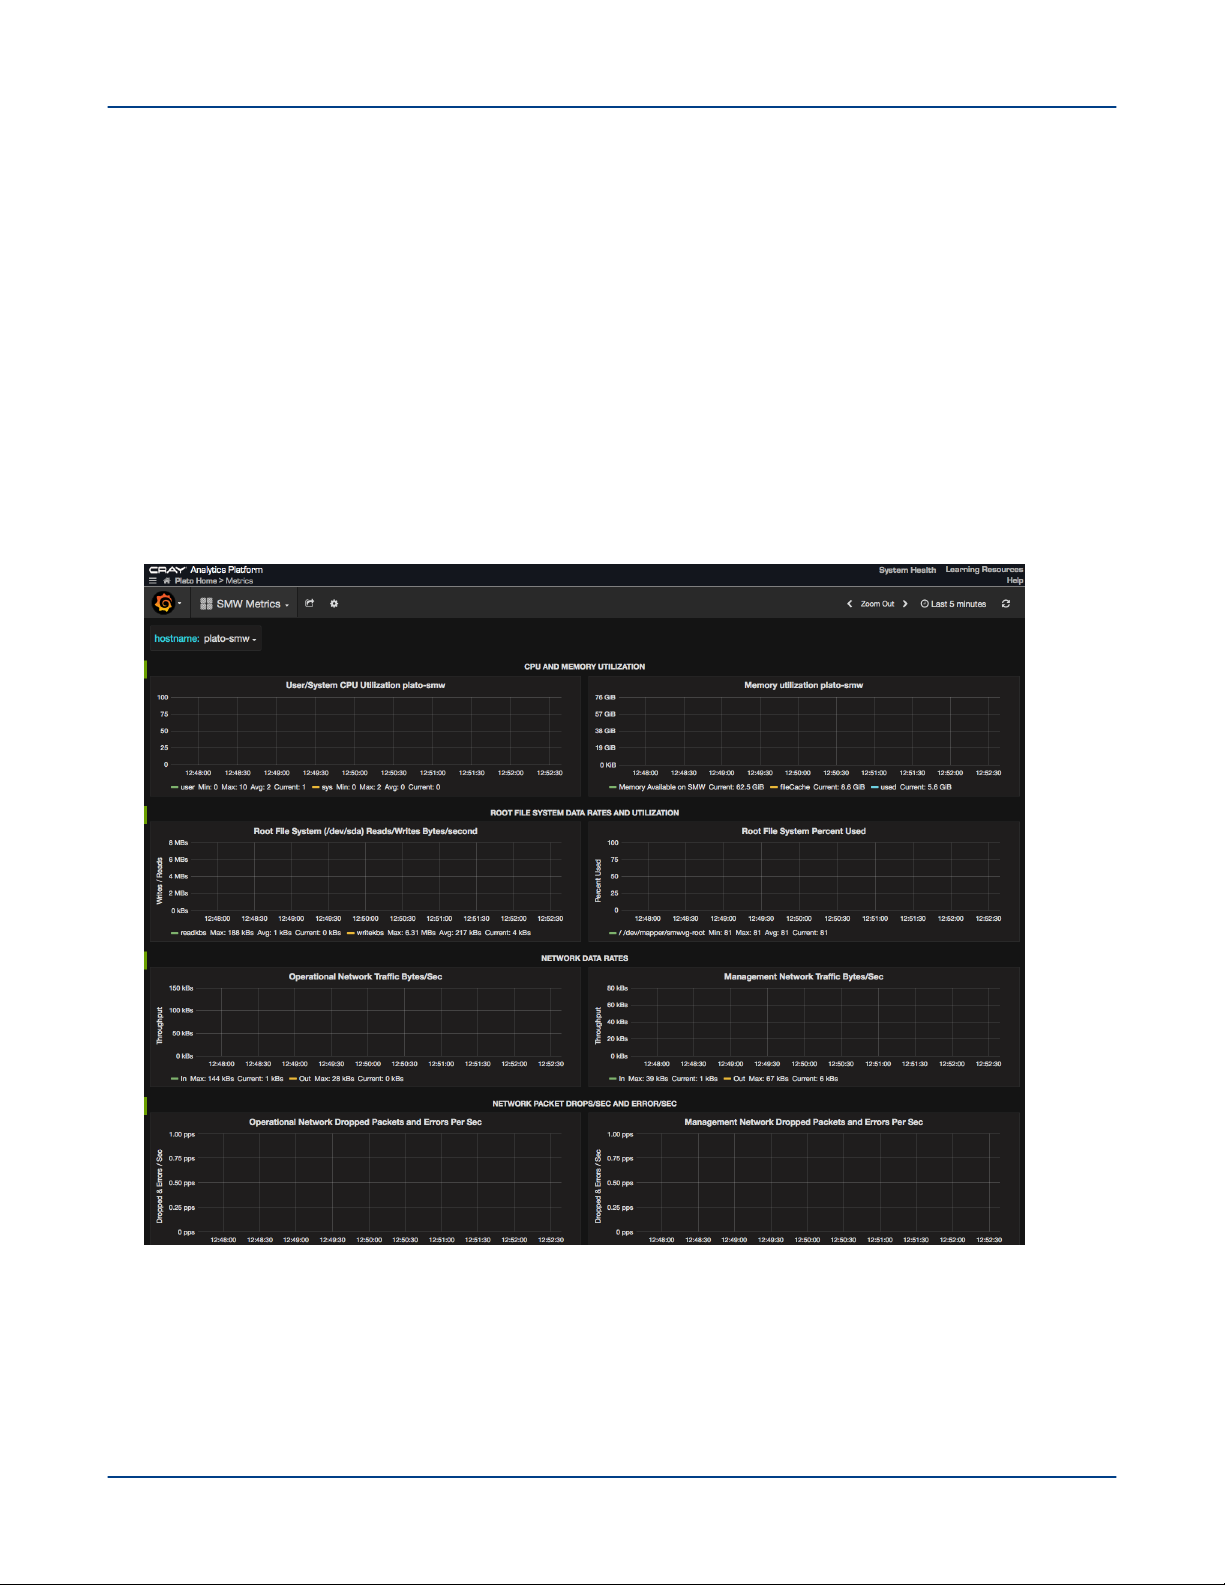
System Monitoring
▪ Root File System Hard Drive (/dev/sda) Reads/Writes Bytes/Sec - Displays information about the
usage of memory on the root file system of the SMW
▪ Root File System Percent Used - Displays the percentage for used SMW root file system space.
○ NETWORK DATA RATES
▪ Operational Network Traffic Bytes/sec - Displays the operational network's data rate.
▪ Management Network Traffic Bytes/sec - Displays the management network's data rate.
○ NETWORK PACKET DROPS/SEC AND ERRORS/SEC
▪ Operational Network Dropped and Errors Per Sec - Displays the number of dropped packets and
errors per second for the operational network.
▪ Management Network Dropped and Errors Per Sec - Displays the number of dropped packets and
errors per second for the management network.
Figure 12. SMW Metrics Dashboard
● Spark Metrics - Displays graphs representing statistical data related to Spark jobs. This dashboard also
contains links for viewing the Spark Web UI and Spark History Server.
S3016 88
Page 89
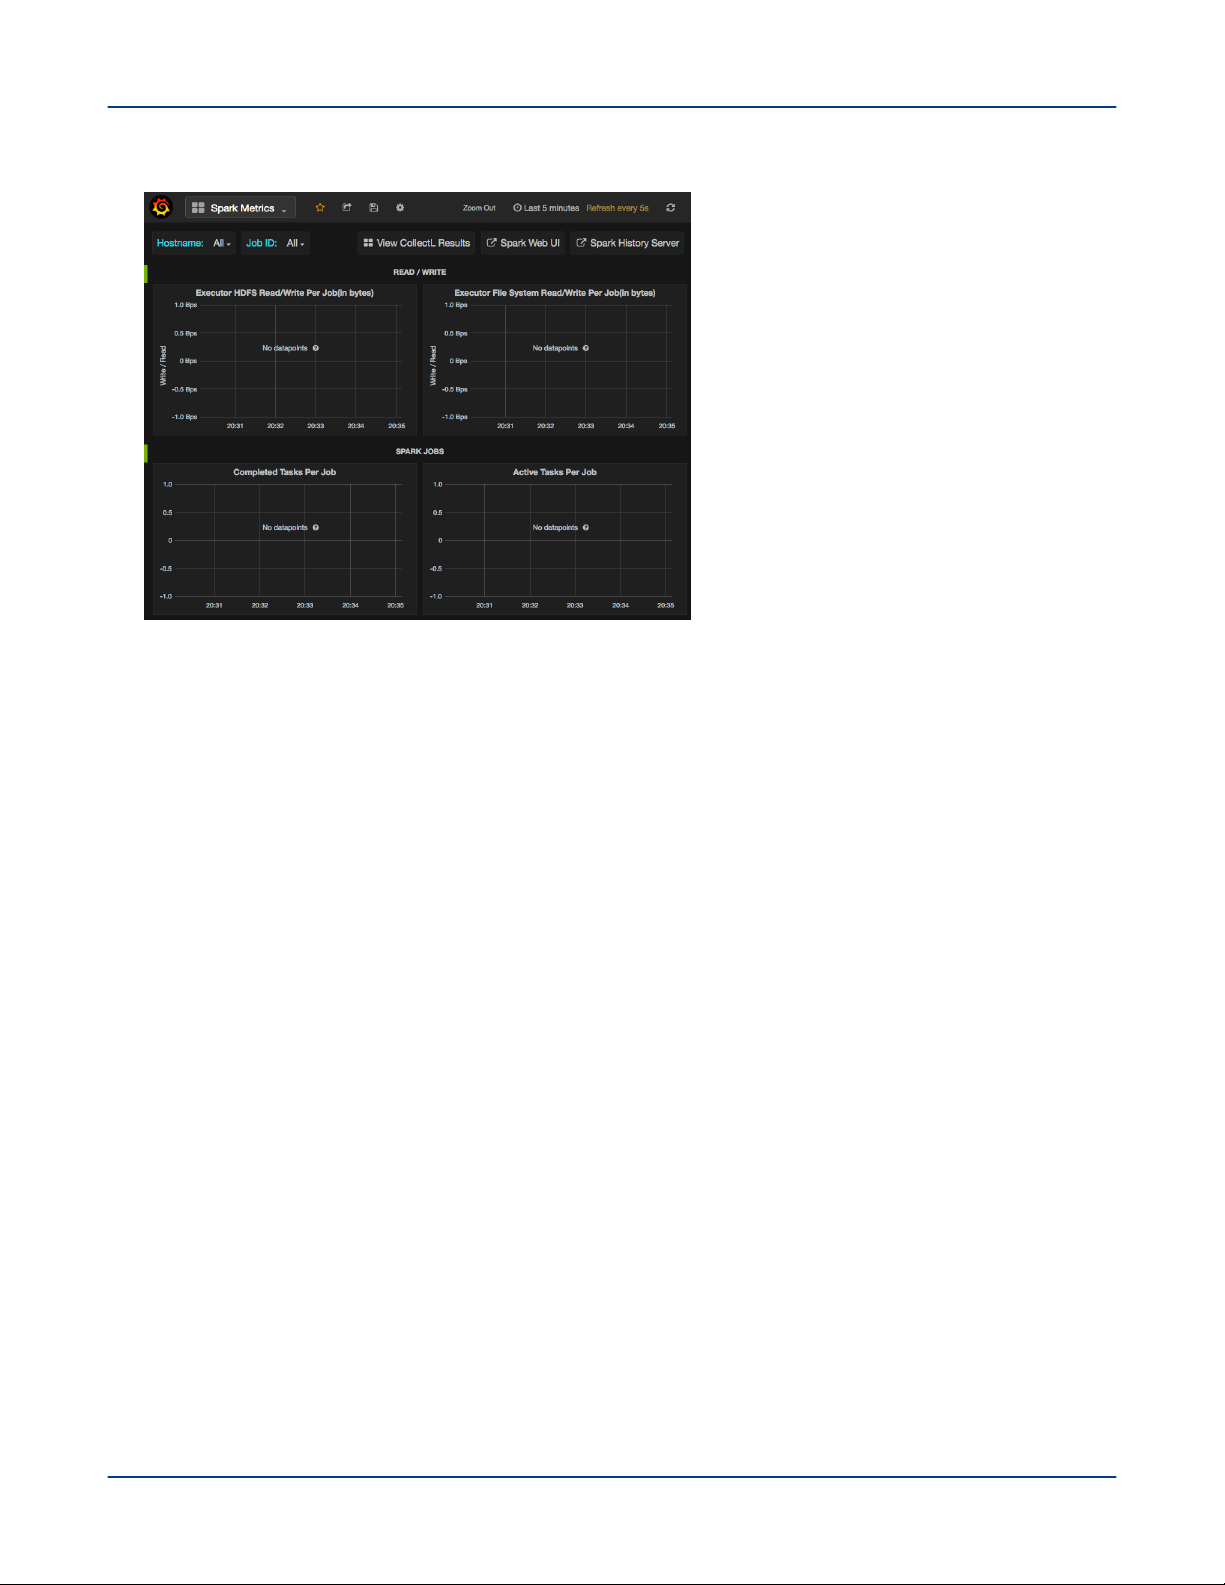
Figure 13. Grafana Spark Metrics Dashboard
Graphs displayed on this dashboard are grouped into the following sections:
System Monitoring
○ READ/WRITE: Displays statistics related to the file system statistics of a Spark executor. Results in the
graphs of this section are displayed per node for a particular Spark Job. The Y-axis displays the number
in bytes, whereas the X-axis displays the start/stop time of the task for a particular Spark Job.
This section contains the following graphs:
▪ Executor HDFS Read/Write Per Job (in bytes): Reading and writing from HDFS.
▪ Executor File System Read/Write Per Job (in bytes): Reading and writing from a File System.
○ SPARK JOBS: Displays statistics related to the list of executors per node for a particular Spark Job. The
Y-axis displays the number of tasks and X-axis displays the start/stop time of the task for a particular
Spark Job.
This section contains the following graphs:
▪ Completed Tasks Per Job: The approximate total number of tasks that have completed execution.
▪ Active Tasks Per Job: The approximate number of threads that are actively executing tasks.
▪ Current Pool Size Per Job: The current number of threads in the pool.
▪ Max Pool Size Per Job: The maximum allowed number of threads that have ever simultaneously
been in the pool.
○ DAG Scheduler - Displays statistics related to Spark's Directed Acyclic Graphs.
This section contains the following graphs:
▪ DAG Schedule Stages - This graph displays the following types of DAG stages:
▪ Waiting Stages: Stages with parents to be computed.
▪ Running Stages: Stages currently being run.
▪ Failed Stages: Stages that failed due to fetch failures (as reported by CompletionEvents for
FetchFailed end reasons) and are going to be resubmitted.
S3016 89
Page 90

System Monitoring
▪ DAG Scheduler Jobs - This graph displays the following types of DAG scheduler jobs:
▪ All Jobs - The number of all jobs
▪ Active Jobs - The number of active jobs
▪ DAG Scheduler Message Processing Time - This graph displays the processing time of the DAG
Scheduler.
○ JVM Memory Usage - The memory usage dashboards represent a snapshot of used memory.
▪ JVM Memory Usage - init: Represents the initial amount of memory (in bytes) that the Java virtual
machine requests from the operating system for memory management during start up. The Java
virtual machine may request additional memory from the operating system and may also release
memory to the system over time. The value of init may be undefined.
▪ JVM Memory Usage - Used: Represents the amount of memory currently used (in bytes).
▪ JVM Memory Usage - Committed: Represents the amount of memory (in bytes) that is guaranteed
to be available for use by the Java virtual machine. The amount of committed memory may change
over time (increase or decrease). The Java virtual machine may release memory to the system and
committed could be less than init. Committed will always be greater than or equal to used.
▪ JVM Memory Usage - Max: Represents the maximum amount of memory (in bytes) that can be used
for memory management. Its value may be undefined. The maximum amount of memory may change
over time if defined. The amount of used and committed memory will always be less than or equal to
max if max is defined. A memory allocation may fail if it attempts to increase the used memory such
that used > committed even if used <= max is still true, for example, when the system is low on
virtual memory.
▪ JVM Heap Usage: Represents the maximum amount of memory used by the JVM heap space
▪ JVM Non-Heap Usage: Represents the maximum amount of memory used by the JVM non-heap
space
4.5
Update InfluxDB Security Settings
Prerequisites
● This procedure requires root privileges.
● Ensure that the system is running in the service mode that allows use of the InfluxDB. Execute the urika-
state or urika-service-mode commands to check the service mode. For more information, refer to the
urika-state or urika-service-mode man pages and see Urika-GX Service Modes on page 177.
About this task
The default configuration for InfluxDB as shipped with Urika-GX is:
1. InfluxDB UI on socket login2:8083 is disabled
2. No authorization is enabled.
S3016 90
Page 91

System Monitoring
This means that any user on login node 2 can call the /bin/influx command and modify databases. To restrict
this to only a privileged user, the admin needs to create an authorized user and enable basic authentication for
InfluxDB.
CAUTION: After creating the privilege user the Grafana data sources must to be updated to provide the
name and password for Grafana queries to InfluxDB to succeed.
To enable add an authorized user and enable basic authentication:
Procedure
1. Log on to login2 (login node 2) and become root.
2. Connect to InfluxDB and add a user named admin user and set its password.
# /bin/influx
Visit https://enterprise.influxdata.com to register for updates, InfluxDB
server management, and monitoring.
Connected to http://localhost:8086 version 0.12.2
InfluxDB shell 0.12.2
> create user admin with password 'admin' with all privileges
> show users
user admin
admin true
3. Edit the /etc/influxdb/influxdb.conf file as root.
# vi /etc/influxdb/influxdb.conf
< change auth to be true, save file, exit >
# systemctl restart influxdb
At this point Grafana dashboards will still work because Grafana is shipped with credentials for InfluxDB to be
user admin with admin as the password. If the privileged user differs from these defaults Grafana queries will
fail and graphs in dashboards will not work. To resolve this issue, log on to Grafana as the admin user and
open each data source, edit the InfluxDB details, updating the user and password to match that of the
privileged InfluxDB user.
For more information, visit https://docs.influxdata.com/.
4.6
Update the InfluxDB Data Retention Policy
Prerequisites
This procedure requires root privileges. Before performing this procedure, use the urika-state command to
ensure that the system is operating in the service mode that supports using InfluxDB. For more information, see
the urika-state man page and refer to Urika-GX Service Modes on page 177.
S3016 91
Page 92

System Monitoring
About this task
The data retention policy for InfluxDB defaults to infinite, i.e. data is never deleted. As a result, Spark and Hadoop
Grafana dashboards may take longer to load and InfluxDB may take up more space than necessary. To reduce
the amount of space being used by InfluxDB, the data retention policy for each database needs to be reduced, as
described in this procedure. Reducing the data retention policy for Spark and Hadoop databases can reduce the
load time of the Spark and Hadoop Grafana dashboards.
Procedure
1. Log on to login2 and become root.
2. Switch to the /var/lib/influxdb/data directory.
# cd /var/lib/influxdb/data
3. Use the du command to show how much space being used.
The sizes below are shown as examples. Actual sizes on the system may vary.
$ du -sh *
14G Cray Urika GX
1.5G CrayUrikaGXHadoop
906M CrayUrikaGXSpark
21M _internal
#
4. Connect to InfluxDB to view the current data retention policy.
# /bin/influx
Visit https://enterprise.influxdata.com to register for updates, InfluxDB
server management, and monitoring.
Connected to http://localhost:8086 version 0.12.2
InfluxDB shell 0.12.2
> show retention policies on "Cray Urika GX"
name duration shardGroupDuration replicaN default
default 0 168h0m0s 1 true
5. Update the data retention policy according to requirements.
In this example the data retention duration is changed from 0 (forever) to 2 weeks (504 hours).
> alter retention policy default on "Cray Urika GX" Duration 2w
> show retention policies on "Cray Urika GX"
name duration shardGroupDuration replicaN default
default 504h0m0s 24h0m0s 1 true
> exit
The change will take a while to be applied. The default is 30 minutes.
6. Verify that the data retention change has taken effect
# du -sh *
3G Cray Urika GX
1.5G CrayUrikaGXHadoop
906M CrayUrikaGXSpark
21M _internal
S3016 92
Page 93

System Monitoring
4.7 Configuration Settings of Grafana
Grafana's configuration options can be specified using environment variables or the grafana.ini configuration
file, which is located at /etc/grafana/. This file contains default settings that Urika-GX ships with, and can be
modified as needed. Options in this configuration file can be overridden using environment variables.
Grafana needs to be restarted for the changes in the grafana.ini file to take effect. To do so, log onto login2
(login node 2), become root or use sudo, and then execute the following command:
# systemctl restart grafana-server
In addition, the metrics that Grafana displays on the UI are retrieved from the collectl.conf file, which
specifies the list of metrics that need to be collected from each node and stored in InfluxDB. By default, a subset
of the list of collected metrics is displayed on the Grafana dashboard. Users with admin or editor privileges can
create/modify dashboards to update the default list of displayed metrics if needed. The collectl.conf
configuration file contains instructions for making such updates.
4.8 Change the Default Timezone Displayed on Grafana
Prerequisites
This procedure requires root privileges. Before performing this procedure, use the urika-state command to
ensure that the system is operating in the service mode that supports using Grafana. For more information, see
the urika-state man page and refer to Urika-GX Service Modes on page 177.
About this task
Urika-GX ships with UTC as the default timezone displayed on the Grafana UI. This procedure can be used to
change the timezone for newly created dashboards or copies of the predefined dashboards shipped with the
system.
NOTE: The timezone for the default set of Dashboards shipped with the system cannot be changed.
Since the time displayed on the Grafana UI uses the browser's timezone and that displayed on the Spark
History server's UI uses the Urika-GX system's timezone, the timezones displayed on the two UIs may
not be the same.
Procedure
1. Access the Grafana UI using the Urika-GX Applications Interface by pointing a browser at http://
hostname-login1 (which is the recommended way of access) or at http://hostname-login2:3000.
2. Log on to Grafana as an admin.
S3016 93
Page 94
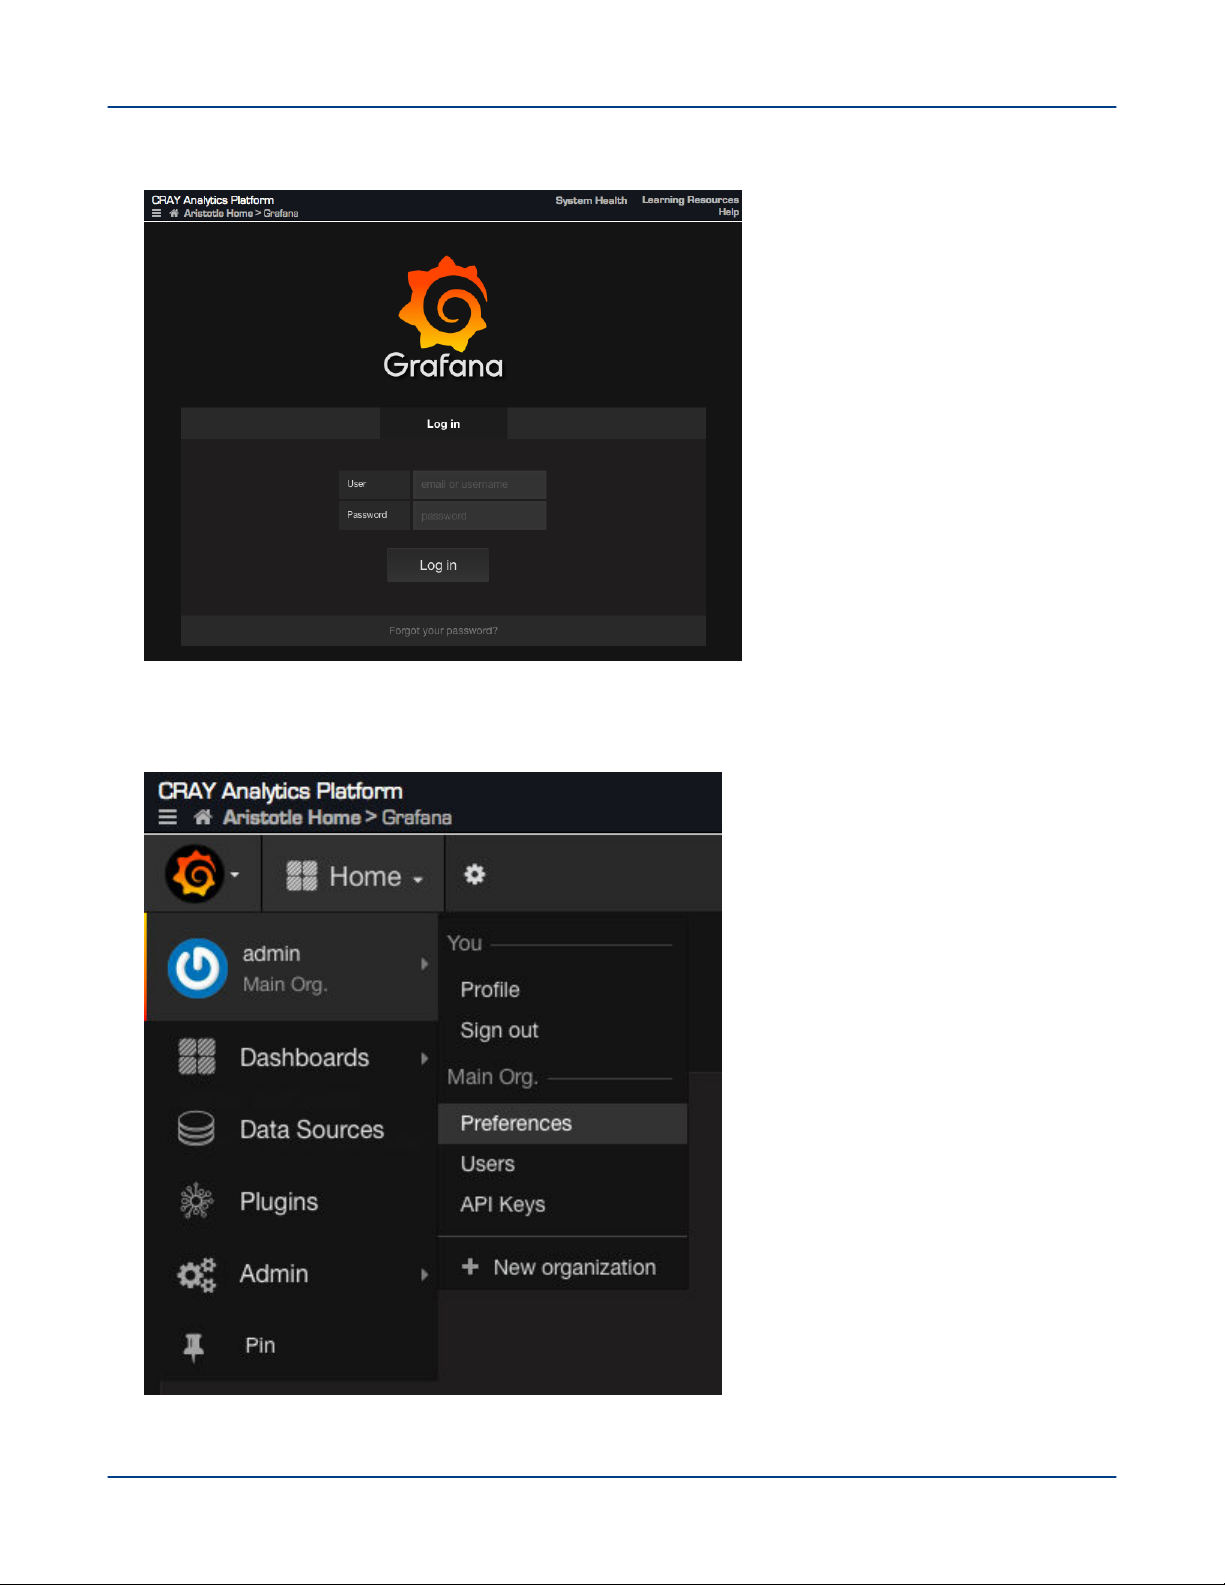
Figure 14. Grafana Login Screen
System Monitoring
3. Select Home >admin > Preferences
Figure 15. Preferences Interface
S3016 94
Page 95
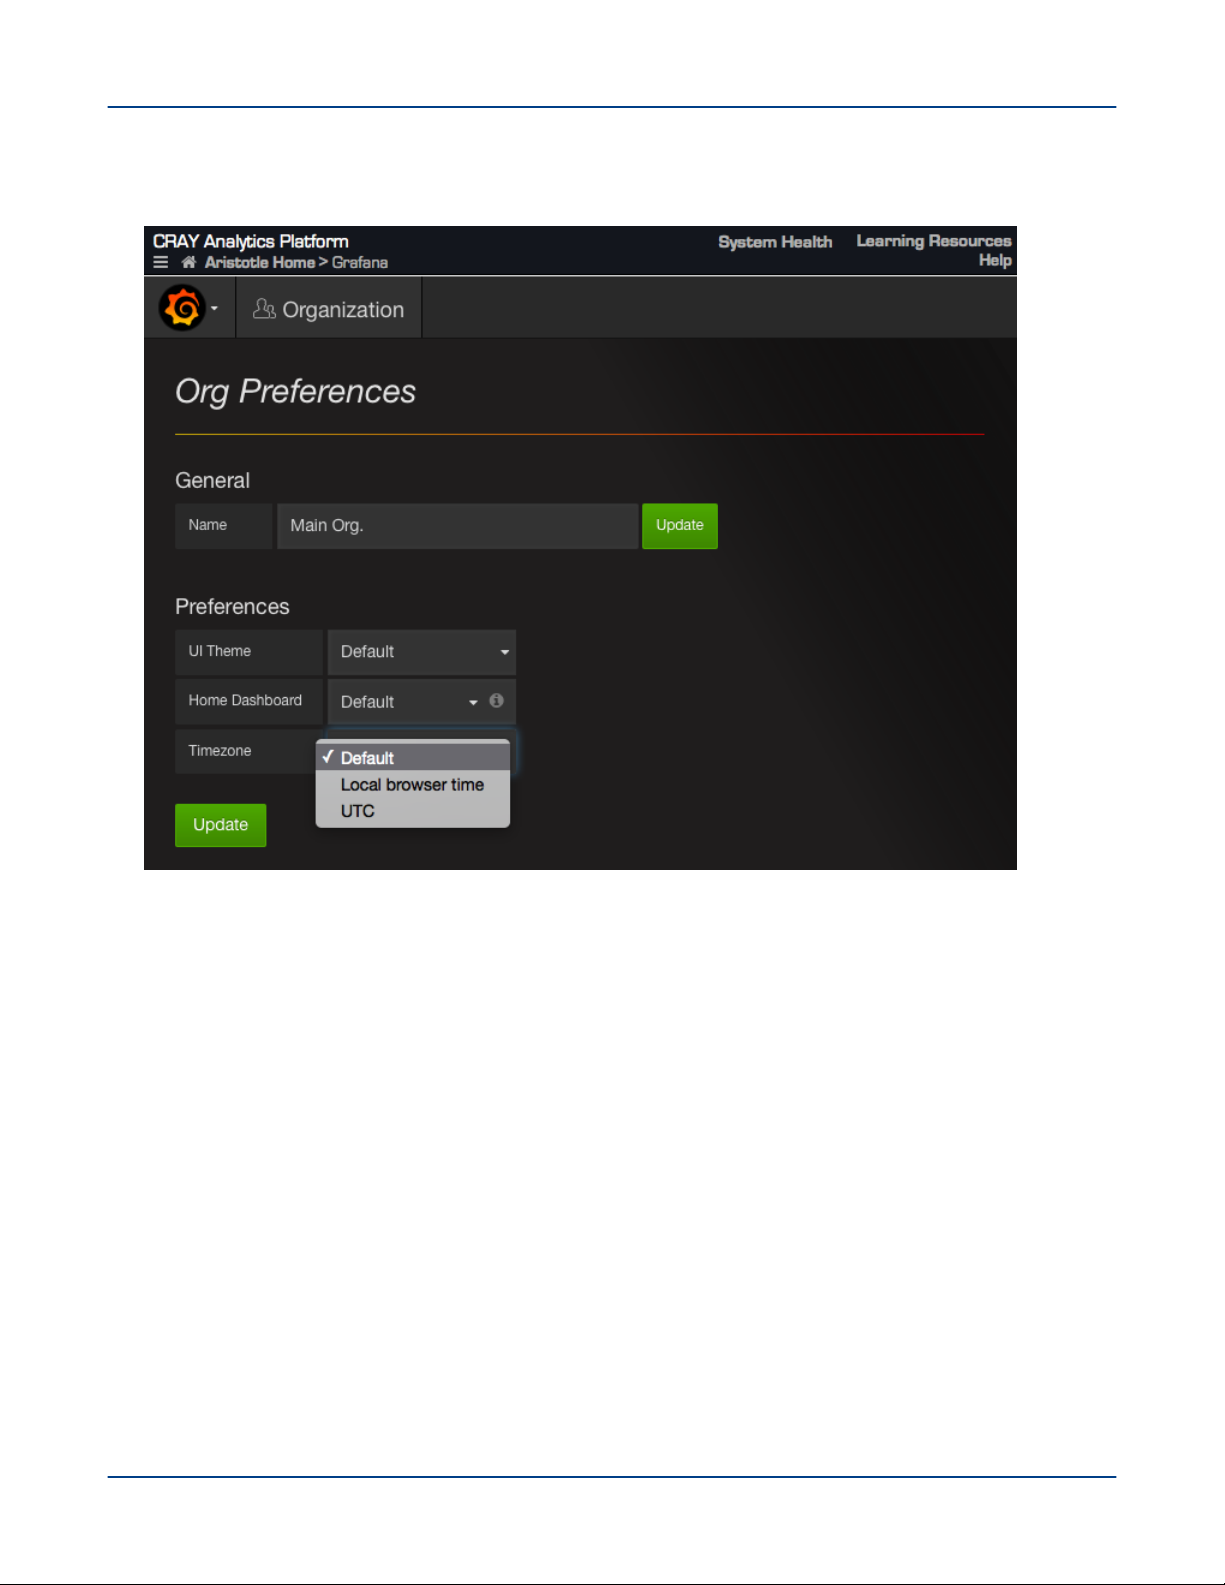
System Monitoring
4. Use the Timezone drop down on the Org Preferences page to select the timezone of choice.
Figure 16. Org Preferences Interface
4.9 Create a New Grafana Dashboard
Prerequisites
This procedure requires administrative privileges. Before performing this procedure, use the urika-state
command to ensure that the system is operating in the service mode that supports using Grafana. For more
information, see the urika-state man page and refer to Urika-GX Service Modes on page 177.
About this task
In addition to the default set of dashboards, administrators can add additional dashboards to the Grafana UI, as
described in the following instructions.
IMPORTANT: New graphs can be created/added by user of any role type. However, those added by a
user with the role of a 'Viewer' persist only for the current session and will be deleted once the user logs
out.
S3016 95
Page 96
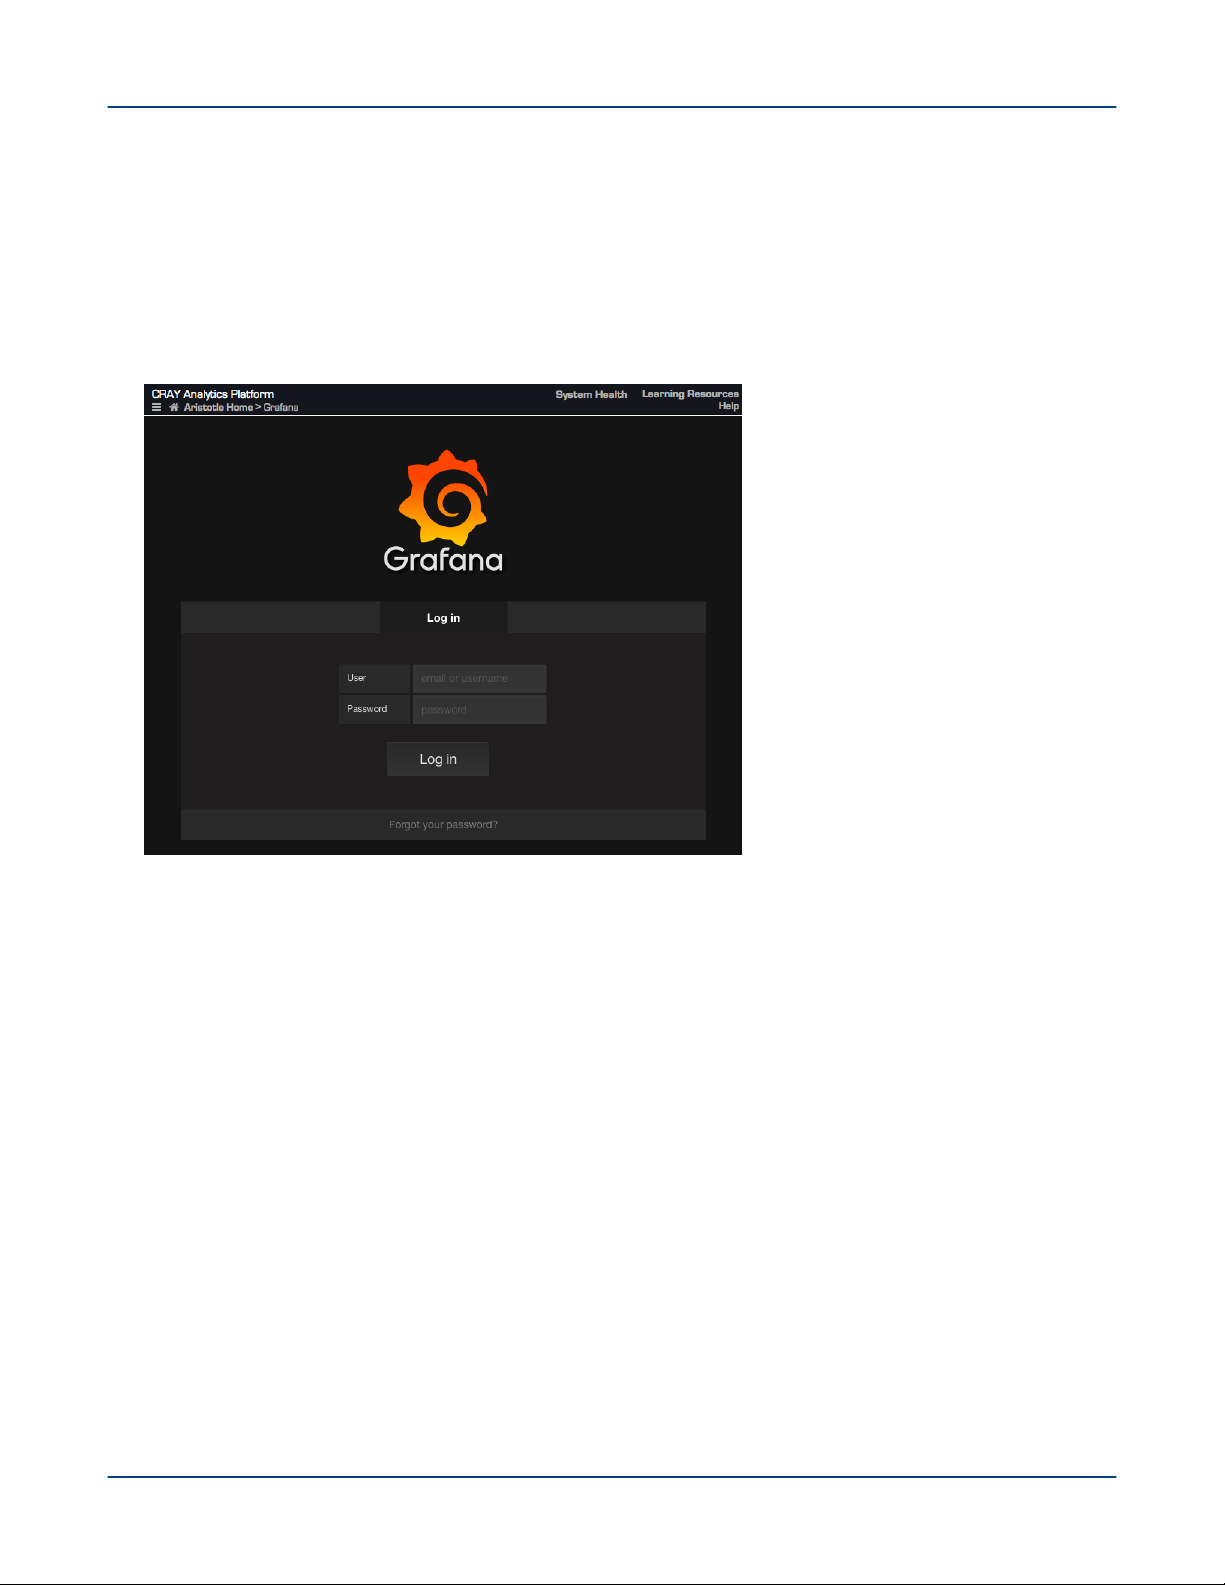
System Monitoring
Procedure
1. Access the Grafana UI using the Urika-GX Applications Interface by pointing a browser at http://
hostname-login1 (which is the recommended way of access) or at http://hostname-login2:3000.
2. Log on to Grafana by entering LDAP credentials, or credentials of the default Grafana account (username:
admin, password: admin) to log on to Grafana.
Figure 17. Grafana Login Screen
3. Select Home from the top of the interface and then select the New button from the displayed pop-up.
S3016 96
Page 97
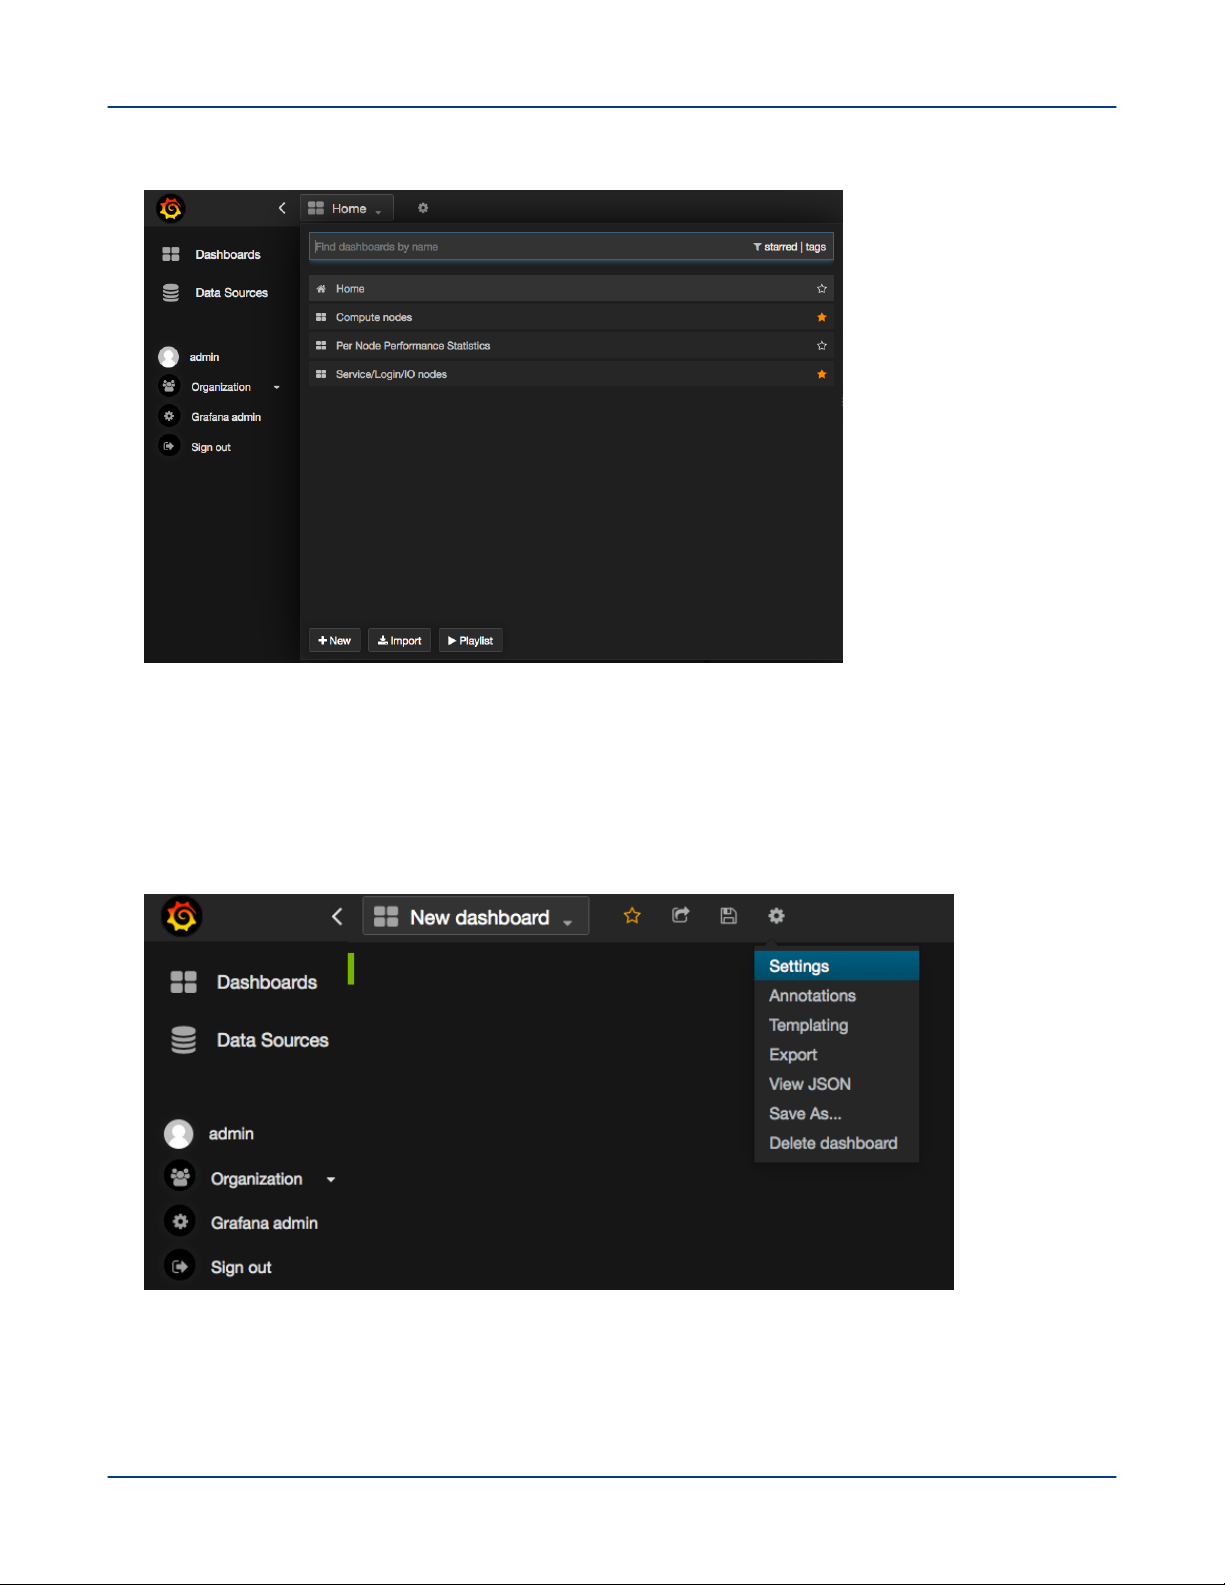
Figure 18. New Dashboard Pop-up
System Monitoring
4. Select Dashboard from the left navigation menu
5. Add panels/graphs/rows to the new dashboard and customize as needed.
6. Optional: Update the dashboard's default settings using Settings from the configuration gear at the top of the
interface.
Figure 19. Select Grafana Settings
S3016 97
Page 98
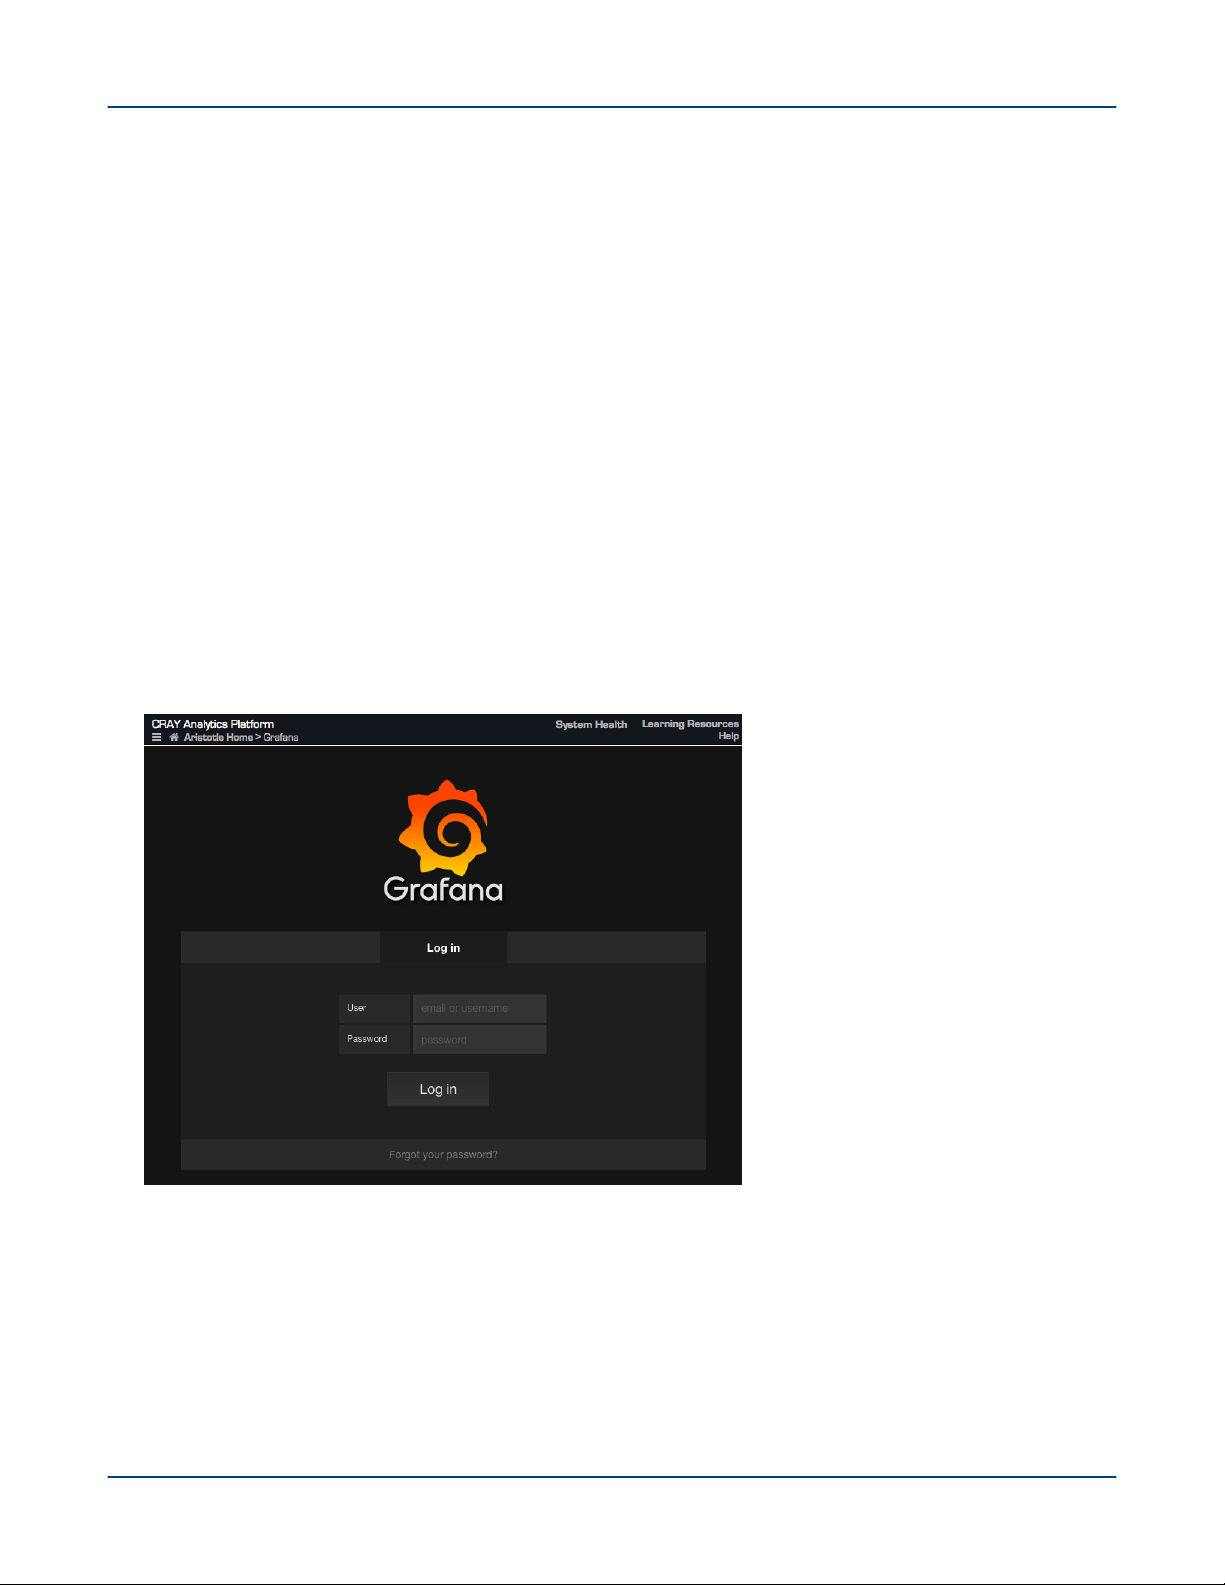
System Monitoring
4.10 Add a New Graph to the Grafana Dashboard
Prerequisites
This procedure requires administrative privileges. Before performing this procedure, use the urika-state
command to ensure that the system is operating in the service mode that supports using Grafana. For more
information, see the urika-state man page and refer to Urika-GX Service Modes on page 177.
About this task
In addition to the default set of panels, administrators can add additional panels to the Dashboard of the Grafana
UI, as described in the following instructions.
Procedure
1. Access the Grafana UI using the Urika-GX Applications Interface by pointing a browser at http://
hostname(which is the recommended method) or at http://hostname:3000.
2. Log on to Grafana by entering LDAP credentials, or credentials of the default Grafana account (username:
admin, password: admin) to log on to Grafana.
Figure 20. Grafana Login Screen
3. Select the dashboard that the new graph needs to be added to.
S3016 98
Page 99
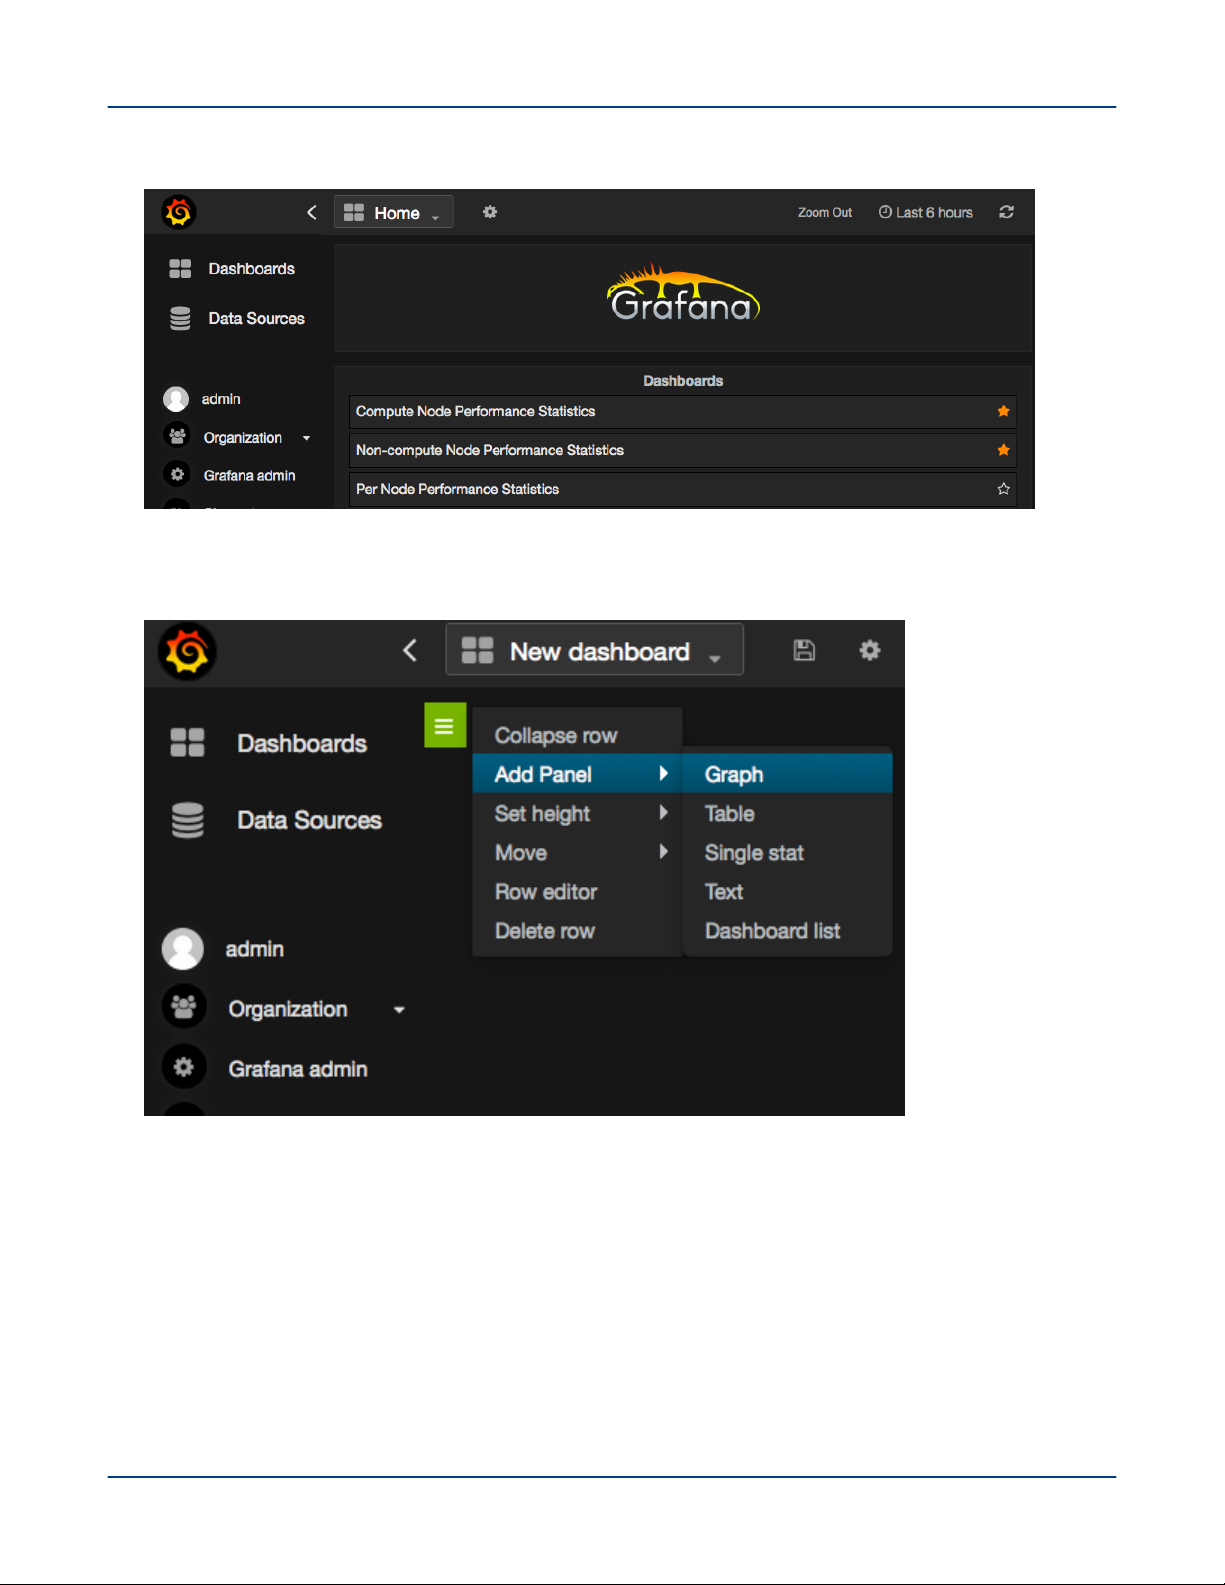
Figure 21. Default Grafana UI on Urika-GX
4. Select Add Panel > graph from the green menu on the left side of the Dashboard.
Figure 22. Add a New Graph to Grafana Dashboard
System Monitoring
5. Click on the title of the new panel and select edit as shown in the following figure:
S3016 99
Page 100
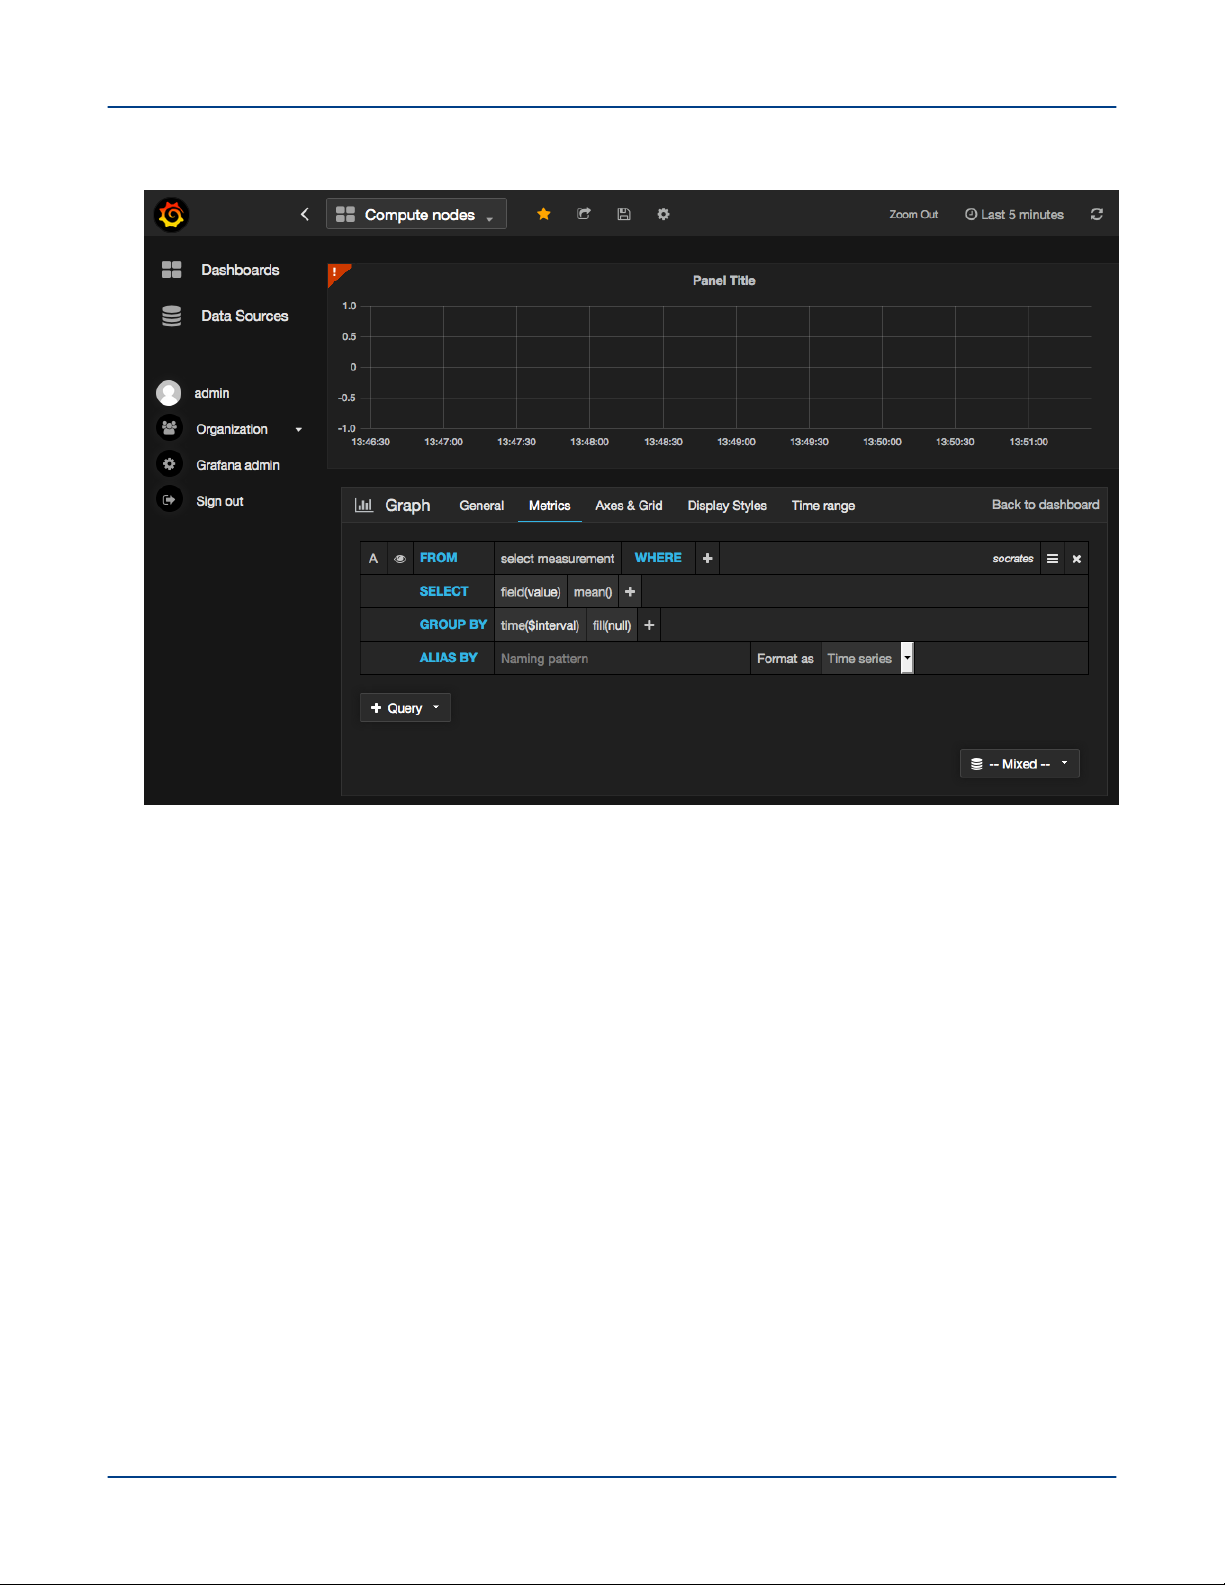
Figure 23. Edit a Grafana Panel
System Monitoring
6. Enter a title for the graph in the Title field of the General tab and optionally specify a span and/or height for
the graph.
7. Specify/select metrics using UI elements.
8. Optional: Click on the Axes & Grid and/or Display Styles tabs for specifying formatting options for the graph.
4.11
Start InfluxDB Before Hadoop Services
Prerequisites
This procedure requires root privileges. Before performing this procedure, use the urika-state command to
ensure that the system is operating in the service mode that supports using InfluxDB. For more information, see
the urika-state man page and refer to Urika-GX Service Modes on page 177.
About this task
If the Hadoop Cluster Metrics Grafana dashboard takes too long to populate, it may because the InfluxDB
service was started after Hadoop services. Follow the instructions documented in this procedure to troubleshoot
this issue.
S3016 100
 Loading...