

Page 1
Flow Processor
EC80
CXX-UM-03060-EN-01 (April 2019)
User Manual
Page 2

Flow Processor, EC80
April 2019CXX-UM-03060-EN-01Page ii
Page 3

User Manual
CONTENTS
Description. . . . . . . . . . . . . . . . . . . . . . . . . . . . . . . . . . . . . . . . . . . . . . 5
Safety information . . . . . . . . . . . . . . . . . . . . . . . . . . . . . . . . . . . . . . . . .5
Safety Symbol Explanations . . . . . . . . . . . . . . . . . . . . . . . . . . . . . . . . 5
Unpacking and Inspection . . . . . . . . . . . . . . . . . . . . . . . . . . . . . . . . . . . . 5
Operating Principle . . . . . . . . . . . . . . . . . . . . . . . . . . . . . . . . . . . . . . . . 6
Installation . . . . . . . . . . . . . . . . . . . . . . . . . . . . . . . . . . . . . . . . . . . . . .7
Precautions . . . . . . . . . . . . . . . . . . . . . . . . . . . . . . . . . . . . . . . . . . 7
Typical Congurations . . . . . . . . . . . . . . . . . . . . . . . . . . . . . . . . . . . 8
Input. . . . . . . . . . . . . . . . . . . . . . . . . . . . . . . . . . . . . . . . . . . . . . . . . 10
Analog Input . . . . . . . . . . . . . . . . . . . . . . . . . . . . . . . . . . . . . . . . 10
Outputs . . . . . . . . . . . . . . . . . . . . . . . . . . . . . . . . . . . . . . . . . . . . . . . 11
Wiring and Jumpers . . . . . . . . . . . . . . . . . . . . . . . . . . . . . . . . . . . . . . . 12
RM1 . . . . . . . . . . . . . . . . . . . . . . . . . . . . . . . . . . . . . . . . . . . . . . 12
RM2 . . . . . . . . . . . . . . . . . . . . . . . . . . . . . . . . . . . . . . . . . . . . . . 14
XP1 . . . . . . . . . . . . . . . . . . . . . . . . . . . . . . . . . . . . . . . . . . . . . . 15
Dimensions . . . . . . . . . . . . . . . . . . . . . . . . . . . . . . . . . . . . . . . . . . . . 17
RM1 Conguration. . . . . . . . . . . . . . . . . . . . . . . . . . . . . . . . . . . . . 17
RM2 Conguration. . . . . . . . . . . . . . . . . . . . . . . . . . . . . . . . . . . . . 17
XP1 Conguration . . . . . . . . . . . . . . . . . . . . . . . . . . . . . . . . . . . . . 18
Specications . . . . . . . . . . . . . . . . . . . . . . . . . . . . . . . . . . . . . . . . . . . 19
Using the IFC Software . . . . . . . . . . . . . . . . . . . . . . . . . . . . . . . . . . . . . 20
Password Initialization . . . . . . . . . . . . . . . . . . . . . . . . . . . . . . . . . . 20
Establish Link Via RS485 . . . . . . . . . . . . . . . . . . . . . . . . . . . . . . . . . 21
Establish Link Via Ethernet. . . . . . . . . . . . . . . . . . . . . . . . . . . . . . . . 22
Prole . . . . . . . . . . . . . . . . . . . . . . . . . . . . . . . . . . . . . . . . . . . . . . . . 22
Creating, Saving and Loading Proles. . . . . . . . . . . . . . . . . . . . . . . . . 22
Uploading a Prole . . . . . . . . . . . . . . . . . . . . . . . . . . . . . . . . . . . . 22
Prole Programming. . . . . . . . . . . . . . . . . . . . . . . . . . . . . . . . . . . . . . . 23
Table Data Entry . . . . . . . . . . . . . . . . . . . . . . . . . . . . . . . . . . . . . . 25
Page iii CXX-UM-03060-EN-01April 2019
Page 4

Flow Processor, EC80
Linearization . . . . . . . . . . . . . . . . . . . . . . . . . . . . . . . . . . . . . . . . 26
Rotor Ratio. . . . . . . . . . . . . . . . . . . . . . . . . . . . . . . . . . . . . . . . . . 28
Pressure Calibration . . . . . . . . . . . . . . . . . . . . . . . . . . . . . . . . . . . . 29
Temperature Compensation. . . . . . . . . . . . . . . . . . . . . . . . . . . . . . . 29
Conguring Flow processor Outputs and Inputs . . . . . . . . . . . . . . . . . . . . . 30
Frequency Outputs (1 and 2) . . . . . . . . . . . . . . . . . . . . . . . . . . . . . . 30
Analog Output (Channels 1, 2, 3 and 4). . . . . . . . . . . . . . . . . . . . . . . . 31
Conguring Analog Input . . . . . . . . . . . . . . . . . . . . . . . . . . . . . . . . 32
Conguring Liquid Properties. . . . . . . . . . . . . . . . . . . . . . . . . . . . . . . . . 33
Temperature vs Viscosity Table . . . . . . . . . . . . . . . . . . . . . . . . . . . . . 34
Temperature vs Density Table . . . . . . . . . . . . . . . . . . . . . . . . . . . . . . 35
Liquid Pressure Compensation . . . . . . . . . . . . . . . . . . . . . . . . . . . . . 35
Hardware Conguration . . . . . . . . . . . . . . . . . . . . . . . . . . . . . . . . . . . . 36
Model Information. . . . . . . . . . . . . . . . . . . . . . . . . . . . . . . . . . . . . 36
General Hardware Information . . . . . . . . . . . . . . . . . . . . . . . . . . . . . 36
Oscillation . . . . . . . . . . . . . . . . . . . . . . . . . . . . . . . . . . . . . . . . . . 37
Meter Selection (BUS ID) . . . . . . . . . . . . . . . . . . . . . . . . . . . . . . . . . 37
Real-time Monitoring . . . . . . . . . . . . . . . . . . . . . . . . . . . . . . . . . . . . . .38
Real-Time Report Display. . . . . . . . . . . . . . . . . . . . . . . . . . . . . . . . . 39
Flow processor Programming . . . . . . . . . . . . . . . . . . . . . . . . . . . . . . . . . 40
Downloading Proles . . . . . . . . . . . . . . . . . . . . . . . . . . . . . . . . . . . 40
Locating Multiple EC80 Flow Processors . . . . . . . . . . . . . . . . . . . . . . . 41
Commands . . . . . . . . . . . . . . . . . . . . . . . . . . . . . . . . . . . . . . . . . 42
Conguration Options . . . . . . . . . . . . . . . . . . . . . . . . . . . . . . . . . . . . . 42
General . . . . . . . . . . . . . . . . . . . . . . . . . . . . . . . . . . . . . . . . . . . . 42
Report Display . . . . . . . . . . . . . . . . . . . . . . . . . . . . . . . . . . . . . . . 43
Communication (Comm.) . . . . . . . . . . . . . . . . . . . . . . . . . . . . . . . . 43
Database, Gator Display, Gator Report and Real Time Clock (RTC) . . . . . . . 43
Version Information . . . . . . . . . . . . . . . . . . . . . . . . . . . . . . . . . . . . . . . 43
April 2019CXX-UM-03060-EN-01Page iv
Page 5

Description
DESCRIPTION
The EC80 Flow Processor provides a state-of-the-art interface for today’s flow
meters. With multiple frequency inputs and one temperature input in a compact
design, the flow processor is compatible with single and dual rotor turbine flow
meters for precise calculation and output of flow rate or accumulated flow.
The linearization, viscosity and density correction features improve flowmeter
accuracy to the highest levels available today. Our newest feature allows the flow
processor, with a Cox Auto Viscosity Turbine Meter, to automatically measure and
compensate for kinematic liquid viscosity.
SAFETY INFORMATION
The installation of the flow processor must comply with all applicable federal,
state and local rules, regulations and codes.
Failure to read and follow these instructions can lead to misapplication or misuse
of the flow processor, resulting in personal injury and damage to equipment.
Safety Symbol Explanations
DANGER
INDICATES A HAZARDOUS SITUATION, WHICH, IF NOT AVOIDED WILL RESULT
IN DEATH OR SERIOUS PERSONAL INJURY.
INDICATES A HAZARDOUS SITUATION, WHICH, IF NOT AVOIDED COULD
RESULT IN DEATH OR SERIOUS PERSONAL INJURY.
INDICATES A HAZARDOUS SITUATION, WHICH, IF NOT AVOIDED COULD
RESULT IN MINOR OR MODERATE PERSONAL INJURY OR DAMAGE TO
PROPERTY.
UNPACKING AND INSPECTION
Upon opening the shipping container, visually inspect the product and applicable
accessories for any physical damage such as scratches, loose or broken parts, or
any other sign of damage that may have occurred during shipment.
OTE:N If damage is found, request an inspection by the carrier's agent within 48
hours of delivery and file a claim with the carrier. A claim for equipment
damage in transit is the sole responsibility of the purchaser.
Page 5 CXX-UM-03060-EN-01April 2019
Page 6
Operating Principle
RTD
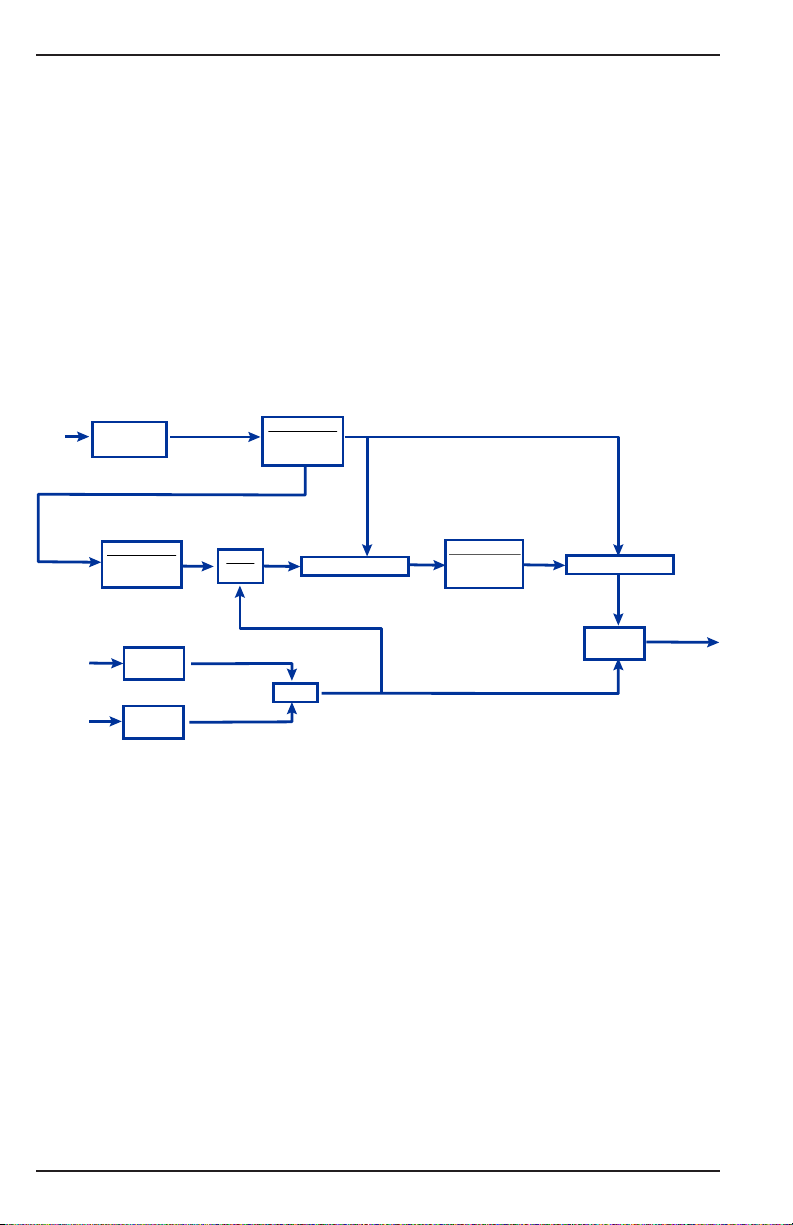
OPERATING PRINCIPLE
The EC80 Flow Processor accepts all types of square wave pulse inputs. Fully
compensated and linearized volumetric flow rates, totals and temperature are
examples of flow parameters that can be viewed through serial communications,
included software program or an embedded rate indicator (depending on
product configuration).
The EC80 Flow Processor can use a universal viscosity curve to compensate for
varying liquid temperature and viscosity conditions. It can also use
Strouhal-Roshko algorithms for a more comprehensive compensation method,
taking into consideration all the secondary effects to which the meter is sensitive
like the expansion and contraction of the meter bore diameter. The flow processor
extracts the density value of a known liquid from a stored temperature/density
table and multiplies by the volumetric flow rate to get the inferred mass flow rate.
Measure
Temperature
Counts
Lookup Table
Temperature
vs Counts
Temp
Temp
Rotor A
Rotor B
Lookup Table
Viscosity vs
Temperature
Measure
Frequency
Measure
Frequency
Ro
v
Fa
Fb
act
Fsum
v
1+2(alpha)(deltaT)
Fsum
Fa+Fb
Figure 1: Flow Processor Calculations
Ro
ref
Lookup Table
Strouhol vs
Roshko
St
ref
1-3(alpha)( delta T)
St
act
Calculate
Flow Rate
Q
supply
April 2019CXX-UM-03060-EN-01Page 6
Page 7

Installation
INSTALLATION
Precautions
• Turn off power supply prior to making any connections to the flow processor.
• Verify that the power supply is rated to deliver enough current for
your application.
• Do not submerge or place flow processor in moisture-prone environments.
• Do not place the flow processor in close proximity to high voltage and/or
current carrying lines. It is sensitive to Electro-Magnetic Interference (EMI).
• Verify that all terminations at the flow processor are free from frayed wires and
terminate with proper insulation at terminal blocks.
• Before applying supply power, make sure the power setting is not in excess
of the flow processor’s rating. A setting over the rating will cause the flow
processor to fail and not be covered under the warranty.
• Tighten all terminal block connections with reasonable firmness. Do not
over-tighten the screw down terminals.
• Use adequately gauged wires for transferring signals to and from the flow
processor printed circuit board (PCB).
• Make sure the PCB will not be exposed to excessive shock.
• Make sure the PCB will not be exposed to heat that exceeds the temperature
rating of the flow processor electronics.
• Pay careful attention to the grounding scheme for your application. Use low
impedance grounds, common to all electronics.
• If the PCB is exposed, be careful that debris, loose conductor strands or any
other foreign matter does not come in contact with terminals and/or electrical
components and connections.
Page 7 CXX-UM-03060-EN-01April 2019
Page 8
Installation
C
(NOT INCLUDED)
DETAIL N
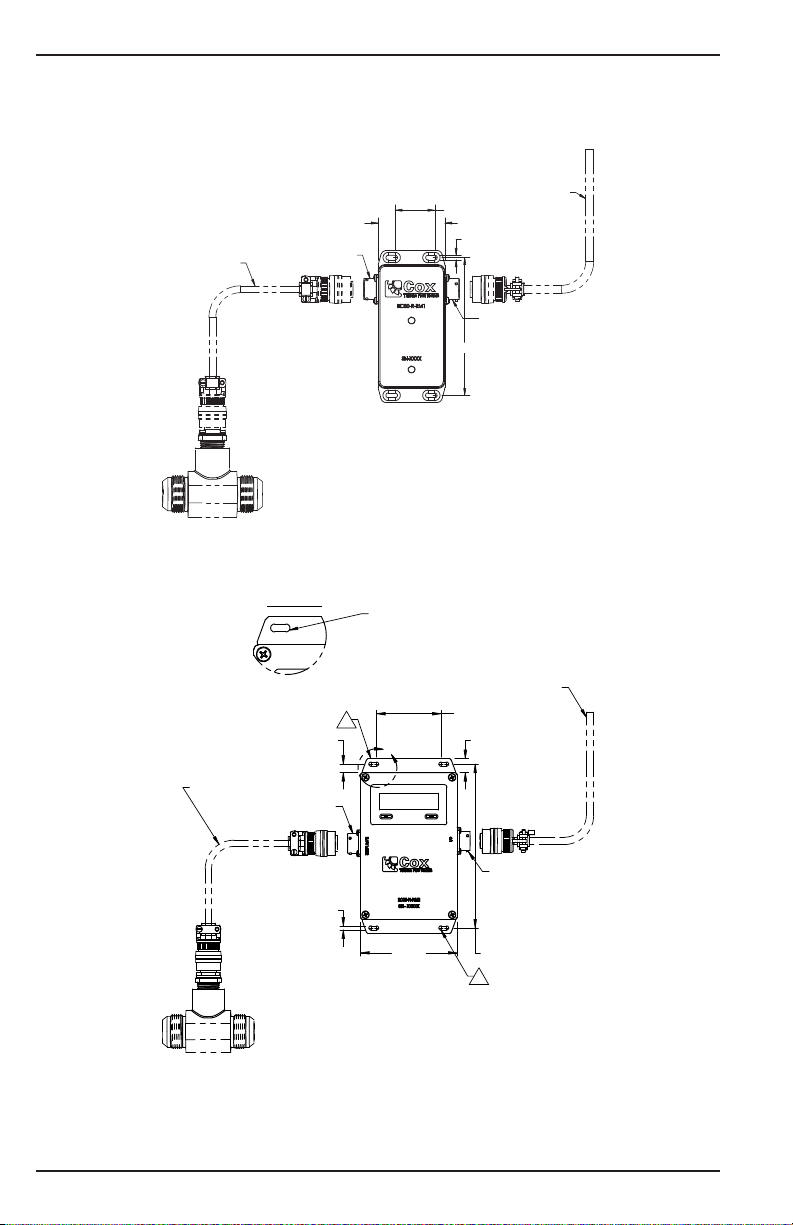
Typical Congurations
RM1
ABLE
* CONFIGURATION SHOWN
IS TYPICAL FOR RF INPUT.
RM2
PT02E-12-8P
Figure 2: RM1 Configuration
REMOVE ANODIZATION
TO EXPOSE ALUMINUM
2X 1.42
2.4
4X.17
2X 4.92
CABLE
(NOT INCLUDED)
PT02E-12-14P
2X .33
CABLE (NOT INCLUDED)
PT02E-12-8P
4X .16
* CONFIGURATION SHOWN
IS TYPICAL FOR RF INPUT.
Figure 3: RM2 Configuration
CABLE (NOT INCLUDED)
3
N
2X 2.50
.55
PT02E-12-14P
2X 6.37 3.74
3
April 2019CXX-UM-03060-EN-01Page 8
Page 9
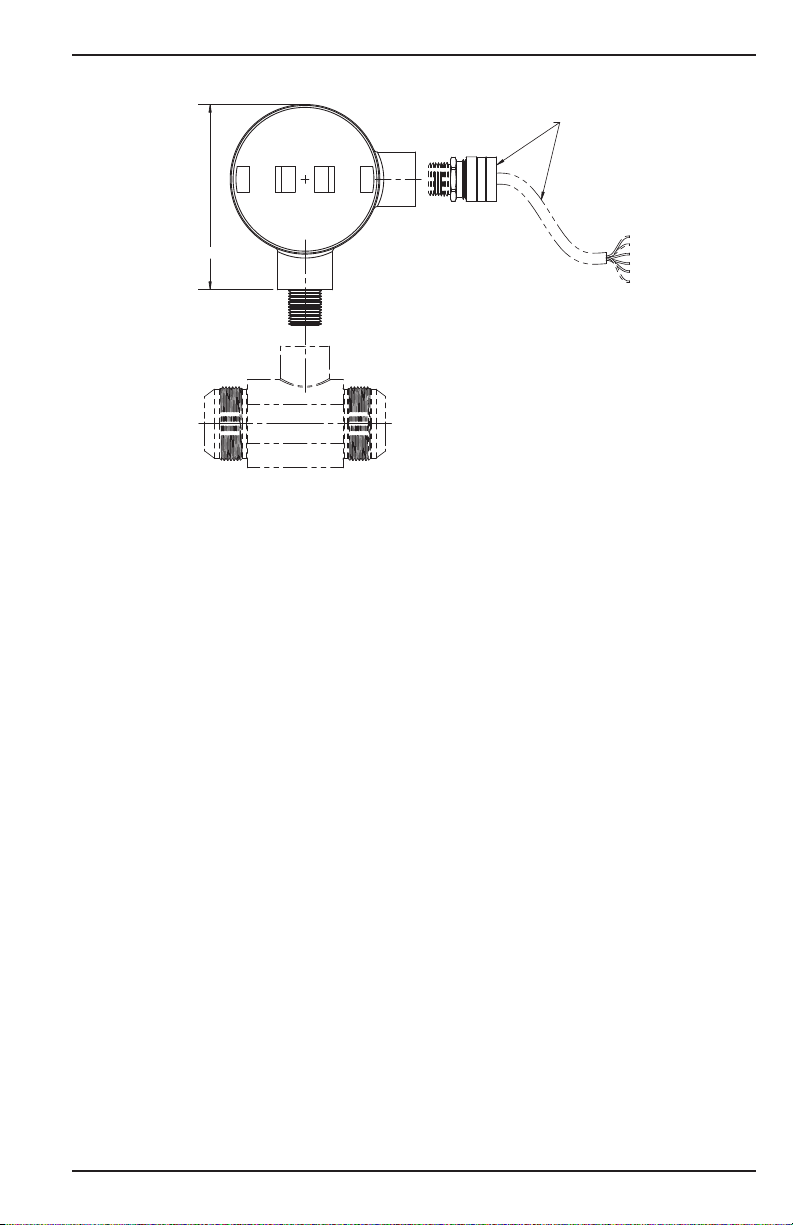
XP1
2X 4.7
B-9541 CABLE WITH 6907K13
CORD GRIP. (NOT INCLUDED)
* CONFIGURATION SHOWN
IS TYPICAL FOR RF INPUT.
Figure 4: XP1 Configuration
Installation
Page 9 CXX-UM-03060-EN-01April 2019
Page 10
Input
INPUT
The flow processor has inputs for turbine meters (both single and dual rotor) and
temperature. The flow processor calculates mass flow rates based on volumetric
flow with temperature compensation.
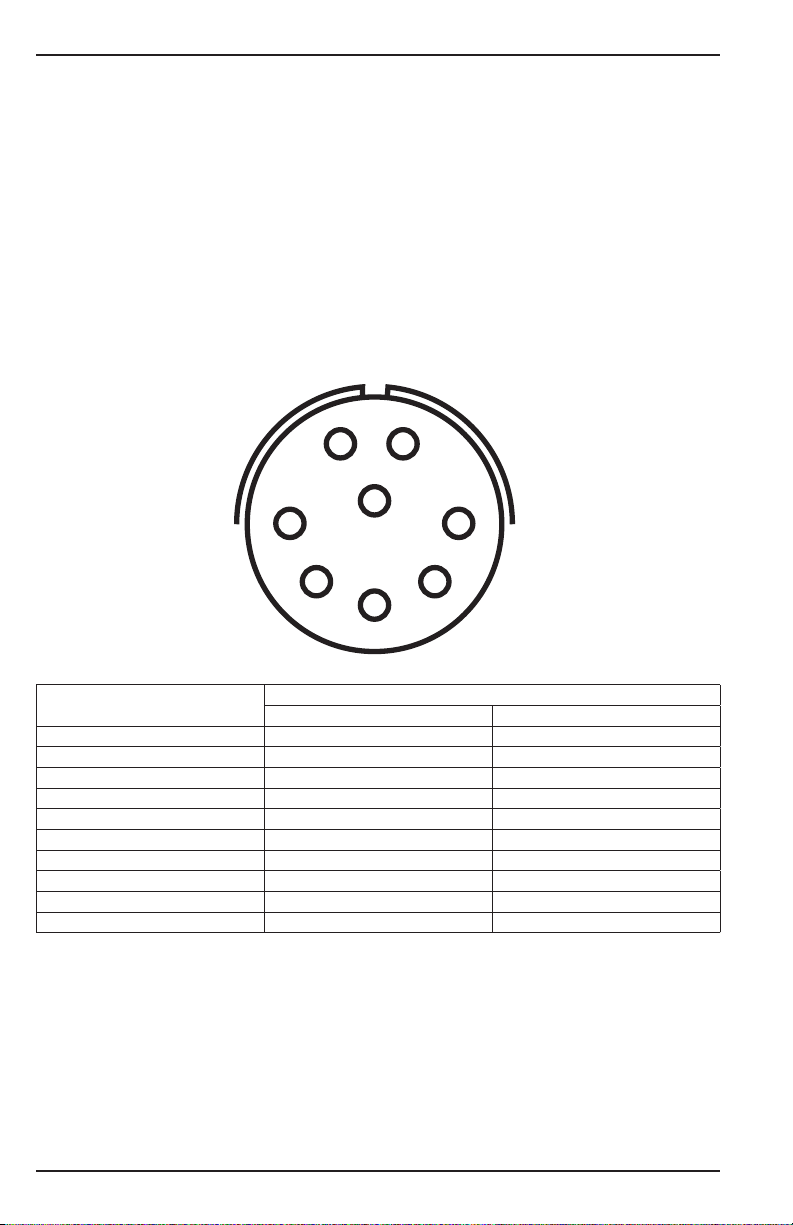
Analog Input
You can configure the analog input for different types of temperature transducers.
The flow processor is supplied with a 10 kΩ thermistor but can be
jumper-configured for 0…5V DC, 0…10V DC or 4…20 mA temperature
transducers. Consult the factory if you need to incorporate the analog input for
reasons other than temperature acquisition. See “Installation” on page7 and
“Wiring and Jumpers” on page12 to select a particular temperature transducer.
G
F
A
B
H
E
C
D
Figure 5: Input diagram
Function/Signal
RF PICKOFF A A A
RF A RETURN B B
RF PICKOFF B C C
RF B RETURN D D
RF PICKOFF Q N/A N/A
RF Q RETURN N/A N/A
RTD EX+ E E
RTD + F F
RTD – G G
RTD EX- H H
RM1 RM2
Pinout
April 2019CXX-UM-03060-EN-01Page 10
Page 11

Outputs
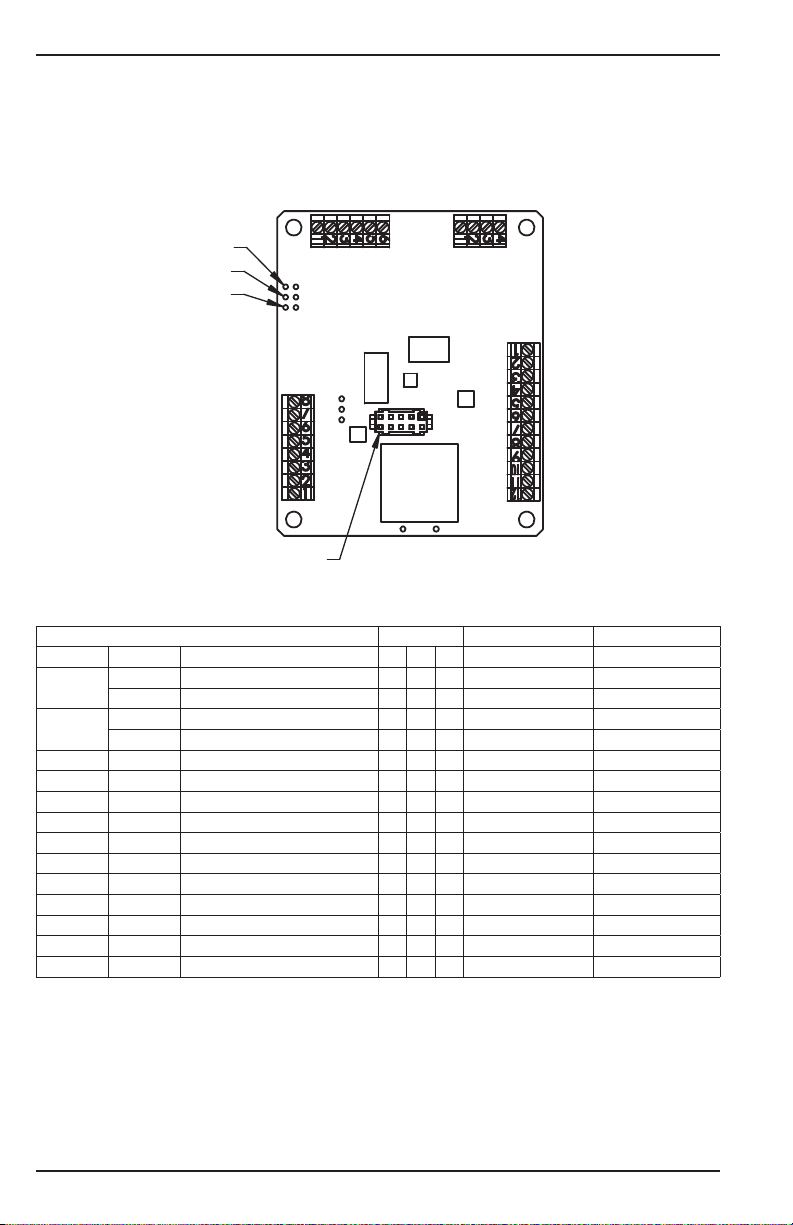
OUTPUTS
You can configure all flow processor outputs for different parameters, and can
do so independently of other channels. Use the IFC15 software to program the
following output parameters:
Frequency
• Linearized Flow Rate (Volumetric or Mass)
• Raw Frequency Rotor A
• Raw Frequency Rotor B
• Raw Sum; Frequency A + Frequency B (Dual Rotor Applications)
• Total Flow (Accumulation)
Analog
• Linearized Flow Rate
• Temperature
B
C
A
F
E
D
H
L
M
K
J
N
Figure 6: Output diagram
Function/Signal
PWR + A A
PWR RETURN B B
RS-485 + C C
RS-485 – D D
RAW A OUT E E
RAW B OUT F F
GND H H
FREQ 1 OUT J J
FREQ 2 OUT K K
GND L L
ANALOG 1 VOLTAGE OUT M M
ANALOG 2 VOLTAGE OUT N N
AGND P P
ANALOG 4-20 mA RETURN – P P
ANALOG 4-20 mA OUT + R R
RM1 RM2
R
P
Pinout
Page 11 CXX-UM-03060-EN-01April 2019
Page 12
Wiring and Jumpers
JMP
EF4295 TERMINAL BLOCK LAYOUT
PGM PORT
JMP
JMP
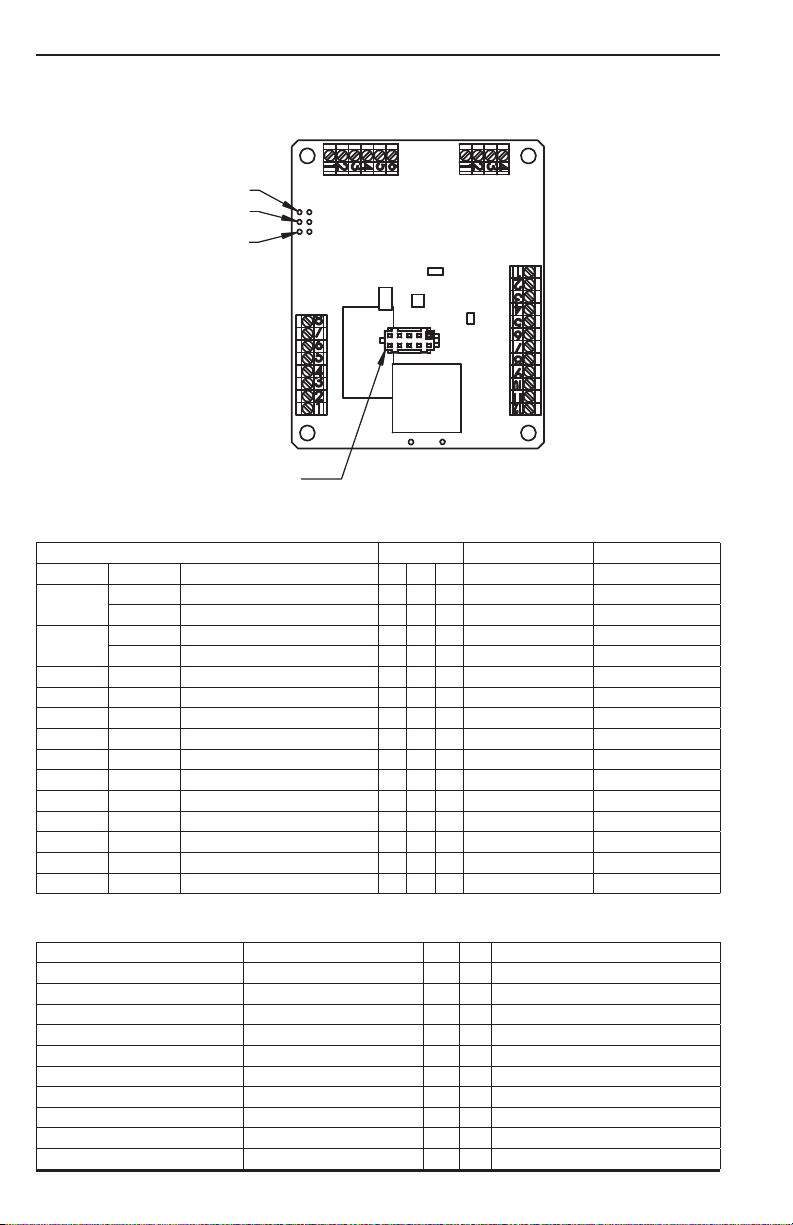
WIRING AND JUMPERS
RM1
J2
J1
-C
-B
-A
JMP-1
J5
J4
EC80 Flow Computer to PT02E-12-14P
EC80 B-9541 CABLE PT02E-12-14P
SCALING UNITS FUNCTION/SIGNAL J1 J4 J5 WIRE COLOR PINOUT
N/A
N/A
N/A Hz RAW A OUT 1 ORG E
N/A Hz RAW B OUT 2 RED/WHT F
N/A Hz GND 3 ORG/BLK H
N/A Hz GND 6 GRN/BLK L
N/A N/A AGND 7 BLU/BLK P
N/A N/A ANALOG 4-20 mA RETURN – 3 RED/BLK P
VDC+ PWR + 1 RED A
VDC- PWR RETURN 2 BLK B
N/A RS-485 + 5 WHT C
N/A RS-485 – 6 WHT/BLK D
Hz FREQ 1 OUT 4 GRN J
Hz FREQ 2 OUT 5 GRN/WHT K
V ANALOG 1 VOLTAGE OUT 9 BLU M
V ANALOG 2 VOLTAGE OUT 8 BLU/WHT N
mA ANALOG 4-20 mA OUT + 4 BLK/WHT R
April 2019CXX-UM-03060-EN-01Page 12
Page 13

Wiring and Jumpers
Flow-Meter to EC80 Flow Computer
B-9541 WIRE COLOR FUNCTION/SIGNAL J2 J5 PT02E-12-8P PINOUT
WHT RF PICKOFF A 1 A
WHT RF A RETURN 2 B
BLU RF PICKOFF B 3 C
BLU RF B RETURN 4 D
GRN RF PICKOFF Q 5 N/A
GRN RF Q RETURN 6 N/A
ORG RTD EX+ 4 E
ORG RTD + 3 F
ORG RTD – 2 G
ORG RTD EX- 1 H
JMP-1 Pickoff Jumper Table
JMP-A ON ROTOR A 4 OHMS
JMP-A OFF ROTOR A 10 OHMS
JMP-B ON ROTOR B 4 OHMS
JMP-B OFF ROTOR B 10 OHMS
JMP-C ON ROTOR Q 4 OHMS
JMP-C OFF ROTOR Q 10 OHMS
Page 13 CXX-UM-03060-EN-01April 2019
Page 14
Wiring and Jumpers
PGM PORT
EF4295 TERMINAL BLOCK LAYOUT
RM2
JMP-C
JMP-B
J2 J1
JMP-1
JMP-A
J5
J4
EC80 Flow Computer to PT02E-12-14P
EC80 B-9541 CABLE PT02E-12-14P
SCALING UNITS FUNCTION/SIGNAL J1 J4 J5 WIRE COLOR PINOUT
N/A
N/A
N/A Hz RAW A OUT 1 ORG E
N/A Hz RAW B OUT 2 RED/WHT F
N/A Hz GND 3 ORG/BLK H
N/A Hz GND 6 GRN/BLK L
N/A N/A AGND 7 BLU/BLK P
N/A N/A ANALOG 4-20 mA RETURN – 3 RED/BLK P
VDC+ PWR + 1 RED A
VDC- PWR RETURN 2 BLK B
N/A RS-485 + 5 WHT C
N/A RS-485 – 6 WHT/BLK D
Hz FREQ 1 OUT 4 GRN J
Hz FREQ 2 OUT 5 GRN/WHT K
V ANALOG 1 VOLTAGE OUT 9 BLU M
V ANALOG 2 VOLTAGE OUT 8 BLU/WHT N
mA ANALOG 4-20 mA OUT + 4 BLK/WHT R
Flow-Meter to EC80 Flow Computer
B-954 WIRE COLOR FUNCTION/SIGNAL J2 J5 PT02E-12-8P PINOUT
WHT RF PICKOFF A 1 A
WHT RF A RETURN 2 B
BLU RF PICKOFF B 3 C
BLU RF B RETURN 4 D
GRN RF PICKOFF Q 5 N/A
GRN RF Q RETURN 6 N/A
ORG RTD EX+ 4 E
ORG RTD + 3 F
ORG RTD – 2 G
ORG RTD EX- 1 H
April 2019CXX-UM-03060-EN-01Page 14
Page 15

JMP-1 Pickoff Jumper Table
EF4295 TERMINAL BLOCK LAYOUT
PGM PORT
5
JMP-A ON ROTOR A 4 OHMS
JMP-A OFF ROTOR A 10 OHMS
JMP-B ON ROTOR B 4 OHMS
JMP-B OFF ROTOR B 10 OHMS
JMP-C ON ROTOR Q 4 OHMS
JMP-C OFF ROTOR Q 10 OHMS
XP1
Wiring and Jumpers
J2
J1
JMP-C
JMP-B
JMP A
JMP 1
J
J4
EC80 Flow Computer to B-9541 Cable
SCALING UNITS FUNCTION/SIGNAL J1 J4 J5 WIRE COLOR
N/A
N/A
N/A Hz RAW A OUT 1 ORG
N/A Hz RAW B OUT 2 RED/WHT
N/A Hz GND 3 ORG/BLK
N/A Hz GND 6 GRN/BLK
N/A N/A AGND 10 BLU/BLK
N/A N/A ANALOG 4-20 mA OUT – 3 BLK/WHT
VDC+ PWR + 1 RED
VDC- PWR RETURN 2 BLK
N/A RS-485 + 5 WHT
N/A RS-485 – 6 WHT/BLK
Hz FREQ 1 OUT 4 GRN
Hz FREQ 2 OUT 5 GRN/WHT
V ANALOG 1 VOLTAGE OUT 12 BLU
V ANALOG 2 VOLTAGE OUT 11 BLU/WHT
mA ANALOG 4-20 mA OUT + 4 RED/BLK
EC B-9541
Page 15 CXX-UM-03060-EN-01April 2019
Page 16

Wiring and Jumpers
JMP-1 Pickoff Jumper Table
JMP-A ON ROTOR A 4 OHMS
JMP-A OFF ROTOR A 10 OHMS
JMP-B ON ROTOR B 4 OHMS
JMP-B OFF ROTOR B 10 OHMS
JMP-C ON ROTOR Q 4 OHMS
JMP-C OFF ROTOR Q 10 OHMS
Flow-Meter to EC80 Flow Computer
WIRE COLOR FUNCTION/SIGNAL J2 J5
WHT RF PICKOFF A 1
WHT RF A RETURN 2
WHT RF PICKOFF B 3
WHT RF B RETURN 4
WHT RF PICKOFF Q 5
WHT RF Q RETURN 6
RED OR YLW RTD EX+ 4
RED OR YLW RTD + 3
WHT OR YLW RTD – 2
WHT OR YLW RTD EX- 1
April 2019CXX-UM-03060-EN-01Page 16
Page 17

DIMENSIONS
RM1 Conguration
Dimensions
A
B
A
B
C
A 3.40 in (86.36 mm) 1.22 in. (30.99 mm)
B 2.38 in. (60.45 mm) 5.43 in. (137.92 mm)
C — 0.16 in (4.06 mm)
RM2 Conguration
C
A 4.75 in (120.65 mm) 2.18 in. (55.37 mm)
B 3.74 in. (95.00 mm) 1.99 in. (50.55 mm)
C 5.71 in. (145.03 mm) 6.81 in. (172.97 mm)
D — 0.06 in. (1.52 mm)
Front View
Front View Side View
A
B
Front View
Front View Side View
Side View
A
B
Side View
C
D
Page 17 CXX-UM-03060-EN-01April 2019
Page 18

Dimensions
XP1 Conguration
A
A
B
B
C
C
Front View Side View
Front View Side View
A 4.70 in. (119.38 mm) 2.71 in. (68.83 mm)
B 2.80 in. (71.12 mm) 4.70 in. (119.38 mm)
C 2.80 in. (71.12 mm) 0.80 in. (20.32 mm)
April 2019CXX-UM-03060-EN-01Page 18
Page 19

Specications
SPECIFICATIONS
Linearized Frequency ± 0.1% of reading
Performance
Input Power
Temperature Environment
Flow Meter Input Type (A and B)
(Two Independent Channels)
RTD Temperature Input
4-Wire
Analog Input
(For Temperature)
Frequency Output
(Two Independent Channels)
Analog Outputs
(Two Independent Channels)
EIA-485 Serial Data
Raw Frequency Output
(Two Independent Channels)
Enclosure
Environmental Rating
Remote Cable Length
Software Conforms to SAE ARP4990 calculations for temperature
Linearized Analog
Output
Process Latency 100 s
Nominal 24V DC, 2w maximum
With Digital Output 7…32V DC
With Analog Output 12…32V DC
Operating –40…185° F (–40…85° C)
Storage –67…257° F (–55…125° C)
Humidity 0…80% RH, non-condensing
Pulse TTL Compatible
(A and B)
RF Carrier
4 or 10 Ohm Pickup
Type 100 Ohm platinum, 0.00385 alpha
Useable Range –65…365° F (–55…185° C)
5 Hz Sine Response
Voltage 0…5V or 0…10V DC
ADC Resolution 12 bit (1/4096)
Input Impedance >100k Ohms
0…5V, TTL, 1…20,000 Hz, square wave
50% duty cycle
Minimum Load
Impedance
16-bit resolution
Channel One 4…20 mA, 0…5V DC or 0…10V DC
Channel Two 0…5V DC or 0…10V DC
Load Impedance
(4…20 mA)
Baud 115k
Update Rate Selectable, 0.1 sec minimum
Data Bits 8
Stop Bit 1
Parity None
0…5V, TTL, 5…3500 Hz, square wave
5k Ohm minimum load
Remote
Remote with Display
Blind Integral
Flow Meter to EC80 20 ft (6.1 m)
EC80 to DAQ or Control
System
± 0.1% of full scale
Frequency range: 5 Hz…5.0 kHz
Carrier frequency range: 25…65 kHz
Frequency range: 5 Hz…5.0 kHz
10k Ohm
500 Ohms maximum
Aluminum enclosure with
weatherproof mounting flange
Aluminum enclosure with
weatherproof mounting flange
NEMA 4 (IP65)
Class 1, Groups C and D
Class 2, Groups E, F and G
Class 3, WET LOC — Cast Aluminum
100 ft (30.5 m)
Page 19 CXX-UM-03060-EN-01April 2019
Page 20

Using the IFC Software
USING THE IFC SOFTWARE
OTE:N When you first run the program, if any error messages display, close them
out. The IFC configuration has not been initialized yet.
Password Initialization
The Password feature allows only users with permission to access or manipulate
the data in the configuration profile and flow processor.
If multiple users are interfacing with the software, set a default User Name
and Password that is easily remembered. For example: User Name=admin;
Password=admin
Un-installing or re-installing does not erase any set users.
To set the password for the first time, or to add a user name later:
1. Click the Options icon in the upper left portion of the toolbar of the main
GUI screen.
Options Icon
Figure 7: Options icon
Options Icon
2. Select the General tab to view the password options.
OTE:N The General options are also available from File > Options > General.
Figure 8: General options
3. Enter a Company name and Technician name. These two elds remain the same
when opening the Options window, and are not protected.
4. Enter a Login name and Password to be associated with a specic prole.
April 2019CXX-UM-03060-EN-01Page 20
Page 21

Using the IFC Software
IMPORTANT
Be sure to write down the password or click the Remember Password checkbox.
Entering an incorrect password locks the software.
5. Click New User.
6. Enter the same password in the Conrm Password box, and click OK. After
conrmation a new user is created and you are returned to the options screen.
Figure 9: Confirm password box
7. Click Login to login with the user you just created. The currently logged-in
person can then access the Graphical User Interface (GUI), and make changes to
IFC proles.
OTE:N The first user to initialize the software can also choose to add new users.
Establish Link Via RS485
You need to establish communication between the PC and the flow processor
hardware before you can program the flow processor using IFC. Make sure the
cable is connected and the flow processor is powered on.
OTE:N You can see which com port you are connected to using your operating
system’s device manager.
To establish communications:
1. Click the Options icon in the upper left portion of the toolbar of the main
GUI screen.
2. Select the Comm tab to view the communications conguration options.
OTE:N The Comm tab is also available from File > Options > Comm.
3. From the drop-down menu, select the communication port.
4. Set the Baud Rate to 115200.
5. Click Apply.
6. Click OK.
7. View the status area for connection info.
Figure 10: Comm Section
Page 21 CXX-UM-03060-EN-01April 2019
Page 22

Prole
New
Save
Establish Link Via Ethernet
If the flow processor in use is capable of Ethernet communication you can connect
to the PC with an ethernet cable.
To establish communications:
1. Check the Use TCP/IP box.
2. Type the IP Address for the connected ow processor.
3. View the Status area for connection info.
PROFILE
A profile is all the information that is programmed into the software, including
Linearization tables, liquid properties, input and output settings, and others. You
can use a profile to program the EC80 Flow Processor. You can also upload a profile
from a previously programmed flow processor, save a profile for later use and copy
a profile.
The following sections describe how to work with profiles.
Creating, Saving and Loading Proles
Open
Figure 11: New, Load and Save buttons
Create a new profile by going to File>New or clicking the New button on the
toolbar. Save a new profile by selecting File>Save As and then choosing a save
location and filename. You can quickly save the file later by selecting File>Save,
or clicking the Save button on the toolbar. Open a previously saved profile by
selecting File>Open, or clicking the Open button on the toolbar.
Uploading a Prole
You can upload an existing profile from the EC80 Flow Processor and save it under
a different filename, then manipulate the data, yet still retrieve the old data if
necessary.
IMPORTANT
Always keep an OEM copy (original) of the profile, in case you want to restore the
factory configuration.
1. Click the Upload button in the toolbar of the main GUI screen. This retrieves
the prole currently stored in the ow processor (if previously downloaded)
and places all prole data from the ow processor in the GUI.
2. Click the File menu.
3. Click Save As.
April 2019CXX-UM-03060-EN-01Page 22
Page 23

Prole Programming
4. Click the Down Arrow the Save In: eld and browse to the directory in which
you want to save the le.
5. In the File name: eld, type a name for your le
(for example, YOUR FILE NAME.fdp).
6. Make sure the Save as Type: eld indicates Proles (*.fdp) and click Save.
Figure 12: Save profile
All tables and configuration information are now in the profile for ready access.
PROFILE PROGRAMMING
You can Enter data into a profile and use it to program the flow processor.
You can program profiles in two ways:
• Manually change each cell value to correspond with calibration data, or
• Import multiple values into the interface using Microsoft Excel®.
Although the Linearization table is the table most often modified, any of the data
entry look-up tables can be modified. Make sure to follow these guidelines when
importing or exporting the data.
• Always erase the cell(s) entirely before entering data so the new data does not
combine with prior profile data.
OTE:N To erase all cells of a grid, right-click the IDX button in the upper left
corner of the grid and select Clear Grid.
• The number of XY pairs imported from Excel must be less than or equal to the
available number of index numbers (IDX) for each respective look-up table.
• To avoid truncation or excessive interpolation of profile data, make sure the
Excel data tables match the maximum number of columns for each respective
look-up table. For example, if the table holds 100 XY pairs, then maximize the
resolution of the table by placing points at all 100 index points.
• Data obtained through independent testing needs to be manually entered,
cell by cell, or entered into Excel first and then copied into the profile.
Page 23 CXX-UM-03060-EN-01April 2019
Page 24

Prole Programming
• If the data collected is not formatted to use the maximum number of IDX
entries in the GUI, accuracy is jeopardized. For example, if independent testing
yields only 50 Roshko/Strouhal points (IDX linearization entries) the data will
not be as accurate as it would be by using all 100 points in the
Linearization table.
• Data tables interpolate between points.
• Data tables do not extrapolate beyond the minimum and maximum values.
The flow processor holds the last value in the table, if the threshold is
exceeded.
Flow processors with factory-created profiles have pre-formatted data in the cells
of each lookup table. Powerful software, in conjunction with highly repeatable
and accurate calibration systems, provides Badger Meter the ability to fit
accurate curves to calibration profiles. Using linear, exponential or logarithmic
interpolation, the flow computer can use and optimize the maximum number of
IDX entries.
April 2019CXX-UM-03060-EN-01Page 24
Page 25

Prole Programming
Table Data Entry
To manually modify or update a table in the IFC software (using the linearization
table as an example):
1. Navigate to the table.
2. Right-click the IDX button in the upper left corner of the grid and select Clear
Grid. The table may change appearance slightly.
Figure 13: IDX button
3. Click in each cell and type the new value.
IMPORTANT
Be careful when typing the values, as keystroke errors can occur. Verify all data entries
prior to downloading the profile into the EC80 Flow Processor.
Figure 14: Example table
A more convenient method is to copy and paste multiple data entries from
Microsoft Excel. This procedure saves time and provides data accuracy.
To import multiple values into the interface using Microsoft Excel:
1. In Excel, highlight a minimum of 2 (X,Y) pairs and a maximum of up to 200
(X,Y) pairs, and copy them to the clipboard.
a. For example, if we had a total of three Roshko/Strouhal (X,Y) pairs (for the
example Linearization table, other tables use different calculated values),
the Excel spreadsheet would be set up as below:
Roshko (X) Strouhal (Y)
1.7782794 1.77827941
1.9179102 2666.6081
2.068505 2776.4523
b. Click and drag over the data to be copied, but not the column or row labels.
Only grab the raw data from the Excel spreadsheet. Make sure that the
Roshko values are located on the left side as the X-axis variable, and the
Strouhal values are on the right side as the Y-axis variable (for the example
Linearization table, other tables have different calculated values).
Page 25 CXX-UM-03060-EN-01April 2019
Page 26

Prole Programming
c. With the Roshko/Strouhal values highlighted, right-click in the shaded area
and click Copy to place data onto the clipboard. Alternatively, with the data
highlighted, press Ctrl+C to copy the data to the clipboard.
2. Switch to or re-open the GUI and right-click IDX in the upper left corner of
the table.
3. Select Paste Grid to copy the raw data from the clipboard to the table.
Figure 15: Pasted table
Linearization
The Linearization process takes a raw, non-linear output from a turbine meter and
performs mathematical calculations to provide a linearized output. The EC80 Flow
Processor uses the Roshko/Strouhal method for correlating the meter’s volumetric
flow rate and reflects the sum of all rotors. In a single rotor application, the sum
Roshko and sum Strouhal equate to the correlation of a single rotor. In a dual rotor
application, the sum Roshko and sum Strouhal equate to the correlation of both
rotors, summed together.
The minimum number of IDX (X,Y) entries for the linearization table is 2. The
maximum number of IDX (X,Y) entries for the linearization table is 200. Fill out the
table according to instructions in “Table Data Entry” on page25.
In addition to the Linearization table itself, a number of additional fields on the
linearization tab can be changed. Although not typically modified from factory
settings, they perform additional advanced operations in the EC80 Flow Processor.
Field Function
Corresponds to the coefficient of thermal expansion of the flow meter housing. This field
Alpha
Reference
Temp
Rotor
Frequency
Cutoff
is factory configured for the thermal expansion of stainless steel. The thermal expansion
coefficient for stainless steel is 9.6 × 10⁻⁴ or 0.0000096. Other expansion coefficients are
available from the factory.
The reference temperature, in degrees Fahrenheit, in which the calibration data was
obtained. Typical calibration reports state the reference temperature in which the data
was obtained, and should be the same as the temperature in which the Roshko/Strouhal
calibration data was obtained.
These fields limit the output of the flow processor to a minimum and maximum
frequency threshold. If rotor frequency decreases below the minimum flow rate or over
the maximum flow rate, the flow processor stops outputting a flow rate. The left column
corresponds to the rotor frequency of the A rotor (Upstream), and the right column is for
the B rotor (Downstream). In single rotor applications, only the left field is used.
April 2019CXX-UM-03060-EN-01Page 26
Page 27

Prole Programming
Standard vs. Auto-Viscosity
The EC80 Flow Processor, when used with a dual rotor turbine meter, incorporates
the ability to determine liquid viscosity directly from the turbine meter. The Auto-
Viscosity feature is applicable only to liquid viscosities at or below 40 cStk. If you
are unsure as to what range of viscosity you are operating over, please contact
Badger Meter, as a large database of liquid properties has been generated.
To select the Auto-Viscosity feature:
1. Click the Linearization tab on the GUI interface main screen.
Figure 16: Linearization tab
2. Click on the drop-down menu.
Figure 17: Liquid drop-down menu
3. Highlight Turbine (Liquid - Auto Viscosity) and click to select:
Figure 18: Auto Viscosity option
The Linearization table displays, showing the Auto-Viscosity feature enabled.
Remember, the liquid being metered must be below 40 cStks to use this feature. If
you’re unsure of the liquid’s viscosity, call Badger Meter at 877-243-1010.
Page 27 CXX-UM-03060-EN-01April 2019
Page 28

Prole Programming
Load Rotor Table
Rotor Ratio
Figure 19: Ratio tab
The Rotor Ratio table provides a number of powerful diagnostic and analytical
features. In dual-rotor applications, the ratio of the upstream and downstream
rotors can be compared to provide self checks, diagnostic provision or
automatically determine the liquid viscosity.
Rotor ratio is typically configured at the factory; however it can be implemented
by the user as well. The flow processor obtain’s frequency data from each rotor
and calculates the frequency ratio. Once the flow processor calculates the ratio
it associates a high order polynomial and a Roshko number to the data. The
frequency ratio is calculated as follows:
RotorRatio =
Where, Fa = Frequency of Rotor A, and Fb = Frequency of rotor B.
Use this ratio function to address any potential failures in the meter. Because
the flow processor is comparing the frequency output of one rotor to the
other, you can determine if bearing failure, pickoff failure or even liquid
particulates are hindering meter performance. This same method is also used to
determine viscosity.
Fb
Fa
Figure 20: Load rotor table button
Upon editing any fields contained in the Rotor Ratio table, the Load Rotor Table
button appears in the menu bar as seen in Figure 20. This provides the ability to
write updated Rotor Ratio information to the EC80 Flow Processor.
OTE:N The Load Rotor Table button does not write the entire profile down to
the flow processor, it only writes the information contained in the Rotor
Ratio table.
Field Function
If the ratio is exceeded by the set percentage, the flow processor will output zero flow,
Error
therefore stating a malfunction has occurred. Further prognosis could lead to pickoff failure,
Range
bearing failure or flow processor failure
Once the ratio is exceeded, therefore indicating a failure of some kind, the error timer
Error
dictates how long the meter will have to stay in excess of the current set ratio percentage,
Timer
before an error condition occurs and zero flow results
April 2019CXX-UM-03060-EN-01Page 28
Page 29

Prole Programming
Pressure Calibration
Figure 21: Pressure tab
The Pressure table is used for calibrating pressure transducers. Pressure calibration
does not apply to the EC80 flow processor.
Temperature Compensation
Figure 22: Temperature tab
The Temperature table provides the necessary calibration of the flow
processor’s temperature input device. Obtain a temperature profile by testing
the temperature sensor being used. The temperature profile is unique to the
individual sensor. To calibrate the temperature sensor:
1. Place the temperature sensor in a temperature bath.
2. Enter the temperature vs. counts data into the Temperature
Compensation table.
Typical applications use either a 10k Thermistor or 100 Ohm Platinum
RTD. This provides the flow processor the look-up table necessary for
temperature acquisition.
Page 29 CXX-UM-03060-EN-01April 2019
Page 30

Conguring Flow processor Outputs and Inputs
CONFIGURING FLOW PROCESSOR OUTPUTS AND INPUTS
Frequency Outputs (1 and 2)
Figure 23: Frequency out tab
The Frequency Out table is used for configuring both of the EC80 Flow Processor’s
frequency outputs. All EC80 Flow Processors come with 2 frequency channels,
and the channels can be configured independently. Use this table to completely
configure the type of information to be output for each channel, and adjust the
output scaling. A few possible types are volumetric flow rates, mass flow rates,
temperature (both ° F and ° C), the sum of rotor frequencies (Rotor A + Rotor B),
pressure and differential pressure.
1. Click the down arrow to select the engineering unit. The engineering units for
Frequency 1 and frequency 2 do not need to be the same.
2. Fill the tables according to instructions in “Table Data Entry” on page25. The
rst entry typically corresponds to zero ow and is set to zero Hertz, while
the last entry is typically maximum ow. The maximum output frequency is
sixteen Hertz.
OTE:N Setting the maximum flow rate to a frequency greater than 16 kHz causes
the flow processor to output 16 kHz.
Click the summation check box to enable totalizing (accumulation) of the
frequency output. This feature is only applicable to special firmware editions.
The feature needs to be configured at the factory and is not available in standard
applications. The feature works by summing flow rates and outputting a frequency
proportional to total flow, not flow rate.
The test frequency button takes the value input as the scaling frequency and
outputs that frequency from the flow processor. Use this feature to verify that
the flow processor is outputting the appropriate frequency and to verify the
calibration of the flow processor.
April 2019CXX-UM-03060-EN-01Page 30
Page 31

Conguring Flow processor Outputs and Inputs
Analog Output (Channels 1, 2, 3 and 4)
Figure 24: Analog out 1 tab
Use the Analog Out tables to configure the EC80 Flow Processor’s analog channels.
Use this table to completely configure the type of information and scaling. Not
all EC80 Flow Processor boards have an analog output. If yours does, use this
procedure. You can select the engineering unit for things such as volumetric flow
rate, mass flow rate and temperature.
OTE:N The EC80 Flow Processor needs to be jumper-configured prior to selecting
the corresponding electrical type. See “Wiring and Jumpers” on page12
for more information.
The electrical waveform needs to match your board’s jumper configuration.
1. Select the bullet next to the waveform for which the ow processor’s analog
channel is jumper-congured (0…5V DC, 0…10V DC or 4…20 mA).
2. Select the engineering unit from the drop-down menu.
3. Fill the tables according to instructions in “Table Data Entry” on page25. The
rst entry typically corresponds to zero ow, and is set to 0V DC or mA.
Calibrate Analog Channels
In addition to adjusting the scaling and determining the unit of measurement,
you need to calibrate the analog channels. Typically, 10 points are performed in
calibration, evenly spaced throughout the range of the channel. For instance,
on a 0…10V channel, the output would be calibrated at 1, 2, 3, 4, 5, 6, 7, 8, 9 and
10V DC.
1. Use a multimeter to monitor the output.
2. Press the left or right arrows to adjust the Digital-to-Analog Converter (DAC)
counts until the multimeter reads the correct value.
3. Click Set Output to store the number of DAC counts and move on to the next
index point.
Use the summation check box for totalizing (accumulation) of the frequency
output. This feature is only applicable to special firmware editions. The feature
needs to be configured at the factory and is not available in standard applications.
The feature works by summing flow rates and outputting a frequency
proportional to total flow, not flow rate.
Page 31 CXX-UM-03060-EN-01April 2019
Page 32

Conguring Flow processor Outputs and Inputs
Conguring Analog Input
Figure 25: Analog input 1 tab
You can configure the analog inputs (Analog In 1, Analog in 2 and Analog In 3) to
accept external analog devices.
Typically, this applies to flow processors that use pressure compensation, where
an external pressure transducer is used. In special instances, analog inputs may
be used for other functions. Consult the factory if your application includes an
analog input.
The electrical waveform needs to match your board’s jumper configuration. See
“Wiring and Jumpers” on page12 for more information.
1. Select the bullet next to the waveform that the ow processor’s analog
channel is jumper-congured for (0…5V DC, 0…10V DC or 4…20 mA).
2. Select the engineering unit from the drop-down menu.
3. Fill the tables according to instructions in “Table Data Entry” on page25. The
rst entry typically corresponds to zero ow, and is set to zero V DC or mA.
April 2019CXX-UM-03060-EN-01Page 32
Page 33

Conguring Liquid Properties
Delete Selected Liquid
CONFIGURING LIQUID PROPERTIES
Figure 26: Liquid properties tab
Use the Liquid Properties table to correct for changes in liquid viscosity,
compute mass flow rate via density tables and provide pressure versus viscosity
compensation.
Use the drop-down menu to select a liquid and display the liquid properties that
were factory configured.
If needed, create a new liquid by following these instructions:
1. Click the text of the drop-down menu to highlight the text.
2. Type a new liquid name.
3. Fill the viscosity table through use of the viscosity calculator or import a table.
4. Click the Save Liquid Tables button to Save the new liquid.
When you change the data in the table or re-name an existing liquid, the software
shows additional options in the menu bar:
Load Liquid Tables
Figure 27: Liquid tables buttons
Save Liquid Tables
The teal cylinders buttons appear for modification of the liquid registry. The
choice is:
Field Function
Load Liquid
Tables
Save Liquid
Tables
Delete Selected
Liquid
Loads the currently stored liquid tables. The liquid tables are stored on the PC
Overwrites any existing liquids stored on the PC and creates a group of liquids
based on what is saved
Deletes the currently selected liquid from the liquid registry. Liquids are selected
via the drop-down box or placing your cursor in the corresponding liquids table,
which activates the liquid and allows for deletion from the liquid registry
Page 33 CXX-UM-03060-EN-01April 2019
Page 34

Conguring Liquid Properties
Temperature vs Viscosity Table
Figure 28: Temperature vs Viscosity Table
You can populate the entire viscosity table, all 100 index points, with the Viscosity
Calculator tool. You need to know two liquid viscosities and the corresponding
liquid temperature and enter them in the yellow cells.
OTE:N Please pay close attention to appropriate units when entering data into
the fields above. The temperature units are in Fahrenheit (° F), the Density
units are in Pounds per Gallon (Pounds/Gal) and Viscosity is in
Centi-Stokes (cStk). The temperature engineering unit (T1 and T2)
is degrees Fahrenheit (° F) and kinematic viscosity (V1 and V2) is in
centistokes (cStk).
To populate the table:
1. Type a liquid name in the white eld near the top of the table.
2. Click the bullet next to the ASTM or Andrade method for computation of
viscosity. The ASTM equation is typically more accurate.
3. Input the lesser temperature value and the corresponding viscosity value in
the top-most yellow data elds of the viscosity calculator (T1 and V1), and the
greater temperature value and the corresponding viscosity value in the middle
row of yellow data elds of the viscosity calculator (T2 and V2).
OTE:N Do not place the lesser temperature on the middle row of yellow cells
because that causes the viscosity calculator to fail and possibly corrupt
profile data.
4. Specify minimum and maximum temperature values. This tells the viscosity
calculator over which range in temperature to populate the temperature vs
viscosity table.
OTE:N Exceed your intended operating temperature by 5…10 degrees or more
so that temperature range is not exceeded and proper viscosity correction
takes place in the flow processor.
5. Click the Fill button to populate the temperature vs viscosity table.
April 2019CXX-UM-03060-EN-01Page 34
Page 35

Conguring Liquid Properties
The software calculates the viscosity across the entire specified temperature
range. The most commonly used and most accurate method for calculating
viscosity is the ASTM method. However, the Andrade method may be used.
OTE:N All calculations are done per ASTM D341 when ASTM is selected.
Temperature vs Density Table
Figure 29: Temperature vs Density Table
The density table is only applicable when a mass flow rate is needed. Using the
flow meters temperature sensor, density is calculated from the Temperature vs
Density table and then multiplied by the volumetric flow rate to obtain the mass
flow rate.
MassFlowRate = VolumetricFlowRate × Density
Leave these fields blank or clear the table using the IDX button (right-click the IDX
button and select Clear Grid), if a mass flow rate is not needed.
You will need to get the density properties from our factory or independently
in order to calculate mass flow rate. If difficulty arises in obtaining density
information regarding your liquid, have Badger Meter test the liquid properties in
our laboratory, and supply you with the temperature vs density information.
Liquid Pressure Compensation
Figure 30: Liquid Pressure Correction Coefficient table
Liquid pressure compensation is not available for the EC80 Flow Processor.
Page 35 CXX-UM-03060-EN-01April 2019
Page 36

Hardware Conguration
HARDWARE CONFIGURATION
Model Information
The model information is on the left side of the interface. It shows information
pertaining to the profile currently loaded (For example, if you upload a profile
from the flow processor, the hardware information is for that flow processor).
The model information is input at the factory and offers our technicians the base
information needed for troubleshooting or profile tracking. Do not change these
factory settings.
Figure 31: Model information
Field Function
IFC Model
IFC SN
Meter Model No Identifies the configuration and features of the flow meter
Meter SN Provides traceability and calibration information for the flow meter
Firmware Revision
Identifies the configuration of EC80 Flow Processor for which the profile
was designed
Provides traceability of an individual EC80 Flow Processor and
associated documentation
States the flow processors firmware configuration and provides historical
revision control
General Hardware Information
The general hardware information is on the left side side of the interface just
below the model information. It contains factory configuration information
regarding the Clock Frequency, Carrier Frequency, Input and Output Average, and
Low Flow Cutoff (in gpm).
Figure 32: General hardware information
April 2019CXX-UM-03060-EN-01Page 36
Page 37

Hardware Conguration
OTE:N The clock frequency and carrier frequency match the particular model of
flow processor in use. Do not change these factory settings.
Field Sub-Field Function
Frequency
Average
Low Flow
Cutoff
Clock (Hz) Configured at the factory to match individual EC80 Flow Processor.
Carrier (Hz)
Output
(Cycles)
Input
(Cycles)
Numeric
Entry (GPM)
Configured at the factory to optimize resonance curve when using RF
carrier pickoffs.
The number of output samples necessary before the flow processor yields
a single value at the output. If data obtained from the flow processor is
updating too fast, use this feature to smooth the data so more samples
are taken prior to outputting a value.
The number of input samples necessary before the flow processor yields
a single value at the processor. If data obtained from the flow processor
is updating too fast, use this feature to smooth the data so more samples
are taken prior to inputting a value to the processor.
The low flow cutoff omits erroneous data in the low flow region of a
turbine meter. Near zero state conditions or pulsating flow may cause
erratic readings near zero flow. In this case, the flow processor can be
told to not output a flow rate below the set flow rate. Low Flow Cutoff is
typically set to zero and not used.
Oscillation
The Oscillation tab is only used at the factory to calibrate the flow processor’s
internal clock. Do not change these factory settings.
Figure 33: Oscillation tab
Meter Selection (BUS ID)
The software has provisions for multi-drop applications, where multiple flow
processors need to communicate to one central location. In order to address
multiple meters, you must designate a different Bus ID# to each flow processor.
There are 256 available Bus IDs (0…FF). Each ID consists of a one- or two-digit
hexadecimal value, where 0 = 0, and 255 = FF. In order for the software to
search and display a particular flow processor, you must upload the Bus ID (see
instructions below). This tells the interface to attempt communication with that
particular Bus ID.
Page 37 CXX-UM-03060-EN-01April 2019
Page 38

Real-time Monitoring
The Bus ID information displays in the lower left corner of the main screen.
Figure 34: Bus ID information
To address an individual flow processor:
1. Click on the Current Bus ID # eld.
2. Change the value to correspond with the meter to be addressed.
3. Click the Upload icon on the toolbar of the main GUI screen.
The prole from the ow processor you addressed then populates the software
interface with the information stored in that particular ow processor.
4. (Optional) Click the Download icon to place another ow processor’s prole
into the currently selected ow processor.
REALTIME MONITORING
The EC80 Flow Processor outputs
real-time values via the established RS485
communication. Parameters and variables
can be viewed in the Status section of the
IFC15 GUI. The Status screen displays the
item (variable), the numerical value, the
engineering unit, and, if applicable, the
number of counts associated with that
particular variable.
You can select which parameters to view in
the options menu under the Report Display
tab. See “Report Display” on page43 for more
information. The Report Display is programmed
from the factory to display a core group of
variables. More variables can be applied to the
report format.
The status display is shown in Figure 35;
however it is necessary to follow the
instructions in “Real-Time Report Display” to
establish real-time update of the selected
variables.
Figure 35: Status section
April 2019CXX-UM-03060-EN-01Page 38
Page 39

Real-time Monitoring
Real-Time Report Display
To view the parameters in real-time, a flow processor must have established
communication with the PC and be communicating properly.
Once connected, click the Connect button below the Status window.
OTE:N See “Report Display” on page43 for all the variables for monitoring.
In addition to viewing all real time variables, you can also access the
following features:
The Show Graph button switches the logging information section to a small graph
of the currently selected table. To select another table, click somewhere in that
table’s data.
Use the IFC GUI data logging feature to create a log of selected data measured
over a period of time. The GUI sends information to a tab-delimited file. The
software measures the information either for a pre-programmed or manually
selected amount of time.
Figure 36: Log File field
To configure the IFC GUI to provide log reports:
1. Type or browse to a location on your computer to output data logging.
This designates the le name and location in which you wish to store
the information.
2. Type a numeric value in the Sample Rate eld to specify how often a new entry
should be placed in the data log.
3. Select either seconds (S) or milliseconds (mS).
4. Select the interval stop from the drop-down menu, by clicking the drop-down
menu, then clicking an option to select it.
Page 39 CXX-UM-03060-EN-01April 2019
Page 40

Flow processor Programming
Option Function
Manual Stop
Timed Stop
(Seconds)
Timed Stop
(Minutes)
Timed Stop
(Date)
Sample Stop
Manual stop begins data logging when you click Start and ends data logging when
you click Stop.
Timed stop (Seconds) begins data logging when you click Start and ends data logging
when it reaches the numerical value adjacent to the drop-down menu. For Example,
if 100 were placed in the time field adjacent to the drop-down menu, 100 seconds
would elapse before the data would cease to log.
Timed stop (Minutes) begins data logging when you click Start and ends data logging
when upon reaching the numerical value adjacent to the drop-down menu. For
Example, if 100 were placed in the time field adjacent to the drop-down menu, 100
minutes would elapse before the data would cease to log.
Timed stop (Date) begins data logging when you click Start and ends data logging
when upon reaching the numerical value adjacent to the drop-down menu. For
Example, if 1/1/20 were placed in the time field adjacent to the drop-down menu, the
GUI would continue to log data until January 1st 2020.
Sample stop begins data logging when you click Start. The software logs one sample's
worth of data and stops at the set interval in the sample rate field.
Viewing Log
To view the log being populated, click View. You will be transferred to the logging
file you have designated. Values update at the intervals set.
Watching Log
To watch the log being populated in real-time, click Watch. You will be transferred
to the logging file you have designated.
FLOW PROCESSOR PROGRAMMING
Connect all sensors, transducers, pickups and com-link cables to the EC80 Flow
Processor before powering up the computer. Communication needs to be
established with the EC80 Flow Processor prior to uploading or downloading
a profile. All flow processors, unless specially configured, communicate via an
RS485 connection to the PC. The PC, in conjunction with an RS485 converter is
required for communicating with the flow processor. Ask your sales representative
regarding purchase of USB-to-RS485 converters (PN EF I-7561).
Downloading Proles
Downloading a profile is how you use all the information you programmed into
the IFC GUI to program the flow processor. Follow this procedure to download the
current profile to the flow processor:
1. Click the white box next to Enable on the tool bar.
2. Click the Download icon . All information in the data tables, either blank or
populated, is written to the ow processor.
April 2019CXX-UM-03060-EN-01Page 40
Page 41

Flow processor Programming
Flow processor Programming
Locating Multiple EC80 Flow Processors
The Locate IFC function is for users who use many flow processors that all
communicate with a central PC. Daisy-chained flow processors, all communicating
via RS485, can be addressed individually via their corresponding Bus ID. You can
search to see which flow processors are currently connected in the loop. Since
each flow processor has its own Bus ID, each flow processor appears on this
display. Information such as the Bus ID, Firmware Revision and GUID hexadecimal
string can all be displayed in this screen.
To locate an EC80 Flow Processor:
1. Click the View menu.
2. Click Find IFC.
Figure 37: Locate IFC window
The Refresh button clears the display and begins searching again for EC80
Flow Processors.
The Get Profile button loads the currently selected flow meter’s profile into the
GUI tables so you can modify the tables.
Page 41 CXX-UM-03060-EN-01April 2019
Page 41 CXX-UM-03060-EN-01April 2019
Page 42

Conguration Options
Commands
The Commands feature is for specific applications where polling or Ethernet
configurations are being used. Do not use this feature unless the application
requires it. Consult your sales representative if this feature interests you.
Figure 38: Commands menu
CONFIGURATION OPTIONS
Access the options menu either by clicking the Options Icon, or navigating to
File>Options.
General
Figure 39: General tab
Use the General tab for user sign in. A company name, technician name, login
ID and password can be set here. See “Password Initialization” on page20 for
more information.
April 2019CXX-UM-03060-EN-01Page 42
Page 43

Version Information
Report Display
Figure 40: Report display tab
Use the Report Display tab to select which flow processor variables to view in the
Status window. Every variable the flow processor uses for computation of flow is
listed here. If you want to display all the variables, click Select All. To display none
of the variables, click Clear All. To view the old report style, click the box next to
Old Report Style.
Communication (Comm.)
Use the Communications tab to establish communications with the flow processor.
See “Establish Link Via RS485” on page21 or “Establish Link Via Ethernet” on
page22 for more information.
Database, Gator Display, Gator Report and Real Time Clock (RTC)
The Database, Gator Display, Gator Report and Real Time Clock (RTC) tabs are
currently used for Flow Gator products. They are not applicable to the EC80
Flow Processor.
VERSION INFORMATION
Figure 41: Version information window
Click the View menu bar and select About to display important information
regarding the software. The factory may ask for the version of software you
are using.
Page 43 CXX-UM-03060-EN-01April 2019
Page 44

Flow Processor, EC80
Control. Manage. Optimize.
Cox is a registered trademark of Badger Meter, Inc. Other trademarks appearing in this document are the property of their respective entities. Due to continuous
research, product improvements and enhancements, Badger Meter reserves the right to change product or system specications without notice, except to the
extent an outstanding contractual obligation exists. © 2019 Badger Meter, Inc. All rights reserved.
www.badgermeter.com
The Americas | Badger Meter | 4545 West Brown Deer Rd | PO Box 245036 | Milwaukee, WI 53224-9536 | 800-876-3837 | 414-355-0400
México | Badger Meter de las Americas, S.A. de C.V. | Pedro Luis Ogazón N°32 | Esq. Angelina N°24 | Colonia Guadalupe Inn | CP 01050 | México, DF | México | +52-55-5662-0882
Europe, Eastern Europe Branch Oce (for Poland, Latvia, Lithuania, Estonia, Ukraine, Belarus) | Badger Meter Europe | ul. Korfantego 6 | 44-193 Knurów | Poland | +48-32-236-8787
Europe, Middle East and Africa | Badger Meter Europa GmbH | Nurtinger Str 76 | 72639 Neuen | Germany | +49-7025-9208-0
Europe, Middle East Branch Oce | Badger Meter Europe | PO Box 341442 | Dubai Silicon Oasis, Head Quarter Building, Wing C, Oce #C209 | Dubai / UAE | +971-4-371 2503
Slovakia | Badger Meter Slovakia s.r.o. | Racianska 109/B | 831 02 Bratislava, Slovakia | +421-2-44 63 83 01
Asia Pacic | Badger Meter | 80 Marine Parade Rd | 19-07 Parkway Parade | Singapore 449269 | +65-63464836
Switzerland | Badger Meter Swiss AG | Mittelholzerstrasse 8 | 3006 Bern | Switzerland | +41-31-932 01 11 :
 Loading...