

Page 1
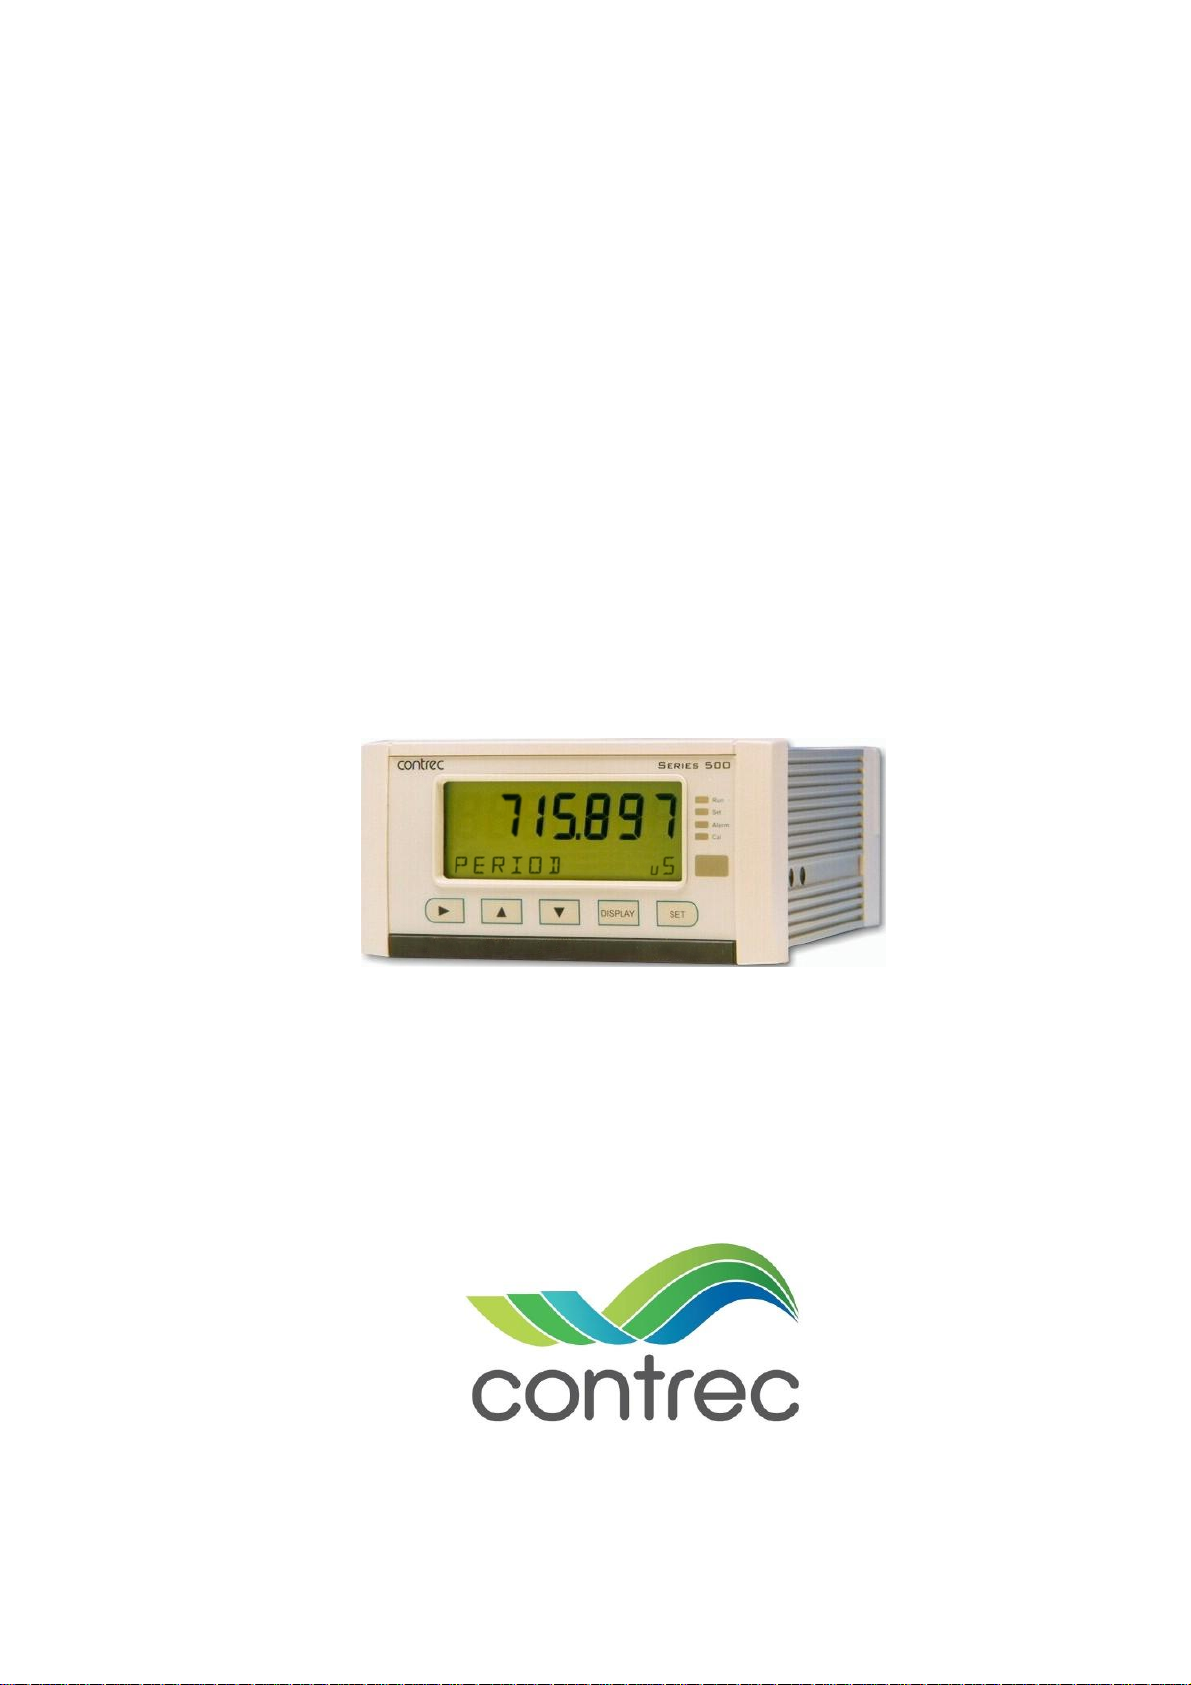
Model 515 Flow Computer
Operation Manual
Application DG01
Density Converter (Gas)
for
Pulse Output Density Meters
18 June 2017
Page 2

Model 515 Flow Computer - Operation Manual
© Contrec Limited 2017
The instructions given herein cover the general description, installation, operation and maintenance of the subject
equipment. Contrec Limited. reserves the right, without prior notice, to make engineering refinements that may not
be reflected in this manual.
Should any questions arise which cannot be answered specifically by this manual, they should be directed to
Contrec Limited for further detailed information and technical assistance.
Contrec Limited will not accept any liability for either direct or consequential damages resulting from the use or
misapplication of the contents of this manual.
Part of the software embedded in this product is eCos - Embedded Configurable Operating System, a trademark of
Red Hat. Portions created by Red Hat are Copyright © 1998, 1999, 2000 Red Hat, Inc.
(http://www.redhat.com). All rights reserved
The software in this product was in part provided by Red Hat and any express or implied warranties, including, but
not limited to, the implied warranties of merchantability and fitness for a particular purpose are disclaimed. In no
event shall the author be liable for any direct, indirect, incidental, special, exemplary, or consequential damages
(including, but not limited to, procurement of substitute goods or services; loss of use, data, or profits; or business
interruption) however caused and on any theory of liability, whether in contract, strict liability, or tort (including
negligence or otherwise) arising in any way out of the use of this software, even if advised of the possibility of such
damage.
Contrec Limited
Riverside, Canal Road, Sowerby Bridge,
West Yorkshire HX6 2AY UNITED KINGDOM
Tel: +44 1422 829944 Fax: +44 1422 829945
Email: [email protected]
Website: www.contrec.co.uk
Contrec Systems Pty Ltd
5 Norfolk Avenue Ringwood, Melbourne 3134 AUSTRALIA
Tel: +61 4 413 505 114
Email: [email protected]
Contrec - USA, LLC
916 Belcher Drive Pelham AL 35124 USA
Tel: +1 (205) 685 3000 Fax: +1 (205) 685 3001
Email: [email protected]
Publication No: 515-DG01-OM - 18 June 2017
Page 3

Safety Notice
The information in this safety notice is for the prevention of injury to personnel and
damage to the instrument.
The manufacturer assumes no liability for injury or damage caused by misuse of the
instrument or for modifications made to the instrument.
Qualified Personnel
The instrument must be installed, operated and serviced by persons who have been properly
trained and authorised. Personnel must read and understand this manual prior to installation and
operation of the instrument.
Static Hazard
The 500 series flow computer uses high speed CMOS circuitry which is sensitive to static
damage. The user should observe accepted safety practices for handling electronic devices,
especially during servicing. Once the unit is installed, grounded and interconnected, the chances
of static damage are greatly reduced.
Voltage Hazard
Before connecting power to the instrument, ensure that the supply voltage for the AC or DC
input is suitable. The AC voltage rating is as stated on the instrument rating plate. Personnel
should take all due care to avoid electric shock. For safe operation it is essential to connect a
mains safety earth to the A.C. power inlet. Do not operate at altitudes above 2000m.
Welding Hazard
Do not perform electric welding in close proximity to the instrument or its interconnecting
cables. If welding in these areas must be performed, disconnect all cables from the instrument.
Failure to do so may result in damage to the unit.
Moisture Hazard
To avoid electrical faults and corrosion of the instrument, do not allow moisture to remain in
contact with the instrument.
Disconnection Device
When powered from a mains supply this unit requires the provision of a suitable mains isolation
device to be accessible near to the installed instrument.
515 DG01 - 18 June 2017 iii
515 DG01 - 18 June 2017
Page 4

iv 515 DG01 - 18 June 2017
Page 5

Contents
1 Introduction
Features
Overview
Calculations
Equation Sets
User Defined Function
Analog Input Scaling
Displayed Information
Main Menu Variables
Communications
Isolated Outputs
Relay Outputs
Software Configuration
Temperature and Pressure Input Types
Approvals
2 Specifications
Specification Table
. . . . . . . . . . . . . . . . . . . . . . . . . . . . . . . . . . . . . . . . . . 1
. . . . . . . . . . . . . . . . . . . . . . . . . . . . . . . . . . . . . . . . . . 1
. . . . . . . . . . . . . . . . . . . . . . . . . . . . . . . . . . . . . . . 2
. . . . . . . . . . . . . . . . . . . . . . . . . . . . . . . . . . . . . . 2
. . . . . . . . . . . . . . . . . . . . . . . . . . . . . . . . . 3
. . . . . . . . . . . . . . . . . . . . . . . . . . . . . . . . . . 4
. . . . . . . . . . . . . . . . . . . . . . . . . . . . . . . . . 4
. . . . . . . . . . . . . . . . . . . . . . . . . . . . . . . . . . 5
. . . . . . . . . . . . . . . . . . . . . . . . . . . . . . . . . . . . 5
. . . . . . . . . . . . . . . . . . . . . . . . . . . . . . . . . . . . 5
. . . . . . . . . . . . . . . . . . . . . . . . . . . . . . . . . . . . . . 5
. . . . . . . . . . . . . . . . . . . . . . . . . . . . . . . . . 6
. . . . . . . . . . . . . . . . . . . . . . . . . . . . . . . . . . . . . . . . 6
. . . . . . . . . . . . . . . . . . . . . . . . . . . . . . . . . . . . 9
. . . . . . . . . . . . . . . . . . . . . . . . . 6
3 Installation
Panel Mounting
Electrical Connection
Rear Panel Connections
Terminal Designations
Inputs
. . . . . . . . . . . . . . . . . . . . . . . . . . . . . . . . . . . . . . . . . . 13
. . . . . . . . . . . . . . . . . . . . . . . . . . . . . . . . . . . . . 11
. . . . . . . . . . . . . . . . . . . . . . . . . . . . . . . . . . 12
. . . . . . . . . . . . . . . . . . . . . . . . . . . . . . . 12
. . . . . . . . . . . . . . . . . . . . . . . . . . . . . . . . 12
Frequency (Pulse) Input Connection
Analog Input Connections
Logic Input Connection
Outputs
. . . . . . . . . . . . . . . . . . . . . . . . . . . . . . . . . . . . . . . . . . 17
. . . . . . . . . . . . . . . . . . . . . . . . . . . . . . 14
. . . . . . . . . . . . . . . . . . . . . . . . . . . . . . . 16
4-20 mA Output Connection
Control Relays (Alarms)
. . . . . . . . . . . . . . . . . . . . . . . . . . . . . . . . . 18
RC Network for Interference Suppression
Communications
RS-232 Port
Infra-red Port
RS-485 Port (Optional)
Earthing and Shielding
. . . . . . . . . . . . . . . . . . . . . . . . . . . . . . . . . . . . . 19
. . . . . . . . . . . . . . . . . . . . . . . . . . . . . . . . . . . . . . 19
. . . . . . . . . . . . . . . . . . . . . . . . . . . . . . . . . . . . . 20
. . . . . . . . . . . . . . . . . . . . . . . . . . . . . . . . 20
. . . . . . . . . . . . . . . . . . . . . . . . . . . . . . . . 20
4 Operation
Normal Operation
Default Variable
Status LEDs
Front Panel Keys
Main Menu Items
Default Period
Data Logs
Model Information
. . . . . . . . . . . . . . . . . . . . . . . . . . . . . . . . . . . . 21
. . . . . . . . . . . . . . . . . . . . . . . . . . . . . . . . . . . 21
. . . . . . . . . . . . . . . . . . . . . . . . . . . . . . . . . . . . . . 21
. . . . . . . . . . . . . . . . . . . . . . . . . . . . . . . . . . . 21
. . . . . . . . . . . . . . . . . . . . . . . . . . . . . . . . . . . 22
. . . . . . . . . . . . . . . . . . . . . . . . . . . . . . . . . . . . 23
. . . . . . . . . . . . . . . . . . . . . . . . . . . . . . . . . . . . . . . 23
. . . . . . . . . . . . . . . . . . . . . . . . . . . . . . . . . . 25
. . . . . . . . . . . . . . . . . . . . . . . . . 13
. . . . . . . . . . . . . . . . . . . . . . . . . . . . . 17
. . . . . . . . . . . . . . . . . . . . . . 19
5 Instrument Calibration
Introduction
515 DG01 - 18 June 2017
. . . . . . . . . . . . . . . . . . . . . . . . . . . . . . . . . . . . . . . 27
v
Page 6

Calibration View Mode . . . . . . . . . . . . . . . . . . . . . . . . . . . . . . . . . 27
Calibration Set Mode
Changing the Instrument Settings
Calibration Menu Tree
Instrument Settings
Units of Measurement
Parameters
Inputs
Outputs
Alarms
. . . . . . . . . . . . . . . . . . . . . . . . . . . . . . . . . . . . . . 33
. . . . . . . . . . . . . . . . . . . . . . . . . . . . . . . . . . . . . . . . . 35
. . . . . . . . . . . . . . . . . . . . . . . . . . . . . . . . . . . . . . . . 39
. . . . . . . . . . . . . . . . . . . . . . . . . . . . . . . . . . . . . . . . 39
Communications
Time Settings and Data Logging
General Setup Parameters
Test Menu
. . . . . . . . . . . . . . . . . . . . . . . . . . . . . . . . . . . . . . . 47
System Messages
Error Messages
Warning Messages
. . . . . . . . . . . . . . . . . . . . . . . . . . . . . . . . . . 28
. . . . . . . . . . . . . . . . . . . . . . . . . . 29
. . . . . . . . . . . . . . . . . . . . . . . . . . . . . . . . . . 30
. . . . . . . . . . . . . . . . . . . . . . . . . . . . . . . . . . . . 32
. . . . . . . . . . . . . . . . . . . . . . . . . . . . . . . . 32
. . . . . . . . . . . . . . . . . . . . . . . . . . . . . . . . . . . 41
. . . . . . . . . . . . . . . . . . . . . . . . . . . 43
. . . . . . . . . . . . . . . . . . . . . . . . . . . . . . . 46
. . . . . . . . . . . . . . . . . . . . . . . . . . . . . . . . . . . . . 48
. . . . . . . . . . . . . . . . . . . . . . . . . . . . . . . . . . . . 48
. . . . . . . . . . . . . . . . . . . . . . . . . . . . . . . . . . 50
6 Communications
Overview
Hardware Interconnection
Protocols
Simple ASCII Protocol
Requests Format
Instrument Responses
Corrupted or Invalid Requests
Modbus RTU Protocol
List of Data Registers
Printer Protocol
Types of Printouts
Printer Data Control
. . . . . . . . . . . . . . . . . . . . . . . . . . . . . . . . . . . . . . . . . 51
. . . . . . . . . . . . . . . . . . . . . . . . . . . . . . 51
. . . . . . . . . . . . . . . . . . . . . . . . . . . . . . . . . . . . . . . . . 53
. . . . . . . . . . . . . . . . . . . . . . . . . . . . . . . . . 54
. . . . . . . . . . . . . . . . . . . . . . . . . . . . . . . . . . . 54
. . . . . . . . . . . . . . . . . . . . . . . . . . . . . . . . . 55
. . . . . . . . . . . . . . . . . . . . . . . . . . . . 58
. . . . . . . . . . . . . . . . . . . . . . . . . . . . . . . . . 59
. . . . . . . . . . . . . . . . . . . . . . . . . . . . . . . . . 61
. . . . . . . . . . . . . . . . . . . . . . . . . . . . . . . . . . . . . 64
. . . . . . . . . . . . . . . . . . . . . . . . . . . . . . . . . . . 65
. . . . . . . . . . . . . . . . . . . . . . . . . . . . . . . . . 68
Appendix A Glossary
Glossary
. . . . . . . . . . . . . . . . . . . . . . . . . . . . . . . . . . . . . . . . . 69
Appendix B Model Numbers
Product Codes
Custom Version Codes
Application Information Code
. . . . . . . . . . . . . . . . . . . . . . . . . . . . . . . . . . . . . . 71
. . . . . . . . . . . . . . . . . . . . . . . . . . . . . . . . . . 72
. . . . . . . . . . . . . . . . . . . . . . . . . . . . . . 72
Appendix C Units of Measurement
Available Units of Measurement
. . . . . . . . . . . . . . . . . . . . . . . . . . . . . 74
Appendix D Reference Tables
Properties of Selected Gases
Index
vi 515 DG01 - 18 June 2017
. . . . . . . . . . . . . . . . . . . . . . . . . . . . . . . . . . . . . . . . . . . . 77
. . . . . . . . . . . . . . . . . . . . . . . . . . . . . . . 75
Page 7

List of Figures
1 Typical Application Diagram . . . . . . . . . . . . . . . . . . . . . . . . . . . . 6
2 Rear Panel Connections
3 Externally Powered Voltage Transmitter
4 Internally Powered Voltage Transmitter
5 Externally Powered Current Loop
6 Internally Powered Current Loops
7 RTD Connection
. . . . . . . . . . . . . . . . . . . . . . . . . . . . . . . . . . 16
8 Logic Inputs Connection Diagram
9 Output 4-20 mA Connection Diagram
10 Relay Connection Diagram
11 RS-485 Interface Connections
12 Logged Data Display Methods
13 Calibration Menu Tree Sheet 1
14 Calibration Menu Tree Sheet 2
15 RS-232 Cable Connections to a Computer
16 RS-485 Connections
. . . . . . . . . . . . . . . . . . . . . . . . . . . . . . 12
. . . . . . . . . . . . . . . . . . . . . 14
. . . . . . . . . . . . . . . . . . . . . 14
. . . . . . . . . . . . . . . . . . . . . . . . . 15
. . . . . . . . . . . . . . . . . . . . . . . . 15
. . . . . . . . . . . . . . . . . . . . . . . . 17
. . . . . . . . . . . . . . . . . . . . . . . 17
. . . . . . . . . . . . . . . . . . . . . . . . . . . . 18
. . . . . . . . . . . . . . . . . . . . . . . . . . . 20
. . . . . . . . . . . . . . . . . . . . . . . . . . 24
. . . . . . . . . . . . . . . . . . . . . . . . . . 30
. . . . . . . . . . . . . . . . . . . . . . . . . . 31
. . . . . . . . . . . . . . . . . . . . 52
. . . . . . . . . . . . . . . . . . . . . . . . . . . . . . . . 52
vii515 DG01 - 18 June 2017
Page 8

viii 515 DG01 - 18 June 2017
Page 9

Chapter 1
Introduction
Features
• Pulse input for density
• Temperature and Pressure inputs for density conversion to reference
conditions
• Conversion based on a variety of General Gas equations
• Customer Defined Function (look-up table)
• Versatile User Input available on main menu
• Selection of second language and user tags
• RTC logging with over 1000 entries
• 4-20 mA retransmission
• RS-232 and RS-485 (optional) serial ports
• Modbus RTU, Printer and other serial port protocols
Overview
• Front panel adjustment of 8-24 V DC output voltage
• Backlit display
The density converter application accepts inputs from Sarasota density
meters, temperature and pressure transmitters, and an unassigned input
enabling a variable to be connected as an input to the Customer Defined
Function (look-up table).
The converter calculates line (measured) density from the density meter
period output and uses it together with temperature and pressure readings to
derive density at reference conditions and calculate specific gravity and
other density related variables.
This instrument is compatible with a wide range of density meter pulse
outputs, including millivolt signals, reed switches, Namur proximity
switches and pulse trains via its smart front-panel program selection.
515 DG01 - 18 June 2017
1
Page 10

Introduction
Calculations
The following equations identify the derivation of some of the displayed
variables. If your interest is more in the operation of the instrument, you can
skip this section and allow the instrument to take care of the calculations.
The line density calculations are based on accurately measured average
period of pulses coming from density meters such as Sarasota Industrial
Density Meter FD910, etc.
A variety of calculations are available to suit the nature of the gas and the
measurement conditions. The calculations are valid for the vapour phase of
a gas.
Equations Of State:
• Ideal Gas
• Redlich-Kwong
• Soave-Redlich-Kwong
• Peng-Robinson
Equation Sets
Measured Line Density Correction
DCF D_OFFSET+=
where:
= measured line density
DCF = density correction factor (default 1.0)
D_OFFSET = density offset (default 0.0)
Equations of State
In this instrument the calculation of gas properties can be based on one of
the following equations of state. These equations are based around the
general gas law that relates pressure (P), temperature (T), Universal Gas
Constant (R) and compressibility (Z) to the volume (V):
PV = ZRT
The method by which each equation determines the compressibility factor
differs, meaning it is more suited to certain gas types and conditions.
Ideal Gas
The Ideal Gas equation assumes the compressibility factor to be 1. This
equation is suited to gas at low pressure and high temperatures.
2 515 DG01 - 18 June 2017
Page 11

Introduction
P
Redlich-Kwong (1949)
The Redlich-Kwong equation determines the compressibility factor with a
cubic equation that uses the Critical Temperature and Pressure gas
properties. This equation is included in this instrument from a historical or
backward compatibility point of view as some older installations still
specify it as the means of gas calculation.
Soave-Redlich-Kwong (1972)
The Soave-Redlich-Kwong equation determines the compressibility factor
with a cubic equation. It uses the Acentric Factor of the gas as well as the
Critical Temperature and Pressure. This equation accurately models the
vapour pressure of light hydrocarbons and light gases at or above
atmospheric pressures.
Peng-Robinson (1976)
The Peng-Robinson equation also determines the compressibility factor
with a cubic equation. It uses the Acentric Factor of the gas as well as the
Critical Temperature and Pressure. This was designed to provide better
vapour pressure for hydrocarbons in the gasoline range.
Critical Temperature and Pressure
The Critical Temperature and Pressure can be entered as constants or
approximated by quadratic equation as functions of Specific Gravity:
T01 ATSG BTSG
C
P01 APSG BPSG
C
Set coefficients A and B to zero if no SG approximation is required.
User Defined Function
The user defined function allows the user to set up a table defining two
output variables OUT-A and OUT-B as a function of two input variables
INP-X and INP-Y. Such table enables the computation of more complex
non-linear custom functions based on the main menu variables. The 500Series Program Manager PC software allows to customize the table as well
as other parameters before downloading embedded software into the
instrument.
2
++=
2
++=
For further details of these equations or restrictions of use please refer to the
appropriate standard or relevant documents.
515 DG01 - 18 June 2017 3
Page 12

Introduction
f
Analog Input Scaling
The analog inputs in this instrument are scaled by the following general
formula:
APmin
where:
P
= minimum point (equivalent to offset)
min
= maximum point (P
P
max
A* = normalised signal (0 to 1) with correction applied for a flow input
Displayed Information
The front panel display shows the current values of the input variables and
the results of the calculations.
The instrument can be supplied with a real-time clock for data logging of
over 1000 entries of the variables as displayed on the main menu.
This application indicates the type of pressure value being displayed as
either gauge or absolute by adding an ‘A’ or ‘G’ to the units of
measurement.
P
max
– P
max
P
min–A*+=
is equivalent to span)
min
4 515 DG01 - 18 June 2017
Page 13
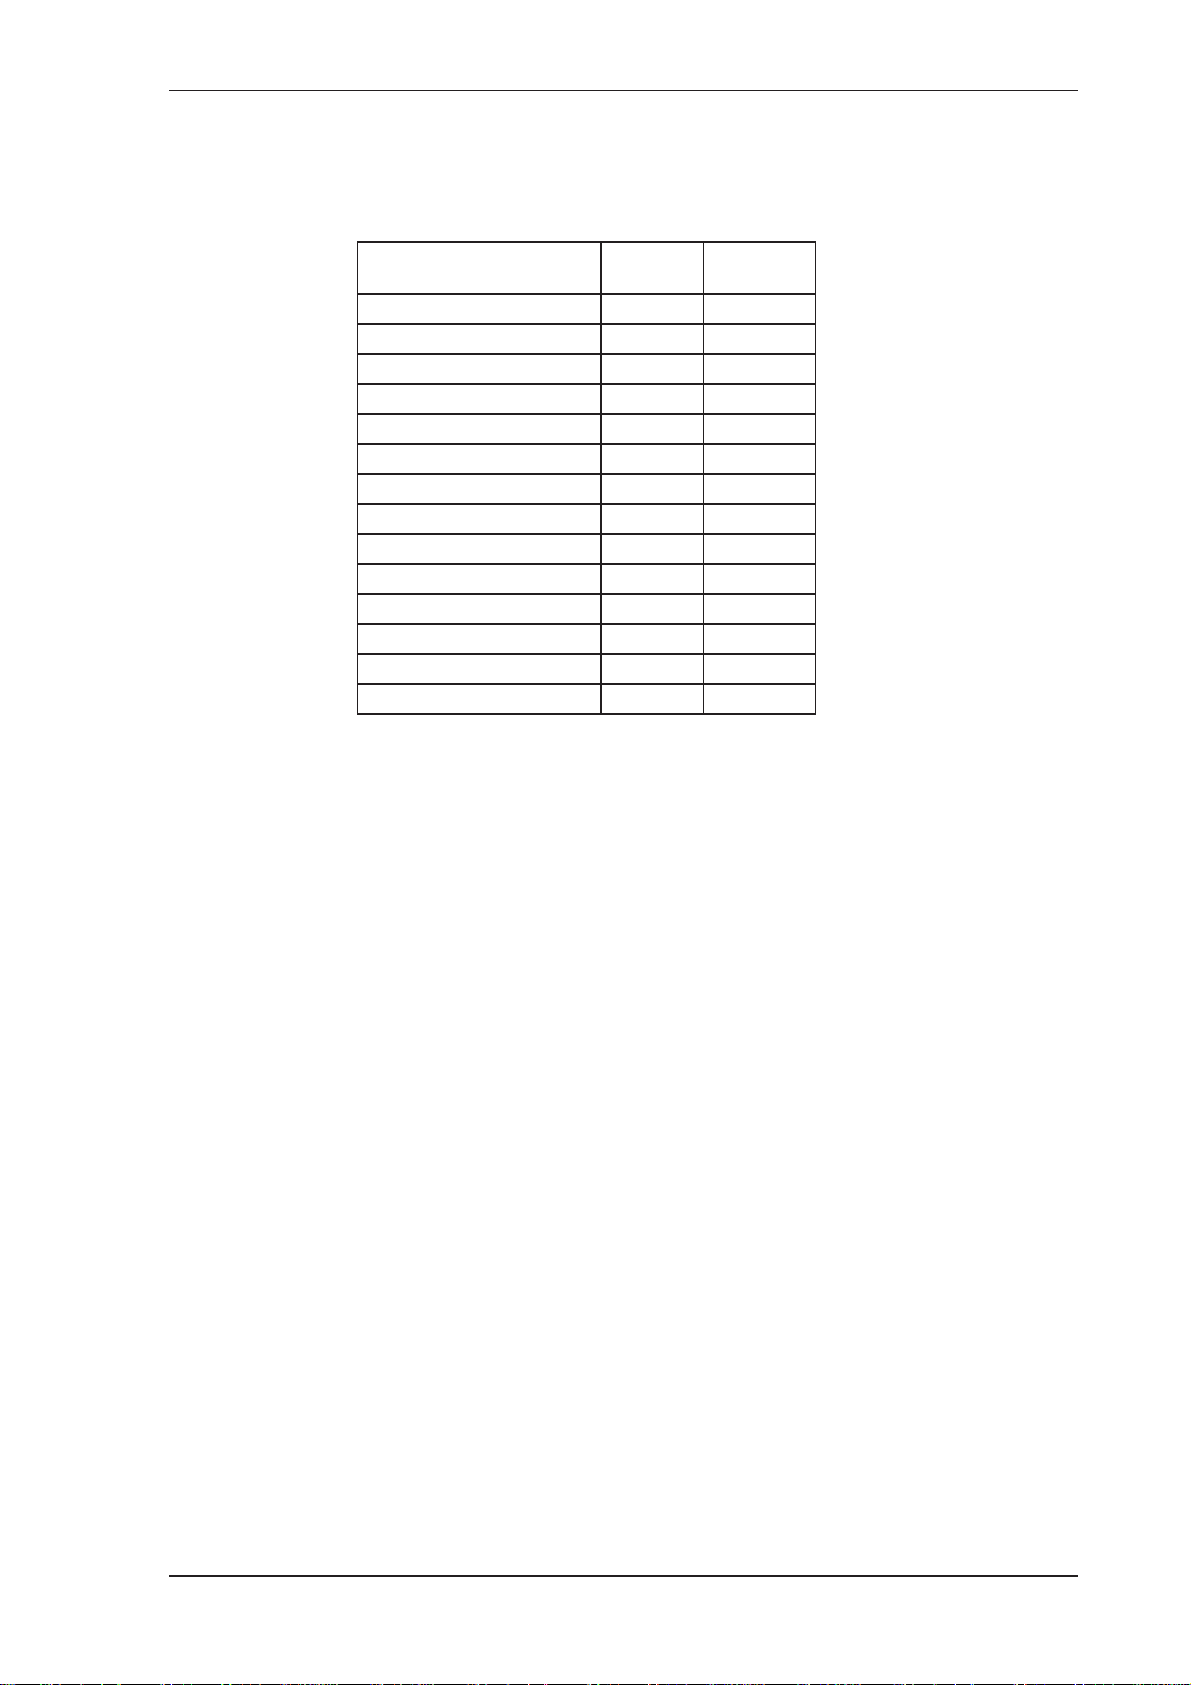
Main Menu Variables
Introduction
Main Menu
Variables
Density (Line) kg/m3 Rate
Period us Rate
Density (Reference) kg/m3 Rate
Temperature Deg C Rate
Pressure kPa Rate
Specific Gravity E+0 Rate
Z-Factor (Line) E+0 Rate
Z-Factor (Reference) E+0 Rate
Molecular Weight E+0 Rate
Critical Temperature Deg C Rate
Critical Pressure kPa Rate
User Input - - - Rate
User Output A - - - Rate
User Output B - - - Rate
Default
Units
Variable
Type
Refer to Available Units of Measurement on page 74 for the list of
available units.
Communications
There are two communication ports available as follows:
• RS-232 port
• RS-485 port (optional)
The ports can be used for remote data reading, printouts and for initial
application loading of the instrument.
Isolated Outputs
The opto-isolated outputs can re-transmit any main menu variable. The type
of output is determined by the nature of the assigned variable. Totals are
output as pulses and rates are output as 4-20 mA signals. One output is
standard, a second output is available as an option.
Relay Outputs
The relay alarms can be assigned to any of the main menu variables of a rate
type. The alarms can be fully configured including hysteresis. Two relays
are standard with additional two relays available as an option.
515 DG01 - 18 June 2017 5
Page 14
Introduction
Software Configuration
The instrument can be further tailored to suit specific application needs
including units of measurement, custom tags, second language or access
levels. A distributor can configure these requirements before delivery.
Instrument parameters including units of measurement can be programmed
in the field, according to the user access levels assigned to parameters by the
distributor.
All set-up parameters, totals and logged data are stored in non-volatile
memory with at least 30 years retention.
Temperature and Pressure Input Types
Temperature sensor input(s) can be either PT100, PT500, 4-20 mA, 0-5 V or
1-5V signals. Pressure sensor input(s) can be either 4-20 mA, 0-5 V or 1-5V
signals.
Approvals
Pulse Input 1 Analog
D
Density
Transmitter
Input 1
T
Temperature
Transmitter
Analog
Input 2
P
Pressure
Transmitter
Analog
Input 3
U
User Input
Figure 1 Typical Application Diagram
This instrument conforms to the EMC-Directive of the Council of
European Communities 2014/30/EU, the LVD safety directive 2014/35/EU
and the following standards:
• EN61326:2013 Electrical equipment for measurement, control and
laboratory use – EMC requirements: Industrial Environment.
• EN61010:2010 Safety requirements for electrical equipment for
measurement, control, and laboratory use.
In order to comply with these standards, the wiring instructions in Chapter
3 - Installation must be followed.
6 515 DG01 - 18 June 2017
Page 15

Introduction
FCC Declaration
This equipment has been tested and found to comply with the limits for a
Class A digital device, pursuant to Part 15 of the FCC Rules. These limits
are designed to provide reasonable protection against harmful interference
when the equipment is operated in a commercial environment. This
equipment generates, uses, and can radiate radio frequency energy and, if
not installed and used in accordance with the instruction manual, might
cause harmful interference to radio communications. Operation of this
equipment in a residential area is likely to cause harmful interference, in
which case the user will be required to correct the interference at his own
expense.
Properly shielded and grounded cables and connectors must be used in order
to meet FCC emission limits. Contrec Ltd is not responsible for any radio or
television interference caused by using other than recommended cables and
connectors or by unauthorized changes or modifications to this equipment.
Unauthorized changes or modifications could void the user's authority to
operate the equipment.
This device complies with Part 15 of the FCC Rules. Operation is subject to
the following two conditions: (1) this device might not cause harmful
interference, and (2) this device must accept any interference received,
including interference that might cause undesired operation.
515 DG01 - 18 June 2017 7
Page 16

Introduction
8 515 DG01 - 18 June 2017
Page 17
Chapter 2
Specifications
Specification Table
Operating Environment
Temperature -20 °C to +60 °C (conformal coating)
+5 °C to +40 °C (no coating)
Humidity 0 to 95% non condensing (conformal
coating)
5% to 85% non condensing (no coating)
Power Supply 100-240 V AC (+/-10%) 50-60 Hz (+/-
10%) or 12-28 V DC
Consumption 6 W (typical)
Protection Sealed to IP65 (Nema 4X) when panel
mounted
Dimensions
(panel option)
147 mm (5.8") width
74 mm (2.9") height
167 mm (6.6") depth
Display
Type Backlit LCD with 7-digit numeric display
and 11-character alphanumeric display
Digits 15.5 mm (0.6") high
Characters 6 mm (0.24") high
LCD Backup Last data visible for 15 min after power
down
Update Rate 0.3 second
Non-volatile Memory
Retention > 30 years
Data Stored Setup, Totals and Logs
Approvals
Interference compliance
Enclosure IECEx, ATEX and CSA approved
enclosures available for hazardous areas
Real Time Clock (Optional)
Battery Type 3 volts Lithium button cell (CR2032)
Battery Life 5 years (typical)
Frequency Input (General)
Range 0 to 10 kHz
Overvoltage 30 V maximum
Update Time 0.3 sec
Cutoff frequency Programmable
Configuration Pulse, coil or NPS input
Non-linearity Up to 10 correction points
Pulse
Signal Type CMOS, TTL, open collector, reed switch
Threshold 1.3 volts
Coil
Signal Type Turbine and sine wave
Sensitivity 15 mV p-p minimum
NPS
Signal Type NPS sensor to Namur standard
Analog Input (General)
Overcurrent 100 mA absolute maximum rating
Update Time < 1.0 sec
Configuration RTD, 4-20 mA, 0-5V and 1-5V input
Non-linearity Up to 20 correction points (some inputs)
RTD Input
Sensor Type PT100 & PT500 to IEC 751
Connection Four Wire
Range -200C to 350C
Accuracy 0.1C typical (-100C to 300C)
4-20 mA Input
Impedance 100 Ohms (to common signal ground)
Accuracy 0.05% full scale (20 C)
0.1% (full temperature range, typical)
515 DG01 - 18 June 2017
0-5 or 1-5 Volts Input
Impedance 10 MOhms (to common signal ground)
Accuracy 0.05% full scale (20 C)
0.1% (full temperature range, typical)
9
Page 18
Specifications
Logic Inputs
Signal Type CMOS, TTL, open collector, reed switch
Overvoltage 30V maximum
Relay Output
No. of Outputs 2 relays plus 2 optional relays
Voltage 250 volts AC, 30 volts DC maximum
(solid state relays use AC only)
Current 3 A maximum
Communication Ports
Ports RS-232 port
RS-485 port (optional)
Baud Rate 2400 to 19200 baud
Parity Odd, even or none
Stop Bits 1 or 2
Data Bits 8
Protocols ASCII, Modbus RTU, Printer*
Transducer Supply
Voltage 8 to 24 volts DC, programmable
Current 70 mA @ 24 V, 120 mA @ 12 V maximum
Protection Power limited output
Isolated Output
No. of Outputs 1 configurable output (plus 1 optional)
Configuration Pulse/Digital or 4-20 mA output
Pulse/Digital Output
Signal Type Open collector
Switching 200 mA, 30 volts DC maximum
Saturation 0.8 volts maximum
4-20 mA Output
Supply 9 to 30 volts DC external
Resolution 0.05% full scale
Accuracy 0.05% full scale (20C)
0.1% (full temperature range, typical)
Important: Specifications are subject to change without notice.
Printer protocol is available only if RTC option is installed.
10 515 DG01 - 18 June 2017
Page 19
Chapter 3
Installation
Panel Mounting
The instrument should be located in an area with a clean, dry atmosphere
that is also relatively free of shock and vibration.
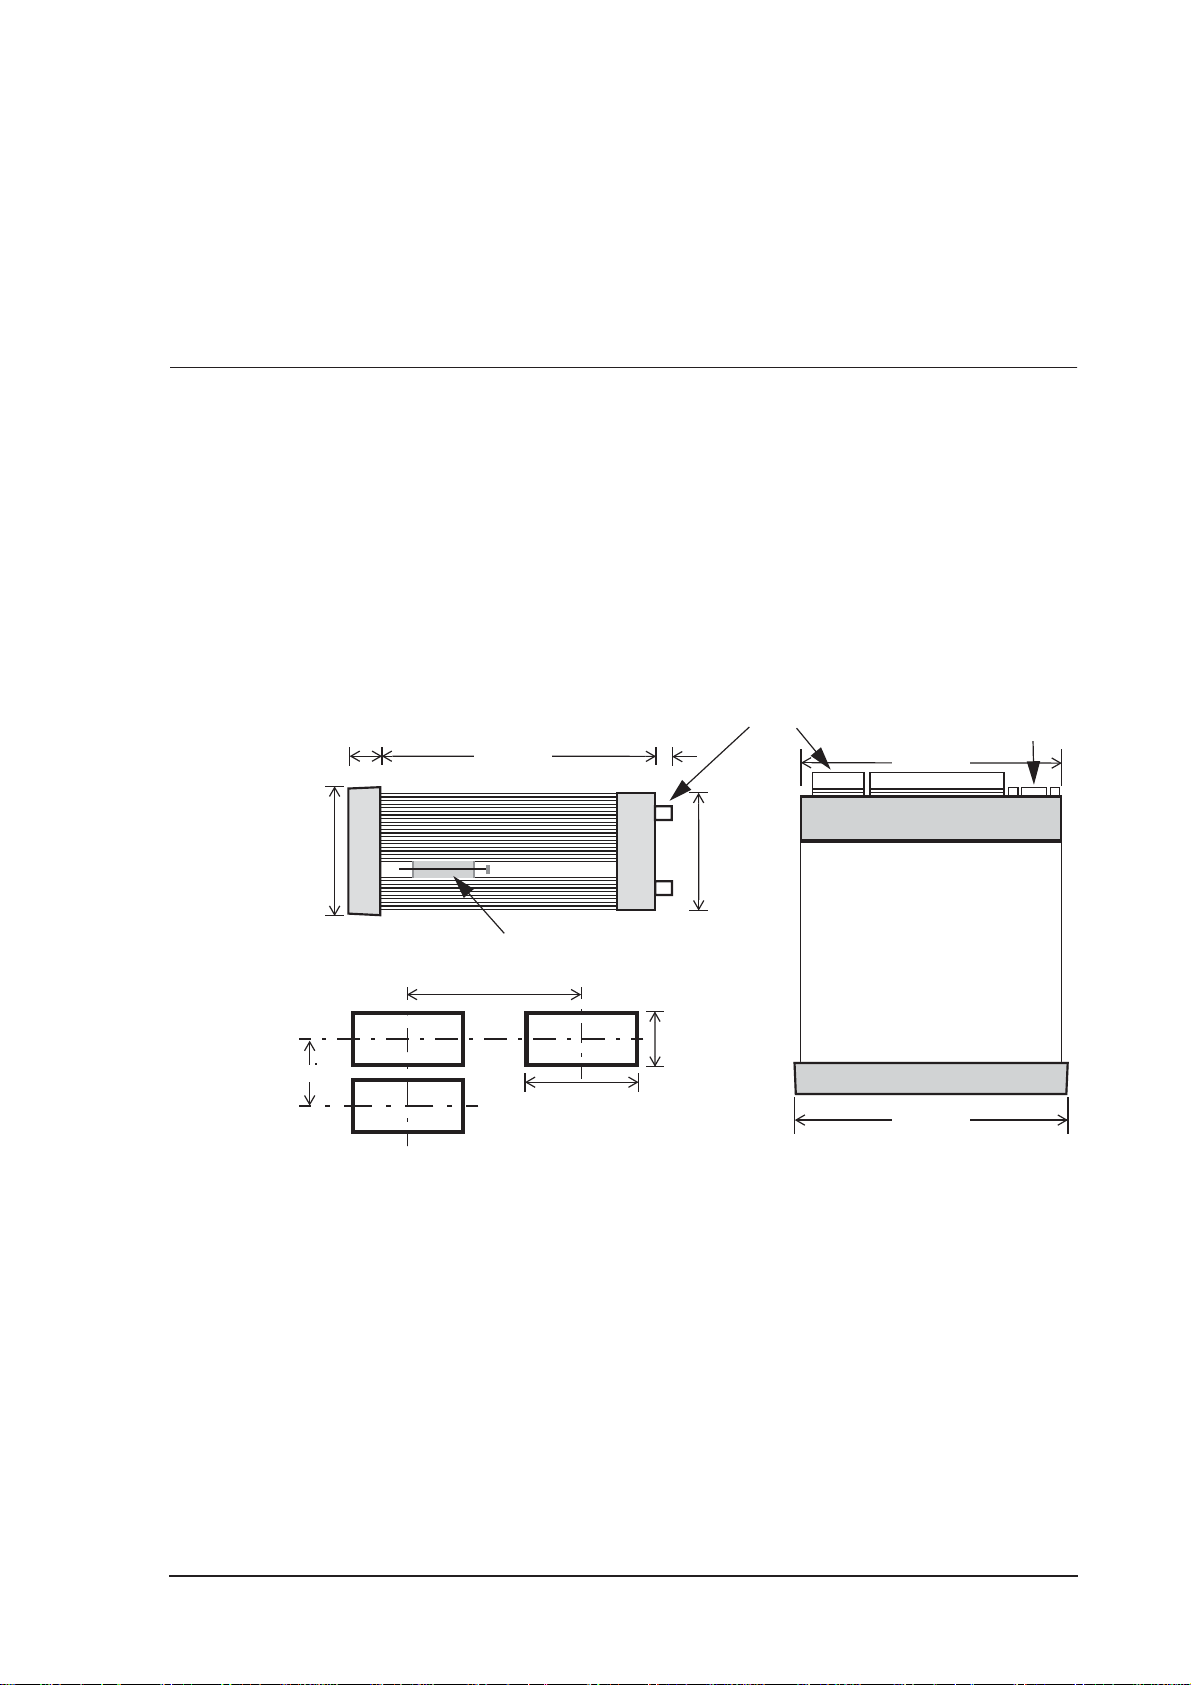
The standard mounting procedure is panel mounting in a cutout that is
139 mm wide by 67 mm high. Two side clips secure the unit into the panel.
shows the panel mounting requirements for the 500 Series Instrument.
Front
Panel
70 mm
Side View
22 mm
145 mm
74 mm
Mounting Clip
Min. 189 mm
139 mm
Panel Cut-out
25 mm
500 Series Instrument Panel Mounting
Rear Connectors
66 mm
67 mm
Top View
138 mm
147 mm
RS232
Port
515 DG01 - 18 June 2017
11
Page 20
Installation
Electrical Connection
Rear Panel Connections
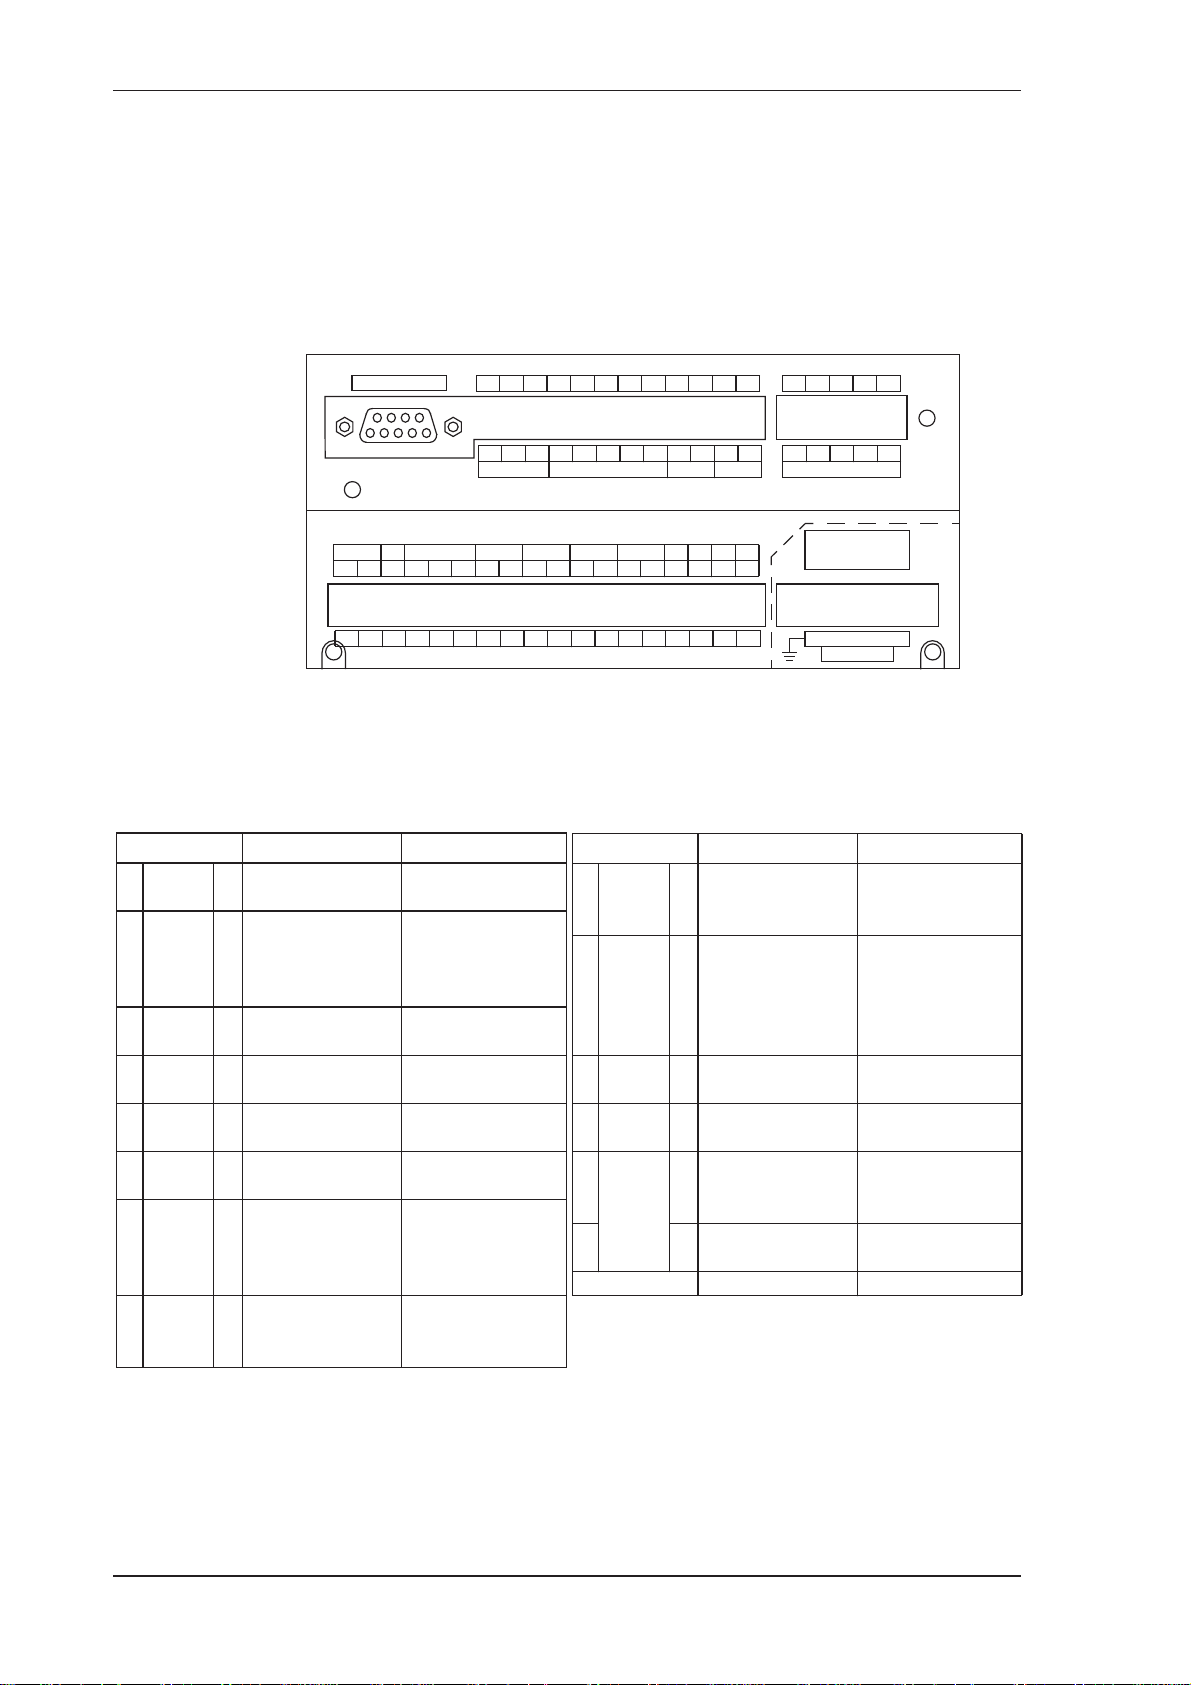
Figure 2 shows the connections on the rear panel of the instrument.
RS232 Port
FINP SG EXC V AINP1 AINP2 AINP3 AINP4 Vo G Vi SH
1+2+-1+2+3++-+-+-+-+-+E
1 2 3 4 5 6 7 8 9 10 11 12 13 14 15 16 17 18
19 20 21 22 23 24 25 26 27 28 29 30
+ - G 1+2+3+4+C- + - + -
RS485 LOGIC INPUT OUT1 OUT2
Figure 2 Rear Panel Connections
Terminal Designations
Terminal Label Designation Comment
1 FINP 1+ Frequency Input 1+ Density Input (Pulse)
2 FINP 2+ Frequency Input 2+ Not used
3 SG - Signal ground
4 EXC V 1+ Excitation Term 1+ Not used
5 EXC V 2+ Excitation Term 2+ For AINP1 RTD Input
6 EXC V 3+ Excitation Term 3+
7
AINP1
8 - Analog Input ch 1 (-)
9
AINP2
10 - Analog Input ch 2 (-)
11
AINP3
12 - Analog Input ch 3 (-)
13
AINP4
14 - Analog Input ch 4 (-)
15 Vo + 8-24 volts DC output Overload protected
16 G - DC Ground
17 Vi + DC power input DC power in 12-28V
18 SH E Shield terminal
E
AC
N N Mains neutral
MAINS
A A Mains active
+ Analog Input ch 1 (+)
+ Analog Input ch 2 (+)
+ Analog Input ch 3 (+)
+ Analog Input ch 4 (+)
E Mains ground
Temperature Input
Pressure Input
User input
AC power in 100240VAC
31 32 33 34 35
RC R1 R2 R3 R4
RELAYS
CAUTION
MAINS
E N A
AC MAINS
Terminal Label Designation Comment
19
RS485
21 G RS485 ground
22
23 2+ Switch 2
LOGIC
24 3+ Switch 3
INPUTS
25 4+ Switch 4
26 C- Signal ground
27
OUT1
28 - Output ch 1 (-)
29
OUT2
30 - Output ch 2 (-)
31
32 R1 Relay 1
RELAYS
33 R2 Relay 2
34 R3 Relay 3
35 R4 Relay 4
RS232 port 9-pin serial port
+ RS485 (+)
1+ Switch 1
+ Output ch 1 (+)
+ Output ch 2 (+)
RC Relay common
Optional RS485 port20 - RS485 (-)
Optional output
Optional relays
12 515 DG01 - 18 June 2017
Page 21
Inputs
Frequency (Pulse) Input Connection
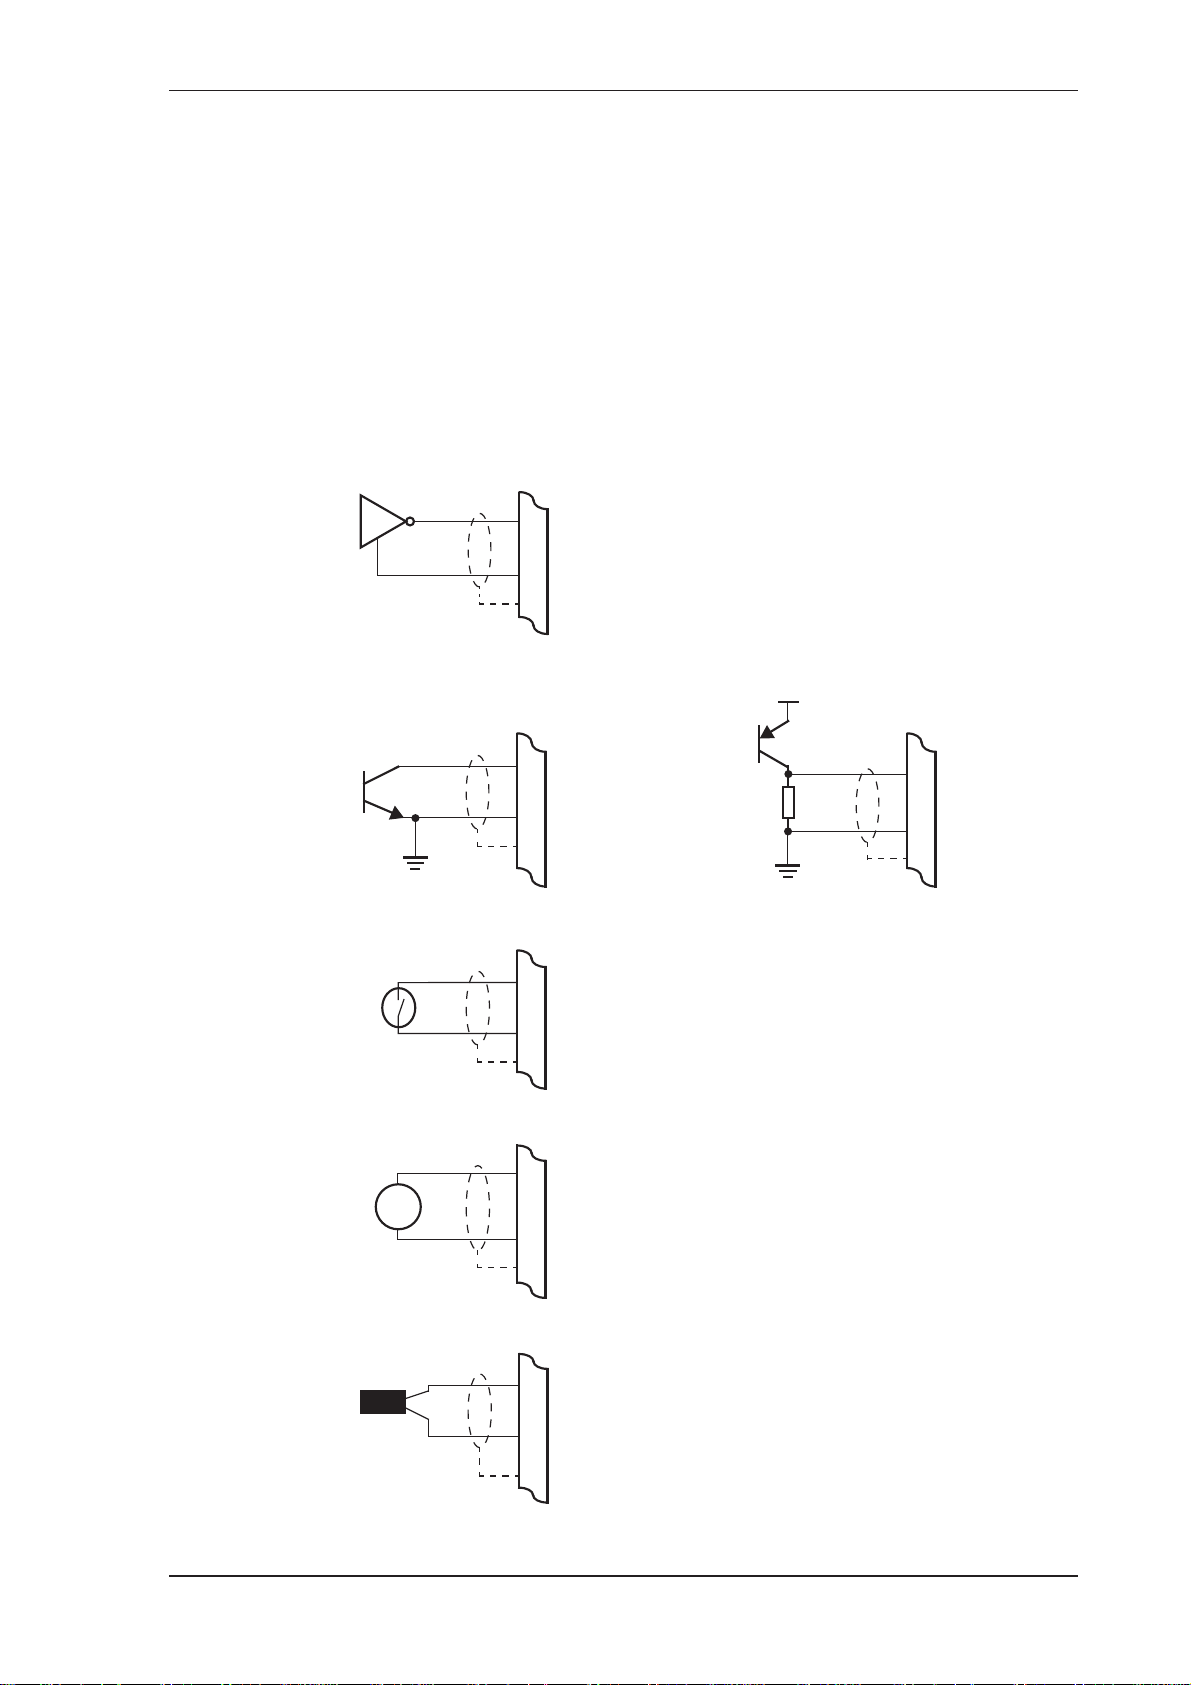
Connect pulse or frequency input signals from devices such as: TTL,
CMOS, open collector, reed relay switch, coil and Namur proximity switch,
as shown below. For better signal integrity, it is recommended to use
shielded cable. Refer to Terminal Designations on page 12 for specific
terminal numbers for this application.
Squarewave, CMOS or TTL
Frequency
+
3
18
Input
(FINPn)
Signal Ground
Shield
Installation
Open Collector
+V
NPN
Frequency
+
Signal Ground
3
Shield
18
Input
(FINPn)
PNP
Reed Relay Switch
Frequency
+
3
18 Shield
Input
(FINPn)
Signal Ground
Coils - with 15 millivolts peak to peak AC minimum
Frequency
+
Input
(FINPn)
~
Signal Ground
3
18
Shield
Frequency
+
Signal Ground
3
Shield
18
Input
(FINPn)
Namur Proximity Switch
NPS
515 DG01 - 18 June 2017 13
15
+
18
Vo +8V DC
Frequency
Input
(FINPn)
Shield
Page 22
Installation
Analog Input Connections
All analog inputs can accept DC signals ranging from 0-5V, 1-5V and
current signals from 4 to 20 mA.
Analog Input 1 (AINP1) can also accept an RTD input (PT100 or PT500) as
well as the standard 0-5 V, 1-5V and 4 to 20 mA input.
Applying levels of input current above the absolute maximum
rating (100mA) may cause permanent damage to the input
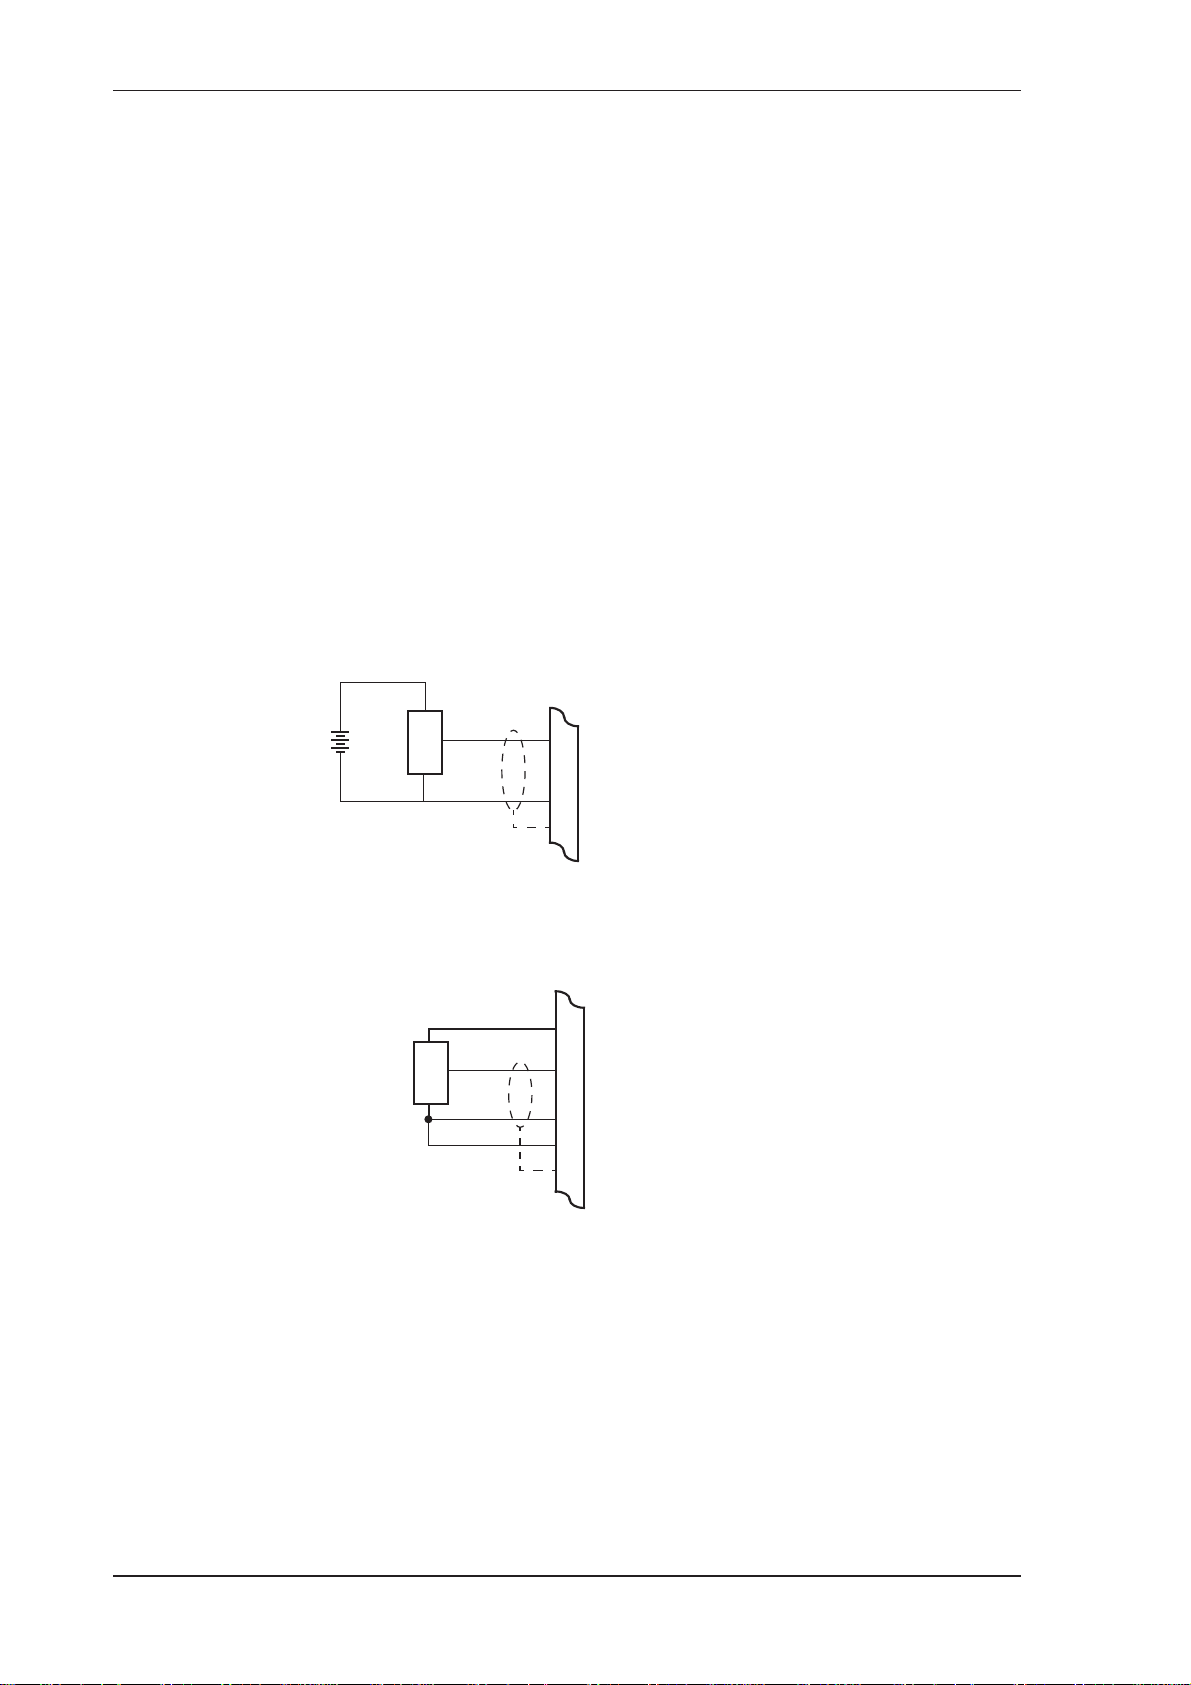
0-5 and 1-5 Volt Inputs
For externally powered voltage transmitters, connect each transmitter to a
pair of input terminals as shown in Figure 3. Refer to Terminal
Designations on page 12 for specific terminal numbers for this application.
CAUTION
circuitry.
+
Signal
-
Transmitter
18
+
Analog
Input
(AINPn)
-
Shield
Figure 3 Externally Powered Voltage Transmitter
Connect internally powered voltage transmitters as shown in Figure 4.
15
Vo +8...24V DC
+
-
16
DC ground
18
Shield
Analog
Input
(AINPn)
Transmitter
+
Signal
-
Figure 4 Internally Powered Voltage Transmitter
14 515 DG01 - 18 June 2017
Page 23
Installation
4-20 mA Inputs
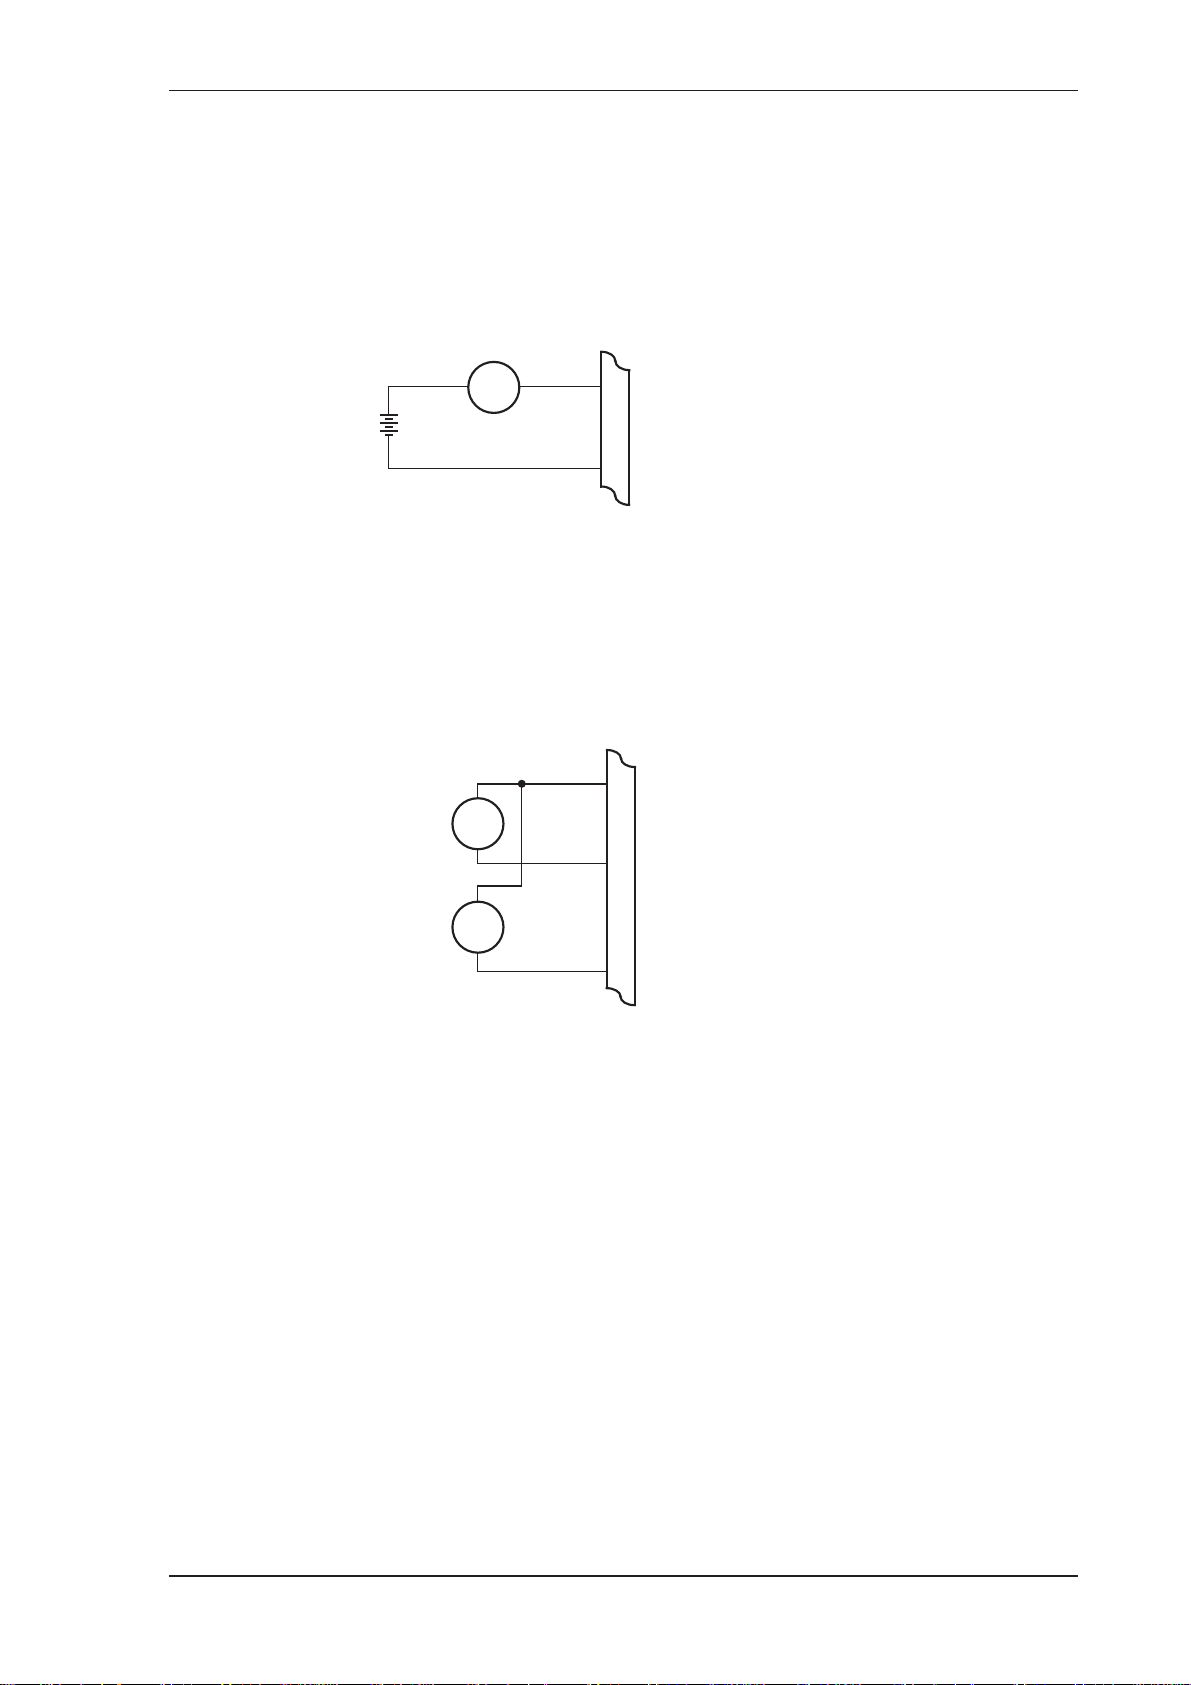
For an externally powered current loop, connect the transmitter to the input
terminals as shown in Figure 5. Refer to Terminal Designations on page 12
for specific terminal numbers for this application.
Transmitter
+
+
Analog
Input
(AINPn)
-
Figure 5 Externally Powered Current Loop
The internal overload-protected power supply has sufficient power for three
current loops at 24 V DC (more current loops can be supplied by using a
reduced voltage setting). Connect internally powered current loops as
shown in Figure 6.
Figure 6 Internally Powered Current Loops
15
+
Transmitter
-
+
Transmitter
-
Vo +8...24V DC
Analog
+
Input
(AINPn)
Analog
Input
+
(AINPn)
RTD Input
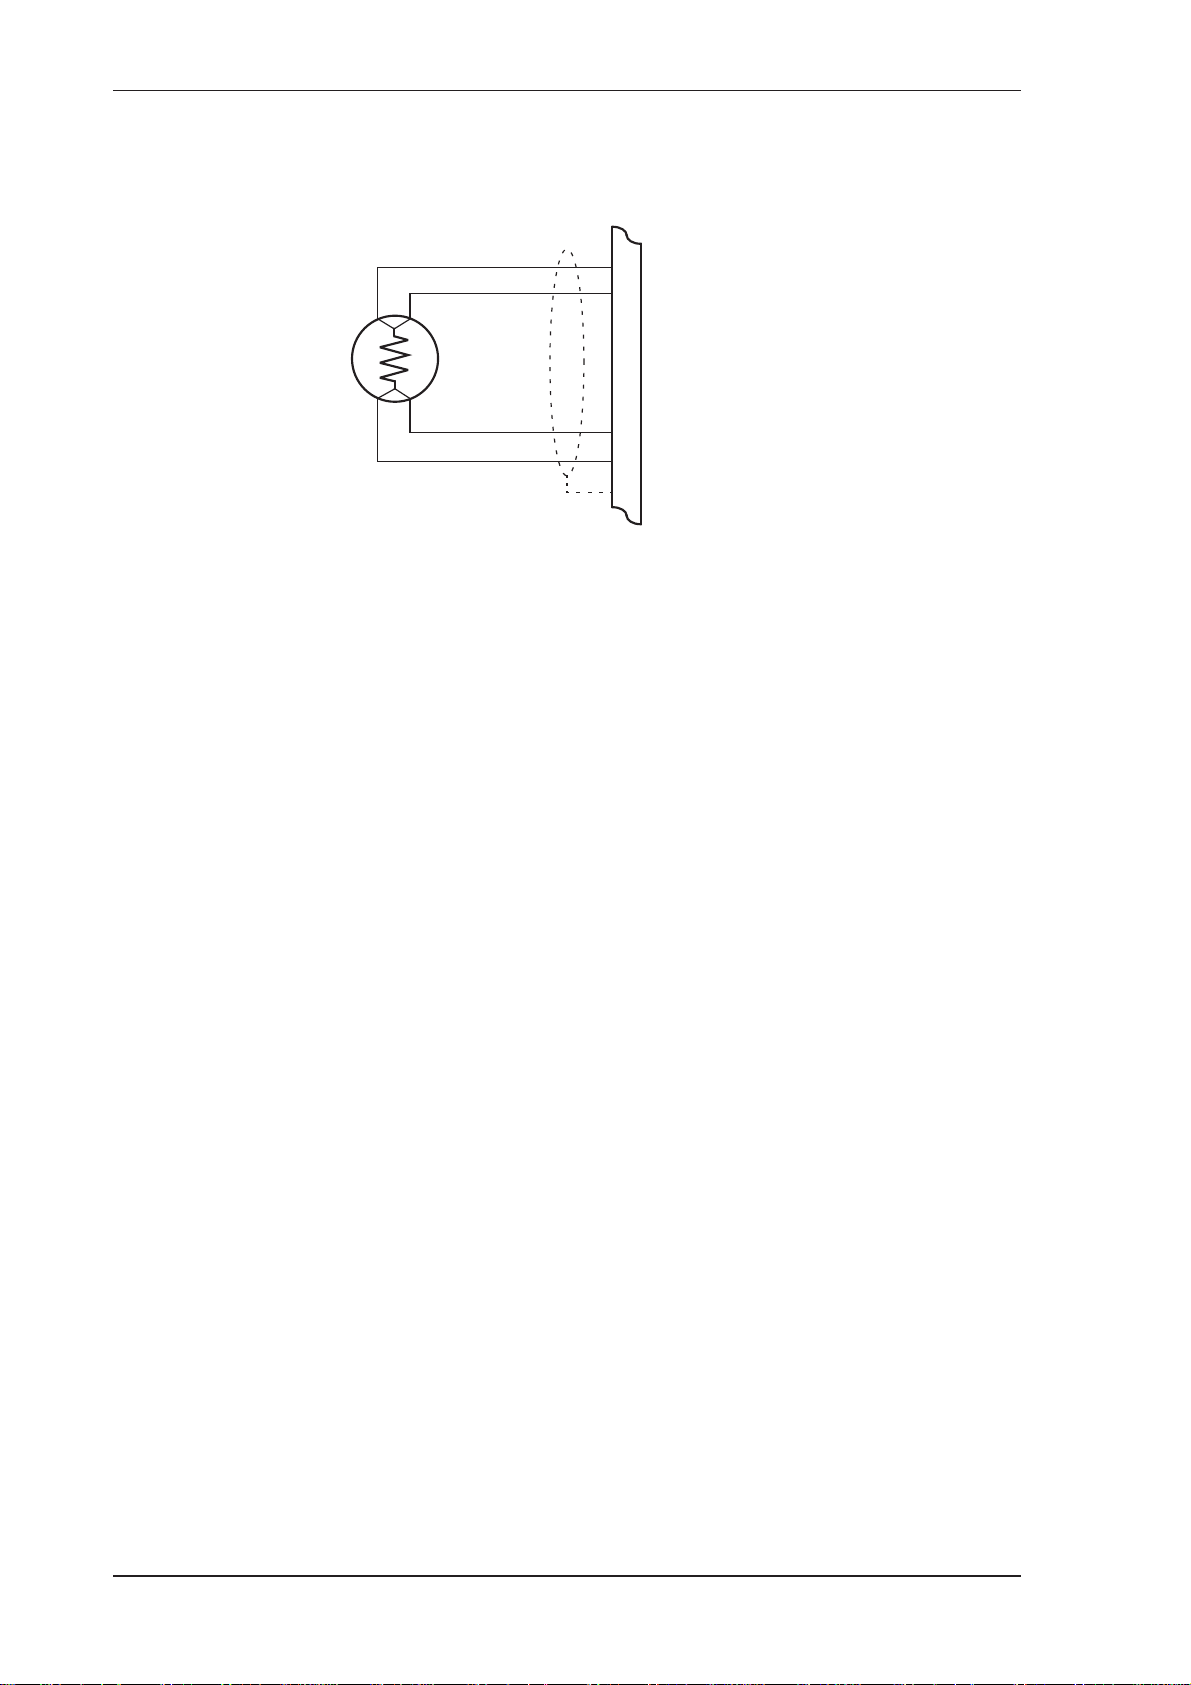
The instrument uses 4-wire RTDs to provide optimum accuracy and
stability. It is not necessary to have equal cable lengths for the 4-wire RTDs,
but they should be no longer than 50 metres. It is also recommended to use
shielded twisted pairs.
515 DG01 - 18 June 2017 15
Page 24
Installation
Connect RTD inputs as shown in Figure 7.
Excitation V (EXC V)
+
Analog Input (AINPn)
+
RTD
-
+
-
Analog Input (AINPn)
Signal Ground
3
Shield
18
Figure 7 RTD Connection
Only Analog Input 1 (AINP1) is available for RTD connection.
Excitation terminal 2 (pin 5) must be used in conjunction with AINP1.
It is possible to use two-wire or three-wire RTDs. However, four wires must
be taken to the RTD, with the signal and current wires joined as close to the
RTD as possible.
Note: The RTD has no polarity and can be connected in either direction.
However, the excitation and the positive analog input must be
connected to one side of the RTD. Similarly, the Signal Ground and
the negative analog input must be connected to the other side of the
RTD.
Logic Input Connection
These input(s) are designed to be connected to CMOS, TTL, open collector
signals or a voltage free contact switch. A minimum activation time of
300ms is required to guarantee reading of an input.
It is possible to read the status of all the logic inputs via a Modbus register
even if they are not used for a control purpose in the application.
16 515 DG01 - 18 June 2017
Page 25
Outputs
Installation
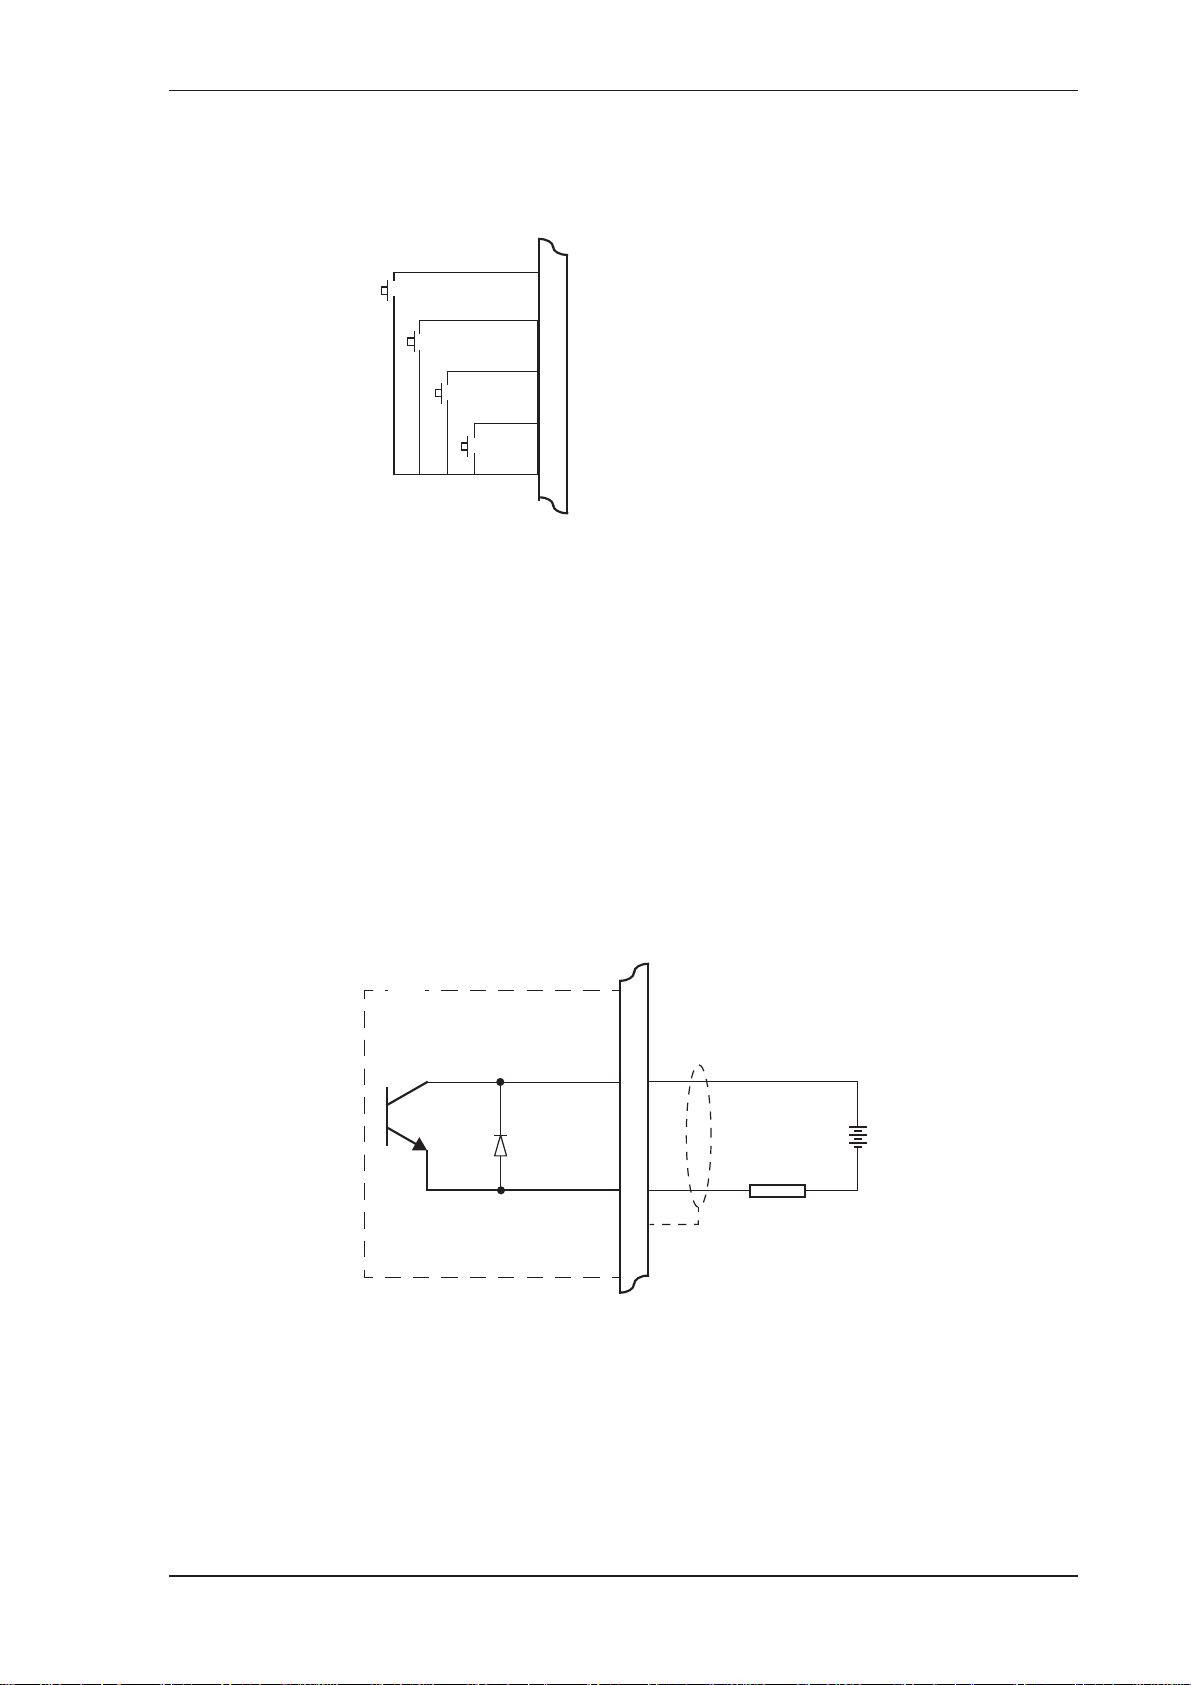
A remote push-button key can be connected to the Logic Inputs as shown
below.
Logic Input
22
1+
23
2+
24
3+
25
4+
26
CSignal Ground
Figure 8 Logic Inputs Connection Diagram
The advanced option for the instrument provides two opto-isolated passive
4-20 mA output ports.
4-20 mA Output Connection
Figure 9 shows the connections for a 4-20 mA output. Output channel 1 uses
terminals 27 (+) and 28 (-), output channel 2 uses terminals 29 (+) and 30 (-).
Maximum Load Resistance = (Supply-9) / 0.02 ohms
515
4-20 mA
Output
(OUTn)
18
+
DC supply
9...24V
-
Load
Shield
Figure 9 Output 4-20 mA Connection Diagram
515 DG01 - 18 June 2017 17
Page 26
Installation
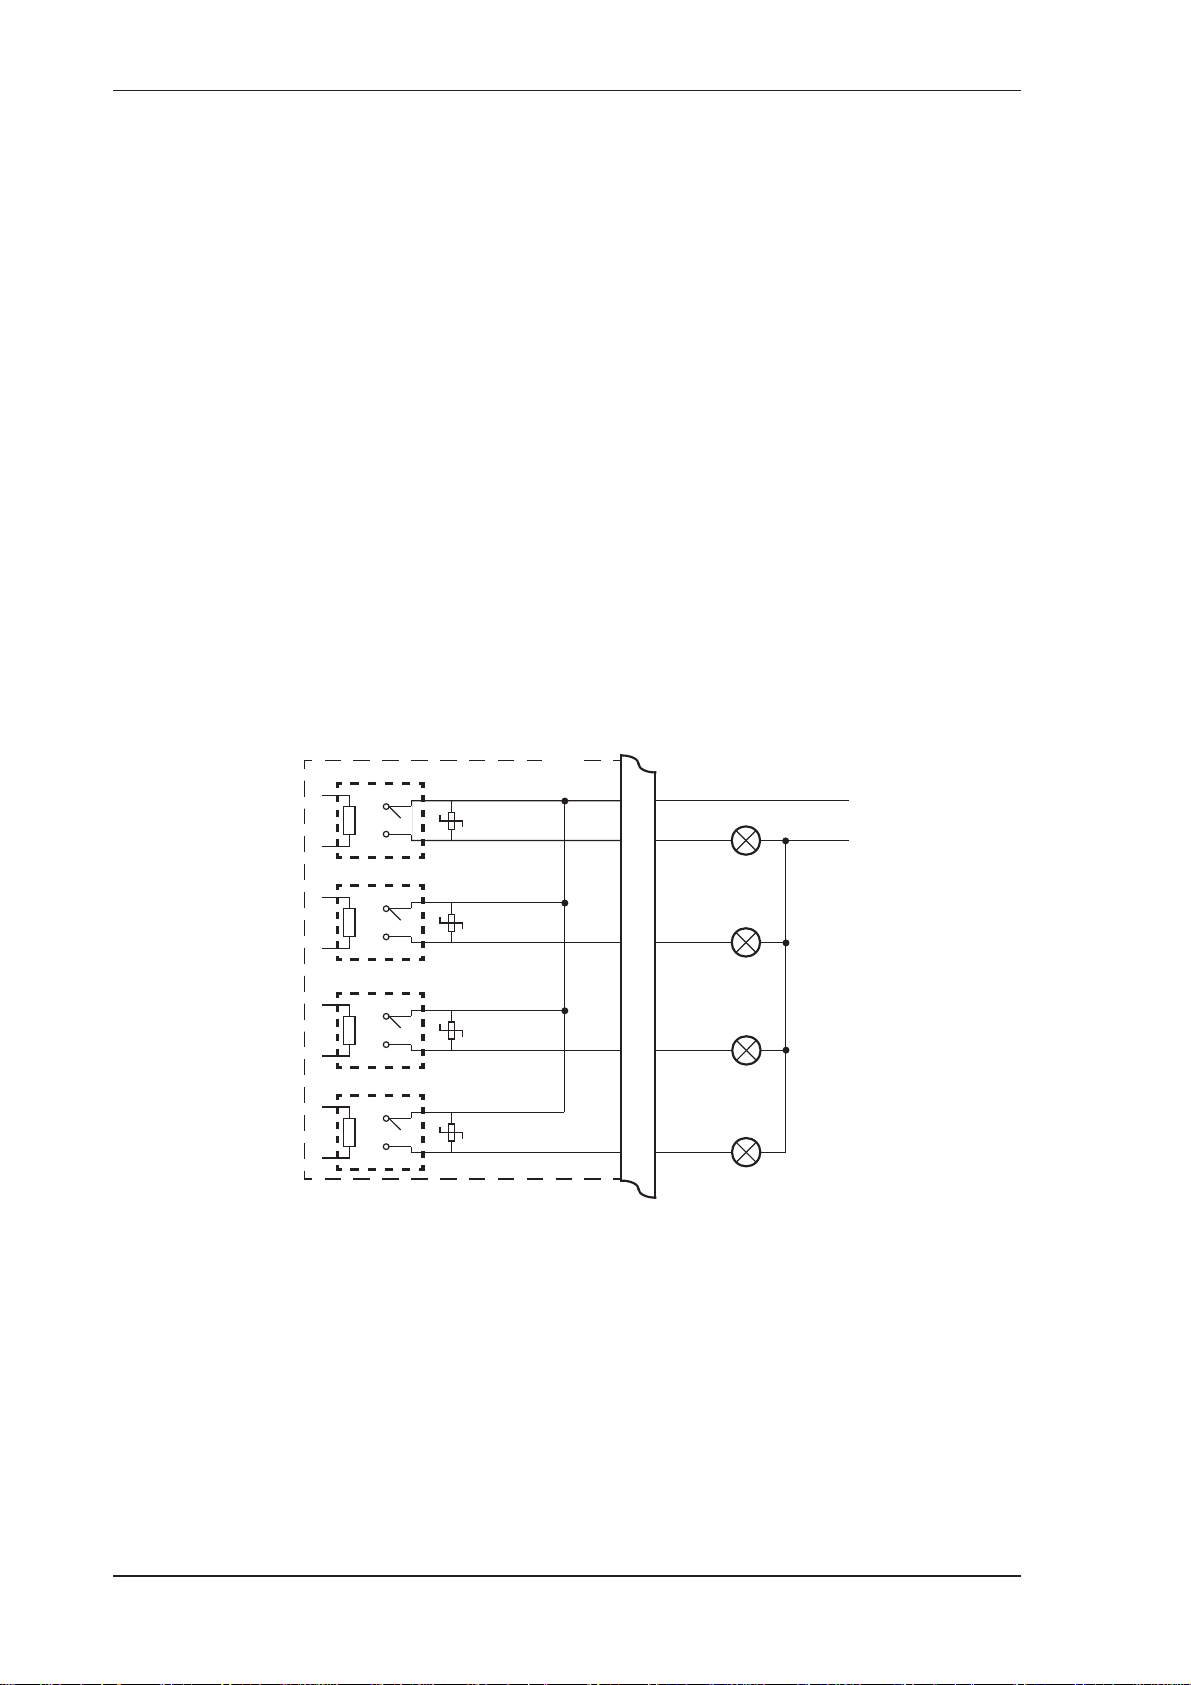
Control Relays (Alarms)
The standard instrument has two alarm relays, which can be used to drive
external devices such as external relays, LEDs, and audible alarms. The
advanced option has four alarm relays.
The operation of each alarm relay can be set to various modes as described
in Alarms on page 39.
There is also an equipment failure alarm option. This alarm can have
normally closed (open) contacts which open (close) when the instrument
displays any error message as listed in Error Messages on page 48, or if
there is a loss of power to the instrument.
The output characteristics of the relays are:
Maximum Voltage 30 volts DC or 250 volts AC
Maximum Current 3 A
Note: Solid state relays use AC voltage only.
Relay 1
MOV
Relay 2
MOV
Relay 3
MOV
Relay 4
MOV
500
Relay Common
RC
R1
R2
R3
R4
Alarm
Alarm
Alarm
Alarm
Supply
Figure 10 Relay Connection Diagram
18 515 DG01 - 18 June 2017
Page 27
RC Network for Interference Suppression
When driving highly inductive loads with the relay outputs, it is
recommended to use RC suppression networks (often called “Snubbers”)
for the following reasons:
• To limit the amount of electrical noise caused by arcing across the
contacts, which may, in extreme cases, cause the microprocessor to act
erratically.
• To protect the relay contacts against premature wear through pitting.
RC suppression networks consist of a capacitor and series resistor and are
commonly available in the electrical industry. The values of R and C are
dependent entirely on the load. However, if the user is unsure of the type of
snubber to use, values of 0.25 F and 100 will usually suffice. Note that
only mains-approved RC suppression networks should be used.
The basic principle of the operation is that the capacitor prevents a series of
sparks arcing across the contact as the contact breaks. The series resistor
limits the current through the contact when the contact first makes.
Installation
Communications
The communication protocols are described in Communications on
page 51.
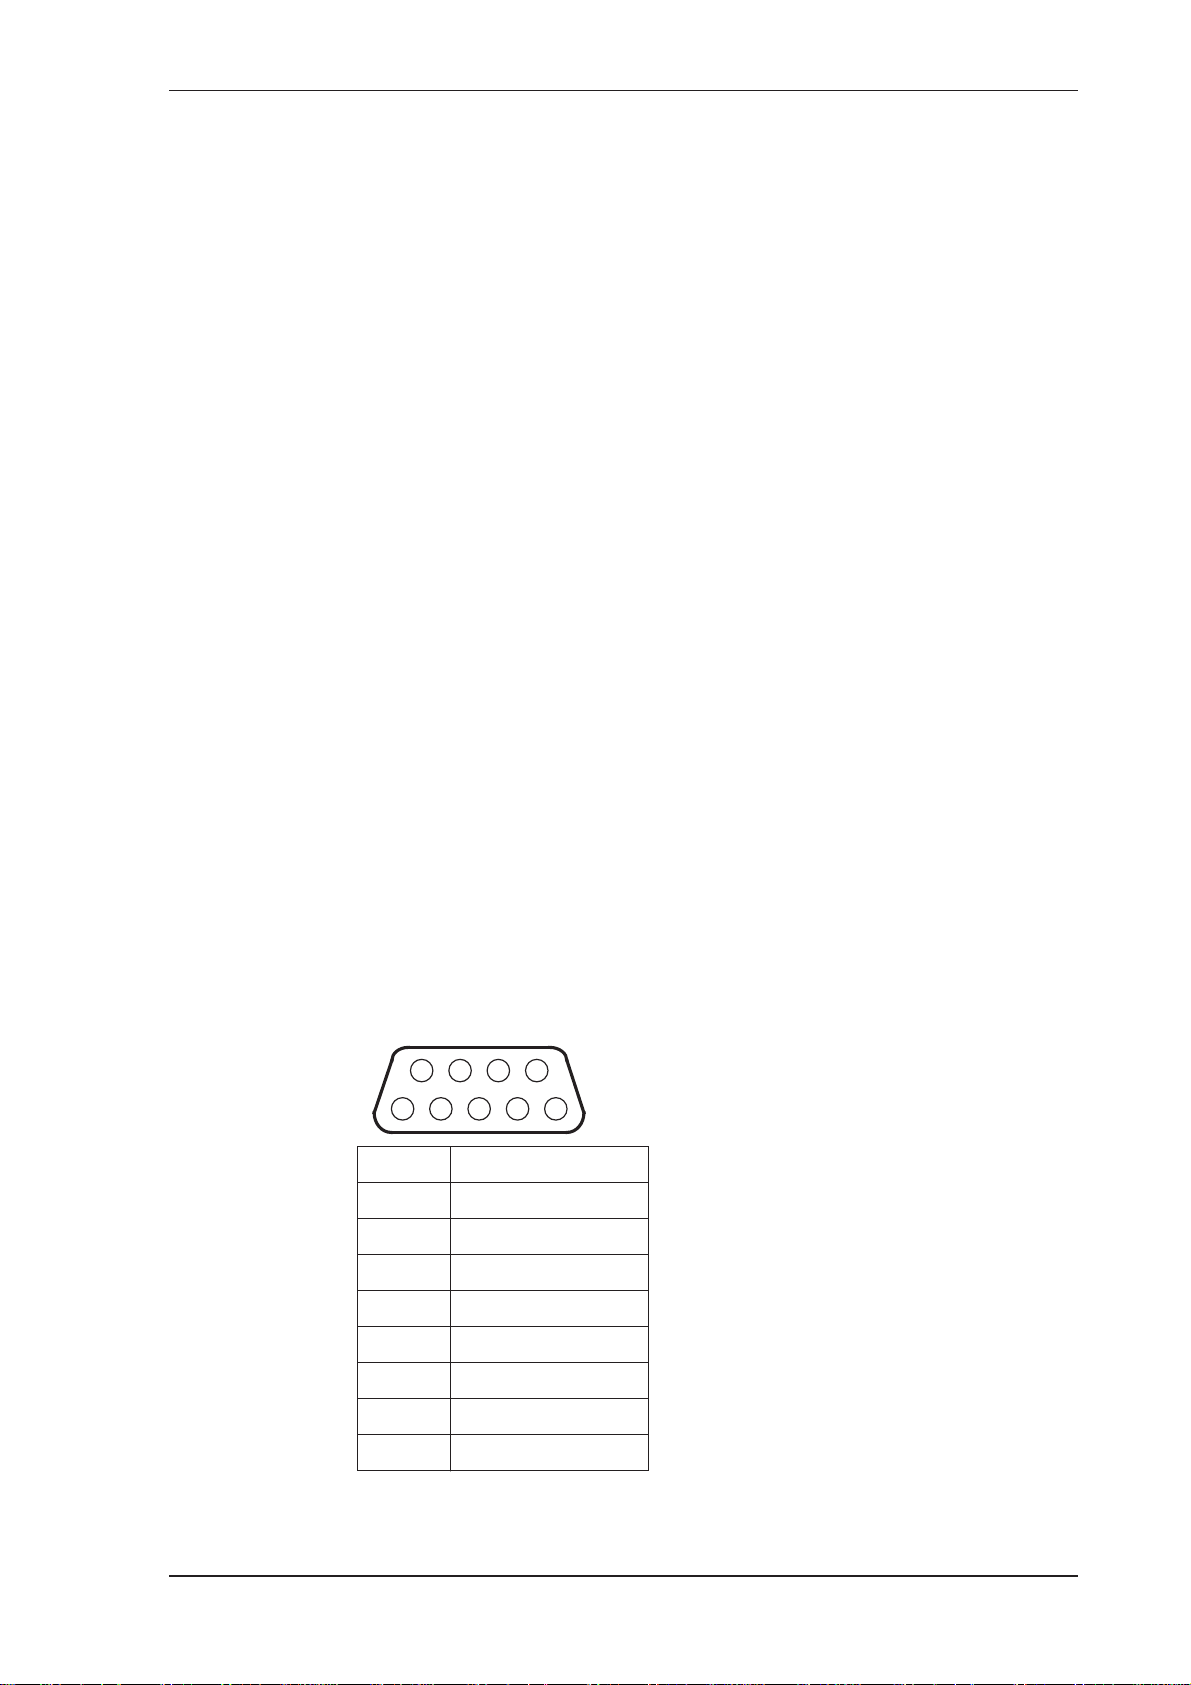
RS-232 Port
The RS-232 port has a 9-pin DB female connector and has the following
pinout:
6
12
Pin 1 Not used
Pin 2 Transmit (TxD)
Pin 3 Receive (RxD)
Pin 4 Not used
Pin 5 Ground
Pin 6 Not used
7
8
9
4
3
5
Pin 7 Handshake line (CTS)
Pin 8 RTS Out
Pin 9 Not used
515 DG01 - 18 June 2017 19
Page 28
Installation
Note: The instrument does not require a null-modem cable for connection
to a personal computer. Refer to Hardware Interconnection on
page 51 for cable termination requirements.
Infra-red Port
The infra-red port is located at the front panel, directly below the row of
status indicators. The main function of this port is for retrieving current or
logged data with a PC that has an infra-red port.
RS-485 Port (Optional)
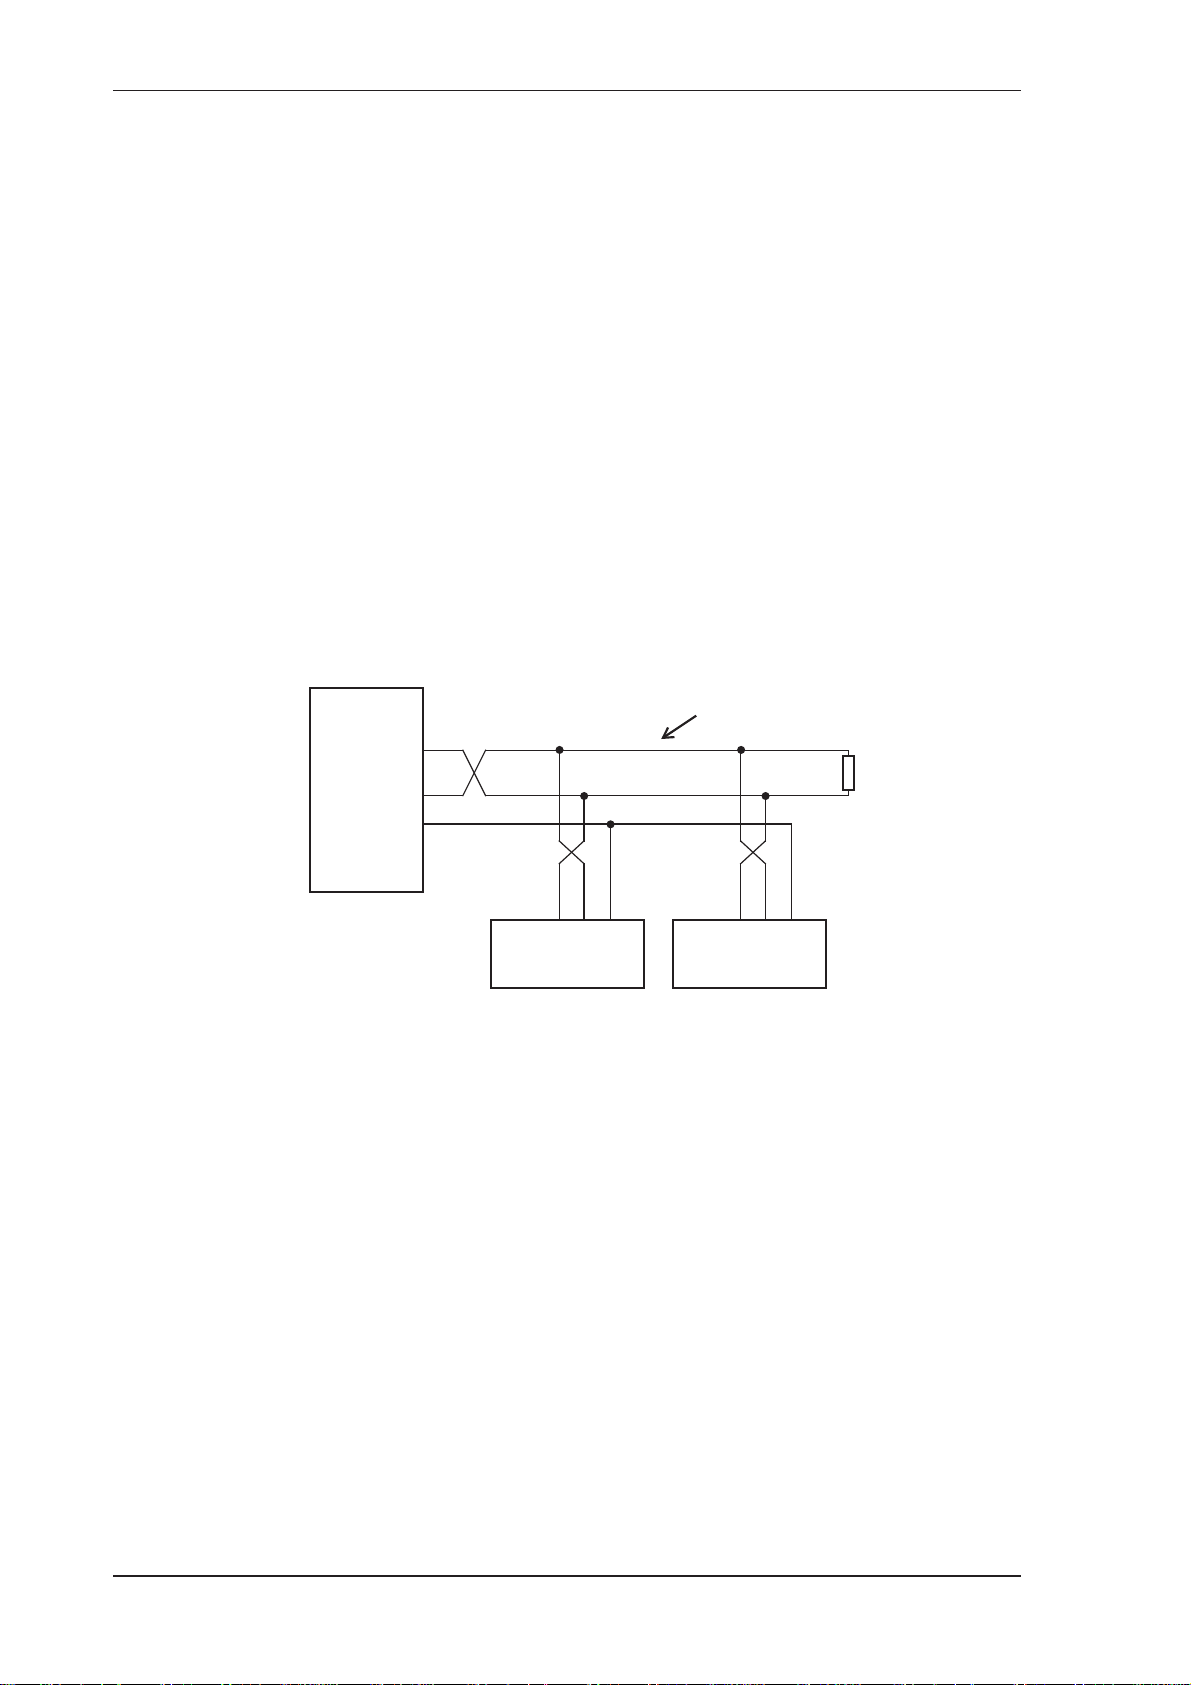
Up to 32 units can be connected to a common RS-485 bus. Each unit has a
unique address that the host computer uses to identify each instrument.
Figure 11 shows the connection of several instruments to a computer using
the RS-485 port.
Host
Computer
Comms
Gnd
Earthing and Shielding
It is a good practice to use shielded cable for all signal connections to the
instrument. Care must be taken to separate signal cables from power cables
to minimize interference.
Overall earth should be connected at the instrument end only. This
connection should be as short as possible and connected to the earthing
point on the rear terminal at pin 18.
Twisted Pair
+
-
Gnd Gnd
-+-
+
19 20 21
Instrument Instrument
19 20 21
Figure 11 RS-485 Interface Connections
Load
120 ohms
20 515 DG01 - 18 June 2017
Page 29

Chapter 4
Operation
Normal Operation
In normal operation mode, you press the buttons on the front panel to
display the values recorded and calculated by the instrument. There are
different categories of information that the instrument can display:
• Process variables
• Instrument settings
Default Variable
In some applications, one variable is of more interest than others, and for
this reason a default variable can be assigned during instrument calibration.
If the display timeout option is enabled and no buttons are pressed for the
selected period (usually 30 seconds) the display returns to the default
variable.
Status LEDs
The status LEDs illuminate to show the following conditions:
Run
Set
Alarm
Cal
Run The host computer is downloading the application software.
Set The instrument is in Calibrate Set mode.
Alarm The instrument has an error, as indicated on the display panel.
Cal The instrument is in Calibrate View mode.
Front Panel Keys
For most actions with the front panel keys, you can hold a key to scroll
through the values or options, instead of repeatedly pressing the key.
DISPLAY
Press the key to step or scroll through the main menu items.
DISPLAY
515 DG01 - 18 June 2017
21
Page 30
Operation
Main Menu Items
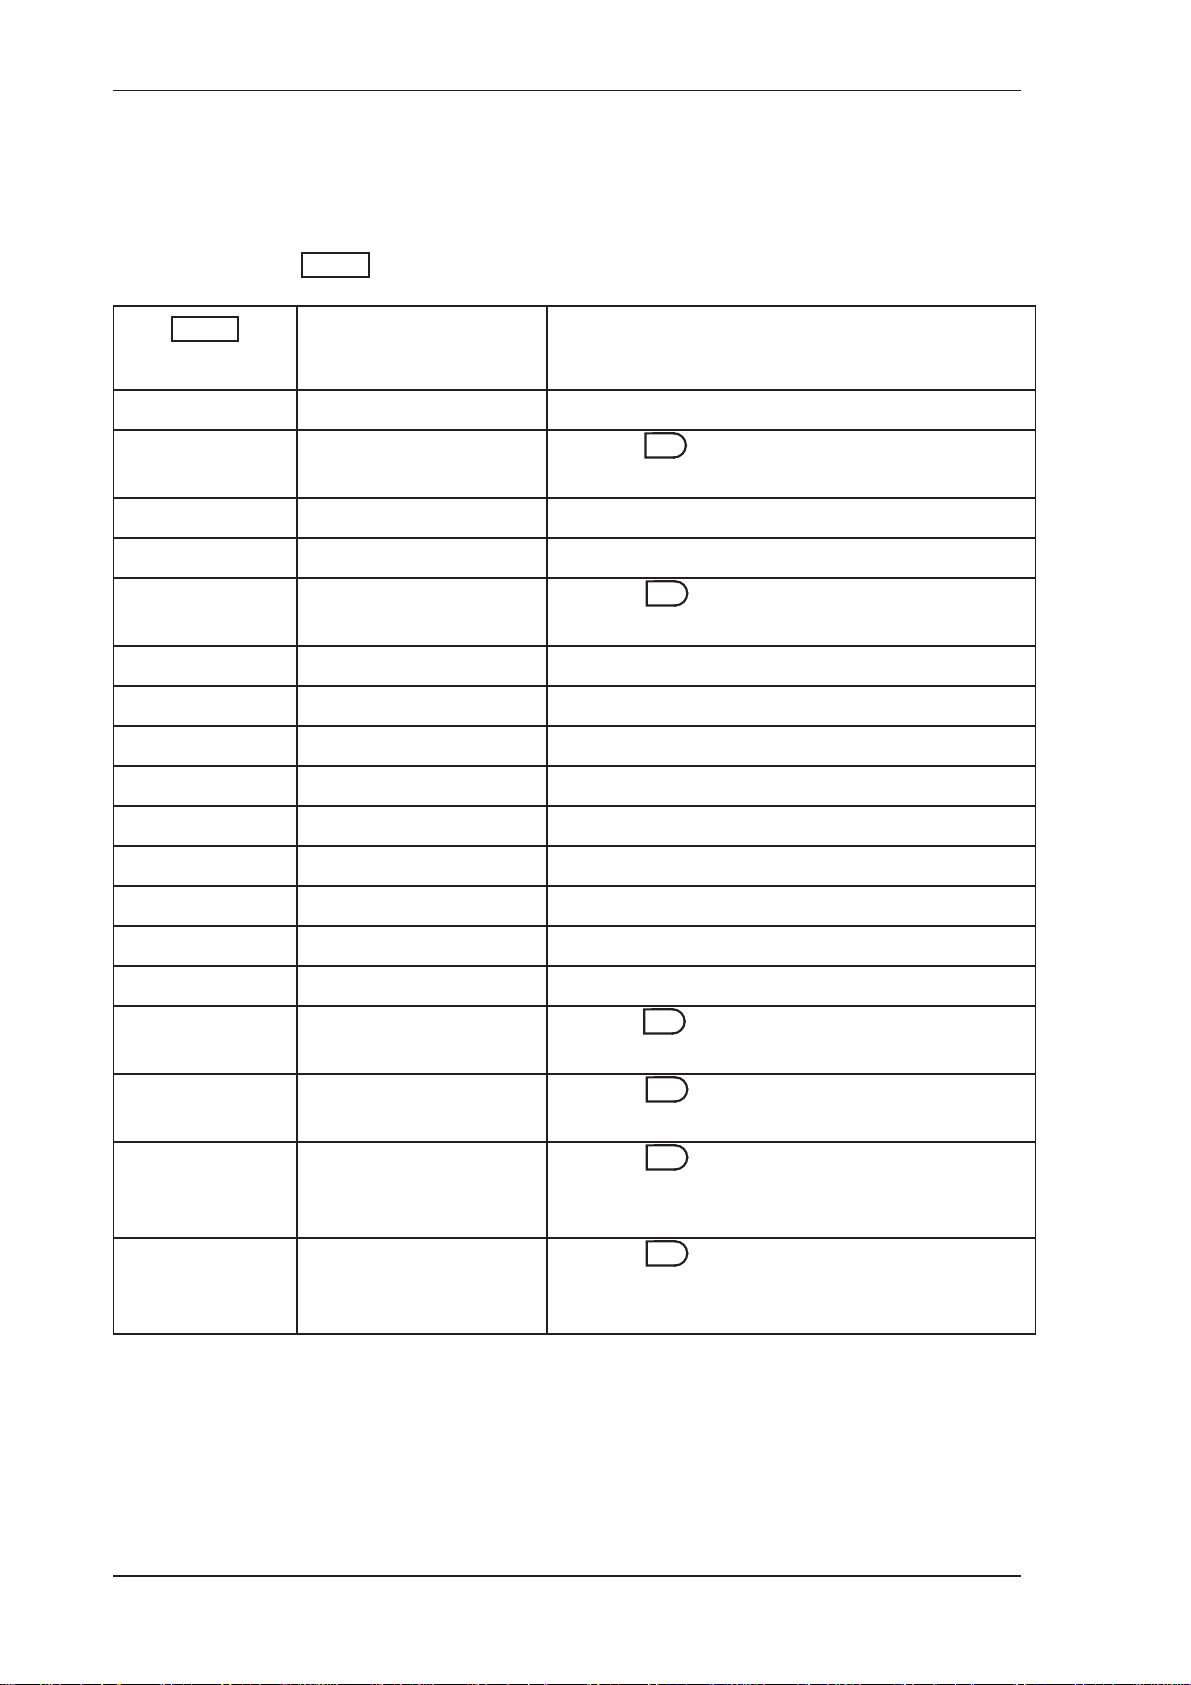
The main menu in this instrument consists of the following items. The
DISPLAY
key is used to step or scroll through the list.
DISPLAY
D-LINE
PERIOD
D-REF
TEMP
PRESS
SG
Z-LINE
Z-REF
MW
Tc
Pc
USER INPUT
Description Options
Density (Line)
Period Hold the key to display (or edit) the Default
SET
Period.
Density (Reference)
Temperature
Pressure Hold the key to view the absolute value if
SET
the type of pressure sensor is set to GAUGE.
Specific gravity
Z-Factor (Line)
Z-Factor (Reference)
Molecular weight
Critical temperature
Critical pressure
User input
USER OUT-A
USER OUT-B
REPORT PRINT
LOGGED DATA
MODEL INFO
CAL MENU
User output A
User output B
Only shown if print
option is selected
Only shown if real-time
clock option is installed
Hold the key to print log report as defined in
SET
the TM/LOG section of calibration.
Hold the key to display data logs as
SET
described in Data Logs on page 23.
Hold the key to display the Model
SET
information as described in Model Information
on page 25.
Hold the key to enter Calibration View
SET
mode as described in Calibration View Mode on
page 27.
22 515 DG01 - 18 June 2017
Page 31

Default Period
Operation
Data Logs
SET SET
Hold the key to display (or edit) the Default Period constant while
viewing the live period. The display of the Default Period will change from
view mode to edit mode after 2 seconds if access has been enabled in
calibration. Once in edit mode the Set indicator will illuminate and the value
is changed in exactly the same way as in calibration set mode. If testing is
required, then set the Default Period to non-zero value and the instrument
will use this value instead of the live pulse input.
The instrument will log the main-menu variables if real-time clock option is
installed. The logs are at fixed intervals of hours, days, weeks, months and
years. The instrument can store a total of more than 1000 log entries.
If the number of log entries exceeds the programmed number for a particular
time interval, the oldest log entry is overwritten by the newest one for that
time interval.
The log entries are recorded at the following times:
HOUR 00 minutes each hour
DAY 00 hours and 00 minutes each day
WEEK 00 hours and 00 minutes each Monday
MONTH 00 hours and 00 minutes on the first day of the month
YEAR 00 hours and 00 minutes on the first day of the year.
View Data Logs
Use the following procedure to view the data that has been logged by the
instrument:
1. Press the key to scroll through the menu to the LOGGED DATA
DISPLAY
prompt.
2. Hold the key.
SET
The system displays the hourly log. The timebase and number of the log
are shown, for example LH-001.
3. While holding the key use the key to print the data for the
DISPLAY
displayed log if the printer option has been selected.
515 DG01 - 18 June 2017 23
Page 32
Operation
The following example shows the hourly log number 006 at 15:00 (3:00 pm)
on 16 January 2016. The day and month alternate with the year in the
bottom right hand corner.
15-00
LH-006 16/01
15-00
LH-006 2016
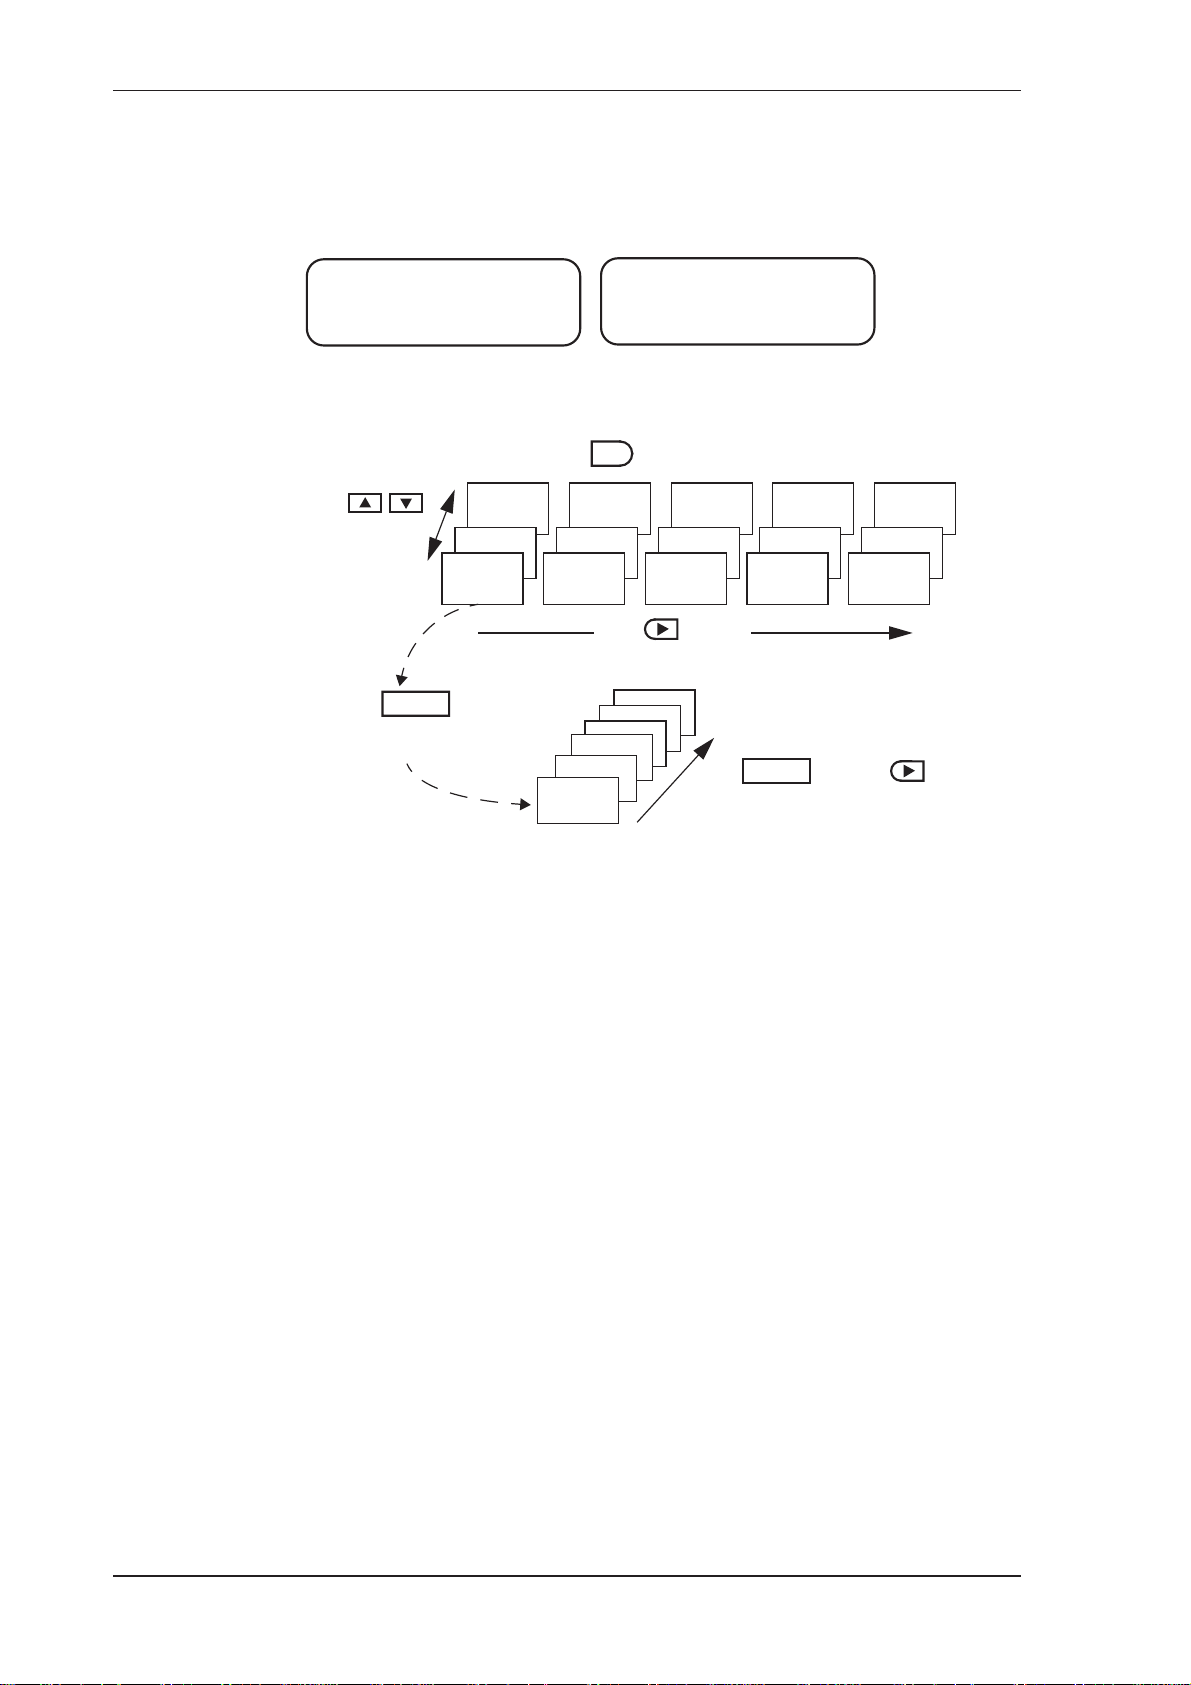
Figure 12 shows how to display the logged data.
SET
Press at any time to exit from the Data Logs
Press
to select the log
number
DISPLAY
Hold to
show the values for
a log entry
HOUR
LH-001
DAY
LD-001
…
Variable 2
Variable 1
Error code
Press to select
the time base
…
WEEK
LW-001
…
DISPLAY
Hold and press to
display the main menu variables
Figure 12 Logged Data Display Methods
MONTH
LM-001
LY-nnnLM-nnnLW-nnnLD-nnnLH-nnn
LY-002LM-002LW-002LD-002LH-002
YEAR
LY-001
24 515 DG01 - 18 June 2017
Page 33
Model Information
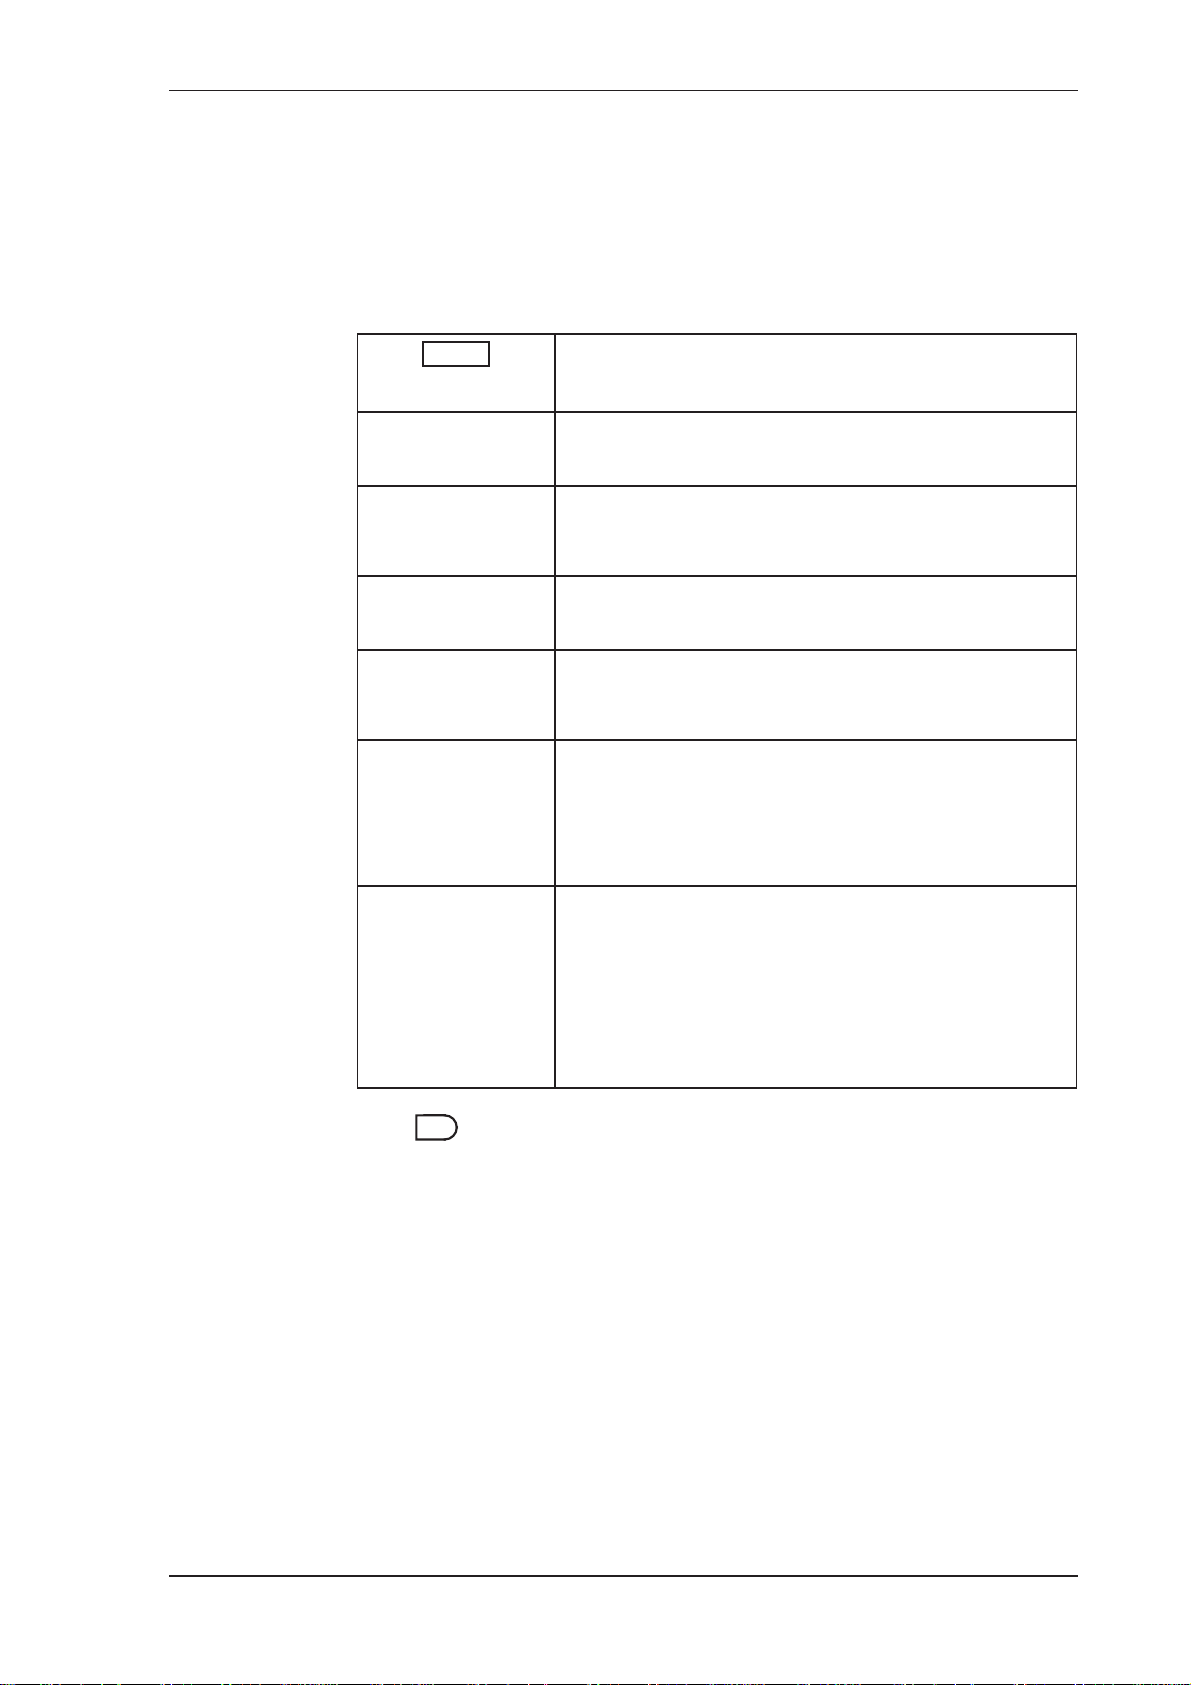
The model information items display the hardware, software and
application versions of the instrument. This information is mainly for
service personnel.
Operation
DISPLAY
2-1--S-
515 MODEL
d-tPU-
DG01 INPUT
3_0_000
500PM VERS
026357
CUSTOM VERS
123456
ABC123 S/N
16-15
EDITED 27/08
2016
Description
The hardware model code. Refer to Product Codes
on page 71 for more information.
The Application number and the assignment of the
inputs. Refer to Application Information Code on
page 72 for more information.
The version of 500-Series Program Manager from
which the application software was compiled.
The Customer version code for this installation. Refer
to Custom Version Codes on page 72 for more
information.
The instrument serial number and unit tag. The serial
number is on the top line and unit tag is on the bottom
left. Both items are entered when the instrument
application software is initially loaded. If the unit tag
is not used the default tag,
The time and date when the calibration of the
instrument was last edited. The format of the time and
date is the same as for the data logs. This example
shows 16:15 (4:15pm) on the 27th August 2016.
UNIT, will be used.
This function is available only if the instrument has
the real time clock option.
Press at any time to exit from the Model information.
515 DG01 - 18 June 2017 25
SET
Page 34

Operation
26 515 DG01 - 18 June 2017
Page 35
Chapter 5
Instrument Calibration
Introduction
You can view or change the settings of the instrument according to the
access level for each parameter as set by the manufacturer. There are four
levels of access to the parameters as follows:
• Not visible - you cannot display or edit the parameter.
• Display Only - you can display the parameter, but you cannot change the
setting.
• Programmable - you can change the setting of the parameter in
Calibration Set mode.
• Password protected - you can change the setting of the parameter in
Calibration Set mode only if you enter the correct password.
Note: When you enter Calibration Set mode, the instrument requests you to
enter a password. Any value will allow to change the settings of the
“programmable” parameters, but the correct password must be
entered to change the password-protected parameters.
Calibration View Mode
Use the following procedure to view the calibration settings of the
instrument:
DISPLAY
SET
SET
DISPLAY
Run
Set
Alarm
Cal
1. Press to scroll to the CAL MENU prompt.
2. Hold the key.
The instrument beeps once, illuminates the Cal indicator and shows CAL
on the display panel.
• Press to scroll through the flashing menu headings.
• Press to scroll through submenu items.
• Press to return to the main calibration menu.
3. To exit from the Calibration View mode, press to scroll to the END
option and press .
The instrument returns to Normal Operation mode.
SET
515 DG01 - 18 June 2017
27
Page 36
Instrument Calibration
Calibration Set Mode
In Calibration Set mode, you can change the settings of the “programmable”
parameters. You must enter the system password to change the setting of the
“password-protected” parameters.
Use the following procedure to enter Calibration Set mode:
Run
Set
Alarm
Cal
Run
Set
Alarm
Cal
1. Press to scroll to the CAL MENU prompt.
2. Hold the key.
DISPLAY
SET
The instrument beeps once, illuminates the Cal indicator and shows CAL
on the display panel.
3. Press to select any flashing menu heading except END.
4. Hold for two seconds.
SET
The instrument requests a password.
5. Press or to change the value of the current digit. To select the
next digit, press .
6. Press to accept the password.
SET
• The instrument makes two beeps for a correct password entry and
enables you to change the “programmable” and “password-protected”
parameters.
• The instrument makes one beep for an incorrect password entry and
enables you to change only the “programmable” parameters.
The instrument illuminates both the Cal and Set indicators.
7. Edit the instrument parameters as required. The programmable values
are indicated by the flashing display.
• To change a numerical value, press to increase a value, or press
to decrease a value. Press a key momentarily to change the value
one number at a time. Hold a key to scroll through the numbers. To
proceed to next digit, press .
• To change an option setting, press or to scroll through the
options.
8. Press to accept the currently displayed value and proceed to the next
parameter. You can press to return to the main calibration menu.
9. To exit from Calibrate Set mode, press to scroll through the main
calibration menu to END, then press . Otherwise, from any menu,
Run
Set
Alarm
Cal
28 515 DG01 - 18 June 2017
you can press and hold for two seconds.
The instrument makes two beeps and cancels the Cal and Set indicators.
SET
DISPLAY
SET
SET
Page 37
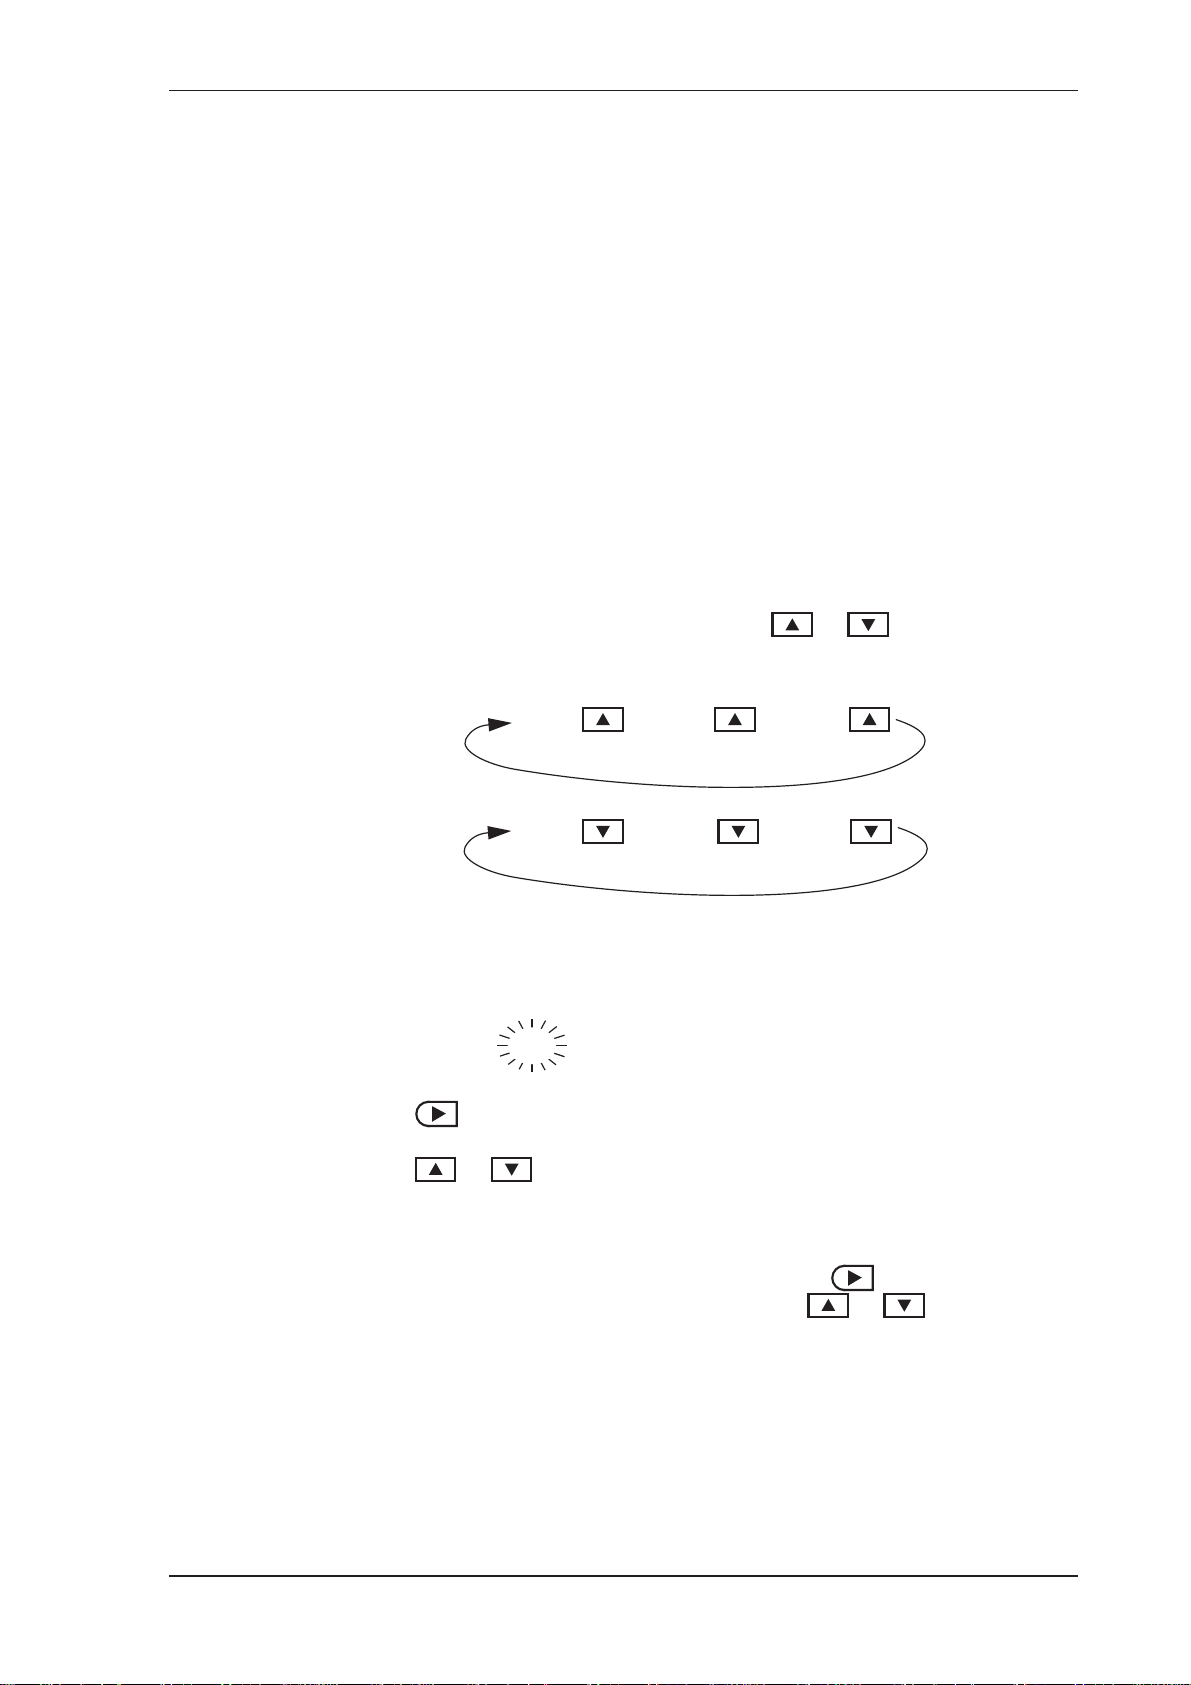
Changing the Instrument Settings
In Calibration Set mode, the display flashes the item that can be changed.
For option settings, the display flashes the complete option. For a numeric
parameter, the display flashes one digit at a time, you can change the value
of the flashing digit as required, then move the flashing cursor to change
another digit.
Note: When you change the setting of a parameter, the instrument records
the result as soon as you move to another parameter, or exit from the
Calibration Set mode.
Changing Option Settings
When you display an option that can be changed, the entire option flashes
on the display, such as the choices of ODD, EVEN or NONE for the
communications parity bit checking. Press or to change the
option. You can “scroll” through the options in either direction to make a
selection as shown below.
Instrument Calibration
ODD EVEN NONE
ODD NONE EVEN
Changing Numeric Settings
The display flashes the digit that can be changed.
6789.123
Press to select the digit that you wish to change.
Press or to increase or decrease the value of the selected digit.
Changing the Decimal Point
To change the position of the decimal point, press to move the flashing
selection until the decimal point flashes. Press or to move the
decimal point to the right or left as required.
Units of Measurement
The calibration of some parameters is based on the units that are defined for
the relevant variables. These units of measurement can been viewed in the
UNITS menu in calibration below.
515 DG01 - 18 June 2017 29
Page 38
Instrument Calibration
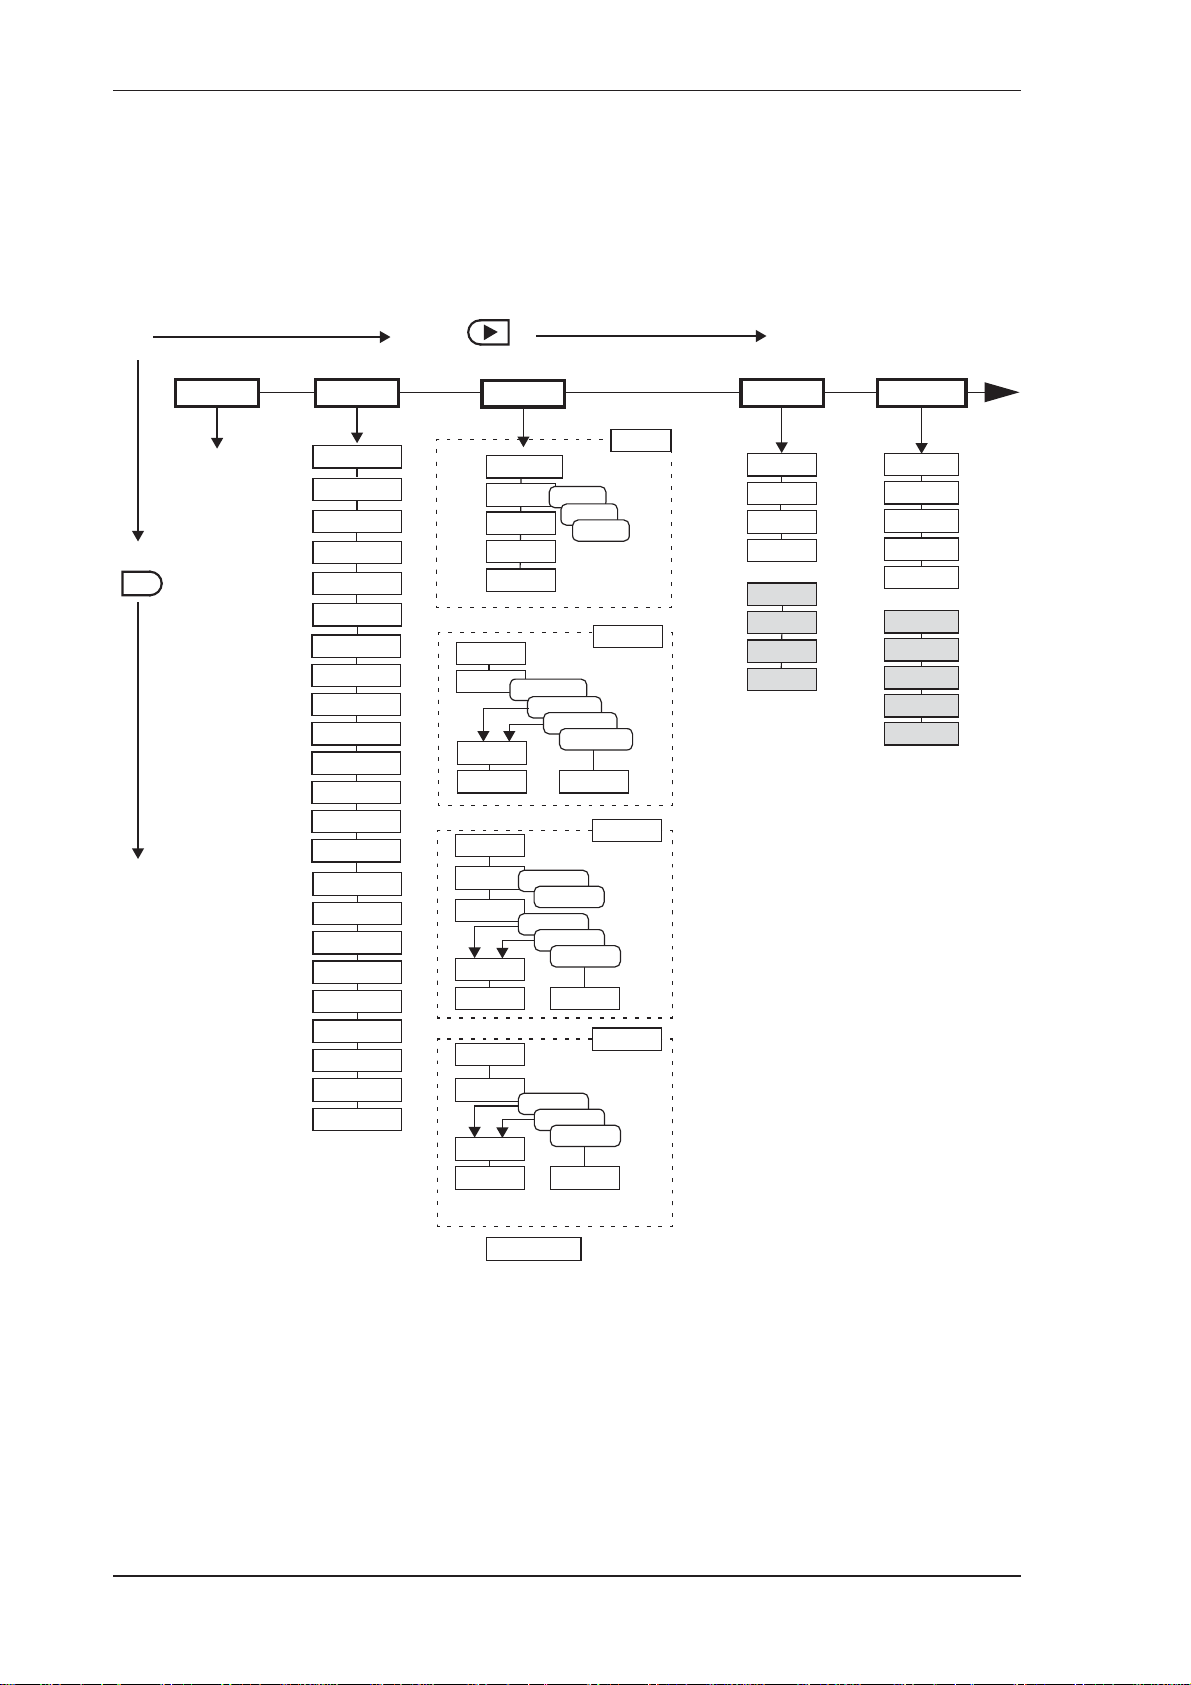
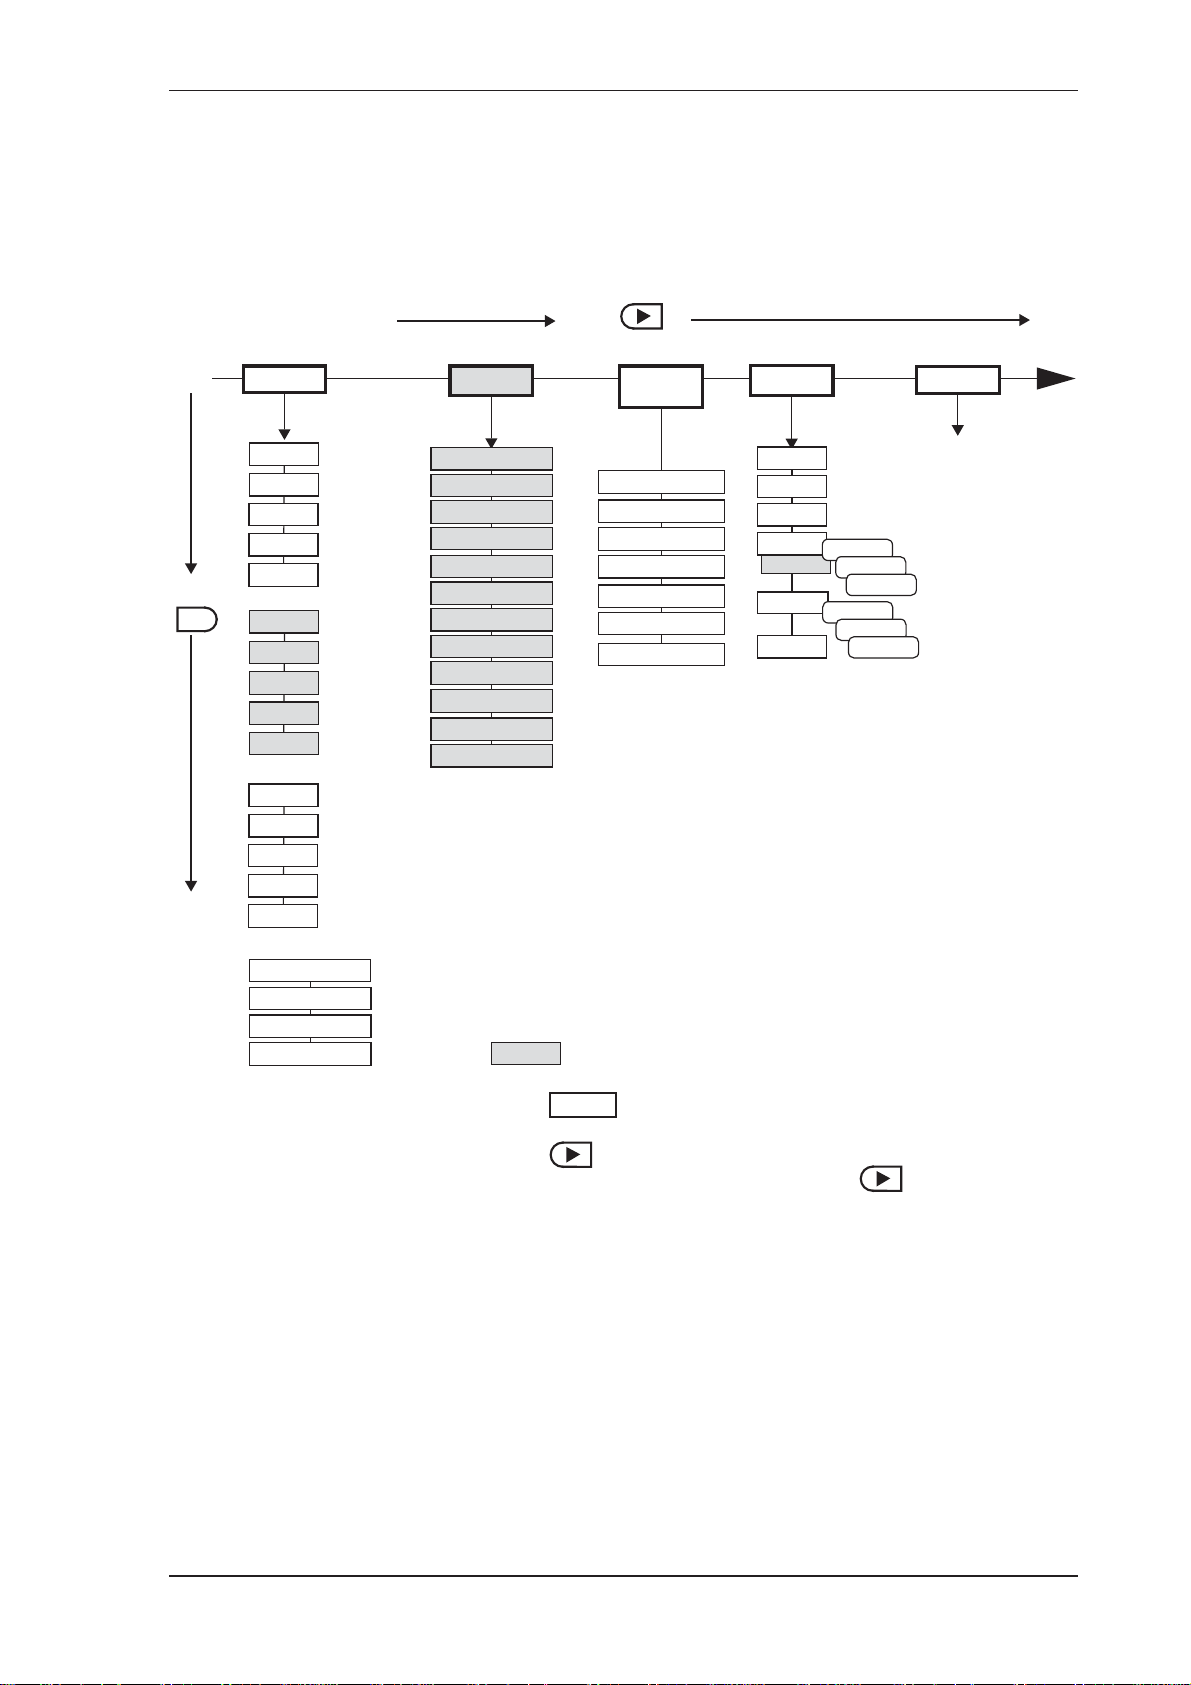
Calibration Menu Tree
Figure 13 and Figure 14 show the keys for moving around the calibration
menu tree in Calibration View or Set mode.
Press
PARAMS
DFLT PERIOD
ATM-PR
T-REF
P-REF
CALC TYPE
DCF
D-OFF
INP-X
INP-Y
K
D0
T0
TEMPCO
PRESCO
VIBDIM
ISENTR
Tc_0
Tc_A
Tc_B
Pc_0
Pc_A
Pc_B
ACENTR
TEMP
TYPE
PT-MIN
PT-MAX PT-DEF
PRESS
PRESS
TYPE
PT-MIN
PT-MAX PT-DEF
USER
TYPE
PT-MIN
PT-MAX PT-DEF
Press
SET
UNITS
View/Edit
units of
measurement
INPUTS
PERIOD
SIGNAL
DBNCE
CUTOFF
FILTER
PT100/500
ABSOL
4-20
4-20
PULSE
4-20
0-5 /1-5V
GAUGE
0-5 /1-5V
DEFAULT
0-5 /1-5V
DEFAULT
NPS
COIL
AINP1
DEFAULT
AINP2
AINP3
PINP1
Continued on next page
OUTPUT
OUT1
selection
PT-MIN
PT-MAX
OUT2
selection
PT-MIN
PT-MAX
ALARMS
ALRM1/2
selection
TYPE
POINT
HYST
ALRM3/4
selection
TYPE
POINT
HYST
EXCEPT VALUE
Figure 13 Calibration Menu Tree Sheet 1
30 515 DG01 - 18 June 2017
Page 39
Instrument Calibration
From previous page
COMMS
RS232
PROTOC
BAUD
PARITY
S-BITS
Press
SET
RS485
PROTOC
BAUD
PARITY
S-BITS
INFRA
PROTOC
BAUD
PARITY
S-BITS
DATE FORM
CLOCK YEAR
CLOCK M-DAY
CLOCK H-MIN
HOUR LOGS
DAY LOGS
WEEK LOGS
MONTH LOGS
YEAR LOGS
RESET LOGS
REPORT TYPE
PRN TYPE
TM/LOG
Press
DEFAULT VAR
SUPPLY VOLT
T-OUT MODE
T-OUT SEC
DISPL TAGS
BACK-L T-OUT
DOCKET RESET
SETUP
TEST
FINP1
AINP1/4
LINP1/4
OUT1
OUT2
REL/ALRM
SUPPLY
PROCESS
HI
LO
PROCESS
OPEN
CLOSED
END
Exit from
calibration
mode
RTU DATA
RTU ADDR
ASCII ADDR
FLASH PORT
The shaded boxes indicate advanced options
DISPLAY
Press at any point to return to the main calibration menu.
Press at any I/O assignment position to move to the next I/O
assignment in the submenu (eg pressing on ALRM1 will
move you to ALRM2)
Figure 14 Calibration Menu Tree Sheet 2
515 DG01 - 18 June 2017 31
Page 40
Instrument Calibration
Instrument Settings
Units of Measurement
The Units menu allows the units to be viewed and edited if necessary
without the reloading of new application software. Any change in units will
result in a full reset to initially downloaded settings. Therefore, any required
changes to units of measurement should be made before changing any other
settings.
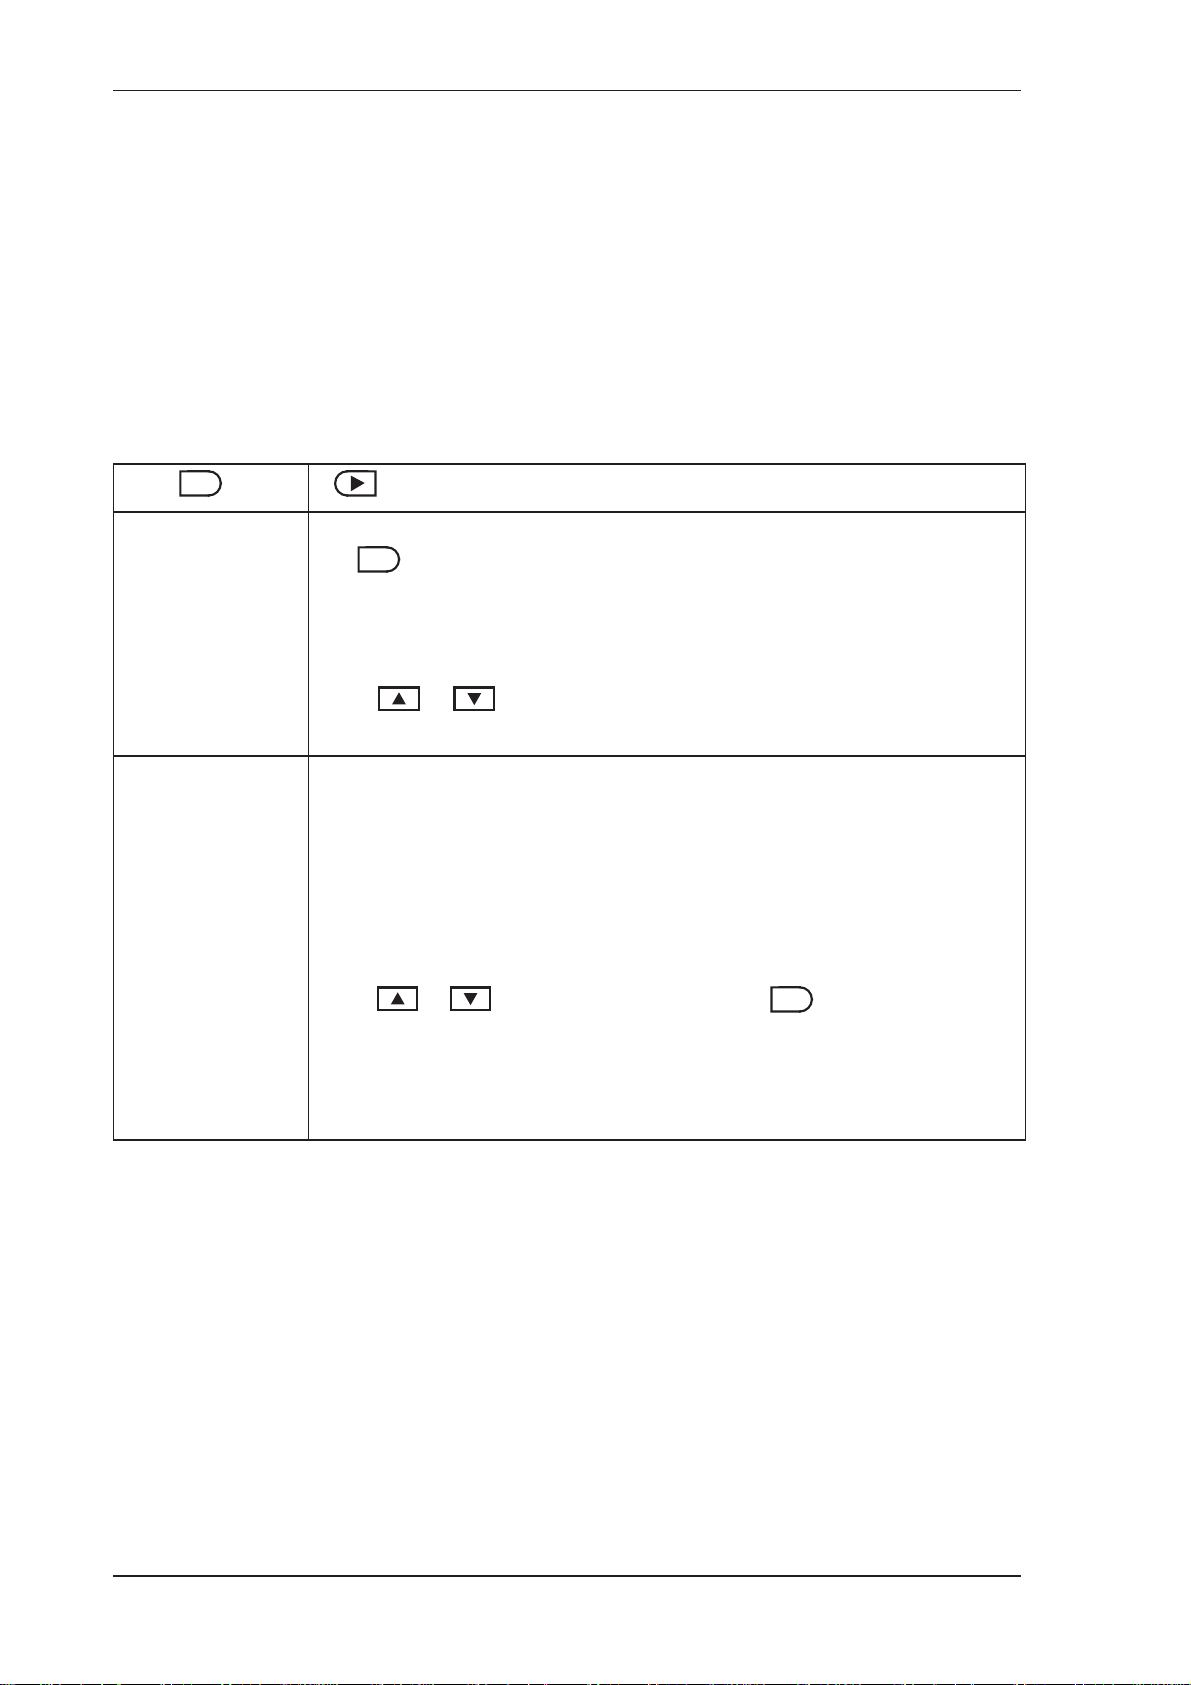
SET
ITEM n unit
ACCEPT UNITS
UNITS PARAMS INPUTS OUTPUTS ALARMS COMMS TM/LOG SETUP TEST END
The units for main menu or calibration items can be viewed by pressing
SET
the key.
The units of measurement are password protected. To edit the units the
correct password must be entered on entry to EDIT mode.
Press or to select the required units. Refer to Available Units
of Measurement on page 74 for the list of available units.
The Accept Units prompt will only appear if one or more of the units
have been changed.
IMPORTANT: Accepting the change of units will initiate a master
reset. All calibration parameters will revert to their default value (i.e.
those values included in the downloaded instrument software). All totals
and any logged information will be cleared.
Press or to select YES, then press the key. The instrument
makes three beeps to confirm the reset command.
SET
The message -RESET- PLEASE WAIT will be displayed as the
instrument exits calibration mode and completes a full re-boot sequence.
32 515 DG01 - 18 June 2017
Page 41
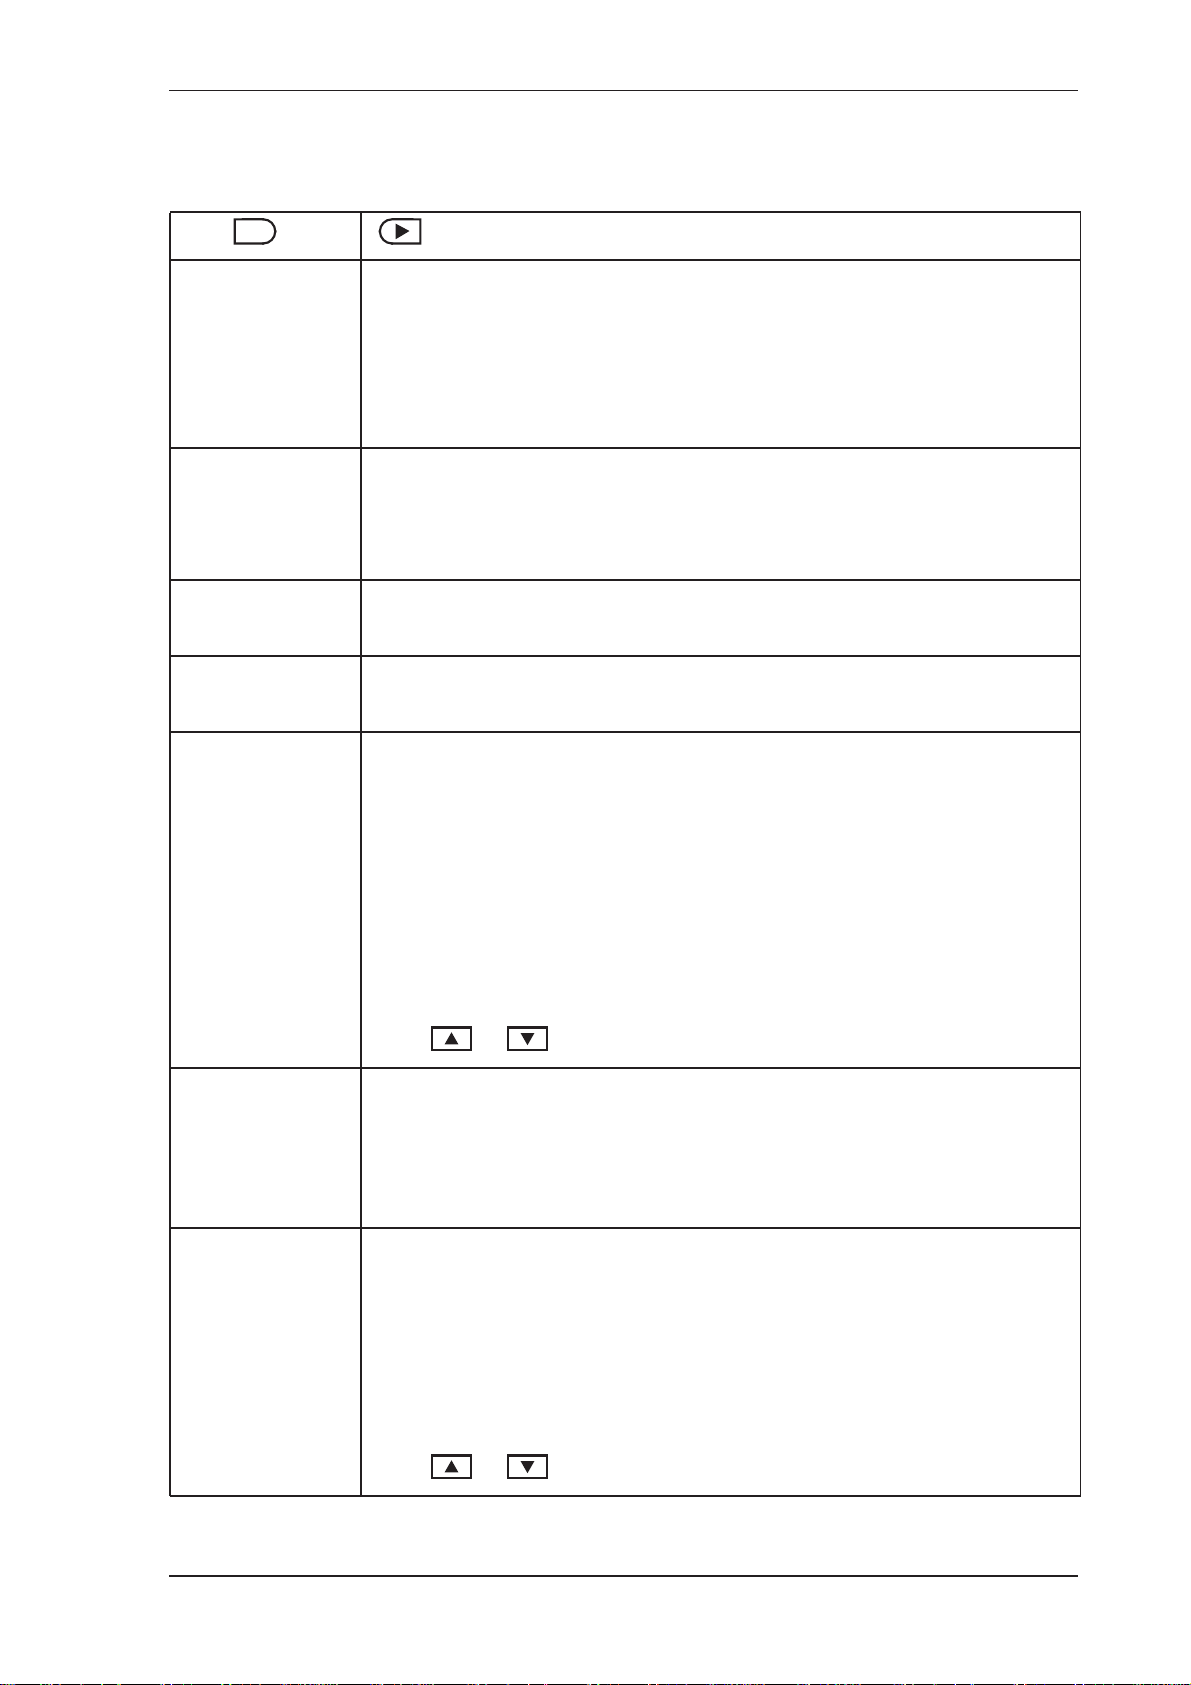
Parameters
SET
UNITS PARAMS INPUTS OUTPUTS ALARMS COMMS TM/LOG SETUP TEST END
Instrument Calibration
DEFLT unit
ATM-PR unit
T-REF unit
P-REF unit
CALC TYPE
You can set this Default Period parameter to non-zero value for testing
purposes (the instrument uses the Default Period value instead of the live
pulse input when the Default Period is not equal to 0).
You can also easily access the Default Period from the main menu by
pressing and holding the SET key when displaying live period.
If the pressure sensor is configured as a Gauge type sensor, the instrument
adds the atmospheric pressure to the measured pressure to determine the
absolute pressure. Set the atmospheric pressure (absolute) according to
the height above sea level. The commonly used value is 101.325 kPAA.
Enter the reference (base) temperature for the calculation of corrected
density. The commonly used values are 15 deg C or 60 deg F.
Enter the reference (base) absolute pressure for the calculation of the
corrected density. The commonly used value is 101.325 kPAA.
Select the type of calculations (Equations of State) to suit the conditions
and nature of the gas:
• IDEAL - Ideal Gas
• REDLICH - Redlich-Kwong (1949)
DCF unit
D-OFF unit
VAR INP-X
INP-Y
• SOAVE - Soave-Redlich-Kwong (1972)
• PENG - Peng-Robinson (1976)
For more details on each calculation type refer to Calculations on page 2
Press or to select the calculation type as required.
Enter the density correction factor and the density offset. These
parameters allow the user to adjust line density by the use of a multiplier
and a fixed offset:
Used Density = Line Density * DCF + Doff
Select a main menu variable to assign as the Input X (Y) to the pre-
programmed User Defined Function look-up table.
Note: The User Defined Function look-up table is constructed and
downloaded from the 500 Series Program Manager as part of the
embedded software. The table provides two outputs OUT-A and
OUT-B as main menu variables.
Press or to select the variable as required.
515 DG01 - 18 June 2017 33
Page 42
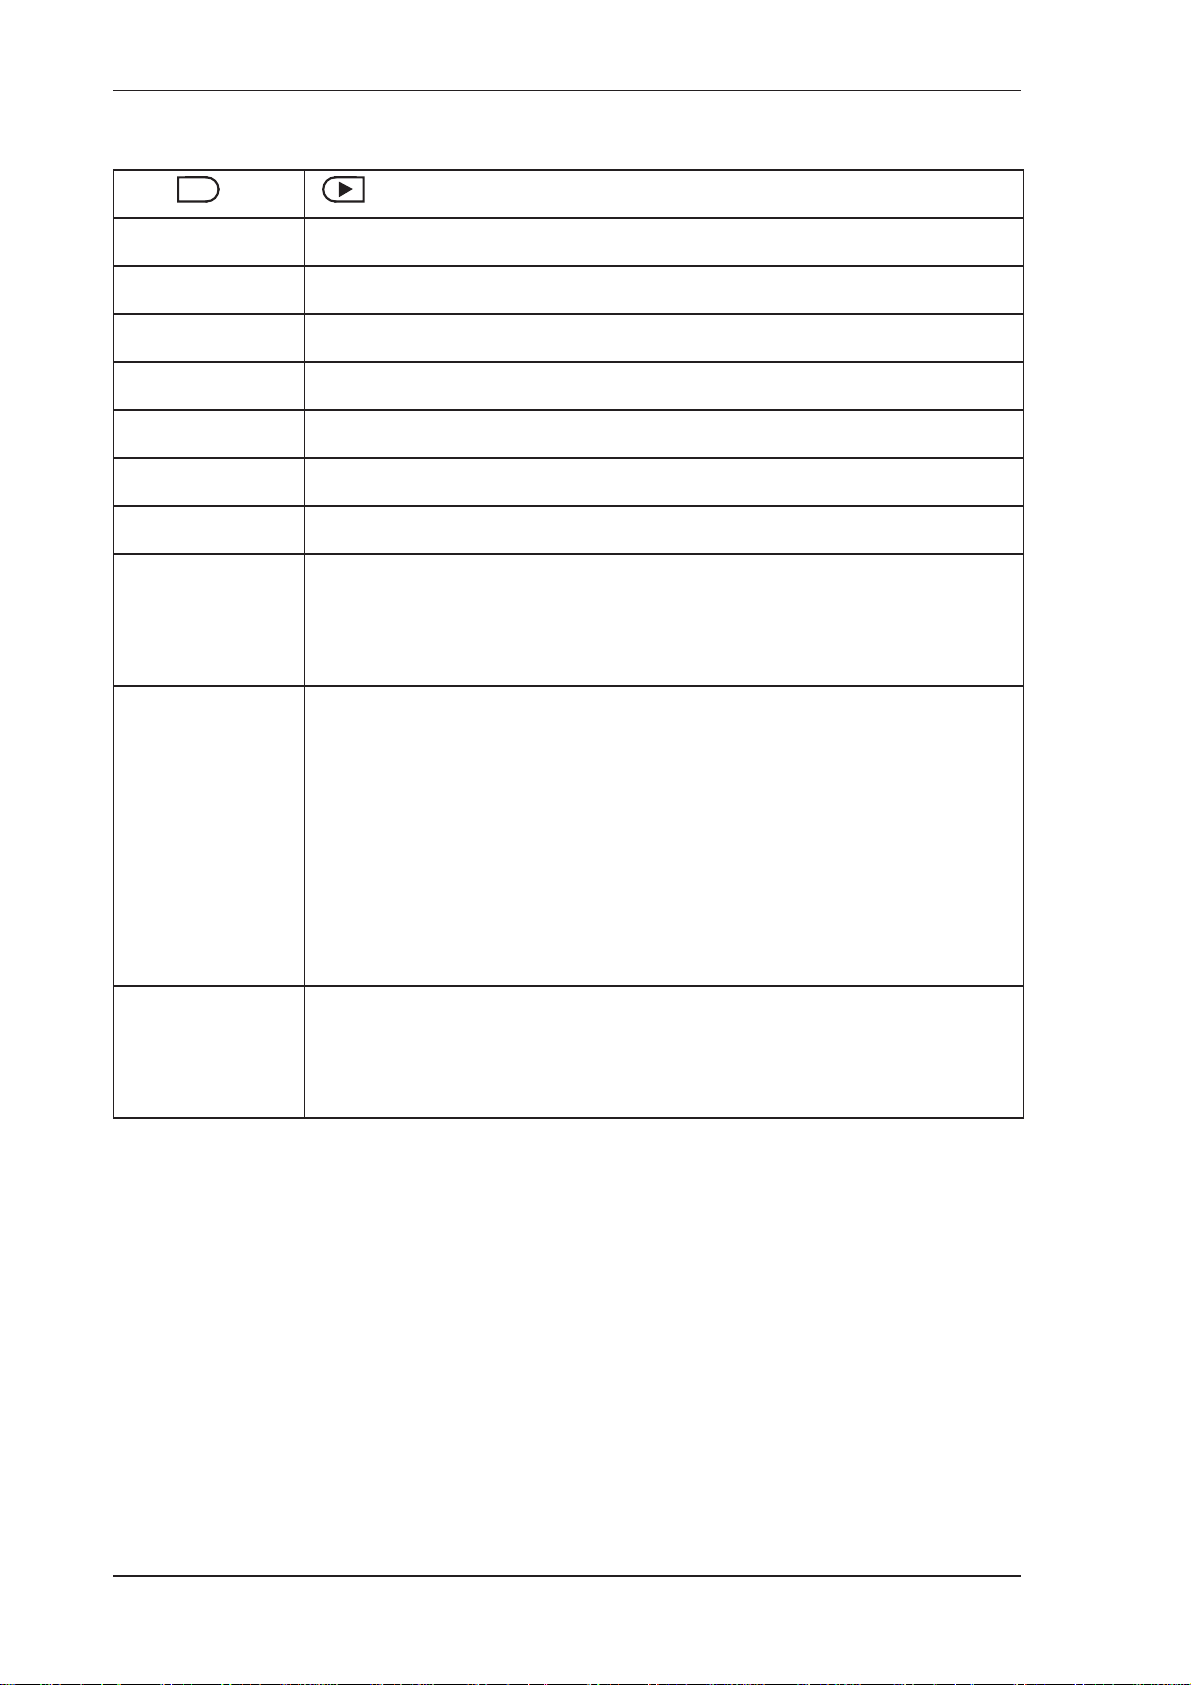
Instrument Calibration
SET
UNITS PARAMS INPUTS OUTPUTS ALARMS COMMS TM/LOG SETUP TEST END
K unit
D0 unit
T0 unit
TEMPCO unit
PRESCO unit
VIBDIM unit
ISENTR EXP
Tc_0 unit
Tc_A unit
Tc_B
Enter the density meter calibration factor.
Enter the density meter calibration constant (density).
Enter the density meter calibration constant (period).
Enter the density meter temperature coefficient.
Enter the density meter pressure coefficient.
Enter the density meter vibration element dimension.
Enter the isentropic exponent of the gas required for density calculations.
This parameter is applicable when the Calculation Type is not Ideal Gas.
Enter the base critical temperature of the gas. Some sample values are
shown in Properties of Selected Gases on page 75.
This parameter is applicable when the Calculation Type is not Ideal Gas.
Enter the critical temperature approximation coefficients (derived from
the gas properties). The critical temperature will be calculated as the
function of Specific Gravity (SG):
Pc_0 unit
Tc = Tc_0 * (1 + Tc_A * SG + Tc_B * SG * SG)
This may allow for better approximation of the critical gas parameters.
Set these coefficients to zero if no SG approximation is required.
This parameter is applicable when the Calculation Type is not Ideal Gas.
Enter the base critical pressure of the gas. Some sample values are shown
in Properties of Selected Gases on page 75.
34 515 DG01 - 18 June 2017
Page 43
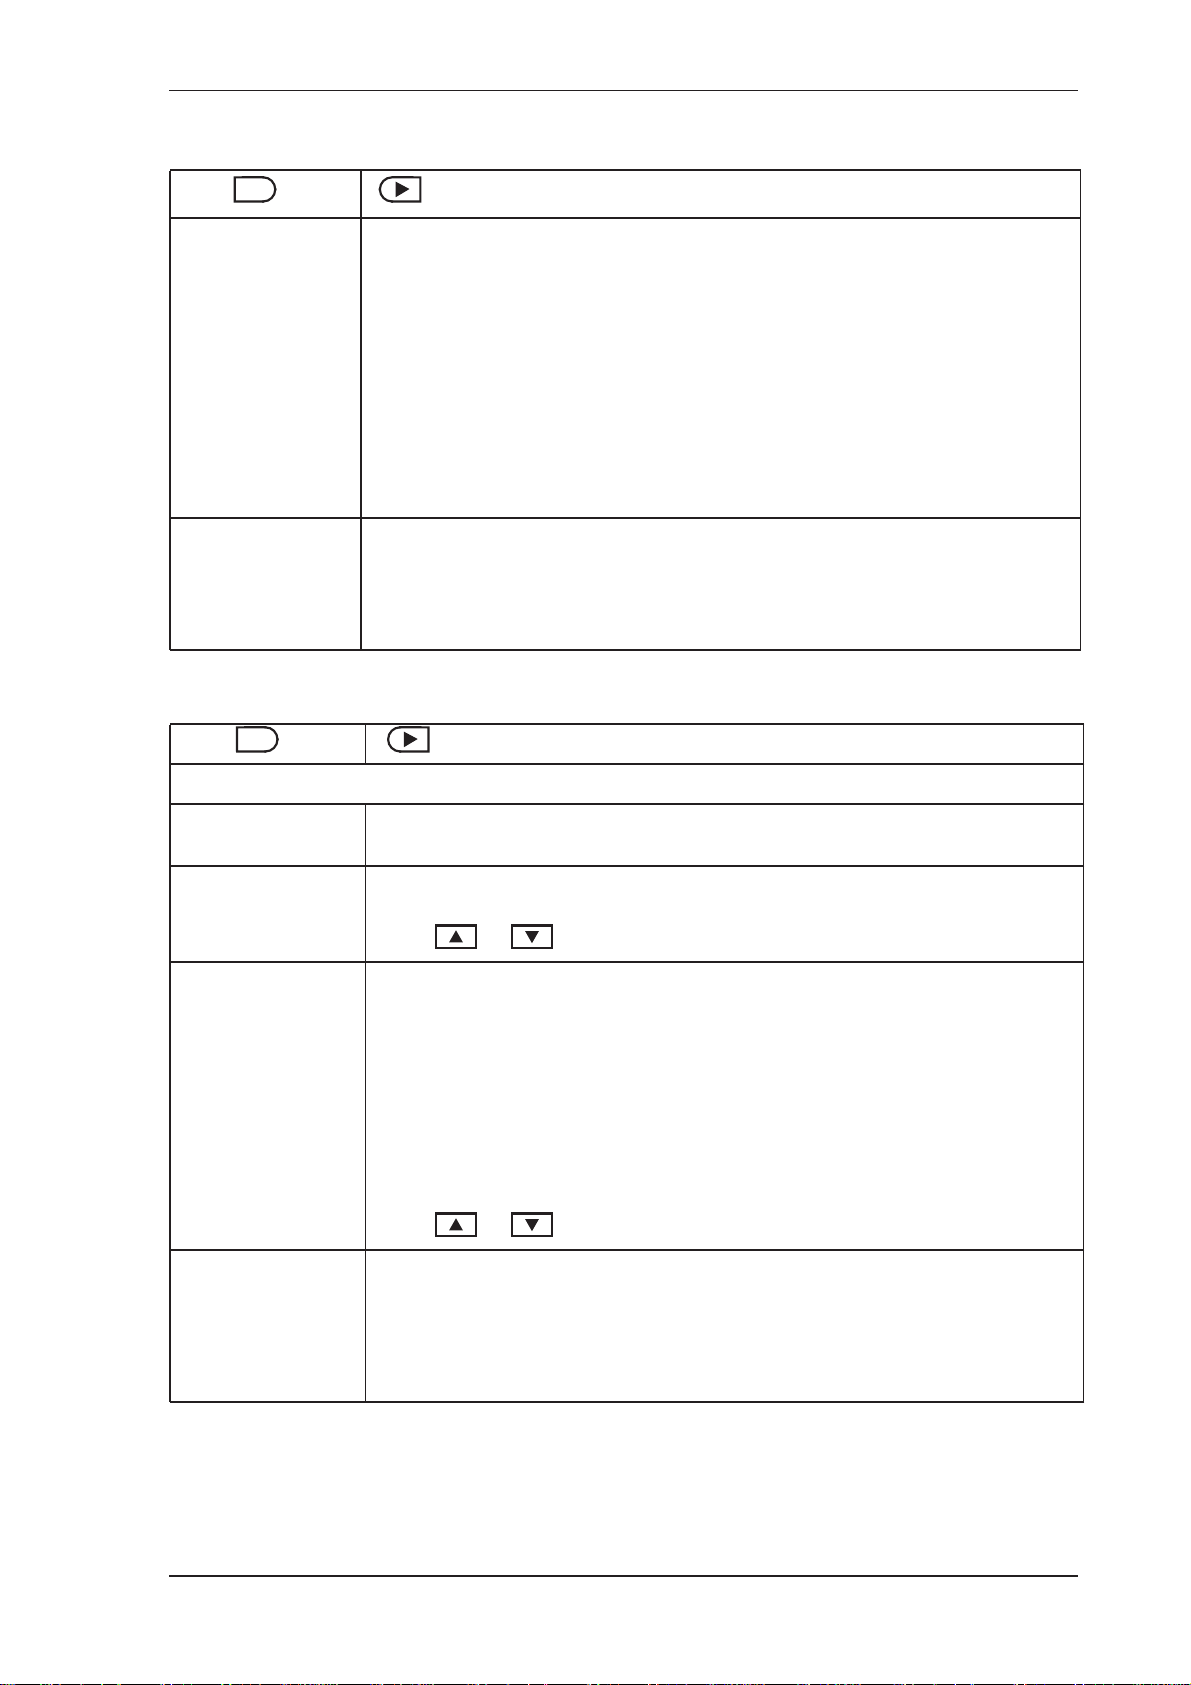
Instrument Calibration
SET
UNITS PARAMS INPUTS OUTPUTS ALARMS COMMS TM/LOG SETUP TEST END
Pc_A unit
Pc_B
ACENTR FACT
Inputs
SET
UNITS PARAMS INPUTS OUTPUTS ALARMS COMMS TM/LOG SETUP TEST END
Pulse Input 1
This parameter is applicable when the Calculation Type is not Ideal Gas.
Enter the critical pressure approximation coefficients (derived from the
gas properties). The critical pressure will be calculated as the function of
Specific Gravity (SG):
Pc = Pc_0 * (1 + Pc_A * SG + Pc_B * SG * SG)
This may allow for better approximation of the critical gas parameters.
Set these coefficients to zero if no SG approximation is required.
This parameter is applicable when the Calculation Type is SoaveRedlich-Kwong or Peng-Robinson.
Enter the acentric factor of the gas.
INPUT
PERIOD PINP1
SIGNAL PINP1
DBNCE PINP1
CUTOFF PINP1
For this application, the Pulse Input 1 is assigned to period.
Pulse Input 1 signal type.
Press or to select COIL, NPS or PULSE.
Switches and relays have metal contacts to make and break circuits. The
contact bounce introduces random signals into the circuit. The instrument
has a debounce circuit to eliminate this problem.
Note: When the debounce circuit is enabled, the maximum input
frequency for large amplitude signals is limited to approximately
500 Hz. For low amplitude signals, the maximum frequency can be
approximately 200 Hz.
Press or to select ENABLE or DISABLE.
The Cut-off is the lowest pulse frequency for which the instrument
continues density calculations.
The value for the cut-off is specified as the frequency of the pulse
densitometer in Hertz.
515 DG01 - 18 June 2017 35
Page 44
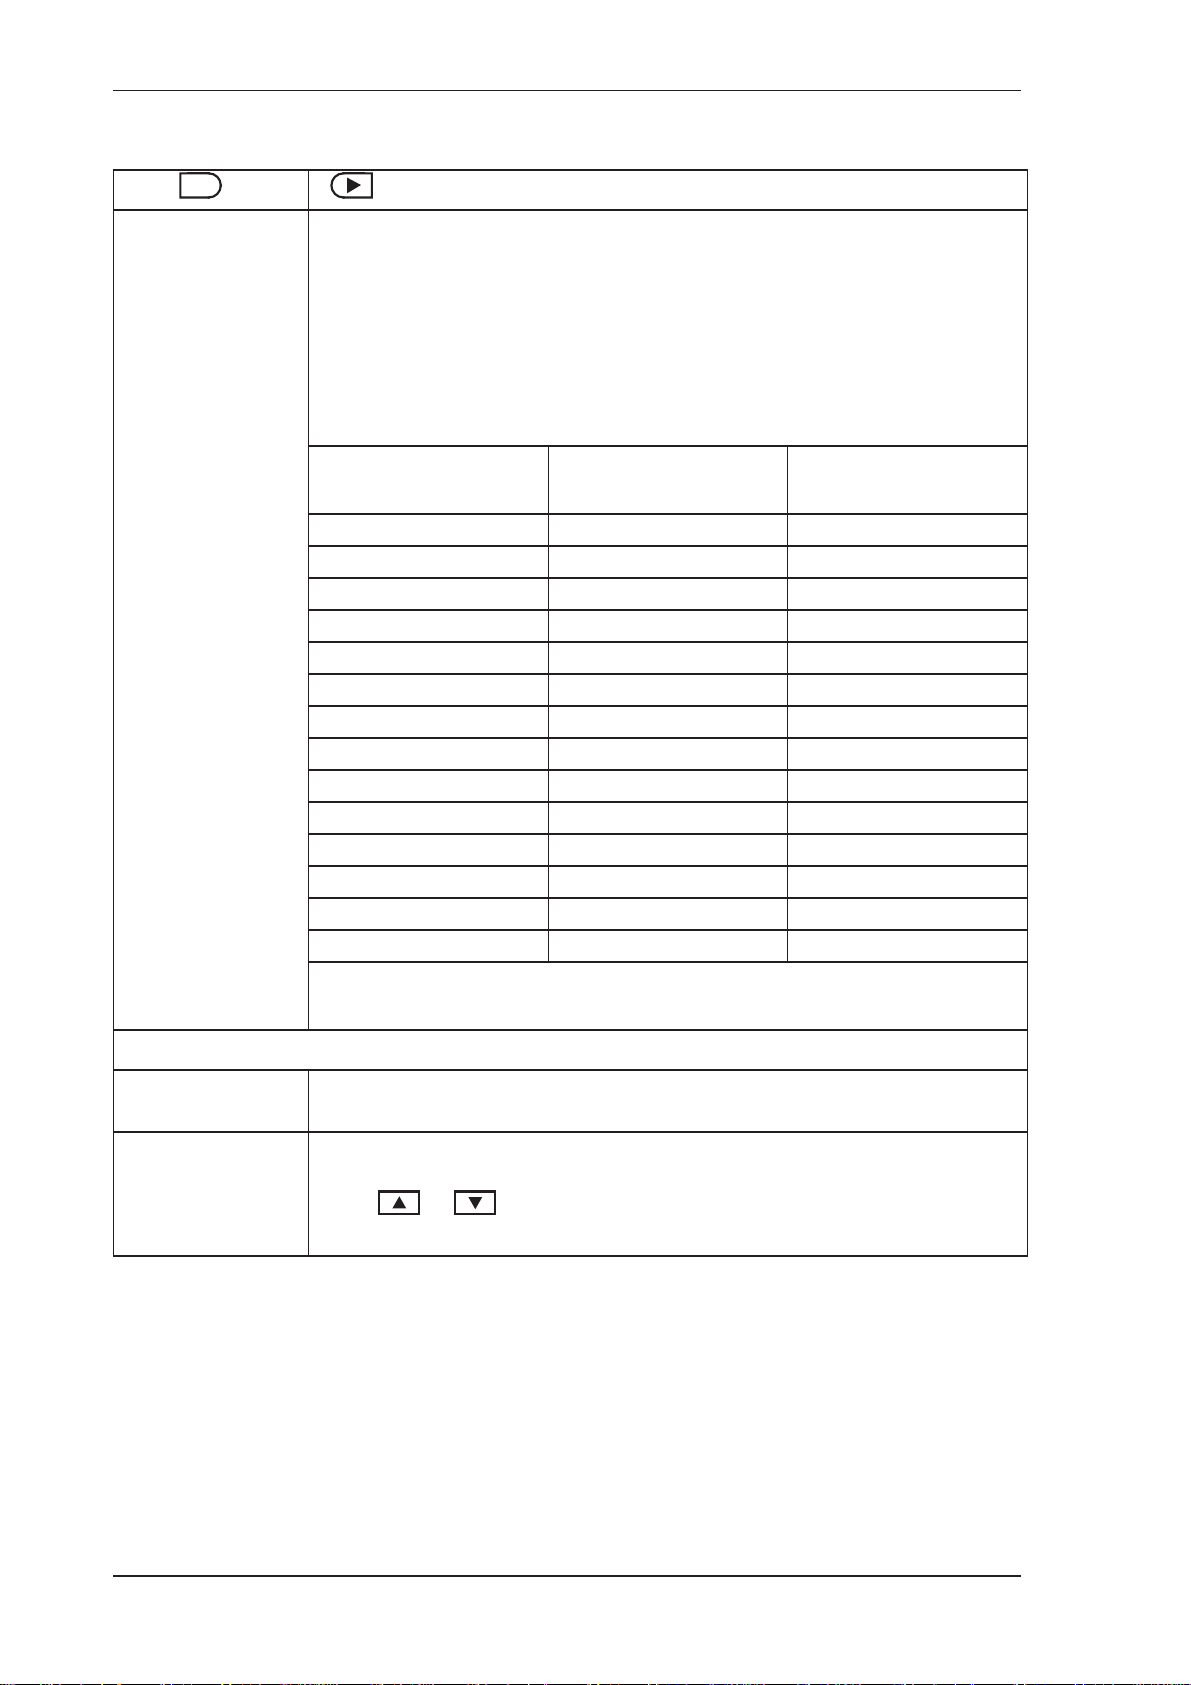
Instrument Calibration
SET
FILTER PINP1
UNITS PARAMS INPUTS OUTPUTS ALARMS COMMS TM/LOG SETUP TEST END
Input fluctuations may create distortions in input readings. The
instrument has a digital filter that can average out these fluctuations.
As a guide to the degree of filtering to use, the following table shows the
response time (in seconds) to reach 90% and 99% of a step change in
input.
The value A is the filter constant that the user can set.
Filter setting A Seconds to reach 90%
of full swing
Seconds to reach 99%
of full swing
000
224
448
6510
10 8 15
15 12 23
20 14 27
25 18 34
35 25 48
45 32 62
60 42 82
75 52 102
90 62 122
99 68 134
Analog Input 1
INPUT
TEMP AINP1
TYPE AINP1
The input filter range is from 0 to 99. A setting of 0 (zero) means that
there is no filtering.
For this application, Analog Input Channel 1 is assigned to Temperature.
Select the type of analog input source.
Press or to select 0-5 V, 1-5V, 4-20 mA, PT100, PT500 or
DEFAULT.
36 515 DG01 - 18 June 2017
Page 45
SET
Instrument Calibration
UNITS PARAMS INPUTS OUTPUTS ALARMS COMMS TM/LOG SETUP TEST END
PT-DEF AINP1
PT-MIN AINP1
PT-MAX
The Default Point is a fixed value that the instrument uses when the Input
Type is set to DEFAULT or Default Value On Exception has been
chosen. You can use the Default value instead of a sensor signal for
testing purposes, or if the sensor is faulty.
You can set the Default value during instrument commissioning so that it
is available immediately if you select the Default input type at a later
date.
Enter the value in the engineering units of assigned variable.
The Minimum Point and Maximum Point parameters are only for 0-5 V,
1-5V and 4-20 mA inputs.
Enter the value of the measured parameter that corresponds to the
minimum input signal level. The minimum point is commonly referred to
as the base value.
Enter the value of the measured parameter that corresponds to the
maximum input signal level. The maximum point is the same as the base
value (set at the minimum point) plus the span value.
Analog Input 2
INPUT
PRESS AINP2
PRESS AINP2
TYPE AINP2
For example, if the source signal is 4 mA for a temperature of 10°C, enter
10 for the minimum point. If the source signal is 20 mA for a temperature
of 200°C, enter 200 as the maximum point.
For this application, Analog Input Channel 2 is assigned to Pressure.
Select the type of analog pressure sensor. For a gauge type sensor, the
instrument adds the atmospheric pressure as defined in the Parameters
menu.
The pressure will be displayed as absolute or gauge, whichever is
selected and indicated with an ‘A’ or ‘G’ at the end of the pressure units.
However the pressure value when logged or read via serial
communications will always be absolute.
Press or to select ABSOL or GAUGE.
Select the type of analog input source.
Press or to select 0-5 V, 1-5V, 4-20 mA or DEFAULT.
515 DG01 - 18 June 2017 37
Page 46
Instrument Calibration
SET
PT-DEF AINP2
PT-MIN AINP2
PT-MAX
UNITS PARAMS INPUTS OUTPUTS ALARMS COMMS TM/LOG SETUP TEST END
The Default Point is a fixed value that the instrument uses when the Input
Type is set to DEFAULT or Default Value On Exception has been
chosen. You can use the Default value instead of a sensor signal for
testing purposes, or if the sensor is faulty.
You can set the Default value during instrument commissioning so that it
is available immediately if you select the Default input type at a later
date.
Enter the value in the engineering units of assigned variable.
Enter the value of the measured parameter that corresponds to the
minimum input signal level. The minimum point is commonly referred to
as the base value.
Enter the value of the measured parameter that corresponds to the
maximum input signal level. The maximum point is the same as the base
value (set at the minimum point) plus the span value.
For example, if the source signal is 4 mA for a pressure of 1.000 MPa,
enter 1.000 as the minimum point. If the source signal is 20 mA for a
pressure of 5.000 MPa, enter 5.000 as the maximum point.
Analog Input 3
INPUT
USER AINP3
TYPE AINP3
PT-DEF AINP3
For this application, Analog Input Channel 3 is assigned to User Input.
Select the type of analog input source.
Press or to select 0-5 V, 1-5V, 4-20 mA or DEFAULT.
The Default Point is a fixed value that the instrument uses when the Input
Type is set to DEFAULT or Default Value On Exception has been
chosen. You can use the Default value instead of a sensor signal for
testing purposes, or if the sensor is faulty.
You can set the Default value during instrument commissioning so that it
is available immediately if you select the Default input type at a later
date.
Enter the value in the engineering units of assigned variable.
38 515 DG01 - 18 June 2017
Page 47
Instrument Calibration
SET
UNITS PARAMS INPUTS OUTPUTS ALARMS COMMS TM/LOG SETUP TEST END
PT-MIN AINP3
PT-MAX
EXCEPT VALUE
Outputs
SET
UNITS PARAMS INPUTS OUTPUTS ALARMS COMMS TM/LOG SETUP TEST END
Enter the value of the measured parameter that corresponds to the
minimum input signal level. The minimum point is commonly referred to
as the base value.
Enter the value of the measured parameter that corresponds to the
maximum input signal level. The maximum point is the same as the base
value (set at the minimum point) plus the span value.
This option allows you to choose which value the instrument will use for
the analog input that raised an exception. The exception message will
continue to be displayed until the fault is rectified or the input type is set
to DEFAULT in calibration set mode.
Press or to select the value on exception as follows:
NONE Value will be set to zero
DEFAULT Value will be set to the default point if exists, otherwise zero
BOUNDS Value will be set to the boundary limit (min or max point)
VAR OUTn
PT-MIN OUTn
PT-MAX OUTn
Alarms
You can assign any of the main menu variables to the 4-20 mA outputs.
Press or to select the variable that is required as an output.
The output minimum value corresponds to the 4 mA point and the output
maximum value corresponds to the 20 mA point.
Setting the output range differently from the input range enables the
instrument to amplify the input signal. You can drive a chart recorder that
“zooms in” on a specified range of values instead of displaying the full
operating range of the transducer.
For example, if “Temperature” is chosen as an output variable and
engineering unit is degrees C, then setting the minimum point to 20 and
the maximum point to 100 would reflect the temperature range of 20 to
100 degrees C. At values below the minimum and above the maximum
points, the output remains at 4 mA and 20mA respectively.
The alarm relay(s) can be assigned to main menu variables such as
temperature, or set as an equipment failure alarm.
515 DG01 - 18 June 2017 39
Page 48
Instrument Calibration
The alarm switches “on” whenever an alarm condition exists. The alarm
switches “off” when the alarm condition no longer exists. However, you
may need to configure external alarm devices that require acknowledgement
for cancelling an alarm.
Equipment Failure Alarm
Any alarm relay can be assigned as an equipment failure alarm. This alarm
setting can have normally closed (open) contacts that open (close) when the
instrument displays any error message as listed in Error Messages on page
48.
SET
RELAY ALRMn
TYPE ALRMn
UNITS PARAMS INPUTS OUTPUTS ALARMS COMMS TM/LOG SETUP TEST END
Select a main menu variable to assign to the alarm relay.
Note: If the alarm type is set to “equipment alarm”, this relay assignment
setting is ignored.
Press or to select the variable that is required as an alarm.
The options available for alarm types are as follows:
• HI-NO — High Alarm, Normally Open contacts
• HI-NC — High Alarm, Normally Closed contacts
• LO-NO — Low Alarm, Normally Open contacts
• LO-NC — Low Alarm, Normally Closed contacts
• BD-NO — Band Alarm, Normally Open contacts
• BD-NC — Band Alarm, Normally Closed contacts
• AL-NO — Equipment Alarm, Normally Open contacts
• AL-NC — Equipment Alarm, Normally Closed contacts
Press or to select the type of alarm required.
POINT ALRMn
The Alarm Setpoint is available for viewing and editing for any alarm
type except ‘equipment alarms’.
The Alarm Setpoint is the value (in engineering units of assigned
variable) at which the alarm condition occurs and therefore the alarm is
on.
Each alarm is completely independent, e.g. a High alarm does NOT need
to have a higher setpoint than the a Low alarm.
40 515 DG01 - 18 June 2017
Page 49
Instrument Calibration
SET
HYST ALRMn
UNITS PARAMS INPUTS OUTPUTS ALARMS COMMS TM/LOG SETUP TEST END
The Alarm Hysteresis is available for viewing and editing for any alarm
type except ‘equipment alarms’.
Alarm hysteresis loops occur when the alarm toggles continuously on and
off when the process variable is close to the setpoint.
For a high alarm, the alarm activates when the value of the variable rises
above the alarm setpoint and deactivates when the value falls below the
alarm setpoint minus the amount of the hysteresis setting (if any).
For a low alarm, the alarm activates when the value of the variable falls
below the alarm setpoint and deactivates when the value rises above the
alarm setpoint plus the amount of the hysteresis setting (if any).
For a band alarm, the alarm activates whenever the value of the variable
is outside the setpoint plus or minus the amount of the hysteresis.
For example, with a high alarm setpoint of 200, and a hysteresis setting
of zero, a value oscillating between 197 and 202 will cause the alarm to
toggle on at 200 and toggle off below 200. However, if the hysteresis is
set to 5, the value of the variable must fall below 195 to cancel the alarm.
The alarm will reactivate only when the value again rises above 200.
Communications
The instrument has the following communication ports:
• RS-232 Port - A 9-pin female connector on the rear panel of the
• RS-485 Port (optional) - Terminals on the rear panel.
• Infra-red Port - Discontinued - Although program settings may be
instrument.
visible in calibration, the required hardware is no longer available. The
Infra-red protocol assignment (
and the remaining
INFRA settings can be ignored.
PROTOC INFRA) should be set to NONE
515 DG01 - 18 June 2017 41
Page 50
Instrument Calibration
SET
UNITS PARAMS INPUTS OUTPUTS ALARMS COMMS TM/LOG SETUP TEST END
PROTOC RS232
RS485
INFRA
BAUD RS232
RS485
INFRA
The Communications Protocols can be assigned to the communication
ports as follows (a protocol cannot be assigned to more than one port at
a time):
• ASCII - Simple ASCII available for all ports
• RTU - Modbus RTU available for all ports
• PRN - Printer Protocol available for RS232 and RS485
• NONE - If a port is not being used, set the protocol to NONE.
Printer Protocol (PRN) is only available if the option with Real Time
Clock is installed.
For the selected port, press or to select the desired protocol.
The Baud setting is the speed of the communication port in data bits per
second.
The baud rate of the instrument must match the baud rate of the
communication device that the instrument is connected to.
Use or to select 2400, 4800, 9600 or 19200 baud.
PARITY RS232
RS485
INFRA
S-BITS RS232
RS485
INFRA
RTU DATA
The Parity bit helps to detect data corruption that might occur during
transmission.
The parity bit setting of the instrument must match the parity bit setting
of the communication device that the instrument is connected to.
Press or to select EVEN, ODD, or NONE.
The Stop bit indicates the end of a transmission. Stop bits can be 1 or 2
bit periods in length. The stop bit setting of the instrument must match
the stop bit setting of the communication device that the instrument is
connected to.
Press or to select 1 or 2 stop bits.
The Modbus RTU data format for the 2-register (4-byte) values can be
set as either floating point or long integer values.
Use or to select FLOAT or INTEGER.
42 515 DG01 - 18 June 2017
Page 51
SET
Instrument Calibration
UNITS PARAMS INPUTS OUTPUTS ALARMS COMMS TM/LOG SETUP TEST END
RTU ADDR
The Modbus RTU protocol address must be in the range of 1 to 247.
When multiple instruments (slaves) are connected to one communication
device (master), each assigned address must be unique.
Note: The master device uses the RTU address 0 (zero) for broadcasting
to all connected slave units.
ASCII ADDR
The ASCII protocol address identifies each communicating device.
The address must be in the range of 1 to 255. When multiple instruments
(slaves) are connected to one computer (master), each assigned address
must be unique.
FLASH PORT
The Flash Driver Port assignment defines the communication port for
downloading software into the instrument.
The default setting of this assignment is the RS-232 port.
Press or to select RS-232, RS-485, or INFRA.
Time Settings and Data Logging
Instrument Clock
Note: The real-time clock is part of the advanced option package.
The instrument has a real-time clock for recording logged events. The clock
displays the time and the date. The date format can be set to European
format (day/month/year) or American format (month/day/year). The time
clock uses the 24-hour format.
The clock will continue to operate for up to 5 years (typically) on the
internal battery if there is no power connected to the instrument. Therefore,
after an interruption to the power supply, the instrument recommences
normal operation although there will be no data recorded during the period
without a power supply.
Note: If there is an interruption to the power supply and the battery has
failed, the instrument displays an error message when the power
supply is restored. In this case, you should set the current time and
date so that the instrument continues to log data at the correct times.
515 DG01 - 18 June 2017 43
Page 52
Instrument Calibration
Data Logging
The instrument will log the main-menu variables if real-time clock option is
installed. The logs are at fixed intervals of hours, days, weeks, months and
years. The instrument can store a total of 1530 log entries which are
distributed over the log intervals as follows:
• 800 hourly logs
• 400 daily logs
• 200 weekly logs
• 100 monthly logs
• 30 yearly logs
If the number of log entries exceeds the programmed number for a particular
time interval, the oldest log entry is overwritten by the newest one for that
time interval.
The log parameters (below) also determine the number of records to be
included in a report printout if the printing option is used.
SET
UNITS PARAMS INPUTS OUTPUTS ALARMS COMMS TM/LOG SETUP TEST END
DATE FORM
CLOCK YEAR
CLOCK M-DAY
CLOCK H-MIN
HOUR LOGS
Clock Date Format
The European date format is: dd/mm/yyyy or (Day-Month).
The American date format is: mm/dd/yyyy or (Month-Day).
Press or to select DAY-M or M-DAY
The Clock Year defines the current year for the real-time clock.
The Clock M-DAY setting defines the current month and date for the
real-time clock. This parameter is programmed in Month-Day format for
both European and American date formats.
The Clock H-MIN setting is the current time in hours and minutes for the
real-time clock.
Set the number of Hourly Logs to appear on the printed log report.
The hourly log entry occurs at 00 minutes each hour.
DAY LOGS
Set the number of Daily Logs to appear on the printed log report.
The daily log entry occurs at 00 hours and 00 minutes each day.
WEEK LOGS
Set the number of Weekly Logs to appear on the printed log report.
The weekly log entry occurs at 00 hours and 00 minutes each Monday.
44 515 DG01 - 18 June 2017
Page 53
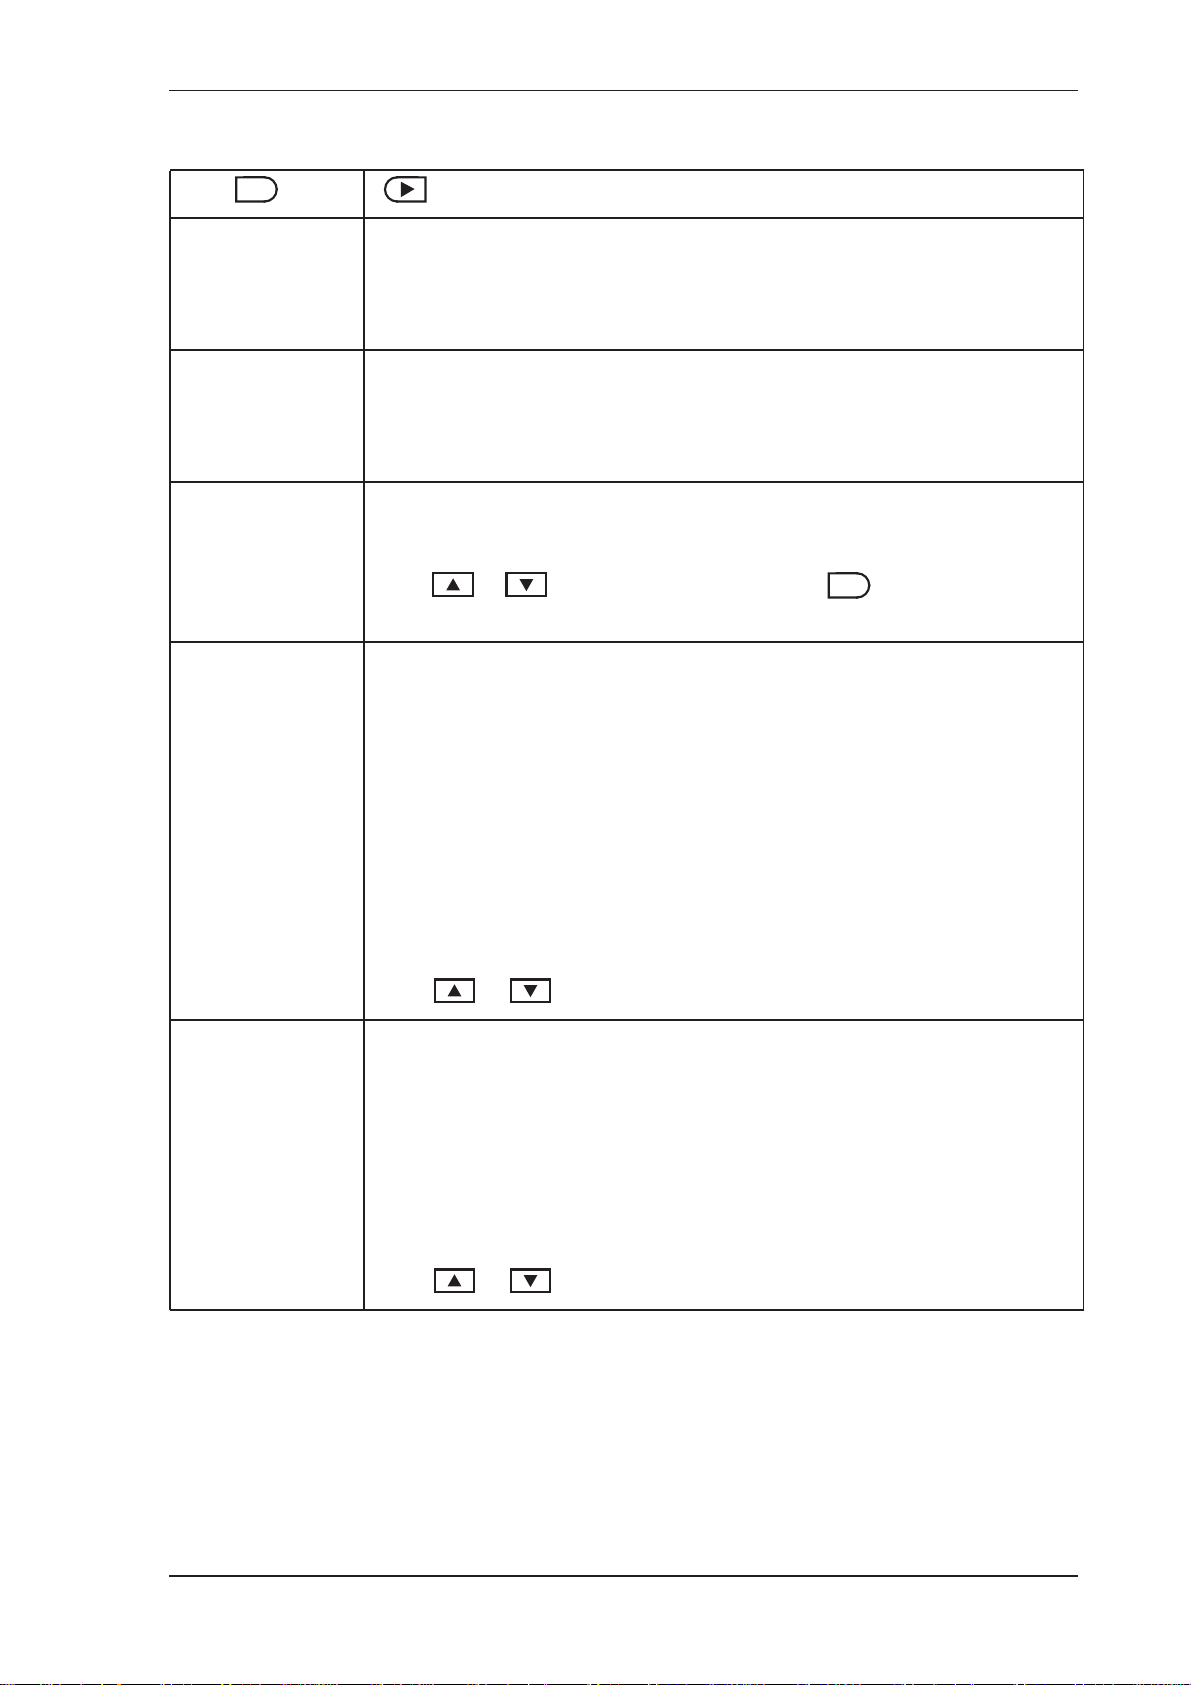
SET
Instrument Calibration
UNITS PARAMS INPUTS OUTPUTS ALARMS COMMS TM/LOG SETUP TEST END
MONTH LOGS
YEAR LOGS
RESET LOGS
REPORT TYPE
Set the number of Monthly Logs to appear on the printed log report.
The monthly log entry occurs at 00 hours and 00 minutes on the first day
of the month.
Set the number of Yearly Logs to appear on the printed log report.
The yearly log entry occurs at 00 hours and 00 minutes on the first day of
the year.
Reset the logged data. You may need to reset (clear) the logged data if
you change the time/log settings.
Press or to select YES, then press the key. The instrument
SET
makes three beeps to confirm the reset command.
The Printer Protocol Report Type determines the nature of the printout
from the REPORT PRINT - HOLD.SET prompt in the main menu. The
following report types available in this instrument are:
• REP-01 Hourly Logs Report
• REP-02 Daily Logs Report
• REP-03 Weekly Logs Report
• REP-04 Monthly Logs Report
• REP-05 Yearly Logs Report
• REP-06 Previous Day’s 24 Hour Report (0Hr – 23Hr, minimum
48 hourly logs required)
PRN TYPE
Press or to select Report Type.
The Printer Protocol Printer Type allows the nature of the printer being
used to be specified. The following printer types available in this
instrument are:
• PRN-01 Generic computer printer
• PRN-02 Generic roll printer (prints first line first)
• PRN-03 Slip printer TM295
• PRN-04 Label (roll) printer - Citizen CMP30L
Press or to select Printer Type.
515 DG01 - 18 June 2017 45
Page 54
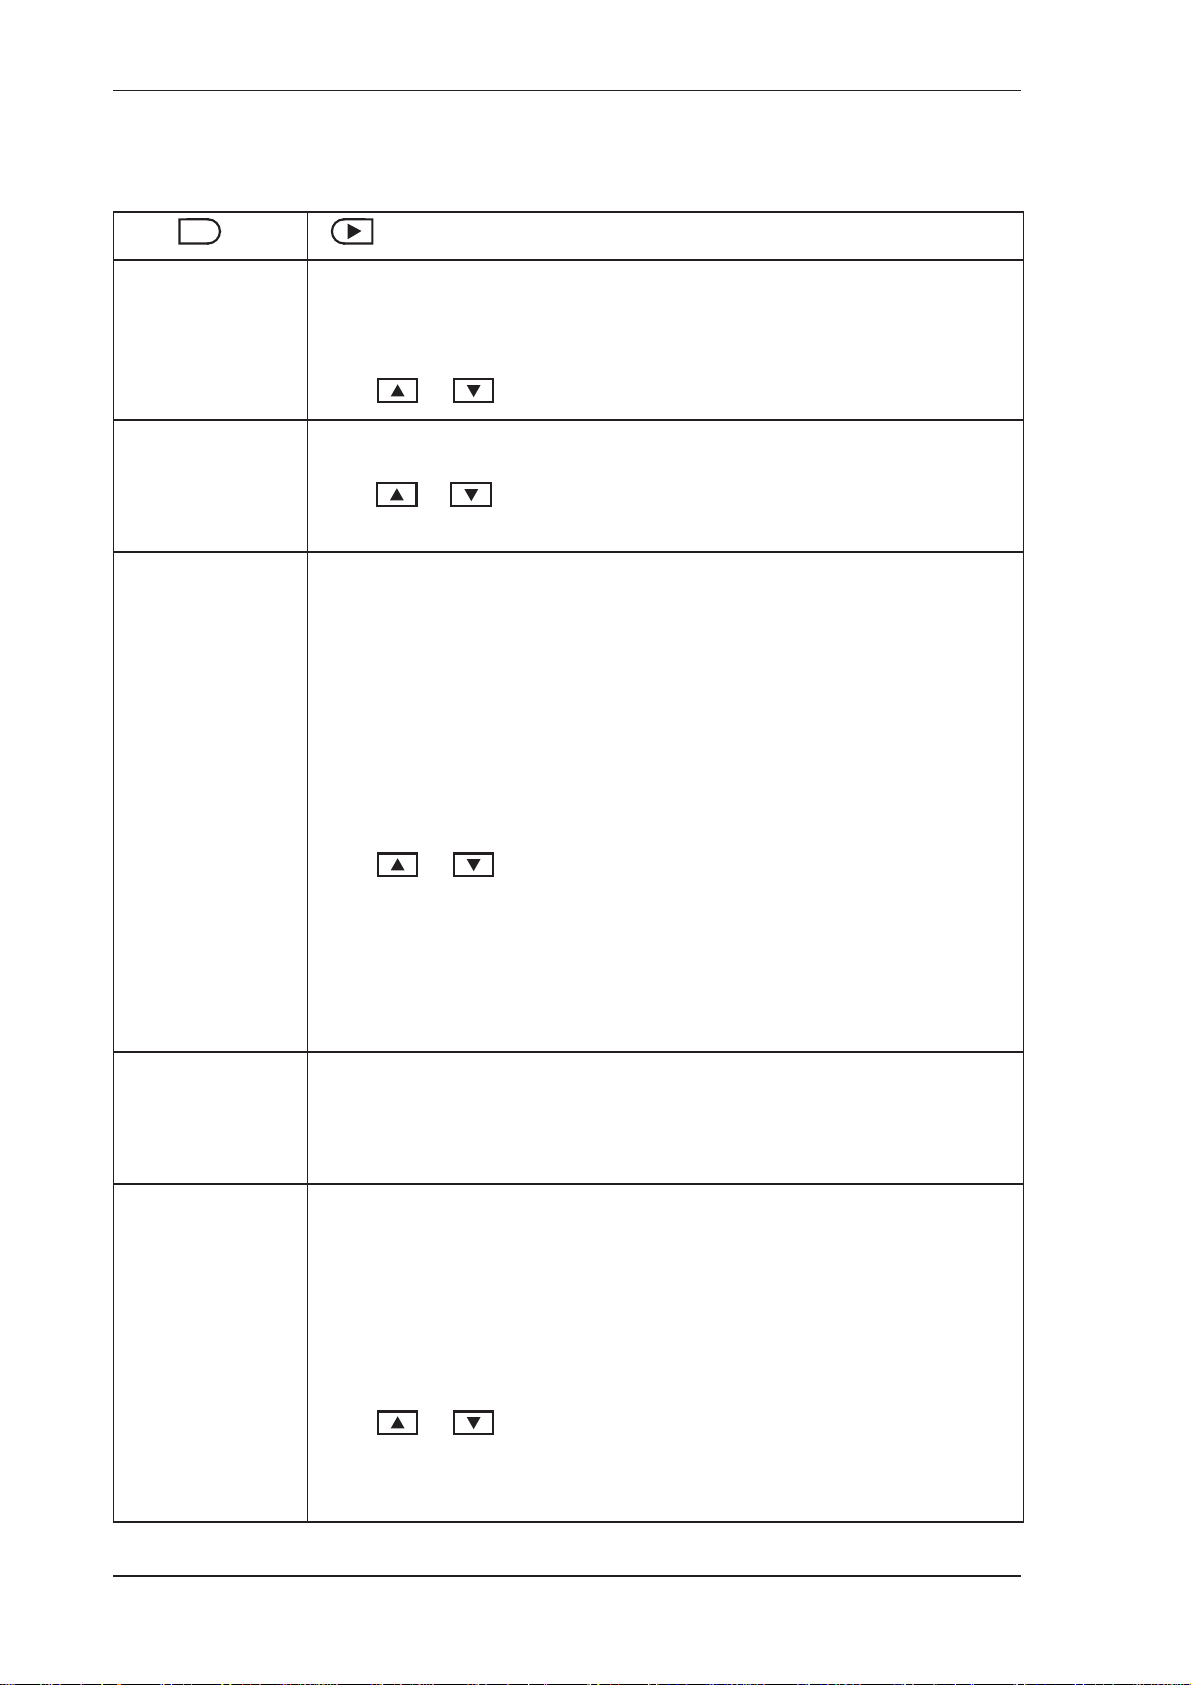
Instrument Calibration
General Setup Parameters
SET
UNITS PARAMS INPUTS OUTPUTS ALARMS COMMS TM/LOG SETUP TEST END
DEFAULT VAR
SUPPLY VOLT
T-OUT MODE
If the display timeout is enabled, the instrument displays the default
Variable when there is no user action for the period of the display timeout
period.
Press or to select the default variable display.
The instrument provides a power-limited supply for external transducers.
Press or to set the transducer supply voltage between 8 and 24
volts DC as required.
If the Display Timeout mode is enabled, and there is no user activity for
the defined timeout period, the display panel returns to the default
display.
This function is useful for the following reasons:
• to return the display to a preferred variable after the user has finished
reading other information,
• to cancel the calibration mode and return to the default display if the
user does not exit from the calibration mode for any reason.
T-OUT SEC
DISPL TAGS
Press or to select the display timeout function as follows:
• DISABLE - Timeout is completely disabled.
• EN DISP - Timeout is enabled during Normal mode and Calibration
View mode.
• EN EDIT - Timeout is enabled during Calibration Set mode.
• EN ALL - Timeout is enabled for all modes.
The Display Timeout period defines the delay for the Display Timeout
mode if it is enabled.
The display timeout period can be from 10 to 99 seconds.
The Display Tags option determines whether the instrument displays the
default display tags or the user-defined tags. The display tag setting also
defines whether the instrument displays the default error and warning
messages, or the user-defined messages.
Note: The user-defined tags can be entered into the instrument only by
the manufacturer or the distributor.
Press or to select the Display Tags option as follows:
• DEFAULT - the instrument displays the default (English) tags
• USER - the instrument displays the user-defined tags.
46 515 DG01 - 18 June 2017
Page 55
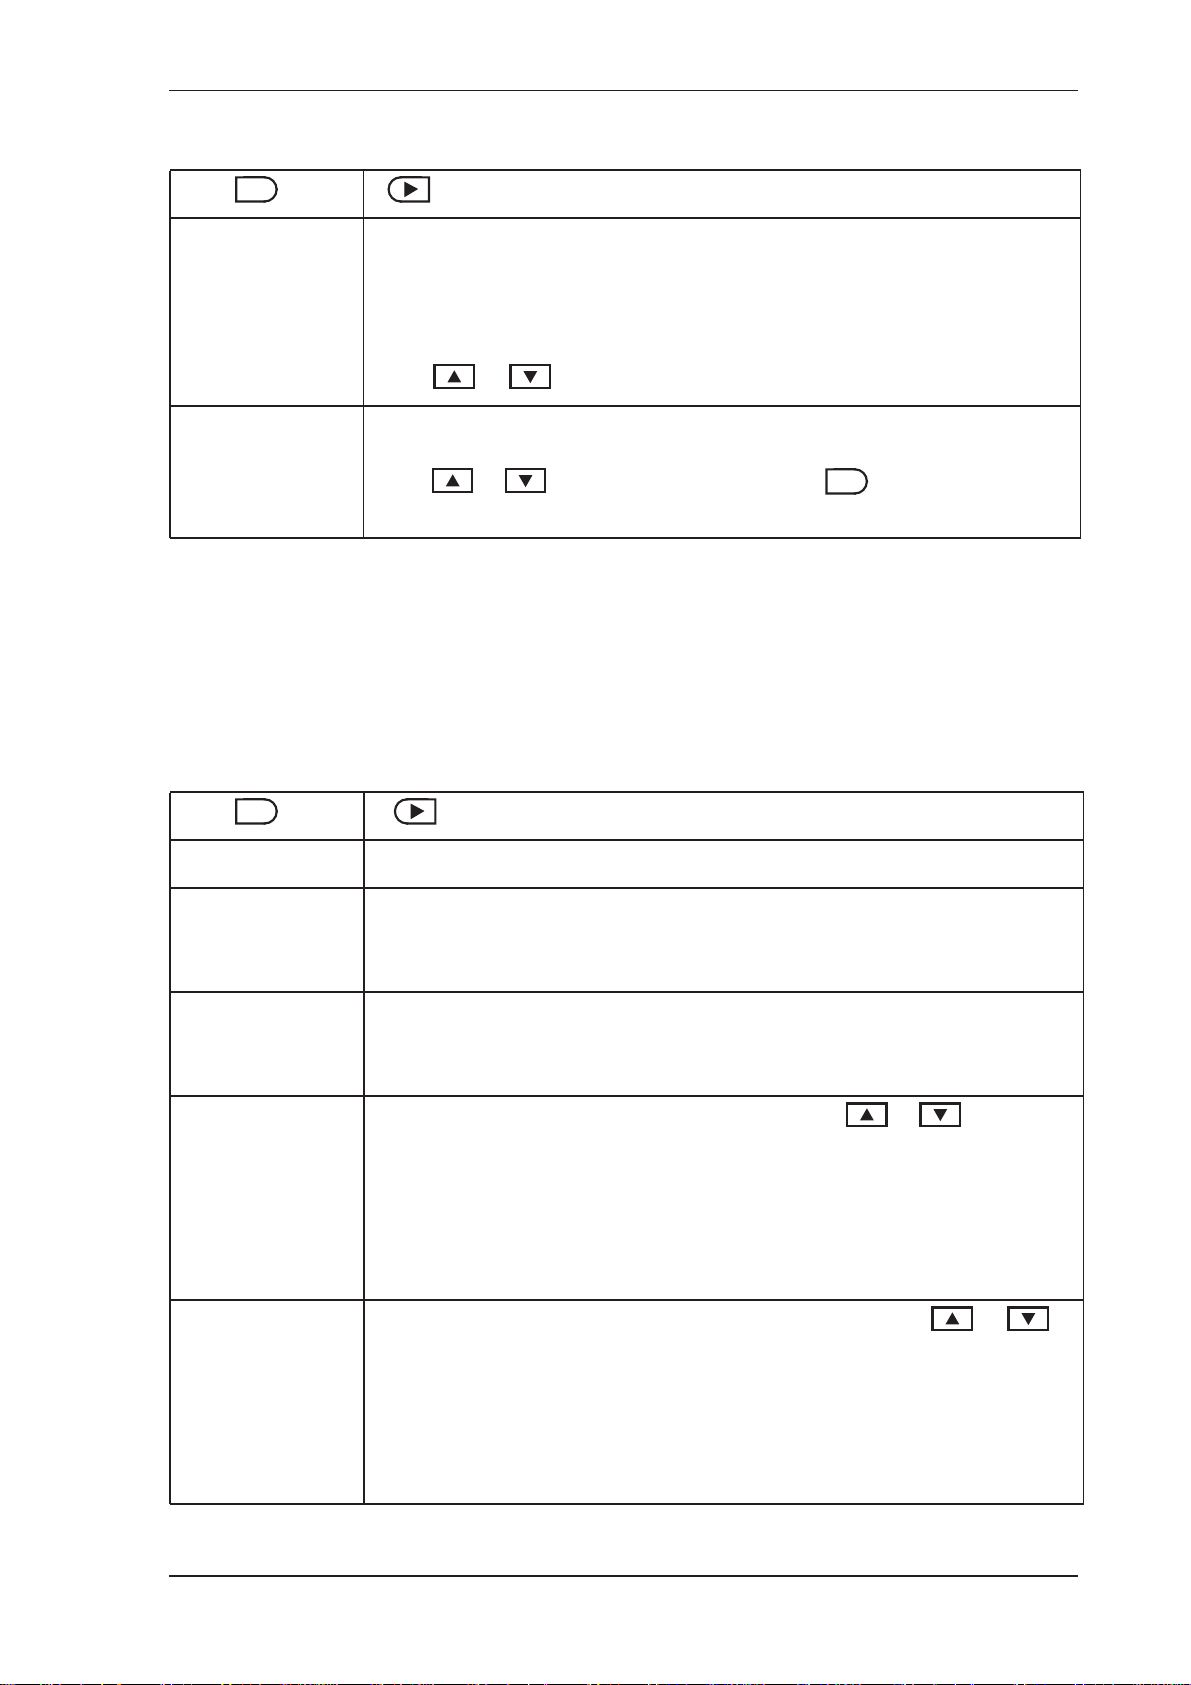
Instrument Calibration
SET
BACK-L T-OUT
DOCKET RESET
Test Menu
UNITS PARAMS INPUTS OUTPUTS ALARMS COMMS TM/LOG SETUP TEST END
If the backlight timeout is enabled, and there is no user activity (any keys
pressed) for a period of 10 seconds, the display backlight switches off to
save power. The backlight switches on when a key is pressed. Select the
backlight timeout mode as required.
Press or to select ENABLE or DISABLE.
The Docket Reset function resets the numbering of printed dockets.
Press or to select YES, then press the key. The instrument
SET
makes three beeps to confirm the reset command.
The Test menu enables you to view the inputs and outputs to and from the
instrument.
In Calibration Set mode, (by entering the system password) you can control
the outputs and the alarms as described in the table below.
SET
UNITS PARAMS INPUTS OUTPUTS ALARMS COMMS TM/LOG SETUP TEST END
PINP1 uS
AINPn units
LINPn STATE
OUTn STATE
ALRMn STATE
or
REL-n
The period of the pulse input to PINP1 is displayed in microseconds.
The units are displayed according to the calibration setup for the analog
input. If unused or set to Default the input is 4-20mA and displayed in
mA.
You can view the state of the logic inputs. If the input is an open contact
or inactive it will display HI. If the input is a closed contact or active it
will display LO.
You can control the state of the outputs. Press the or keys to set
the output state as follows:
• PROCESS - the output depends on the current values of the inputs
and the calculations that the instrument performs (normal operation).
• HI - the output is set to 20 mA.
• LO - the output is set to 4 mA.
You can control the state of the relays (alarms). Press the or
keys to set the selected relay as follows:
• PROCESS - the relay operates according to the current values of the
inputs and the relay settings as programmed (normal operation).
• OPEN - the relay output contacts are set to “open”.
• CLOSED - the relay output contacts are set to “closed”.
515 DG01 - 18 June 2017 47
Page 56

Instrument Calibration
SET
SUPPLY V
You can display the actual DC output supply voltage, which may help
with troubleshooting.
If the actual supply voltage is lower than the preset value (refer to
General Setup Parameters on page 46) it may indicate that the output is
overloaded.
System Messages
The instrument displays messages for defined events and fault conditions.
The manufacturer or distributor can enter user-defined text for the
messages. This user-defined text is displayed, instead of the default
(English) messages, when the Display Tags option in the Setup menu is set
to USER.
Error Messages
UNITS PARAMS INPUTS OUTPUTS ALARMS COMMS TM/LOG SETUP TEST END
Failure of Analog Input Sensor
If there is a failure of an analog input sensor for a process parameter such as
temperature or pressure, the instrument displays the relevant error message
and can be programmed to set the value of that parameter to either 0 or the
boundary limit. The input sensor and connections need to be inspected and
may require replacement. The instrument also sets the results of calculations
that depend on the failed input(s) to 0 when the input value defaults to 0.
Default Value on Exception
If Default Value On Exception has been enabled in the INPUTS section of
calibration, the default value will automatically be used so that all
calculations can continue. The error message will still continue to scroll
across the display until the fault is corrected at which point the calculations
will revert to using the live input.
Override Error Condition
While a fault is being rectified on an analog input for a process parameter,
an operator with calibration access can set the Analog Input Signal Type to
DEFAULT and the Analog Input Default Point to a typical process value. If
there are no other faults, the instrument continues to operate by using the
default value.
48 515 DG01 - 18 June 2017
Page 57
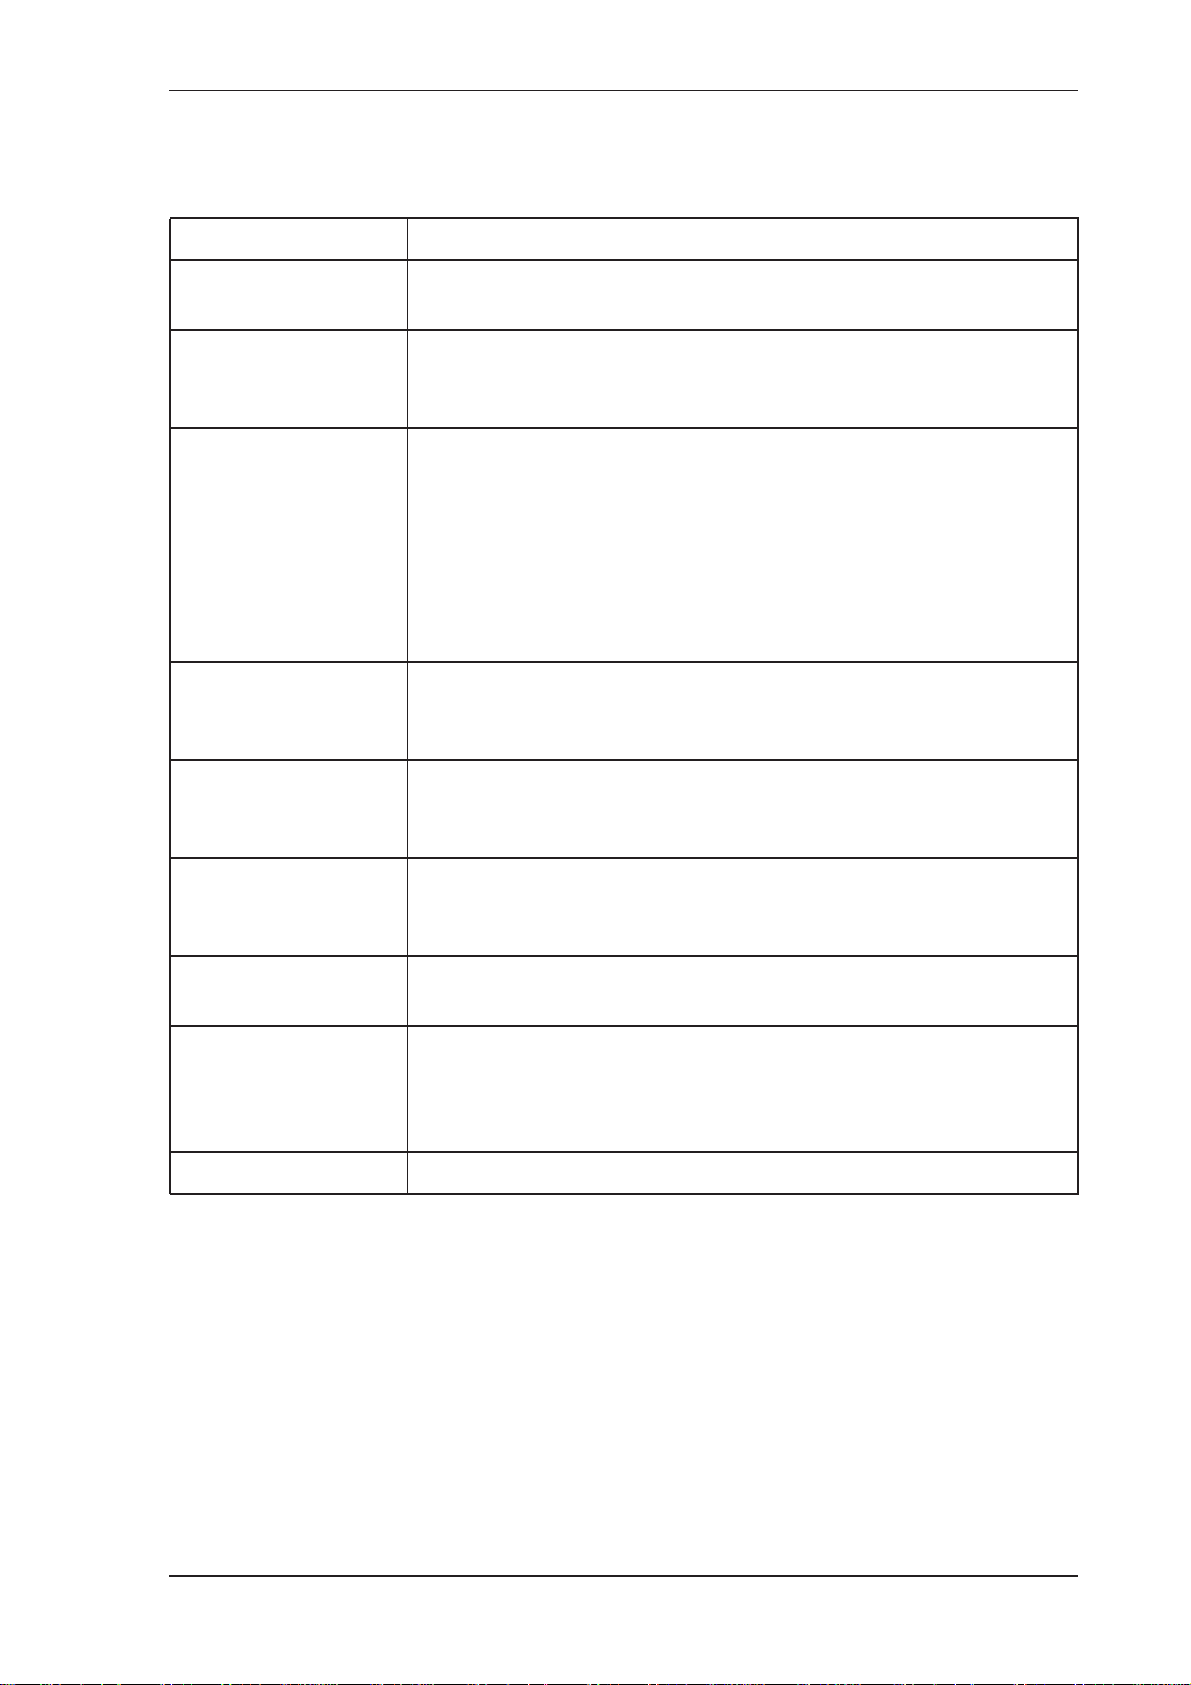
Instrument Calibration
The system displays error messages as described in the following table:
Error Messages Description
CPU Card Failure There are failed components on the CPU card and technical support
is required.
Power Supply is Low The input and/or output power supply voltage is too low, ensure that:
(a) input power supply voltage is within the specified range
(b) output power supply is not overloaded.
New/Failed Battery Set Time
The real-time clock has lost the correct time because the battery has
failed, or there is a new battery. Set the current time and date (in the
TM/LOG menu) to clear the error message and to continue data
logging at the correct times.
Note: The instrument can continue operating with a failed battery,
but the correct time will be lost if there are interruptions to the
power supply.
Temperature Sensor
Failure
The temperature sensor (analog input 1) has failed. To deactivate the
error, the Analog Input Signal Type can be set to DEFAULT to use
a programmed default value instead of the sensor signal.
Pressure Sensor
Failure
The pressure sensor (analog input 2) has failed. To deactivate the
error, the Analog Input Signal Type can be set to DEFAULT to use
a programmed default value instead of the sensor signal.
User Sensor Failure The user sensor (analog input 3) has failed. To deactivate the error,
the Analog Input Signal Type can be set to DEFAULT to use a
programmed default value instead of the sensor signal.
Temp/Pressure is Out
of Range
The temperature and/or pressure inputs are outside of the allowed
calculation range.
Invalid Reference
Parameter
The reference parameter is outside of the allowed range. The
reference temperature and pressure (specified in the Parameters
menu) should be programmed within the defined calculation limits
for the chosen fluid.
Invalid Gas Property The gas property is outside of the allowed range.
515 DG01 - 18 June 2017 49
Page 58
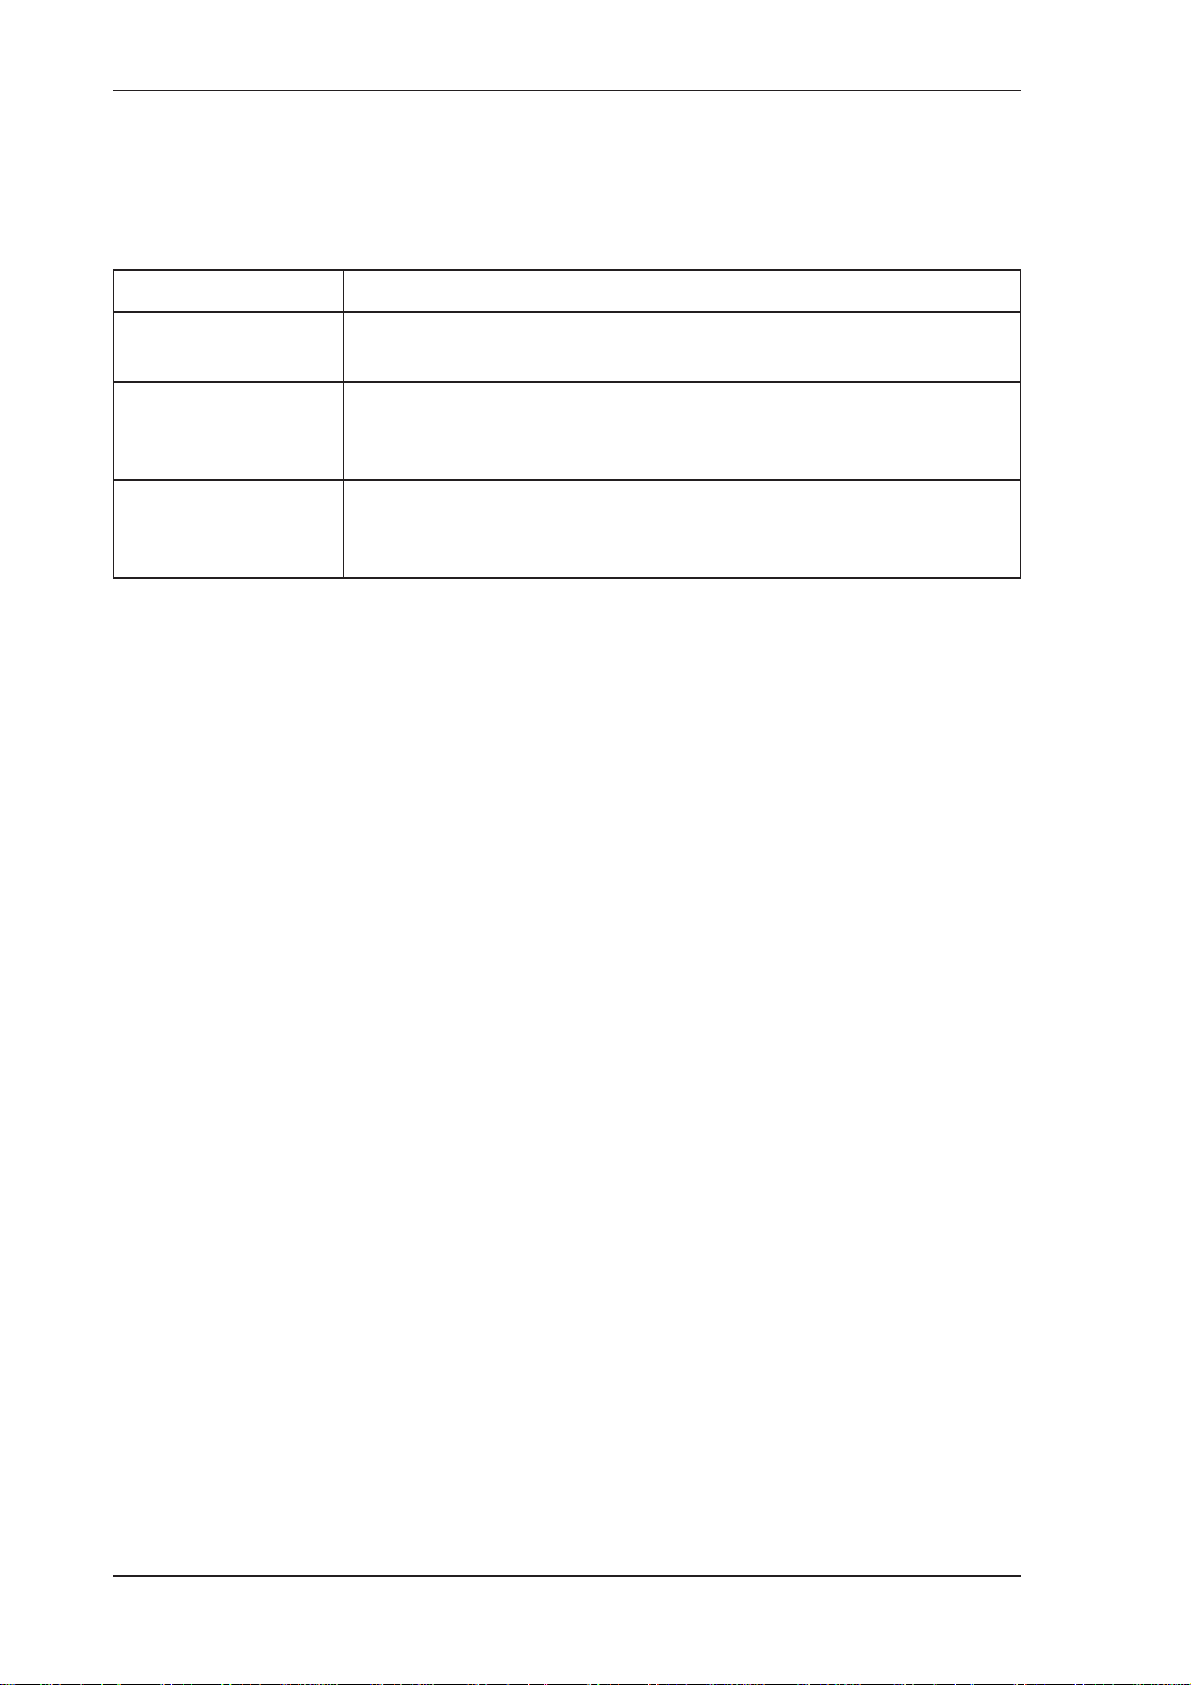
Instrument Calibration
Warning Messages
The system displays warning messages as described in the following table:
Warning Messages Description
Value Has Been Set to
Default
Over Total Limit Maximum Set
Already Assigned to
Other Port
You have entered an invalid value for a parameter. Therefore, the
instrument has set the default value.
You have exceeded the maximum number of logging entries for the
combined time bases. The instrument has set the current log setting to
the remaining maximum number.
You have tried to assign a particular protocol type to more than one
serial communication port. The instrument has set the protocol to
NONE.
50 515 DG01 - 18 June 2017
Page 59

Chapter 6
Communications
Overview
This chapter describes the communications between the instrument and
another communicating device such as a computer or a printer. You should
have relevant information about the devices to which the instrument will be
connected. Some connection examples are included in this manual,
however, the operation and connection of other devices is outside the scope
of this manual.
Hardware Interconnection
The instrument has two communication ports:
• RS-232 port on the rear panel (DB9 female connector)
• RS-485 port on the rear panel (optional)
The appropriate interface and protocols are selected during calibration.
RS-232 Port
The RS-232 port provides communication between the instrument and one
other device such as a host computer or a printer.
Note: A printer must have a serial port to be able to be directly connected
to the flow computer. It is not possible to communicate directly with
a printer via a parallel port.
Computers use either a DB9 or a DB25 connector, and the connections to
each type are shown in Figure 15.
515 DG01 - 18 June 2017
51
Page 60
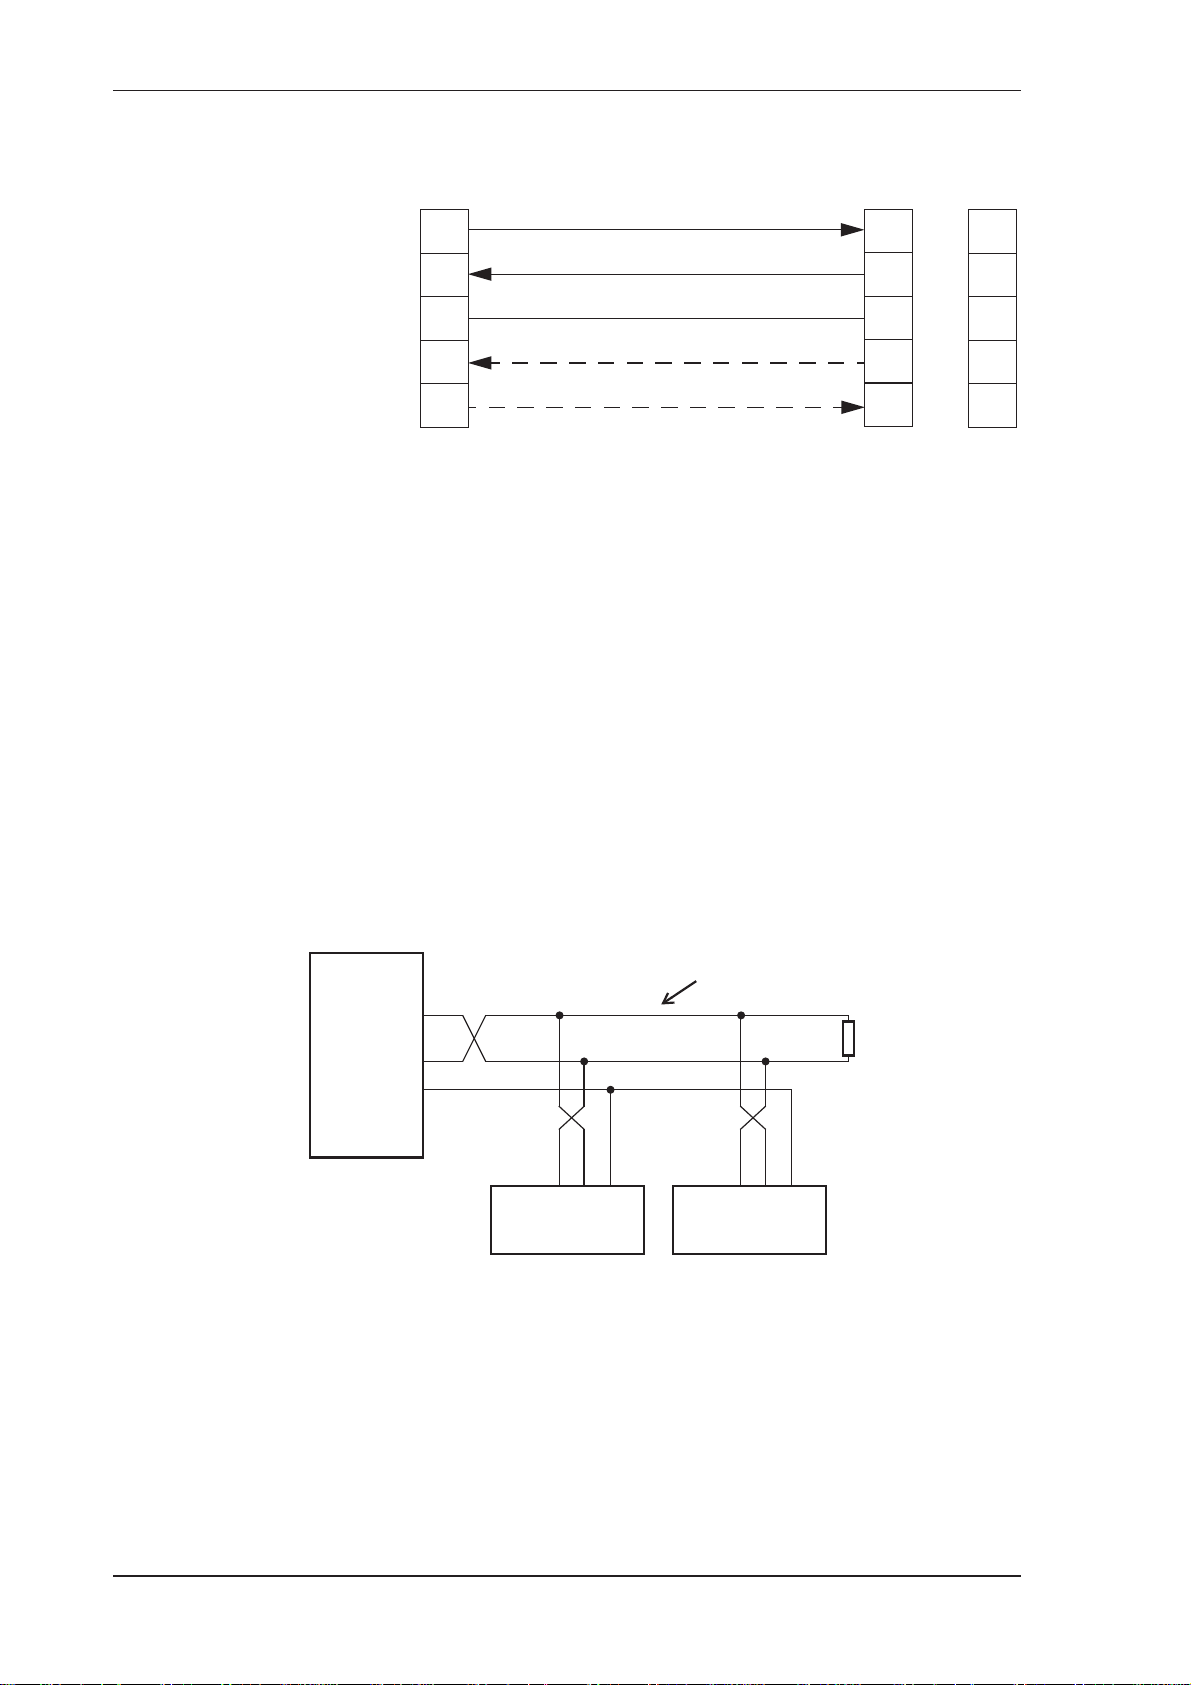
Communications
Instrument
TxD
RxD
GND
CTS
RTS
2
3
5
7
8
DB9
Common
Optional
Optional
Computer/Printer
2
3
5
7
8
DB9
RxD
TxD
GND
RTS
CTS
3
2
7
4
5
DB25
Figure 15 RS-232 Cable Connections to a Computer
Note: The instrument requires a cable with straight-through connections.
Do not use a null modem cable for RS-232 connection to a computer.
RS-485 Port
The RS-485 port enables communication with multiple devices. Each
device has a unique address so that the “master” device can communicate
with specific “slave” devices.
On RS-485 links, an external terminating resistor must be connected at the
furthest end of the cable. When multiple instruments are connected, they
should be “daisy chained” in a multidrop configuration as shown in Figure
16. Up to 32 units can be connected to the interface at a maximum distance
of 1200 metres.
Host
Computer
Comms
Gnd
+
-
Gnd Gnd
-+-
+
19 20 21
Instrument Instrument
Twisted Pair
Load
120 ohms
19 20 21
Figure 16 RS-485 Connections
52 515 DG01 - 18 June 2017
Page 61

Protocols
Communications
Infra-red Port
The infra-red port is located on the front panel of the instrument. The infrared port uses the Infra-red Developers Association (IrDA) physical layer
format of signal encoding and decoding.
The nature of the infra-red port requires the communicating device to be
located close to the front of the instrument. Therefore, its main use would
probably be for reloading the instrument application software, or occasional
collection of data, rather than continuous communications.
The communications protocols can be assigned to the communication ports
on the instrument as follows:
• ASCII - Simple ASCII available for all ports
• RTU - Modbus RTU available for all ports
• PRN - Printer Protocol available for RS232 and RS485
• NONE - If a port is not being used, set the protocol to NONE.
Note: The Printer Protocol is only available if the option with Real Time
Clock is installed. Also a protocol cannot be assigned to more than
one port at a time as described in Communications on page 41.
• ASCII - In this ASCII protocol each command and response is a string
of ASCII characters. This proprietary protocol is developed by Contrec
to allow for simple information interchange. The main advantages of this
mode are that it allows extended time intervals to occur between
characters without causing a timeout error and that messages can be sent
and monitored easily with a simple ASCII terminal.
• Modbus RTU - Modbus RTU is an industry-standard protocol which
allows the instrument to be easily connected to computers running
supervisory software systems. The main advantage of this mode is that
its greater character density allows better data throughput than ASCII
mode, however each message must be transmitted in a continuous
stream.
• Printer - In the Printer protocol there is a selection of printer types.
Please refer to the Printer Protocol on page 64 for full details.
515 DG01 - 18 June 2017 53
Page 62

Communications
Simple ASCII Protocol
This simple ASCII protocol requires that all requests are initiated with a
colon ( : ) and terminated with a carriage return (
termination can include a linefeed before the carriage-return (
is the carriage-return that acts as the message termination.
All responses by the instrument are terminated with a linefeed and a
carriage-return (
Requests Format
The format of a request to the instrument is as follows:
Address Log CommandLog
Each request must include the address and command portions. The
underlined section is an optional part of the request string.
Address
:A001
LFC
).
R
:LR001:XXX?
type number
LFCR
Linefeed
Carriage-return
C
). The message
R
LFCR
), but it
In multipoint communications, each instrument must have a unique address
and it is essential in the request for identifying a particular instrument.
However, it may be set to 000, for special broadcast commands.
For single-instrument communications, the address can also be set to 000 in
the request.
Refer to Communications on page 41 for setting the instrument address.
Note: The instrument always responds with its address in the header
regardless of the type of request.
Log Type and Number
The log type and number enables a communicating device to retrieve data
from the instrument. The data can be from timebased and/or event-based
logs. Data can also be from the current process variables.
The log request is optional. If the log request is not included, or the log
number is set to 000, the instrument returns the current process variables. If
the log request is included, the log number defines the specific log entry by
counting backwards. The most recent log entry for a timebase is 001.
54 515 DG01 - 18 June 2017
Page 63
Communications
The “last edit” log records the process variables at the time of the last exit
from the calibration edit mode. There is only one “last edit” log, therefore,
if a number is included in the request, the instrument ignores the number and
returns the data at the time of the last edit.
The types of logs applicable to this instrument are as follows:
Log Type
LH - hourly log
LD - daily log
LW - weekly log
LM - monthly log
LY - yearly log
LE - last edit log
The number of the log entry is the same as shown on the front panel of the
instrument. For example, a request for LH003 would return the data for the
log entry two hours prior to the most recent hourly log entry. If the current
time is between 9:00 am and 10:00 am, the most recent hourly log LH001
was recorded at 9:00. Therefore, LH002 is for 8:00 and LH003 is for 7:00.
After 10:00 am in this example, LH003 becomes the 8:00 log.
Instrument Responses
The instrument response time to any enquiry is not more than 300 ms. The
responses from the instrument are in the following format:
HEADER
DATA
DATA
.
.
.
DATA
LFC
The components of the response message are as follows:
Header
The format of the response header from the instrument is as follows:
LFCR
LFC
R
LFCR
LFC
R
R
A001 YYYY/MM/DD HH:MM:SS 00
Address Time Date
(24-hour clock)
spacespace
515 DG01 - 18 June 2017 55
Exception Status
space
Page 64
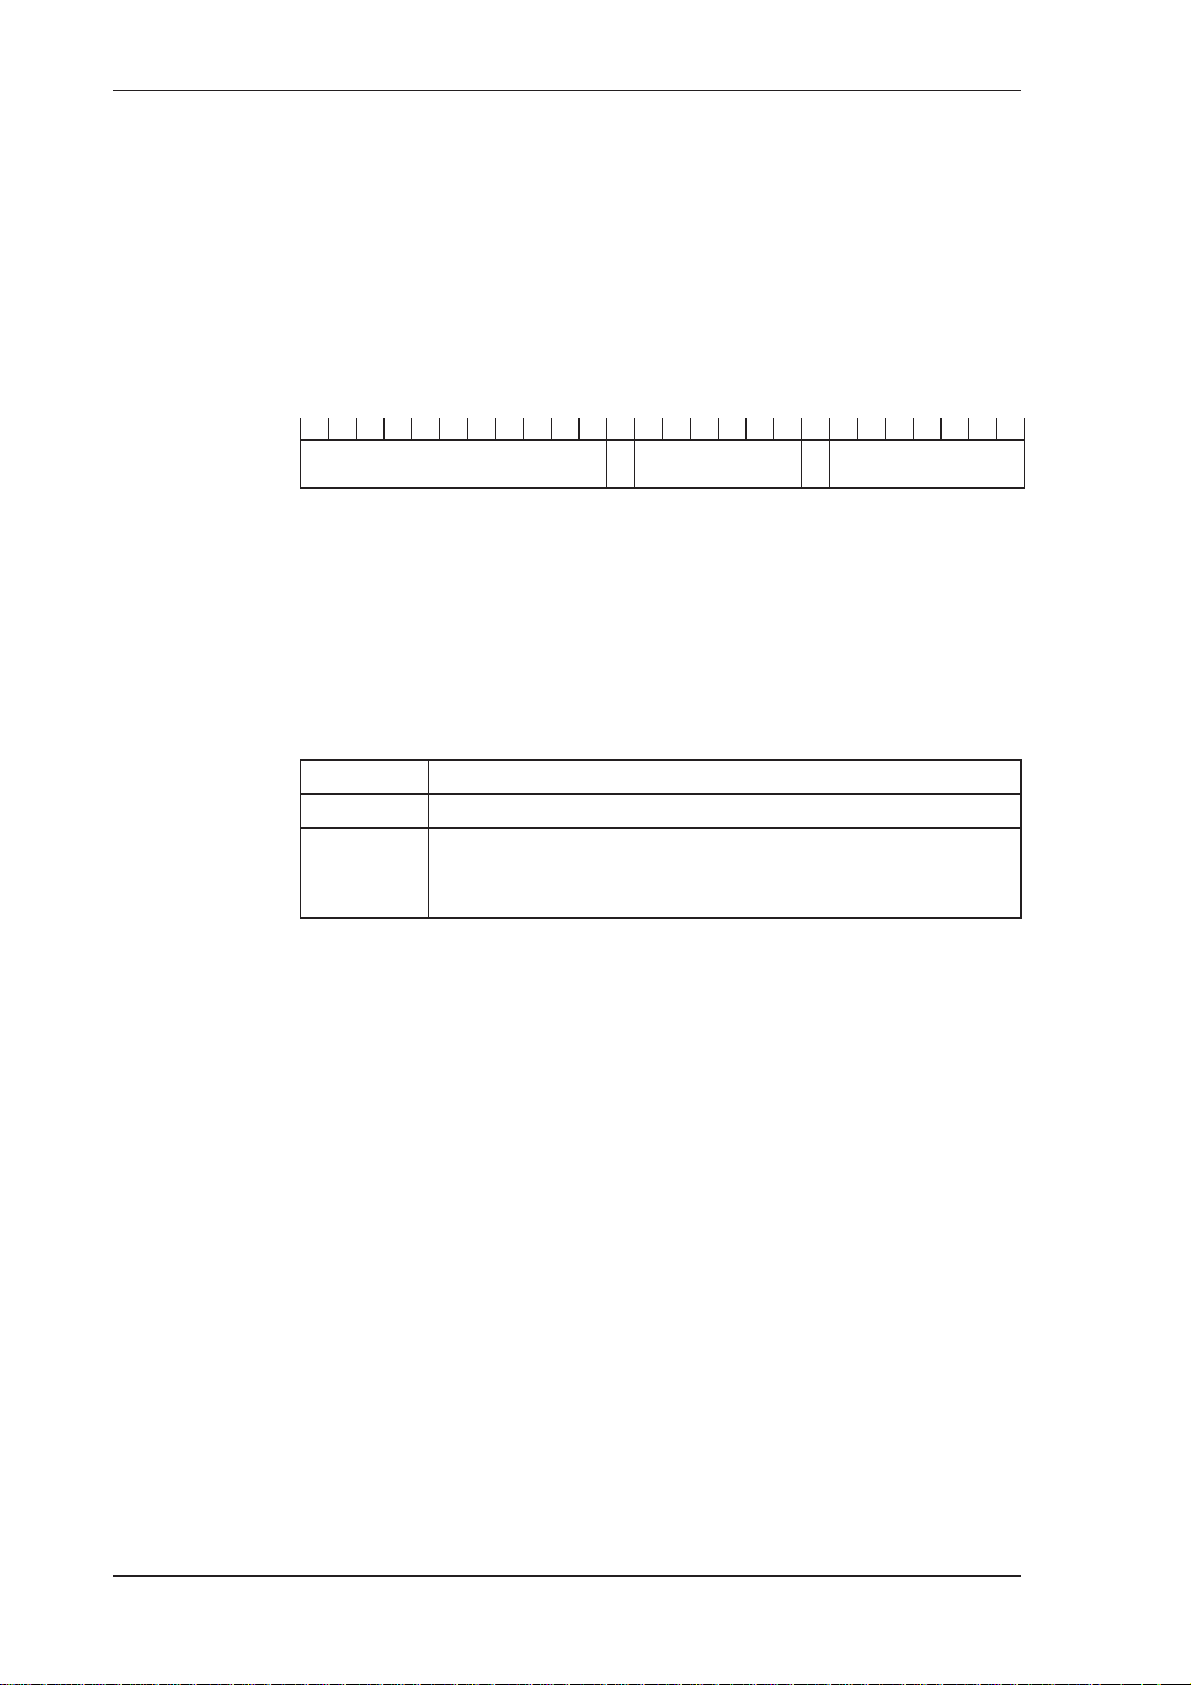
Communications
The instrument Exception Status codes that the instrument returns for the
ASCII protocol are the same as those described for the Modbus RTU
protocol in Instrument Exception Status on page 62.
Data
The format of the data variables from the instrument is as follows:
89123.456 MWh ENERGY
1 2 3 4 5 6 7 8 9 10 11 12 13 14 15 16 17 18 19 20 22 23 24 25 26 27
Value (aligned right)
Unit (aligned left)
space
Item (aligned left)
space
Note: The decimal point in the Value is always at character position 8.
Therefore whole numbers are aligned right at the decimal point, with
trailing zeroes.
Variables Request
The variables request asks the instrument to return the value of one or more
requested variables.
Command Description
:RVA? Return all variables
:RV0? …
:RV9?
Return the specific variable. The numbers relate to the
position in the variables menu. For example, V0 is Energy,
V1 is Power and so on.
Variables Request and Response Example
The following request is for the only instrument that is connected to the
communication port to return the values of all main menu variables.
:A001:RVA?
LFC
R
The following is an example of a hypothetical instrument response. Refer to
on page 25 for the list of variables that would be returned for this
application.
L
LFC
LFC
LFC
LFC
LFC
LFC
C
F
R
R
R
R
R
R
R
A001 2002/03/14 18:25:00 00
6.116 MWh ENERGY
16.573 MW POWER
1320.530 m3 VOLUME
58.300 m3/M V-FLOW
7627.117 KG MASS
344.460 KG/M M-FLOW
56 515 DG01 - 18 June 2017
Page 65
Communications
LFC
LFC
LFC
LFC
R
R
R
R
LFC
230.000 DEG C TEMP
1.260 MPA PRESS
0.174 m3/KG SP-VOL
2886.760 KJ/KG SP-ENT
R
Log Request
The log request asks the instrument how many logs it stores in the particular
timebase. These are the values described in Time Settings and Data
Logging on page 43.
Command Description
:RLH? Return the number of hourly logs
:RLD? Return the number of daily logs
:RLW? Return the number of weekly logs
:RLM? Return the number of monthly logs
:RLY? Return the number of yearly logs
:RLR? Return the number of log records (non- timebased logging)
Log Response Example
The following message asks the instrument with address 001 to return the
number of logs that the instrument stores:
:A001:RLR?
LFC
R
The instrument response would be similar to the following:
A001 2002/03/14 18:25:00 00
LFC
24
LFC
R
R
LFC
R
Clear Data Request
The clear data request asks the instrument to clear the data in the selected
registers.
Command Description
:RCL? Clear the logs except for the “last edited” log
515 DG01 - 18 June 2017 57
Page 66
Communications
Clear Data Request Example
The following message asks the instrument with address 001 to clear the
logged data that the instrument stores:
:A001:RCL?
LFC
R
The instrument response would be similar to the following:
A001 2002/03/14 18:25:00 00
LFC
R
LFC
R
Instrument Information Request
The Instrument Information request asks the instrument to return the general
information about the model and version codes. The instrument exception
status is returned as a part of the header as it is with the header for all
command responses.
Command Description
:RIG? Return the general information about the instrument such as
Model number, Application number, Version and Serial
numbers etc. These items are returned as a block in the same
format as shown on the display in the “Model Info” menu.
Instrument Information Response Example
The following message asks the instrument with address 001 to return the
general information about the instrument:
:A001:RIG?
The following is an example of a hypothetical instrument response:
A001 2002/03/14 18:25:00 00
515 MODEL -11-FSC01 INPUT F-TP-SC01 VERS 0101.001
CUSTOM VERS 000001
UNIT S/N 123456
LFC
R
1 2 3 4 5 6 7 8 9 10 11 12 13 14 15 16 17 18 19 20 21 22 23 24 25 26 27 28 29
Corrupted or Invalid Requests
If the instrument receives a corrupted or incomplete request, there is no
response. The instrument discards any partial request and waits for the next
enquiry.
LFC
R
LFC
R
LFC
R
LFC
R
LFC
R
LFC
R
LFC
R
58 515 DG01 - 18 June 2017
Page 67

If the instrument receives a request message in the correct format, but for a
non-existent option, it returns only the message header. For example, if the
instrument received the following request variables message :A001:RVT?
it will return only the header because there is no T option for the ‘Variables
Request’ message.
Modbus RTU Protocol
Modbus RTU (remote terminal unit) is an industry standard protocol that
allows the instrument to be easily interfaced to other communication
devices.
The instrument implements the Modbus protocol as detailed in the Modicon
Modbus Protocol Reference Guide PI-MBUS-300 Rev J (June 1996).
Message Format
Communications
In RTU mode, messages start with a silent interval of at least 3.5 character
times. The first field transmitted is the device address. Following the last
transmitted character, a similar interval of at least 3.5 character times marks
the end of the message. A new message can begin after this interval. The
entire message frame must be transmitted as a continuous stream. A typical
message frame is shown below:
Address Function Data CRC Check
1 byte 1 byte n bytes 2 bytes
Except for broadcast messages, when a master device sends a query to a
slave device, it expects a normal response. One of four possible events can
occur from the master’s query:
• If the slave device receives the query without a communication error, and
can handle the query normally, it returns a normal response.
• If the slave does not receive the query due to a communication error, no
response is returned. The master program has to process a timeout
condition for the query.
• If the slave receives the query, but detects a communications error (parity
or CRC), no response is returned. The master program has to process a
timeout condition for the query.
• If the slave receives the query without a communication error, but cannot
handle it (for example, if the request is to read a nonexistent register), the
slave will return an exception response informing the master of the nature
of the error.
515 DG01 - 18 June 2017 59
Page 68
Communications
Instrument Address
The address of the instrument is programmable in the range from 1 to 247.
Some addresses are reserved according to PI-MBUS-300 and have a special
meaning:
• 0 = Broadcast, no response required from slave devices
• 248 to 255 Reserved
Function Codes
The instrument accepts the following function codes:
Code Name Description
03 Read data register(s) Obtain the content of one or more 2-byte
data registers.
06 Preset data register Preset one 2-byte data register.
07 Read status register Obtain the content of 1-byte status register.
16 Preset data register(s) Preset one or more 2-byte data registers.
Exception Response
The instrument forms an exception response by adding 80H to the function
code and using an exception code as the 1-byte data field in the returned
frame. Implemented exception codes are as follows:
Code Name Description
01 Illegal function The function code is not a legal action for
the slave.
02 Illegal data address The data address is not a legal address for
the slave.
03 Illegal data value The data value is not a legal value for the
slave.
05 Acknowledge The slave has accepted the request and is
processing it, but a long duration of time
will be required to do so.
06 Slave device busy The slave is engaged in processing a long
duration program command. The master
should re-transmit the message later when
the slave is free.
60 515 DG01 - 18 June 2017
Page 69

List of Data Registers
The following list describes the addresses and meaning of the data registers
in the instrument. The data values are expressed in the engineering units that
were selected for the variables when the instrument settings were
configured. The “Data Type” for the 2-register (4-byte) data values can be
set in programming mode as Floating Point or Long Integer as described in
Communications on page 41.
The registers are grouped in blocks that relate to a particular function of the
instrument.
Note: Conventional numbering of registers often starts from 1, therefore be
aware that “register 1” in this case has “address 0” and so on.
Current and Logged Process Data
This block of registers is available for the retrieval of current or logged
process data with its matching time and date information.
Communications
Use the log type and log number to retrieve the logged information from the
appropriate register. If a particular log number does not exist, or the
instrument does not have the optional real-time clock, the time and date
stamp and associated variables are set to zero.
Register Name Comments Read Only or
Read/Write
1 Density (Line)
3 Period RDT
5 Density (Ref) R DT
7 Temperature R DT
9 Pressure R DT
11 Specific Gravity R DT
13 Z-Factor (Line) R DT
15 Z-Factor (Ref) R DT
17 Molecular Weight R DT
19 Critical Temperature R DT
21 Critical Pressure R DT
23 User Input R DT
25 User Output A R DT
27 User Output B R DT
29 Reserved R DT
31 Year
32 Month R/W I
33 Date R/W I
34 Hour R/W I
35 Minute R/W I
36 Second R I
Only current Date/Time can be edited
Process Variables
Current Date/Time or
Logged Date/Time Stamp
(see register 38 Log Number).
RDT
R/W I
Type
*
†
515 DG01 - 18 June 2017 61
Page 70
Communications
Register Name Comments Read Only or
Read/Write
37 Log Type 00 - hourly or log records
01 - daily
02 - weekly
03 - monthly
04 - yearly
05 - last edit of calibration
38 Log Number If set to 0, current variables and Date/Time are
retrieved
39 Clear Data 01 - clear logs W I
40 Reserved
R/W I
R/W I
Type
* DT = Data Type of 2-register (4 byte) values can be set as Floating Point or Long Integer values
† I = Integer (2 bytes) (Holding Registers)
Note: The Floating Point variable is represented in IEEE-754 Floating Point
4-byte format and requires two 2-byte data registers:
IEEE-754 Modicon Registers
1st byte low byte (register X)
2nd byte high byte (register X)
3rd byte low byte (register X+1)
4th byte high byte (register X+1)
This means that two data registers must be read or written to obtain, or
preset, one data value.
Instrument Exception Status
This register is available to verify the status of the instrument.
Register Name Comments Read Only or
Read/Write
41 Exception
Status
00 = no error
01 = analog input 1 failure
02 = analog input 2 failure
03 = analog input 3 failure
04 = analog input 4 failure
05 = invalid calibration parameter
06 = invalid reference parameter
07 = invalid property
08 to 09 reserved
10 = process parameters out of range
11 = input is over limit
12 = flow error detected
20 = system failure
21 = power supply is low
22 = new or failed clock battery
23 to 29 reserved
30 = alarm 1 active
31 = alarm 2 active
32 = alarm 3 active
33 = alarm 4 active
RI
Type
*
* I = Integer (2 bytes) (Holding Registers)
62 515 DG01 - 18 June 2017
Page 71
Communications
Instrument Control and I/O
This block of registers is available in some applications to give access to
monitor and/or control some of the instrument.
Register Name Comments Read Only or
Read/Write
42 Reserved
43 Logic Inputs 0 to 15 Binary representation of logic inputs
B0 = 0/1 (LSB) input 1 activated/deactivated
B1 = 0/1 input 2 activated/deactivated
B2 = 0/1 input 3 activated/deactivated
B3 = 0/1 input 4 activated/deactivated
44 Operation Mode Representation of operation mode
0 = Idle/Local Idle state
45 Relay State 0 to 15 Binary representation of relay state.
0 = open; 1 = closed.
B0 = relay 1 (LSB)
B1 = relay 2
B2 = relay 3
B3 = relay 4
46 Relay Control 0 to 15 Binary representation of relay control.
0 = open; 1 = close.
B0 = relay 1 (LSB)
B1 = relay 2
B2 = relay 3
B3 = relay 4
47 Relay Control
Source
0 to 15 Binary representation of relay control source.
0 = Local (controlled by instrument operation) 1 = RTU
(controlled by Modbus register 46).
RI
RI
RI
R/W I
R/W I
Type
*
B0 = relay 1 (LSB)
B1 = relay 2
B2 = relay 3
B3 = relay 4
48 Reserved R L
51 to 99 Reserved
101 Analog Inp.1 Raw analog input data.
103 Analog Inp.2 R DT
105 Analog Inp.3 R DT
107 Analog Inp.4 R DT
4-20mA inputs are read in Amperes.
0-5V or 1-5V inputs are read in Volts
RTD inputs are read in degrees Kelvin.
Unused inputs are configured as 4-20mA.
RDT
* I = Integer (2 bytes) (Holding Registers)
† L = Long Integer (2 register = 4 bytes)
‡ DT = Data Type of 2-register (4 byte) values can be set as Floating Point or Long Integer values
†
‡
515 DG01 - 18 June 2017 63
Page 72

Communications
Printer Protocol
A printer protocol is available in the 500 Series. It provides the ability to
print out live data, individual logged data and to do some report-style
printing of logged data. The method of printing these and the format of the
printouts is described below.
Note: Printer output is only available if the Real Time Clock option is fitted.
The selection of Printer Protocol can be made for the Communications
Protocol options for the RS232 or RS485 port. A list of log report types and
printer types available at the end of the TM-LOG calibration menu.
Report Types
The list of report types is as follows:
• REP-01 Hourly Logs Report
• REP-02 Daily Logs Report
• REP-03 Weekly Logs Report
• REP-04 Monthly Logs Report
• REP-05 Yearly Logs Report
• REP-06 Previous Day Hourly Logs (0Hr – 23Hr, minimum 48
hourly logs required)
The number of logs printed in each report is determined by the values
programmed in the TM-LOG menu.
Printer Types
The list of available printers is as follows:
• PRN-01 Generic computer printer
• PRN-02 Generic roll printer (printing first line first)
• PRN-03 Slip Printer TM295
• PRN-04 Label (roll) printer - Citizen CMP30L
Customizing a Printout
A customized printout can be provided which can have up to 4 header lines
and 3 footer lines. It is also possible to include or exclude each main menu
items on the printout. If any customizing of the printout is required discuss
this with the distributor.
64 515 DG01 - 18 June 2017
Page 73

Types of Printouts
Live Data
The key, when in main menu, is shared as the PRINT key if the printer
protocol has been selected. A printout will be initiated whenever this key is
pressed. If printing is not required, do not select printer protocol.
The format of this printout will be:
Custom Header Line 1
Custom Header Line 2
Custom Header Line 3
Custom Header Line 4
Current Docket No.
Instrument Serial No. & Tag
Communications
Current Date & Time & Status
Variable unit value
Variable unit value
etc.
Custom Footer Line 1
Custom Footer Line 2
Custom Footer Line 3
------------------------------------------- <separation line>
(Note that blank header and footer lines are not printed).
Docket Number
The docket number that appears on the live data printout indicates the print
number. The DOCKET RESET parameter allows this number to be cleared
if required.
DOCKET No. 000256
Instrument Serial Number and Unit Tag
The instrument serial number and unit tag is the same as the information
shown in the Model Info menu. For more details refer to Model
Information on page 25.
515 DG01 - 18 June 2017 65
Page 74

Communications
Individual Log Data
When in the Log Menu and while holding the DISPLAY key to view the
data of the log of interest the key can be pressed to initiate a printout
of that log entry. The printout will have the time and date stamp
corresponding to when the log was taken. After the print has been initiated
there will be the opportunity to scroll to view another log entry and print
again.
The format of the printout is the same as the LIVE DATA printout:
Custom Header Lines
Instrument Serial No. & Tag
Log Date & Time & Status
Variable unit value
Variable unit value
etc.
Custom Footer Lines
-------------------------------------------- <separation line>
Log Report Printing
As there is the likelihood that the reports can be of a considerable length it
is strongly recommended that only the 80 Column printer with Z fold
(tractor feed) paper be used. This is just as much for the memory storage of
printer as it is for the reliable paper supply.
There is a HOLD.SET REPORT PRINT prompt under the main menu with
the ability to print the pre-selected type of report. Pressing and holding the
SET key for two seconds will initiate the printout. Any of the Log Reports
will have the following format:
Custom Header Lines
Title of Report <internally set, indicates report type>
Current Date & Time
Instrument Serial No. & Tag
-------------------------------------------- <separation line>
Log No. Date & Time & Status
Variable unit value
Variable unit value
etc.
66 515 DG01 - 18 June 2017
Page 75

Communications
-------------------------------------------- <separation line>
Log No. Date & Time & Status
Variable unit value
Variable unit value
etc.
-------------------------------------------- <separation line>
Log No. Date & Time & Status
Variable unit value
Variable unit value
ETC
Custom Footer Lines
-------------------------------------------- <separation line>
Reports will print in the historical order, and for those logs that have no data
(e.g. unit was powered off at the time) the print will show “Data not
available”. i.e.
Log No. Date & Time & Status
Variable unit value
Variable unit value
etc.
-------------------------------------------- <separation line>
Log No. Data Not Available
-------------------------------------------- <separation line>
Log No. Date & Time & Status
Variable unit value
Variable unit value
etc.
If the unit is programmed for 0 logs for a particular time base then the report
for that time base will only consist of the header and ID information and a
“Data Not Available” message. Likewise for the 0Hr to 23Hr report to print
the complete report there must be a minimum of 48 hourly logs programmed
otherwise “Data Not Available” will be printed for the missing logs.
Custom Header Lines
Title of Report
Current Date & Time
Instrument Serial No. & Tag
Data Not Available
Custom Footer Lines
-------------------------------------------- <separation line>
515 DG01 - 18 June 2017 67
Page 76

Communications
Printer Data Control
Some printers have limited data buffers and are therefore unable to collect
all the print data being transmitted. The 500 Series has the capability of
software handshaking. The Xon/Xoff characters can be used by any of the
printer types to control the flow of data to ensure that data is not lost.
Some printers will also transmit an Xoff character in response to other
events such as printer being off-line, print head not engaged or power being
removed. The specific behaviour of the printer being used should be noted.
Error Messages
There are two printer error messages that can be displayed.
PAPER OUT
This message is related to the Printer Type PRN-03 TM295 Slip printer. It
is standard procedure with this printer to check for paper status before
printing. If a print is attempted but there is no paper the PAPER OUT
message will be scrolled. The instrument will continue to poll the printer for
paper and if paper is detected before a communications timeout expires the
print will commence.
COMMS TIMEOUT
This message is relevant for all printer types and will be activated for the
following conditions.
1. If the flow of data is stopped due to software or hardware handshaking
and is not allowed to resume before the communications timeout.
2. If Printer Type is PRN-03 Slip printer and a paper status is requested but
no response is received within the timeout period.
3. Paper Out has been detected for Printer Type PRN-03 but no paper is
inserted within the timeout period.
When a communications timeout error has been activated the message
COMMS TIMEOUT will be scrolled once, the request to print will be
cleared and the instrument will return to its normal mode.
68 515 DG01 - 18 June 2017
Page 77

Appendix A
Glossary
Glossary
ASCII American Standard Code for Information Interchange. For the ASCII
protocol, the instrument receives and transmits messages in ASCII, with all
command strings to the instrument terminated by a carriage return. Replies
from the instrument are terminated with a line-feed and a carriage-return.
Absolute
Pressure
Atmospheric
& Gauge
Pressure
IrDA The Infra-red Developers Association is a group of computer and software
Modbus RTU The Modbus protocol is a message structure for communications between
Absolute Pressure = Atmospheric Pressure + Gauge Pressure.
It is the combined local atmospheric pressure and the gauge pressure. All
calculations are based on absolute values for pressure. Some sensors can
directly measure the absolute pressure value while others measure gauge
pressure. Pressure can be displayed as absolute or gauge and is indicated
with an ‘A’ or ‘G’ appended to the pressure units of measure.
Some sensors only measure gauge pressure, in this case the atmospheric
pressure must be programmed to determine the absolute value. The
atmospheric value is affected by the altitude of the installation. The
atmospheric pressure default is 101.325 kPa (14.696 psia) which is the
standard value at sea level.
manufactures who have agreed on a format for communication among
infrared devices.
controllers and devices regardless of the type of network. In RTU (remote
terminal unit) mode, each 8-bit byte in a message contains two 4-bit
hexadecimal characters. This mode has greater character density than
ASCII and allows better data throughput than ASCII for the same baud rate.
Molar Mass Molar mass is the molecular weight, which is the mass of one mole of the
substance.
Normal
Conditions
Normal conditions are defined as:
• 0°C (273.15 K) and 101.325 kPa
• 32°F (491.67°R) and 14.696 psia.
A flow rate at normal conditions is indicated with an ‘N’ in the front of the
corrected volume units of measure. Compare with Standard conditions.
515 DG01 - 18 June 2017
69
Page 78

Normalised
Input
A normalised input ranges from 0 to 1.000. For 4-20 mA input, the signal is
set to 0 at 4 mA and the signal is set to 1.000 at 20 mA.
Passive Output
Signal
RTD Resistance Temperature Device
Specific
Gravity
Standard
Conditions
Universal Gas
Constant (R)
Requires an external power supply.
Specific Gravity is the ratio of the molar mass of a gas to the molar mass of
air.
Standard condition are defined as:
• 15°C (288.15 K) and 101.325 kPa, or
• 59°F (518.67°R) and 14.696 psia.
The Universal Gas Constant is used in the calculation of density at flowing
conditions. (8.314510 J/(mol*K)
70 515 DG01 - 18 June 2017
Page 79
Appendix B
Model Numbers
Product Codes
Model Supplementary Code Description
515 . - DG01
1
2
Enclosure
Output Options
Relay Type
Power Supply
Display Panel Options S
PCB Protection
Application Pack Number DG01
For example: Model No. 515.111USC
Displayed on the 500 Series as:
Note: The first character represents the CPU installed
(factory use only). The remaining 6 characters only
represent hardware that affects the operation.
3/5
4/6
0
1
2/3
1
2
3
U
D
C
N
Panel mount enclosure
Field mount enclosure (NEMA 4X / IP66)
Explosion proof Ex d (IECEx/ATEX), metric glands
(5 specifies heater)
Explosion proof Ex d (CSA), NPT glands
(6 specifies heater)
4 logic inputs, 1 isolated output, 2 relays (only relay type 1 is
available), RS232 (DB9) communication port
4 logic inputs, 2 isolated outputs, 4 relays, real-time clock data
logging, RS232 (DB9) and RS485 communication ports
4 logic inputs, 2 isolated outputs, 4 relays, real-time clock data
logging, RS232 (DB9) and Ethernet/RF communication ports
(not yet available)
Electromechanical relays only
2 electromechanical and 2 solid state relays
Solid state relays only (not yet available)
Inputs for 12-28VDC and 100-240 VAC, 50-60Hz
(Previous Models: A = 110/120 VAC, E = 220/240 VAC)
Input for 12-28VDC power only
Standard option (now with backlight & LCD backup)
(original Full option: F, with Infra-Red comms, no longer available)
Conformal coating - required for maximum environmental
operating range. Recommended to avoid damage from
moisture and corrosion.
None - suitable for IEC standard 654-1 Climatic Conditions up
to Class B2 (Heated and/or cooled enclosed locations)
Defines the application software to be loaded into the
instrument
2-1--S-
515 MODEL
Note: Example full product part number is 515.111USC-DG01 (This is the number used for
placing orders).
515 01 - 18 June 2017
71
Page 80
Custom Version Codes
Code Description
00 Factory Default Application
01 Contrec Systems Pty. Ltd. Melbourne Australia
02 Contrec Limited. West Yorkshire UK
Origin Code
Identifies
Distributor
User Language
Distributor’s Code
03
04 Contrec - USA, LLC. Pelham AL 35124 USA
05 Flowquip Ltd. Halifax UK
06
etc.
0 English (Default)
1 German
2 Dutch
3 French
4 Spanish
5
etc.
000
Distributor’s own choice. Possibly a code that identifies the
…
customer and the application.
999
For example: 02 3 157
Displayed on the 500 Series as:
023157
CUSTOM VERS
Application Information Code
The Application Information code is an aid for users and service personnel to determine the type
of inputs that are used in a particular application. The Application Information code is displayed
on the instrument as shown below.
Assignment type
F-tP--
SC01 INPUT
Application number
72 515 01 - 18 June 2017
Page 81

The Application number identifies the application as in the following examples:
• SC01 - steam flow computer for frequency flow meter
• GN02 - natural gas flow computer for analog flow meter
The Input Assignment type indicates the physical input that is assigned to each input on the
instrument. The code is made up from six characters as follows:
FINP1 FINP2 AINP1 AINP2 AINP3 AINP4
XXXXXX
The codes are as follows:
• - - not used in this application
• A - indicates a generic analog input such as level
• d - indicates a density input
• F - indicates a generic flow input such as for volume or mass, (frequency or analog)
• H - indicates a high flow input for stacked inputs
• L - indicates a low flow input for stacked inputs
• P - indicates a pressure input
• q - indicates a quadrature input
• t - indicates a temperature input.
For example,
input, AINP1 assigned to a temperature input and AINP2 assigned as a pressure input. The other
inputs are not used.
F-tP-- is an instrument with FINP1 (frequency input 1) assigned to a flow
515 01 - 18 June 2017 73
Page 82

Appendix C
Units of Measurement
Available Units of Measurement
The following is a list of the available units of measurement used across the range of 500 Series
applications.
Units Type Available units of measurement
Volume m3, Km3, Ltr, mL,Gal, KGal, MGal, ft3, kft3, Mft3, bbl
Volume Flowrate m3/s, m3/min, m3/h, m3/D, L/s, L/min, L/h, L/day, mL/s, mL/min, mL/hr, Gal/s, Gal/min, Gal/h,
KGal/D, MGal/D, ft
3
Volume K-Factor P/m
Mass kg, g, Ton, lb, Klb
Mass Flowrate kg/s, kg/min, kg/h, g/s, g/min, g/h, Ton/min, Ton/h, Ton/D, lb/s, lb/min, lb/h, Klb/min, Klb/h,
Mass K-Factor P/kg, P/g, P/Ton, P/lb, P/Klb
Energy kJ, MJ, GJ, kWh, MWh, kBTU, Ton.h, therm, cal, kcal, Mcal
Power kJ/h, MJ/h, GJ/h, kW, MW, kBT/M, kBT/h, Ton, therm/min, therm/h, kcal/h, Mcal/h
Energy K-Factor P/kJ, P/kWh, P/kBTU, P/Ton.h, P/therm, P/kcal
Temperature Deg K, Deg C, Deg F, Deg R
Pressure Pa, kg/m
Density kg/m3, kg/Ltr, lb/ft3, SG60F
Specific Volume m3/kg, L/kg, ft3/lb
Specific Enthalpy kJ/kg, BT/lb, cal/g, cal/kg, kcal/kg, Mcal/kg
Reynolds Number E+0, E+3, E+6 (scaling for unitless variable)
, P/Ltr, P/mL, P/Gal, P/ft3, P/bbl
Klb/D
2
, kg/cm2, kPa, MPa, mbar, bar, psi, Atm, inH2O, mmH2O
3
/s, ft3/min, ft3/h, Mft3/D, bbl/s, bbl/min, bbl/h, bbl/D
Length (Level) m, mm, cm, INCH, FOOT
Velocity m/s, m/M, m/h, ft/s, ft/M, ft/h
Length K-Factor P/m, P/cm, P/INCH, P/FOOT
Area m2, ft
Ratio %
General Input Pressure, Temperature, Density, Length (Level), Factor
2
74 515 01 - 18 June 2017
Page 83
Appendix D
Reference Tables
Properties of Selected Gases
Gas Specific
Gravity
SG °C °F kPa psia
Acetylene 0.8990 35.15 95.27 6114 886.76 0.189
Air 1.0000 -140.90 -221.62 3747 543.46 0.035
Ammonia 0.5880 132.25 270.05 11353 1646.61 0.257
Argon 1.3793 -122.29 -188.12 4898 710.39 -0.002
Butane 2.0054 151.97 305.55 3796 550.56 0.200
Carbon Dioxide 1.5196 30.97 87.75 7374 1069.51 0.225
Carbon Monoxide 0.9671 -140.30 -220.54 3494 506.76 0.045
Chlorine 2.4482 143.85 290.93 7700 1116.79 0.069
Ethane 1.0382 32.17 89.91 4872 706.62 0.099
Ethylene 0.9686 9.19 48.55 5041 731.14 0.087
Helium 0.1381 -267.96 -450.32 227 32.92 -0.390
Critical Temperature Critical Pressure Acentric
Factor
Hydrogen 0.0696 -240.17 -400.30 1293 187.53 -0.217
Hydrogen Chloride 1.1898 51.54 124.78 8310 1205.26 0.132
Hydrogen Sulphide 1.1767 100.25 212.45 8963 1299.97 0.090
Methane 0.5559 -82.59 -116.66 4599 667.03 0.011
Neon 0.6969 -228.75 -379.75 2760 400.30 -0.016
Nitrogen 0.9672 -146.95 -232.51 3398 492.84 0.037
Nitrous Oxide 1.5199 36.45 97.61 7255 1052.25 0.142
Oxygen 1.1048 -118.57 -181.42 5043 731.43 0.022
Propane 1.5226 96.68 206.02 4248 616.12 0.152
515 01 - 18 June 2017 75
Page 84

76 515 01 - 18 June 2017
Page 85

Index
Numerics
0-5V input
14
4-20mA
15
input
output 17
A
address, instrument
alarm
connection
18
equipment failure 40
hysteresis 41
relays 39
setpoint 40
alarms menu 40
analog input
connections
14
failure 48
scaling 4
application code 72
approvals 6
FCC Declaration 7
ASCII protocol 54
B
back panel
12
battery
49
failed
life 43
new 49
baud rate 42
C
calibration
30
menu
set mode 28
view mode 27
clock
battery
43
date format 44
real-time 43
54
codes
application information
customer version 72
exception 62
product number 71
communication
connections
19
protocols 53
communications 5, 51
menu 41
connections
18
alarm
communication 51
communications 19
electrical 12
input 13
output 17
customer version codes 72
customizing a printout 64
D
daily logging
44
data log
viewing
23
data logging
44
daily
hourly 44
monthly 45
weekly 44
yearly 45
date format 44
declaration FCC 7
default on exception 48
default variable 21
display
specifications
9
timeout mode 46
timeout time 46
DISPLAY key 21
display-only parameter 27
72
515 DG01 - 18 June 2017
77
Page 86

E
earthing
20
electrical connections 12
equations of state 2, 3
equipment failure alarm 40
error condition, override 48
error messages 48
exception codes 62
Exception Status 56
exception, default 48
inputs menu 35
installation 11
instrument
address
54
request format 54
responses 55
settings 32
interconnections, communication 51
interference suppression 19
isolated outputs 5
F
failure of input
48
features 1
flash driver port assignment 43
format, date 44
frequency input connection 13
front panel
infra-red port
20
keys 21
LEDs 21
G
gas equation
Ideal Gas
2
Peng-Robinson 3
Redlich-Kwong 3
Soave-Redlich-Kwong 3
gas equations 2, 3
gas properties 75
glossary 69
H
hardware connections
51
hourly logging 44
hysteresis, alarm 41
I
infra-red port
20, 41, 53
input
14
0-5V
4-20mA 15
connections 13
analog 14
frequency 13
failure 48
RTD 15
sensor failure 48
types 6
K
key
DISPLAY
21
SET 23
keys, front panel 21
L
LEDs, status
21
logged data 23
viewing 23
logging
44
daily
hourly 44
monthly 45
weekly 44
yearly 45
logic input connection 16
M
main menu items
22
menu
alarms
40
calibration 30
comms 41
inputs 35
outputs 39
params 33
setup 46
test 47
tm/log 43
units 32
messages
48
error
system 48
warning 50
meter factor 23
Modbus data format 42
Modbus RTU protocol 59
78 515 DG01 - 18 June 2017
Page 87

mode
display timeout
46
normal operation 21
set calibration 28
view calibration 27
model numbers 71
monthly logging 45
mounting 11
N
normal operation
21
number
model
71
serial 25
O
operation, normal
21
output
connections
17
4-20mA 17
outputs menu 39
override error condition 48
P
panel
21
LEDs
mounting 11
rear 12
parameter
display-only
27
not visible 27
password-protected 27
programmable 27
parameters menu 33
parity bits 42
password-protected parameter 27
port
assignment, flash driver
43
flash driver assignment 43
infra-red 20, 41, 53
RS-232 19, 41, 51
RS-485 20, 41, 52
power supply interruption 43
printer
data control
68
error messages 68
protocol 64
report types 64
printer types 64
printouts
individual logs
66
live data 65
log report 66
types 65
product number codes 71
programmable parameters 27
properties of gases 75
protocol
ASCII
54
communication 53
Modbus RTU 59
printer 64
R
real-time clock
43
rear panel 12
relay outputs 5
relays, alarm 39
responses, instrument 55
RS-232 port 19, 41, 51
RS-485 port 20, 41, 52
RTD input 15
RTU protocol 59
S
scaling analog input
4
serial number 25
SET key 23
setpoint, alarm 40
settings
instrument
32
setup menu 46
shielding 20
snubber 19
specific gravity 75
specifications 9
standards 6
status LEDs 21
stop bits 42
suppression, interference 19
system
48
errors
messages 48
warnings 50
T
terminal designations
12
test menu 47
515 DG01 - 18 June 2017 79
Page 88

timeout
46
mode
time 46
tm/log menu 43
U
unit tag
25
units
32
menu
V
variable, default
21
version, customer 72
view data logs 23
W
warnings
50
weekly logging 44
Y
yearly logging
45
80 515 DG01 - 18 June 2017
 Loading...