

Page 1

Multi-parameter Veterinary monitor
C80
User Manual
Shenzhen Comen Medical Instruments Co., Ltd.
Page 2

I
Copyright
Ver sio n: A
Time: 2012 /09
Part No. 046-000333-00
Statements
Our Company makes no warranty of any kind with regard to this material, including(but not
limited to) the implied warranties of merchantability and fitness for a particular purpose. Our
Company assumes no responsibility for any errors that may appear in this document, or for
incidental or consequential damage caused by the providing, performance and using of this
manual.
This manual includes the proprietary information which is protected by the copyright law. All
rights reserved, any part of this manual can not be copied or photocopied by any form or method
without the consent of the Our Company.
Responsibility of the Manufacturer
Our Company only considerers itself responsible for the safety, reliability and performance of the
instrument under the following situations, as:
♦ Assembly operations, extensions, re-adjustments, improvements and repairs are all
conducted by the personnel authorized by Our Company
♦ The related electrical equipment complies with the national standards
♦ Theinstrument is used in accordance with the instruction for use.
Note: This device is not intended for home use.
Warning :
This device is not intended for treatment.
Note: Nowadays, Our Company will provide the circuit diagram conditionally if the user requests
and in addition list to instruct the calibration methods and other information so as to help the user
to repair the parts which have been classified by the Our Company that the user can repair with
appropriate and qualified personnel.
Guide to Labels in the Manual
Warning :
The information you should know for how to avoid the damage that the patients and
Page 3

II
medical staff may suffer.
Caution :
You should know the information for how to avoid the damage the equipment may
suffer.
Note: The important information you should know.
Page 4

III
Contents
Chapter1 General Information ............................................................................................... 1
1.1 General Information .................................................................................................. 2
1.2 Button Functions and Basic Operations .................................................................... 3
1.3 Screen display ........................................................................................................... 4
1.4 External Socket ......................................................................................................... 9
1.4.1 Left Panel .......................................................................................................... 9
1.4.2 Right Panel ........................................................................................................ 9
1.4.3 Rear Panel ....................................................................................................... 10
1.5 Built-in charge battery ............................................................................................. 11
Chapter2 Monitor Assembly ................................................................................................. 12
2.1 Open Package and Check ........................................................................................ 12
2.2 Connect with AC Cable ........................................................................................... 12
2.3 Power on ................................................................................................................. 13
2.4 Connect with Sensor ............................................................................................... 13
2.5 Check Recorder ....................................................................................................... 13
Chapter3 System Menu ......................................................................................................... 14
3.1 PATIENT MANAGE .............................................................................................. 14
3.2 Survey setup ............................................................................................................ 16
3.3 SELECTION ........................................................................................................... 16
3.3.1 ALARM Volume ............................................................................................. 16
3.3.2 HEART BEAT VOLUME ............................................................................... 17
3.3.3 KEY VOL (Keyboard Vol ) ............................................................................. 17
3.3.4 LCD LIGHT(LCD Brightness) .................................................................... 17
3.4 MONITOR SETUP (Monitor Setting) .................................................................... 17
3.4.1 ALARM SETUP ............................................................................................. 18
3.4.2 RECORD (Record output setting) ................................................................... 18
3.4.3 TIME SETUP (System Time Setting) ............................................................. 19
3.4.4 3.4.4 NURSE CALL SETUP .......................................................................... 19
3.4.5 MODULE SETUP .......................................................................................... 19
3.5 WORK INTERFACE SELECTION ....................................................................... 20
3.6 TREND SCREEN ................................................................................................... 20
3.7 TREND TABLE (TREND Figure) .......................................................................... 21
3.8 NIBP RECALL ....................................................................................................... 22
3.9 Reviewing alarm ..................................................................................................... 23
3.10 WAVE RECALL ..................................................................................................... 25
3.11 INFO (Monitoring Information).............................................................................. 25
3.12 DRUG CALCULATION & TITRATION LIST ..................................................... 26
3.13 Maintenance ............................................................................................................ 26
3.14 DEMO (Password: 5188) ........................................................................................ 26
3.15 SCR LOCK(screen lock) ......................................................................................... 27
Chapter4 System Work Interface ......................................................................................... 28
4.1 Work Interface Selection ......................................................................................... 28
Page 5

IV
4.1.1 STANDARD ................................................................................................... 28
4.1.2 LIST FACE ..................................................................................................... 28
4.1.3 TREND SCREEN ........................................................................................... 29
4.1.4 OxyCRG SCREEN ......................................................................................... 30
4.1.5 BIG FONT INTERFACE ................................................................................ 31
4.1.6 7-CH MULTI-LEADS DISPLAY ................................................................... 32
4.1.7 ANESTHESIA-GAS SCREEN (optional) ...................................................... 33
Chapter5 Recording ............................................................................................................... 34
5.1 General Information on the Recorder ...................................................................... 34
5.2 Record Type ............................................................................................................ 34
5.2.1 Real-time record .............................................................................................. 34
5.2.2 Frozen waveform record ................................................................................. 35
5.2.3 The contents of the real time recording ........................................................... 35
5.3 Operation and Status Information of Recorder ....................................................... 35
5.3.1 Requirements on record paper ......................................................................... 35
5.3.2 Normal service ................................................................................................ 35
5.3.3 Insufficient paper ............................................................................................ 35
5.3.4 Paper loading procedures ................................................................................ 36
5.3.5 Solution to paper jam ...................................................................................... 36
Chapter6 T rend ...................................................................................................................... 37
6.1 TREND GRAPH (TREND Diagram) ..................................................................... 37
6.1.1 Select trend diagrams for various parameters to be displayed: ....................... 38
6.1.2 Select 1-hour or 120-hour TREND diagrams: ................................................. 38
6.1.3 Observe TREND diagrams of later or earlier duration: .................................. 38
6.1.4 Change the display zoom ................................................................................ 38
6.1.5 Obtain the TREND data at certain time in the current TREND diagram ........ 38
6.1.6 Operation sample ............................................................................................ 39
6.2 TREND TABLE (TREND Figure) .......................................................................... 39
6.2.1 Select TREND Figures in various resolutions ................................................. 40
6.2.2 Observe earlier or later TREND curves .......................................................... 41
6.2.3 Observe TREND data of various parameters .................................................. 41
6.2.4 Operation sample ............................................................................................ 41
6.3 NIBP RECALL ....................................................................................................... 41
Chapter7 Drug Calculation & Titration List ....................................................................... 43
7.1 DRUG CALC .......................................................................................................... 43
7.2 TITRATION ............................................................................................................ 45
Chapter8 Alarm...................................................................................................................... 47
8.1 Alarm Type .............................................................................................................. 47
8.2 Alarm Level ............................................................................................................ 47
8.3 Alarm Mode ............................................................................................................ 48
8.4 Lighting Alarm ........................................................................................................ 48
8.5 Sound Alarm ........................................................................................................... 48
8.6 Alarm Information .................................................................................................. 49
8.7 Alarm Parameter Flashing ....................................................................................... 49
Page 6

V
8.8 Icon of Alarm Status ................................................................................................ 49
8.9 Setting the upper and lower limits of alarm ............................................................ 50
Chapter9 Patient Safety ......................................................................................................... 51
9.1 Environment ............................................................................................................ 51
9.2 Power Source .......................................................................................................... 51
9.3 Monitor earthing ..................................................................................................... 52
9.4 Equal-potential earthing .......................................................................................... 52
9.5 Condensation ........................................................................................................... 52
9.6 Explanations on Symbols Used in the Monitor ....................................................... 53
Chapter10 Maintenance & cleaning ....................................................................................... 54
10.1 Maintenance check .................................................................................................. 54
10.2 Cleaning and Sterilization ....................................................................................... 54
10.2.1 Note on Cleaning and Sterilization ................................................................. 54
10.2.2 Cleaning .......................................................................................................... 55
10.2.3 Sterilization ..................................................................................................... 55
Chapter11 ECG Monitoring .................................................................................................... 57
11.1 Definition of ECG Monitoring ................................................................................ 57
11.2 Attentions during ECG Monitoring ......................................................................... 57
11.3 Monitoring Procedures ............................................................................................ 58
11.3.1 Preparation ...................................................................................................... 58
11.3.2 Install ECG leads ............................................................................................. 59
11.3.3 ECG lead connection recommended for surgery patients ............................... 60
11.3.4 Use the 5-lead ECG device. ............................................................................ 61
11.4 ECG Hot Key .......................................................................................................... 61
11.5 ECG Menu .............................................................................................................. 63
11.5.1 ECG setting in parameter area ........................................................................ 63
11.5.2 ECG setting in waveform area ........................................................................ 64
11.5.3 ECG setting in measurements ......................................................................... 66
11.5.4 About ST Monitoring ...................................................................................... 67
11.5.5 Arrhythmia Analysis ....................................................................................... 71
11.6 ECG Alarms & Reminders ...................................................................................... 75
Chapter12 RESP Measurement .............................................................................................. 78
12.1 Measure RESP ........................................................................................................ 78
12.1.1 How to measure RESP .................................................................................... 78
12.1.2 Setting of RESP monitoring ............................................................................ 78
12.2 RESP Setting in parameter area .............................................................................. 79
12.3 RESP setting in waveform area ............................................................................... 81
12.4 RESP setting in measurements ................................................................................ 81
12.5 RESP alarm information and prompt information .................................................. 82
12.6 Maintenance & Cleaning ......................................................................................... 83
Chapter13 SpO2 Monitoring ................................................................................................... 84
13.1 Definition of SpO2 Monitoring ............................................................................... 84
13.1.1 Principle for Measurement of SpO2 Volume Recording Parameter ................ 84
13.1.2 BOS/Pulse Monitoring .................................................................................... 84
Page 7

VI
13.2 Precautions in SpO2/Pulse Monitoring ................................................................... 85
13.3 Monitoring Procedures ............................................................................................ 86
13.4 Measurement restriction .......................................................................................... 87
13.5 SpO2 Setting in the parameter area ......................................................................... 88
13.6 SPO2 setting in waveform area ............................................................................... 89
13.7 SPO2 setting in measurements ................................................................................ 89
13.8 Alarms & Reminders ............................................................................................... 90
13.9 Maintenance & Cleaning ......................................................................................... 92
13.9.1 Cleaning: ......................................................................................................... 93
Chapter14 NIBP Monitoring ................................................................................................... 94
14.1 General Information ................................................................................................ 94
14.2 NIBP Monitoring..................................................................................................... 94
14.2.1 NlBP Measurement ......................................................................................... 94
14.2.2 Operational guide ............................................................................................ 97
14.2.3 Measurement restriction .................................................................................. 98
14.2.4 NIBP Parameter Setting & Adjustment ........................................................... 99
14.3 NIBP setting in parameter area ............................................................................... 99
14.4 NIBP setting in measurements .............................................................................. 101
14.5 NIBP Pressure Calibration .................................................................................... 102
14.6 Gas leakage detection ............................................................................................ 103
14.7 NIBPAlarms & Reminders .................................................................................... 104
14.8 NIBP alarm information ........................................................................................ 107
14.9 Maintenance & Cleaning ....................................................................................... 107
14.9.1 Recyclable blood pressure cuff ..................................................................... 107
14.9.2
One-time blood pressure cuff ........................................................................ 108
Chapter15 TEMP Monitoring ............................................................................................... 109
15.1 TEMP Monitoring ................................................................................................. 109
15.1.1 TEMP measurement setting .......................................................................... 109
15.2 TEMP setting in parameter area ............................................................................ 110
15.3 TEMP setting in measurements ............................................................................. 111
15.4 Alarm information and prompt information .......................................................... 111
15.5 Maintenance & Cleaning ....................................................................................... 112
Chapter16 CO2 Monitoring .................................................................................................. 114
16.1 General .................................................................................................................. 114
16.2 Measuring Principle and Working Process ............................................................ 115
16.3 Operating Instruction for CO
2
Connection ............................................................ 115
16.4 CO
2
Measurement Procedures .............................................................................. 118
16.4.1 Measuring Procedure of RESPIRONICS Branded Mainstream and Sidestream
Modules 118
16.4.2 Measuring Procedure of PHASEIN Branded Sidestream and Mainstream
Analyzers ...................................................................................................................... 121
16.5 CO2 Settings in Parameter Area ............................................................................ 123
16.6 CO2 Settings in Waveform Area ........................................................................... 125
16.7 CO
2
Settings in Measurement Setup ..................................................................... 125
Page 8

VII
16.8 Discharging Waste Gases ...................................................................................... 126
16.9 Maintenance and Cleaning of RESPIRONICS Branded Mainstream and Sdestream
Modules 127
16.9.1 Common Cleaning ........................................................................................ 127
16.9.2 Airway Adapter for Cleaning Reusable Mainstream Sensor ......................... 127
16.9.3 Method for Sterilizing Reusable Adapter ...................................................... 127
16.9.4 Sterilization Times for Reusable Airway Adapter ......................................... 128
16.9.5 Zeroing .......................................................................................................... 128
16.10 PHASEIN Branded Mainstream and Sidestream Analyzer Related Information . 128
16.10.1 Zeroing .................................................................................................. 128
16.10.2 CO
2
Module Lighting Information ........................................................ 129
16.10.3 Others .................................................................................................... 129
Chapter17 IBP Monitoring .................................................................................................... 130
17.1 16.1 General information ...................................................................................... 130
17.2 Considerations of IBP monitoring ......................................................................... 130
17.3 Monitoring procedure ............................................................................................ 131
17.4 IBP Menu .............................................................................................................. 132
17.4.1 IBP<1,2>setup in the parameter area ............................................................ 132
17.4.2 IBP<1,2>setup in the waveform area ............................................................ 135
17.4.3 IBP<1,2>setup in the measurement setup ..................................................... 136
17.5 Zero calibration of sensor: .................................................................................... 137
17.6 Mercury manometer calibration procedures: ........................................................ 138
17.7 Alarm information and prompt information .......................................................... 140
17.7.1 Alarm information ......................................................................................... 140
17.8 Maintenance and Cleaning .................................................................................... 140
Chapter18 Measurement of Anesthetic Gases ..................................................................... 143
18.1 Overview ............................................................................................................... 143
18.2 Measurement Principle and Work Process ............................................................ 143
18.3 AG Display ........................................................................................................... 144
18.4 MAC Value............................................................................................................ 145
18.5 Preparations for Measurement .............................................................................. 146
18.6 AG Setup ............................................................................................................... 147
18.6.1 CO2 Settings ................................................................................................. 147
18.6.2 O2 Settings .................................................................................................... 149
18.6.3 N2O Settings ................................................................................................. 151
18.6.4 AG AA Settings ............................................................................................. 152
18.7 Aderse effects on performance .............................................................................. 154
18.8 Safety Alarm Information ..................................................................................... 155
18.8.1 ISA Sidestream Gas Analyzer Safety Warning Information .......................... 155
18.8.2 ISA Mainstream Gas Analyzer Safety Warning Information ........................ 157
18.9 Airway Obstruction ............................................................................................... 159
18.10 Discharging Waste Gases ...................................................................................... 160
18.11 Consumables ......................................................................................................... 160
18.12 Safety Symbol Information ................................................................................... 160
Page 9

VIII
18.13 Patents and Trademarks ......................................................................................... 162
18.14 Maintenance .......................................................................................................... 162
18.15 Cleaning the Analyzer ........................................................................................... 163
Appendix I. Accessories ................................................................................................... 164
Appendix II. Specification ................................................................................................. 166
Appendix III. Description of System Alarm Prompt ........................................................ 174
Page 10

1
Chapter1 General Information
For information about the monitor, please read the General Information on the Monitor chapter.
For introduction on various information displayed on screen, please read the Screen Display
chapter.
For operational methods, please read the Button Functions and Basic Operations chapter.
For locations of various interfaces, please read the External Interfaces chapter.
For notices of using the monitor with power supply from a battery, please read the Built-in
Chargeable Battery chapter.
Warning
This monitor is to monitor clinical patients, only for doctors and nurses’ use.
Warning
Don’t open cover of the equipment to avoid possible risks in electric shock. Any
maintenance or upgrading on the monitor must be conducted by service personnel
trained and authorized by Our Company.
Warning
Don’t use this monitor where there are flammables such as anesthetic agent, so as to
prevent from explosion.
Warning
Users before starting use should check whether the equipment and its accessories can
work properly and safety.
Warning
Please make sufficient alarming setting for each patient in order to prevent from
delayed therapy and make sure there is voice effect during alarming.
Warning
Don’t use mobile phones around the monitor. Mobile phones will generate strong
emission fields and disturb the monitor.
Warning
During defibrillation don’t touch patients, tables and the machine.
Page 11

2
Warning
Equipments inter-connected with the monitor should form an equal-potential body (as
protective effective earthing).
Warning
Users (doctors or nurses) should ensure safety of patients under monitoring, when the
monitor is used together with electrosurgical equipments.
1.1 General Information
Transport and Storage:
Temperature: -20℃~+40℃
Humidity: ≤80%
Atmospheric Pressure: Pressure: 50kPa~106kPa
Working:
Temperature: 5℃~+40℃
Humidity: ≤80%
Atmospheric Pressure: 86kPa~106kPa
Voltage:
a.c.100V~240V 50Hz/60Hz
FUSE T 1.6A
The portable Veterinary Monitor is of rich functions, applicable for bedside monitoring on
Veterinary, such as cat, dog, the small animals.
This monitor can monitor main parameters including ECG, RESP, SpO2, NIBP, Double TEMP,
IBP, EtCO2 and Anesthesia Gas. It integrates parameter measurement modules, display and record
output to build such a solid and light monitor. Its replaceable built-in battery makes convenience
for patient movement and it will clearly display 7 waveforms and all the monitoring parameter
information on the high-resolution interface.
Notice:
IBP , CO2 and Anesthesia Gas are optional.
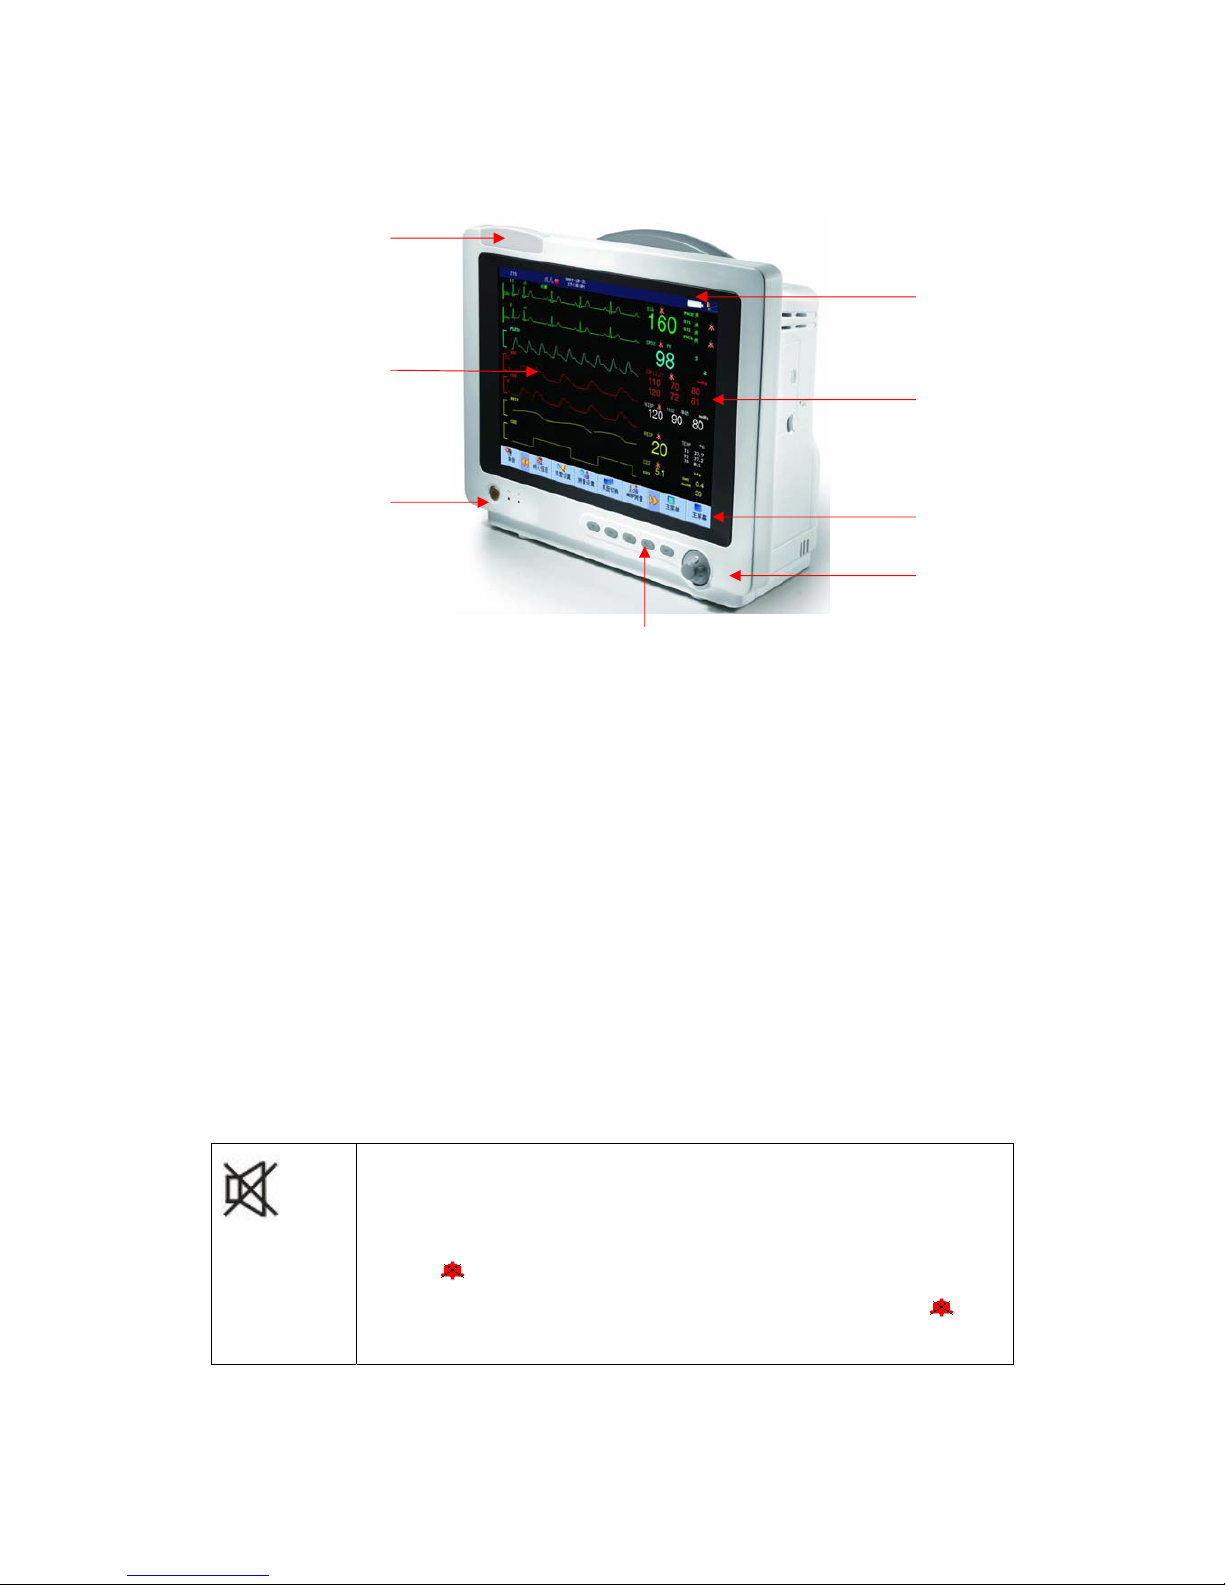
From left to right they are in turn:
(1) ALARM INDICATOR; (2)Waveform area; (3) ON/OFF button ; (4)Function button; (5)Knob;
(6)MENU; (7)Parameter area; (8)Information area. The Knob has three working methods as
turning left, turning right and pressing to confirm parameters are mainly applied to the operation
of menu.
Page 12
3
The outlet of the recorder is located on the left side of monitor and AC power line sockets are on
the rear panel of the monitor.
Figure 1-1 Multi-parameter Patient Monitor
This monitor has rich functions, able to provide various functions such as visual/audio alarming,
TREND storage & output, NIBP measurement save and review, medicine calculation, ST analysis,
pulse analysis, heart rate turbulence analysis, etc.
This monitor has a friendly operation interface, able to provide all functions with the keys and
buttons on the front panel, refer to Function Keys part for details.
1.2 Button Functions and Basic Operations
The monitor can be operated through use of the buttons and knobs. Here are the functions of the
buttons as follows:
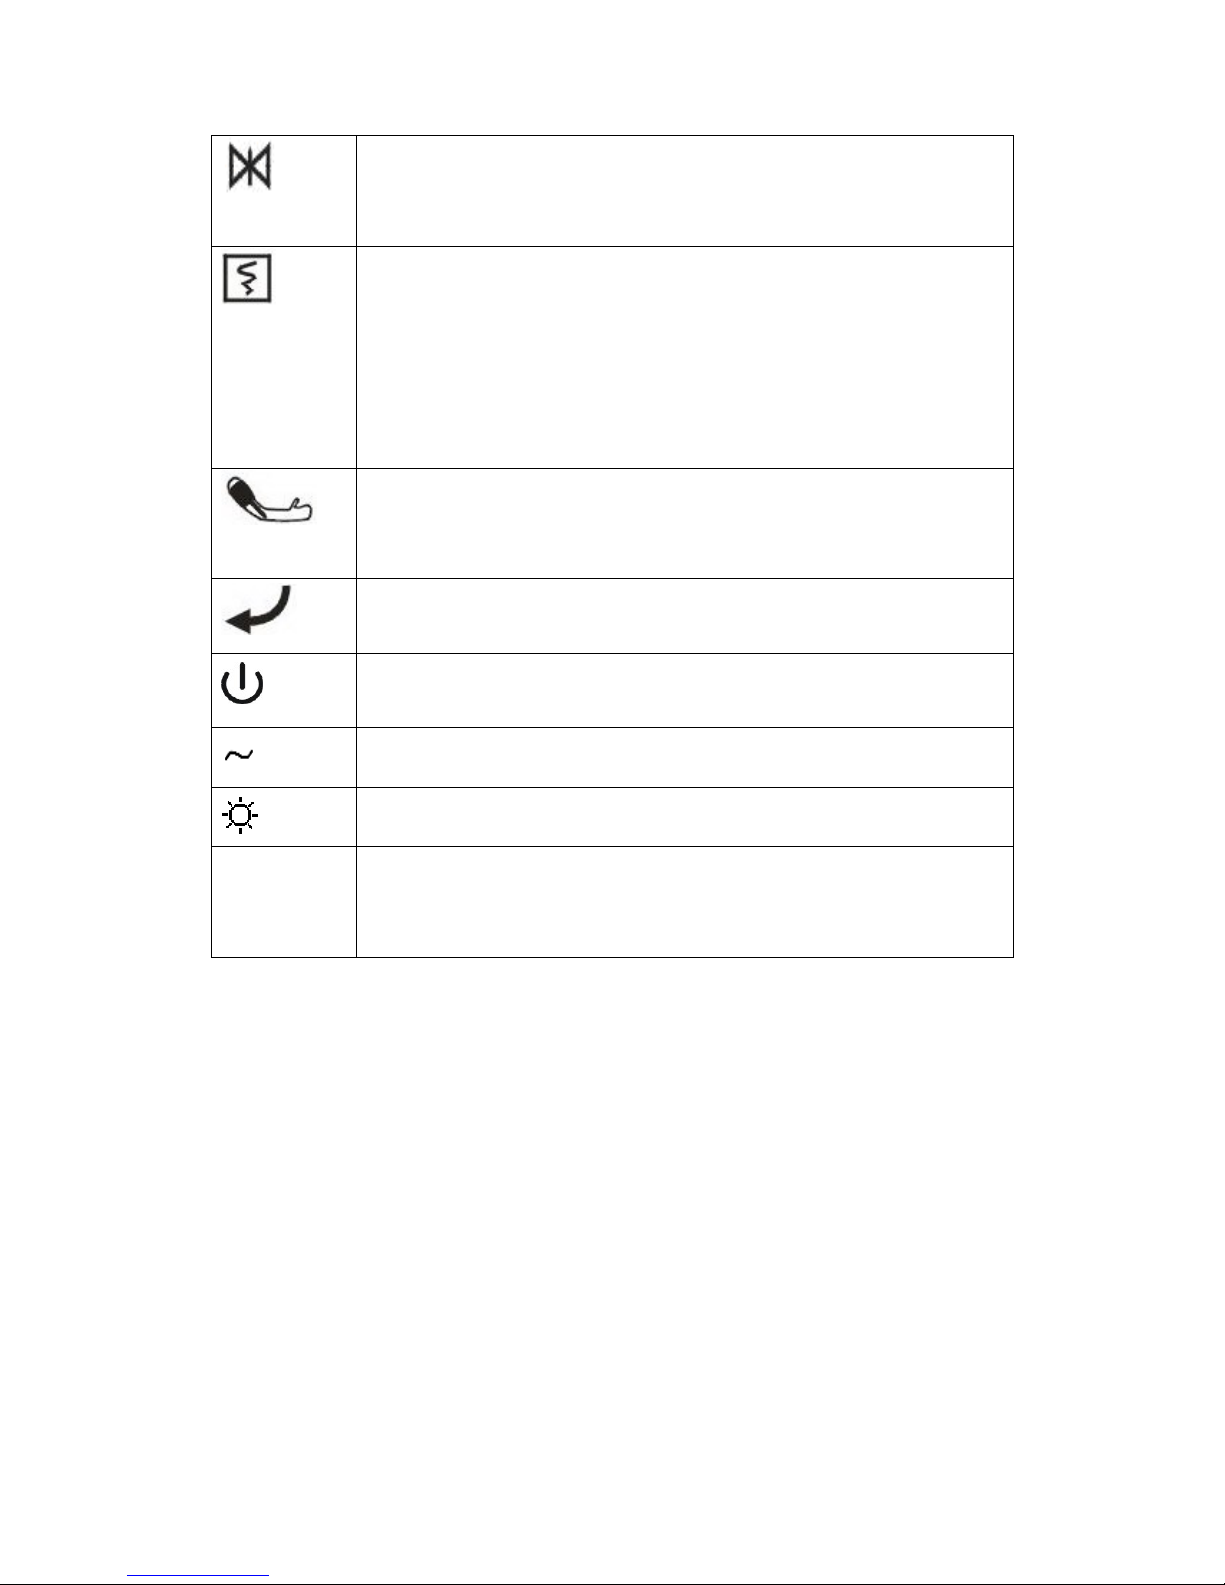
(SILENCE button): Press this button and the alarm will be silence for 3
minutes (this item can be set in the “Alarm Setting” menu). Press this button
over 1 second and the alarm sound can be shielded. In the information area
appears
sign. Repress this button again to pause alarm, resume heart beat
sound and cancel some technical alarm (ECG off, SPO2 off), and the
sign
disappears.
(1)
(2)
(3)
(4)
(5)
(6)
(7)
(8)
Page 13
4
(FREEZE button): Press this button and all waveforms on the screen can be
frozen in the normal mode. Press this button once again and the frozen
waveforms can be freed.
(PRINT button): Press this button to start a real-time recording. The recording
length is determined according to the “real-time recording time” in the
“Recorder” submenu of “Setting” menu. Press this button once again in the
recording process and the recording will stop at once. Each interval of pressing
this button should be greater than 2 seconds and the frequency should not be
excessively high.
(To start/stop NIBP measurement), press to inflate the cuff to start a blood
pressure measurement. When measuring, press to stop the measurement and
deflate the cuff.
(MENU button): Press this button to have the main menu pop up when the
interface is in the state of non-window setting.
(ON/OFF button): Press this button to control the startup and shutdown of the
monitor.
a.c. INDICATOR
Work INDICATOR
JOG-DIAL JOG-DIAL to select and change the settings. Operation can be performed by
turning it clockwise, counterclockwise or pressing it down. JOG-DIAL is
mainly used in menu and window operation
1.3 Screen display
This monitor has a color LED screen, able to concurrently display collected patient
parameters, waveforms, and alarming information provided by the monitor, bed marks, clocks,
monitor status and other reminder information.
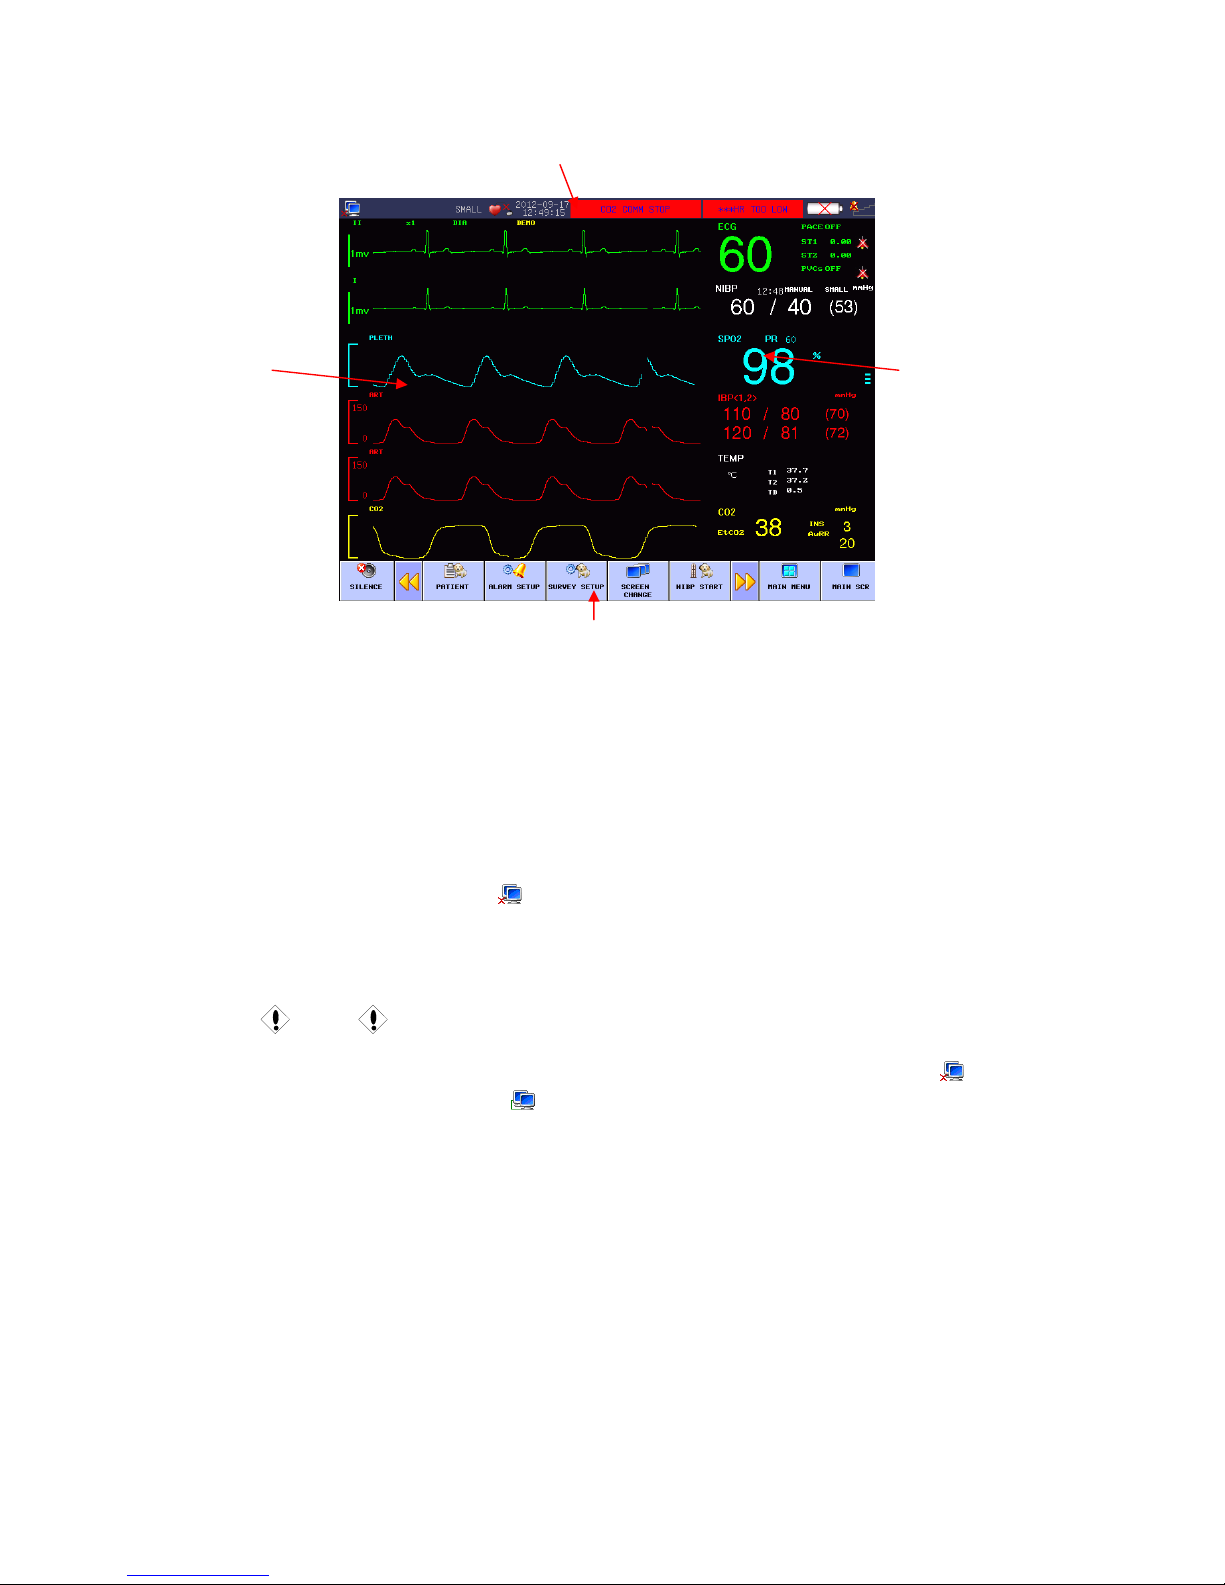
The main screen is divided into 4 sub-areas, i.e., Information Area , Waveform Area , ①②
Parameter Area and Menu Area (As shown in Figure 0③④ -2)
Page 14
5
Figure 1-2 Main screen display
Information Area ( ):①
Prompt message in the information area appears and disappears together with the reported state. In
accordance with the content, it is divided into:
1. Network setup: Cursor stops in sign, press to enter system setup.
Network Bed No.: refer to IP address for monitor, The IP is 200.200.200.X,(X is
Network Bed No.:, from 1 to 100)
Caution
Connection state of CMS (central monitoring system) : when displaying
, no
connection; when displaying
, connection.
Network Bed No. should not conflict with other monitors, or there will be unnecessary problems
for the monitor.
If any problem happens because of confliction, unplug network wire, restart the monitor, reset the
Network Bed No. and connect the network wire again.
2. Patient Information: press to enter the Patient Information menu when cursor is in bed No.,
name or patient group area.
“Bed No.”: Refer to the bed number of the patient being monitored, this area will be
blank if there is no input.
Name: Patient name, this area will be blank if there is no input.
Information Area
Parameter
Area
Waveform
Area
Menu Area
Page 15

6
Sex: Male and Female.
Weight(kg): patient’s weight
Patient Type: neonatal, pediatric, adult
Update patient: Replaced with new patients, once the update, delete the monitoring data
on a patient
3. Time setup: set up local time
time: display system time
4. Technical alarm: display technical alarm, such as ECG lead off.
5. Physical alarm: display physical alarm, such as T2 too low.
6. Battery: display capacity of batter.
Full capacity
Not full capacity
Low capacity
Very low capacity, need to charge soon.
7. Volume setup: setup alarm volume, heart beat volume, key volume.
Alarm volume: there are five Alarm Vol levels, 1, 2, 3, 4 and OFF, where "OFF" level
means the alarm sound is closed.
Alarm volume on, alarm level 4
Alarm volume off
Caution
Visual alarm and alarm status
Alarm light winks or shines when there is an alarm. The colour of light means the alarm
level. Refer to alarm function chapter for details.
W aveform Area ( ) ②
There are four waveforms in the waveform area, which are respectively from up to down:
two-channel ECG waveform, SpO2 volume graphic waveform and respiratory waveform
(possibly from ECG module).
The name of selected waveform is displayed on the upper left part. For details, please refer to
chapter of ECG Monitoring. Each ECG waveform still shows the gain of this channel and the
filtering method of ECG waveform. A 1-mv rod is on the left of ECG waveform.
When you choose/touch each waveform, submenu of waveform will be pop up, which always
occupies most of space of waveform area, so that some waveforms are invisible. The original
image will come back after the menu exit.
Waveforms are refreshed at the set speed. For adjustment on waveform refresh speed, refer to the
Page 16
7
chapter of each Parameter Setting.
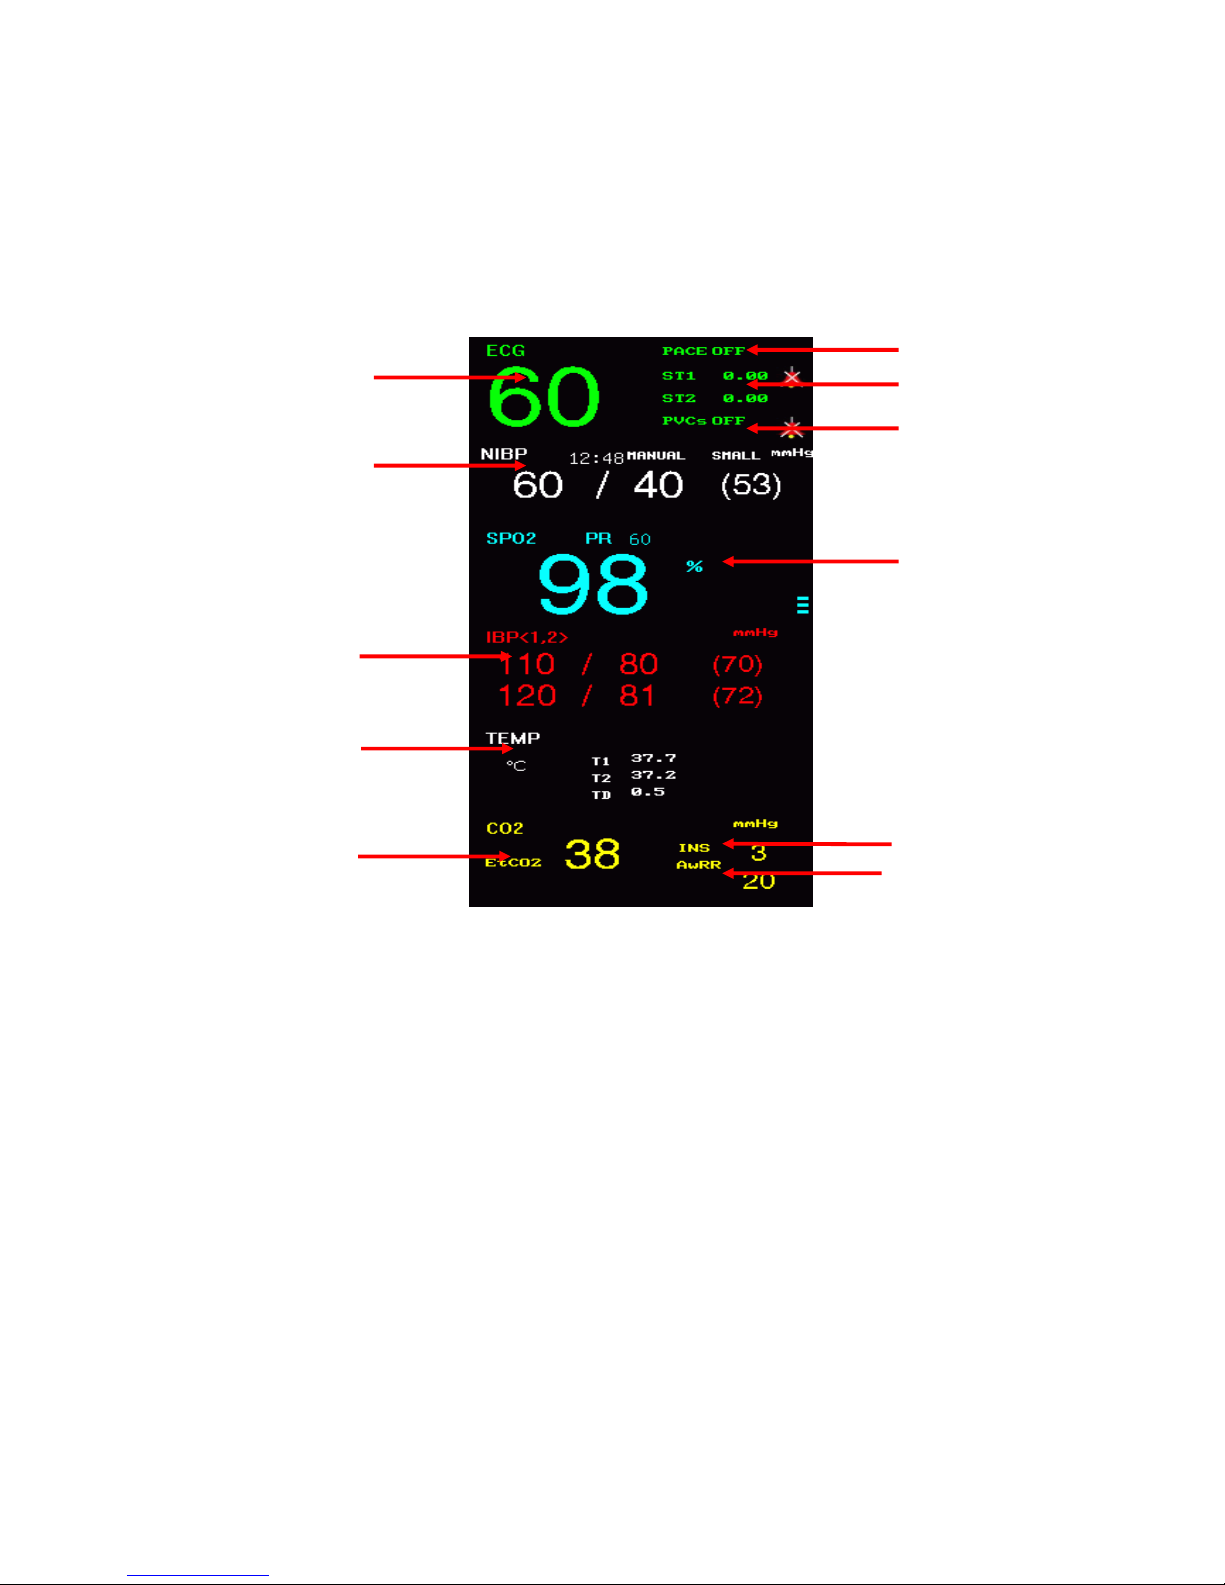
Parameter Area( )③ :
Parameters can display at the fixed position (as shown in ~① ○12of the following picture), which
are separately:
Figure 1-3 Main Screen
ECG
—Heart Rate or Pulse Rate( ,unit① :bpm)
—pacer detection ( PACE)②
—ST-segment of channel 1 and channel 2 ( , unit: mv)③
— PVCs times ( Unit: times/minute) ④
NIBP
— None-Invisive Blood Pressure
(From left to right) Systolic, Diastolic, Mean ( , Unit: mmHg or kPa)⑤
SpO2
—SpO2(⑥,unit:%)
②
③
④
⑤
⑥
⑦
①
○
8
○
9
○
10
○
11
Page 17

8
—Pulse Rate(unit:bpm)
IBP (optional)
— Invisive Blood Pressure
(From left to right) Systolic, Diastolic, Mean (⑦, Unit: mmHg or kPa)
TEMP
—TEMP
—Temperature(⑧,unit: or℃℉)
CO2 (optional)
—end-tidal CO2 (⑨, Unit: mmHg or kPa)
—inspiratory CO2 (⑩, Unit: mmHg or kPa)
—Air Way Respiration Rate (AWRR)(
○
11 ,unit:bpm)
RESP
—Respiration Rate(,unit:bpm)
The above monitored results will show in the parameter area.
The parameters are refreshed once per second, but NIBP value, once per measurement.
Users can select the monitoring parameters and the main screen will display the relative content.
Menu Area(④)
1. PATIENT: patient information configuration. Refer to chapter of Patient Informatio for details.
2. ALARM SETUP: set up alarm type
ALARM RECORD TIME: in case of physiological alarm, the system can record the
information before and after the alarm time. The system can give three kinds of time, i.e., 8
seconds, 16 seconds. The seconds in the options are the sum of seconds before and after the
alarm time. For example, 8 seconds mean the information within 4 seconds before the alarm
time and within 4 seconds after such a time.
ALM PAUSE TIME (Alarm pause time):“1 minute”, “2 minutes” or “3 minutes”
ALAM LIMIT (Display alarm limits):”ON” and”OFF”
ALM LATER :Disabled ,5s,10s,15s,20s.
Select "Disable", when an alarm occurs, the
instrument that occurs immediately alarm; When Select "five seconds", alarm occurs only
when the parameters continue to exceed the the alarm upper or lower limit of 5 seconds
instrument, other settings and so on. The purpose of this feature is to reduce the instant false
alarms, allow doctors to more accurately grasp the situation
3. SURVEY SETUP: ECG, RESP, SpO2, NIBP and TEMP setup, refer to each chapter for details
4. SCREEN CHANGE: STANDARD, LIST FACE, TREND SCREEN, oxyCRG SCREEN, BIG
FONT, AND 7CH MULTI-LEADS DISPLAY. For details,please refer to chapters for each
Page 18
9
parameter.
5. NIBP STARTt: press this button to start/stop NIBP measurement.
6. FROZEN: the screen freezes when press this button, turn the knob to review all the waveform
stored for the last 4 minutes.
7. TREND GRAPH, TREND TABLE (TREND Figure), NIBP RECALL: refer to chapter 3 for
details.
8. PRINT: press this button to record waveforms and patient information.
9. SCR LOCK: In order to avoid non-operators misuse Monitor, the instrument has a touch
screen lock function. Click on the "lock screen" button to lock the touch screen in the main
interface. For To unlock the the continuous point lived unlock the screen "option for three seconds,
you can unlock the screen is locked
1.4 External Socket
1.4.1 Left Panel
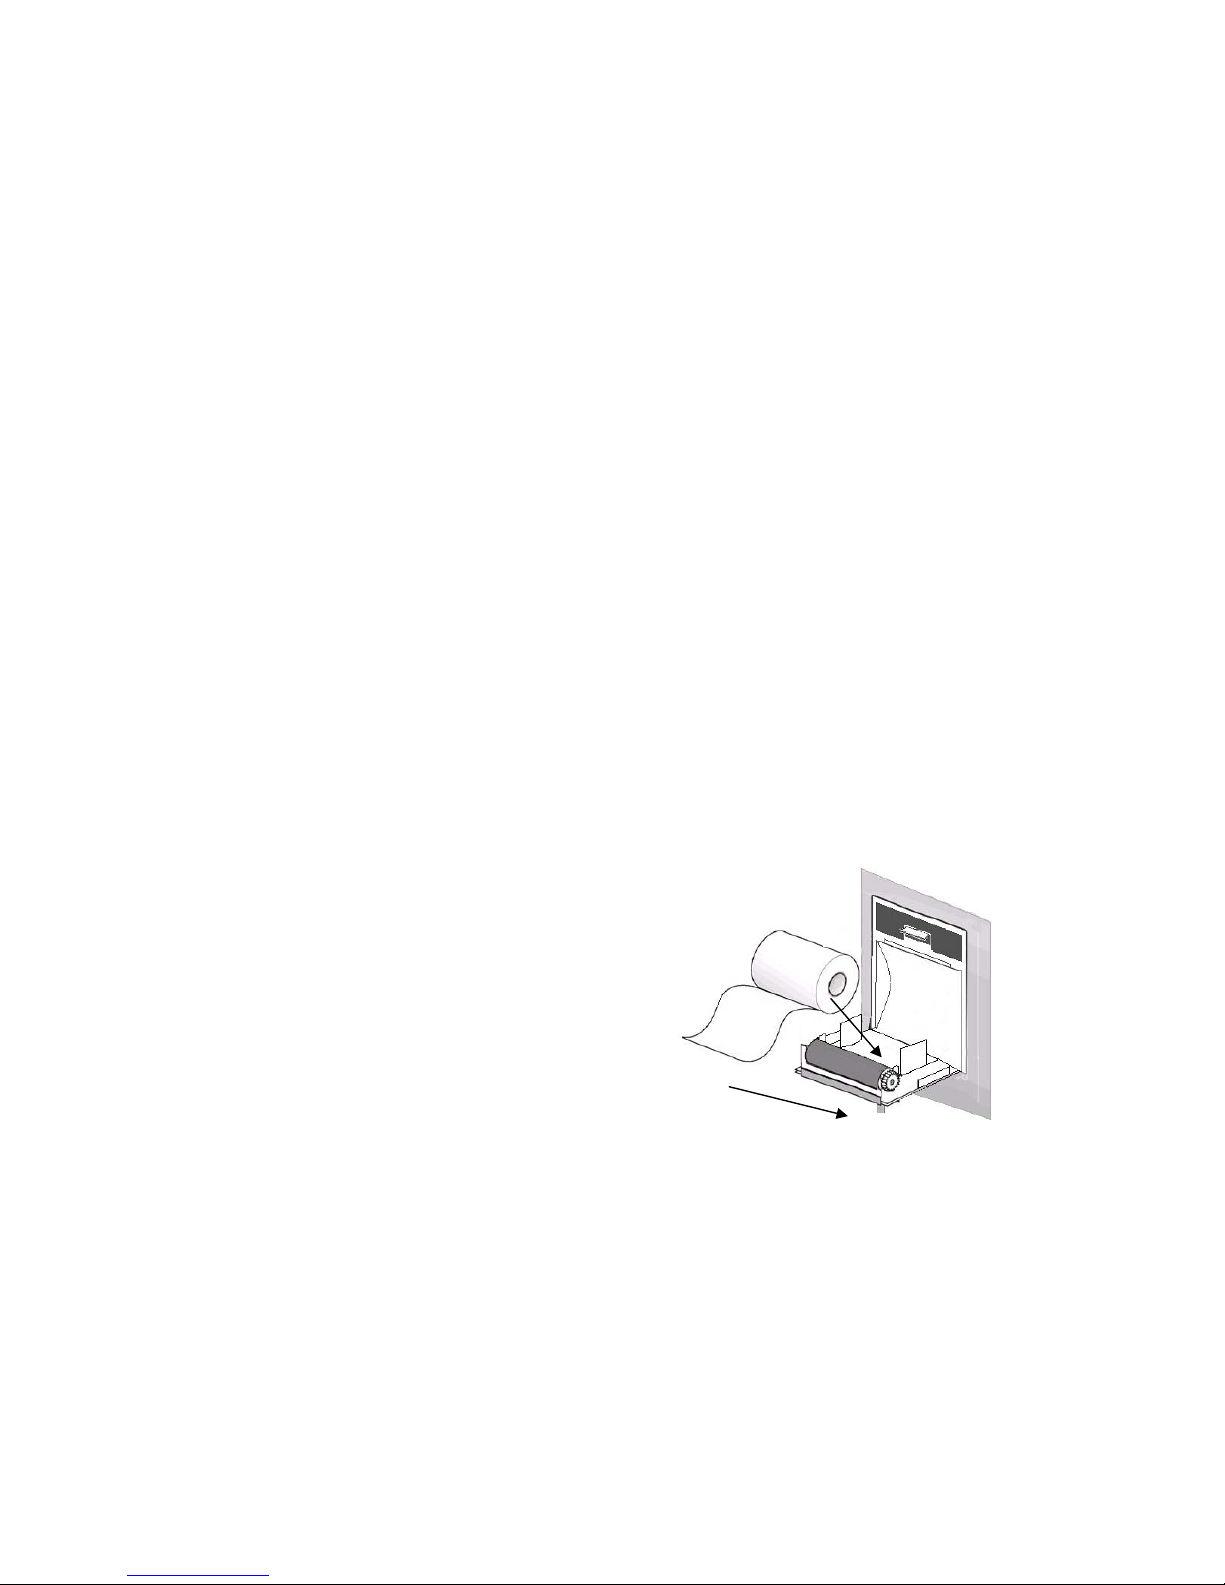
Recorder is optional
1. Open the recorder door.
2. Take away the no-paper rod
3. Fix the new paper correctly, tip of paper out from the
head of printer.
4. 3mm paper must out of recorder door, close the door.
5. Press PRINT to check if the paper fixed well or not.
If no printing, prease re-fix the paper.
Fig 1-4 Recorder
1.4.2 Right Panel
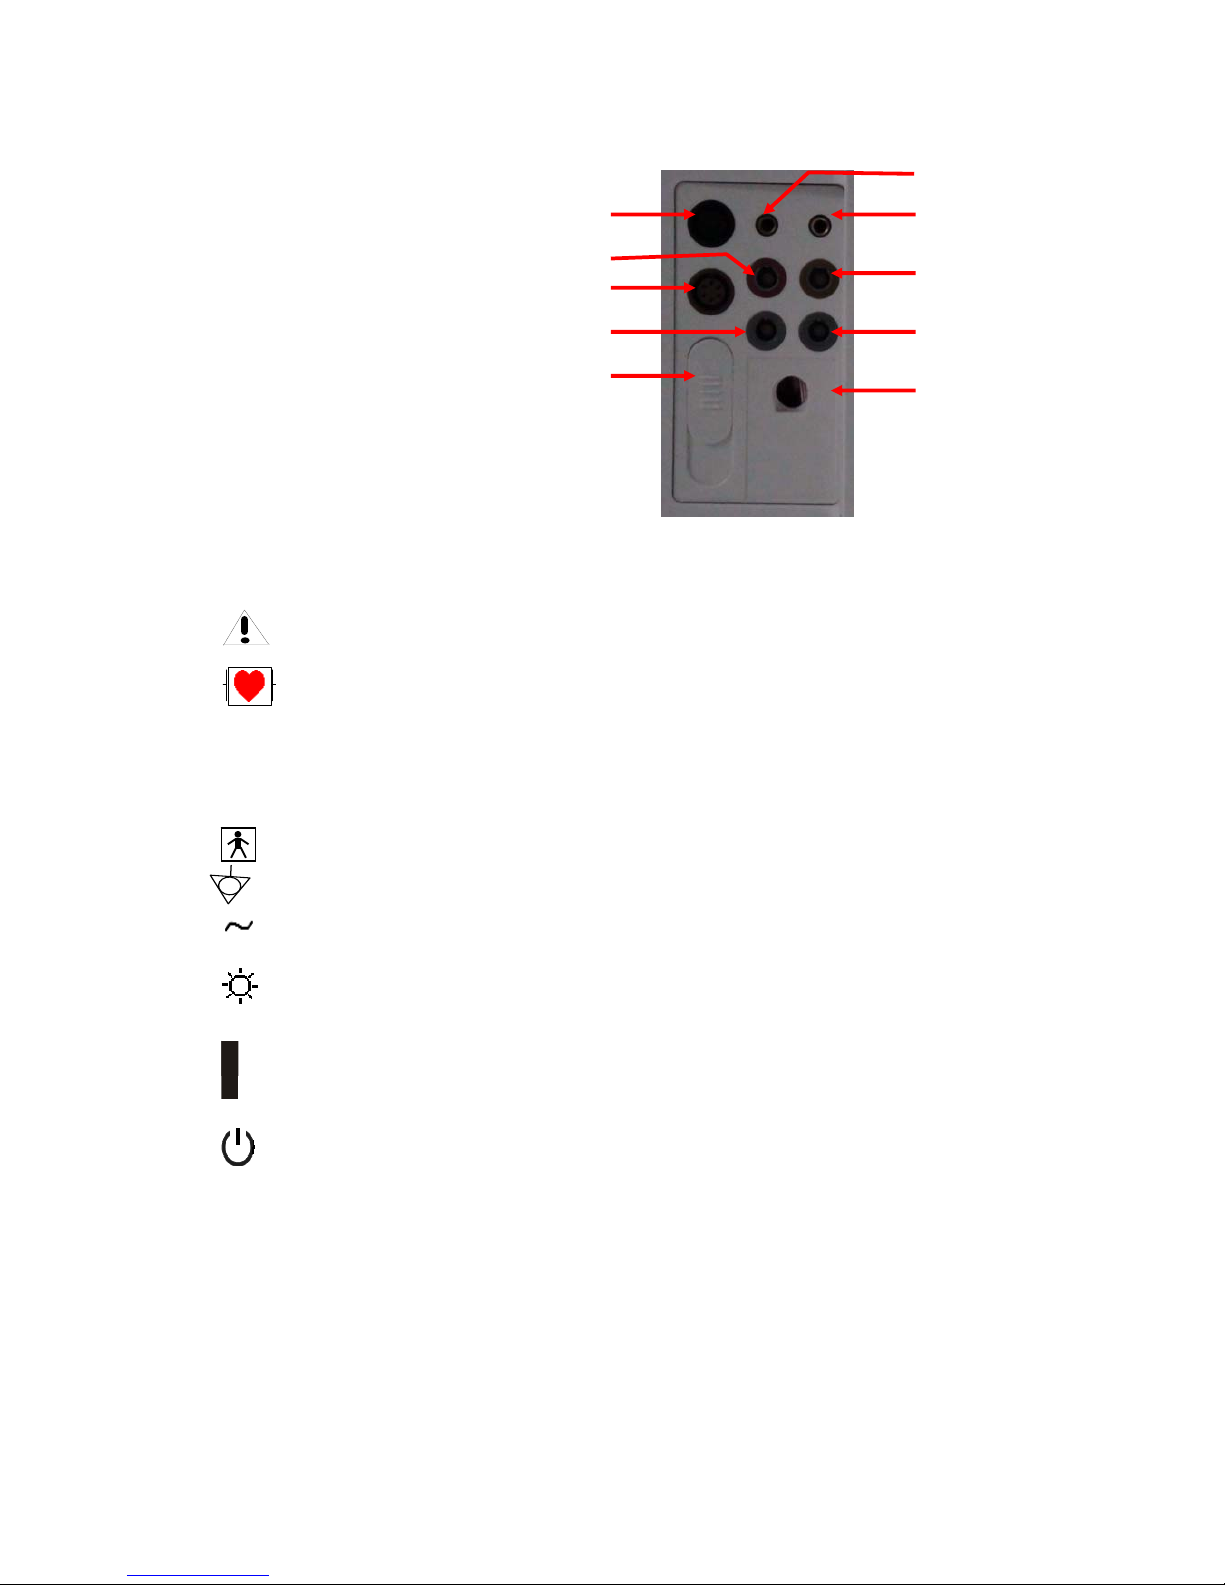
On the right side of the monitor are sockets for each transducer
Page 19
10
① ECG1
② NELLCORSPO2
③ ECG2
④ IBP1 (optional)
⑤ Hidden NIBP
⑥ TEMP1
⑦ TEMP2
⑧ CO2(optional)
⑨ IBP2(optional)
⑩ ICG or Anesthesia Gas(optional) Fig 1-5
This symbol means “be careful”; refer to this manual for details.
This symbol means this application part is of CF type, designed with special protection
from electric shock (especially provided with F-type floating insulation apparatus for permissible
leakage current) and suitable for the defibrillation process.
Other symbols will be introduced in the Patient Safety chapter.
this symbol means: BF type
means the equipotential grounding terminal.
A.C. indicator
work indicator
Power-up
Switch-on/off
1.4.3 Rear Panel
There are the following soclets in the rear panel:
①
②
③
④
⑤
○
6
○
7
○
8
○
9
○
10
Page 20
11
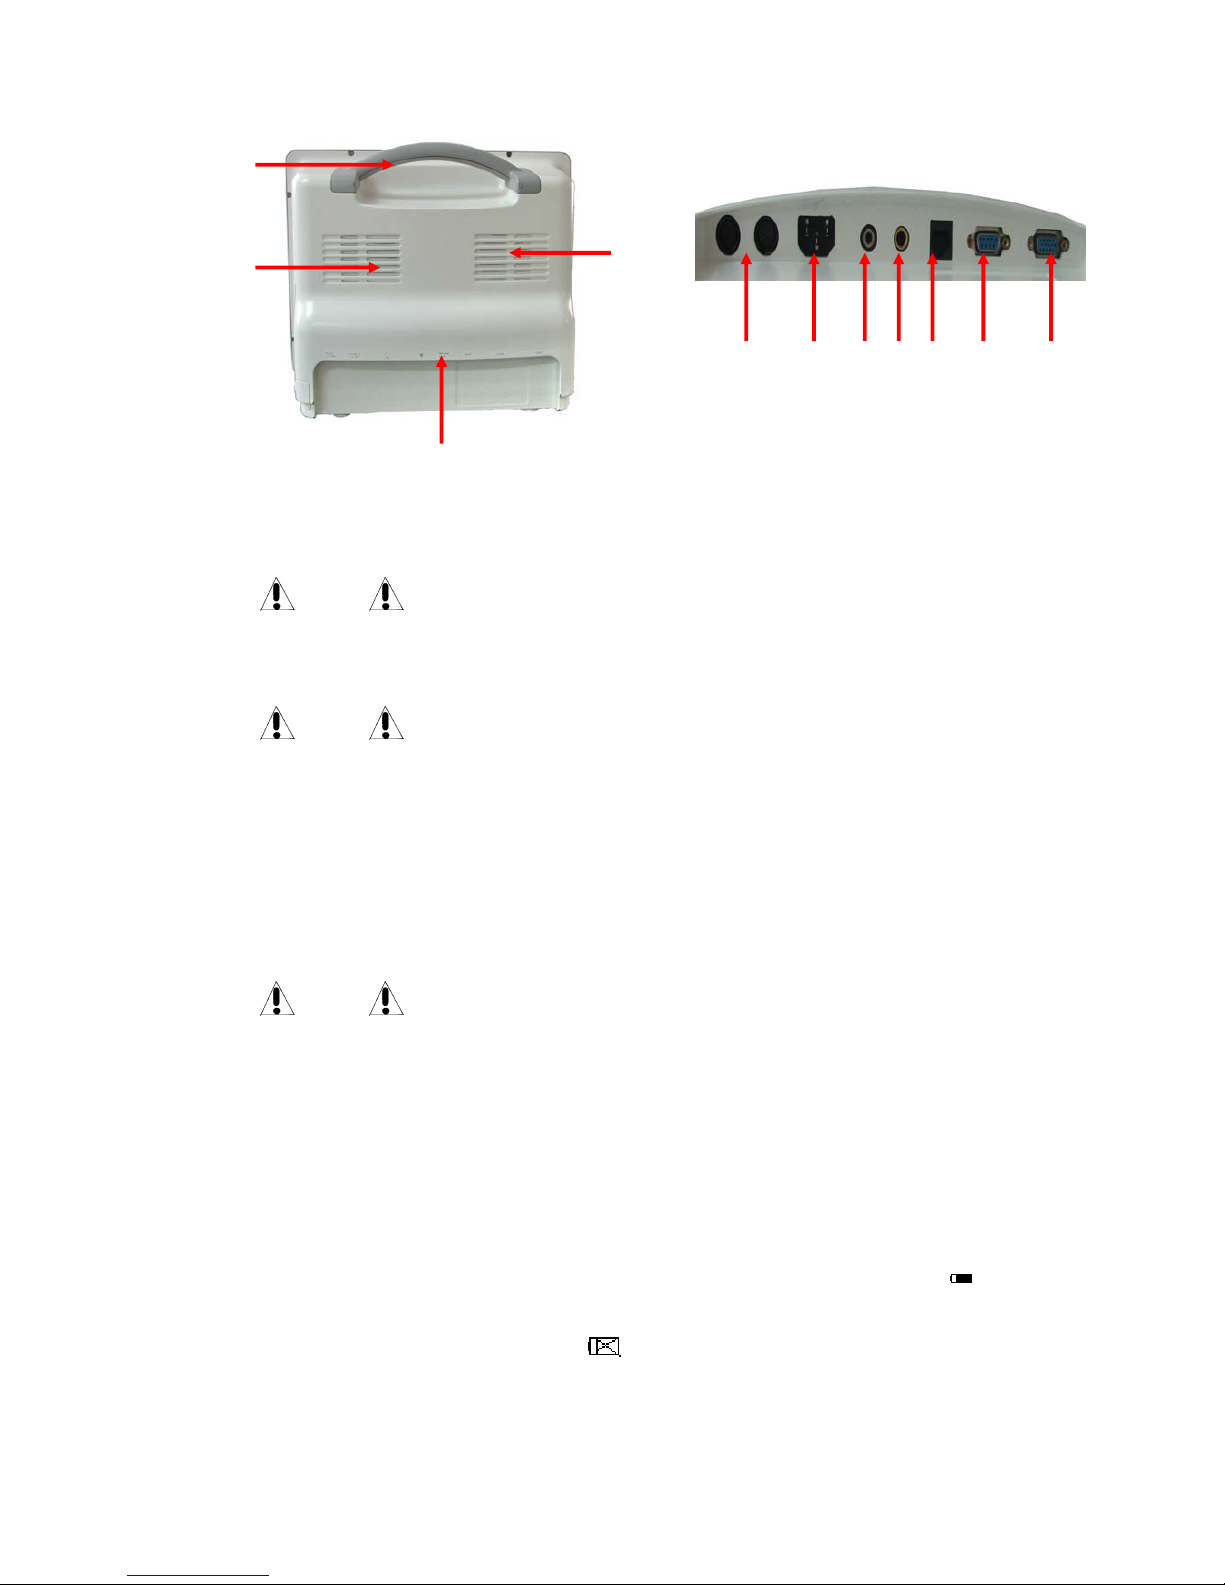
Fig 1-7 rear panel socket
Fig 1-6 Rear Panel
Handle 2.Fan 3.rear panel socket(Fig 1-7 ○1Fuse-holder,○2Power socket,○3 Equipotential
socket,○4Nurse call socket,○5Network socket,○6Channel socket,○7VGA socket,4.Speaker
Warning
This network port can only be connected with CARL NOVEL’s central monitoring
system.
Warning
All the simulated or digital equipments connected with this monitor must be certified
under the designated IEC standards (such as IEC 60950 Data Processing Equipment
Standard and IEC 60601-1 Medical Equipment Standard). And all configurations must
comply with effective versions of IEC 60601-1-1 system standards. Persons in charge of
connecting additional equipments with the input/ output signal terminals should
configure the medical system and be responsible for compliance of the system to IEC
60601-1-1 standard. For any enquiries, please contact the supplier.
Warning
Patient cable interface, network interface and other interfaces connected to different
equipments, the leakage current should not exceed the limit.
1.5 Built-in charge battery
The multi-parameter monitor has a built-in charge battery. When connected with AC power, the
battery will charge automatically until it is full. On the right side of the screen, there is a “
”, it
means charging state. Its yellow part means the quantity of the battery. If this monitor has no
built-in battery, the battery state will display “
”, it means no battery or defective battery.
②
①
③
④
○
1
○2 ○3 ○4 ○5 ○6 ○7
Page 21

12
Chapter2 Monitor Assembly
Caution
For normal work of the monitor, before use please read this chapter and the Patient
Safety chapter and assemble in accordance with the requirements.
2.1 Open Package and Check
Carefully pick up the monitor and accessories from the package box, and properly keep the
package materials for future transport or storage. Please check the accessories with the package
checklist.
Check whether there is any mechanical damage;
Check all the exposed cables and plug in some accessories for test.
Any problems should be immediately raised to the Sales Department of our Company or our
agents.
2.2 Connect with AC Cable
Procedures to connect with AC power cables:
Make sure the AC supply complies with the following specification: 100-250VAC,50/60Hz
Use the power cables provided with the monitor together. Plug in the power cable into power
supply interface of the monitor, while insert the other end of this cable to a 3-phase earthing power
socket.
Caution
Connect the power cable with the sockets special for hospital use.
If deemed necessary, connect with an equal-potential earthing cable. Refer to the equal-potential
earthing part in the Patient Safety chapter.
Caution
In case configured with a battery, the equipment after transport or storage must have
the battery taken for charging. Thus in case of direct booting without connection with
AC power supply, the equipment may not work properly due to insufficient power. With
AC power supply connected, the battery will be charged no matter the monitor is
Page 22

13
booted or not.
2.3 Power on
The logo displays when the power is on, and appears the processing screen. After the 3~5 seconds
checking process, the system enters the monitoring main screen and the users can start operations.
Caution
In case of any fatal errors found during the self-detection process, the system will
alarm.
Caution
Check all the available monitoring functions and make sure they work properly.
Caution
If a battery is configured, users must charge the battery after each time of use so as to
ensure sufficient power storage.
Caution
If any monitoring functions are found with damage or there are any error reminders,
don’t use this monitor to monitor patients and quickly contact with the biomedical
engineers of your hospital or maintenance engineers of our Company
Caution
Reboot the equipment at least 1 minute after shut down.
2.4 Connect with Sensor
Connect the required sensor between the monitor and the monitoring position of a patient.
Caution
For correct connection methods and relevant requirements of various sensors, please
refer to Chapters 10-15.
2.5 Check Recorder
If there is recorder in monitor, check the paper. If there is no paper, see reference related in chapter 1.
Page 23
14
Chapter3 System Menu
The monitor system setting is more flexible. Monitoring, waveform speed, volume and output, all
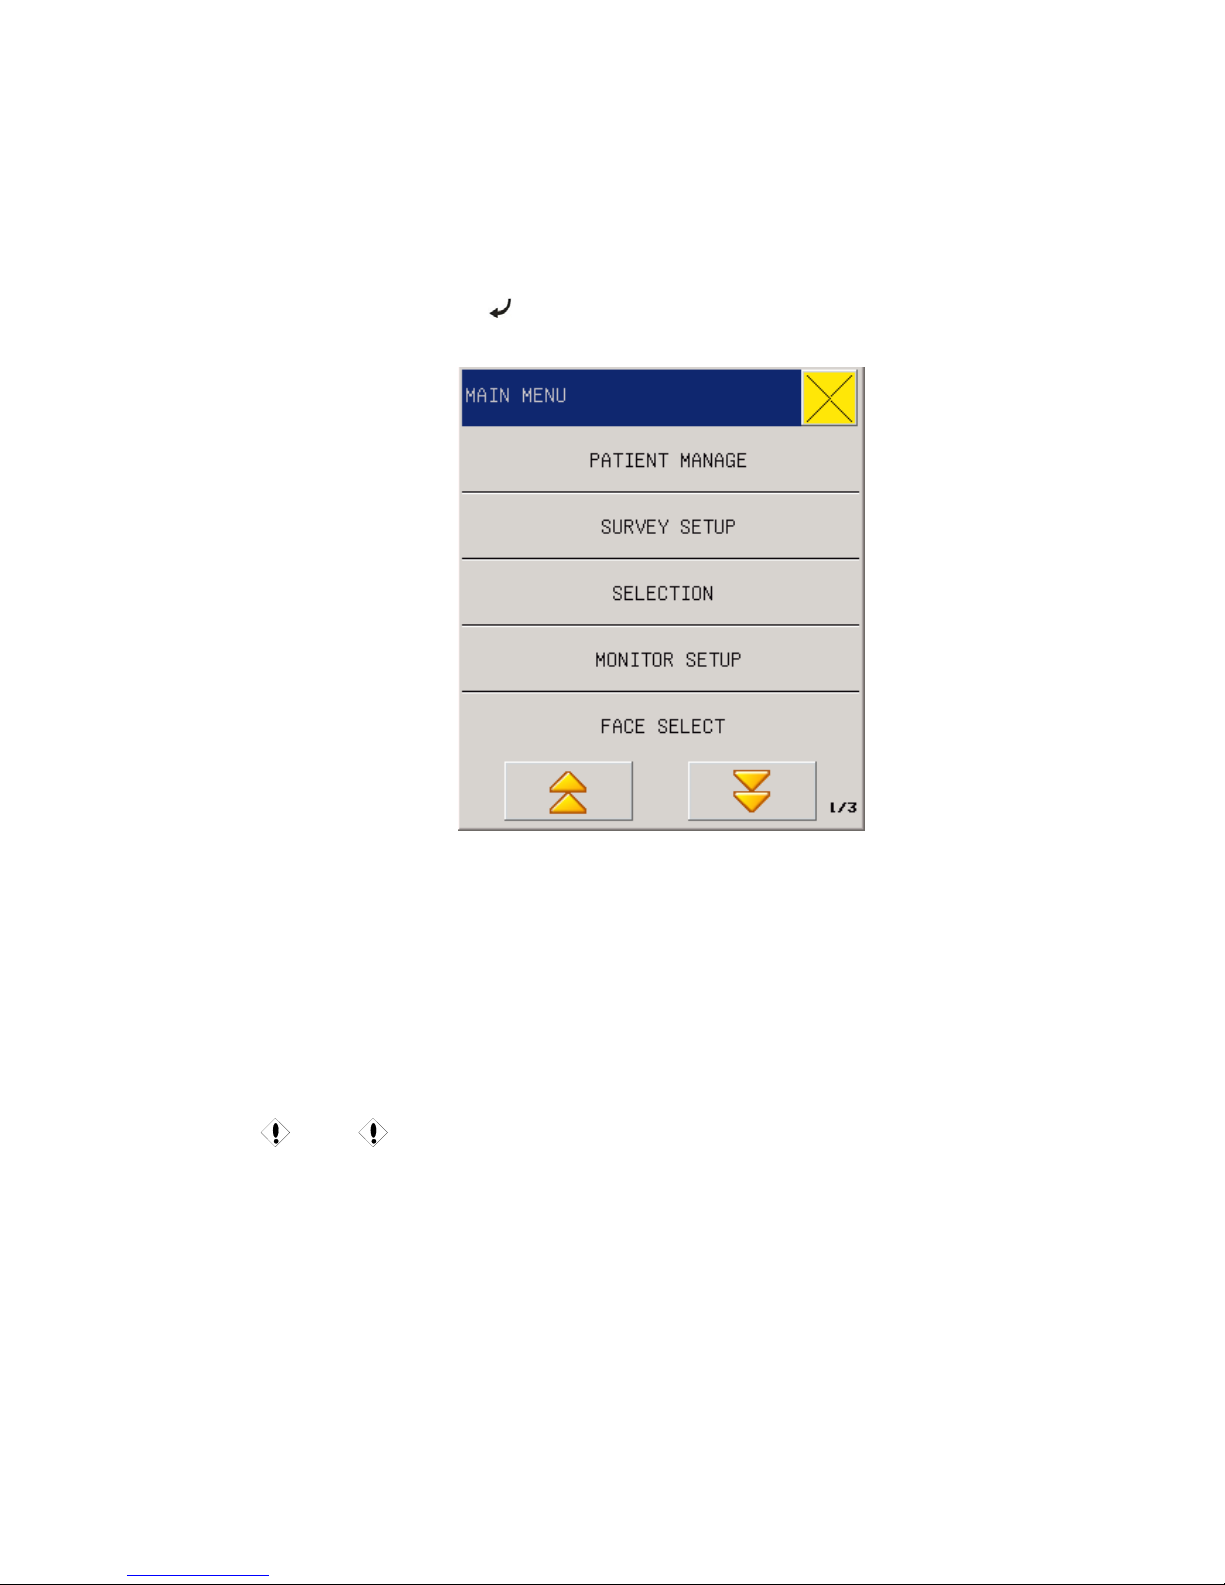
can be setup by user. Press the “
” button or use turn-knob to choose main menu, popping up
MAIN MENU.
Fig 3-1 Main Menu
MAIN MENU including: PATIENT MANAGE, SURVEY SETUP, SELECTION, MONITOR
SETUP, FACE SELECT, TREND GRAPH, TREND TABLE, NIBP RECALL, ALM RECALL ,
WAVE RECALL ,INFO, DRUG CALC, MAINTAIN, DEMO.
3.1 PATIENT MANAGE
Caution
For deleting the patient’s current data, please refer to the “
UPDATE PATIENT” in
this chapter.
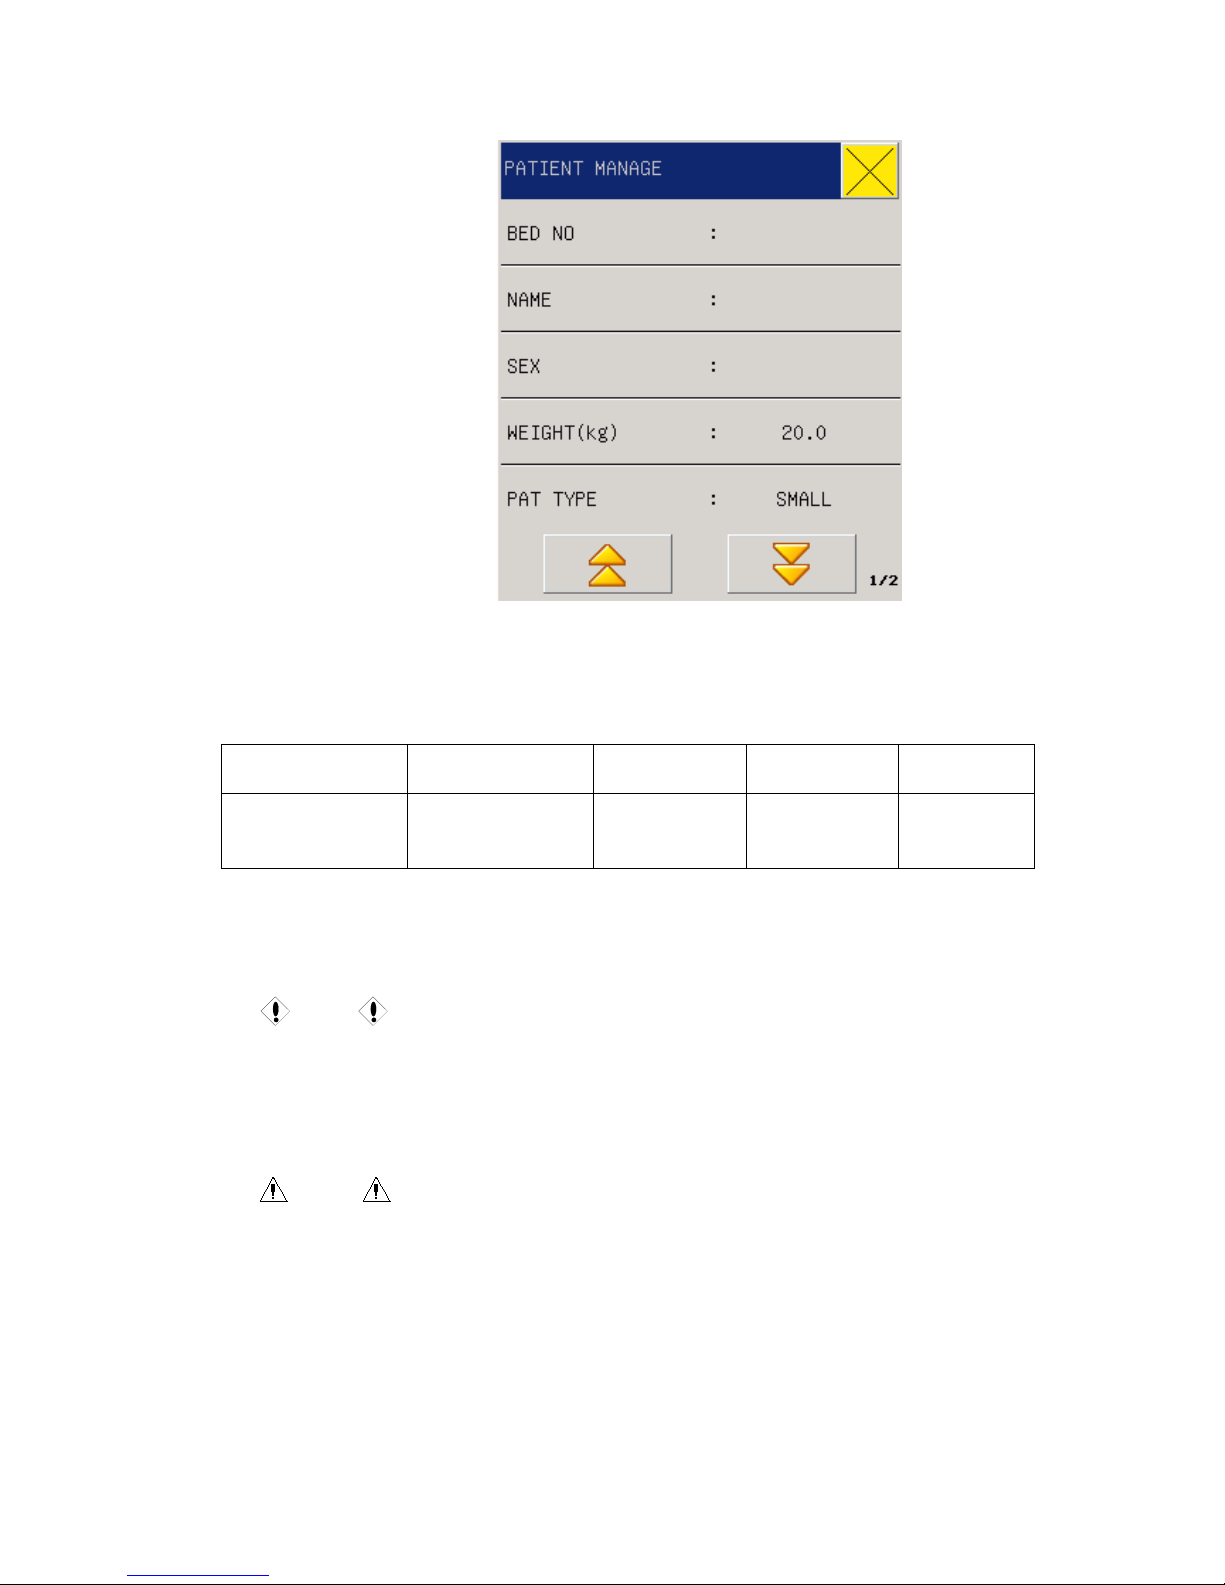
Select the “PATIENT MANAGE” item under the system menu, and then pop up the following
menu:
Page 24
15
Fig 3-2 Patient Manage
Users can set the following content:
1. Bed NO. 0-999 for option, for example, 666
2. Name input patient name to the popping up menu
Lock Shift Del Clr Enter
Caps Lock
(permanent)
Caps shift
(one-off)
delete clear enter
3. SEX Patient gender( female, male)
4. PAT TYPE PATIENT TYPE (big,small)
5. Weight(kg) 0~200, for example, 100
Caution
PACE: The default setting is OFF after you restart the monitor.
In this menu, user can select the “UPDATE PATIENT” and select “CONFIRM TO UPDATE
PATIENT” to update patient information.
Warning
Patient type changed, the alarm parameters such as heart beat and NBP may vary,
usually make sure the limits are suitable for the patient.
Pacer detection must be on for pacing patients. If falsely setting OFF, the monitor would
miktake pacing pulse as QRS, and not alarm for heatbeat stop
Page 25
16
3.2 Survey setup
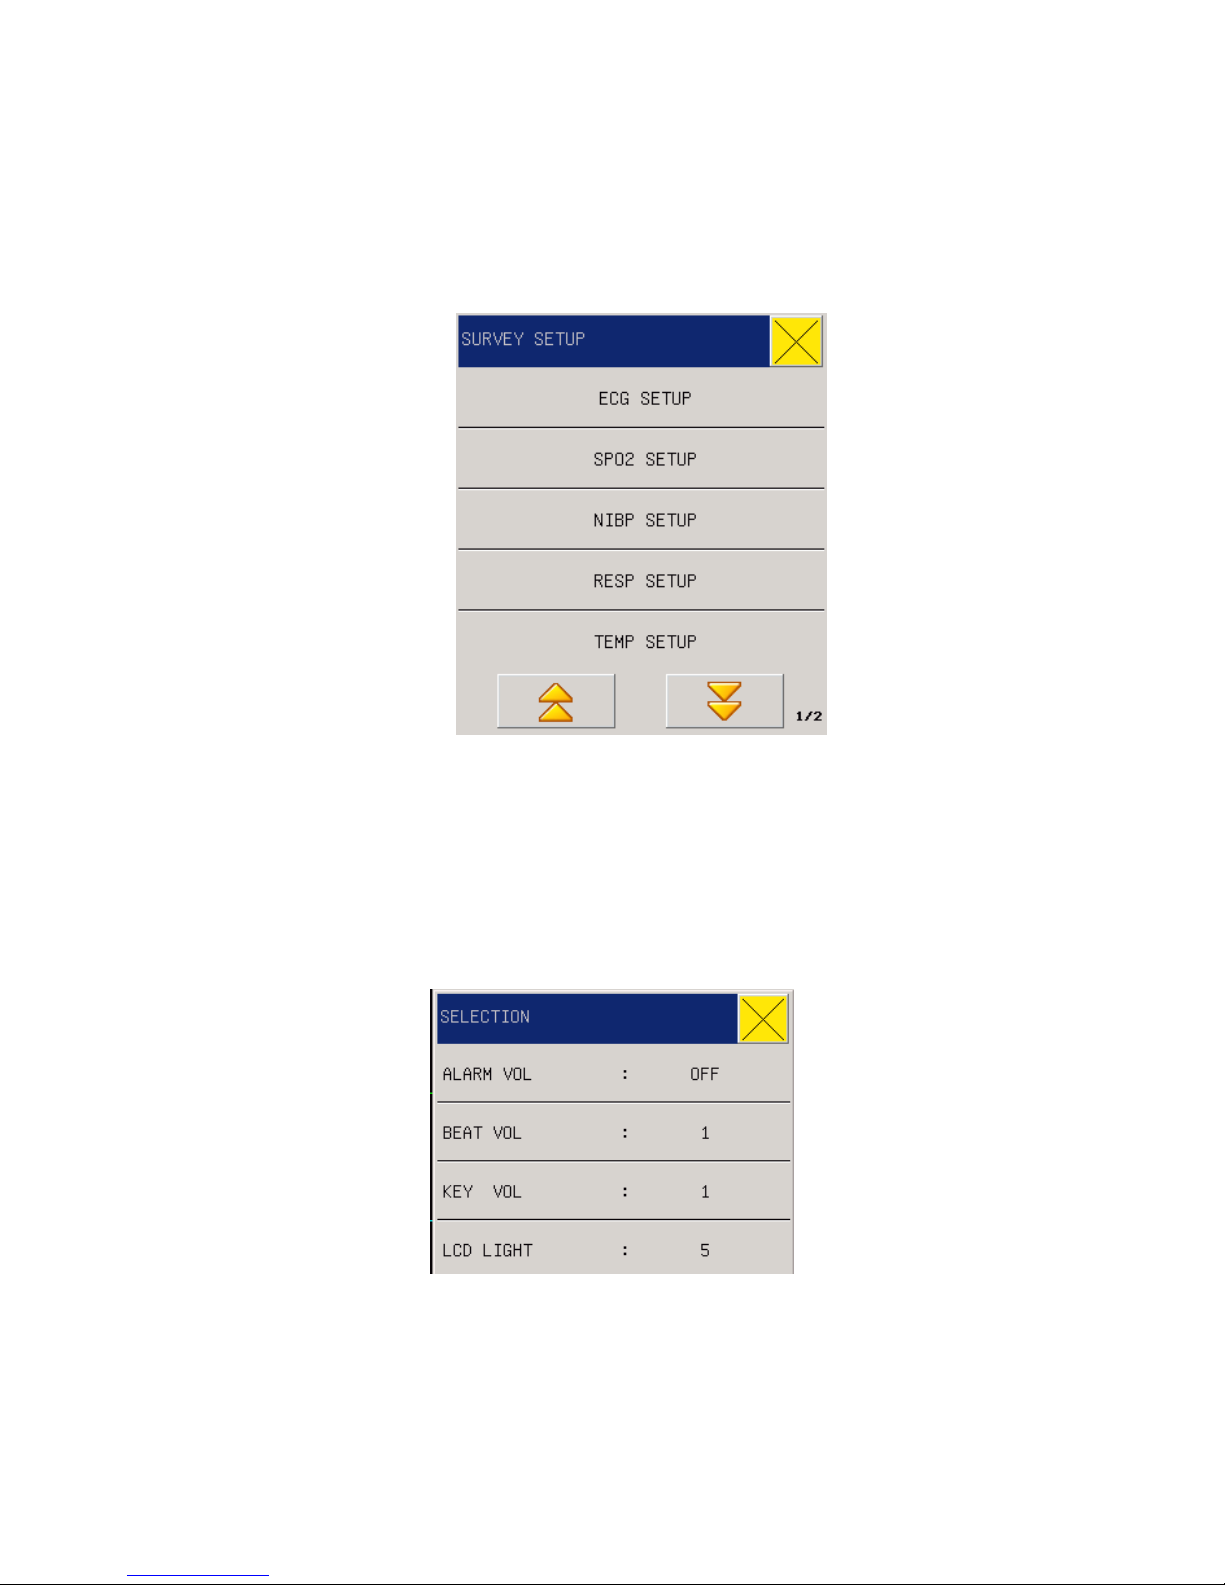
Select the “Survey setup” item under the system menu, Survey setup include: ECG setup, SPO2
setup, NIBP setup, RESP setup, TEMP setup, CO2 setup, IBP(1,2) setup pop up the following
menu (next chapter would be detail introduce to the setup function):
Fig 3-3 Survey setup
3.3 SELECTION
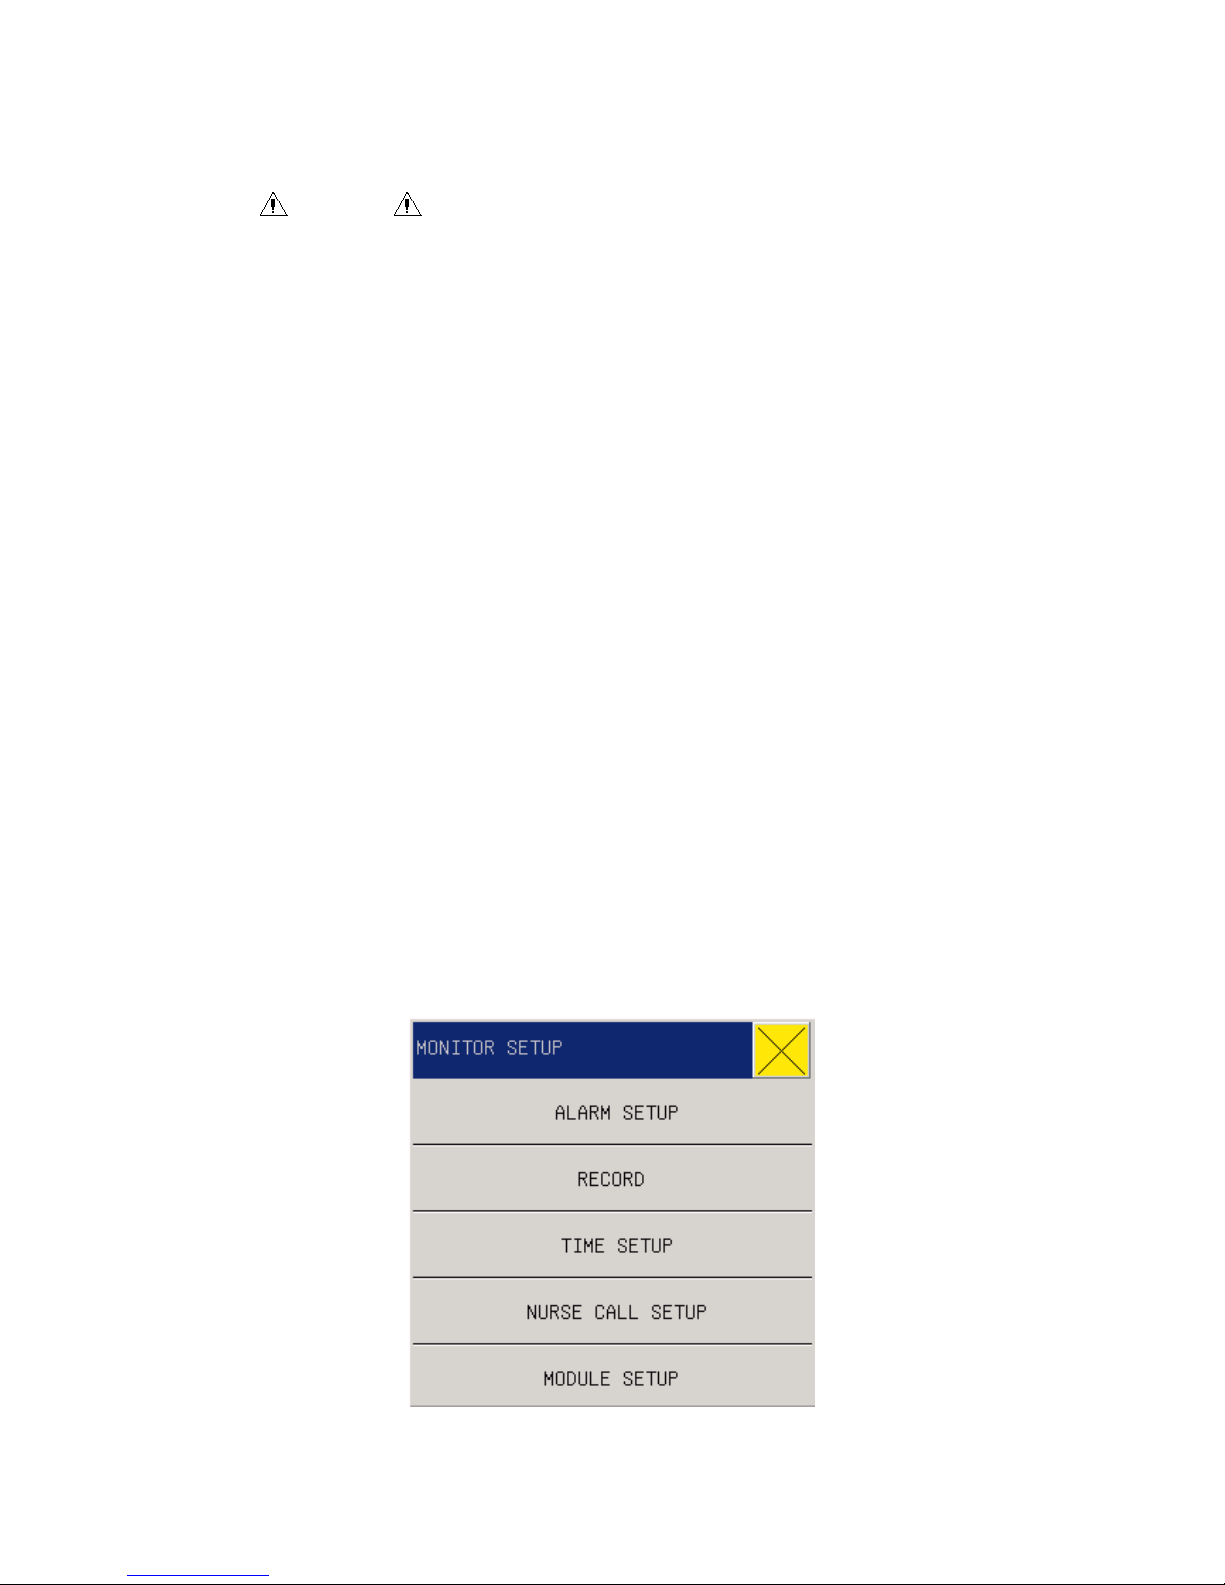
Select the “SELECTION” in the “MENU MENU” and sub-menu following with Figure below,
including
Fig 3-4 Selection Setup
3.3.1 ALARM Volume
In the system there are five levels of Alarm Vol: OFF, 1~4.
Page 26
17
"OFF" level means the alarm sound is closed.
WARINING
Where the alarm volume of the system is set at OFF, the monitor will not give alarm
sound in case of alarm, so you should use this function carefully.
3.3.2 HEART BEAT VOLUME
In the “SYSTEM MENU” select the “SELECTION”. Pitch on the “BEAT VOL ” with the cursor
and turn the knob to select the volume from such five options as “OFF”, “1”,“2”、“3” and “4”.
3.3.3 KEY VOL (Keyboard Vol )
Pitch on the “KEY VOL ” with the cursor and select the volume from such five options as “OFF”,
“1”,“2”、“3” and “4”.
3.3.4 LCD LIGHT(LCD Brightness)
In the system there are five Brightness level, i.e. “1~5”, where “5” means the maximum
brightness.
3.4 MONITOR SETUP (Monitor Setting)
Select MONITOR SETUP in MAIN MENU, sub-menu following with figure below, including
Fig 3-5 Monitor Setup
Page 27

18
3.4.1 ALARM SETUP
Alarm Setup has the following options:
ALM REC TIME (Alarm Record Time):
In case of physiological alarm, the system can record the information before and after the alarm
time. The system can give three kinds of time, i.e., 4 seconds, 8 seconds, 16 seconds. The seconds
in the options are the sum of seconds before and after the alarm time. For example, 8 seconds
mean the information within 4 seconds before the alarm time and within 4 seconds after such a
time.
ALM PAUSE TIME (Alarm pause time):“1 minute”, “2 minutes” or “3 minutes”
ALM LIMIT (Display alarm limits):”ON” and”OFF”
ALM LATER: Disabled ,5s,10s,15s,20s. Select "Disable".
when an alarm occurs, the instrument that occurs immediately alarm; When Select "five seconds",
alarm occurs only when the parameters continue to exceed the the alarm upper or lower limit of 5
seconds instrument, other settings and so on. The purpose of this feature is to reduce the instant
false alarms, allow doctors to more accurately grasp the situation.
3.4.2 RECORD (Record output setting)
Options for record output:
REC WAVE1/ REC WAVE2: can not change
REC RATE: 25.0/50.0 mm/s, record speed
REC GRID: ON/OFF
RT REC TIME: 3S/5S/8S/CONTINUAL (real-time record time)
CONTINUAL means after pressing PRINT BUTTON
, monitor will keep printing
parameters and waveform, until press
to stop
Caution
The recorder is a component for option.
Caution
Where two similar waveforms are selected, the system will automatically adjust the
other one into a different one.
Page 28

19
3.4.3 TIME SETUP (System Time Setting)
"TIME SETUP" with options below:
Setup year, month, day, hours, minutes and seconds.
Pitch on the content required for correction.
3.4.4 3.4.4 NURSE CALL SETUP
Options in nurse call setting:
ALM ON/OFF: ON/OFF
ALM LEV(Alarm lever): high, middle, low
3.4.5 MODULE SETUP
Options in module setup:
ECG and SpO2 are not optional.
TEMP: ON/OFF. When it is ON, machine can monitor TEMP, when it is OFF, machine can
not monitor TEMP, and no parameter area of TEMP in main interface.
RESP: ON/OFF. When it is ON, machine can monitor RESP, when it is OFF, machine can not
monitor REST, and no parameter area of RESP in main interface.
NIBP: ON/OFF. When it is ON, machine can monitor NIBP, when it is OFF, machine can not
monitor NIBP, and no parameter area of NIBP in main interface.
IBP<1,2>(optional): ON/OFF. When it is ON, machine can monitor IBP<1,2>, when it is OFF,
machine can not monitor IBP<1,2>, and no parameter area of NIBP in main interface.
CO2(optional): ON/OFF. When it is ON, machine can monitor CO2, when it is OFF, machine
can not monitor CO2, and no parameter area of CO2 in main interface.
AG(optional): ON/OFF. When it is ON, machine can monitor AG, when it is OFF, machine
can not monitor AG , and no parameter area of NIBP in main interface.
Caution
When CO2 module is set to "On", RESP option is the system default to "Off".
Caution
When the temperature module manufacturers setting temperature module is locked,
this menu "TEMP" is not option.
Caution
Page 29
20
Factory software program determines the option module switch settings when CO2
(CO2 mainstream and sidestream module work), no AG the options appear AG ,
CO2-free options, in short, both only appear single, and will not appear in this menu
3.5 WORK INTERFACE SELECTION
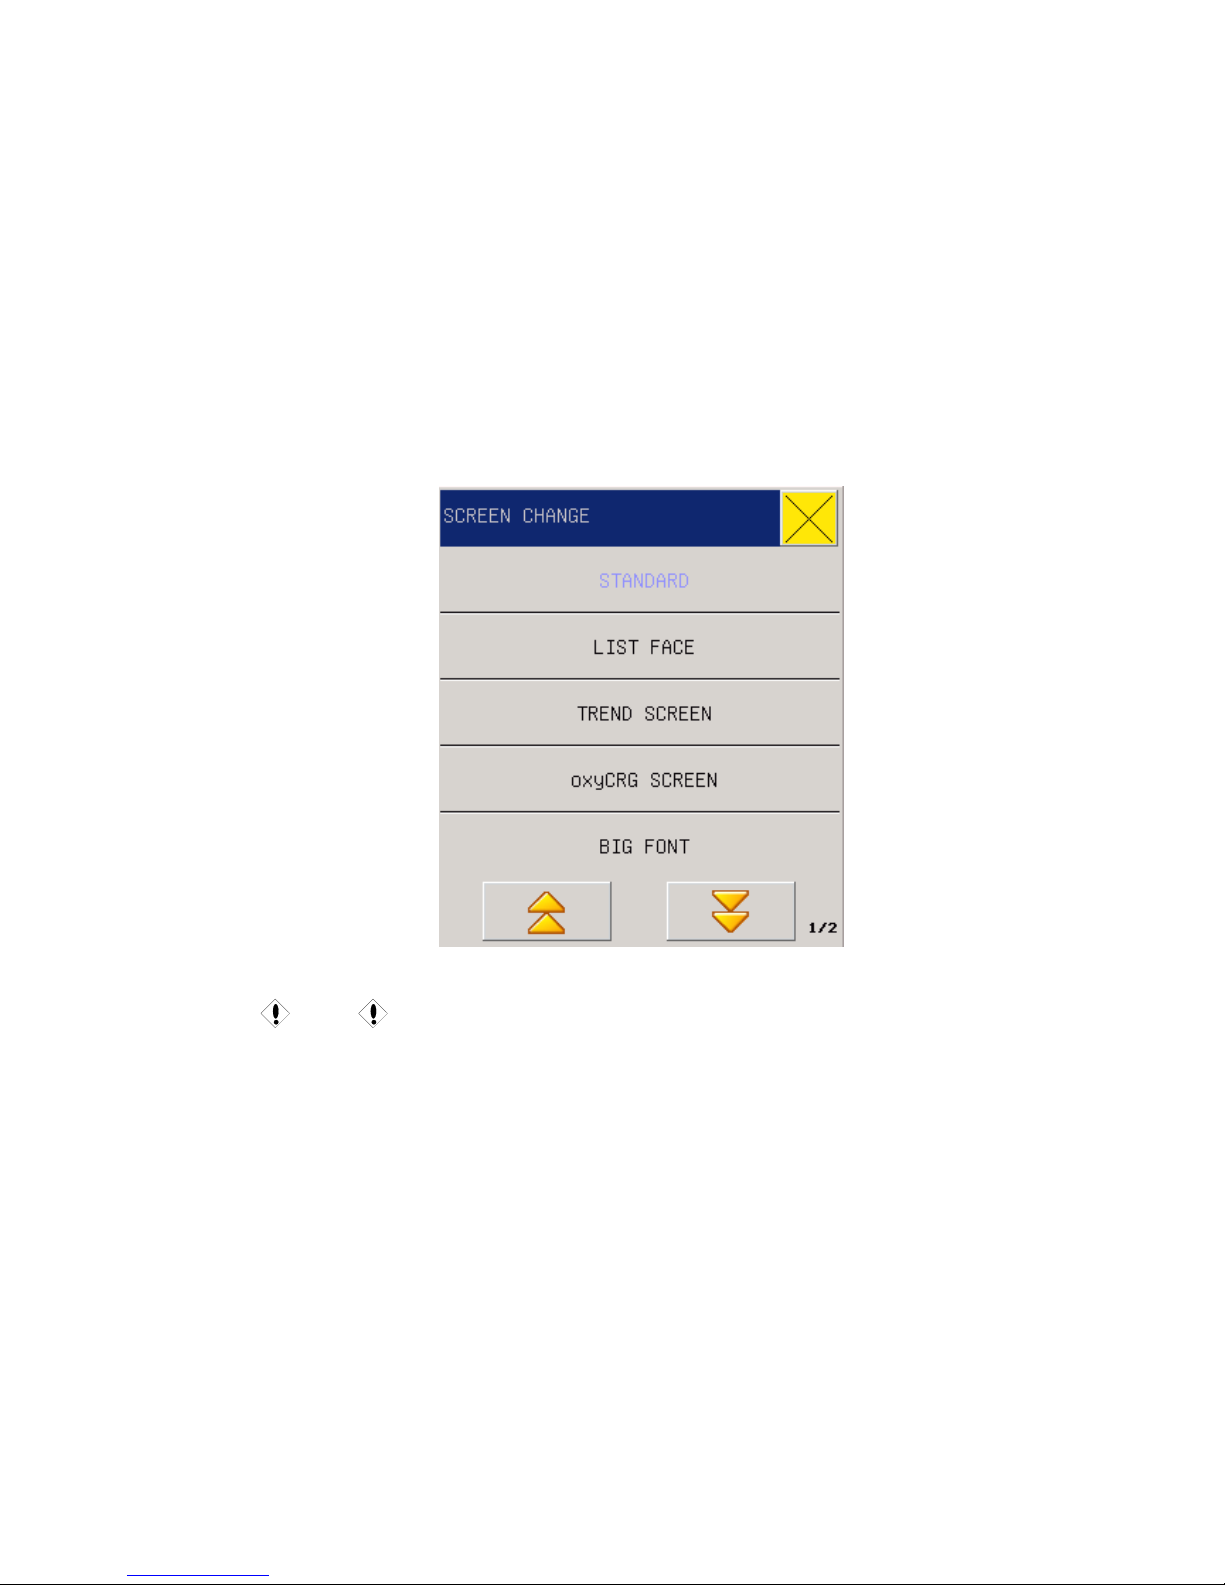
In the System Menu, select the “FACE SELECT” to enter the dialog box in the following Figure.
Here there are such seven options as “STANDARD”, “LIST FACE” “TREND SCREEN”,
“oxyCRG SCREEN” , “BIG FONT” , “7CH MULTI-LEADS DISPLAY” and AG SCREEN.
Fig 3-6 Work Interface
Caution
z " 7CH MULTI-LEADS DISPLAY " of the measurement setup "by the" lead type
"decision, when the lead type is set to" 5 lead ", this menu is “7CH
MULT I-LEADS DISPLAY”.
z When the lead type is set to "3 lead", it not have the menu.
z When the instrument function with AG anesthetic gas, module switch is set to
"On", this menu will have “AG SCERRN”
3.6 TREND SCREEN
Trend gragh for the previous 1 hour can be diplayed in the resolution of one data per one second
or one data per five seconds.
Page 30
21
Trend gragh for the previous 120 hour can be diplayed in the resolution of one data per minute,
per five minutes or per ten minutes.
Users can select the TREND Diagram Review item under the System menu so as to pop up the
following window:
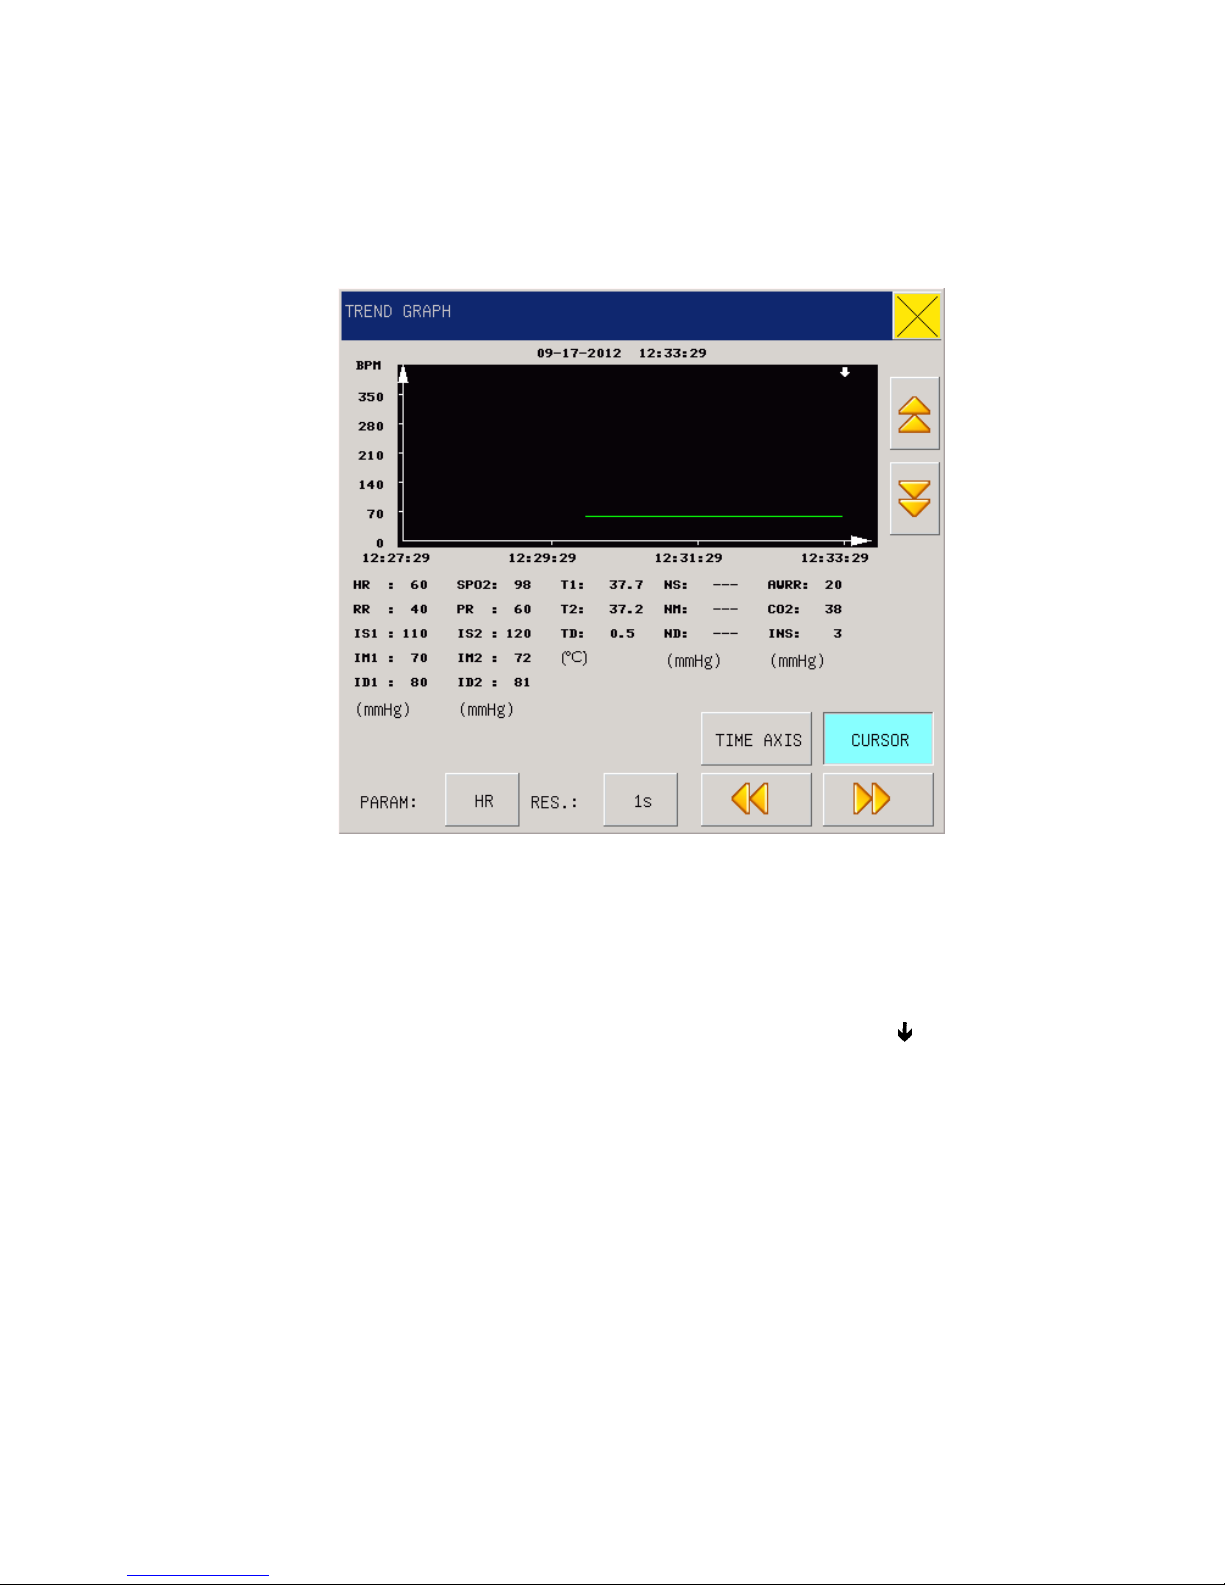
Fig 3-7 Trend Graph
Parameter selection: HR、RR、SPO2、PR、TEMP、NIBP、IBP1、IBP2、CO2、INS、AWRR.Y-axis
means measurement value, X-axis means measurement time. “Д is cursor for trend graph, The
measurement values it points to display at the bottome of the graph, corresponding time at the
upper end of the graph: 2012-09-17 12:33:29。
Vertical axis is for measured values and horizontal axis for measurement time. The “
” symbol is
the cursor for TREND diagrams, and the measured value at the position it arrows is displayed
below the TREND diagram while its corresponding time is displayed above the TREND diagram.
3.7 TREND TABLE (TREND Figure)
TREND Figure data over the previous 120 hours can be displayed in the following resolutions: 1
minute, 5 minutes, 10 minutes, 30 minutes and 60 minutes.
Select “TREND TABLE” under the system menu to pop up the following TREND Figure:
Page 31
22
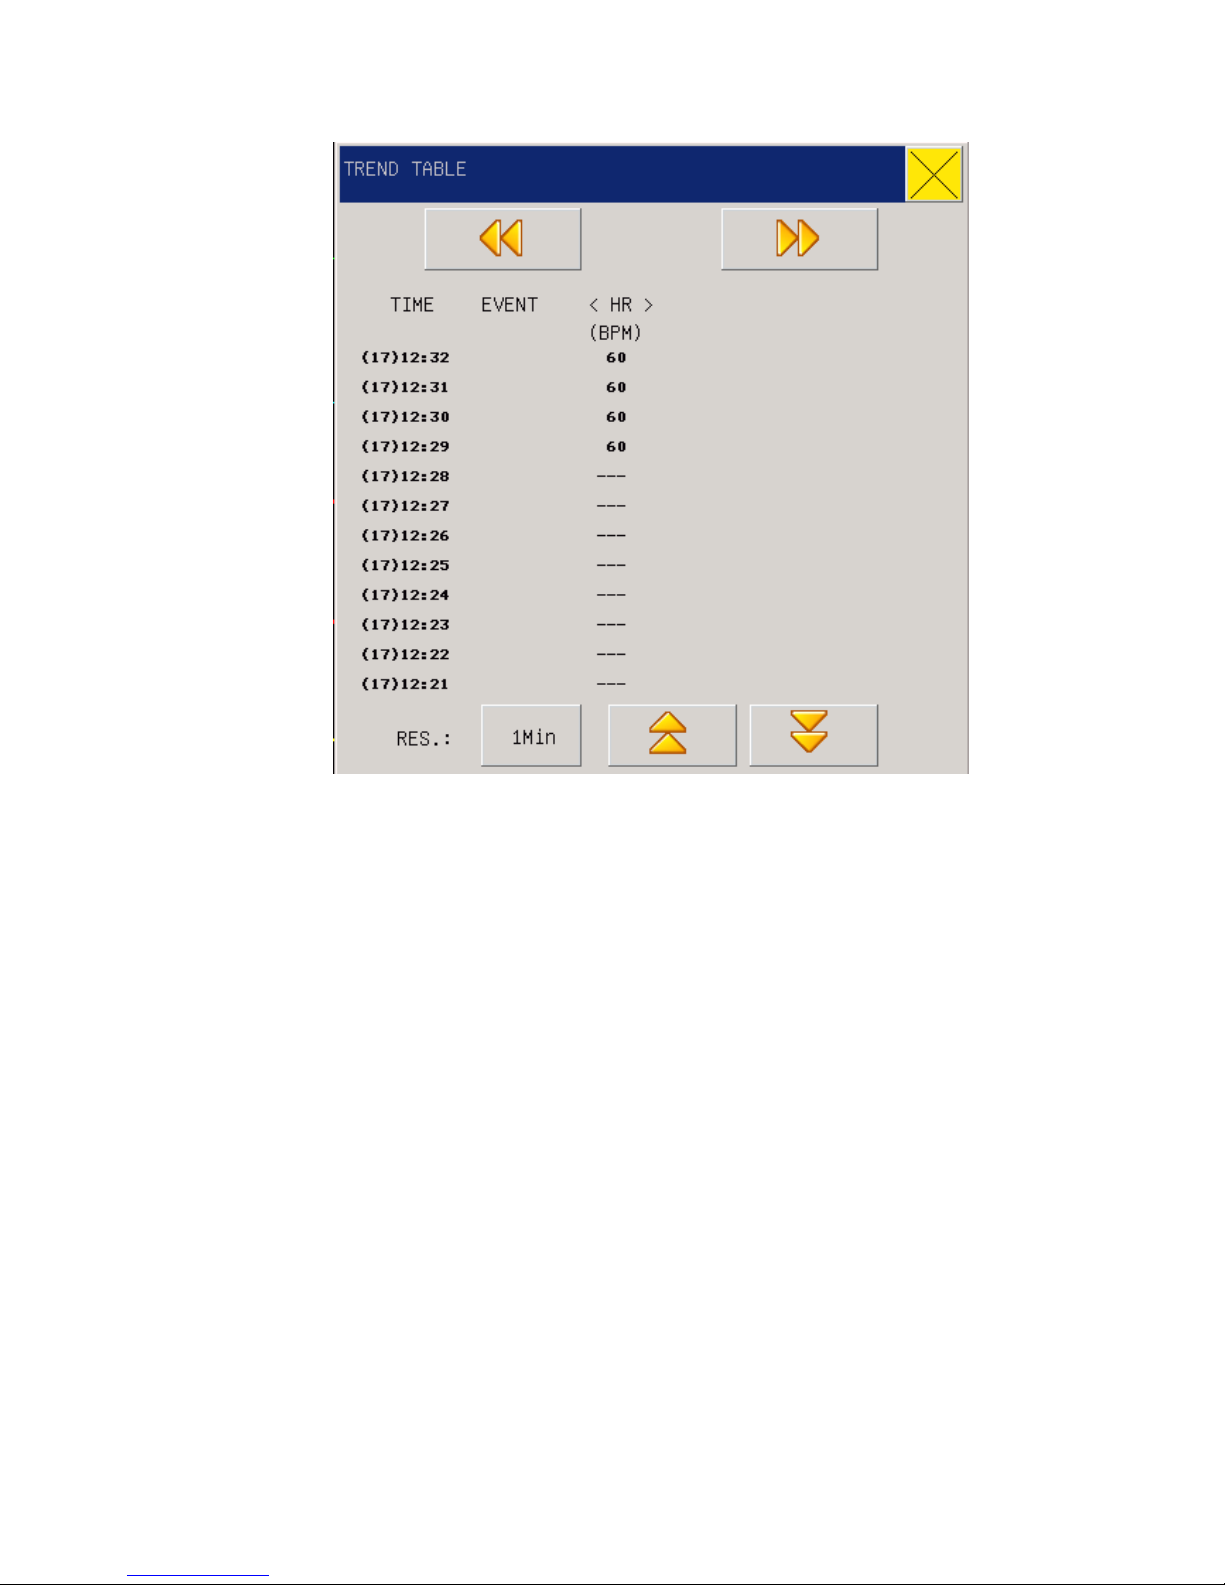
Fig 3-8 Trend Table
Time corresponding to various groups of TREND data is displayed at the left column, with dates
braced. What are listed is the cases that have once been marked, which corresponds to the time of
the marked cases. Parameters in the TREND Figures can be categorized into the following 9
groups:
HR,
ST1, ST2
RR,
T1,T2,TD
SPO
2
, PR
NIBP ((S/ D/M)DATE
IBP1(S/D/M)
IBP2(S/ D/M)
CO
2
INS AWRR
NIBP TREND data has its own characteristics; besides of measured values, below each
“measurement point” there is time for this NIBP measurement.
3.8 NIBP RECALL
Page 32
23
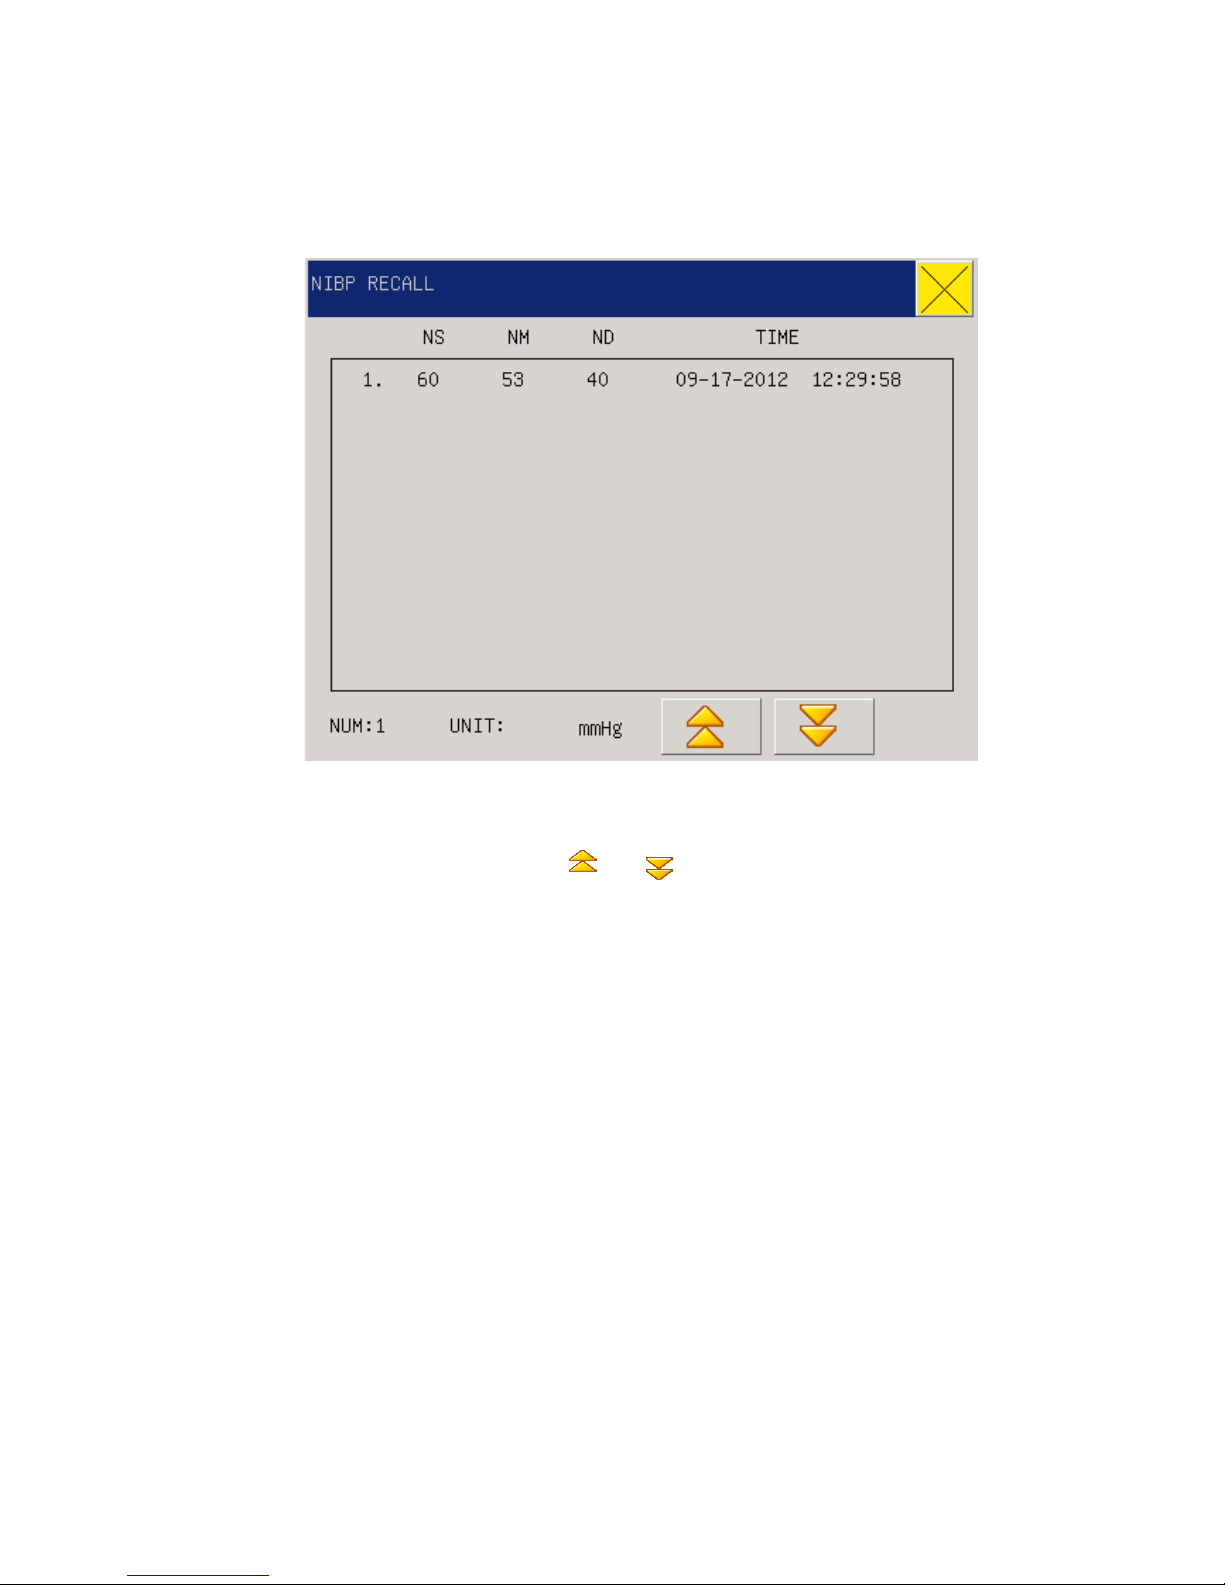
The monitor can display the latest 2000 NIBP measurement data in the NIBP review function.
After users select the NIBP Data Review item under the System menu, the windows will display
the latest 10 NIBP measurement results and measurement time, as shown in the following:
Fig 3-9 NIBP Recal l
Data is sorted in time sequence, from early to late, and each screen can display 10 times of
measurement data, while users can select “ ” or “ ” to view later or earlier data. Maximally
2000 measurement results can be displayed, and when the measure times are over 2000, only the
latest 2000 will be displayed.
3.9 Reviewing alarm
When parameter alarm occured ,the monitor would be memory the alarm parameter data. Enter
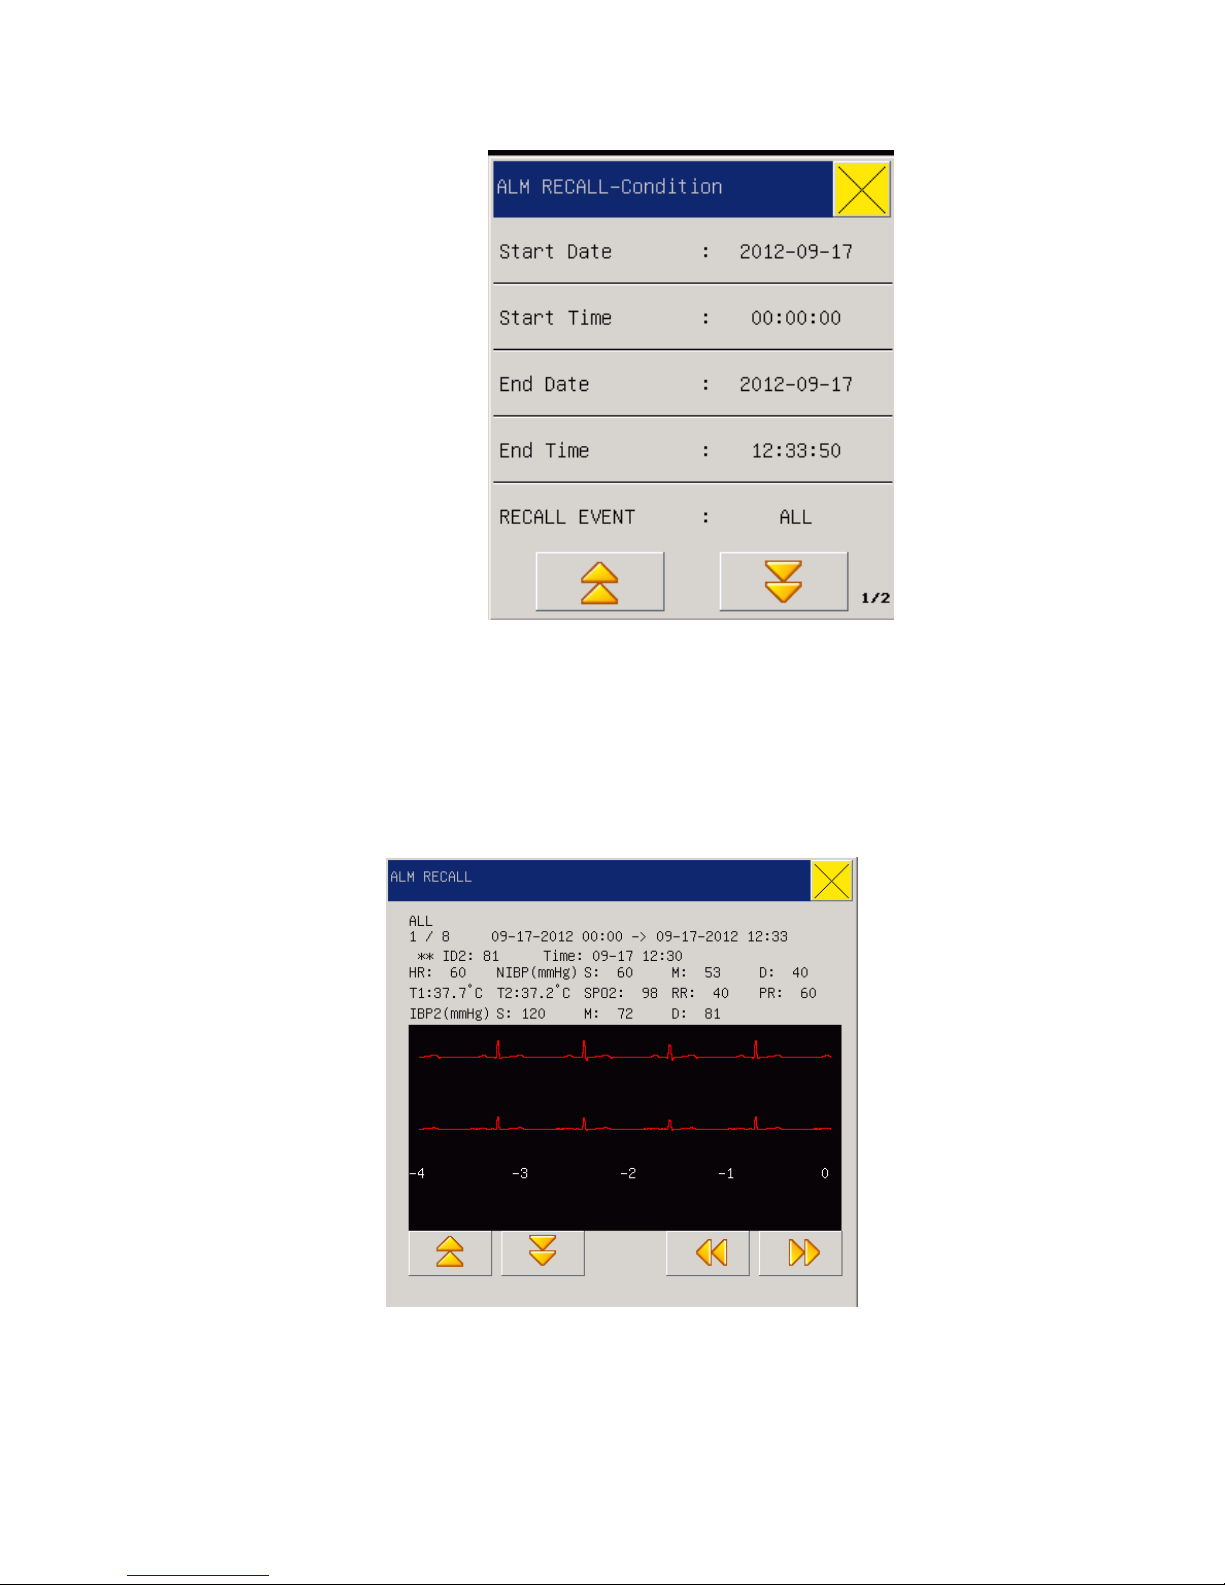
the “main menu” selected “ALM RECALL-condition” could be recheck the patient status in
“RECALL EVENT”:
Page 33
24
Fig 3-10 Alarm Recall condition
1. Setup up the “recall event” from start time/date to end time/date
2. Would be re-check the alarm status in “RECALL EVENT” menu , the events include
“ALL , ECG ,SPO2 , NIBP , IBP , CO2 , RESP , TEMP” status.
3. Optional “ALM-RECALL_Condition” window , would be recall the alarm parameter
and waveform ,following with figure below:
Fig 3-11 Recall event
Page 34
25
3.10 WAVE RECALL
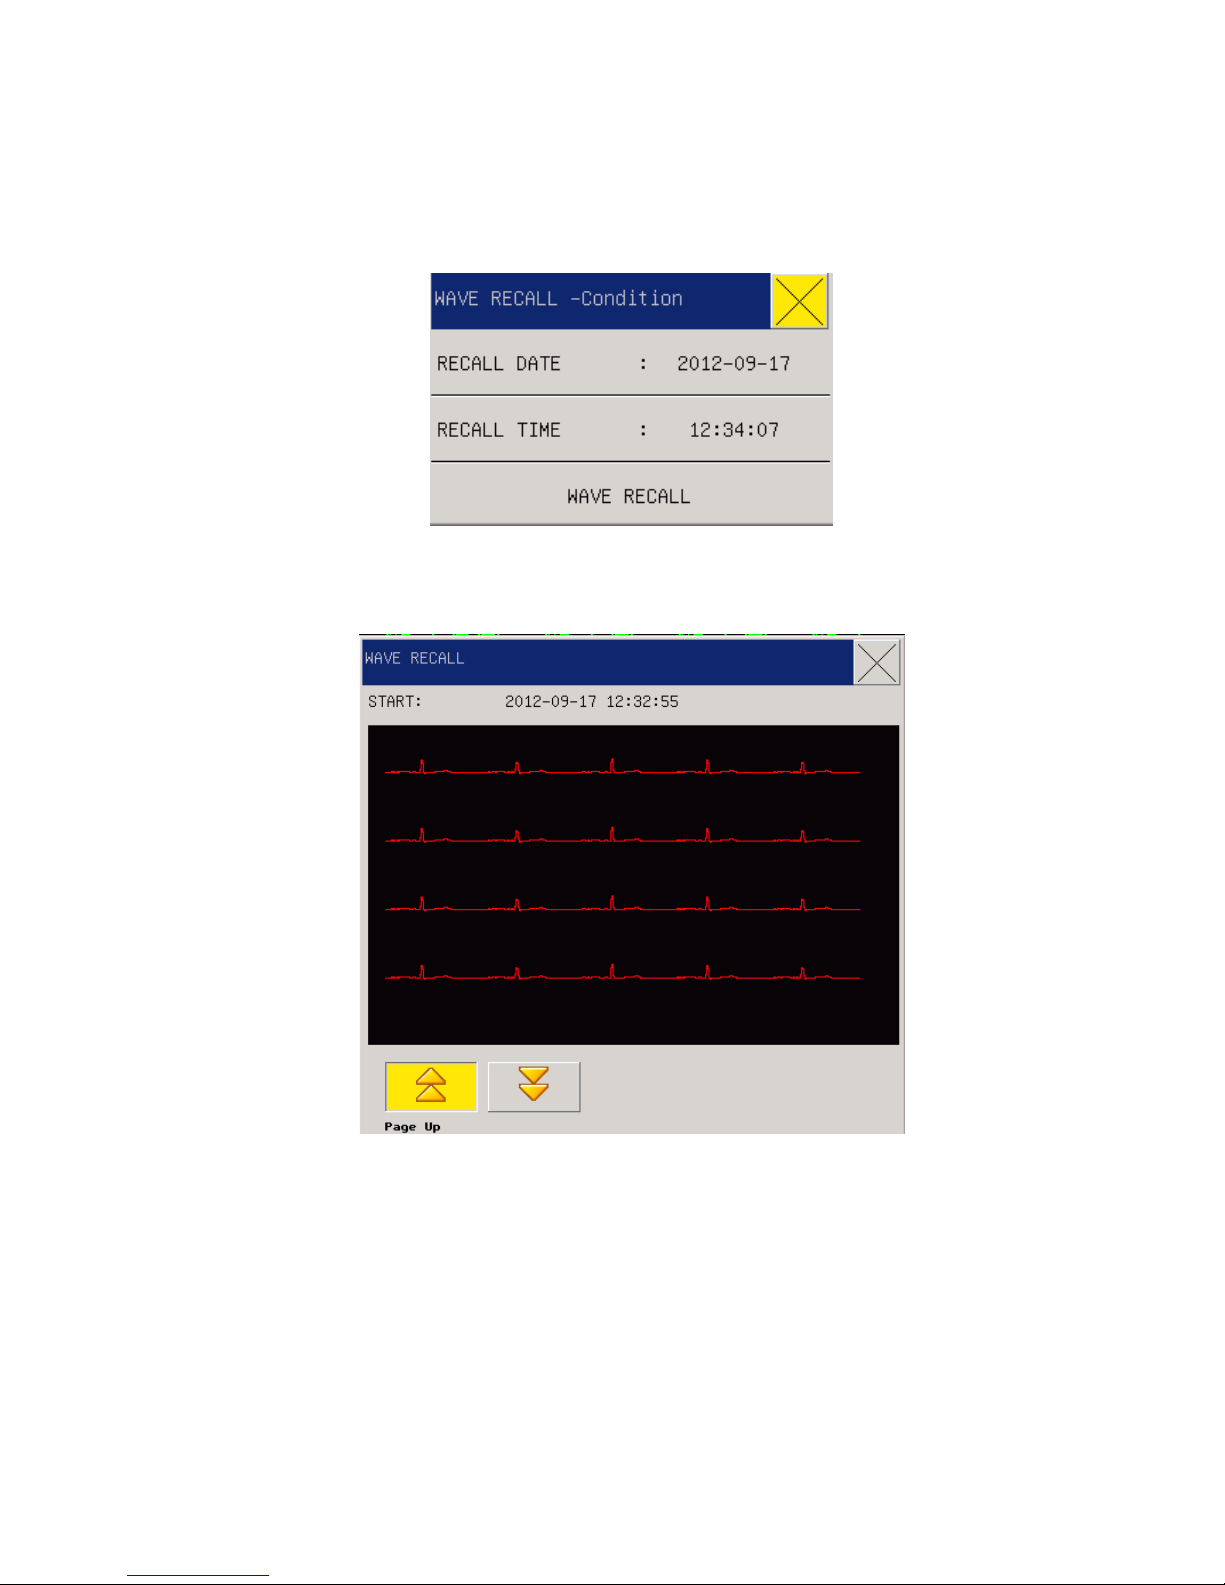
In “main menu” selected the “WALL RECALL-Condition”could be recall the parts information or
all information within memory data , following with figure below
Fig 3-12 WAVE RECALL-Condition
Setup the review types of the recall events and times , enter in “WAVE RECALL-Condition”
selected “WAVE RECALL ” would be display the window , following with figure below:
Fig 3-13 WAVE RECALL
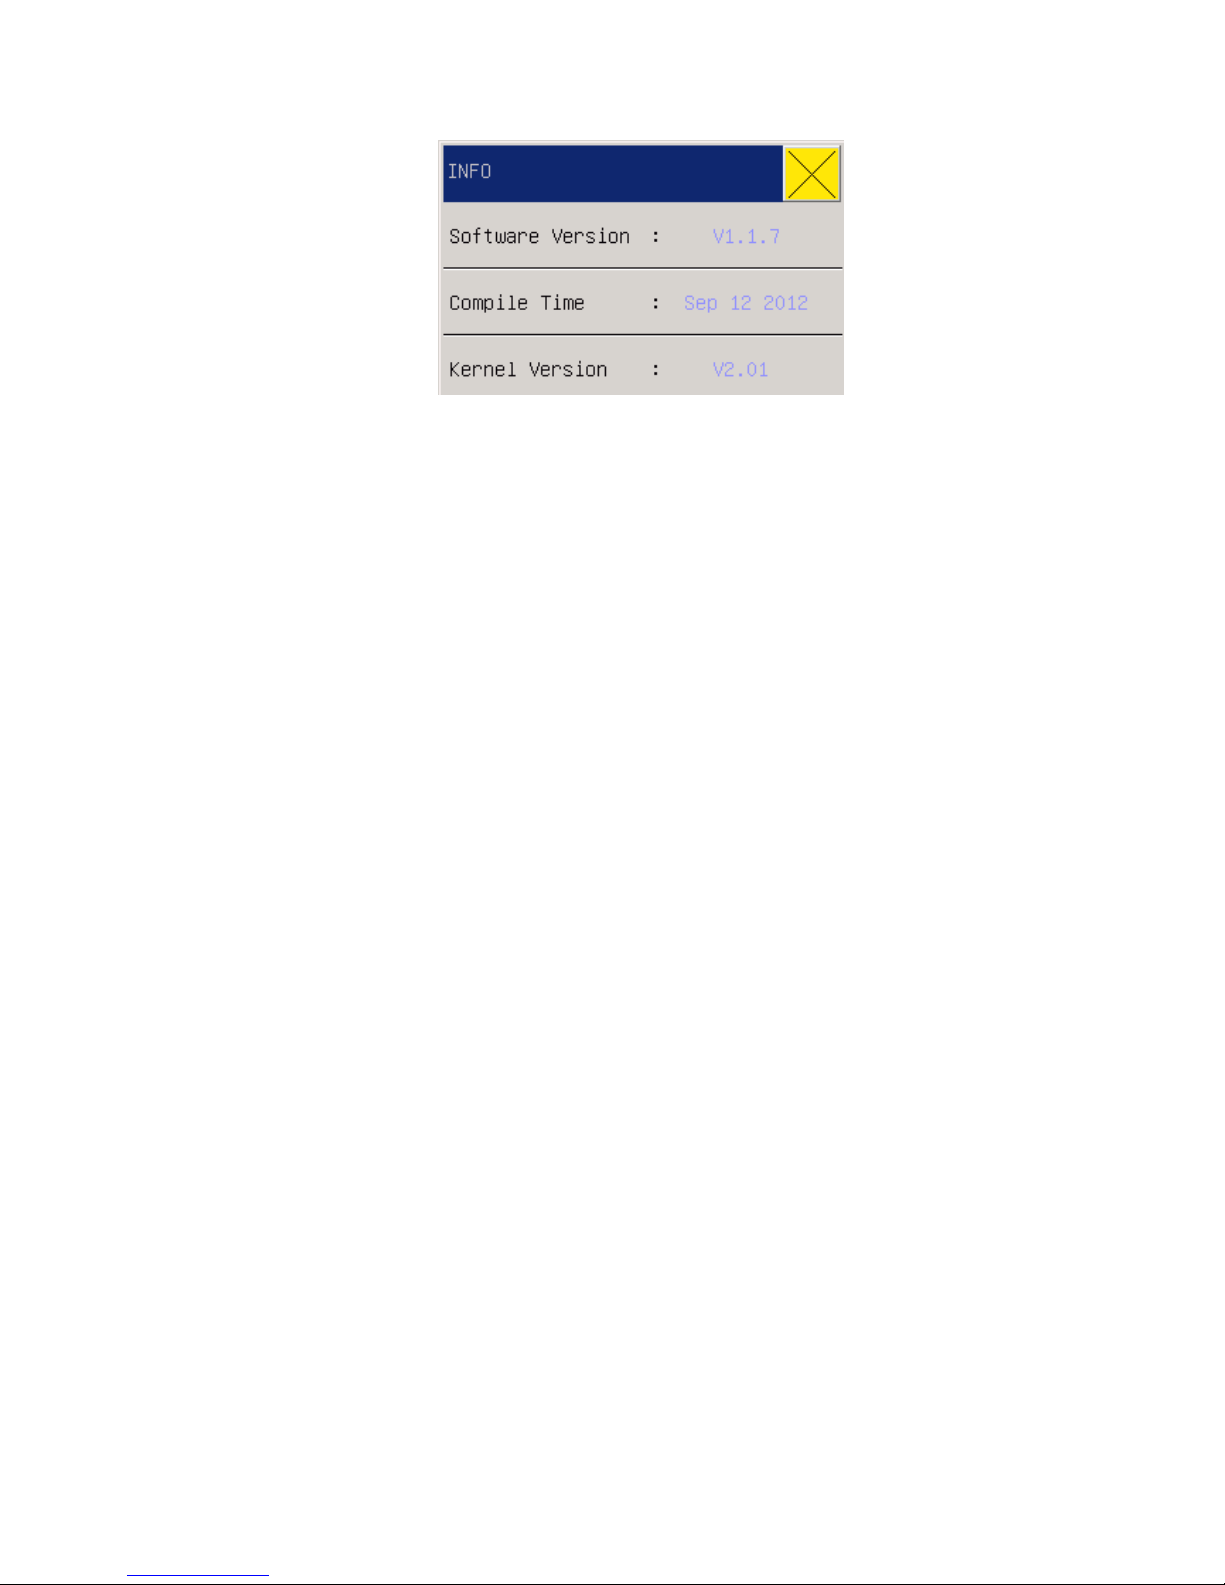
3.11 INFO (Monitoring Information)
In the “MAIN MENU” select the “INFO” to look through the version information of the software
and hardware.
Page 35
26
Fig 3-14 Monitoring Information
3.12 DRUG CALCULATION & TITRATION LIST
The portable-type multi-parameter monitor can provide the computation for 15 kinds of medicines
as well as the Titration List Display Function, and output the content of Titration list on the
recorder.
3.13 Maintenance
In the “MAIN MENU” select the “MAINTENANCE”, submenu pop out:
Password: 5188
a) Language:you can select CHINESE(SIMP) or ENGLISH
b) VGA size:12.1 `TFT
c) Wave Mode: Color or mono
d) Wave type: SpO2 waveform and RESP waveform has two type to select: LINE and
FILL
e) Exporting Data:Data including alarm data, NIBP list data and trend table data. The
monitor export data provides two options: CSV (* csv) file export and TXT (* txt) file
export. Based on the need to export data format
f) Screen Adjust: switch on touch screen as monitor indicated.
g) Factory default: you can into the menu “default” ,if you select “YES” , adopt factory
default big configuration ,the previous configure will be lost.
3.14 DEMO (Password: 5188)
In the “System Menu” select the “Demo” to have the “Input Demo Password” dialog box pop up.
Page 36

27
Input the correct password and the system will enter the waveform demonstration state.
Demo Waveform means the simulated one set by the manufacturer for showing the monitor
performance and helping users with training.
In the practical clinical l use it is prohibited to use such a function because it will make the
medical personnel misthink they are the monitored patient’s waveforms and parameters so as to
affect patient monitoring and delay treatment. So this menu is set with the password.
3.15 SCR LOCK(screen lock)
Screen Lock: In order to avoid non-operators misuse Monitor, the instrument has a touch screen
lock function. Click on the "SCR LOCK" button to lock the touch screen in the main interface.
For To unlock the screen , continuous point lived “ SCR UNLOCK” option for three seconds, you
can unlock the screen is locked.
Page 37
28
Chapter4 System W ork Interface
4.1 Work Interface Selection
In the Main Menu, select the “FACE SELECT” to enter the dialog box in the following Figure.
Here there are such seven interfaces to choose:
STANDARD, LIST FACE, TREND SCREEN, oxyCRG SCREEN, BIG FONT, 7CH
MULTI-LEADS DISPLAY, and Anesthesia-gas screen.
4.1.1 STANDARD
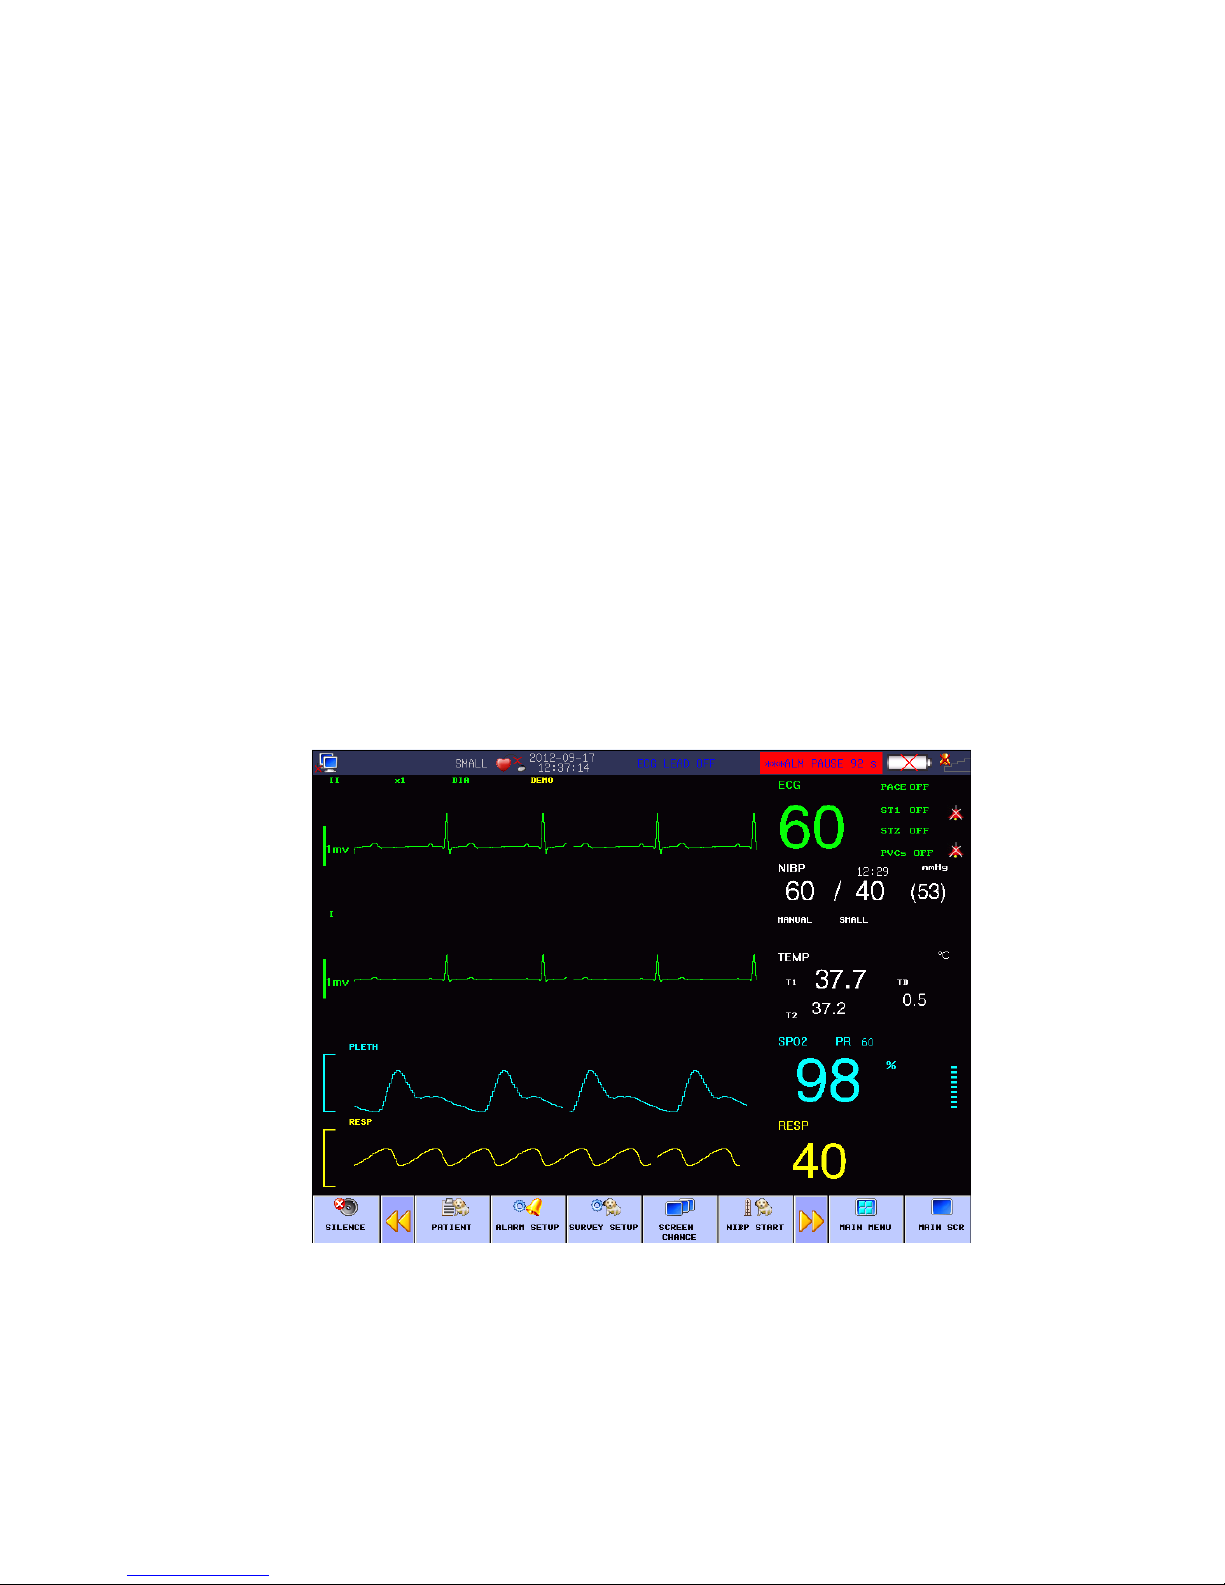
In the “FACE SELECT” menu, select the “STANDARD” to enter the standard work interface. The
Standard interface provides us the parameter waveforms under monitoring and displays the
parameters in the parameter area, as shown in the following picture:
Fig 4-1 Standard Interface
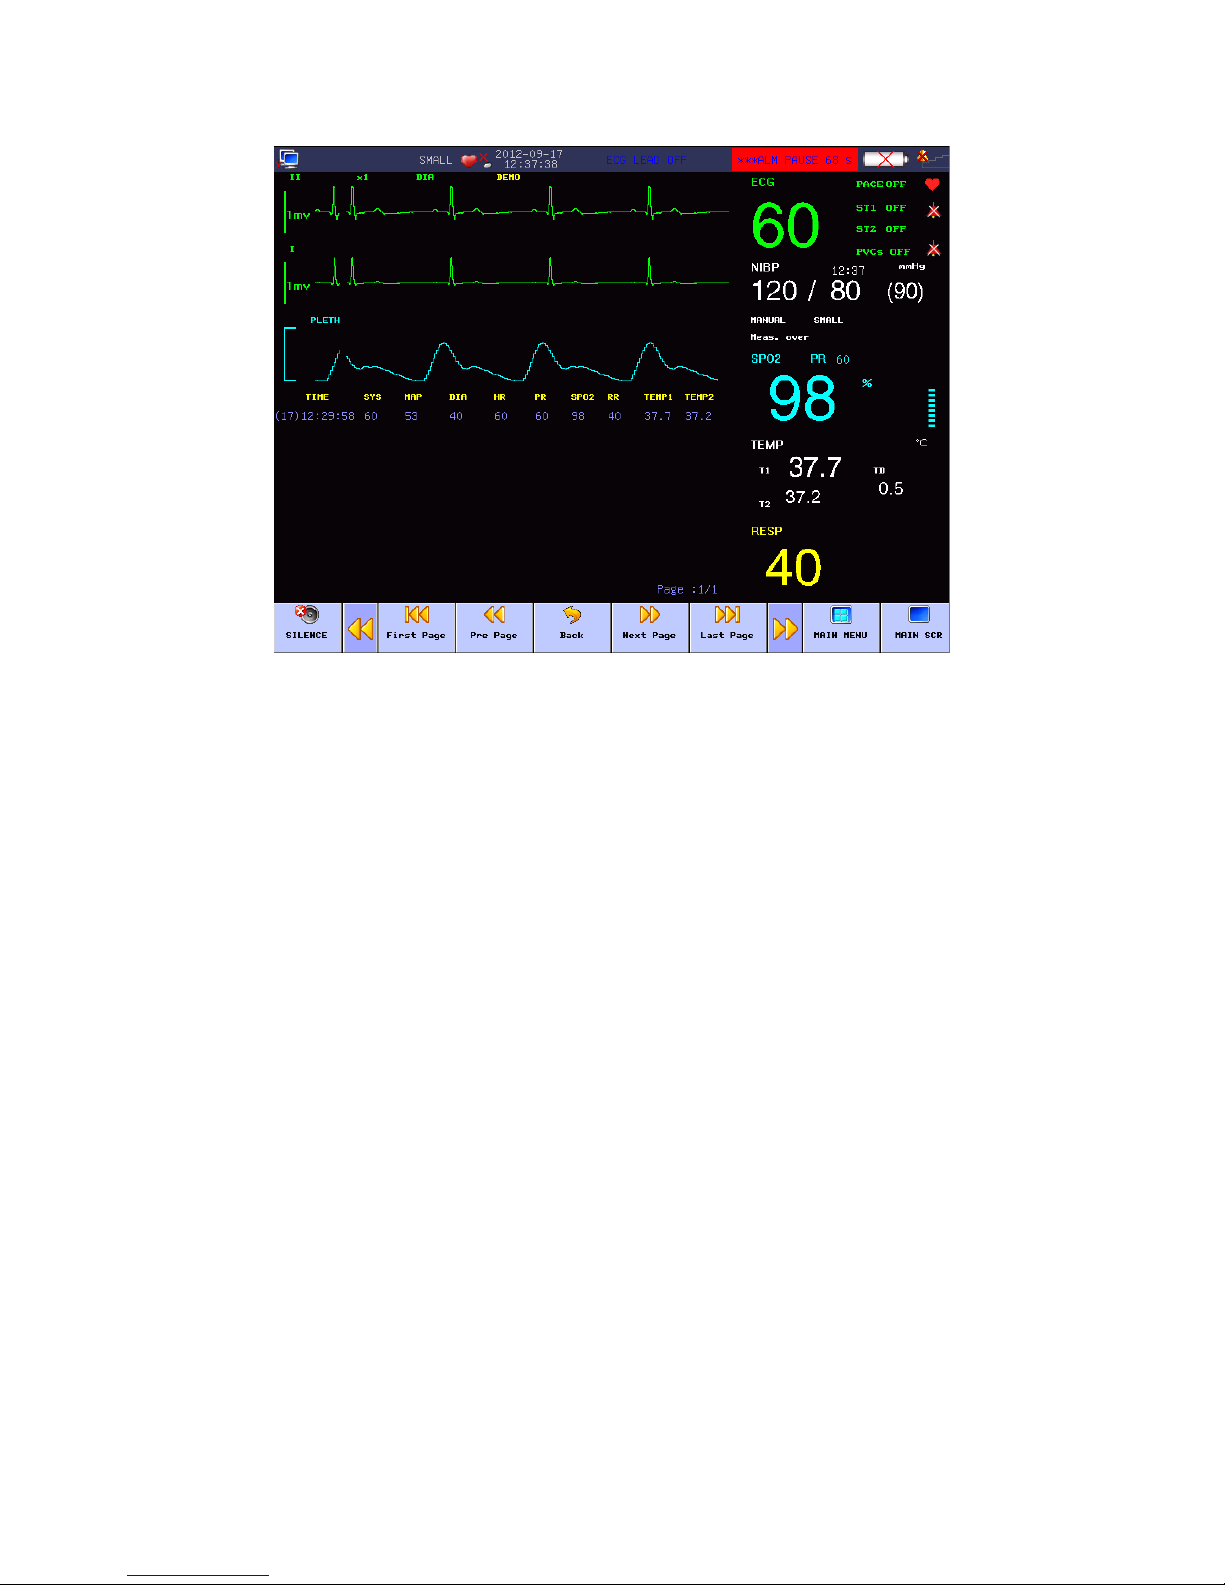
4.1.2 LIST FACE
In the “FACE SELECT” menu, select the “LIST FACE” to enter the LIST FACE work interface.
Page 38
29
Fig 4-2 List interface
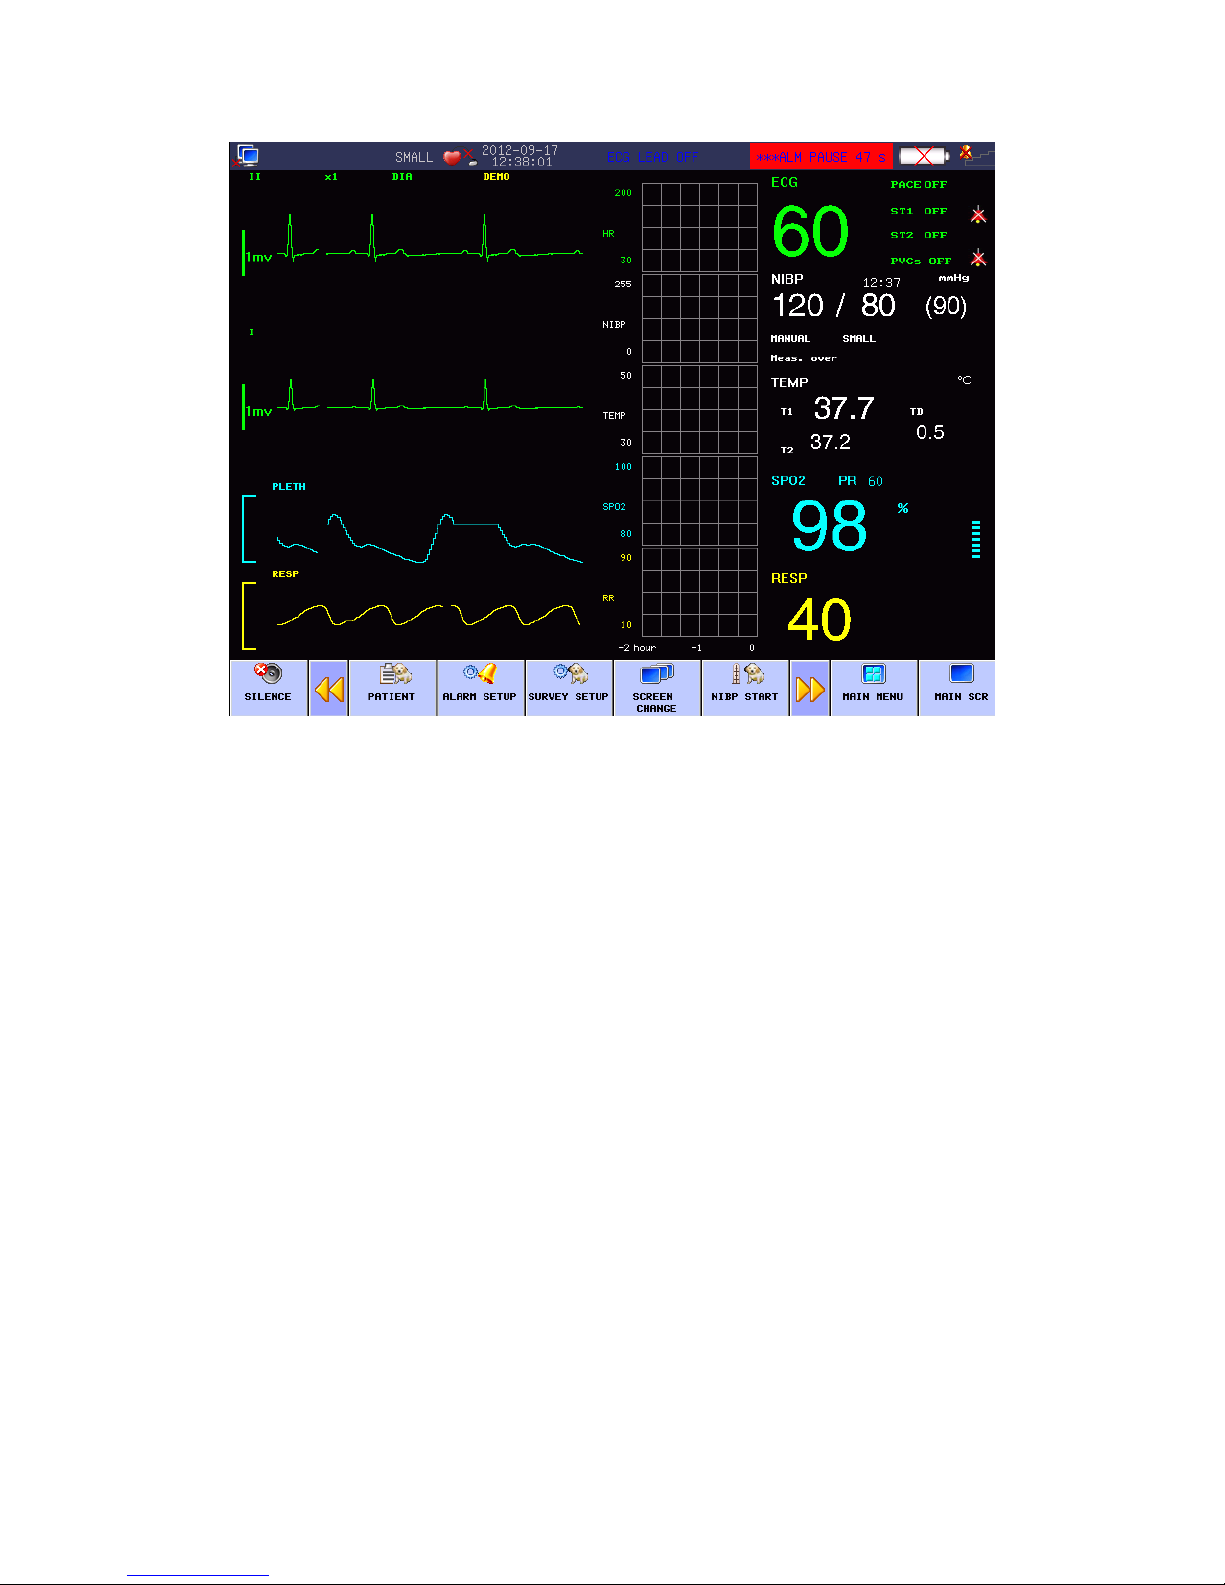
4.1.3 TREND SCREEN
Enter the “FACE SELECT” and select the “TREND SCREEN” in the Work Interface Selection
menu to enter such an interface.
Page 39
30
Fig 4-3 Trend Sreen Interface
Location of trend diagrams
TREND diagrams is located at right side of waveforms, with the same colors to the corresponding
parameters.
TREND length
Dynamic trend length is 2 hours; in a trend diagram, the right side of the horizontal axis is 0 hour,
and the left side is 2 hours.
End of trend concurrence interface
Out of the “Interface Selection” options, select any other work interface to end the trend
concurrence interface.
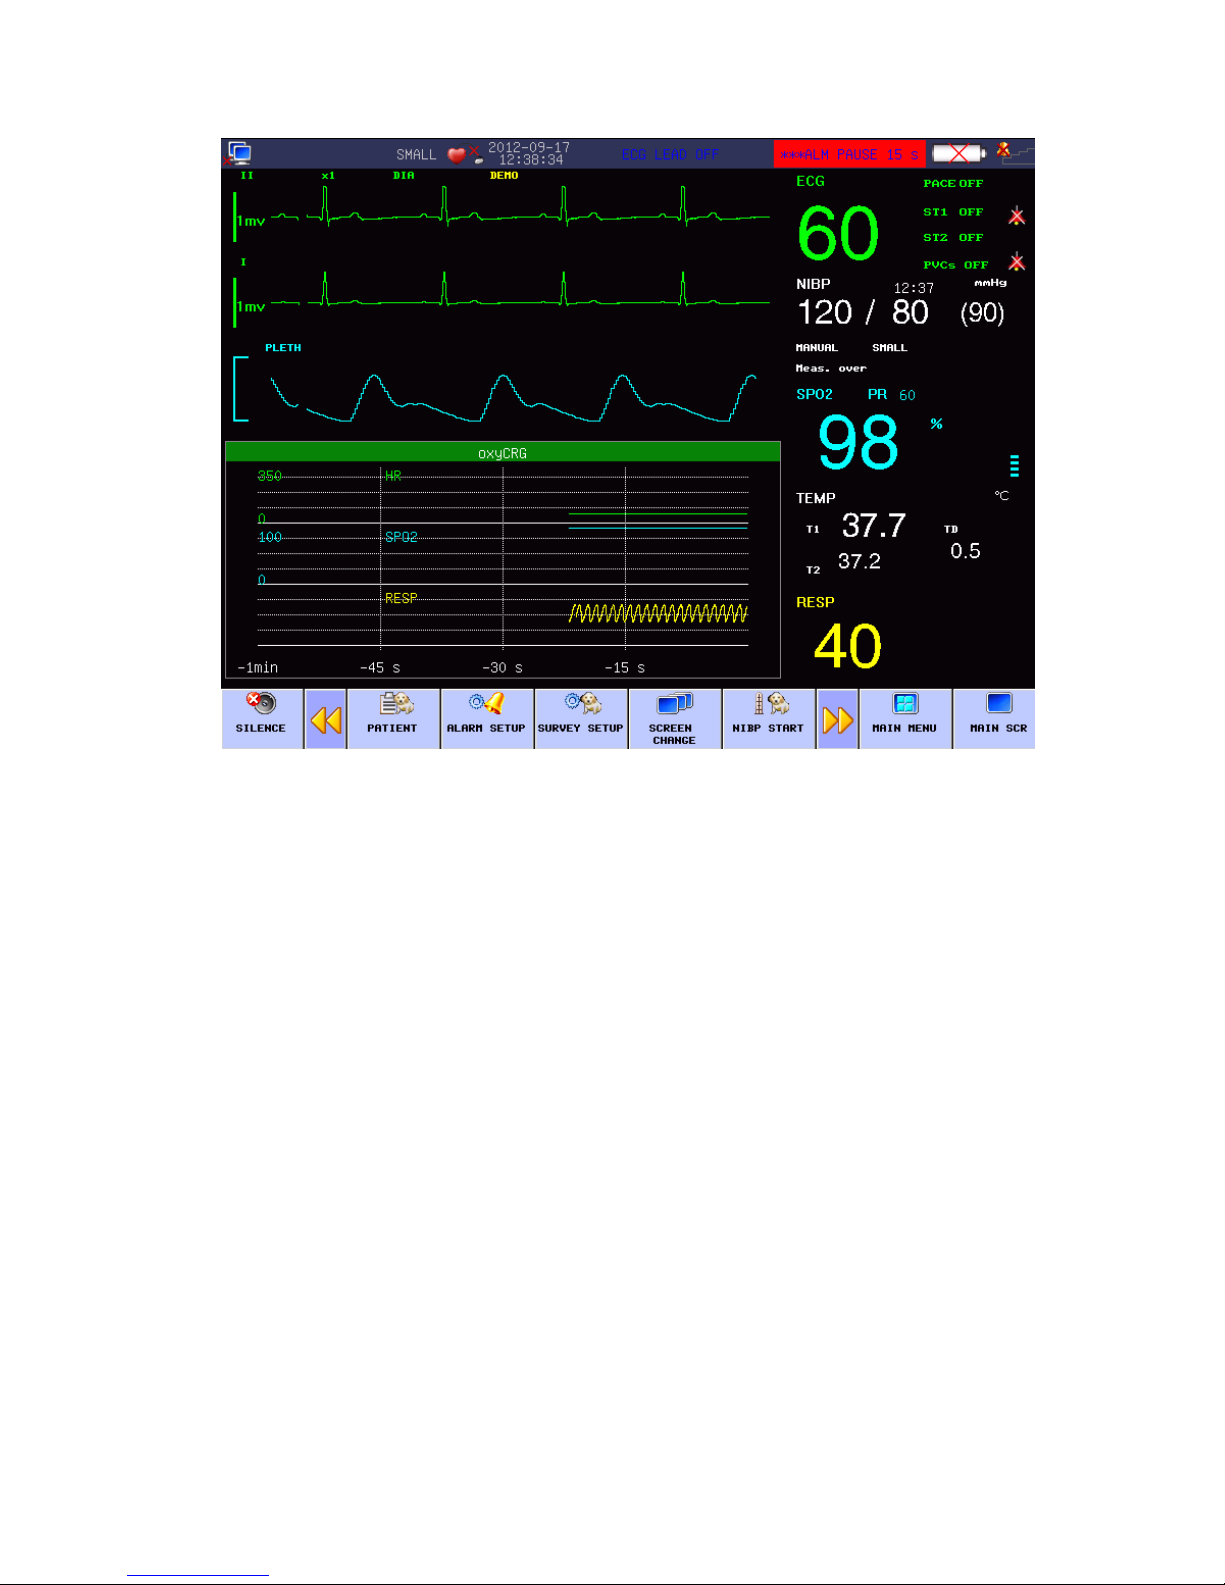
4.1.4 OxyCRG SCREEN
In the Work Interface Selection menu, select the “oxyCRG Screen” to enter the oxyCRG work
interface.
Page 40
31
Fig 4-4OxyCRG Screen
TREND Diagram in oxyCRG Interface
OxyCRG Dynamic Interface is consist of compressed respiratory wave and RR.
OxyCRG Trend Length Selection
Two hot key at the below part of dynamic interface: TIME and TYPE
TREND Diagram for “1 minute” and “2 minute” can be selected through the trend time
buttons.
Compressed Respiratory Wave and RR
“The function of “Respiratory Rate/Compressed Respiratory Wave” means the operator
can select the “PR Trend” or “Compressed Respiratory Wave” as needed, under which
the displayed content occupies the same position. Select the “PR Trend” and this
position will show the TREND Diagram of the respiratory rate; select the “Compressed
Respiratory Wave” and this position will show the respiratory wave after compression.
In the Work Interface Selection menu, select other work interface to end the OxyCRG work
interface.
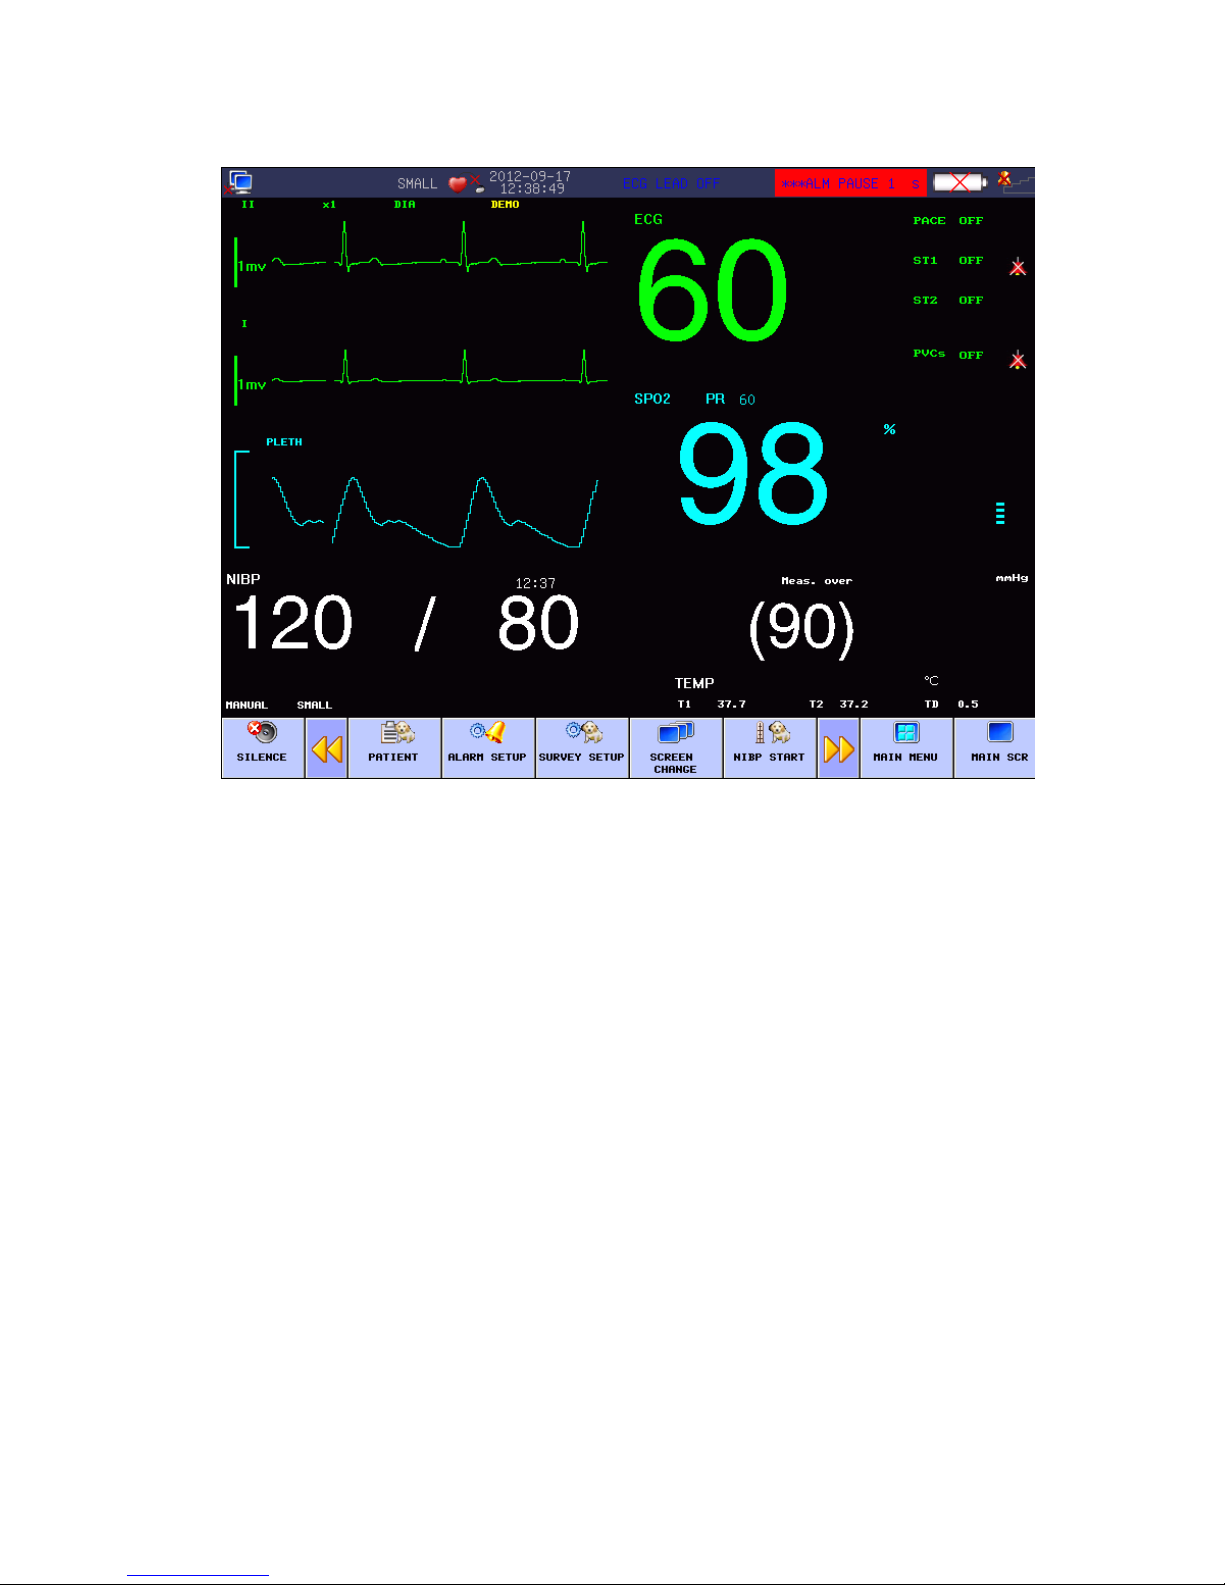
4.1.5 BIG FONT INTERFACE
In the Work Interface Selection menu, select the “BIG FONT” to enter the big font interface.
Page 41
32
Fig 4-5 Big Font Interface
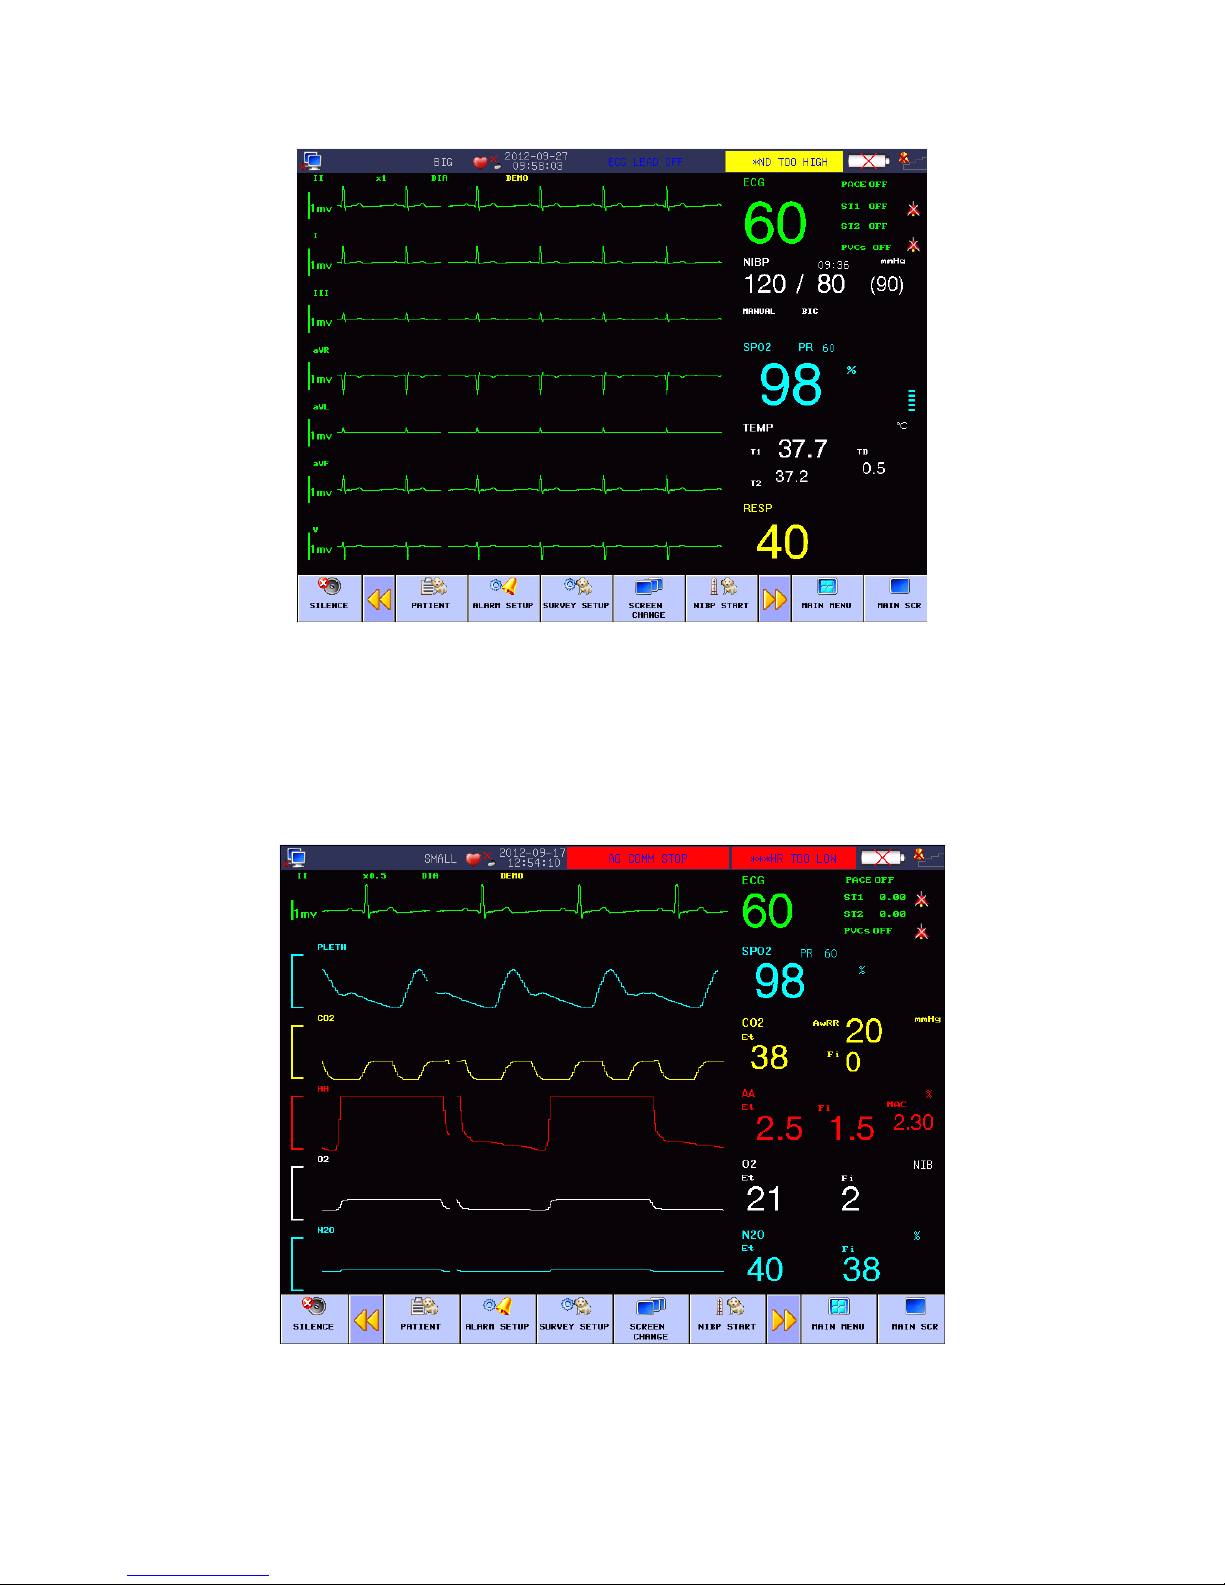
4.1.6 7-CH MULTI-LEADS DISPLAY
In the Work Interface Selection menu, select “7-CH MULTI-LEADS SCREEN” to enter the
MULTI-LEADS SCREEN interface. Users could observe seven ECG channels in this screen,
including II, I, III, AVR, AVL, AVF
Page 42
33
Fig 4-6 6-CHANNEL ECG DISPLAY
4.1.7 ANESTHESIA-GAS SCREEN (optional)
In the Work Interface Selection menu, select “ANESTHESIA-GAS SCREEN” to enter the
anesthesia-gas interface:
Fig 4-8 Anesthesia-gas screen
Page 43

34
Chapter5 Recording
In the Main Menu, select the “MONITOR SETUP”, then to RECORD menu
5.1 General Information on the Recorder
The recorder used with this monitor is a heat-sensitive array recorder, with print width of 50mm.
Recorder capability
1. Outputted waveforms run at 25mm /sec or 50mm / sec
2. Maximally record two waveforms
3. Grid output function is optional
4. English output
5. Real-time record time and waveforms are selected by users through menus
6. Automatic record interval is selected by users through menus, while waveforms are
identical to real-time records
5.2 Record Type
This monitor generates slip records of the following types:
Real-time continuous record;
Real-time 3, 5, 8-second record;
Automatic alarm record;
5.2.1 Real-time record
Start recording waveforms from the moment you press the button.
Real-time continuous record for 8-second defaulted by machine system (normally only for two
waveforms) or set by users through menu. Please refer to relevant chapters for details.
Caution
During output process, the next parameter alarming output will be outputted after
completion of the current output.
Page 44

35
5.2.2 Frozen waveform record
In case waveforms are frozen, the system can output the designated waveforms on the screen and
in such a way record those unusual waveforms captured by freezing.
5.2.3 The contents of the real time recording
Record time
Record type :real-time print ,alarm trigger print ,frozen print
ECG lead,1mV ruler, and gain
Paper speed : 25mm /sec. or 50mm / sec
Time
Bed number
HR ,RR
ST1,ST2
T1,T2
SPO2,PR
NIBP
5.3 Operation and Status Information of Recorder
5.3.1 Requirements on record paper
Only qualified heat-sensitive record paper can be used, otherwise there may be failure or quality
reduction in record, or damage to the heat-sensitive head.
5.3.2 Normal service
Do not pull out paper when the recorder is working.
Do not use recorder without record paper.
5.3.3 Insufficient paper
Don’t boot the recorder when there is a reminder of “add paper to the recorder” in the information
area. Please load qualified heat-sensitive record paper.
Page 45

36
5.3.4 Paper loading procedures
Open the recorder door;
Pull up the slide switch at the left rod of the recorder;
Load new paper exactly following the paper inlet, with the print side toward the
heat-sensitive head;
Slightly pull the paper exposed from the other side, and align the paper properly;
Pull back the slide switch at the left rod of the recorder;
Remove the paper from the paper outlet of the recorder;
Close the recorder door.
Caution
Paper loading must be done softly so as to avoid heat on the heat sensitive head. Unless
during paper loading or trouble shooting, the recorder door must be kept open.
5.3.5 Solution to paper jam
When the running voice of the recorder sounds improper or paper outputs improperly, users
should open the recorder door to check whether there is paper jam. Procedures to clear paper jam:
Cut the recorder paper at the paper outlet side;
Pull up the slide switch at the left rod of the recorder;
Pull out the recorder paper from the bottom;
Re-load paper.
Page 46
37
Chapter6 Trend
It can store 120 hours trend data, 2000 NIBP and 500 alarm events and support recording.
Observation methods are provided in this chapter.
6.1 TREND GRAPH (TREND Diagram)
TREND diagram for the latest 1 hour can be displayed one data per second or one data per five
seconds;
TREND diagram for latest 120 hours can be displayed one data per minute, per 5 minutes, or per
10 minutes.
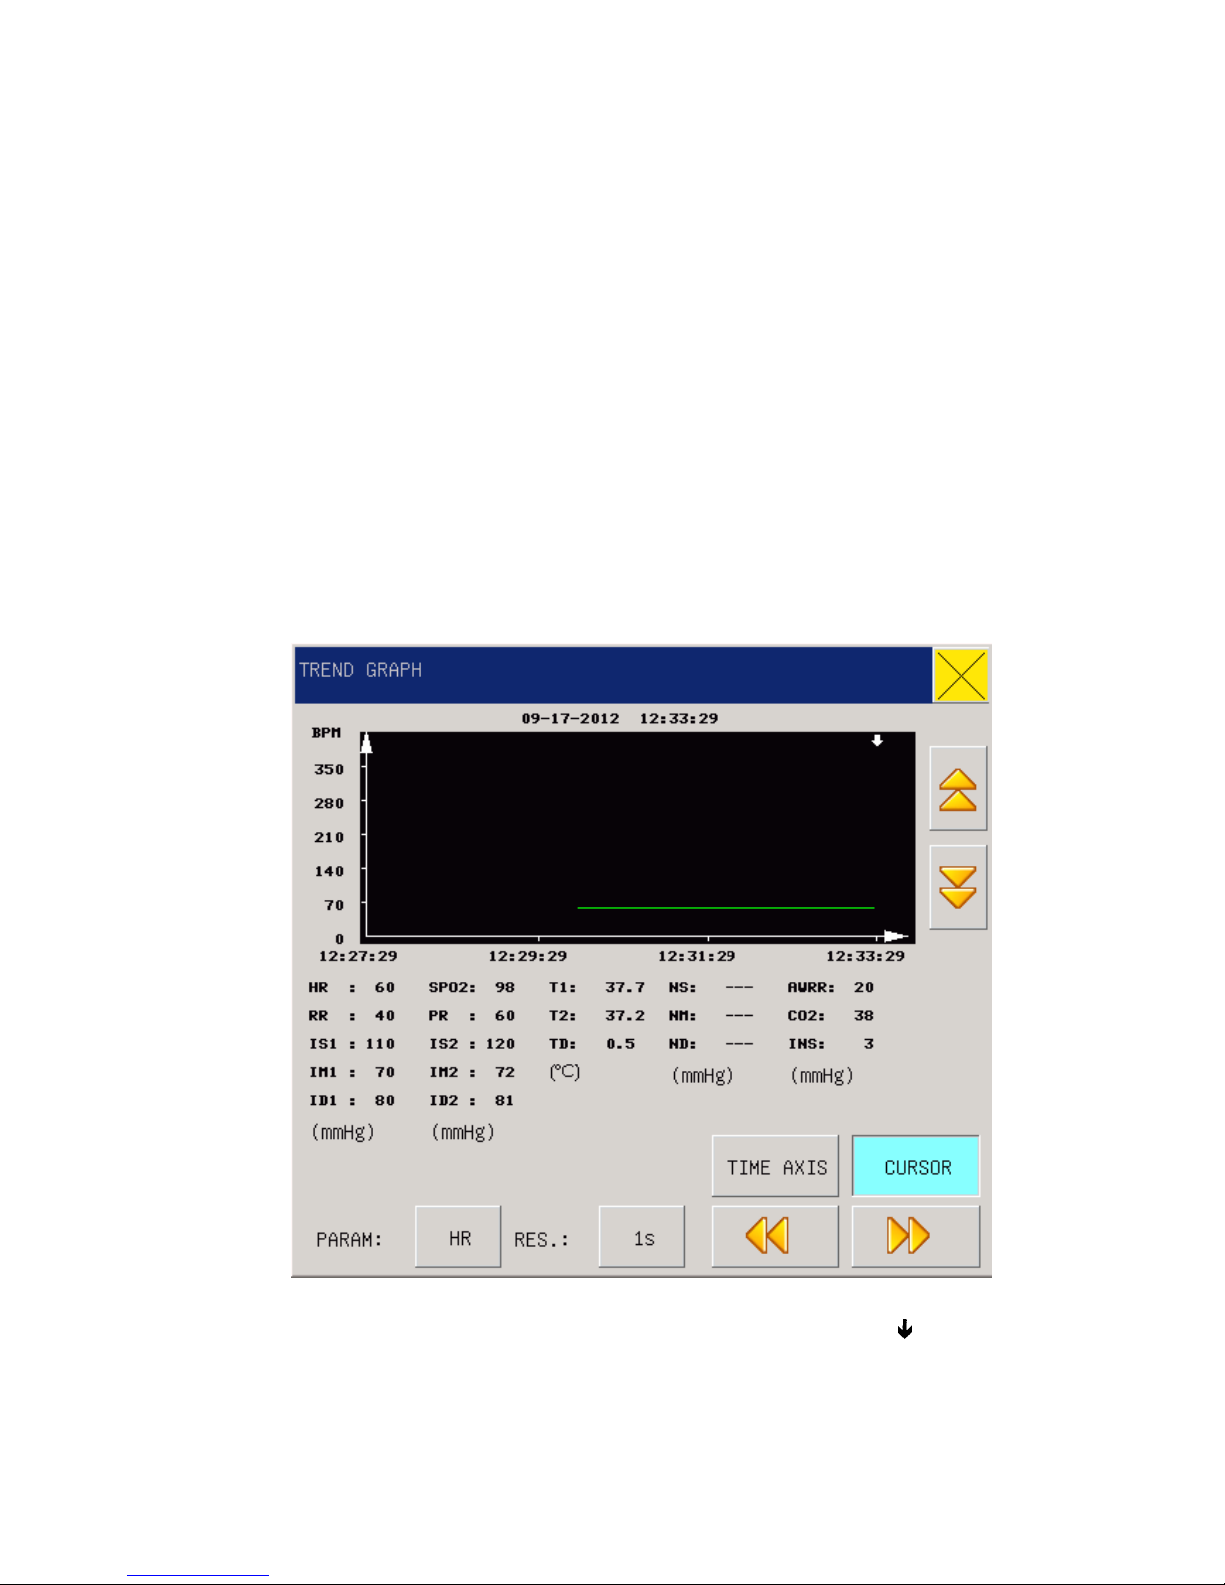
Select “TREND GRAPH” in the “MAIN MENU” to pop up the following TREND figure:
Fig 6-1 Trend Graph
Vertical axis is for measured values and horizontal axis for measurement time. The “ ” symbol is
the cursor for TREND diagrams, and the measured value at the position it arrows is displayed
below the TREND diagram while its corresponding time is displayed above the TREND diagram.
Page 47

38
6.1.1 Select trend diagrams for various parameters to be displayed:
Use the cursor to select the Parameter Selection option and revise the displayed contents. Upon
display of the expected parameter, press the knob, then the TREND diagram for this parameter
will be displayed in the window.
6.1.2 Select 1-hour or 120-hour TREND diagrams:
Use the cursor to select the Resolution option, then select 1 seconds or 5 seconds if you want to
observe 1-hour TREND, or select 1 minute, 5 minutes or 10 minutes if you want to observe
96-hour TREND.
6.1.3 Observe TREND diagrams of later or earlier duration:
Press the “ or ” button or rotate the knob clockwise or anticlockwise so as to observe later
or earlier TREND curves.
6.1.4 Change the display zoom
Use the “ or ” button to change displayed size of the vertical axis, while displayed size of
the TREND curves will follow to change. Values higher than the biggest axis value will be
represented by the biggest axis value.
6.1.5 Obtain the TREND data at certain time in the current
TREND diagram
Select “Cursor” and rotate the knob to “ ” or “ ” control movement of the cursor;
with the cursor moves, its arrowed time also changes, and the parameter value at such time will be
displayed below the horizontal axis. If there is a “
” indication in the right side of the window,
when the cursor moves onto this indication the TREND diagram will automatically page down to
display later TREND curves; and if there is a “
” indication in the left side of the window, when
the cursor moves onto this indication the TREND diagram will automatically page up to display
earlier TREND curves.
Page 48

39
6.1.6 Operation sample
Observe the NIBP TREND diagram within the latest 1 hour:
Press the TREND button on the control panel to pop up the Main menu;
Select the TREND Diagram Review option in the menu;
1. Select the parameter: rotate the knob in the Parameter Selection item until “NIBP” is
shown in the dropdown box;
2. Select 1 or 5 seconds in the Resolution item;
3. Press the “
or ” button or rotate the knob, while observing changes in the
TREND diagram time and TREND curves;
4. Stop at the period to be carefully observed; in case the vertical axis is out of proper size,
for example, some TREND values exceed the highest value of the current vertical
axis, select “Adjust amplitude” to adjust;
5. If users want to know the measured value at certain time, just select “move cursor” and
move the cursor to where they wants, then time will be displayed above the curve and
measured values below the curve;
6. If users need output the TREND diagrams to the recorder, just select the “record” button
so as to let the recorder output NIBP TREND of the current review window;
7. Press “
” to exit observation on TREND diagram.
6.2 TREND TABLE (TREND Figure)
TREND Figure data over the previous 120 hours can be displayed in the following resolutions: 1
minute, 5 minutes, 10 minutes, 30 minutes and 60 minutes.
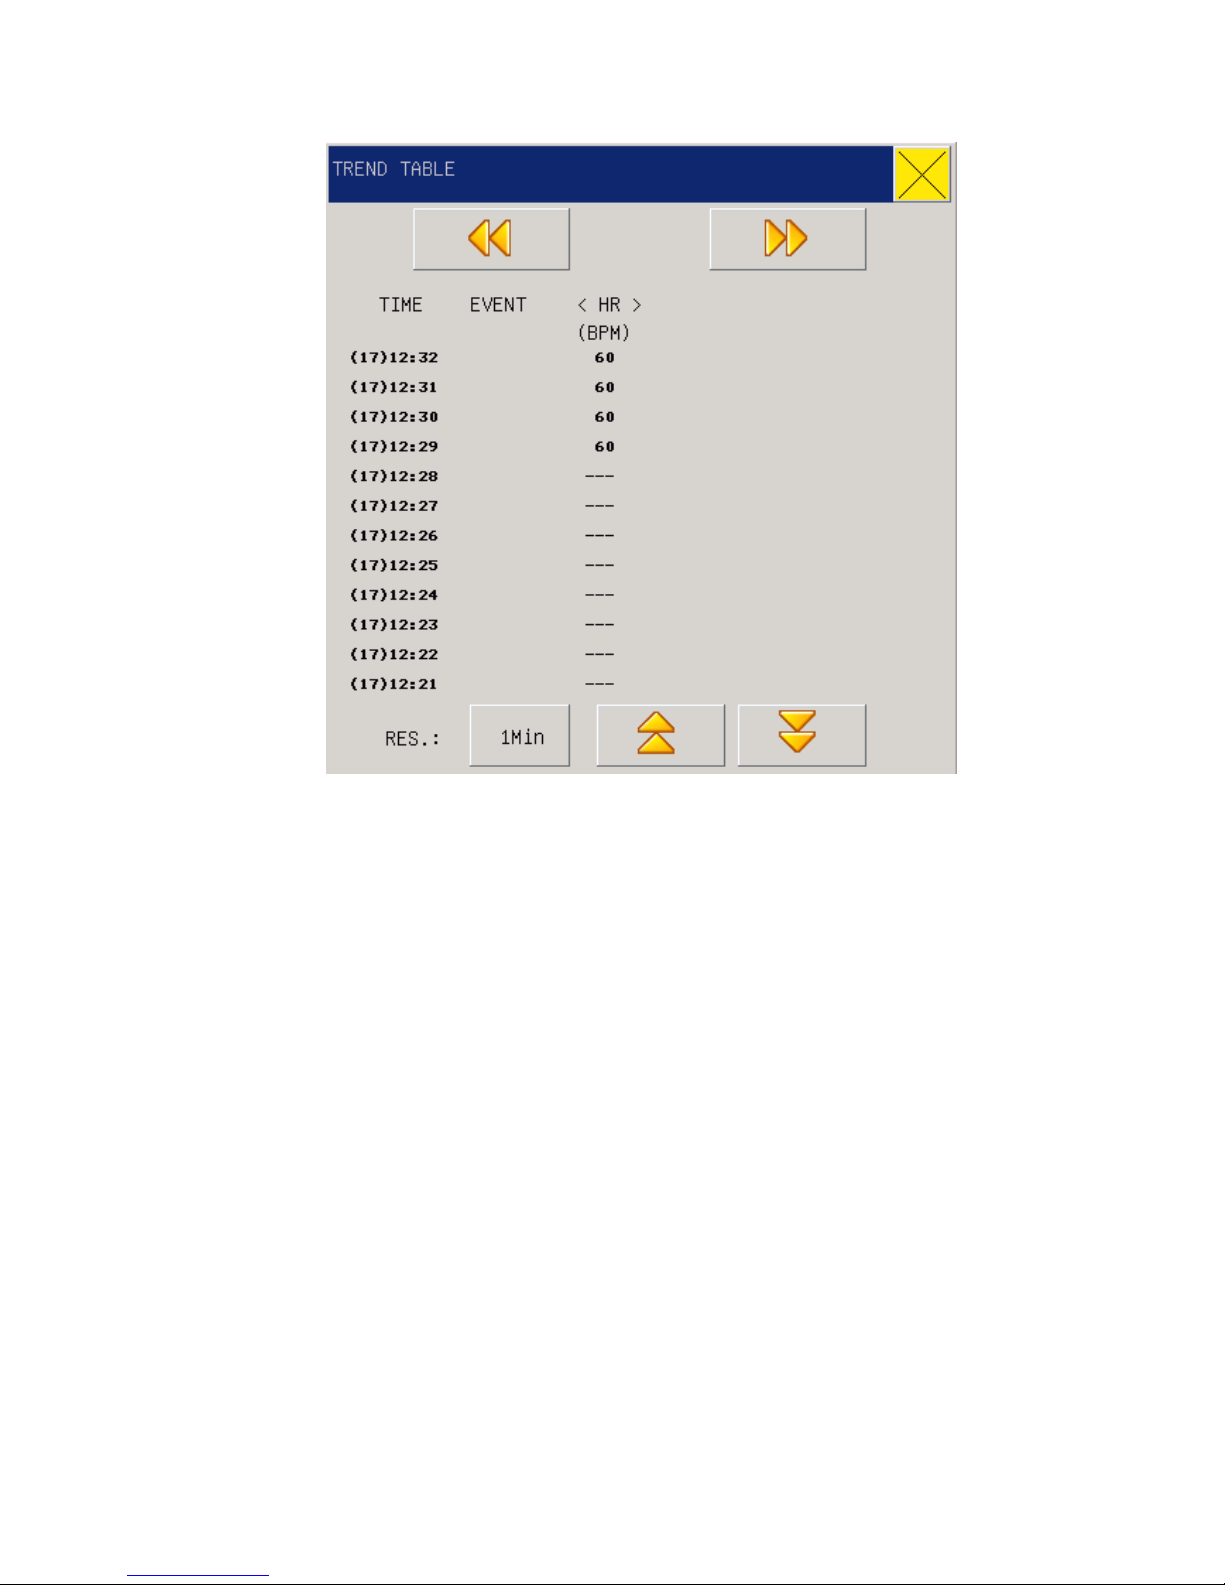
Select “TREND TABLE” under the “Main Menu” to pop up the following TREND figure:
Page 49
40
Fig 6-2 Trend Table
Time corresponding to various groups of TREND data is displayed at the left column, with dates
braced. What are listed is the cases that have once been marked, which corresponds to the time of
the marked cases. Parameters in the TREND Figures can be categorized into the following 9
groups:
HR,
ST1, ST2
RR,
T1,T2,TD
SPO2, PR
NIBP (S/D/M)DATE
IBP1(S/ D/M)
IBP2(S/ D/M)
CO2, INS, AWRR
NIBP TREND data has its own characteristics; besides of measured values, below each
“measurement point” there is time for this NIBP measurement.
6.2.1 Select TREND Figures in various r esolutions
Use the cursor to select a resolution and use the knob to change options so as to change the time
Page 50

41
interval for TREND data.
6.2.2 Observe earlier or later TREND curves
Press “ or ” button or rotate the knob clockwise or anticlockwise so as to observe later or
earlier TREND curves.
6.2.3 Observe TREND data of various parameters
Press “ or ” button and select one group of parameters out of 6 available groups.
6.2.4 Operation sample
To observe a NIBP TREND Figure:
Press the TREND button on the control panel to pop up the Main menu;
Select the TREND Figure Review option in the menu;
1. Press “
or ” button or rotate the knob to select the NIBP (S/D/M )DATE;
2. Select the resolution: click the left item and select the expected data interval;
3. Press “
or ” button or rotate the knob, while observing NIBP TREND data over various
time;
4. Press “
” to exit observation on TREND table.
6.3 NIBP RECALL
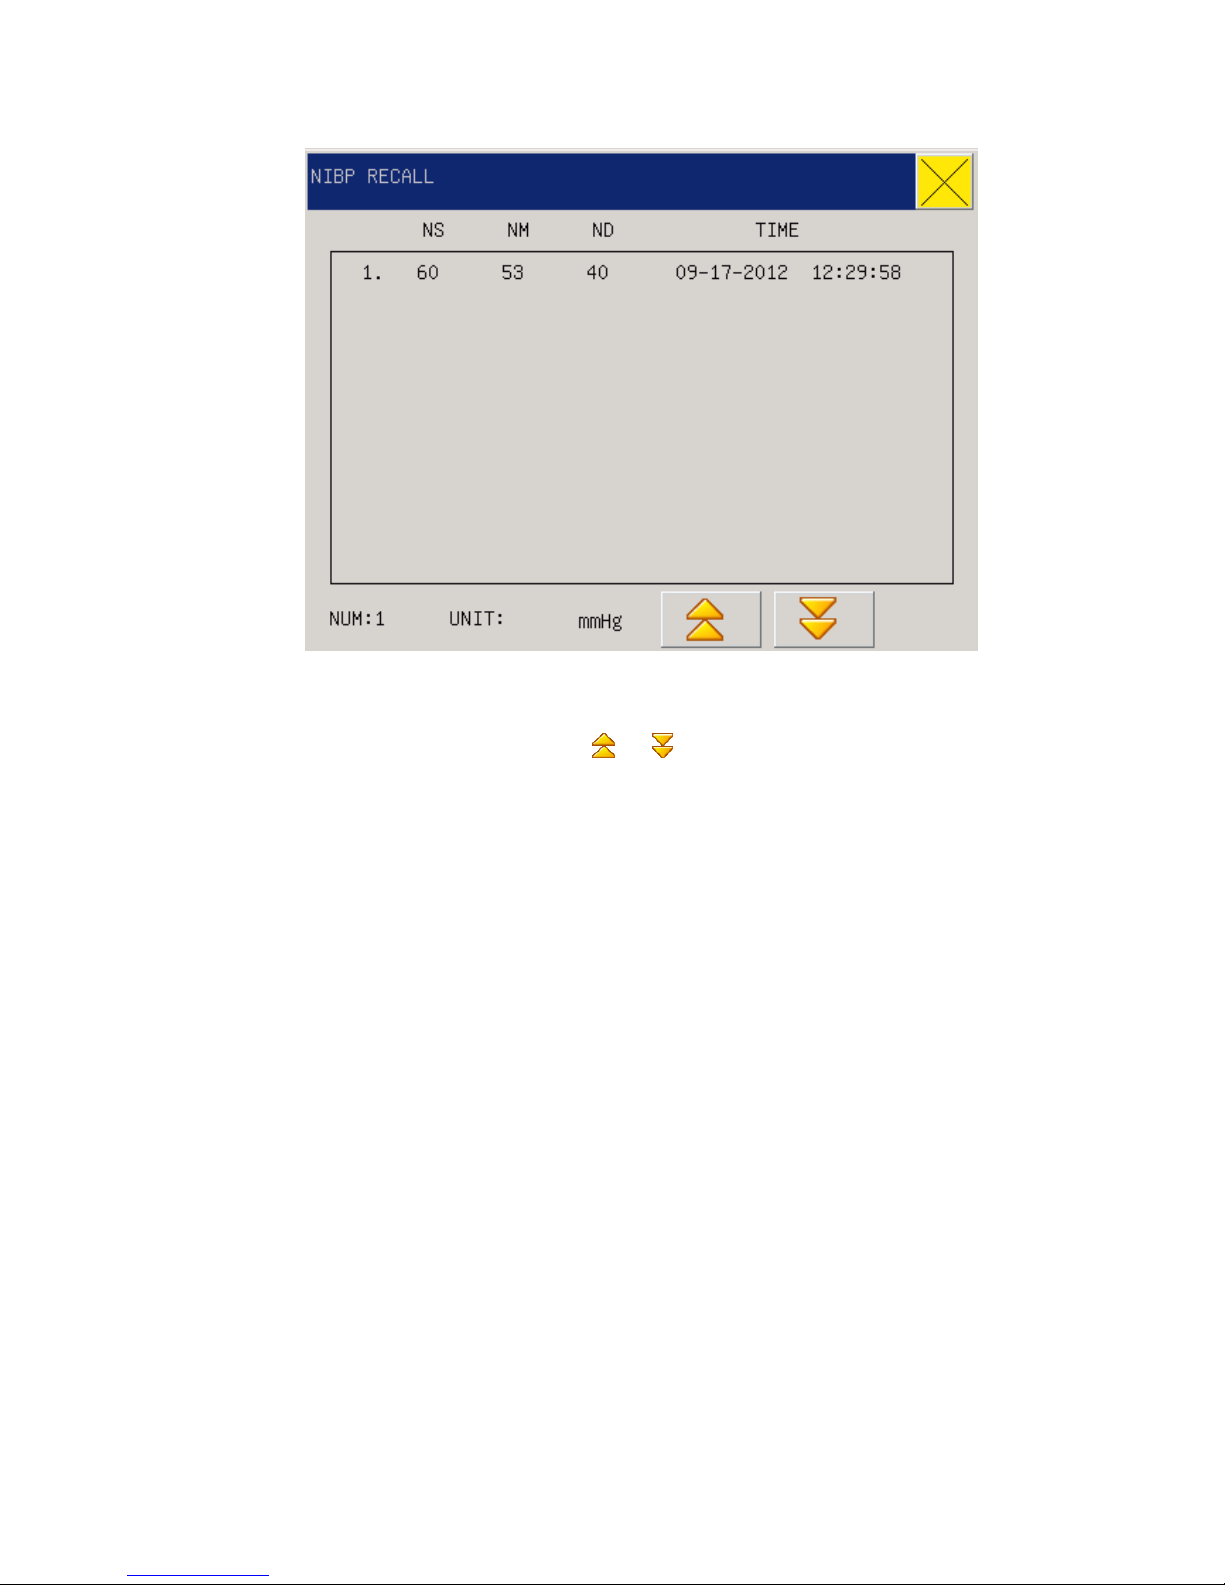
The monitor can record the latest 2000 NIBP datas. After select the NIBP RECALL in MAIN
MENU, the window will display 10 groups of NIBP records as follows:
Page 51
42
Fig 6-3 NIBP RECALL
Data is sorted in time sequence, from early to late, and each screen can display 10 times of
measurement data, while users can Press “
or ” button to view later or earlier data.
Maximally 2000 measurement results can be displayed, and when the measure times are over
2000, only the latest 2000 will be displayed.
Page 52
43
Chapter7 Drug Calculation & Titration
List
The portable-type multi-parameter monitor can provide the computation for 15 kinds of medicines
as well as the Titration List Display Function, and output the content of Titration list on the
recorder.
7.1 DRUG CALC
Medicines able to be calculated under this system are: aminophylline, dobutamine, dopamine,
epinephrine, heparin, isuprel, lidocaine, nipride, nitroglycerin and pitocin. Besides, there are Drag
A, Drag B, Drag C, Drag D and Drag E provided to flexibly replace any medicine.
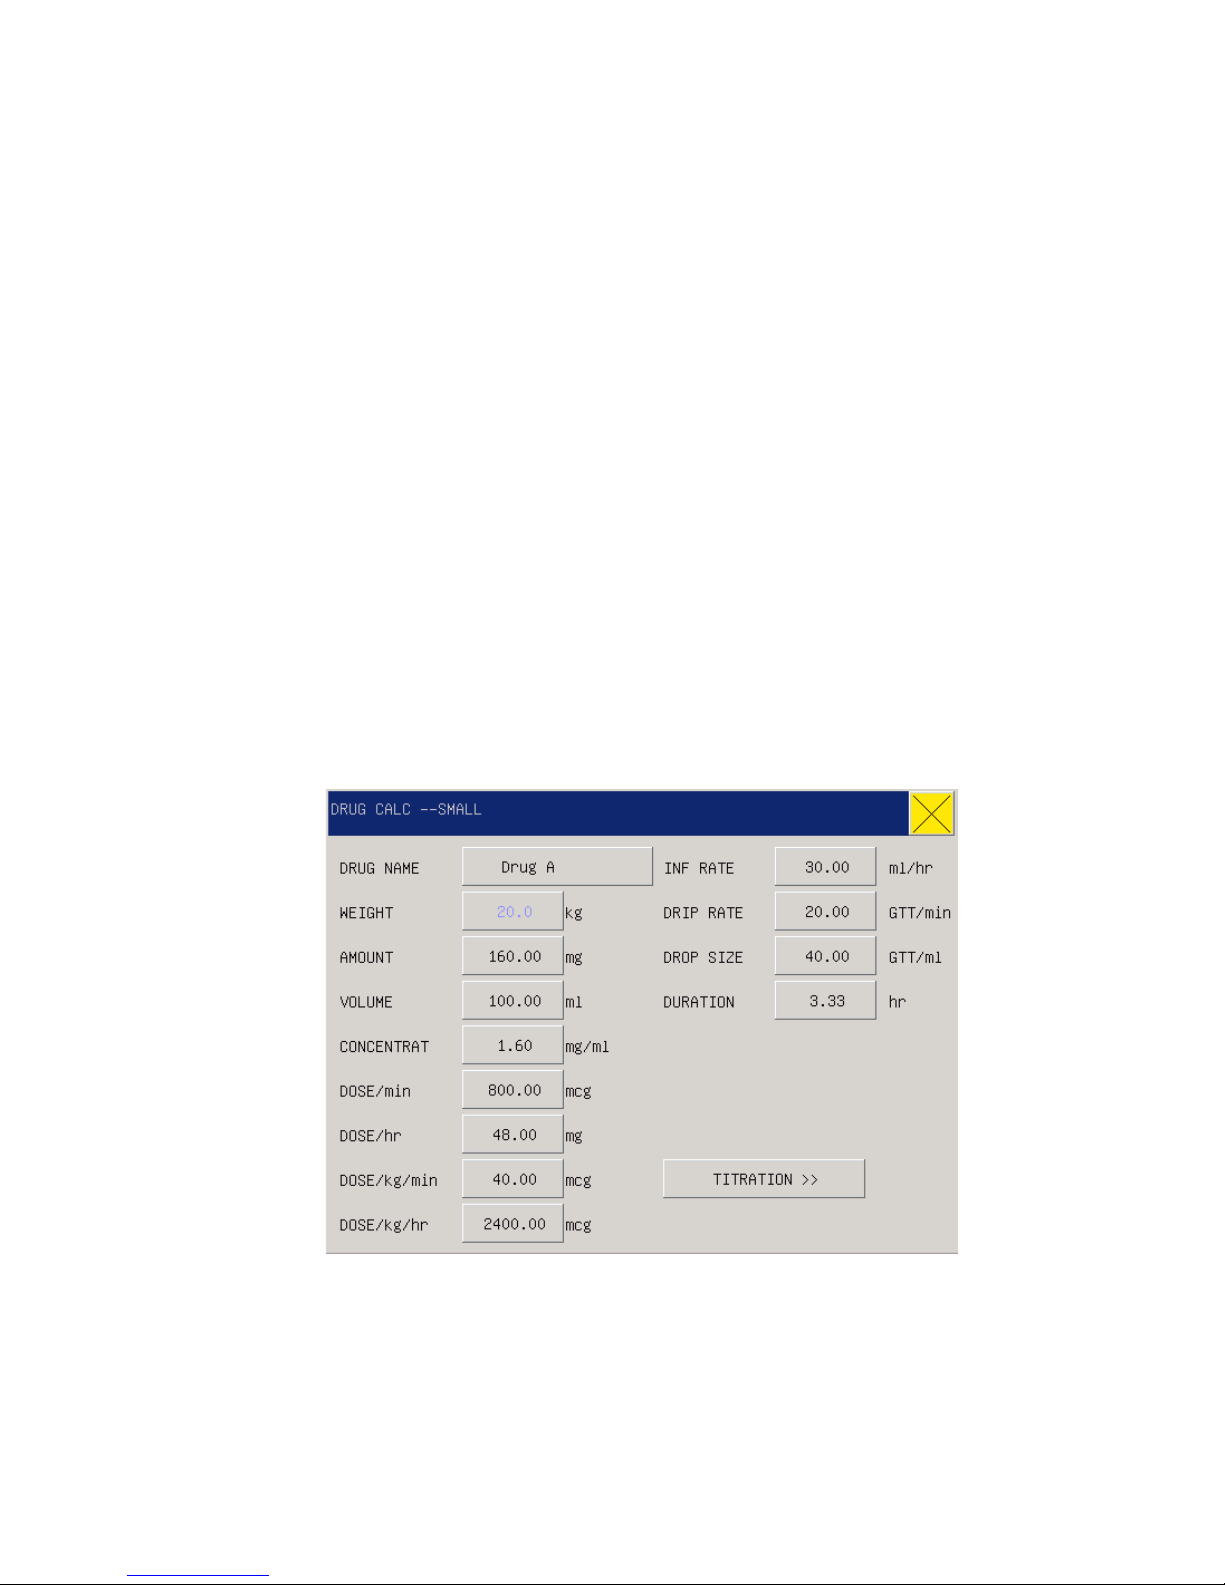
Users can select “Drug Calculation” under the MAIN MENU to pop up the following window:
Figure7-1 Drug Calculation
The following formulae are used for medicine dosage calculation:
Medicine contents = Total medicine volume / Liquid volume
Infusion speed = Medicine dosage / Medicine contents
Continued time = Total medicine volume / Medicine dosage
Page 53

44
Medicine dosage = Infusion speed × Medicine contents
Operation method:
In the medicine calculation window, operators should firstly select names of the medicines to be
calculated, and then confirm patient weight, and input other known values. Subsequently,
operators move the cursor to the various calculation items in the calculation formulae, press the
knob and rotate it, so as to select the calculation value. After the calculation value is selected,
value of the items to be calculated will be displayed at the corresponding position. Values for each
calculation item have their limits, if the calculated results exceed such limits, the system will
display “---.--”.
Caution
Under this medicine calculation function, other menu items are available for input only
after operators input patient weight and medicine names. The values firstly given in the
system are only a random group of initial values, and operators should not take such
values as calculation standard, instead, should re-input a group of values suitable for
the current patient, based on the comments by doctors.
Caution
Each kind of medicine is subject with fixed units or unit series, and operators must
select proper unit based on comments by doctors. Under the same unit series,
numbering system of the units will be automatically adjusted with the current input
values, and when the input value exceed out of expression of the relevant unit, the
system will display “---”.
Caution
After operators input a certain value, the system will give a clear reminder in the menu,
reminding operators to check correctness of the inputted value; only inputted values are
guaranteed to be correct, the calculated values will be reliable and safe.
Caution
In case of newborns, dropping speed and volume of an infusion drop make no sense.
Caution
The system gives a reminder for each inputted value, asking operators to confirm.
Operators must be serious with every such reminder, as only valid and correct inputs
can get reliable calculation results.
Select medicine type: move the cursor onto “Medicine name”, rotate the knob and select one from
aminophylline, dobutamine, dopamine, epinephrine, heparin, isuprel, lidocaine, nipride,
nitroglycerin, pitocin, Medicine A, Medicine B, Medicine C, Medicine D and Medicine E,
Page 54

45
altogether 15 types. At one time, only one type of medicine can be selected for calculation.
Caution
The above introduced A, B, C, D, and E are not actual medicine names but only codes
for medicines. Units for these five types of medicines are fixed, and operators can select
proper units based on general practice of medicines. The expression rules of their units
are as follows:
Medicines A, B, and C are fixed under the “mg” unit series, including g, mg, and mcg; Medicine
D is fixed under the “unit” unit series, including unit, k unit, and m unit; and Medicine E is fixed
under the “mEq” unit.
Patient weight: When entering the medicine calculation window, operators should firstly or
secondly input patient weight, which will be taken as independent information for calculation of
medicine contents.
Caution
This function of medicine calculation is only to provide a medicine calculator, while
values in the list should not be related with the patient under monitoring. Thus the
patient weight under this menu is different from the patient weight in the system; when
the system refresh with a new patient, values in this menu will not be affected.
7.2 TITRATION
7.2.1.1 Enter the Titration list:
In the “Drug Calculation” menu, pitch on the “Titration” to enter the Titration list interface.
The Titration list interface for medicines is shown in the following Figure:
Page 55
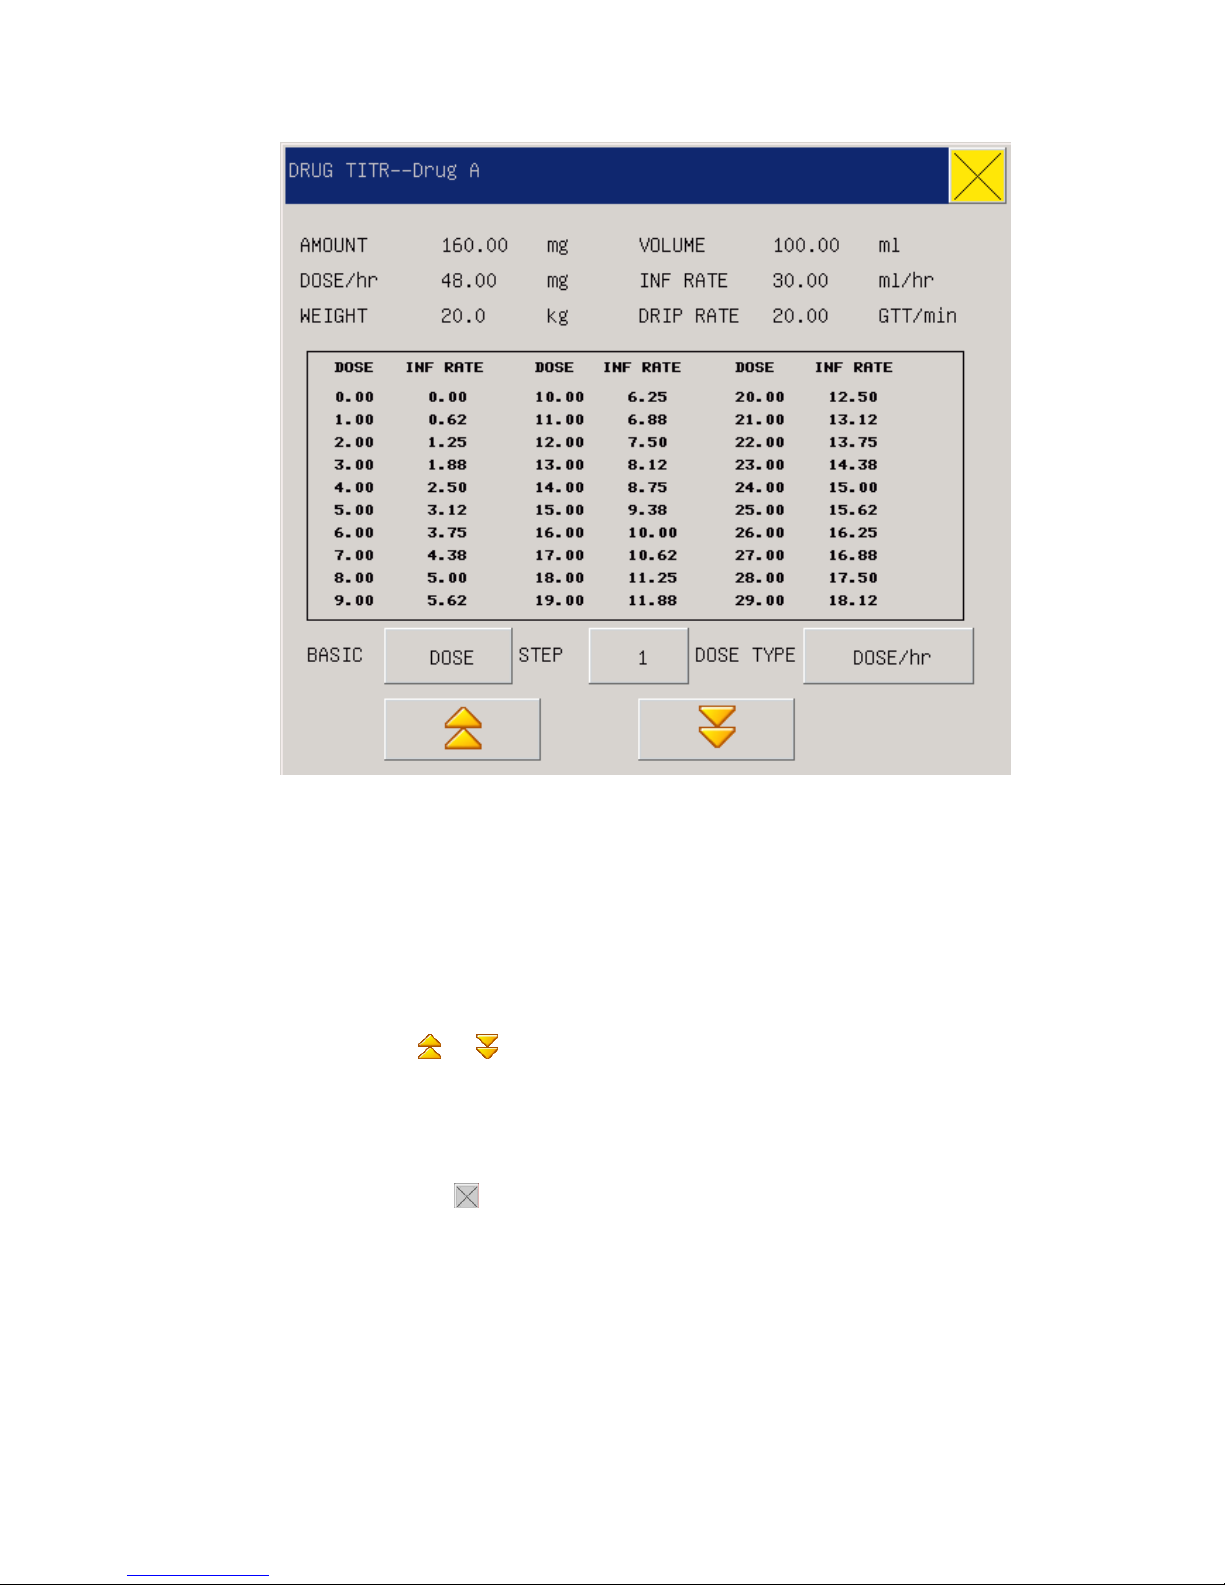
46
Figure7-2 Titration List
The specific operations are as follows:
In the Titration list, move the cursor to the “Reference Item” with the knob first, and then press the
knob to select the required item. “Dosage” and “Injection Speed” are two options.
Move the cursor to the “Step Length” and press the knob to select the step length in the range of
1~10.
Move the cursor to the “Dosage Type” and press the knob to select the dosage unit.
Move the cursor to the “
or ” button and press and turn the knob to check the previous and
next pages of the list.
Move the cursor to the”Record” and press the knob to output the Titration list data on the current
display interface.
Move the cursor to the” ” and press the knob to return to the “Medicine Calculation” menu.
Page 56

47
Chapter8 Alarm
8.1 Alarm Type
The monitor can give an alarm of three types: physiological alarm, technical alarm and prompt
message.
(1) Physiological alarm
Physiological alarm is usually caused by a certain physiological parameter of the patient
which exceeds the set upper/lower limit scope or by the physiological abnormality of the
patient. The alarm message of the physiological alarm will appear in the physiological alarm
area above the screen.
(2) Technical alarm
The technical alarm is also referred to as a system error message, indicating the alarm is
caused by a misoperation or system malfunction thereby causing improper operation of a
system function or distortion of monitored results. The alarm message of the technical alarm
will appear in the technical alarm area above the screen.
(3) Prompt message
Strictly speaking, prompt message does not belong to the domain of alarm. It is to display the
information relative to the system conditions themselves, which have nothing to do with the
patient’s vital sign.Prompt message will appear in the prompt message area.
8.2 Alarm Level
The monitor can give an alarm in three volume levels: high, medium and low, based on the
severity.
(1) High level alarm:
The patient is in a critical condition, endangering the patient’s life, emergent attention
required.
(2) Medium level alarm:
Page 57

48
The patient’s vital signs are abnormal, relevant measures and treatment are immediately
required.
(3) Low level alarm :
The patient’s vital signs are abnormal,and relevant measures and treatment may be required.
All alarm levels for technical alarms and some physiological alarms have be set before the
monitors are delivered:, the users are not allowed to change them. but a certain degree of
physiological alarm can be modified.
8.3 Alarm Mode
When giving an alarm, the monitor will prompt the users in both sound and visual modes:
Lighting Alarm
Sound Alarm
Alarm
parameter’s flashing
In which light signal, sound signal and prompting message are differentiated with different alarm
levels.
8.4 Lighting Alarm
When giving an alarm, the alarm indicating lamp will show alarms in different levels with color
and flashing frequency.
High level alarm red with flash frequency of 2 per second.
Medium level alarm yellow with flash frequency of one every two seconds.
Low level alarm yellow without flash but with a continuous light.
8.5 Sound Alarm
The sound alarm is set to prompt the alarm in different levels of severity with different sounds.
Page 58

49
High level alarm: Do-Do-Do--Do-Do
Medium level alarm: Do-Do-Do
Low level alarm: Do
8.6 Alarm Information
Prompting message means the related information will appear on the physiological alarm area or
technical alarm area of the monitor when the alarm is active. The system will show different alarm
levels in different background colors:
High level alarm: Red
Medium level alarm: Yellow
Low level alarm: Yellow
Levels of the prompt message in the front of the alarm will be distinguished with the following
symbols:
High level alarm: ***
Medium level alarm: **
Low level alarm: *
8.7 Alarm Parameter Flashing
When a parameter is alarming, the parameter will flash once every second.
8.8 Icon of Alarm Status
Besides the alarm modes mentioned above, the following alarm icons will appear on the screen to
indicate different alarm conditions.
: indicating alarm muted.
: indicating shut off of a parameter alarm.
Page 59

50
8.9 Setting the upper and lower limits of alarm
Take ECG for example:
a) Select ECG in the parameter area;
b) In the popped-out menu ECG Setting, select the HR ALM SETUP;
c) Set the upper and lower limits of HIGH LIMIT as 120bpm and 50bpm respectively;
d) Set the upper and lower limits of MID LIMIT as 110bpm and 60bpm respectively
e) Set the upper and lower limits of LOW LIMIT as 100bpm and 70bpm respectively
f) Upon completion of setting, press the key “ ” to exit.
Warning
When setting the upper and lower limits of alarm, decide whether the patient you are
monitoring is an big or small animal, and the limit should be set according to clinical
requirements.If the set limit value exceeds the alarm limit, it will easily lead to alarm
system failure.
Page 60

51
Chapter9 Patient Safety
The portable monitor is designed to meet the international safety requirements IEC60601-1,
EN60601-2-27 and EN60601-2-30 formulated for medical electric equipments. It’s furnished with
floating inputted defibrillation resistance and surgery electric knife protection. If correct electrodes
(referring to the ECG and RESP chapters) are installed following supervision of the manufacturer,
screen display will be recovered within 10 seconds after defibrillation.
This symbol means the application part is of IEC 60601-1 type CF equipment, and designed with
special electric shock resistant apparatus (especially with an F-type floating insulation apparatus
for permissible leakage current), especially recommended for use during defibrillation period.
Warning
During defibrillation period don’t touch the relevant patients, beds or equipments.
9.1 Environment
Users should follow the following guides to ensure absolute safety of electricity installation. For
an environment where the portable monitor is located, users should reasonably avoid vibration,
dusts, corrosive or explosive gases, extreme temperature and moisture. In case installed inside a
chamber, the front side must be given sufficient space for convenient operations, and while the
chamber door is open, the rear side must be given sufficient space for easy repair. Besides, must
make sure of air flow inside the chamber.
The monitor, when working in an ambient temperature between 0℃~40℃, can meet the
technical indexes, otherwise may have equipment accuracy affected or parts or circuits damaged.
Moreover, there should be at least 2 inch (5 cm) of space reserved surrounding the monitor to
ensure air flow.
9.2 Power Source
Please refer to the Product Specification chapter.
Page 61

52
9.3 Monitor earthing
To protect patients and medical staffs, the portable monitor must has its cover connected with the
earth; for such reason the monitor is equipped with a dismountable 3-line cable, which should be
plugged into a matching 3-line socket and further connected with the earth through the ground line
of the power supply cable. In case of no 3-line socket, please consult with the electricity staffs of
your hospital.
Warning
Don’t connect the 3-line cable of this monitor with a 2-line socket.
Connect the ground line with the equal-potential earthing terminal of the monitor. If unaware
whether a certain equipment combination is risky in terms of equipment specification, for example,
whether gathered leakage current is dangerous, users should consult with relevant manufacturers
or specialists, so as to make sure the necessary safety of the relevant equipment will not be
damaged by the proposed combination.
9.4 Equal-potential earthing
First level protection on the equipment has been contained in the house protective earthing system
through earthing of the power socket. For heart or head internal check, this portable monitor must
be individually connected with an equal-potential earthing system. One side of the equal-potential
cable (potential balanced cable) should be connected with the equal-potential earthing terminal on
the rear panel of the monitor, while the other side connected with one interface of the
equal-potential system. In case of any damage to the protective earthing system, the
equal-potential earthing system will take the safety function of protecting the earthing cable. Heart
or head checks should be conducted within houses for medical use installed with protective
earthing systems. Before each time of use, users should check whether the equipment is under
good work status and pay attention the cable connecting patients and the equipment must be free
from electrolytes pollution.
Warning
If the protective earthing system is instable, the monitor should be applied with internal
power supply.
9.5 Condensation
Page 62

53
During work period the equipment must be made sure of no condensation. When the equipment is
shifted from one room to another room, condensation may be formed as the equipment is exposed
in moistured atmosphere and different temperature.
Warning
If the monitor is used where there are flammable anesthetic agents, there may be
explosion.
9.6 Explanations on Symbols Used in the Monitor
See reference in external interface in chapter 1.
Page 63

54
Chapter10 Maintenance & cleaning
10.1 Maintenance check
Before monitoring patients, you shall:
♦ Check whether there is any physical damage;
♦ Check all the disclosed leads, plugs, and accessories;
♦ Check all the functions to be used to monitor the patients and ensure the equipment
works well; if any phenomenon is observed with the possibility of damaged
functions, the Monitor shall not be used onto the patients and please contact the
biochemical engineers of your hospital or the maintenance engineers of our
company.
♦ Comprehensive checks, including safety checks, must be conducted by qualified
personnel once per 6-12 months and after each time of repair.
Warning
if any hospital or agency responsible for using the Monitor fails to implement a set of
satisfying maintenance plan, unusual functional failure may be resulted to the Monitor
and may threaten the people’s health.
10.2 Cleaning and Sterilization
10.2.1 Note on Cleaning and Sterilization
Attention
z The monitor and accessory surface can be cleaned with hospital-grade ethanol and
dried in air or with soft, clean cloth.For protecting the environment, disposable
accessories should be recycled or disposed of properly.
Caution
z Do not autoclave the sensor.
Page 64

55
z Do not soak the sensor in liquids.
z If the sensor or cable is damaged or has signs of deterioration, do not use again.
10.2.2 Cleaning
The Monitor must be kept dust-free. Regular cleaning of the monitor shell and screen is strongly
recommended. More cleaning is needed in the environmental polluted or sandstorm areas. Before
cleaning the monitor or the sensor, please consult with customer service or understand the hospital
equipment cleaning regulation.
(a) Cleaning agents are listed below:
Diluted Ammonia Water
Diluted Sodium Hypochlorite(Bleaching agent)
Diluted Soapy Water
Hydrogen Peroxide 3%
Alcohol 70%
Isopropanol 70%
(b) Before cleaning the monitor:
a) Make sure that the equipment is switched off and disconnected from the power line.
b) Use soft cotton ball to adsorb a small amount of cleaning agents and clean the screen.
c) Use soft cloth to adsorb a small amount of cleaning agents and clean the monitor shell.
d) If necessary, use a soft dry cloth to wipe away the excess cleaning agents.
e) Dry the monitor in air.
10.2.3 Sterilization
To avoid damage to the monitor, sterilization is recommended only when stipulated as necessary
in the Hospital Maintenance Schedule. Monitor facilities should be washed first.
Recommended sterilization material: Ethyl alcohol 70%, Isopropanol 70%,Glutaraldehyde 2%.
Page 65

56
Caution
z Do not use ETO gas to disinfect the monitor.
z Use a moistened cloth to wipe up any agent remaining on the monitor
z Try to use low-content liquids or dilute liquids following the instructions of
manufacturers.
z Don’t let any liquid enter the cover and don’t immerse any part of the equipment into
any liquids.
z Don’t remain any cleaning liquid on the equipment surface.
z Don’t pour liquids onto the equipment during the disinfection process.
Page 66

57
Chapter11 ECG Monitoring
11.1 Definition of ECG Monitoring
ECG monitoring describes continuous waveforms of cardiac activities of patients so as to
accurately assess the current psychological status of the patients. Thus proper connection of ECG
cables must be ensured in order to obtain correct measurement values. This portable monitor
concurrently can display 2 waveforms under normal work status.
A patient cable consists of two parts:
Wire connecting the monitor;
Leads connecting patients
With a 3-lead facility for monitoring, ECG can obtain two waveforms from two different
leads. Users can use the knob, in the left side of the ECG waveforms on the screen, to
directly select the lead to be monitored.
Displayed monitoring parameters include HR, ST segment measurement value and
arrhythmia.
All the above parameters can be taken as alarm parameters.
Caution
In the ex-factory setting of the monitor the ECG waveform displays at the position of
the first two waveforms in the waveform area.
11.2 Attentions during ECG Monitoring
Warning
Don’t touch patients, tables or the equipment during defibrillation.
Warning
The ECG cable used for ECG signal monitoring by this portable monitor must be
provided by our Company.
Warning
When connecting electrodes or patient cables, users should ensure there is no
connection with other electric conductive parts or the ground, and more importantly,
Page 67

58
ensure all the ECG electrodes including neutral electrodes are attached with patient
bodies instead of touching with electric conductive parts or the ground.
Caution
Disturbance from non-earthing equipments around a patient or ESU disturbance may
affect waveforms to function improperly.
Where this monitor is operated according to the conditions specified in the EN60601-1-2
(anti-radiation ability: 3V/M) and the electric-field strength above 1V/M may give rise
to the measurement mistakes under various frequencies, it is suggested that the
electroradiant equipment should not be used in the place next to the
ECG/Respirometer.
11.3 Monitoring Procedures
11.3.1 Preparation
Take patient skin preparation before installation of electrodes:
1. Skin is bad conductor, thus to ensure good touch between electrodes and skin it’s very
important to well prepare patient skin.
2. When necessary, remove body hair surrounding the electrode positions.
3. Clean thoroughly the skin with soap and water (don’t use ethyl ether or pure alcohol, as they
will increase skin resistance)
4. Drily sweep the skin so as to increase capillary blood flow as remove skin scraps and oil.
5. Install spring clamp or snap before installation of electrodes
6. Put the electrodes on patient body; in case the electrodes contain no conductive paste, coat
the conductive paste before installation.
7. Confirm power supply.
Warning
Daily check whether the ECG electrode plates stimulate skin; in case of any
sensitiveness phenomenon, change the electrodes or positions every 24 hours.
Caution
To protect the environment, used electrode must be recycled or properly treated.
Warning
Before monitoring check whether the leads work properly. After users plug out the
Page 68
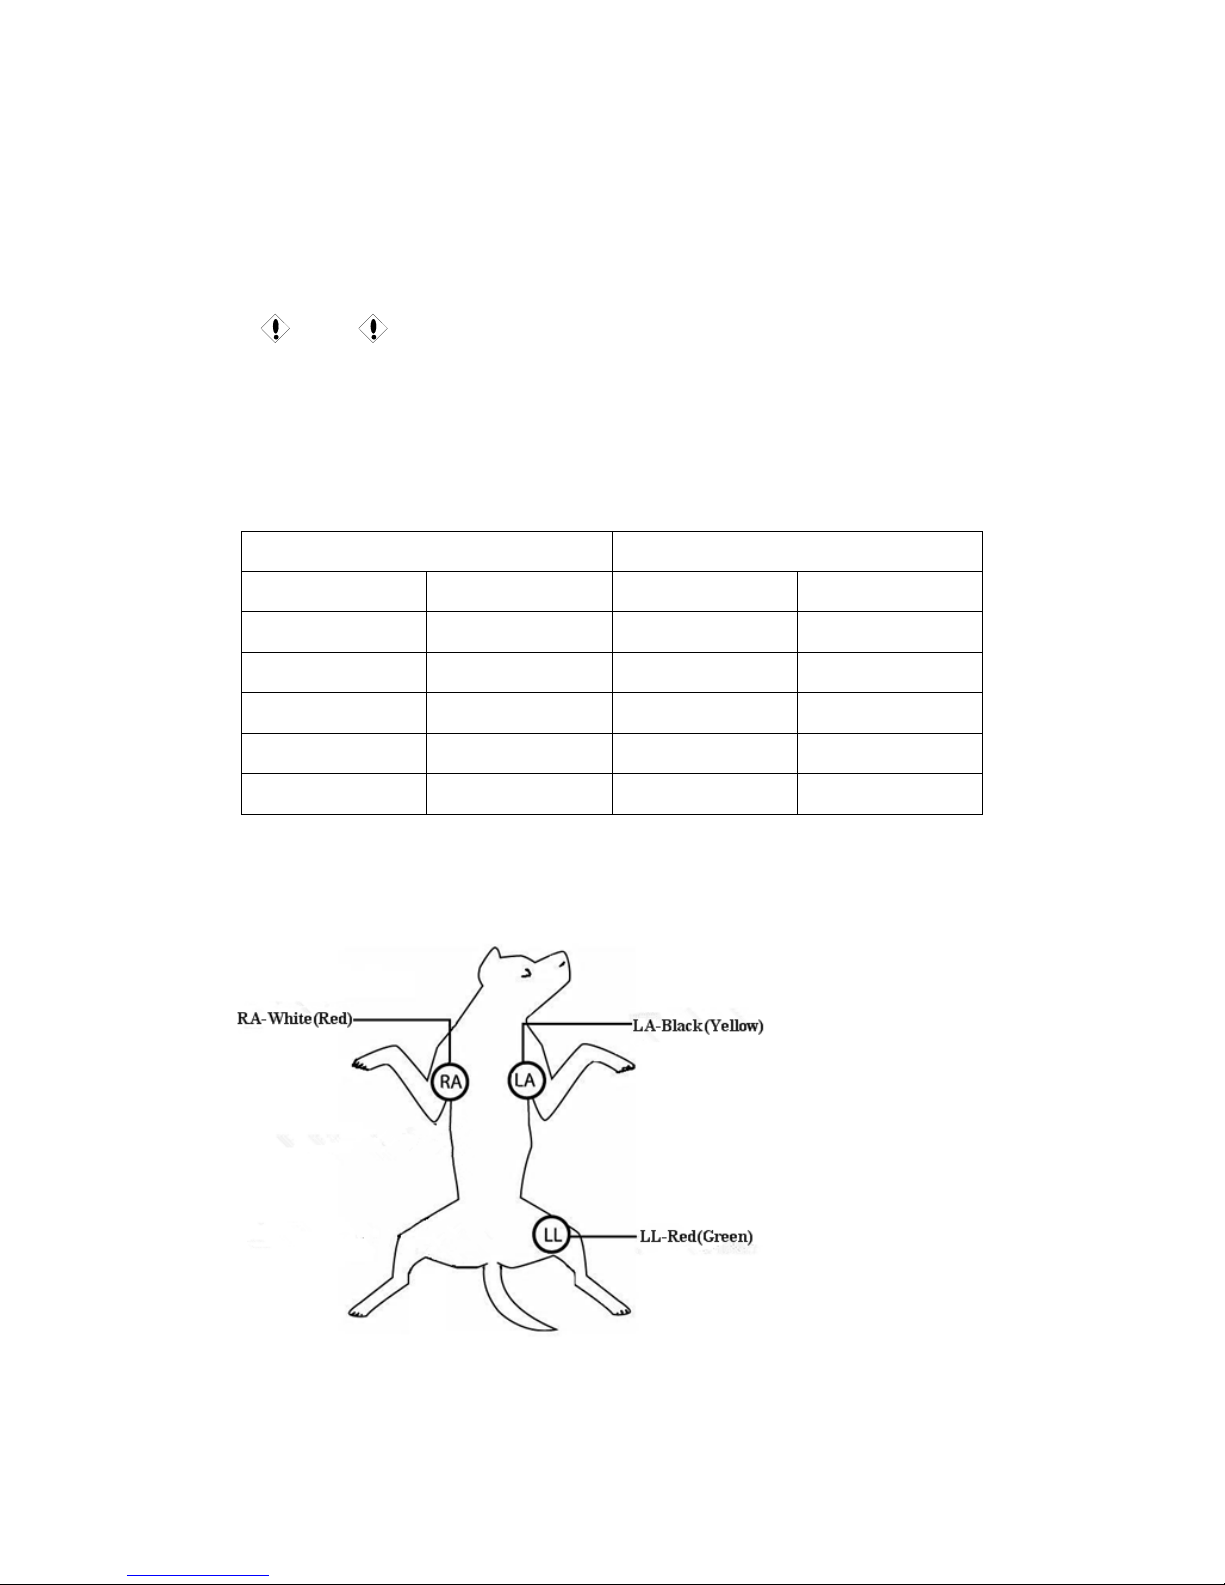
59
ECG cables, screen will display the error information of “Sensor disconnected” and
activate voice alarming.
11.3.2 Install ECG leads
Caution
The following table lists the lead names under the European and US standards (leads
are represented in R, L, N, F and C under the European standard and in RA, LA, RL,
LL, and V under the US standard
US standard European standard
Lead name Color Lead name Color
RA White R Red
LA Black L Yellow
LL Red F Green
RL Green N Black
V Brown C White
Three-lead ECG electrodes position (Fig 10-1):
Fig 10-1(1) 3-leads monitoring
Page 69
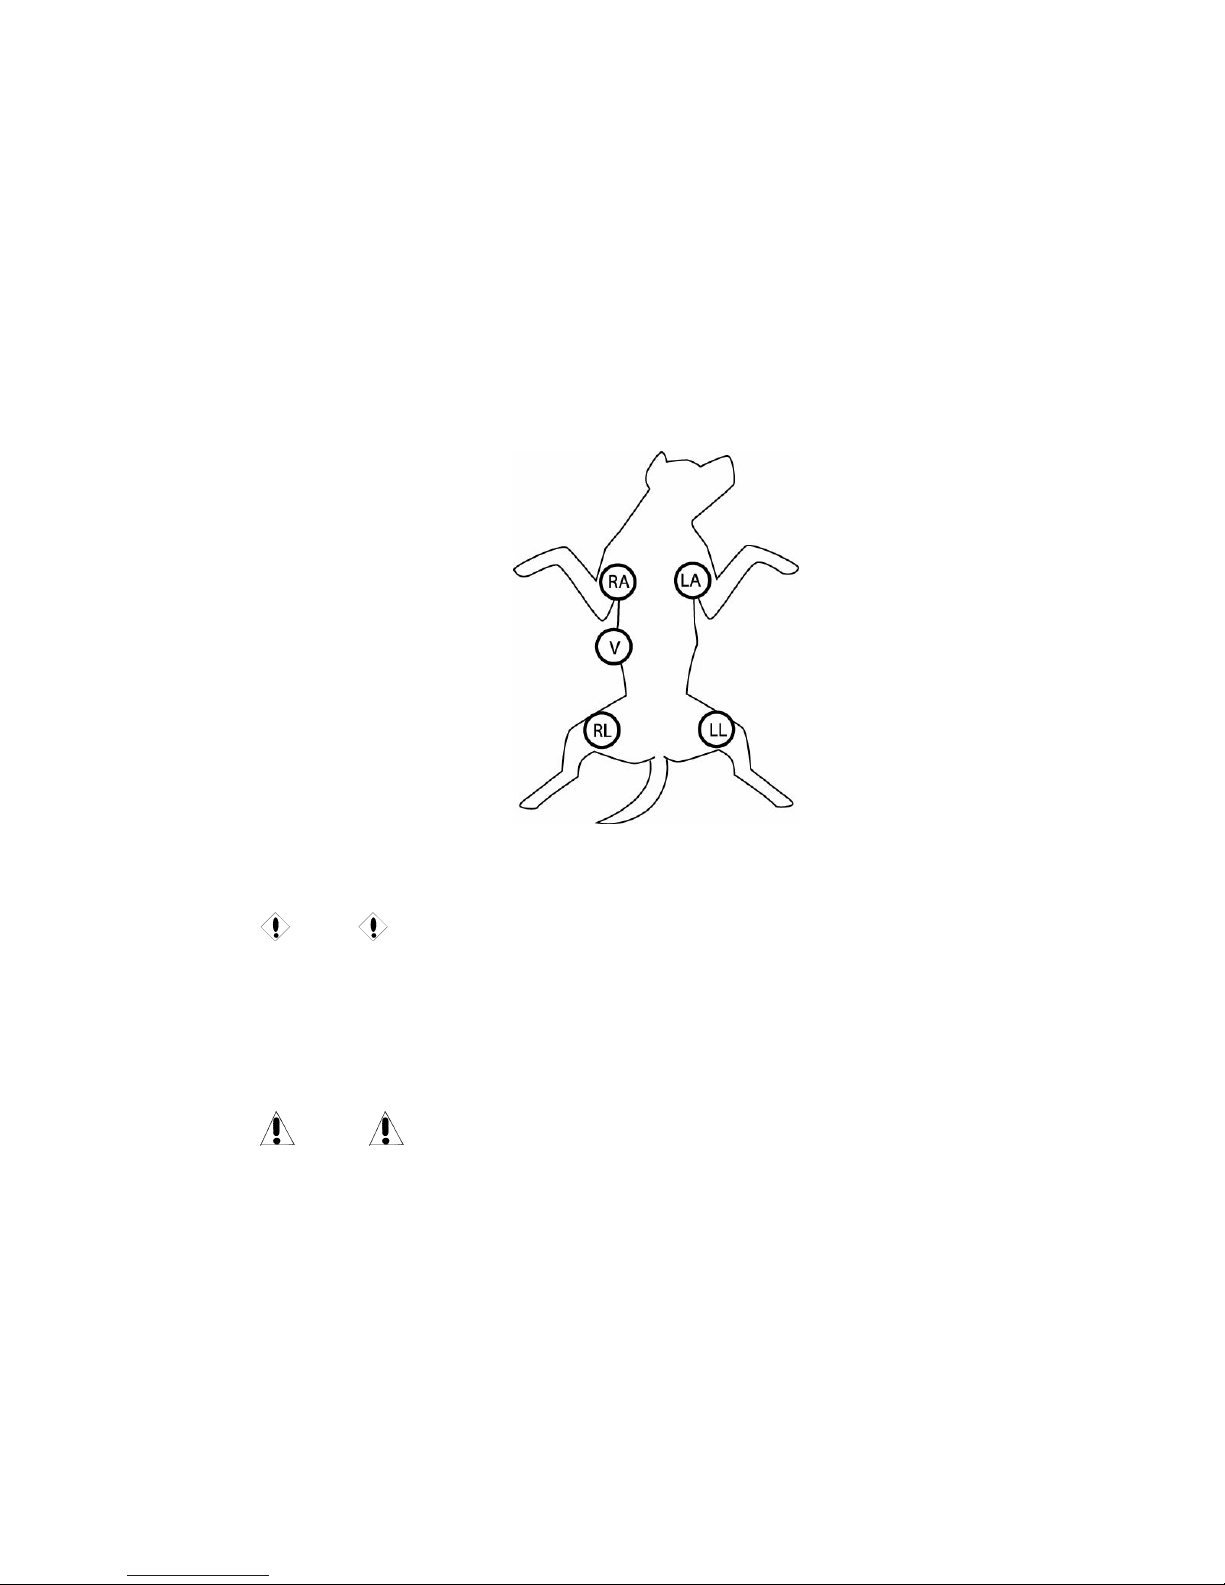
60
Note: the sign name and color of the e lectro d e is American standard, what inside the
square brackets
[-] are European standard.
white electrode (RA) — Right foreleg
■ black electrode (LA)— Left foreleg
■ green electrode (RL)— Right hind leg.
■ red electrode (LL)—Left hind leg.
■brown electrode (V) — Fourth intercostal space.
Fig10-2 5-leads ECG Electrodes position
Caution
For patient safety, all the leads must be connected with patient body.
11.3.3 ECG lead connection recommended for surgery patients
Warning
When using ES equipments, users should put ECG electrodes at middle of the ES
earthing plate and ES knives to prevent from burns. Cables of ES equipments can not
be wrapped with ECG cables together.
Positioning of ECG leads is up to operation types, for example, for chest operation, electrodes can
be put on breast sides or back. Inside operation rooms using surgery electric knives, sometimes
artificial discrepancy may affect ECG waveforms; to reduce such artificial discrepancy, users may
put the electrodes at the left and right shoulders, near left and right abdomen, with breast lead at
left to the middle breast. No electrodes should be put on left arm; otherwise the ECG waveforms
Page 70

61
will be very small.
Warning
During use of ES equipments, don’t put electrodes near the earthing plate of such
equipments, otherwise ECG signals will be much disturbed.
11.3.4 Use the 5-lead ECG device.
Users may based on their requirements arrange leads at each channel. Lead names for each
channel are displayed at left to the corresponding waveforms, and users can directly select them
for revision. Users can select proper leads from I, II, III, AVR, AVL, AVF, and V for the channels,
as shown in Fig. 0-5. In case a user selects the same leads, the monitor will automatically adjust to
different lead.
Characteristics of a good signal:
High and narrow, without incisura
High R-wave, fully above or below the baseline
Pacing signal no higher than R-wave
T-wave lower than 1/3 of R-wave
P-wave significantly lower than T-wave
To obtain 1mV of calibrated ECG waveform, users should conduct ECG calibration, in such case
the screen will display” Don’t monitor patients during calibration.
Fig 10-5 Standard ECG waveform
11.4 ECG Hot Key
P
Q S
Page 71
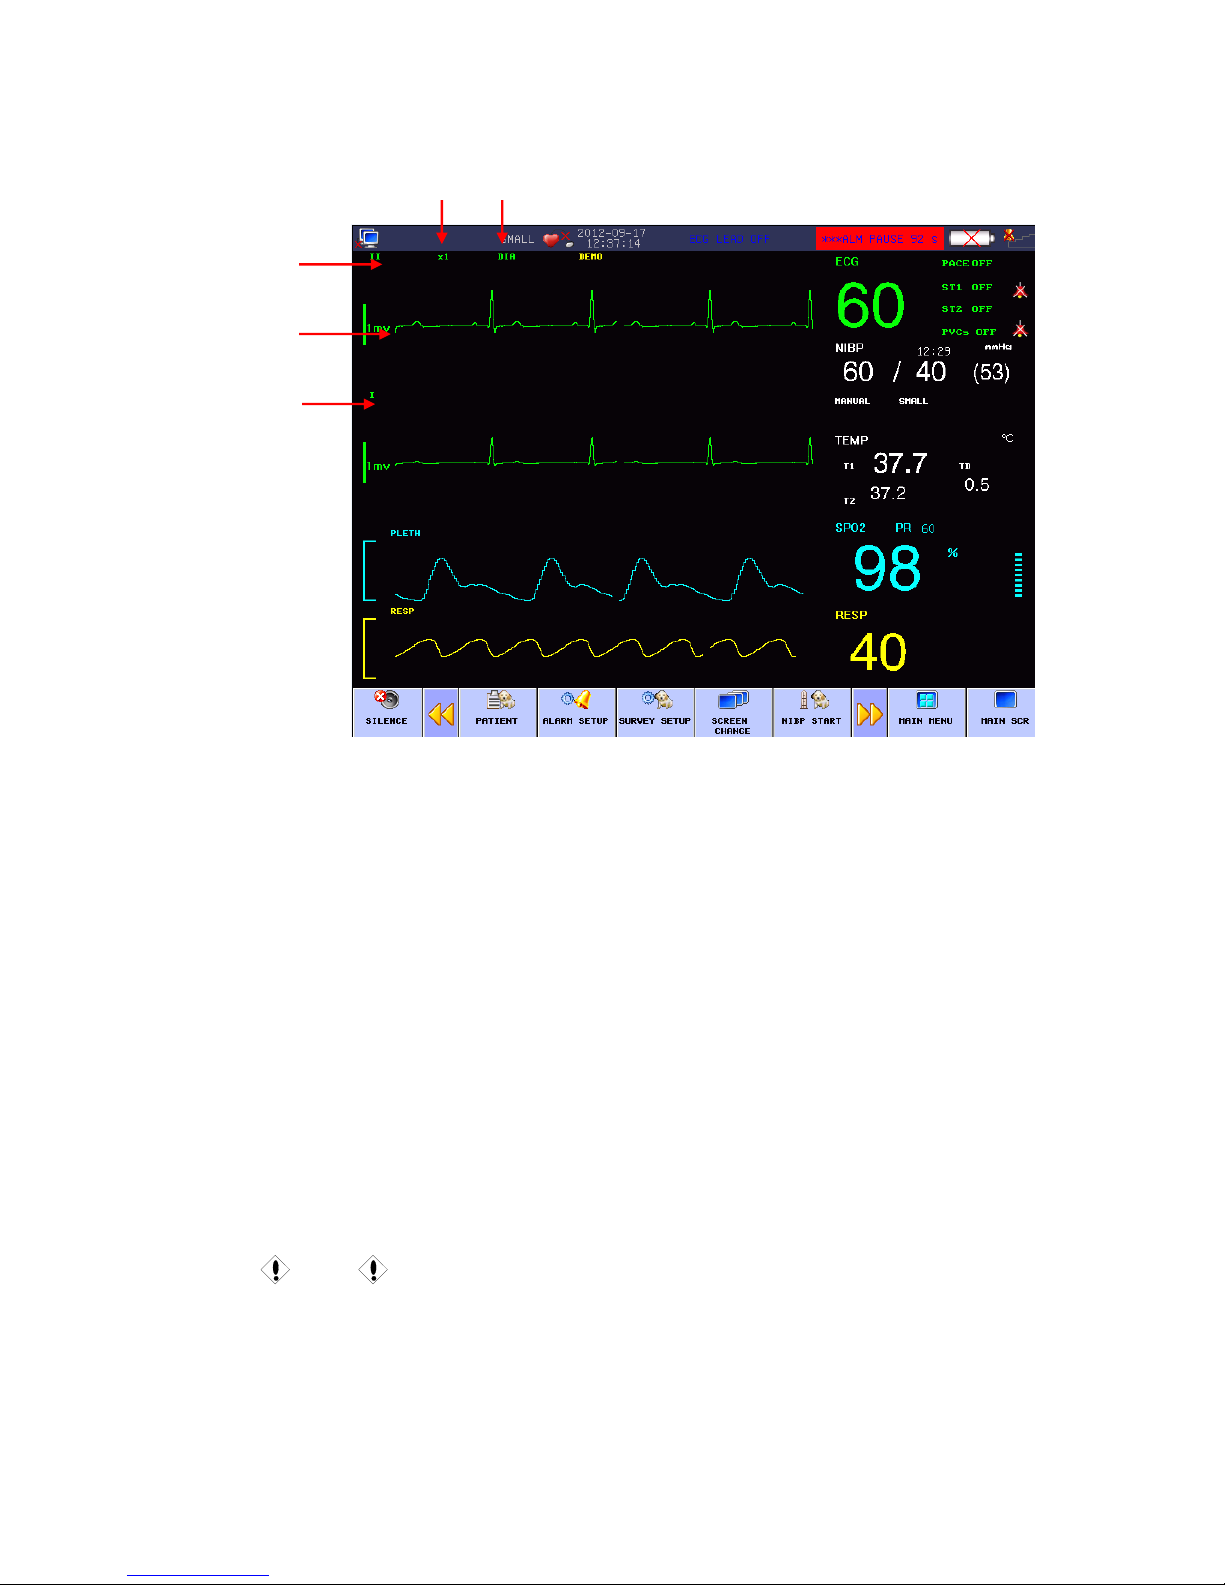
62
Fig 10-4 ECG Hot Key
○
1 Name of the First ECG Lead:
ECG using 5-lead, the selectable leads include I, II, III, aVR, aVL, aVF and V;
ECG using 3-lead, the selectable leads include I, II and III. (For neonate)
The leads on the ECG waveform should not have the same name, otherwise the
system will automatically change the similar name into another.
○
2 The 1st-ECG Waveform Gain: used to adjust the amplitude of ECG waveform.
The gain of each calculation channel can be selected, which has such columns as
×0.25, ×0.5, ×1 and ×2 as well as auto mode. Auto mode means that the monitor can
automatically adjust the gain. On the right side of each ECG waveform there is a 1-mv rod
of which height and amplitude are proportional.
Caution
The input signal being too strong, the wave crest may be truncated. At this time users
can manually change the gain column of ECG waveform by reference to the actual
waveform for fear of incompleteness of waveform.
○
1
○
4
○
2 ○3
⑤
Page 72

63
○
3 Filtering Mode: The cleaner or precise waveform can be obtained through filtering.
There are three filtering modes for option. The unfiltered ECG waveform is shown in
the diagnostic mode; the monitoring mode will possibly lead to the artifact filtering;
the operation mode used in the surgery can reduce the artifact and interference from
the electrosurgery unit. The filtering mode can be used in two channels and displayed
on the upper part of the first ECG waveform.
Warning
Only in the diagnostic mode can the system provide the real signal that has not been
treated. In the filtering modes such as “Monitoring” and “Operation”, the ECG
waveform will abnormally occur to the different extents. At this time the system can
only provide the basic ECG status, and will produce greater influence on the analysis
result of ST Segment. The analysis result of ARR may partially be affected in the
operating mode, so it is suggested that efforts are made to monitor patients in the
diagnostic mode when the interference is small.
○
4 the waveform of the ECG lead
○
5 The Name of 2nd-ECG Waveform Gain: for details, please refer to ○1
Caution
The detected pacing signal displays on the upper part of the ECG waveform in the
waveform area, which is expressed as “
”.
11.5 ECG Menu
11.5.1 ECG setting in parameter area
Use turn knob and move cursor on the main screen to the ECG hot keys in the parameter area,
then press the knob to pop up the ECG Setting menu:
Page 73
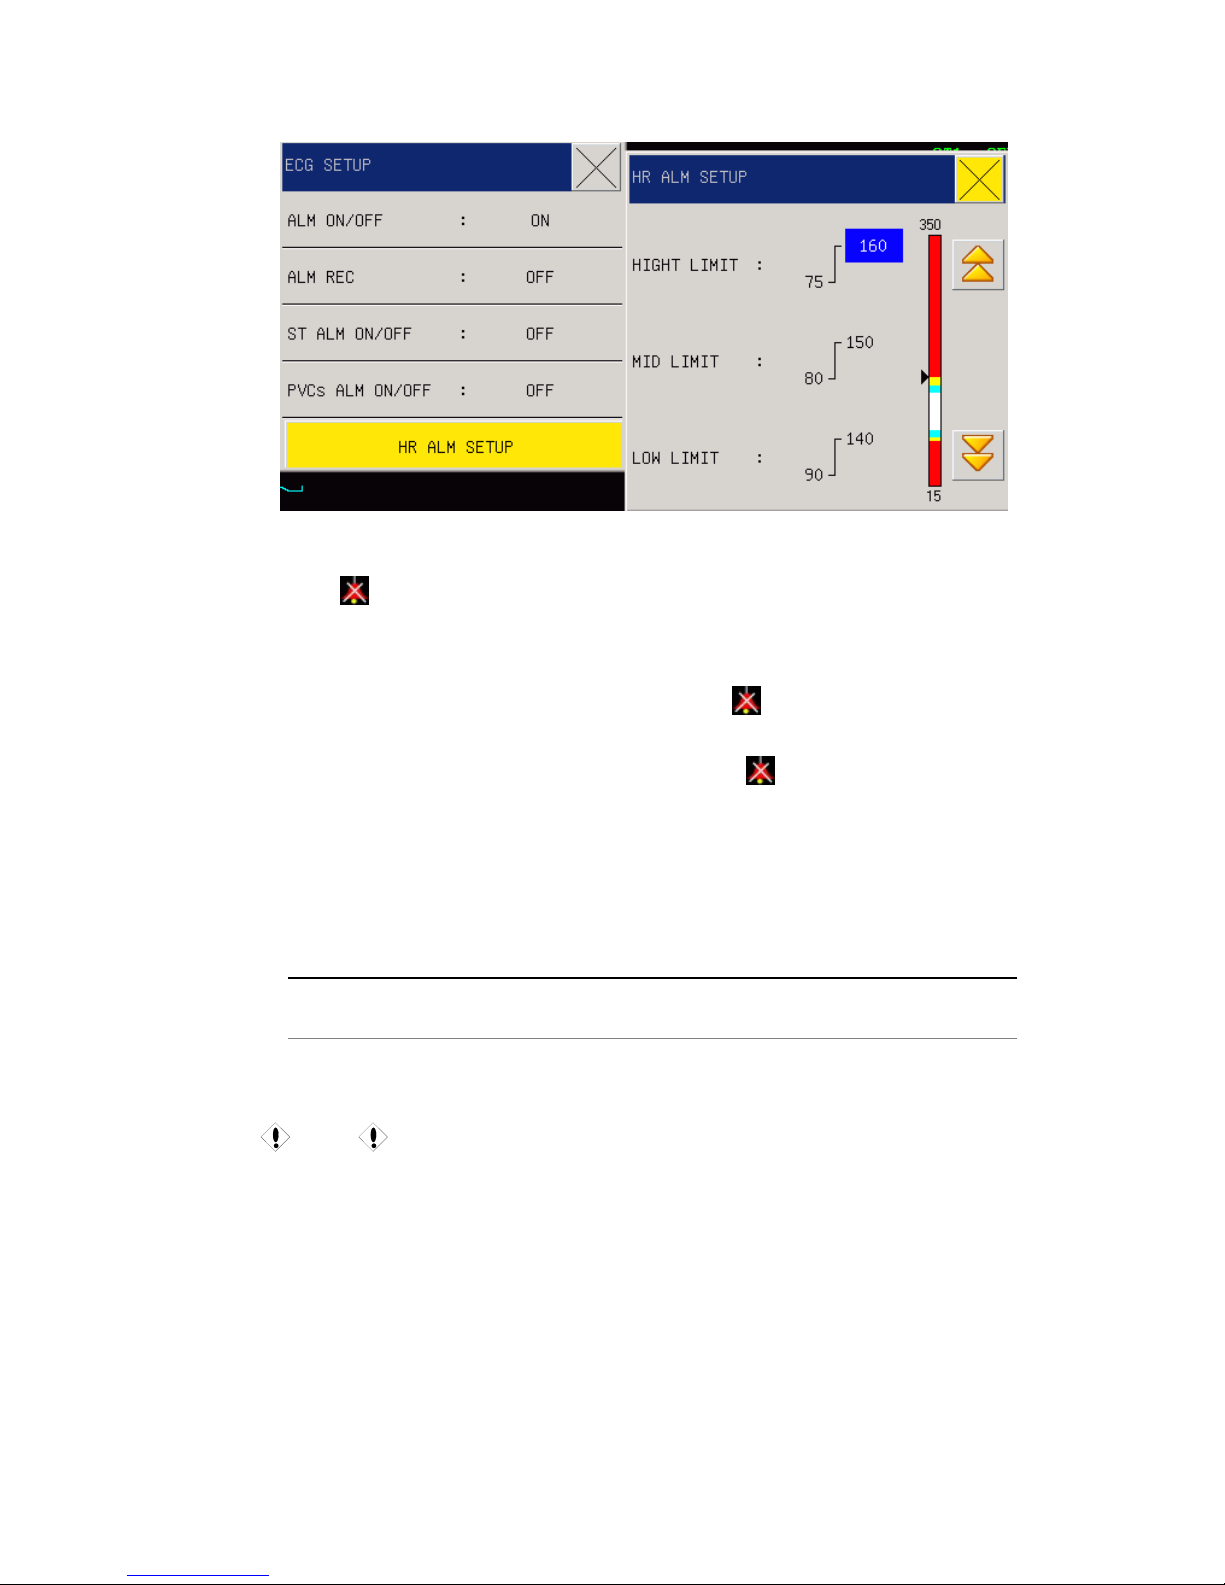
64
Fig 10-5 ECG Setup
Alarm ON/OFF: Select “ON” to give alarm prompt and storage when the heart rate alarm
happens.
will be prompted beside ECG.
Alarm record: Users can select “On” to print HR alarms when they happen
ST ALM ON/OFF: Select "ON” in the event of ST1 or ST1 overrun alarm prompt and
storage, select the "OFFs not an alarm, and ST1 next have "
” pompt.
PVCs ALM ON/OFF: Select "ON” in the event of PVCs or PVCs overrun alarm prompt and
storage, select the "OFFs not an alarm, and PVCs next have "
” pompt.
HR ALM SETUP: setup heart rate hight limit ,middle limit ,low limit of the upper and lower
limits .
Alarms will happen once the HR values exceed the upper or lower limit.
Adjustable ranges for HR alarm upper & lower limits are as follows:
Name
Highest upper limit Lowest lower limit
Adjustment step
length
Big /small 350 15 1
Caution
Users should set the alarm upper & lower limits based on the clinical conditions of
every patient. Setting of the HR alarm upper limit is very important, and users should
not set it too high but consider fluctuation factors. The set HR alarm upper limit should
not be over 20 beats/ minutes than patient HR.
11.5.2 ECG setting in waveform area
Turn the knob to waveform area,press the knob to enter ECG waveform setting
Page 74
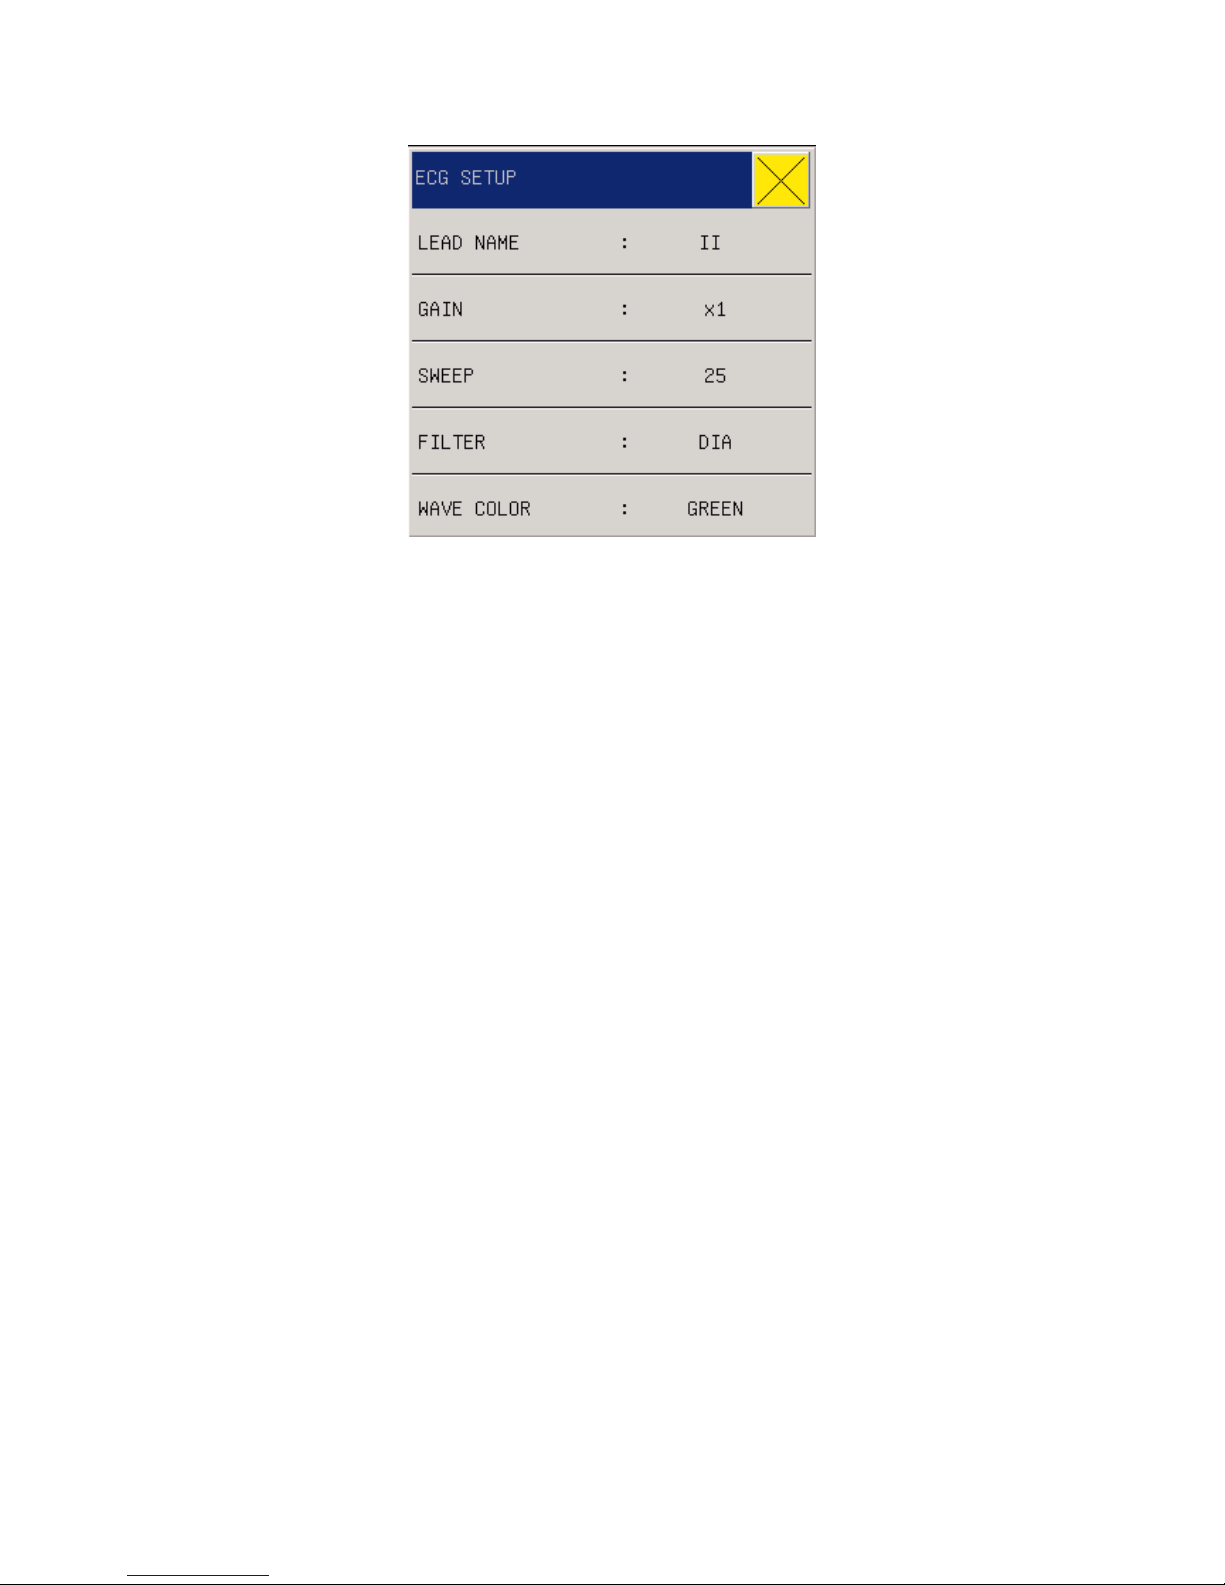
65
Fig 10-6 ECG Setup
Lead Name:
ECG using 5-lead, the selectable leads include I, II, III, aVR, aVL, aVF and V;
ECG using 3-lead, the selectable leads include I, II and III.
Gain: used to adjust the amplitude of ECG waveform. The gain of each calculation
channel can be selected, which has such columns as ×0.25, ×0.5, ×1 and ×2 as well as auto
mode. Auto mode means that the monitor can automatically adjust the gain. On the right
side of each ECG waveform there is a 1-mv rod of which height and amplitude are
proportional.
Sweep: ECG Waveform scanning wave has four levels for option, such as 6.25, 12.5,
25.0 and 50.0mm/s.
Filtering Mode: The cleaner or precise waveform can be obtained through filtering.
There are three filtering modes for option. The unfiltered ECG waveform is shown in the
diagnostic mode; the monitoring mode will possibly lead to the artifact filtering; the
operation mode used in the surgery can reduce the artifact and interference from the
electrosurgery unit. The filtering mode can be used in two channels and displayed on the
upper part of the first ECG waveform.
Wave Color: green, cyan, red, yellow, white, blue, violet.
Page 75
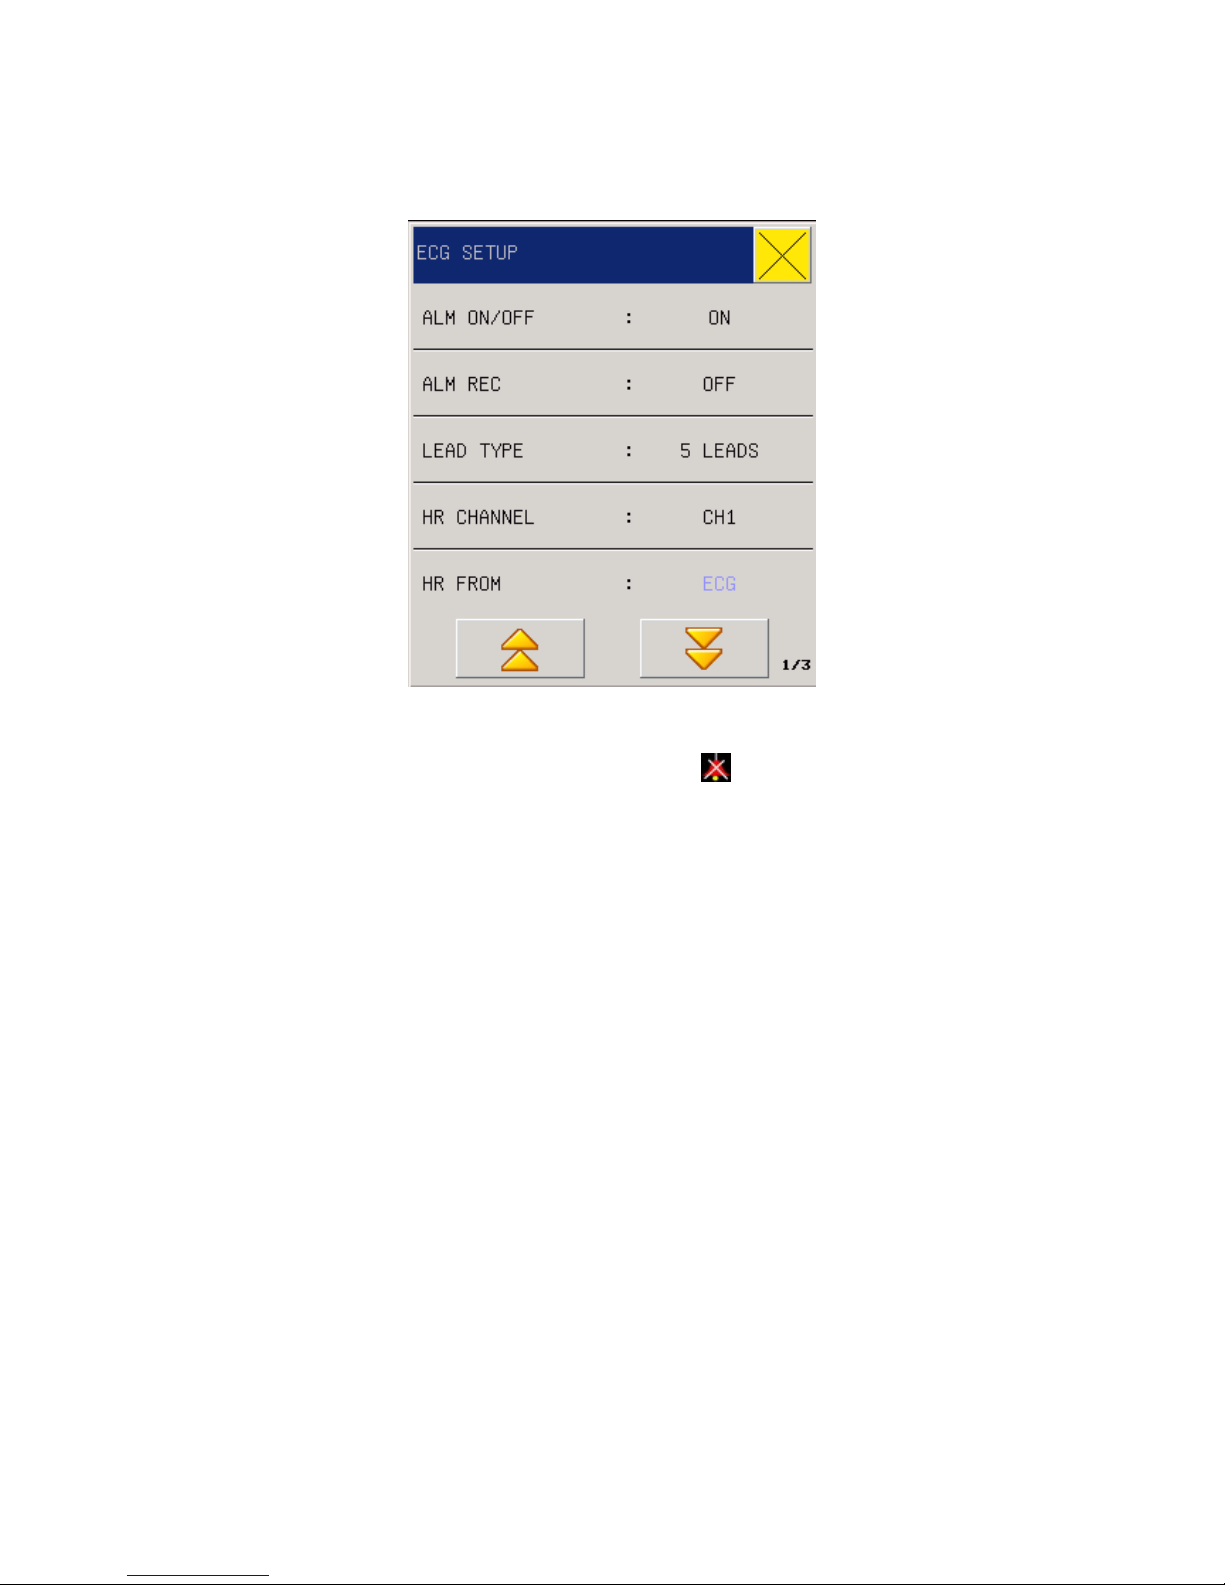
66
11.5.3 ECG setting in measurements
Fig 10-7 ECG Setting menu
1. When the heart rate alarm happens. Select “OFF”
will be prompted beside ECG.
2. Alarm record: Users can select “On” to print HR alarms when they happen
3. Lead type: 5-lead or 3-lead
4. HR CHANNEL(Selection of HR calculation channel)
“Channel 1” means the HR is calculated according to the first ECG waveform data.
“Channel 2” means the HR is calculated according to the second ECG waveform data.
“Auto” means the monitor will automatically select the channel of calculating HR.
5. HR FROM(HR Source)
Users can select to check HR through ECG or PLETH (blood-oxygen volume
recording waveform); if users select “Automatic”, the monitor will decide HR source
based on signal quality; if users select “All”, the monitor will concurrently display HR
and PR. In case PLETH is taken as the HR source, the PULSE reminder will be
displayed together with pulse voice.
In case PLETH is taken as HR source, no alarm judgment on HR but alarm judgment
on PR will be conducted. In case “All” is selected, PR measurement values will be
displayed in the right to SpO2 on the main screen, and HR & PR make alarms at the
same time. Pulse voice will give priority to HR, as long as there is HR data, voice
reminder will be there; only when there is no HR data, voice reminder will be subject
Page 76

67
with PR.
6. FILTER,SWEEP ,WAVE COLOR : See this chapter “ECG Settings” parameter area
corresponding
7. NOTCH: When set to ON, it is a method of inhibiting the method and apparatus of the
power frequency common mode interference, for bioelectric signals measurement
system including a common mode interference signal extraction circuit and a drive
circuit connected to the circuit; particular, the apparatus furtherincludes a phase
compensation processing means for receiving from the subject organisms of
biological signals and the driver circuit to provide the amplified signal, the output is
sent to a feedback signal by measuring biometric.
8. HR ALM SETUP: setup heart rate hight limit ,middle limit ,low limit of the upper and
lower limits .
9. ST AMALYSIS : ST Segment Analysis Select this item and enter the “ST Segment
Analysis” menu.
10. ARR ANALYSIS: ARR Analysis Select this item and enter the “ARR Analysis”
menu.
11. ECG CAL : When the ECG calibration, you can not monitor the patient . Tip: in the
middle of the screen of the instrument calibration can not monitor the patient . Stop
the calibration is required to return to the “ECG Setup” select to “stop ECG
calibration” menus .
12. DEFAULT : Select "default configuration" dialog box, the user can choose "No" or
“Yes" to be “the default configuration” or “original configuration will be set”
11.5.4 About ST Monitoring
The monitor performs ST segment analysis on normal and atrially paced beats and calculates ST
segment elevations and depressions. This information can be displayed in the form of ST numerics
and snippets on the monitor.
All available leads can be monitored continuously. The ECG waveform does not need to be
displayed on the Screen for ST segment analysis.
Warning
This monitor provides ST level change information; the clinical significance of the ST
level change information should be determined by a physician.
Page 77

68
11.5.4.1 Setting of ST Segment Analysis Menu
ST Segment Analysis: this switch is mainly used to set the state of ST Segment Analysis. Only
when the switch is ON, ST Segment Analysis can proceed.
Alarm Switch: Where “ON” is selected, the alarm prompt and saving will proceed when ST
analysis result is alarmed; where “OFF” is selected, alarming will not happen, but
will be
prompted beside ST in the screen parameter area. ST Alarm will be triggered only when its
measured value exceeds ST Alarm Upper Limit or ST Alarm Lower Limit.
Alarm Level: used to set the ST Alarm Level according to three options such as “High”, “Middle”
and “Low”.
Alarm Record: when it is set at “ON”, the system will start the recorder for alarm record.
Alarm Upper Limit: used to set the alarm upper limit of ST Segment, of which maximum upper
limit is 2.0 and of which minimum upper limit must be more than -1.6 of the set lower limit.
Alarm Lower Limit: used to set the alarm lower limit of ST Segment, of which minimum lower
limit is 1.8 and of which maximum lower limit must be lower than -2 of the set upper limit.
The adjustable range for upper limit and lower limit of alarm as follows:
Max. Upper Limit Min. Lower Limit Single Adjustable Quantity
ST 2.0mv -2.0mv 0.1mv
Determine the ST Segment AP (Analysis Point): Select this option to enter the “Determine the ST
Segment AP” window and set the values at ISO and ST.
ISO (BP: base point): set the baseline point. Power on time is ste at 96 ms.
ST (SP: starting point): set the measuring point. Power on time is set at 128ms.
Page 78
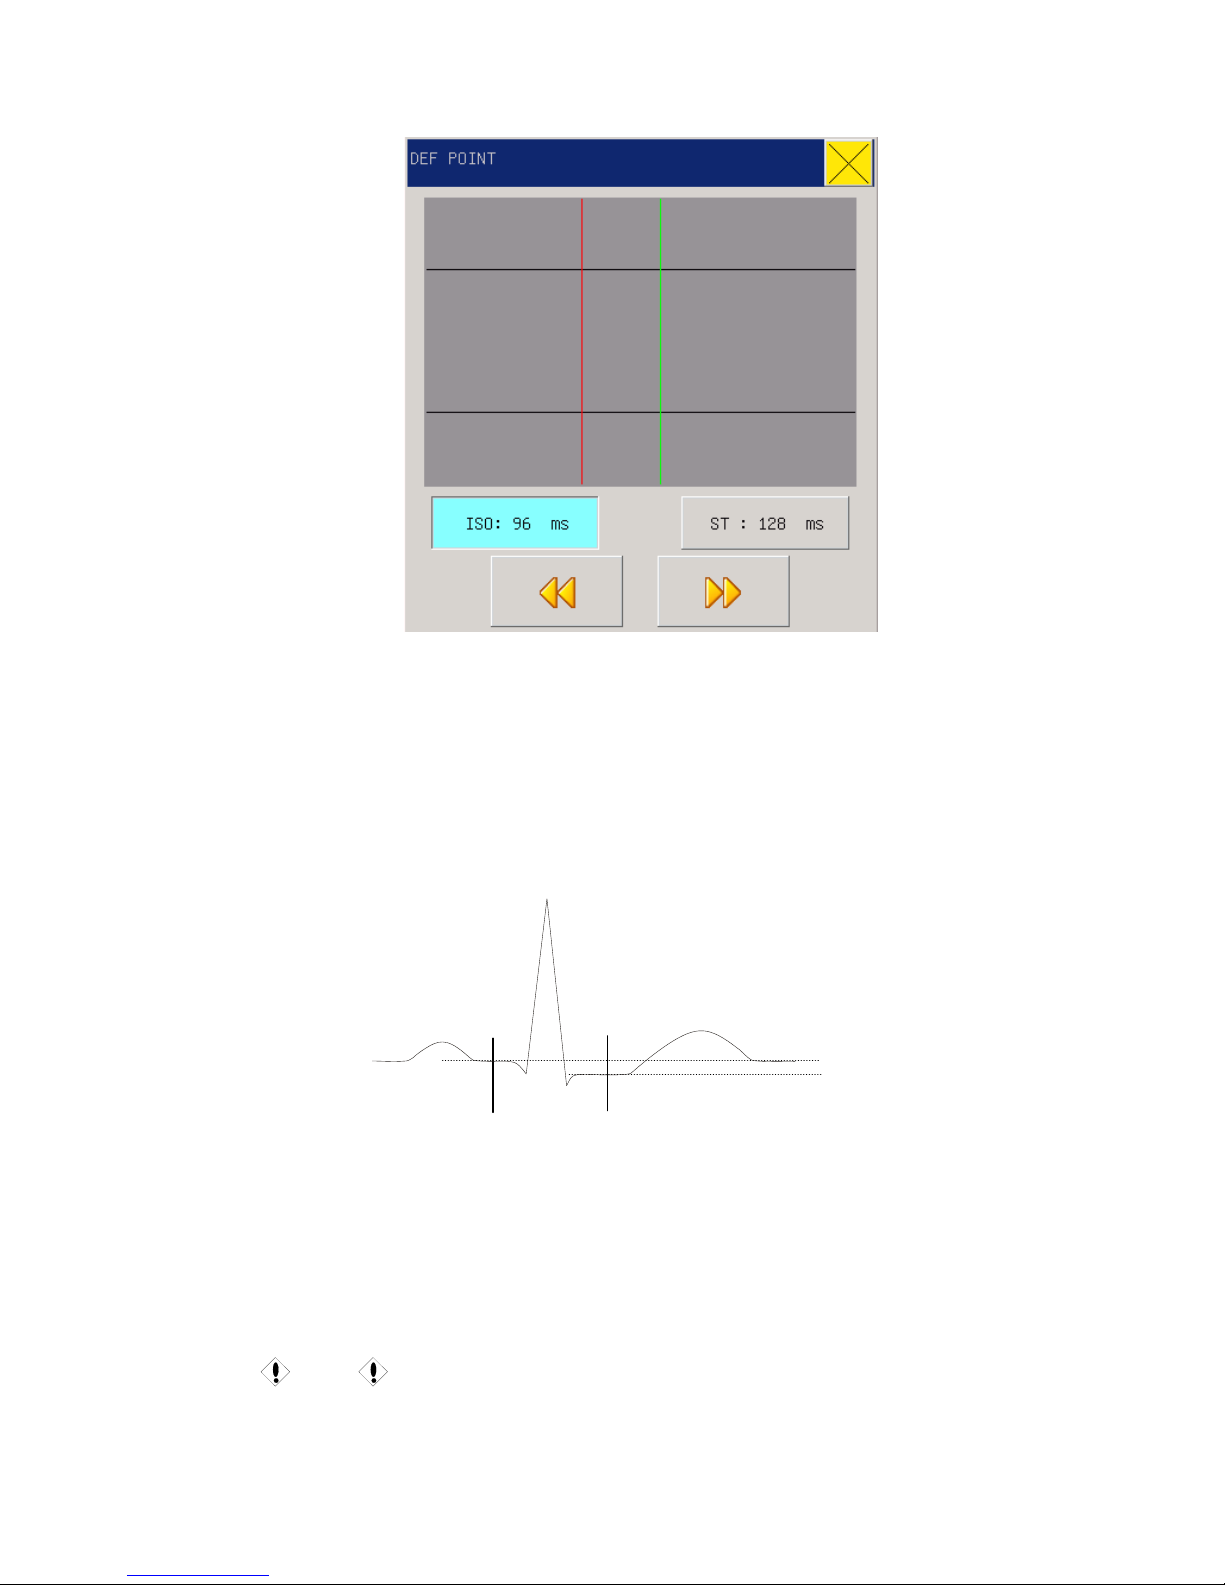
69
Fig10-8 Determine the ST Segment AP
ISO and ST are two measuring points of ST Segment, which are adjustable.
R wave crest point is the reference point in setting of ST measuring point (as shown in the
following figure):
Fig 10-9 ST A n alysis Point
ST measured value of each HB composite waveform is the vertical distance between this
waveform and the crossing of two measuring points.
Caution
Where obvious changes happen to the patient’s HR or ECG Waveform, it is necessary
P
}
ST Value
BP: ISO
-78 ms
Q
}
R Wave
S
T
ST Measuring Point
Initial Value +109 ms
+109 ms
Page 79

70
to adjust the ST measuring point in the following methods.
Method of Adjusting ISO and ST
Adjust the values by turning the knob.
Setting the measuring point of ST Segment, please open the “Determine Analysis Point” window
and the window will show QRS wave-group module (if the channel is not opened, “ST Analysis
Switch OFF” will be prompted). The location for high-brightness line in the window can be
adjusted. Select the ISO or ST first, and then turn the knob both leftward and rightward to move
such a line in parallel so as to determine the reference point or measuring point.
Caution
The abnormal QRS wave group will not be taken into consideration when ST segment is
analyzed.
Alarms & Reminders used in ST Segment Analysis.
Caution
The alarm limits for two measured values of ST SEGMENT are coincident. The alarm
limit of each channel can’t be set alone.
The alarm record switch in the related menu being opened, the physical alarm caused by the
parameter alarm super-limit will make the recorder automatically output the alarm parameter
values and related measured waveforms.
For the physical alarm, technical alarm and noticed information possible to happen in the ST
Segment Measurement, please see the following table.
Physical alarms:
Prompt
Messages
Causes Alarm Levels
ST1 too
high
The measured value for ST Segment of Channel 1 is higher than the
set alarm upper limit.
Selectable by
users
ST1 too low The measured value for ST Segment of Channel 1 is lower than the
set alarm lower limit.
Selectable by
users
ST2 too
high
The measured value for ST Segment of Channel 2 is higher than the
set alarm upper limit.
Selectable by
users
ST2 too low The measured value for ST Segment of Channel 2 is lower than the
set alarm lower limit.
Selectable by
users
Technical alarms
Prompt
Message
Causes
Alarm
Level
Solutions
ST Alarm
Limit is
wrong.
Function
safety failure
High
Stop use of ST SEGMENT alarm and advise the
biomedicine engineer or our company’s servicemen.
Page 80

71
Prompt Message (including general alarm message):
Prompt
Messages
Causes
Alarm
Level
ST1 measurement
out of scope
The measured value for ST Segment of Channel 1 exceeds the measured
range.
High
ST2 measurement
out of scope
The measured value for ST Segment of Channel 2 exceeds the measured
range.
High
11.5.5 Arrhythmia Analysis
Press SURVEY in main interface, one submenu pop up; choose ECG SETUP, Arrhythmia analysis
information inside
Arrhythmia analysis is used in clinically monitoring the ECG of baby and adult patients, detecting
the HR change and PVB, saving the arrhythmia events and producing alarm messages. Besides, it
can be used to monitor the patients with or without the pacemaker. The qualified personnel can
evaluate the patient’s status (such as HR, PVCS (PVB), frequency, rhythm and abnormal HB)
according to arrhythmia analysis and make a diagnosis and give treatment. In addition to detect
the ECG change, arrhythmia analysis can monitor patients and give a suitable alarm.
The functional default of arrhythmia monitoring in the system is the off state.
Users can start this function as needed.
Arrhythmia monitoring can arouse the doctor’s attention to the patient’s cardiac rhythm and give
an alarm through test and classification of arrhythmia and HB abnormality.
This monitor can perform 13 kinds of arrhythmia analysis.
In arrhythmia analysis, the system will save the latest 60 alarm events (the single-channel ECG
waveform four seconds before and after alarm). The operator can edit the arrhythmia events
through this menu.
11.5.5.1 Arrhythmia Analysis Menu
In the “ECG Setting” menu, select the “Arrhythmia Analysis” to enter the submenu.
(1)
ARR ANAL(Arrhythmia Analysis): During monitoring it can be set at “ON” and during
default, “OFF”
(2)
ALM ON/OFF(Alarm Switch): Select the “ON” and the alarm prompt and saving will
proceed; select the “OFF” and PVCs alarm won’t start, but prompting
do beside
PVCs in the screen parameter area.
(3)
ALM LEV(Alarm Level): There are such three options as “high”, “middle” and “low”.
Page 81

72
“High” means the most serious PVCs alarm.
(4) ALM REC(Alarm Record): Select the “ON” and the recorder will output during PVCs
alarm.
(5) ALM HI(Alarm Upper Limit): PVCs alarm is based upon the set alarm upper limit. The
alarm will happen when PVCs exceeds the upper limit.
The adjustable range for upper limit and lower limit of alarm as follows:
Name Max. Upper Limit Min. Lower Limit Single Adjustable Quantity
PVCs 10 1 1
PVCs Alarm Message and Prompt Message:
When the alarm record switch in the related menu is turned on, the physical alarm arising out of
that the parameters exceeds the alarm limit will make the recorder automatically output the alarm
parameter values and related waveforms.
The physical alarm and technical alarm that may happen in PVCs parameter measurement are
listed in the following table.
Physical alarms:
Prompt
Message
Causes Alarm Level
PVCs too high PVCs measured value is above the set alarm upper limit. Selectable by users
Technical alarms
prompt message Causes Alarm
Level
Solutions
PVCs alarm
limit is wrong.
Function
safety failure
High
Stop use of PVCs alarm and advise the biomedicine
engineer or our company’s servicemen.
(6)
ARR ALARM(ARR alarm setup): Set the Arrhythmia Alarm
①
ARR TYPE :
ASYSRTOLE、VFIB/VTAC、R ON T、VT>2、COUPLET、PVC
、
BIGEMINY、TRIGEMINY、TACH Y、BRADY、PNC、PNP、MISSED BEATS.
②
ALM ON/OFF :ON ,OFF
③
ALM LEV :HIGH ,MED, LOW
④
ALM REC :ON/OFF
⑤
ARR ALM QUICK SETUP :
The alarm fully open, the alarm fully closed, the record
fully open, to record fully closed, the alarm level. The user can select the alarm fully
open various arrhythmia alarm is set to "On", select "Alarm full off various arrhythmia
alarm set to" Off ". Similarly, the record fully open "alarm record switch can be all set
to" On ", the The record fully closed alarm record switch can be all set to" Off ".
(7)
ARR RECALL (Arrhythmia Recall): Select this option and you can view and edit the
Page 82
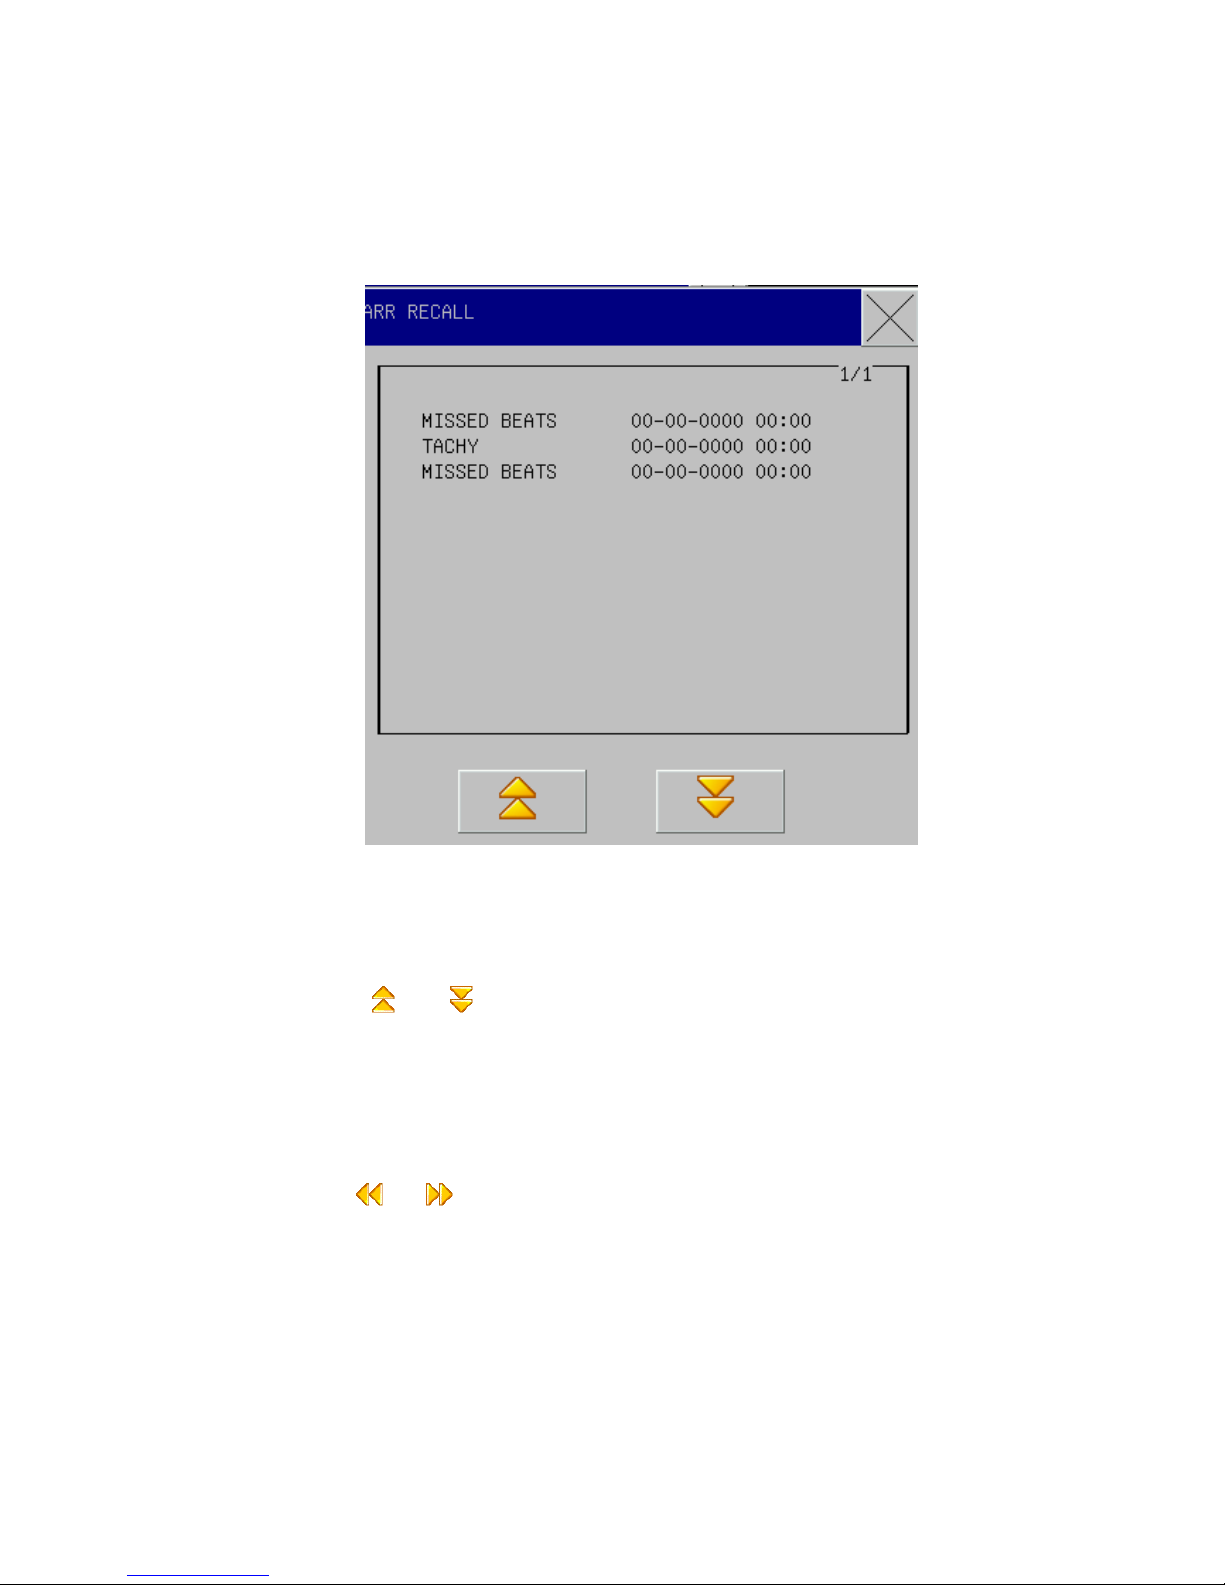
73
patient’s arrhythmia information.
The latest saved arrhythmia events are listed in the window (one page can show 10 events
and at most 6 pages can display).
Fig 10-11 Arrhythmia Review
The latest saved arrhythmia events are listed in the window (one page can show 10 events and at
most 6 pages can display).
Press “ ”&“ ”: to observe the list of arrhythmia events in other pages.
Cursor Movement: to move the cursor to select the arrhythmia events in the list.
Waveform: press this button and the window will show the waveforms, occurrence time
and parameters of the selected arrhythmia events .
Arrhythmia Waveform Review Window:
Press “ ” & “ ”: to observe waveforms of other arrhythmia events.
Movable Waveform: to observe all waveforms of arrhythmia events in 8 seconds.
Waveform: to output the arrhythmia event waveform through the recorder.
Quit: to return to the window of arrhythmia event list.
Page 83
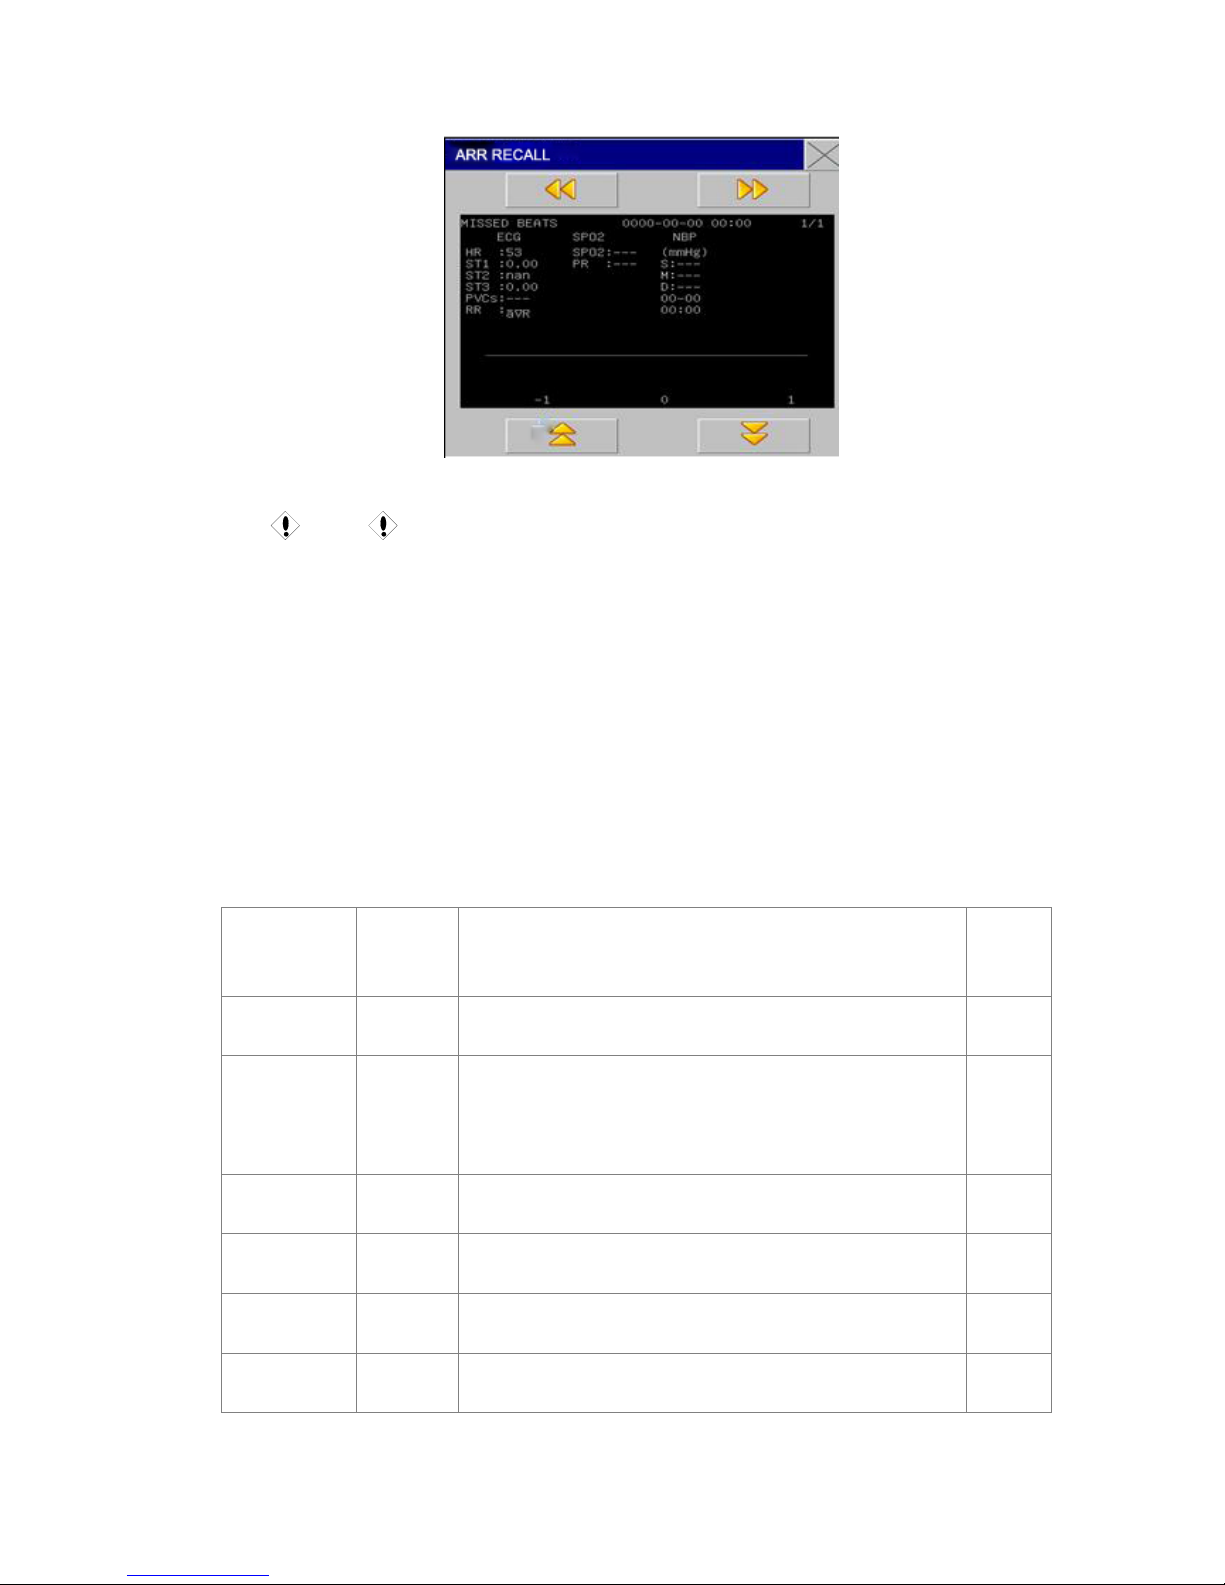
74
Fig 10-12 Arrhythmia Waveform Review Window
Caution
In the event that the number of arrhythmia event is more than 200, the monitor will
retain the latest instead of the earliest. As for the monitor with the power-fail saving
function, it can save 200 arrhythmia events with power-fail.
Arrhythmia Alarm
In case of arrhythmia, the system will give an alarm sound. If “Alarm Switch” is ON, the system
will give an alarm sound and the indicator light; if “Alarm Record Switch” is ON, the alarm
record will be outputted (ECG waveform of channels analyzed 4 seconds before and after
alarming).
The alarm or prompt message related to arrhythmia analysis is as shown in the following table.
Physical alarms:
Prompt
Message
Applied
Patient
Typ e
Conditions
Alarm
Level
Asystole Full No QRS waveforms successivefully for 4 seconds
Selectabl
e by users
VFIB/VTAC No pacing
F Wave successively for 4 seconds or the continuous
ventricular beats are greater than the number upper limit of
serial ventricular beats (≥5pcs), of which R-R time is smaller
than 600ms.
Selectabl
e by users
Multiple PVS No pacing
The number of serial PVS greater than or equal to 3 and
smaller than 5.
Selectabl
e by users
Two PVS No pacing Two continuous PVS
Selectabl
e by users
PVS bigeminy No pacing PVS bigeminy
Selectabl
e by users
PVS trigeminy No pacing PVS trigeminy
Selectabl
e by users
Page 84
75
R ON T No pacing
HR<100, RR interval < 1/3of average interval, after which
there is a compensation interval of which length is 1.25 x R-R
mean (next R waveform is moved up to the previous T wave.)
Selectabl
e by users
Single PVS No pacing Single PVS not belonging to the above types
Selectabl
e by users
Tachycardia Full
Successively 5 QRS waveforms and RR mean smaller than
0.5s
Selectabl
e by users
Bradycardia Full Successively 5 QRS waveforms and RR mean greater than 1.5s
Selectabl
e by users
MB(Missed
Beat)
No pacing
Where HR is smaller than 100times/minute, HB is not detected
in the 1.75 times of time for RR mean; or where HR is greater
than 100times/minute, pulsation is not detected within 1
second.
Selectabl
e by users
Pacemaker
doesn’t work.
Pacing
In the 1.75 times of time for RR mean there are no QRS
waveform and pacing pulse (only for the patient with the
pacemaker).
Selectabl
e by users
Pacemaker
doesn’t capture
pacing.
Pacing
In case of pacing pulse there is no QRS wave in the 1.75 times
of time for RR mean (only for the patient with the pacemaker).
Selectabl
e by users
Applied Patient Type: “Full” means the arrhythmia analysis that can be given to the patient with
the pacemaker as well as that to the patient without the pacemaker.
“Non-pacing”: means the arrhythmia analysis that can be given to the patient without the
pacemaker.
“Pacing”: means the arrhythmia analysis that can be given to the patient with the pacemaker.
Prompt Message:
Prompt
Message
Cause Alarm
Level
ARR Learning QRS wave template necessary in ARR analysis is forming. No Alarm
Caution
Arrhythmia name displays in the alarm message area.
11.6 ECG Alarms & Reminders
Alarming information
Possibly happened alarms during ECG measurement are classified into physical alarms and
technical alarms, while during the same process there may be various reminders. The visual and
audio appearance of the monitor upon happening of such alarms or reminders, are as described in
the Alarming chapter. On the display screen, physical alarms and general reminders are displayed
Page 85

76
in the alarming area, while technical alarms and those reminders unable to activate alarms are
displayed in the information area. In this chapter all the descriptions on alarming applies out of the
arrhythmia and ST segment analysis parts.
When the alarming record function under relevant menu is turned on, those physical alarms
activated because parameters exceed alarming limits may activate the recorder to automatically
output alarming parameter values and the relevant measurement waveforms.
The following classified table lists various possible alarms during such measurement process.
Physical alarms:
Reminders Causes Alarming levels
ECG signal
over-weak
Fail to detect patient ECG signals High
HR over-high
HR measurement values higher the set alarming
limit
User customized
HR over-low
HR measurement values lower the set alarming
limit
User customized
Technical alarms:
Reminders Causes
Alarming
levels
Solution
ECG lead disconnected
ECG electrodes drop
off from patient
body or ECG cables
drop off from the
monitor
Low
Make sure electrodes,
leads and cables are all
connected properly
ECG V-lead disconnected or
ECG C-lead disconnected
ECG LL-lead disconnected or
ECG L-lead disconnected
ECG RA-lead disconnected or
ECG R-lead disconnected
ECG module initialization error
Failure in ECG
measurement
module
High
Stop using the
measurement function
provided from the ECG
module and inform
biochemical engineers or
our maintenance
personnel
ECG module initialization error 1
ECG module initialization error 2
ECG module initialization error 3
ECG module initialization error 4
ECG module initialization error 5
ECG module initialization error 6
ECG module initialization error 7
ECG module initialization error 8
ECG module communication
stopped
ECG measurement
module failure or
communication
failure
High Ditto
ECG module communication error
Casual
communication
High
Ditto if the failure
continues
Page 86
77
error
HR alarming limit error
Function / safety
error
High
Stop using HR alarming
and inform biochemical
engineers or our
maintenance personnel
ECG over-disturbance
ECG measurement
signals are heavily
disturbed
Low
Keep patients silent,
electrode connection
reliable, and AC supply
earthing well
Reminders (including general alarming information):
Reminders Causes Alarming levels
HR measurement out of
scope
HR measurement values out of
measurement scope
High
Page 87

78
Chapter12 RESP Measurement
12.1 Measure RESP
12.1.1 How to measure RESP
This monitor measures RESP values from the breast impedance values at two electrodes;
impedance change between such electrodes (due to breast activities) will generate a RESP
waveform on the screen.
12.1.2 Setting of RESP monitoring
For RESP monitoring, no additional electrodes are required, but how to install electrode is critical.
For some patients, especially with clinical condition that negative breast internal pressure will be
generated if their breast is horizontal expanded. In that case, users should put the two RESP
electrodes respectively at middle line of the right axilla and left side to the breast, where there are
largest activities during respiration, so as to obtain the best RESP wave.
Caution
RESP monitoring is not applicable for patients with active activities otherwise may
generate wrong alarms.
RESP monitoring checks:
Take patient skin preparation before installation of electrodes;
Install spring clamp or snap for electrodes, and follow the later-introduced method to
install electrodes on patient body;
Turn on power supply for the monitor system.
Install electrodes for RESP monitoring
Page 88

79
Fig 11-1 Install electrodes
■ white electrode (RA) — Right foreleg
■ black electrode (LA)— Left foreleg
■ green electrode (RL)— Right hind leg.
■ red electrode (LL)—Left hind leg.
■brown electrode (V) — Fourth intercostal space.
Caution
Install the white and red electrodes in a diagonal line so as to obtain the best RESP wave.
Need keep the liver and heart area out of the line formed by such electrodes, so as to
avoid artificial discrepancy generated from heart cover or pulsatile blood, which is very
important for newborns.
12.2 RESP Setting in parameter area
Users can rotate the knob and move the cursor to the RESP hotkey on the parameter area of the
main screen, then press the knob to enter the RESP Setting menu.
Page 89
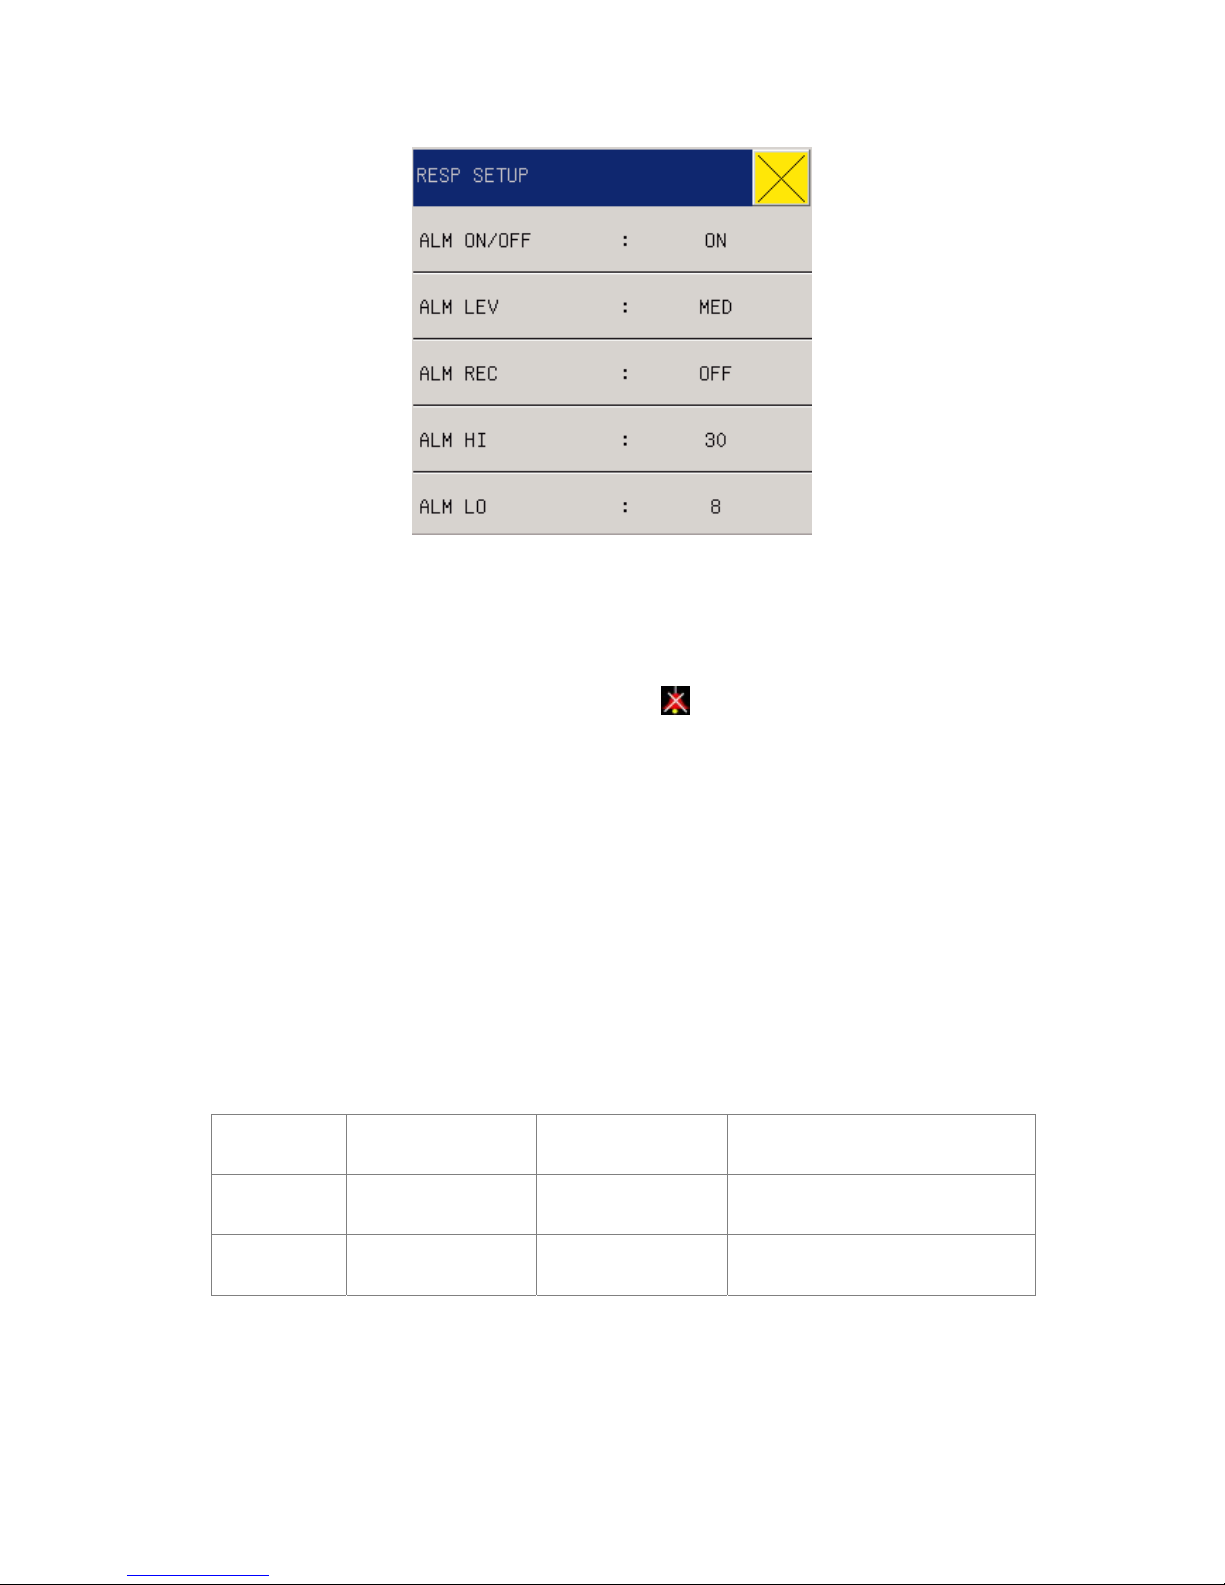
80
Fig 11-2 RESP Setup
1. ALM ON/OFF(Alarm Switch): select the “ON” and the alarm prompt and saving will
proceed during RR alarm; select the “OFF” and “
” will be prompted beside RESP in the
screen parameter area.
2. ALM LEV(Alarm levels): High, MED or Low to be selected, and High for the most serious
alarm.
3. ALM REC(Alarm record): If users select “On”, upon RESP alarming, the recorder will
output the alarm.
4. ALM HI(Alarm high): used to be set with the upper limit for RR alarm.
5. ALM LO(Alarm low): used to be set with the alarm lower limit.
RESP alarming takes the set upper & lower limits as standard, and once the RESP values exceed
such limits there will be alarms.
Adjustable range of RESP alarm upper & lower limits:
RR Max upper limit Min lower limit Adjusted amount per time
BIG
7~120bpm 6~119bpm
1
SMALL
7~150bpm 6~149bpm
1
Choke alarm: Users can set the time to judge patient choke; 10-40 seconds are optional, each
rotation of knob will increase/ decrease 5 seconds.
Page 90
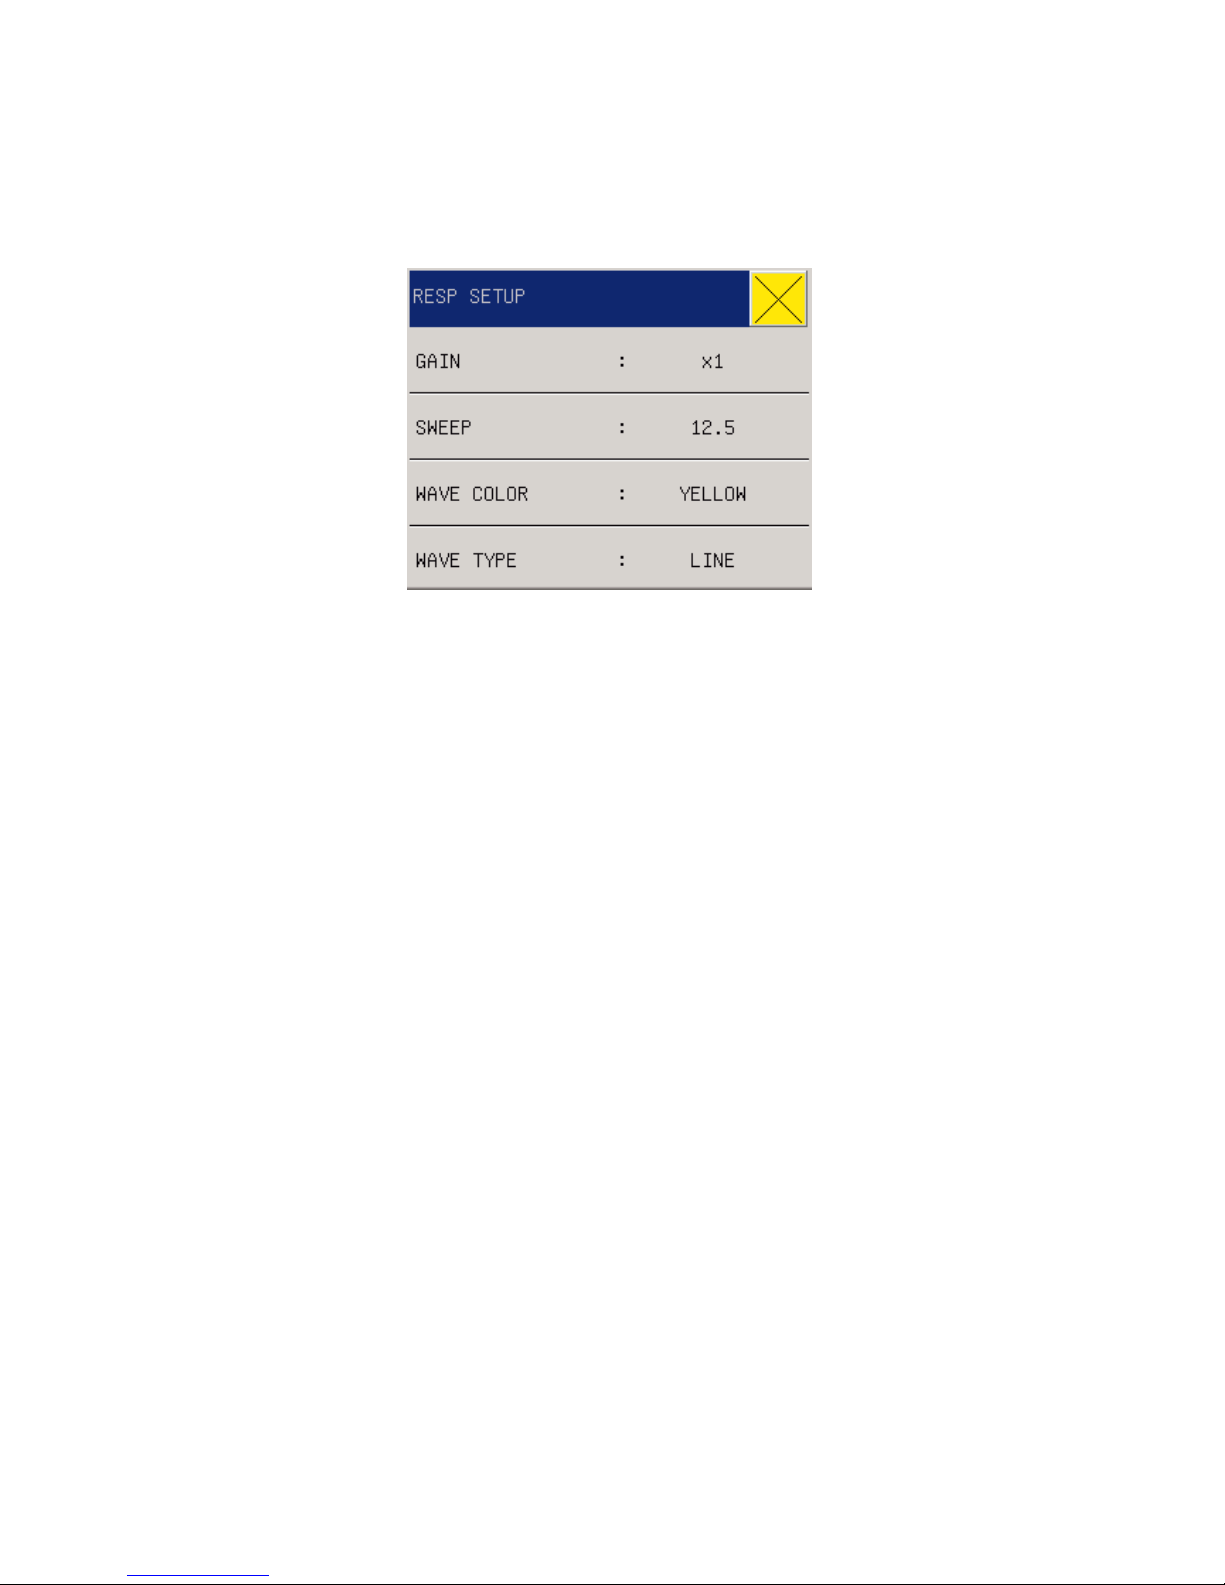
81
12.3 RESP setting in waveform area
Users can rotate the knob and move the cursor to the RESP hotkey on the parameter area of the
main screen, then press the knob to enter the RESP Setting menu.
Fig 11-3 RESP Setup
GAIN(Waveform amplitude): Users can set enlarged display of RESP waveforms under five
optional enlargement rates: ×0.25, ×0.5, ×1, × 2 and ×4.
SWEEP(Waveform speed): Three optional speeds, 6.25mm/s, 12.5mm/s and 25.0mm/s
WAVE COLOR: green, cyan, red, yellow, white, blue, violet.
WAVE TYPE : LINE or FILL
12.4 RESP setting in measurements
Users can rotate the knob and move the cursor to the RESP hotkey on the parameter area of the
main screen, then press the knob to enter the RESP Setting menu.
Page 91
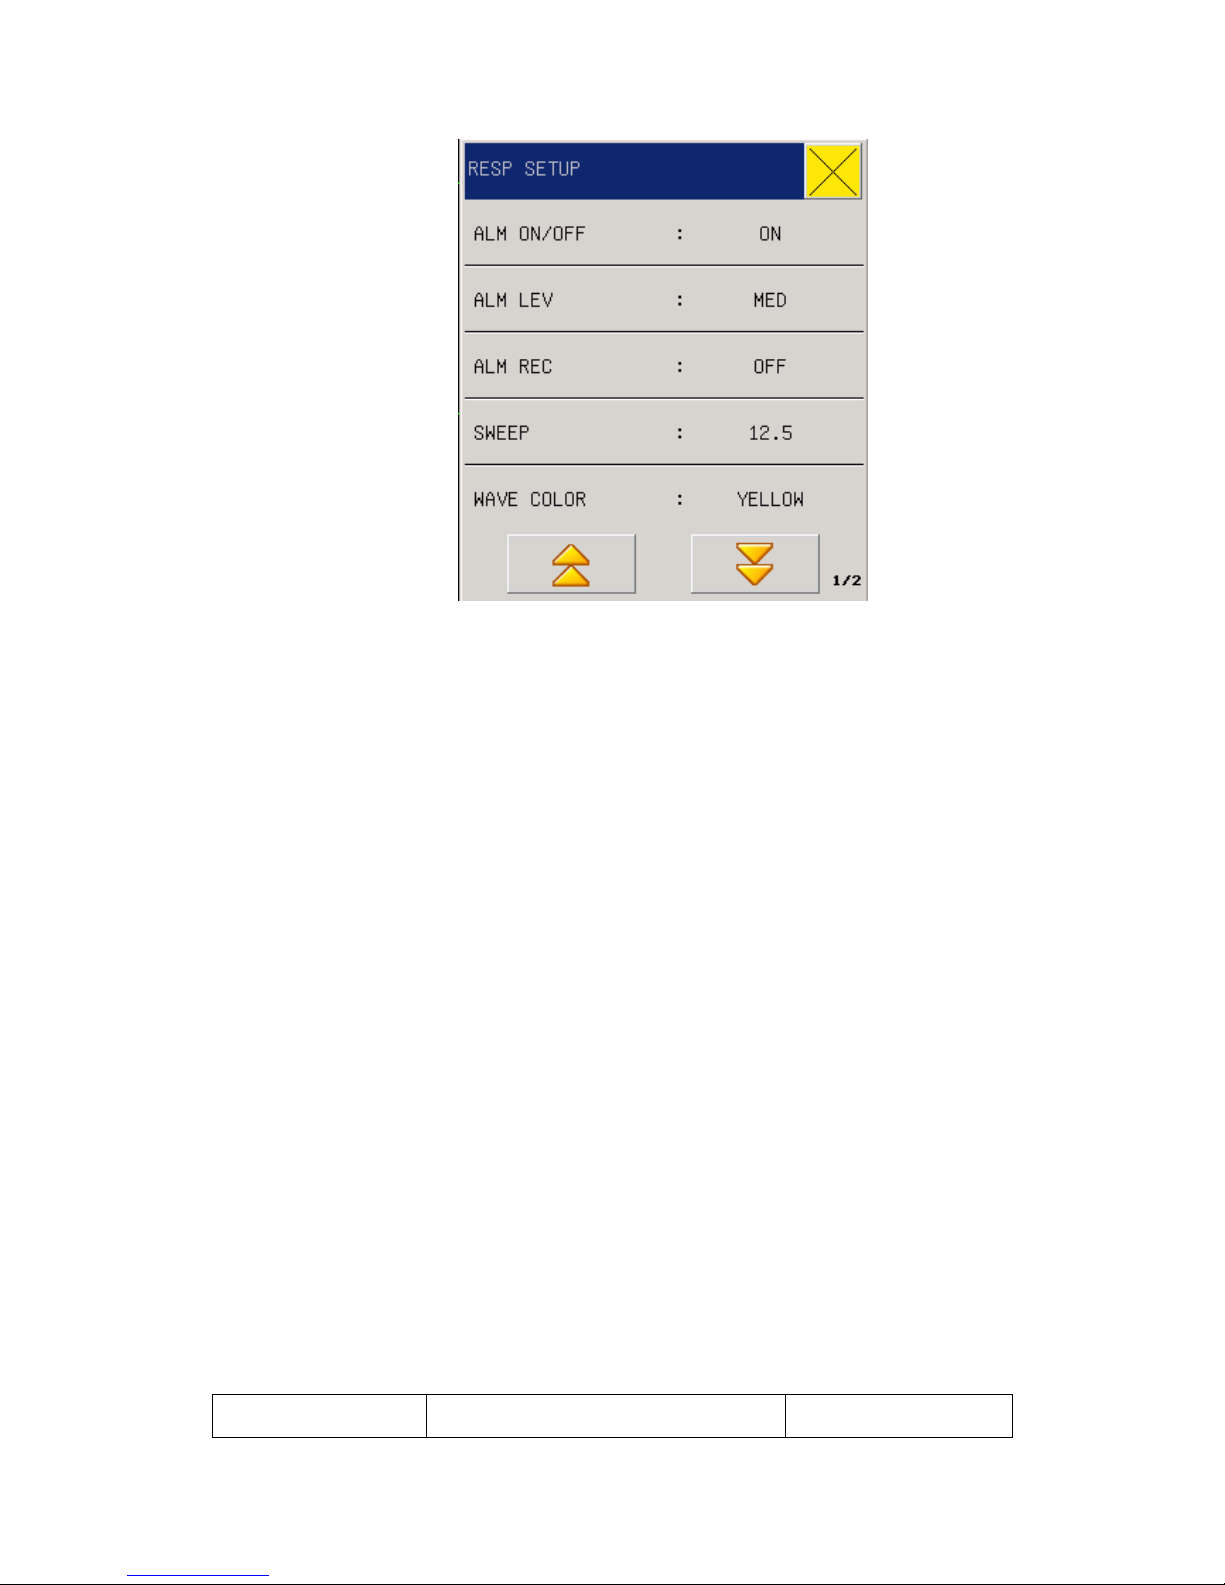
82
Fig 11-4 RESP Alarm Setup
1. ALM ON/OFF: see reference in RESP Setting menu
2. ALM LEV: see reference in RESP Setting menu
3. ALM REC see reference in RESP Setting menu
4. SWEEP: Waveform speed, Three optional speeds, 6.25mm/s, 12.5mm/s and 25.0mm/s
5. WAVE COLOR: green, cyan, red, yellow, white, blue, violet
6. RR Gain: Users can set enlarged display of RESP waveforms under four optional
enlargement rates: 0.25, 0.5, 1.0, 2.0 and 4.0.
7. APNEA ALM :Set the time dignosing a patient suffocation .NO , 1s ,2s ,5s ,10s ,15s ,20s,
25s ,30s ,35s ,40s.
6. ALM HI: used to be set with the upper limit for RR alarm.
8. ALM LO: used to be set with the alarm lower limit.
9. DEFAULT: Select this option to enter "default configuration" dialog box, select the "Yes",
that is, using the default default configuration, the original configuration will be overwritten,
select "No" to abandon the current operation, the system remains the original configuration
unchanged
12.5 RESP alarm information and prompt information
The physiological alarm, technical alarm and prompt message which may occur in the RESP
measurement are listed below:
Physiological alarms:
Prompt information Cause Alarm level
Page 92

83
RR too high
RESP measurements higher than the set
alarm upper limit
User-selectable
RR too low
RESP measurements lower than the set
alarm upper limit
User-selectable
Apnea
Breathing not detectable within a specific
time interval
High
Table 12-2
Technical alarm:
Prompt
information
Cause
Alarm
level
Countermeasure
RESP alarm limit
fault
Functional safety
failure
High
Stop using RESP alarm function, notice
biomedical engineer or maintenance personnel
of Our company.
Table 12-3
Prompt information (including the general alarm information):
Prompt information Cause Alarm level
RR beyond measurement range
RR measurements beyond measurement
range
High
Table 12-4
12.6 Maintenance & Cleaning
Please see Chapter 10 maintenance, cleaning and disinfection
Page 93

84
Chapter13 SpO2 Monitoring
13.1 Definition of SpO2 Monitoring
The SpO2 volume recording parameter is used to measure arterial SpO2, i.e., percentage of
oxyhemoglobin. For example, if there are 97% of hemoglobin molecules combining with oxygen
out of the arterial red blood cells, the blood will be described as SpO2 97%, and the SpO2 reading
on the monitor will be 97%. SpO2 values thus can show the percentage of oxygen-attached
hemoglobin molecules (will form oxyhemoglobin), meanwhile, SpO2 volume recording
parameters can also provide the PR signals and volume recording waves.
13.1.1 Principle for Measurement of SpO2 Volume Recording
Parameter
BOS (blood oxygen saturation) is measured and determined in the method of pulse oximetry,
which is a method of measuring and determining the oxyhemoglobin saturation continuously and
without any hurt, mainly used to measure and determine how many rays from the light source of
the sensor penetrate the patient’s tissue (such as fingers or ears) and reach another receiver.
As for the wave length measurable by the sensor, generally the red LED is 660nm and the infrared
LED, 940nm. The maximum selectable output power of LED is 4mW.
The number of penetrated rays rests with many factors where most are constant, but one of these
factors means the arterial flow changes through time because it is pulsant. The arterialized blood’s
BOS can be obtained through measurement of absorbed rays during pulsation. A “volume
recording” waveform and PR signal can be given through detection of pulsation.
“SpO2” value and “Volume Recording” waveform can display on the main screen.
Warning
Where there is carboxyhemoglobin, ferrihemoglobin ordye dilution chemicals, SpO2
value will have a deviation.
13.1.2 BOS/Pulse Monitoring
Warning
Page 94

85
The cable for the equipment of electrosurgery can’t be twisted together with the sensor
cable.
Warning
Please don’t place the senor on the limb with arterial duct or vein injection syringe.
Caution
Please don’t place SpO2 detector and cover on the same limb for measurement of blood
pressure, because in the course of measuring blood pressure the vascular obstruction
will affect the BOS reading.
13.2 Precautions in SpO2/Pulse Monitoring
Caution
Guarantee the nail can shut out the light.
The detector cable should be fixed on the back of hand.
Caution
SpO2 value always displays at the fixed place.
Only in the following cases PR will appear:
♦ In ECG menu, set “HR Source” as SPO2 or all.
♦ In ECG menu, set “HR Source” as “AUTO” and there is no ECG signal at this time.
Caution
SpO2 waveform and pulse are out of proportion.
Warning
Prior to monitoring, the first inspection should be given to whether the sensor cable is
normal. SpO2 sensor cable being pulled out of the jack, the screen will display the
“Sensor Off” mistaken information, and trigger the sound alarm.
Warning
Where the sensor packing or the sensor has the sign of damage, please don’t use this
SpO2 sensor, but return it to the manufacturer.
Warning
Continuous and overlong monitoring may increase the undesirable dangers that skin
features change, such as extraordinary sensitivity, reddening, blistering or pressure
Page 95
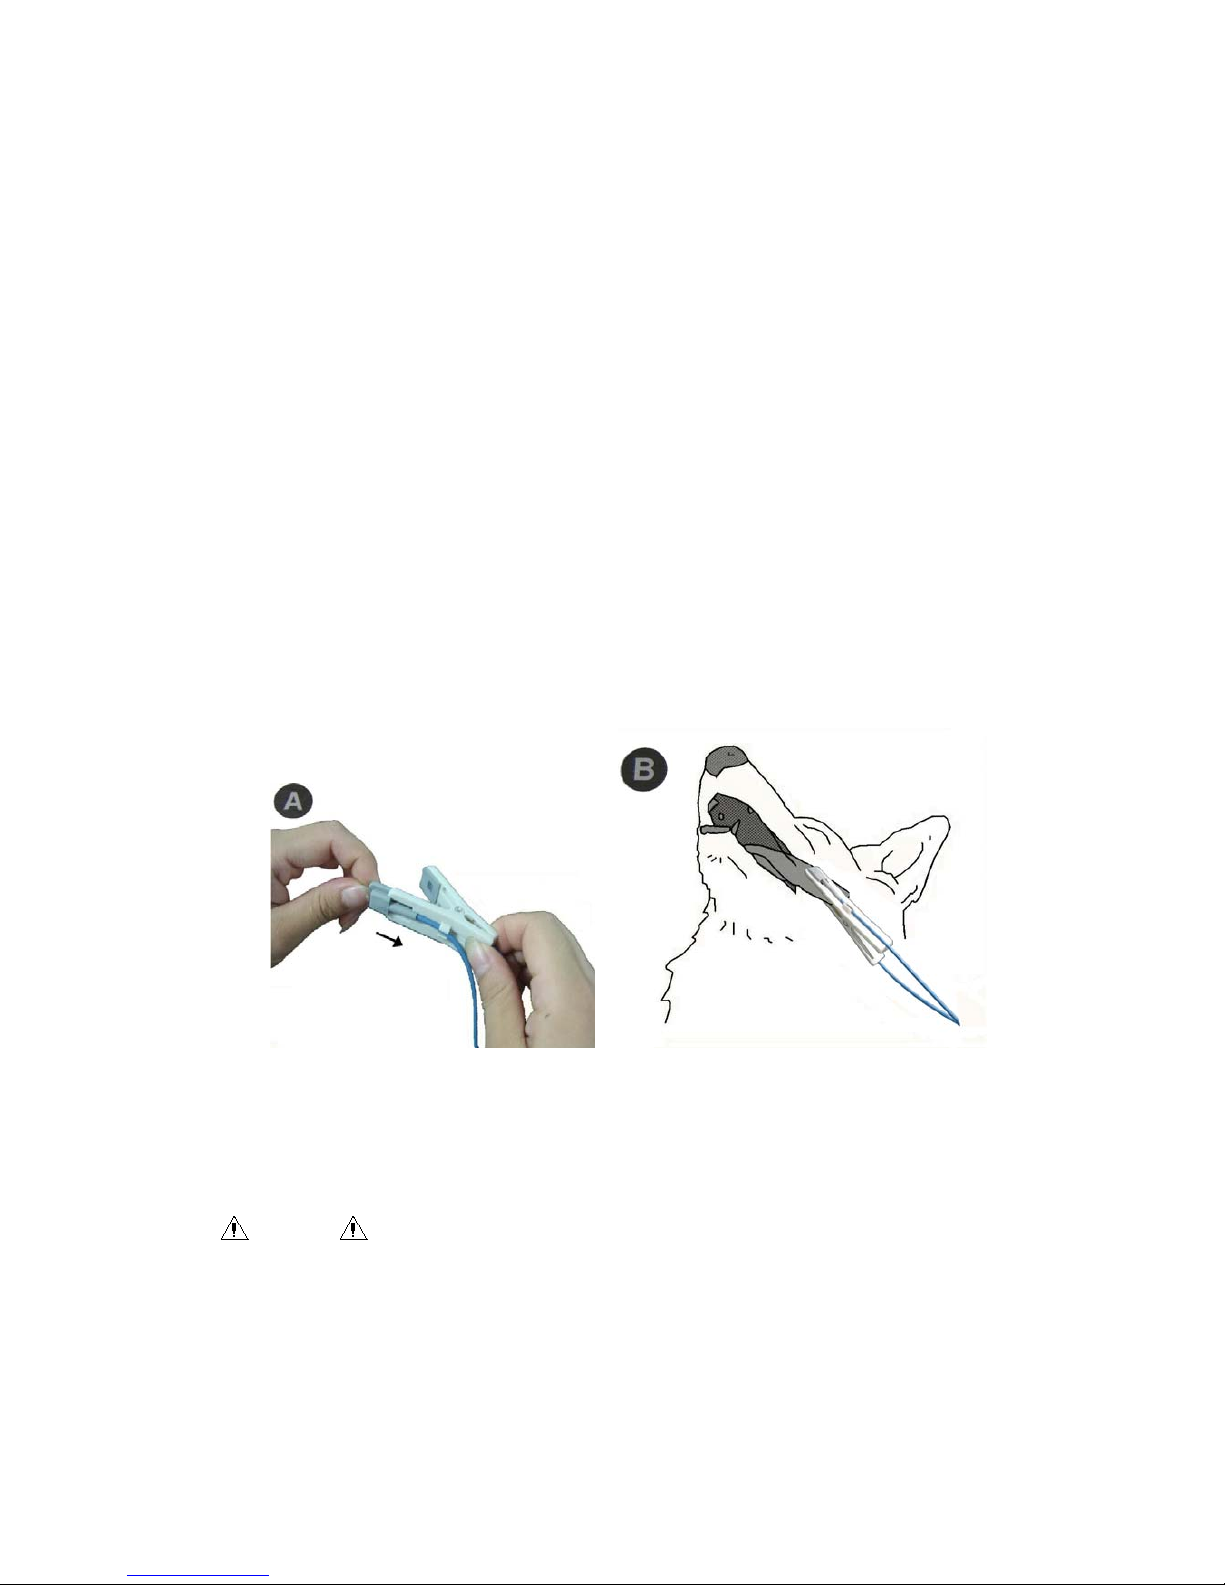
86
necrosis, which are especially easy to happen to the newborns or the patients with
perfusion disorder or immature skin. In such a case special attention should be given to
aiming the correct beam path at detection of sensor position according to the change of
skin quality. Regular inspection should also be given to the laid-on position of sensor
and the change of such a position when the skin quality goes worse. It is possible to
require for the more frequent inspection due to different patient status.
13.3 Monitoring Procedures
(1) he oxygen probe clip open in the left and right sides of the clip installed infrared LED sensor
(see Figure 13-1-A);
(2) open the monitor;
(3) to one end of the sensor cable connector insertion the SpO2 module's SpO2 hole;
(4) the best placement of the probe position is the animal's tongue, the probe can be placed in the
intermediate position of the tongue of the animal. Other places, such as the toes and ears are
also available for placement. We recommend to the probe clip clamped the animal tongue to
oxygen guardianship, (see Figure 13-1-B):
Figure 13-1 placement of senseor
Attention
When the accurate positioning between the test site and the probe fails, it may result in
wrong readings of blood-oxygen saturation, and even stop monitoring because of the
failure of the search for the pulse wave. In this case you should re-position the two.
Excessive movement of measured sites may affect the accuracy of the measurement,
therefore, you should calm the patient or replace sites in order to reduce the impact of
Page 96

87
excessive movement.
Warning
In a long and continuous monitoring process, check the condition of the peripheral
circulation and skin under measuring every 2 hours or so, and if negative cond itions
happen, timely change the site under measurement.
In a long and continuous monitoring process, it is advisable to check periodically the
positioning of the probe to avoid inaccurate measurement due to changing in the
positioning from moving or other factors.
13.4 Measurement restriction
Measurement restriction
During operation, the following factors may affect accuracy of SpO2 measurement:
High-frequency electric disturbance, such as disturbance generated from the system itself or
electrosurgery equipments connected with the system;
A photo-oximeter and SPO2 sensor are used during MRI process, as the inductive current may
cause burns;
Intravenous Dye;
Frequent movement by patient;
Light radiation from outside;
Improper installation of the sensor or improper touching position with objects;
Improper sensor temperature (ideal temperature should be 28℃-42 );℃
The sensor is put onto body with blood pressure cuff, arterial duct or vein tube;
Contents of non-functional Hb such as COHb and MetHb;
SPO2 over low;
Bad microvascular perfusion at the test position;
Shock, anemia, low temperature and application of vessel shrinking medicines, which all can
reduce the arterial blood flow to a non-measurable level;
Measurement is also up to absorption of lights with special wavelengths by oxyhemoglobin and
deoxygenated hemoglobin. Existence of other materials that absorbs the same wavelengths, such
as carbonated hemoglobin, hemoglobin, methylene blue and indi carmine, will make artificial or
low SPO2 values.
SPO2 sensor introduced in the accessory is recommended.
Page 97
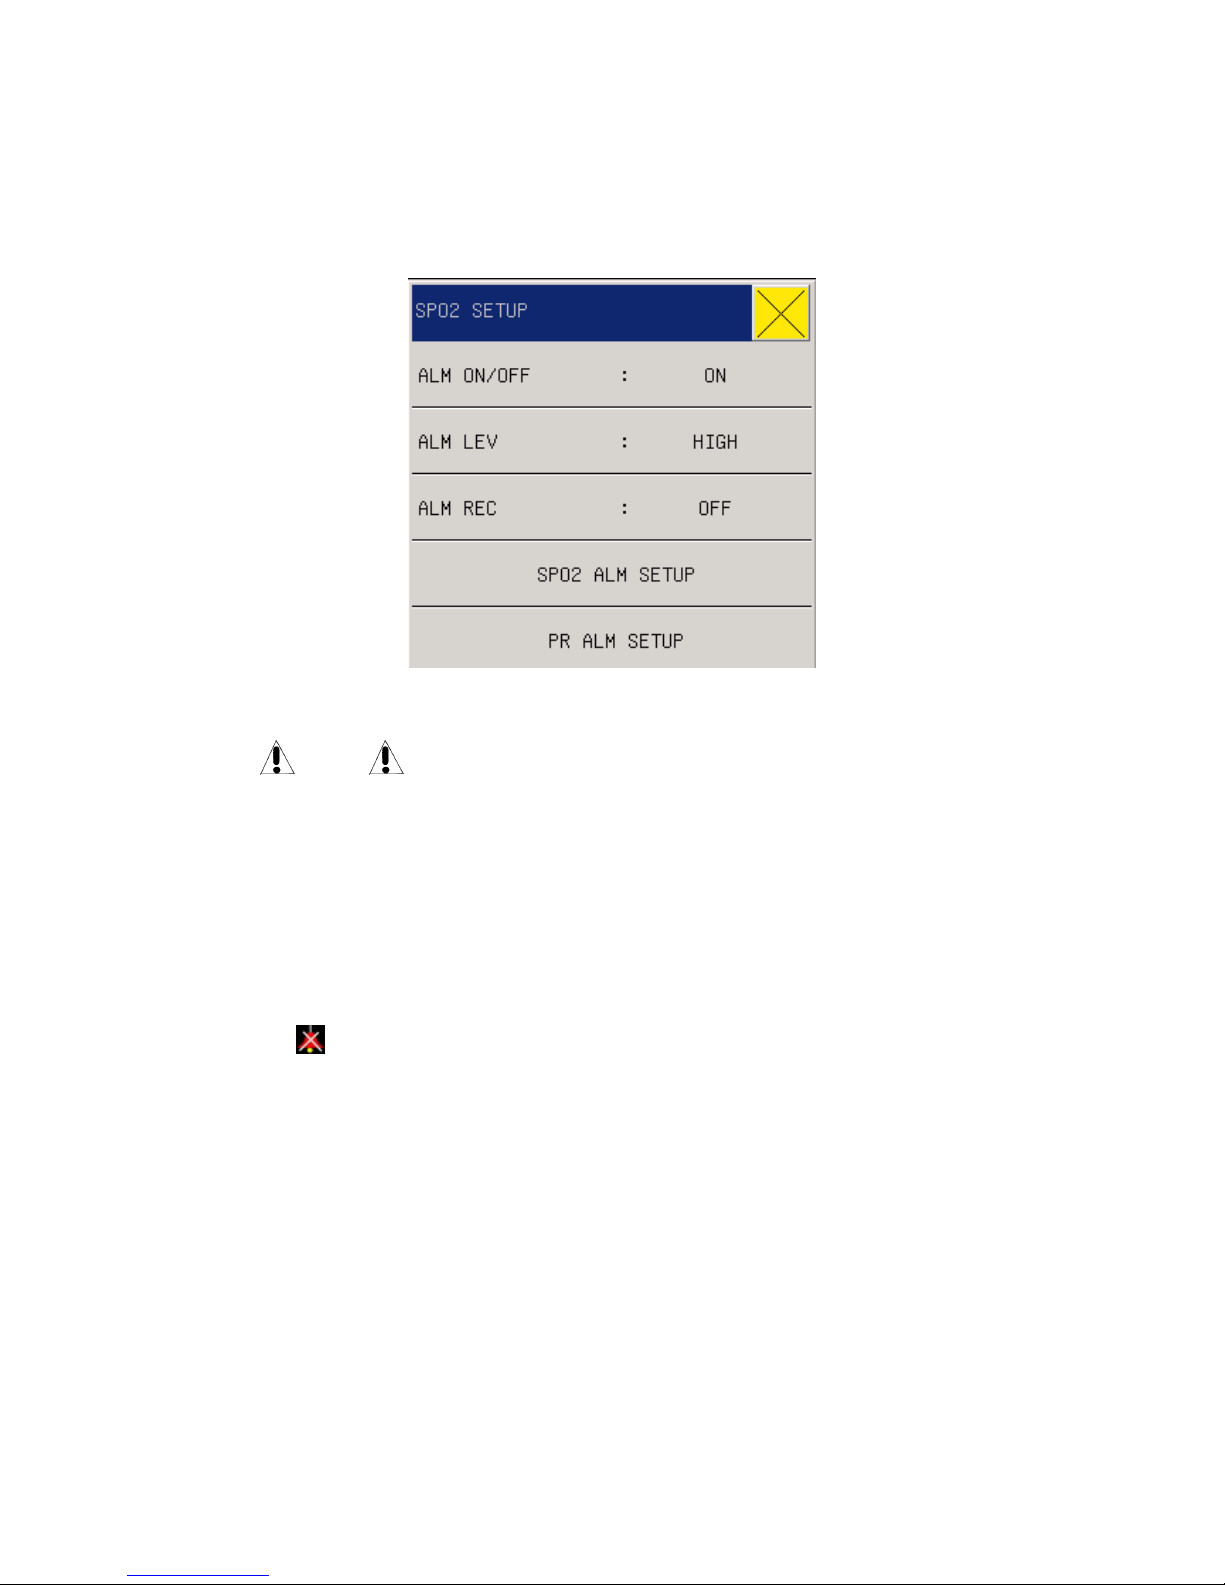
88
13.5 SpO2 Setting in the parameter area
Users can rotate the knob and move the cursor onto the SPO2 hotkey in the parameter area, then
press the knob to enter the SpO2 Setting menu.
Fig 12-7 SPO2 Setup
Warning
Setting the SpO2 alarm upper limit to be 100% means to release the upper limit.
However, high SpO2 level will make early-born infants infected with retrolental
fibroplasias, thus the SpO2 alarm upper limit must be carefully selected based on
common acknowledged clinical practice.
ALM ON/OFF(Alarm Switch): Where “ON” is selected, the alarm prompt and saving will
proceed when SpO2 (BOS) is alarmed; where “OFF” is selected, alarming will not happen,
but
will be prompted beside SpO2 in the screen parameter area.
ALM LEV(Alarm level): used to set alarm levels and, during SpO
2
alarming, for alarm
reminder and saving. Options include “High”, “Middle”, and “Low”; “High” for the most
serious alarm.
ALM REC(Alarm record): If “On” is selected, the recorder will output during SpO
2
alarming.
SPO2 ALM SETUP: setup SPO2 hight limit ,middle limit ,low limit of the upper and lower
limits .
PR ALM SETUP: setup pulse rate hight limit ,middle limit ,low limit of the upper and lower
limits .
If the monitor SPO2 is NELLCOR ,the “SPO2 ALM SETUP” and “PR ALM STEUP” , according
to the set upper/lower limit, alarm will happen when SpO
2
is higher than upper limit or lower than
lower limit.
Page 98
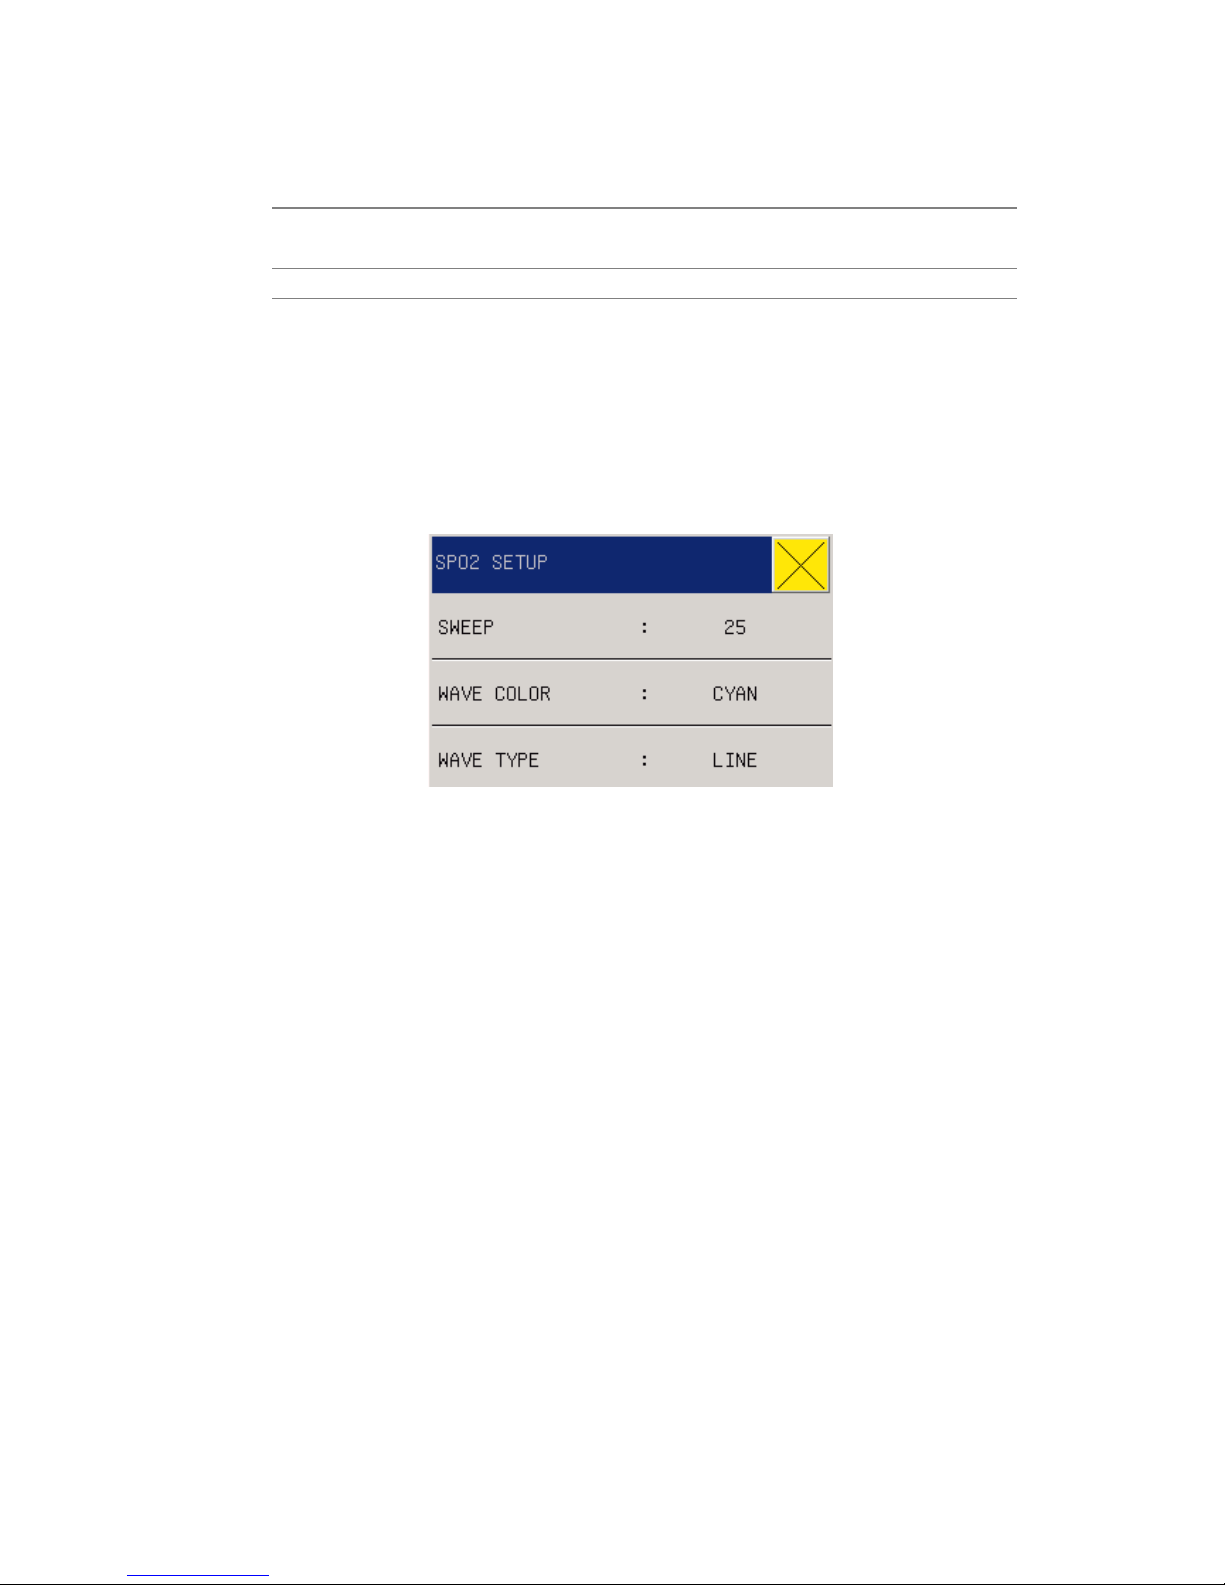
89
SpO2 & PR adjustable limits:
Parameter Max upper limit Min lower limit Adjustable amount
each time
SpO2 100% 0 1
PR 300bpm 15 bpm 1
13.6 SPO2 setting in waveform area
Users can rotate the knob and move the cursor onto the SPO2 hotkey in the parameter area, then
press the knob to enter the SpO2 Setting menu.
Fig 12-8 SPO2 Setting
SWEEP: Waveform Speed, the scanning speed of SpO2 volume recording waveform is provided
with 12.5 and 25.0mm/s for option.
Waveform Colour: green, cyan, red, yellow, white, blue, violet.
WAVE TYPE:LINE or FILL
13.7 SPO2 setting in measurements
In the menu bar, select the “SURVEY SETUP”, select the "SPO2 SETUP” , see below
Page 99
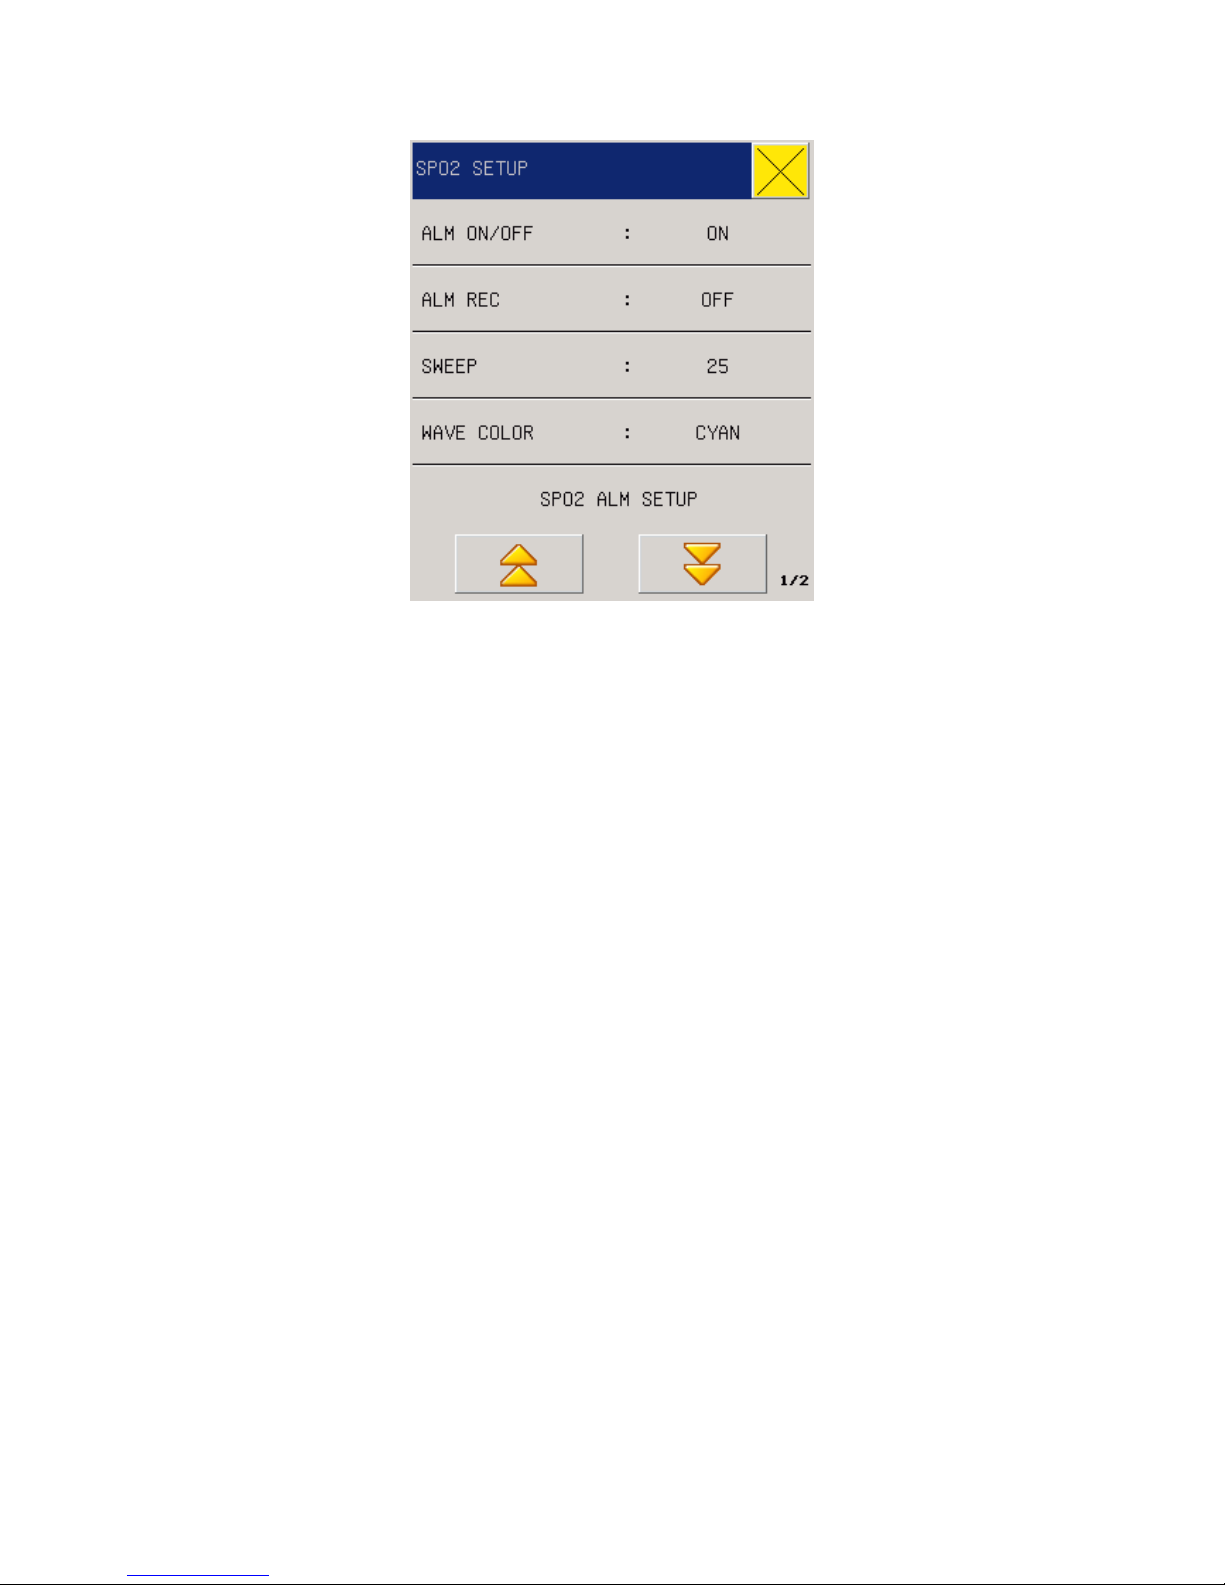
90
Figure 13-4 SPO2 setup
ALM ON/OFF: see the content of this chapter parameter area the SPO2 set the “ALM
ON/OFF”
ALM LEV: see the content of this chapter parameter area the SPO2 set " ALM LEV ".
ALM REC: see this chapter parameter area the SPO2 set “ALM REC”.
SWEEP: see this chapter waveform area the SPO2 set "SWEEP”.
WAVE COLOR:.see this chapter waveform area the SPO2 set "WAVE COLOR”
BRAIN ALARM(intelligent alarm): 10, 25, 50, 100 seconds, disable, for example, intelligent
alarm range is set to 50, then when NELLCOR oximeter alarm limit 97, and the lower limit is
90, and the measured oxygen value is 99, then from exceeding the alarm limit commences
consecutive exceeds the alarm limit of 25 seconds as soon as they sound and light alarm at
the same time the oxygen values next to the circle and draw back to square one. The
intelligent alarm to reduce false alarms, allow doctors to more accurate and timely master
oxygen changes. (This feature is only effective NELLCOR oxygen)
SPO2 ALM SETUP: see the content of this chapter parameter area the SPO2 set alarm
settings.
PR ALM SETUP: see the content of this chapter parameter area the SPO2 set alarm settings.
If the oxygen probe in the machine NELLCOR probe "SPO2 alarm settings, PR (pulse rate) alarm
settings set upper and lower limits of the alarm limit.
DEFAULT: Select this option to enter the the SPO2 default configuration dialog box, the user can
choose "yes" or "no" to "will be the default configuration" or "original configuration will be set.
13.8 Alarms & Reminders
Page 100

91
Sp02 alarm information
When the alarm record function under certain menus is on, those physical alarms caused because
relevant parameters exceed the specified alarm limits will automatically output alarm parameter
values and relevant measurement waveforms.
Possible physical alarms, technical alarms and reminders during Sp02 module measurement are as
listed here:
Physical alarms:
Reminders Causes Alarming levels
SPO2 over-high SpO2 measurement value higher than the set
upper limit
User defined
SpO2 over-low SpO2 measurement value lower than the set
lower limit
User defined
PR over-high PR measurement value higher than the set
upper limit
User defined
PR over-low PR measurement value lower than the set
lower limit
User defined
Technical alarms
Reminders Causes Alar
m
Level
s
Remedial Measures
SPO2 Sensor
disconnected
SpO2 sensor drops down
from the patient or
monitor.
Low
Ensure the sensor is fixed on the
patient’s finger or other locus and
that the monitor is normally
connected with the cable.
SPO2 module
initialization wrong
SpO2 module wrong High
Stop use of SpO2 module
measurement function and advise
the biomedicine engineer or User
Service Dept.
SPO2 module
initialization wrong 1
SPO2 module
initialization wrong 2
SPO2 module
initialization wrong 3
SPO2 module
initialization wrong 4
SPO2 module
initialization wrong 5
 Loading...