

Page 1
BLOOD PRESSURE SENSOR 0377I
0 .. 250 MM HG
User’s Guide
CENTRE FOR MICROCOMPUTER APPLICATIONS
http://www.cma-science.nl
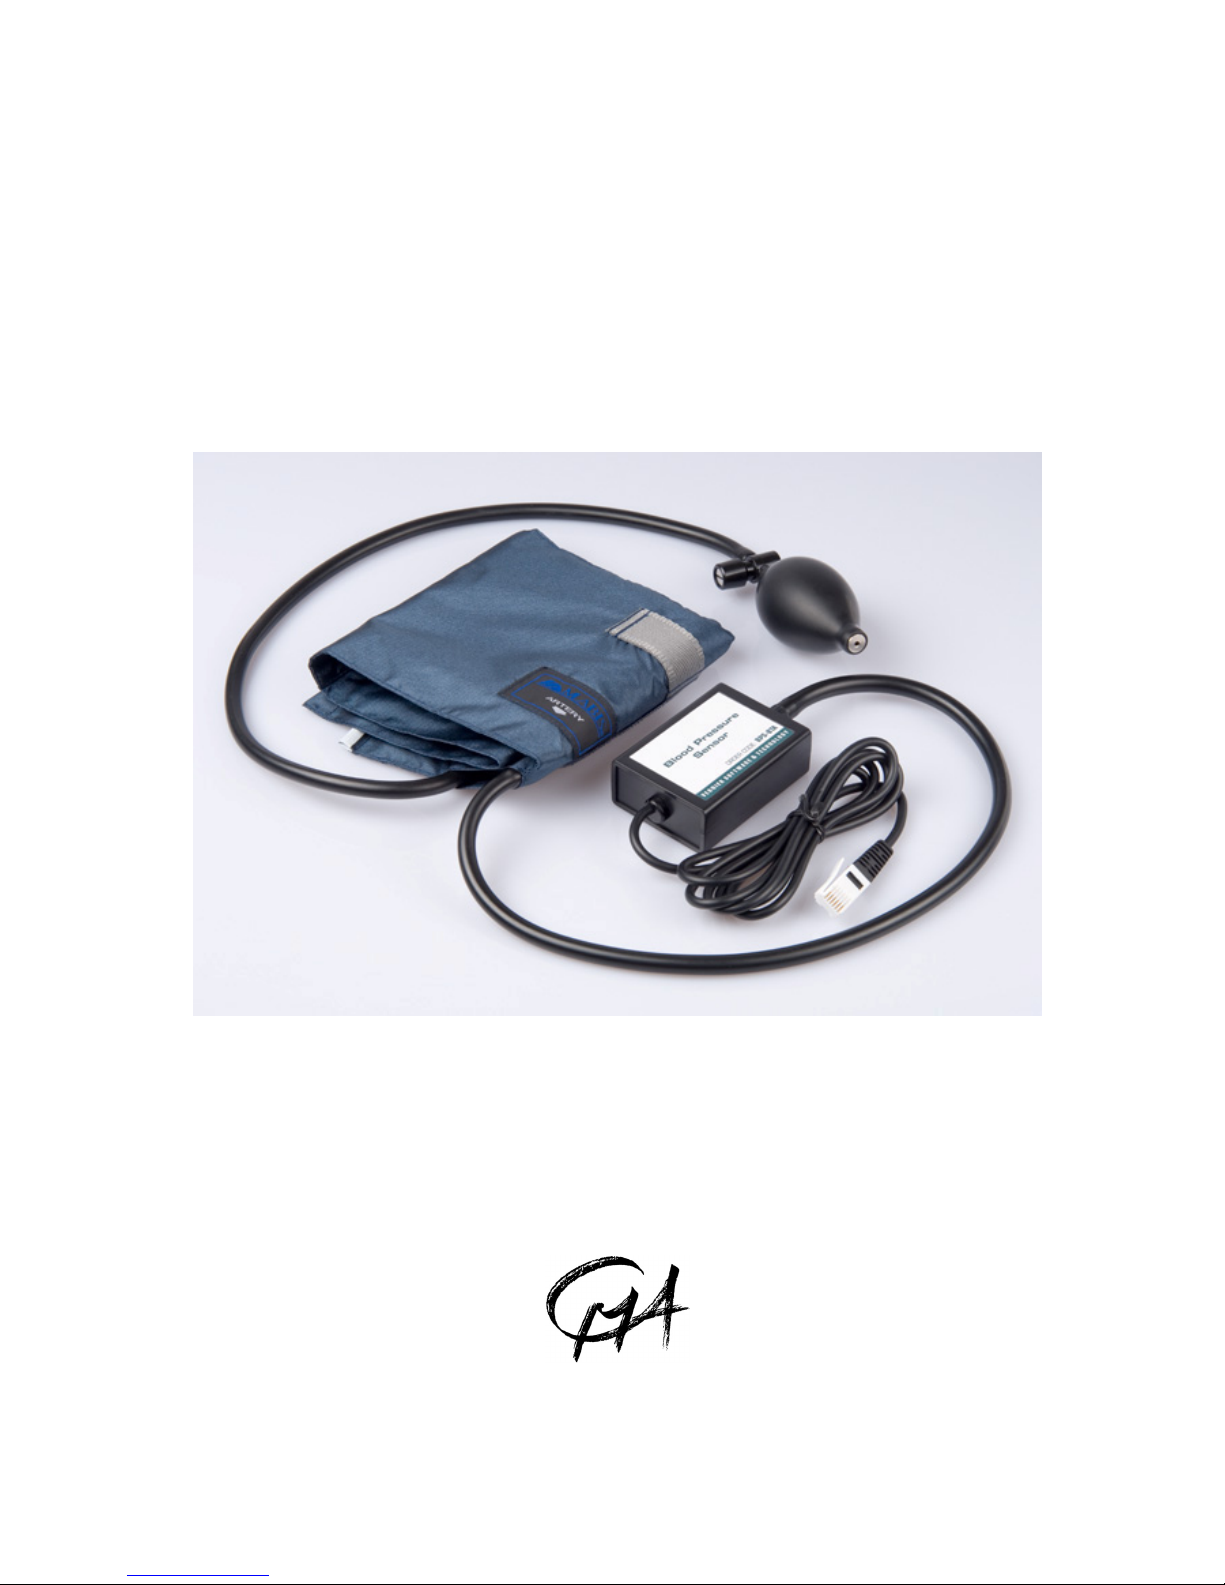
Figure 1. The Blood Pressure sensor
Page 2

2
Description
The Blood Pressure sensor is used to measure arterial blood pressure in humans (noninvasively). It measures the pressure signal caused by the interaction between the cuff and
the blood flow through the brachial artery.
The pressure sensor uses the SenSym SDX05D4 pressure transducer. This element has a
membrane that flexes as pressure changes. It is arranged to measure differential pressure.
The sensor produces an output voltage that varies in a linear way with pressure. Special
circuitry minimizes the errors that might be caused by changes in temperature. The sensor
is delivered with standard adult size adjustable cuff (27 cm to 39 cm) and bulb pump (with
release valve).
The Blood Pressure sensor is equipped with a BT plug and can be connected to the
following CMA interfaces: €Lab, CoachLab II/II
+
and ULAB. Furthermore the
sensor can be used with Texas Instruments CBL, CBL2 and Vernier LabPro
.
Important: The Blood Pressure sensor is not appropriate for medical applications.
This sensor is to be used only for educational purposes. Read this manual before you start
measurements with the sensor. Notice that over inflation of the cuff may cause pain and/or
injury
.
Sensor specifications
The Blood Pressure sensor
has a memory chip (EEPROM) with information about the
sensor. Through a simple protocol (I
2
C) the sensor transfers its data: name, quantity,
unit and calibration to the interface
1
.
Suggested experiments
The following experiments can be performed with the Blood pressure sensor:
Measure blood pressure before and after exercise and while sitting or standing;
Compare blood pressure after voluntary isometric contractions (weight lifting) and a
rhythmic activity such as running or biking;
Study the effect of caffeine on blood pressure.
Calibration
The output of the Blood Pressure sensor is linear with respect to pressure. To collect data
you can:
1. Use the calibration supplied by the sensor EEPROM memory.
2. Use the calibration supplied in the standard sensor library of the Coach program. The
name of the Blood pressure sensor in the sensor library of Coach is
Blood pressure sensor (0377i) (CMA) (0..250 mm Hg).
1
This is valid for the following interfaces: CMA €Lab, BT inputs of CoachLab II/II+ and ULAB,
TI CBLand CBL2, and Vernier LabPro.
Page 3

3
About blood pressure
During each heart beat the arterial blood
pressure varies between two utmost values:
the systolic and the diastolic pressure. The
peak pressure in the arteries is the systolic
pressure and the lowest pressure is the
diastolic pressure. In between these is the
Mean Arterial Pressure (MAP) which is used
to describe the average blood pressure.
Oscillometric Method
The blood pressure sensor can be used to determine blood pressure via the so-called
oscillometric method. With this method, which is non-invasive, a cuff is placed around the
arm and inflated by means of a pump, after which the cuff deflates via an automatic valve.
The sensor measures the cuff pressure. This pressure varies because of the blood flow in
the brachial artery.
With inflation of the cuff, the external pressure on the artery rises, and hence the artery is
increasingly compressed. At pressures exceeding the systolic blood pressure, the artery
will be occluded. There are weak pressure pulses against the cuff in the rhythm of the heart
beat which shows as small peaks in the graph.
When the cuff is slowly deflated, the cuff pressure, and hence the external pressure on the
artery will be lowered to that of the systolic blood pressure. Now, the artery is no longer
continuously occluded. At systolic blood pressure, small amounts of blood pass through
the compressed artery segment and cause changes in the artery volume, conducted to the
cuff. This leads to pressure oscillations in the cuff. These oscillations increase with lower
cuff pressure values, as more blood passes through the compressed artery. The maximum
oscillation amplitude is reached around the mean arterial blood pressure. Then, as the
pressure decreases until the cuff becomes fully deflated, the blood flow returns to normal
and the oscillation amplitude decreases in the cuff decreases and small pulses remain at a
low level below diastolic pressure.
The point at which the largest oscillations are occurring corresponds to the mean arterial
pressure (MAP). The point above the mean pressure at which the pressure difference grows
rapidly correlates to the systolic pressure. The point below the mean pressure where the
differences start to get small corresponds to the diastolic pressure.
A similar method is used during the regular blood pressure measurement, a clinician, using
the stethoscope, listens at the brachial artery for characteristics sounds of the pressure
pulses (so-called Korotkoff sounds).
Measurements with the Blood Pressure sensor
When performing blood pressure measurements, it is best to work with a partner.
1. Connect the Blood Pressure sensor to your interface. Attach the rubber hose from the
cuff to the connector on the sensor.
2. Wrap the cuff firmly around your partner’s arm, approximately 2 cm above the elbow.
The two rubber hoses from the cuff should be positioned over the bicep muscle
(brachial artery) and not under the arm.
Important: The person having his or her blood pressure measured must remain still
during data collection—no movement of the arm or hand during measurements.
3. Start your measurement in the Coach program.
Figure 2. Pressure course of the heart beat in
the brachial artery.
Page 4

4
4. Quickly and repeatedly squeeze the bulb to inflate the cuff on your partner’s arm.
Continue inflating the cuff to a pressure between 150 and 170 mm Hg. The measured
by the sensor value is displayed on the sensor icon in Coach. When the maximum
pressure is reached, set the bulb pump down onto the table. The built-in pressure
release valve will slowly deflate the cuff.
5. After the pressure drops to 50 mm Hg, press down on the pressure release valve to
release any air left in the cuff. If the pressure does not reach 50 mm Hg by the time data
collection ends, adjust the exhaust rate of the pressure release valve.
Adjusting the Pressure Release Valve
The pressure release valve is set to release at a rate of 3.0 mm Hg/second on an arm of 32
cm in circumference. For arms much larger or much smaller it may be necessary to adjust
the valve so that the exhaust rate stays in the range of 2.0–4.0 mm Hg/s. With the bulb in
hand and the hose leading away from you, place a screwdriver into the metal slot on the
top of the release valve. To increase the rate of exhaust, turn the screwdriver clockwise. To
decrease the rate of exhaust, turn the screwdriver counter-clockwise. The larger a subject’s
arm the slower the release valve will exhaust.
Helpful Tips
Blood pressure readings will
differ from person to person and
even between measurements on
the same individual. Do not
expect to receive the same
measurements each trial since
there are many factors that
cause a person’s blood pressure
to increase or decrease. Use the
following tips to take accurate
measurements.
The subject’s arm and hand
must remain still during
measurements (hand open –
no fist!).
The arm should be at heart
level and is best supported.
Proper placement of the pressure cuff will increase the accuracy of your blood pressure
measurements. The rubber hoses from the cuff should exit over the brachial artery and
2 cm above the crease in the elbow.
Remove any clothing that may cover or constrict the portion of the arm being
measured.
For most individuals it is not necessary to inflate the pressure cuff higher than 170 mm
Hg. Over inflation of the cuff may cause pain and/or injury.
If the pressure release valve is exhausting slower or faster than 2.0–4.0 mm Hg /s, then
adjust the exhaust rate of the pressure valve.
There should be at least 10 minutes break between two measurements on the same
individual.
Figure 3. A typical measurement with the Blood Pressure
sensor. The cuff is slowly deflated and arterial blood
pressure pulses are detected.
Page 5

5
The blood pressure increases with the age. The rule of thumb for the normal systolic
pressure is the formula 100 + age.
Blood pressure values are rounded to 5 mmHg.
Calculating the blood pressure in the Coach software
The blood pressure cannot be read directly from the measurement graph. A detailed
description of the data processing is given in this chapter.
The result of the measurement with the Blood pressure sensor is a pressure - time graph in
which the pressure pulses of the blood are superposed on the decaying trend pressure of the
cuff. The pressure pulses, when extracted from the cuff pressure, form an oscillating
waveform. The peak-to-peak amplitudes of this waveform create a bell shaped “envelope
curve” vs. pressure. Within the envelope, the pulse amplitudes increase through the
systolic blood pressure and continue increasing until a maximum amplitude (Mean Arterial
Pressure - MAP), is reached. After that the pulse amplitudes decrease further until hardly
noticeable.
Generally, the systolic blood pressure is calculated by determining the point along this
bell-shaped envelope for which p>MAP using a known percentage of the maximum
amplitude (usually 50%). Diastolic blood pressure is calculated using the same method and
the portion for p<MAP (usually 75%). These percentage values are obtained from
empirical research.
2
The bell shaped “envelope curve” is extracted from the measurement graph as the
difference graph of the pulse pressure graph (the maximal values of the pressure pulses)
and the trend pressure graph.
Important:
Save your original blood pressure
measurements. These are needed for the
data processing.
Determination of the cuff pressure
1. Determine the number of the
measured points in your
measurement (from the
Measurement settings or from the
Measurement table).
2. Select in the diagram window menu
the Process > Select/Remove data
option.
3. Select the method Point-by-point.
4. Mark the very first point, very last point and points where the pressure values are
locally minimal. These points indicate the graph of the deflating pressure trend of the
cuff (i.e. without the pulses). It is enough to take every second minimum (see figure 4).
Tip: Use the cursor key to go through points. Find the point where the pressure value
2
Mehlsen J et al (1999). Vejledende retnigslinier for hjemmeblodtryksmåling. Ugesk Læ Klaringsrapport
nr. 8, 1999. Online beschikbaar op http://www.hypertension.suite.dk/klar899.pdf
Figure 4. Select the points at which the pressure value
is minimal
, j
ust before the pressure signal rises again.
Page 6

6
(displayed in the pressure
coordinate field) is
locally minimal.
Select/Deselect with
space key. In Coach 6
you can maximize the
Select/ Remove dialog.
5. Mark Keep selected and
click OK. As the result
you get circa 25 points of
the lower part of the
envelope curve. These
points determine the
graph of the trend
pressure. To get a
smoothed graph with the
number of points of the
original graph through
these points you are going to use the Spline function. Select the option Process >
Smooth.
6. Select as Function Type Spline. Type the original number of points (determined in step
1) in the Number of Points field. Leave all other settings as they are. Mark Replace
data and click OK. The calculations may take some time.
7. Rename the pressure quantity p to ‘p-trend’.
8. Save the results under the new name ‘Trend pressure’ by using the option Save as….
Determination of upper pressure values
1. Open the original measurement
results.
2. Repeat the steps 2 to 6, but this time
mark the maximal pressure values, the
tops of the pulses.
It is enough to mark every second
maximum (see the figure 7).
3. Rename the pressure quantity to ‘p-
pulse’ and save the results as ‘Pulse
pressure’.
Determination of the envelope curve
You have now two result graphs from
which the difference graph should be made.
1. Open the original measurement result. Place the measurement table in one of the Coach
panes.
2. Select in the Table menu the Import data > Coach Junior/Coach 5 Result option.
3. Select in the dialog the result ‘Pulse Pressure’.
4. In the Import data dialog column C1 is selected in the Original data part, select in the
Import as part ‘Column: none’.
5. Click column C2 in the Original data part and set in the Import as part ‘Column: C3’.
Figure 5. Selection of circa 25 cuff pressure points.
Figure 7. Selection of the upper pressure points.
Page 7

7
Do not change other options. Click OK.
6. In the same way import to the Column C4 the pressure data from the ‘Trend pressure’.
7. Open the Create/Edit Table dialog by clicking the Create/Edit Table menu option.
Make data ranges C3 and C4 invisible.
For C5 select ‘Formula’ and create, using the Formula Wizard, the formula [p-
pulse] – [p-trend]. Name this quantity ‘p-difference’. Make this column also
invisible.
8. Create a new diagram with the name Envelope curve.
Select for the data range C1 ‘Manual: p-trend’.
Select for the data range C1 ‘Formula: p-difference’.
An example of a bell shaped envelope curve is shown in the diagram below.
Figure 8: A bell shaped “envelope curve” vs. the trend pressure. As blood pressure values
are usually rounded to 5 mmHg we find a blood pressure of 120/80. A best-fit bell-shape
envelope is sketched in the graph to find the maximum (MAP).
Page 8

8
Age Heart frequency per minute Systolic pressure average ± SD Diastolic pressure average ± SD
boys girls boys girls boys girls
10 jr
132 129
108±12 109±13 67± 9 64±11
11 jr
160 131
109±11 110±12 65±11 66±10
12 jr
150 147
111±13 114±14 65±10 68±10
13 jr
144 141
116±14 116±14 66±11 68±10
14 jr
127 143
118±14 116±12 66±10 69± 8
15 jr
128 127
123±14 116±11 66±11 68±11
16 jr
106 135
125±14 118±12 68±11 69± 9
17 jr
107 115
126±13 121±13 70±11 70±10
18 jr
85 85
129±15 122±14 71± 9 71±11
19 jr
94 77
131±15 120±12 71±10 70±10
Table 1: Normal heart frequency and blood pressure values for boys and girls for ages between
10-19 years old. (From: van den Brande, Heymans & Monnens, Kindergeneeskunde, Elsevier)
Technical data
Pressure range 0 .. 250 mm Hg
Voltage output range 0 - 4.5 V
Calibration function p (mm Hg) = 64.94 * V
out
(V)
Max. pressure 1030 mm Hg without permanent damage
Typical accuracy ± 3 mm Hg
Temperature Compensated 0°C to 50°C
Combined linearity and hysteresis typical ±0.2% full scale
Response time 100 microseconds
Sensor information for Auto-ID and calibration - 256 byte serial EEPROM
Connection Right-hand (British Telecom) connector
Warranty:
The 0377i Blood pressure sensor is warranted to be free from defects in materials and
workmanship for a period of 12 months from the date of purchase provided that it has been
used under normal laboratory conditions. This warranty does not apply if the sensor has
been damaged by accident or misuse.
Note: This product is to be used for educational purposes only. It is not appropriate for
industrial, medical, research, or commercial applications.
Rev. 1/11/12
 Loading...