

Page 1
OmniPeek NetFlow Analyzer User’s Guide
Introduction
We know, you love the OmniPeek UI (we all do), and you
would like to use it to analyze packet based traffic as well as
NetFlow statistics from the various Cisco Routers that are spread
all over the network. Well guess what? Now you can do just that
with the WildPackets NetFlow Analyzer for the OmniPeek
Console!
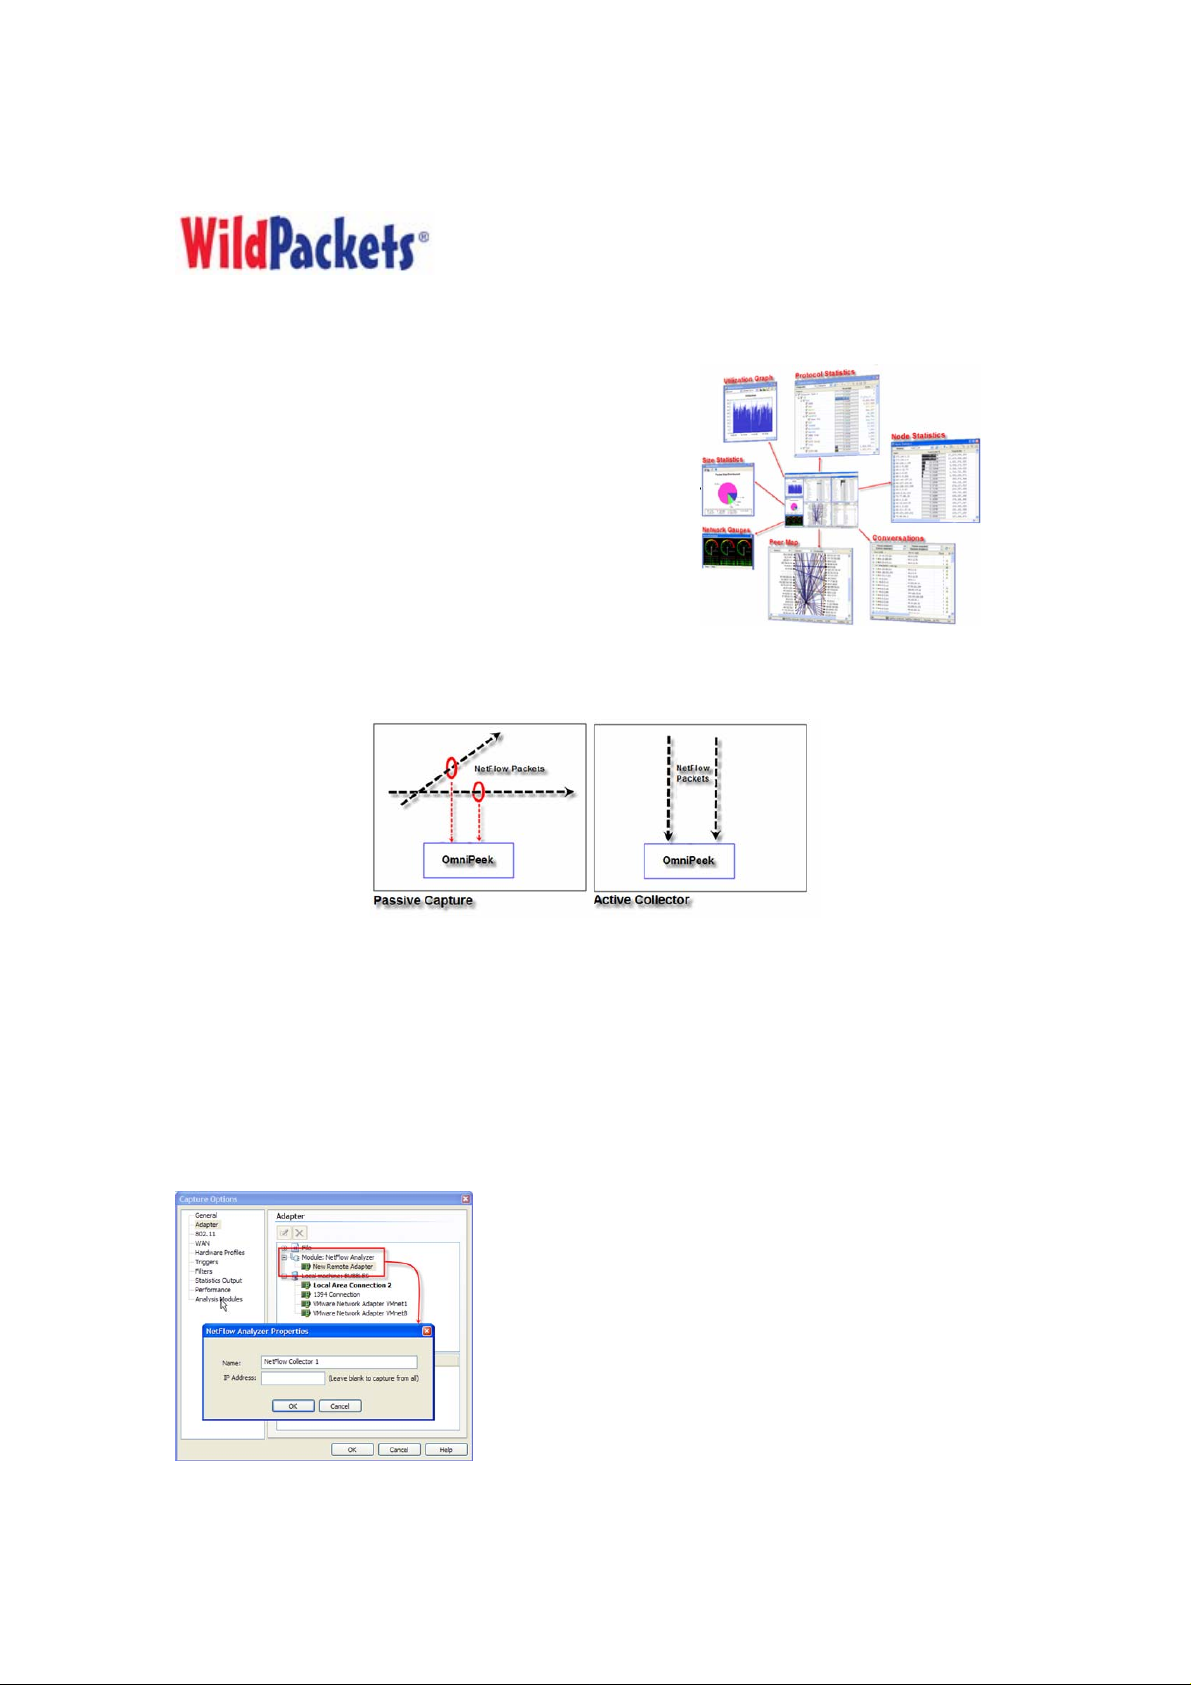
The WildPackets NetFlow Analyzer is a remote adapter plug-in
for the OmniPeek Console that captures and analyzes NetFlow
traffic in two ways. Like other NetFlow clients, it can listen and
collect NetFlow data that is being sent directly to it. But because
OmniPeek is a packet analyzer, the NetFlow Analyzer can also passively capture NetFlow packets being
sent to other clients and display the NetFlow statistics for these packets as well. In both cases, the NetFlow
statistics can be displayed in the monitor windows as well as individual capture windows.
Installation
To install and configure the NetFlow Analyzer Adapter, first download it from MyPeek, and install it onto
a computer that already has OmniPeek Enterprise installed on it. Yes, the NetFlow Analyzer only works
with OmniPeek Enterprise, so if you were thinking about an upgrade from Basic or Pro, now is definitely
the time.
Configuration as a collector
To configure the NetFlow Analyzer as a collector, run OmniPeek and select the Monitor Adapter. The
Monitor can be enabled by selecting Monitor from the top level menu, and then selecting Monitor Options.
In the Monitor Options Dialog, go to the Adapter tab, open the NetFlow Analyzer group, and double-click
on New Remote Adapter. When the NetFlow Properties Dialog appears, enter the unique name of the new
adapter and the IP address of the router the NetFlow data will be
coming from, as shown below:
To collect and aggregate NetFlow data from more than one router,
leave the IP Address blank.
Once the new NetFlow Analyzer entry has been created, select it
and hit OK. That's it, the NetFlow Analyzer will now be listening
on port 9996 for incoming NetFlow packets. Ah, but what if your
router is sending NetFlow data to another port? There are two
ways to address this. One is to configure the router to send the
NetFlow data to port 9996. The other way is to change the port that
Page 2
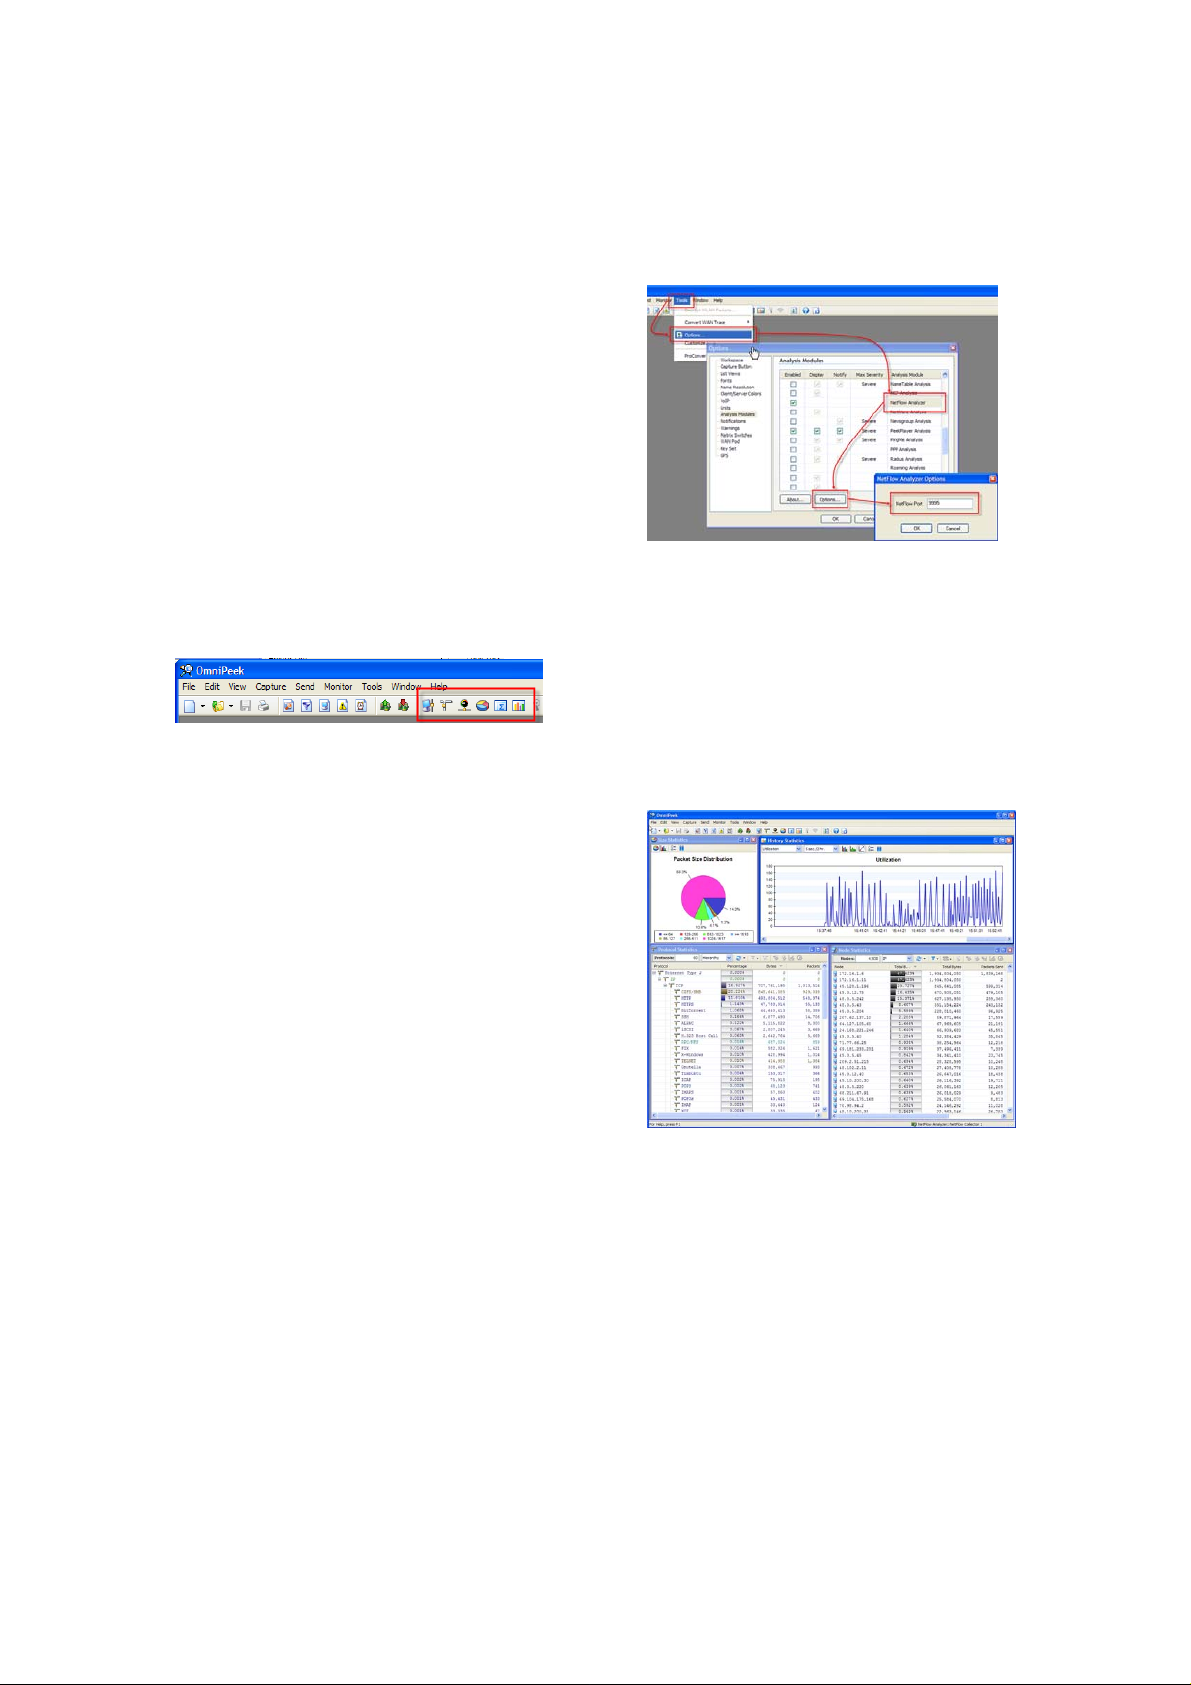
the NetFlow Analyzer is listening on. Changing the NetFlow Analyzer listen port is done by going to Tools
-> Options -> Analysis Modules -> NetFlow Analyzer, hitting the Options button, and then changing the
port as shown in the screenshot.
Router Configuration
It is important to note that in order to receive NetFlow
data, a router must be configured to send it to the
computer that the NetFlow Analyzer is running on.
Configuring a router is outside the scope of these
instructions, but I know it can be done!
Note: Keep in mind that if the router is sending NetFlow
data, and the NetFlow analyzer is not collecting it, the
computer being sent the data will respond with ICMP
Destination Unreachable packets.
Using the NetFlow Analyzer
Ok, now the fun begins. To use the NetFlow Analyzer, go to the top level tool bar and select the icons
shown in the following image:
Oh what a messy desktop you have. To clean this up, and make it look more like a dashboard, go to the top
level Windows menu and select Tile. Now adjust the windows, you should see something like this:
And that's it for the monitor, you are now all knowing and
all powerful. But guess what, that's just the beginning.
Multiple NetFlow Capture Windows
With the global monitor you can collect NetFlow from
one or more Cisco routers on different networks and
aggregate the statistics into a single view. But let's say
that you would like to monitor those networks separately.
This can be achieved by creating separate NetFlow
Adapter entries for each Cisco router, and creating a
separate Capture Window for each.
As shown in the image, the key to separating different
NetFlow feeds into separate captures is specifying the IP
address of the Cisco Router in each NetFlow Adapter
entry. Of course, you can also use a non ip specific NetFlow Adapter entry for a real-time capture window
as well and aggregate the feeds into a single capture window. The advantages of monitoring NetFlow with
a capture window instead of the global monitor is that the Dashboard, the Expert, and the PeerMap are all
capture window features, and not available in the global monitor. Below is a screen shot of a capture
window with these features.
Page 3

Capturing Other NetFlow Packets
As mentioned earlier, the NetFlow Analyzer can also capture NetFlow packets that are being sent to other
devices, analyze the packets and display the NetFlow statistics. To capture and analyze NetFlow packets,
create and enabled an Advanced Filter on the NetFlow Capture Analysis Module. This is done by creating a
new filter, setting it from "Simple" to "Advanced". Next, select an Advanced Analysis Module node, and
pick the NetFlow Analyzer from the list. When the NetFlow Filter is being used, packets captured by the
adapter are not displyaed. Instead, packets representing the statistics from the NetFlow packets are
displayed. This can be a little confusing at first since the Packets Received value at the top of the Capture
Window will show the number of packets captured, while the Packets Filtered value will show the number
of packets from the NetFlow statistics. Without any other filters enabled, the NetFlow Analyzer will
capture and analyze all of the NetFlow packets on the port specified by the NetFlow port option. To target
specific NetFlow packets simply add other filters.
Interface Statistics
Most routers have multiple interfaces, and NetFlow can report on any and/or all of them. The OmniPeek
NetFlow Analyzer displays the interface for each packet in the packet list, and the interface statistics in the
Summary Statistics. In turn, the Interface Statistics can be triggered on and graphed. Below are some
screenshots of each:
NetFlow Versions
This version of the NetFlow Analyzer supports NetFlow versions 5, 9, and templates 256 and 257. If you
are using other versions of NetFlow, and would like us to add support, please send us a trace file of the
NetFlow packets.
Beta Notice
This version of the NetFlow Analyzer is a beta. We are excited about this innovative new tool and look
forward to your feedback.
Limitations
Ah, but yes, there are limitations. The magic used by the NetFlow Analyzer to display NetFlow statistics in
OmniPeek, is to collect the NetFlow data and create fake packets that are inserted into and processed by
OmniPeek. For the most part, this works great. Features like Nodes, Protocols, Conversations, and Peer
Map, and many of the Summary Statistics are accurate and useful. However, if you are so inclined to look
at the packets, you will see that they are a facsimile of the real thing. They are real enough to generate
useful statistics, but they are not meant to be analyzed. Because the packets are also generated based on
the NetFlow data, the exact timestamp of the real packets is not known, and is generated using an algorithm
to separate the timestamps of the packets evenly over the interval represented by each NetFlow record.
Page 4

Also, this technique creates packets on the fly from NetFlow statistics that can represent very large
numbers of packets. Because of this, best practices must be used in order for the NetFlow Analyzer to
scale. At lower volumes the Expert can be used to display conversations. However, at higher volumes the
Expert diagnoses should be disabled, and at even higher volumes the Expert itself should be disabled, and
so and so forth. Obviously, the faster your computer, the more volume it will be able to process.
System Requirements
Hardware: The faster the better, with lots of memory. OS: Windows XP or Vista
 Loading...