

Page 1

Cisco ICM Software
Supervisor Guide
ICM Software Version 4.5
Corporate Headquarters
Cisco Systems, Inc.
170 West Tasman Drive
San Jose, CA 95134-1706
USA
http://www.cisco.com
Tel: 408 526-4000
800 553-NETS (64387)
Fax: 408 526-4100
Customer Order Number : DOC-7811588 =
Text Part Number: 78-11588-01
Page 2

THE SPECIFICATIONS AND INFORMATION REGARDING THE PRODUCTS IN THIS MANUAL ARE SUBJECT TO CHANGE WITHOUT
NOTICE. ALL STATEMENTS, INFORMATION, AND RECOMMENDATIONS IN THIS MANUAL ARE BELIEVED TO BE ACCURATE BUT
ARE PRESENTED WITHOUT WARRANTY OF ANY KIND, EXPRESS OR IMPLIED. USERS MUST TAKE FULL RESPONSIBILITY FOR
THEIR APPLICATION OF ANY PRODUCTS.
THE SOFTWARE LICENSE AND LIMITED WARRANTY FOR THE ACCOMPANYING PRODUCT ARE SET FORTH IN THE INFORMATION
PACKET THAT SHIPPED WITH THE PRODUCT AND ARE INCORPORATED HEREIN BY THIS REFERENCE. IF YOU ARE UNABLE TO
LOCATE THE SOFTWARE LICENSE OR LIMITED WARRANTY, CONTACT YOUR CISCO REPRESENTATIVE FOR A COPY.
The following information is for FCC compliance of Class A devices: This equipment has been tested and found to comply with the limits for a Class A
digital device, pursuant to part 15 of the FCC rules. These limits are designed to provide reasonable protection against harmful interference when the
equipment is operated in a commercial environment. This equipment generates, uses, and can radiate radio-frequency energy and, if not installed and
used in accordance with the instruction manual, may cause harmful interference to radio communications. Operation of this equipment in a residential
area is likely to cause harmful interference, in which case users will be required to correct the interference at their own expense.
The following information is for FCC compliance of Class B devices: The equipment described in this manual generates and may radiate radio-frequency
energy. If it is not installed in accordance with Cisco’s installation instructions, it may cause interference with radio and television reception. This
equipment has been tested and found to comply with the limits for a Class B digital device in accordance with the specifications in part 15 of the FCC
rules. These specifications are designed to provide reasonable protection against such interference in a residential installation. However, there is no
guarantee that interference will not occur in a particular installation.
Modifying the equipment without Cisco’s written authorization may result in the equipment no longer complying with FCC requirements for Class A
or Class B digital devices. In that event, your right to use the equipment may be limited by FCC regulations, and you may be required to correct any
interference to radio or television communications at your own expense.
You can determine whether your equipment is causing interference by turning it off. If the interference stops, it was probably caused by the Cisco
equipment or one of its peripheral devices. If the equipment causes interference to radio or television reception, try to correct the interference by using
one or more of the following measures:
• Turn the television or radio antenna until the interference stops.
• Move the equipment to one side or the other of the television or radio.
• Move the equipment farther away from the television or radio.
• Plug the equipment into an outlet that is on a different circuit from the television or radio. (That is, make certain the equipment and the television or
radio are on circuits controlled by different circuit breakers or fuses.)
Modifications to this product not authorized by Cisco Systems, Inc. could void the FCC approval and negate your authority to operate the product.
The Cisco implementation of TCP header compression is an adaptation of a program developed by the University of California, Berkeley (UCB) as part
of UCB’s public domain version of the UNIX operating system. All rights reserved. Copyright © 1981, Regents of the University of California.
NOTWITHSTANDING ANY OTHER WARRANTY HEREIN, ALL DOCUMENT FILES AND SOFTWARE OF THESE SUPPLIERS ARE
PROVIDED “AS IS” WITH ALL FAULTS. CISCO AND THE ABOVE-NAMED SUPPLIERS DISCLAIM ALL WARRANTIES, EXPRESSED
OR IMPLIED, INCLUDING, WITHOUT LIMITATION, THOSE OF MERCHANTABILITY, FITNESS FOR A PARTICULAR PURPOSE AND
NONINFRINGEMENT OR ARISING FROM A COURSE OF DEALING, USAGE, OR TRADE PRACTICE.
IN NO EVENT SHALL CISCO OR ITS SUPPLIERS BE LIABLE FOR ANY INDIRECT, SPECIAL, CONSEQUENTIAL, OR INCIDENTAL
DAMAGES, INCLUDING, WITHOUT LIMITATION, LOST PROFITS OR LOSS OR DAMAGE TO DATA ARISING OUT OF THE USE OR
INABILITY TO USE THIS MANUAL, EVEN IF CISCO OR ITS SUPPLIERS HAVE BEEN ADVISED OF THE POSSIBILITY OF SUCH
DAMAGES.
Access Registrar, AccessPath, Are You Ready, ATM Director, Browse with Me, CCDA, CCDE, CCDP, CCIE, CCNA, CCNP, CCSI, CD-PAC, CiscoLink, the
Cisco NetWorks logo, the Cisco Powered Network logo, Cisco Systems Networking Academy, Fast Step, FireRunner, Follow Me Browsing, FormShare,
GigaStack, IGX, Intelligence in the Optical Core, Internet Quotient, IP/VC, iQ Breakthrough, iQ Expertise, iQ FastTrack, iQuick Study, iQ Readiness
Scorecard, The iQ Logo, Kernel Proxy, MGX, Natural Network Viewer, Network Registrar, the Networkers logo, Packet, PIX, Point and Click
Internetworking, Policy Builder, RateMUX, ReyMaster, ReyView, ScriptShare, Secure Script, Shop with Me, SlideCast, SMARTnet, SVX, TrafficDirector,
TransPath, VlanDirector, Voice LAN, Wavelength Router, Workgroup Director, and Workgroup Stack are trademarks of Cisco Systems, Inc.; Changing
the Way We Work, Live, Play, and Learn, Empowering the Internet Generation, are service marks of Cisco Systems, Inc.; and Aironet, ASIST, BPX,
Catalyst, Cisco, the Cisco Certified Internetwork Expert Logo, Cisco IOS, the Cisco IOS logo, Cisco Press, Cisco Systems, Cisco Systems Capital, the
Cisco Systems logo, Collision Free, Enterprise/Solver, EtherChannel, EtherSwitch, FastHub, FastLink, FastPAD, IOS, IP/TV, IPX, LightStream,
LightSwitch, MICA, NetRanger, Post-Routing, Pre-Routing, Registrar, StrataView Plus, Stratm, SwitchProbe, TeleRouter, are registered trademarks of
Cisco Systems, Inc. or its affiliates in the U.S. and certain other countries.
All other brands, names, or trademarks mentioned in this document/website are the property of their respective owners. The use of the word partner does
not imply a partnership relationship between Cisco and any of its resellers. (0008R)
Cisco ICM Software Supervisor Guide
Copyright © 1995 - 2001 Cisco Systems, Inc.
All rights reserved.
Page 3

Contents
Preface........................................................................................ xiii
Purpose...................................................................................................xiii
Audience..................................................................................................xiii
Organization............................................................................................xiii
Typographic Conventions....................................................................... xiv
Other Publications...................................................................................xv
1. Overview................................................................................. 17
iii
Contents
1.1. What is the Intelligent Call
1.1.1. Where Does the ICR Fit In? .......................................................19
1.1.2. Call Routing................................................................................20
1.1.3. Pre-
1.1.4. Post-
1.1.5. Enterprise CTI ............................................................................21
1.1.6. Call Routing Scripts....................................................................22
1.1.7. Reporting and Monitoring...........................................................22
1.1.8. Network ICR...............................................................................23
1.2. The Call Center Enterprise...................................................................23
1.2.1. Services and Skill Groups..........................................................24
1.2.2. Agents and Agent Teams...........................................................27
1.2.3. Trunk and Network Trunk Groups..............................................27
1.2.4. Service Arrays............................................................................28
1.2.5. Routes........................................................................................29
1.2.6. Other Parts of the Enterprise .....................................................30
1.3. Peripheral-Specific Terminology.........................................................32
Routing
Routing
................................................................................21
...............................................................................21
Router
?....................................................18
2. The Admin Workstation ........................................................ 37
2.1. The GEOTEL Admin Workstation Group..............................................38
2.2. Distributor and Client Admin Workstations.......................................39
2.2.1. Real-Time and Historical Data...................................................40
2.2.2. Historical Database Server (HDS) .............................................40
Page 4

iv Contents
2.2.3. Monitor-Only AW ....................................................................... 40
2.2.4. Admin Workstation Users.......................................................... 41
2.2.5. Open Database Architecture ..................................................... 41
2.3. Monitor ICR Reporting......................................................................... 41
2.3.1. Enterprise and Peripheral Reporting ......................................... 42
2.3.2. Agent Reporting......................................................................... 43
2.4. Monitor ICR Reporting Scenario......................................................... 44
2.4.1. Viewing Multiple Reports........................................................... 44
2.4.2. Analyzing the Data.....................................................................45
2.4.3. Correcting the Situation .............................................................46
2.4.4. Monitor ICR Reporting Terms.................................................... 46
2.5. Web View...............................................................................................47
3. Creating a Report...................................................................49
3.1. The Report Example.............................................................................50
3.2. Starting Monitor ICR ............................................................................ 52
3.2.1. Controller Time ..........................................................................52
3.3. Setting Up the Template Launcher..................................................... 53
3.4. Launching the Report .......................................................................... 56
3.4.1. What the Report Shows............................................................. 58
3.4.2. The Status Bar........................................................................... 59
3.5. Retrieving the Latest Historical Data ................................................. 59
3.6. Printing the Report............................................................................... 59
3.7. Saving the Report.................................................................................59
3.8. Opening the Report.............................................................................. 61
3.9. Setting Thresholds............................................................................... 61
3.10. Adding Drill-Downs............................................................................ 64
3.11. Saving Your Workspace .................................................................... 67
Page 5

Contents v
4. Reporting Basics................................................................... 69
4.1. The GEOTEL Admin Workstation Group..............................................70
4.2. Starting Monitor ICR.............................................................................71
4.2.1. Toolbar Options..........................................................................72
4.2.2. On-Line Help ..............................................................................73
4.2.3. Controller Time...........................................................................74
4.2.4. Command Prompt Startup Options............................................75
4.3. Working with the Template Launcher.................................................75
4.3.1. Category and Scope...................................................................77
4.3.2. Date and Time............................................................................80
4.3.3. Items...........................................................................................83
4.3.4. Templates ...................................................................................84
4.3.5. Launching Templates.................................................................85
4.4. Working with Reports...........................................................................86
4.4.1. Saving Report Definitions...........................................................86
4.4.2. Single- and Multiple-Component Reports..................................88
4.4.3. Shuffle Mode ..............................................................................90
4.4.4. Working with Several Reports....................................................92
4.4.5. Status Bar...................................................................................93
4.4.6. Retrieving Historical Data...........................................................93
4.4.7. Pausing the Screen Refresh......................................................93
Contents
4.5. Reconnecting to the Central Database...............................................94
4.6. Printer Setup .........................................................................................94
4.7. Printing Reports ....................................................................................96
4.7.1. Printing Multiple-Component Reports........................................96
4.8. Opening Saved Reports.......................................................................96
4.9. File Association ....................................................................................97
4.10. Saving Your Workspace.....................................................................98
4.11. Modifying Report Definitions.............................................................99
4.12. Deleting Report Definitions .............................................................100
4.13. Exporting Report Data......................................................................101
4.14. Setting Workstation Preferences....................................................102
4.14.1. Event Feed Warning.................................................................105
4.15. User Information ...............................................................................105
Page 6

vi Contents
5. Setting Thresholds and Drill-Downs ..................................107
5.1. Setting Thresholds in Reports.......................................................... 108
5.1.1. Setting Thresholds in Multiple-Component Reports................109
5.1.2. Saving Threshold Settings....................................................... 110
5.2. Using Drill-Downs in Reports............................................................ 110
5.2.1. Drill-Down Hierarchy................................................................ 110
5.2.2. Adding Drill-Downs ..................................................................111
5.2.3. Saving Drill-Down Assignments............................................... 113
5.2.4. Invoking Drill-Downs ................................................................ 113
5.2.5. Saving Drill-Downs as Separate Reports ................................ 115
6. Scheduling Reports.............................................................117
6.1. ICR Job Scheduler ............................................................................. 118
6.1.1. Job Scheduler Printing Requirements..................................... 118
6.1.2. Scheduling Reports to Print..................................................... 119
6.1.3. Changing Scheduled Jobs....................................................... 122
6.1.4. Deleting Scheduled Jobs......................................................... 123
6.1.5. Inspecting the Job Scheduler Log ........................................... 123
6.1.6. Closing the ICR Job Scheduler................................................124
7. Available Data ......................................................................125
7.1. Skill Group Data ................................................................................. 126
7.1.1. Skill Group Agent Data............................................................ 126
7.1.2. Percent Utilization.................................................................... 127
7.1.3. Call Handling............................................................................ 127
7.2. Agent Data...........................................................................................128
7.2.1. Agent Tables............................................................................128
7.2.2. Agent Status ............................................................................ 129
7.2.3. Agent Activity........................................................................... 129
7.2.4. Agent Performance.................................................................. 130
7.3. Agent States and Time Allocations.................................................. 132
7.3.1. ICR Agent State Terminology..................................................134
7.3.2. ICR Agent State Mapping To Peripherals ...............................137
7.4. Service Data........................................................................................ 141
7.4.1. Call Counts ..............................................................................141
7.4.2. Service Level ...........................................................................142
7.4.3. Queues and Delays .................................................................144
7.4.4. Agent Time Allocations............................................................ 145
7.5. Enterprise Data................................................................................... 145
7.5.1. Enterprise Calculations............................................................ 146
Page 7

Contents vii
7.6. Trunk Group Data ...............................................................................146
7.7. Network Trunk Group Data................................................................147
7.8. Service Array Data..............................................................................147
7.9. Route Data...........................................................................................148
7.9.1. Service Level............................................................................149
7.10. Peripheral Data..................................................................................149
7.11. Application Gateway Data................................................................150
7.12. Call Type Data ...................................................................................151
7.13. Routing Client Data ..........................................................................151
7.14. Schedule Import Data.......................................................................152
8. Template Reference ............................................................ 153
8.1. Real-Time and Historical Templates.................................................154
agteam01_agent_status_by_position ...................................................155
agteam02_agent_status_by_skillgroup.................................................156
agteam03_logout_status_by_team.......................................................157
agteam04_daily_agent_activity.............................................................158
agteam05_agent_daily_perf..................................................................160
agtper01_agent_status_by_position.....................................................163
agtper02_agent_status_by_skillgroup ..................................................164
agtper03_logout_status_by_peripheral.................................................165
agtper04_daily_agent_activity...............................................................166
agtper05_agent_daily_perf ...................................................................168
agtskg01_agent_status_by_position.....................................................171
agtskg02_agent_status_by_skillgroup..................................................172
agtskg03_logout_status_by_skillgroup.................................................173
agtskg04_daily_agent_activity..............................................................174
agtskg05_agent_daily_perf...................................................................176
apgate11_status_by_half_hour.............................................................179
caltyp01_status_grid .............................................................................180
caltyp02_count_graph...........................................................................181
entskg01_status_#_graph.....................................................................182
entskg02_status_grid ............................................................................183
entskg03_status_%_graph....................................................................185
entskg04_status_grid_to5.....................................................................186
entskg05_utilization_graph....................................................................188
entskg06_halfhour_aht_grid..................................................................189
entskg07_daily_aht_grid.......................................................................191
entskg08_halfhour_perform_grid..........................................................193
Contents
Page 8

viii Contents
entskg09_normalized_agt_state........................................................... 195
entsvc01_queue_delay_status............................................................. 196
entsvc02_calls_status........................................................................... 197
entsvc03_effect_of_aban_on_servicelevel........................................... 198
entsvc04_calls_trend_analysis............................................................. 199
entsvc05_calls_offered_half_pie .......................................................... 200
entsvc06_serv_level_monitor_graph.................................................... 201
entsvc07_now_to5_grid........................................................................ 202
entsvc08_gate_realtime_status_grid.................................................... 204
entsvc09_svc_array_now_to5_grid...................................................... 206
entsvc11_calls_analysis_daywise........................................................ 208
entsvc12_calls_analysis_half_hour...................................................... 209
entsvc13_calls_offered_daywise_graph...............................................211
entsvc14_calls_handled_daywise_graph.............................................212
entsvc15_calls_abandoned_daywise_graph........................................ 213
entsvc16_calls_history_daywise_graph ............................................... 214
entsvc17_calls_offered_half_hour........................................................ 215
entsvc18_gate_half_hourly_status_grid............................................... 216
nettrk01_status_grid .............................................................................218
nettrk02_grid_last_half_hour................................................................ 219
nettrk12_grid_half_hour........................................................................ 220
peragt01_agent_status_by_position..................................................... 221
peragt02_agent_status_by_skillgroup.................................................. 222
peragt03_logout_status_by_agent ....................................................... 223
peragt04_daily_agent_activity.............................................................. 224
peragt05_agent_daily_perf................................................................... 226
peragt06_daily_agent_detail................................................................. 229
periph01_peripheral_status_report.......................................................230
periph02_galaxy_software_status........................................................ 231
periph03_galaxy_hardware_status....................................................... 232
perskg01_status_#_graph.................................................................... 233
perskg02_status_grid............................................................................ 234
perskg03_status_%_graph ................................................................... 236
perskg04_status_grid_to5 .................................................................... 237
perskg05_utilization_graph................................................................... 239
perskg06_halfhour_aht_grid................................................................. 240
perskg07_daily_aht_grid....................................................................... 242
perskg08_halfhour_perform_grid.......................................................... 244
perskg09_normalized_agt_state........................................................... 246
perskg10_forecast_agents_status_grid................................................ 247
persvc01_queue_delay_status............................................................. 248
persvc02_calls_status........................................................................... 249
persvc03_effect_of_aban_on_servicelevel .......................................... 250
persvc04_calls_trend_analysis............................................................. 251
persvc05_calls_offered_half_pie.......................................................... 252
persvc06_serv_level_monitor_graph.................................................... 253
persvc07_now_to5_grid........................................................................ 254
persvc08_gate_realtime_status_grid....................................................256
persvc09_forecast_aht_offer_grid........................................................ 258
persvc11_calls_analysis_daywise........................................................ 259
Page 9

Contents ix
persvc12_calls_analysis_half_hour ......................................................261
persvc13_calls_offered_daywise_graph...............................................263
persvc14_calls_handled_daywise_graph .............................................264
persvc15_calls_abandoned_daywise_graph........................................265
persvc16_calls_history_daywise_graph................................................266
persvc17_calls_offered_half_hour........................................................267
persvc18_gate_half_hourly_status_grid ...............................................268
routes01_queue_delay_status..............................................................270
routes02_calls_status............................................................................271
routes03_effect_of_aban_on_servicelevel............................................272
routes04_calls_trend_analysis..............................................................273
routes05_calls_offered_half_pie...........................................................274
routes06_serv_level_monitor_graph.....................................................275
routes07_now_to5_grid.........................................................................276
routes11_calls_analysis_daywise.........................................................278
routes12_calls_analysis_half_hour.......................................................280
rtecli11_status_by_five_minutes...........................................................282
schimp01_name_time_numbers...........................................................283
trkgrp01_alltrunkbusy_graph.................................................................284
trkgrp02_idle_inservice_status..............................................................285
trkgrp03_trunkgroup_status_grid..........................................................286
trkgrp11_trunkgroup_performance_grid................................................287
Contents
Glossary..................................................................................... 289
Index .......................................................................................... 319
Page 10

x Contents
Figures
Figure 1: ICR Call Routing.................................................................................. 18
Figure 2: Intelligent Call
Figure 3: ICR Call Flow Diagram........................................................................ 20
Figure 4: Service and Skill Group Hierarchy.......................................................24
Figure 5: Enterprise and Peripheral Ser vices..................................................... 25
Figure 6: Enterprise and Peripheral Sk ill Gro ups ...............................................26
Figure 7: Agent Hierarchy................................................................................... 27
Figure 8: Network and Peripheral Trunk Groups................................................ 28
Figure 9: Service Arrays ..................................................................................... 29
Figure 10: Routes ............................................................................................... 30
Figure 11: Enterprise and Peripheral Reporting.................................................42
Figure 12: Sample Report...................................................................................45
Figure 13: Web View Report ............................................................................... 47
Figure 14: Enterprise Service Calculation Examples....................................... 146
Router
Overview........................................................... 19
Page 11

Contents xi
Tables
Table 1: Aspect, Lucent, and Nortel—ICR Terminology Mapping......................33
Table 2:
Table 3: Alcatel, NEC, and Ericsson—ICR Terminology Mapping .....................34
Table 4: Features Not Supported for Specific Peripherals..................................35
Table 5: Agent Report Types..............................................................................43
Table 6: Monitor ICR Toolbar..............................................................................72
Table 7: Default ICR Subdirectories....................................................................87
Table 8: File Format Options.............................................................................102
Table 9: Drill-Down Hierarchy...........................................................................111
Table 10: Agent States and Time Allocations ...................................................135
Table 11: Agent State Terminology—Aspect, Lucent, and Nortel ....................137
Table 12: Agent State Terminology—Rockwell and Siemens ..........................139
Table 13: Agent State Terminology—Alcatel, NEC, and Ericsson....................140
Rockwell and Siemens—ICR Terminology Mapping ............................34
Contents
Page 12

xii Contents
Page 13

xiii
Preface
Purpose
This manual describes how to monitor enterprise call center activity with
the real-time and historical reporting features of the G
CallRouter (ICR).
Audience
This document is intended for the Intelligent CallRouter supervisor. The
supervisor has an understanding of call center management and the
specific types of data that are used to report on call center activity and
resources.
This document assumes that you have some familiarity with Microsoft
Windows™ applications and common tasks such as moving and resizing
windows and using a mouse.
Organization
Chapter 1, “Overview”
Chapter 2, “The Admin Workstation”
Chapter 3, “Creating a Report”
Chapter 4, “Reporting Basics”
Chapter 5, “Setting Thresholds and Drill-Downs”
Preface
EOTEL Intelligent
®
Introduces the Intelligent CallRouter and the ICR call center
enterprise.
Introduces the Admin Workstation (AW) with a special emphasis on
call center reporting and the Monitor ICR reporting application.
Guides you through the process of creating a simple report using the
predefined report templates of Monitor ICR.
Describes how to use the basic features of Monitor ICR.
Describes how to set threshold values and drill-down templates in
Monitor ICR reports.
Page 14

xiv Preface
Chapter 6, “ Scheduling Reports”
Describes how to schedule reports to print automatically by using
the ICR Job Scheduler tool.
Chapter 7, “Available Data”
Describes the most commonly used data available in the ICR
databases.
Chapter 8, “Template Reference”
Documents the predefined report templates that come with Monitor
ICR.
Typographic Conventions
This manual uses the following conventions:
Boldface type is used for emphasis; for example:
Real-time information is not stored in the central databas e.
Italic type indicates one of the following:
A newly introduced term; for example:
A skill group is a collection of agents who share similar skills.
A generic syntax item that you must replace with a specific value;
for example:
IF (
condition, true-value, false-value
)
A title of a publication; for example:
For more information, see the Intelligent CallRouter Database
Schema Handbook.
Sans serif type with small caps represents keys on your keyboard; for
example:
Press the
An arrow (→) indicates an item from a pull-down menu. For example,
the Save command from the File menu is referenced as File→Save.
Text you must type is shown in a sans serif type. For example:
Date and Time
SHIFT key to select a range of items.
Page 15

Other Publications
Intelligent CallRouter Custom Screen Builder Tutorial
Intelligent CallRouter Database Schema Handbook
Intelligent CallRouter Installation Guide
Preface xv
Intelligent CallRouter Planning Guide
Intelligent CallRouter Product Description
Intelligent CallRouter Quick Start Guide
Intelligent CallRouter Supervisor Guide
Intelligent CallRouter System Manager Guide
GEOTEL
For information about the G
following documents:
•
Web View Administrator Guide
EOTEL•Network ICR product, see the
Network ICR Product Description
Network ICR User Guide
Preface
Page 16

xvi Preface
Page 17

1. Overview
The GEOTEL Intelligent CallRout er (ICR) improves the level of
customer service offered by geographically distributed call centers. The
Intelligent CallRouter’s main function is to route toll-free calls to the
most appropriate agent or answering resource available. The system also
provides a set of computer telephony integration (CTI), reporting,
monitoring, and scheduling tools that help you to manage a distributed
call center enterprise.
This chapter provides an overview of the Intelligent CallRouter and
describes its role in a multiple call center environment.
17
1. Overview
Page 18
18 Overview
1.1. What is the Intelligent Call
The Intelligent CallRouter (ICR) is a software-based call processing
system that provides call-by-call routing to geographically distributed
call centers. The ICR links agents from multiple call centers to create a
virtual call center.
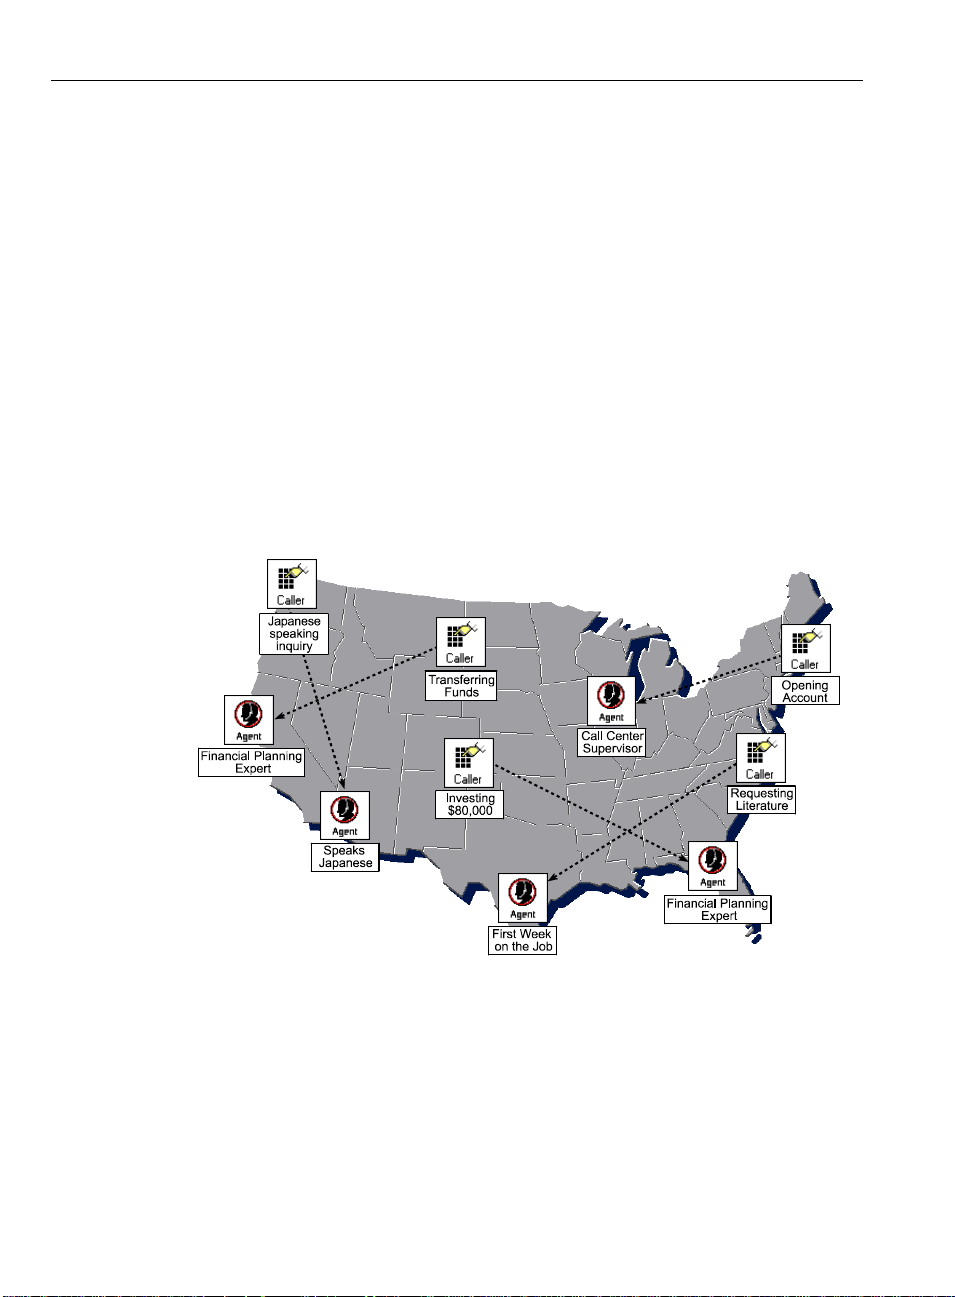
In the virtual call center model, agents from distributed call centers can
be grouped logically according to their areas of expertise. For example, a
financial company might have call centers in several cities across the
country. Each call center has groups of agents organized into skill
groups.
The agents in these skill groups are trained to handle certain types of
calls. Basic calls can be routed to skill groups that are trained to provide
general services. Callers who have more complicated transactions can be
routed to more specialized skill groups.
Figure 1 shows how calls are routed to the best available agents in the
call center enterprise.
Router
?
Figure 1: ICR Call Routing
What happens if several callers require the services of a specialized
agent? For example, you might have several callers who need the
assistance of a financial planner. This type of specialized agent may not
always be immediately available at one call center. However, since the
Intelligent CallRouter is aware of the status of the entire enterprise, it
can quickly find financial planners at other call centers and route the
calls accordingly.
Page 19

What is the Intelligent CallRouter? 19
1.1.1. Where Does the ICR Fit In?
The Intelligent CallRouter works directly with call centers and the
interexchange carrie r (IXC ) tha t supp lies the to ll-free service. The IXC
is a long-distance telephone company that offers toll-free call routing
services. Figure 2 shows how the Intelligent CallRout er operates
between the IXC network and distributed call centers.
Intelligent
Router
SCP
Service Control Point
Calls
Toll-Free Callers
Call
Call Associated
Signaling Network
Call Associated
Switched Network
Data
Data
Public
Agent, Queue,
CTI data
Calls
ACD, PBX,
VRU
Agent
Groups
Call Centers
1. Overview
Figure 2: Intelligent Call
Router
Overview
The IXC signaling network controls how calls are routed in the public
switched network. In addition to connecting to the signaling network,
the ICR has data connections to each call center peripheral. A peripheral
may be an Automatic Call Distributor (ACD), Private Branch Exchange
(PBX), or Voice Response Unit (VRU). The data connections to each
peripheral provide the ICR with real-time data on agent group and call
activity.
The ICR has two main functions in the call center enterprise: routing
calls and collecting management information. The management
information is used to make informed decisions on where to route calls.
It is also used to monitor and report on call center performance. In a
G
EOTEL•Enterprise CTI environment, management data can also used
in a variety of integrated desktop and server CTI applications.
Page 20
20 Overview
1.1.2. Call Routing
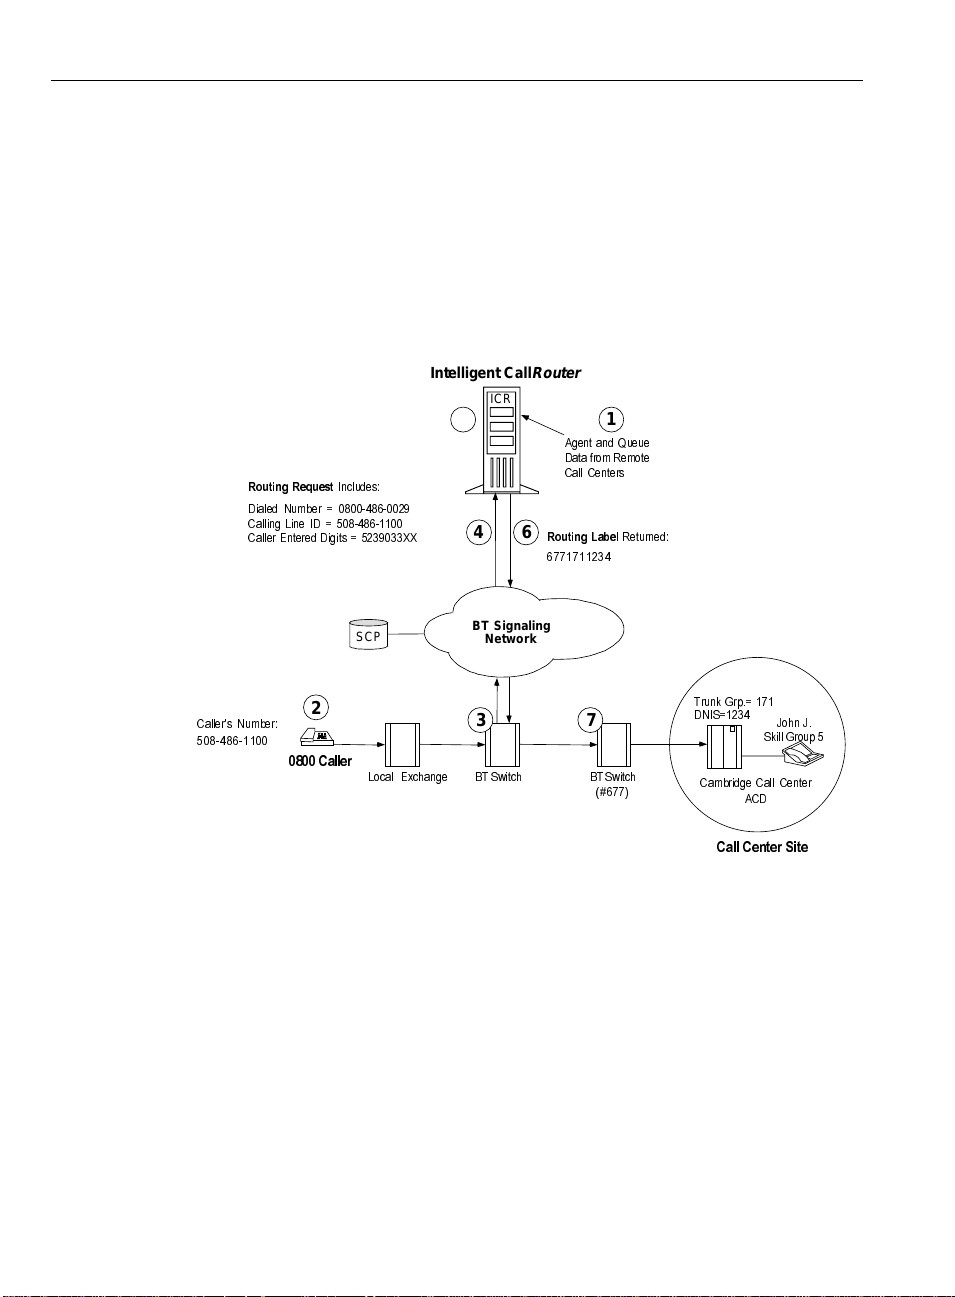
A typical ICR-routed call goes through the following stages.
Figure 3 illustrates these stages in detail.
The Intelligent CallRouter is constantly receiving data from call
ô A caller dials the toll-free number.
í The Local Exchange Carrier (LEC) passes the call to the IXC.
centers on agent availability, queue status, and call handling
performance.
5RXWLQJ5HTXHVW
'LDOHG 1XPEHU
&DOOLQJ/LQH,'
&DOOHU(QWHUHG 'LJLWV ;;
&DOOHUV 1XPEHU
&DOOHU
Intellig ent Call
5
,QFOXGHV
SCP
2
/RFDO ([FKDQJH %76ZLWFK
Router
ICR
$JHQWDQG 4XHXH
'DWDIURP5HPRWH
&DOO &HQWHUV
4 6
BT Signaling
Network
5RXWLQJ/DEHO
3 7
1
5HWXUQHG
%76ZLWFK
7UXQN*US
'1,6
&DPEULGJH&DOO&HQWHU
&DOO&HQWHU6LWH
6NLOO*URXS
$&'
-RKQ-
Figure 3: ICR Call Flow Diagram
÷ The IXC signaling network sends call information from its computer
(the Service Control Point (SCP)) to the ICR in the form of a routing
request.
û The ICR, using the information from the IXC routing request and
the data it has been receiving from call centers, determines the best
agent group based on skills, current agent availability, and queue
status.
ø The ICR returns a routing label (destination) for the call to the IXC.
ù The IXC then connects the call to the ACD where an appropriate
agent is located.
Page 21

What is the Intelligent CallRouter? 21
1.1.3. Pre-
Routing
The Intelligent CallRouter uses Pre-Routing® to ensure that incoming
calls reach the appropriate agent resource the first time. In Pre-Routing,
the ICR executes routing decisions before the call terminates at a call
center.
As shown in Figure 3, every time a caller dials the toll-free number, the
IXC passes a routing request through the signaling network to the
Intelligent CallRout er. Th e interexchange c arrier act s as a routing
client, while the Intelligent CallRouter acts as the routing server.
The IXC routing request includes information about the call such as
Number dialed.
Calling Line ID (CLID) or Automatic Number Identification (ANI).
Caller Entered Digits (CED).
The final routing decision, or the call’s destination, is contained in a
routing label which the ICR returns to the interexchange carrier. The
carrier is then responsible for connecting the call and maintaining the
voice path.
1.1.4. Post-
Routing
Optionally, the ICR can perform the same routing functions used in
Pre-Routing for transfers and internal calls (that is, for calls originating
at a call center or another agent location). The ICR uses Post-Routing
to make these “secondary” routing decisions. Post-Routing also lets you
implement intelligent transfer applications in which calls are routed
between agents and VRUs. Post-Routing ensures that subsequent call
transactions are routed in a timely manner to an appropriate resource.
In Post-Routing calls, the ICR uses the same routing scripts and call
processing as it does in Pre-Routing calls. The difference is that the
peripheral (ACD, PBX, or VRU) generates the routing request rather
than the IXC. The Intelligent CallRouter processes the routing request,
returns a destination address (routing label), and then directs the
peripheral to send the call to the best resource available.
1. Overview
®
1.1.5. Enterprise CTI
As an enterprise call routing system, the ICR collects data from different
systems and telecomm unications env ironments throughout the call
center enterprise. Often these systems are implemented on
heterogeneous hardware and software platforms and distributed across
multiple sites. G
transaction data from these dissimilar systems and makes it available to
agent desktop and CTI server applications.
EOTEL•Enterprise CTI gath ers enter pr ise cal l and
Page 22

22 Overview
See also:
For more information on Enterprise CTI, see the Intelligent CallRouter
Product Description.
1.1.6. Call Routing Scripts
To determine the best destination for a call, the ICR processes routing
requests through call routing scripts. A routing script is a graphical,
flowchart-like diagram that specifies how to route a call. A script usually
has several branches that can be followed depending on current
conditions at the call centers.
In order to make a routing decision, the script uses the information
contained in the routing request along with real-time information on the
status of resources at each call center. The system manager typically
defines a number of routing scripts to use in the ICR system.
Scripts can be scheduled as required to route calls among call centers
based on the type of service the caller needs, the time of day the call is
being placed, and where suitably qualified agents are available to handle
the call.
See also:
For more information on the routing scripts, see the Intelligent
CallRouter System Manager Guide.
1.1.7. Reporting and Monitoring
The ICR uses real-time, near real-time, and historical data on agent and
call center status to make its routing decisions. To make the best routing
decision possible, the ICR constantly collects information about agen t
activity at each call center, such as:
Current agent state
Logon duration
Number of agents available
Number of agents talking
The time agents spend in particular call handling states
The ICR also collects information about calls coming into the call
centers, such as
Number of calls in progress
Number of calls handled and finished
How calls were routed
How long callers were on hold
Page 23

The Call Center Enterprise 23
Although this management data is essential to call routing, it is also
important for monitoring and reporting on agent and agent group
performance. The ICR stores the management data in industry-standard
historical and real-time relational databases.
The Intelligent CallRouter provides many ways for you to analyze
trends and gauge service levels using real-time and historical
management data. The main ICR reporting tool, called Monitor ICR,
allows you to generate many types of reports on agent and call activity.
Monitor ICR is described in more detail later in this chapter.
1.1.8. Network ICR
GEOTEL•Network ICR is the carrier-class version of the Intelligent
CallRouter. It allows a network service provider to offer virtual call
center services to its customers. The Network ICR functions much like a
Service Control Point (SCP) by distributing incoming calls to individual
network service customers based on the number dialed, the call’s point
of origin, and caller-entered digits.
The Network ICR product uses a two-tiered architecture in which one
ICR passes route requests to a second ICR. The first ICR, called the
Network ICR or NICR, typically receives routing requests from a carrier
network. The NICR can either return a label itself or pass the route
request to a second ICR, called the Customer ICR or CICR.
Each CICR can processes all calls for one or more customers. The CICR
receives the route request, runs its own routing scripts to determine the
destination for the call, and returns a routing label to the NICR. The
NICR then returns the label to the original carrier network. This
architecture lets a service provider perform simple routing (within the
NICR) for some customers while providing full ICR functionality (in a
CICR) for other customers.
See also:
For more information about Network ICR, see the Network ICR Product
Description.
1. Overview
1.2. The Call Center Enterprise
An Intelligent CallRouter treats a customer’s multiple distributed call
centers as a single enterprise. You can think of the call center enterprise
as an entire company or agency that spans many call centers. The
enterprise typically includes all call centers served by an ICR.
You can create different organizational entities within a call center
enterprise. For example, you might organize distributed groups of agents
into a shared resource pool that spans call centers. You might also create
entities that are tied to specific peripherals. The term peripheral refers to
the individual switch (ACD, PBX, or VRU) that distributes incoming
calls at each call center.
Page 24
24 Overview
From a reporting perspective, you can view agent and call routing
statistics on an enterprise-wide or peripheral-by-peripheral basis.
Enterprise reporting gives you a view of performance across the entire
call center enterprise. Peripheral reporting focuses your reports on
specific areas of the call center enterprise.
To become more familiar with the ICR call center enterprise, it might
help to review the types of organizational entities you can define.
See also:
Table 1, later in this chapter, provides information on how ICR call
center terms map to the terms used by ACD vendors.
1.2.1. Services and Skill Groups
A service is a particular type of call processing that the caller requires.
In most cases, a service can be thought of as a certain type of call. For
example, in a software company’s call center, callers who have
questions about installing software might be directed to the Technical
Support service.
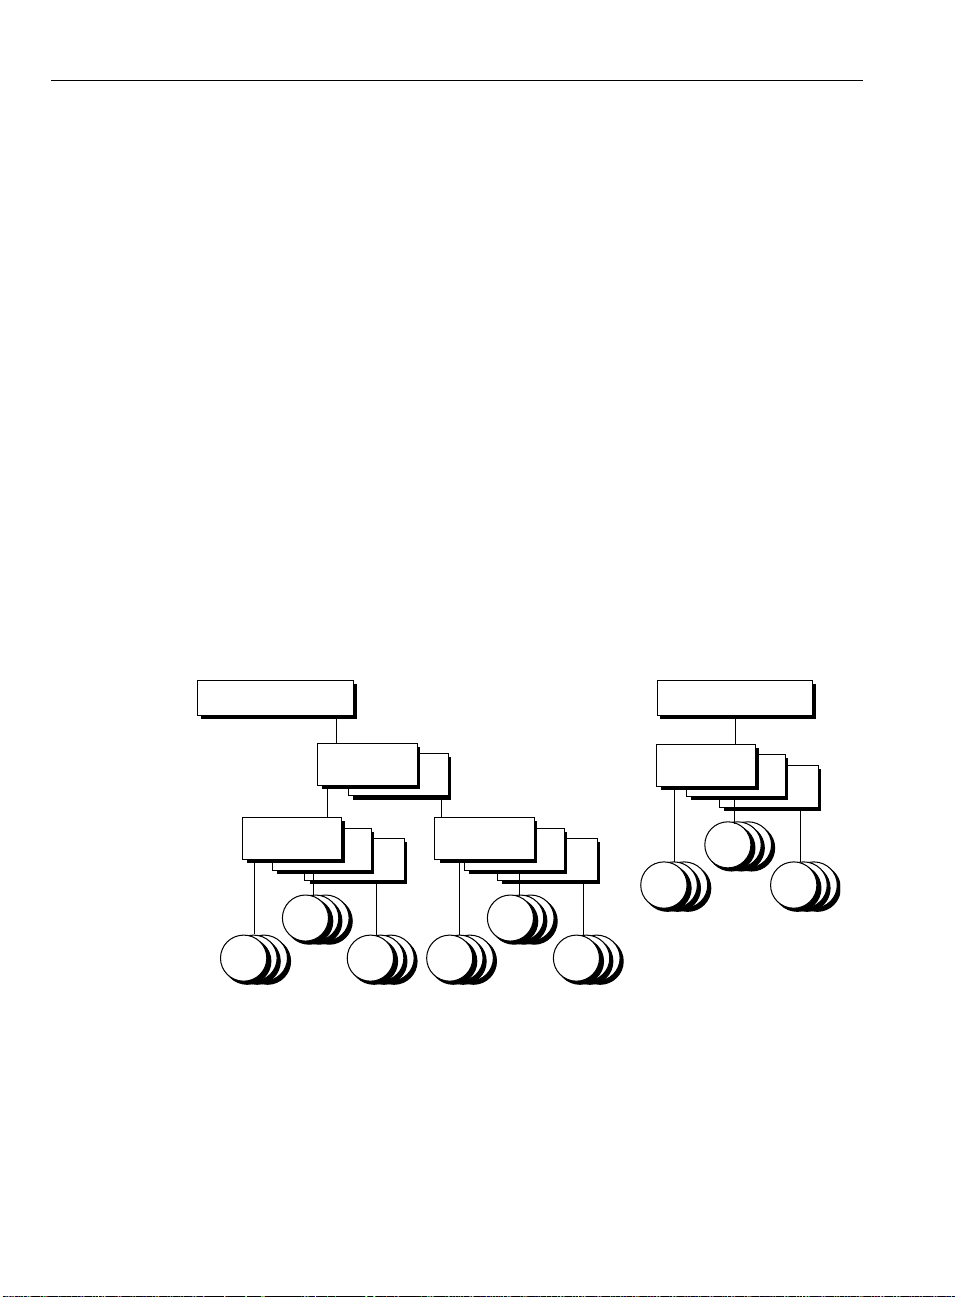
A skill group, on the other hand, is a set of agents who handle similar
types of calls or have a common set of skills. A skill group might
contain agents who are able to handle a particular type of call (for
example, calls from customers who speak Spanish). Figure 4 shows the
hierarchy of services and skill groups within a call center enterprise.
Enterprise Service
Peripheral
Services
Peripheral
Skill Groups
Agents
Agents Agents
Peripheral
Skill Groups
Agents
Agents Agents
Enterprise Skill Group
Peripheral
Skill Groups
Agents
Agents Agents
Figure 4: Service and Skill Group Hierarchy
As shown in Figure 4, you can group services and skill groups to create
enterprise services and enterprise skill groups. These are simply
collections of services and skill groups that span call centers.
A peripheral service is a service that is tied to a specific ACD or PBX.
You might have several Sales peripheral services. Each Sales peripheral
service is tied to, or associated with, a specific peripheral somewhere in
the call center enterprise. The Sales services can be logically grouped
Page 25

The Call Center Enterprise 25
across peripherals to form an enterprise Sales service. Figure 5 shows
the relationship between enterprise and peripheral services.
Enterprise Services
Sales Technical Support
Peripheral Services
Denver Sales
Denver Tech. Support
Denver Info. Services
ACD
ACD
These peripheral services are logically combined to form the
enterprise service, Sales.
Dallas Sales
Dallas Tech. Support
Dallas Info. Services
Information Services
Boston Sales
Boston Tech. Support
Boston Info. Services
ACD
Figure 5: Enterprise and Peripheral Services
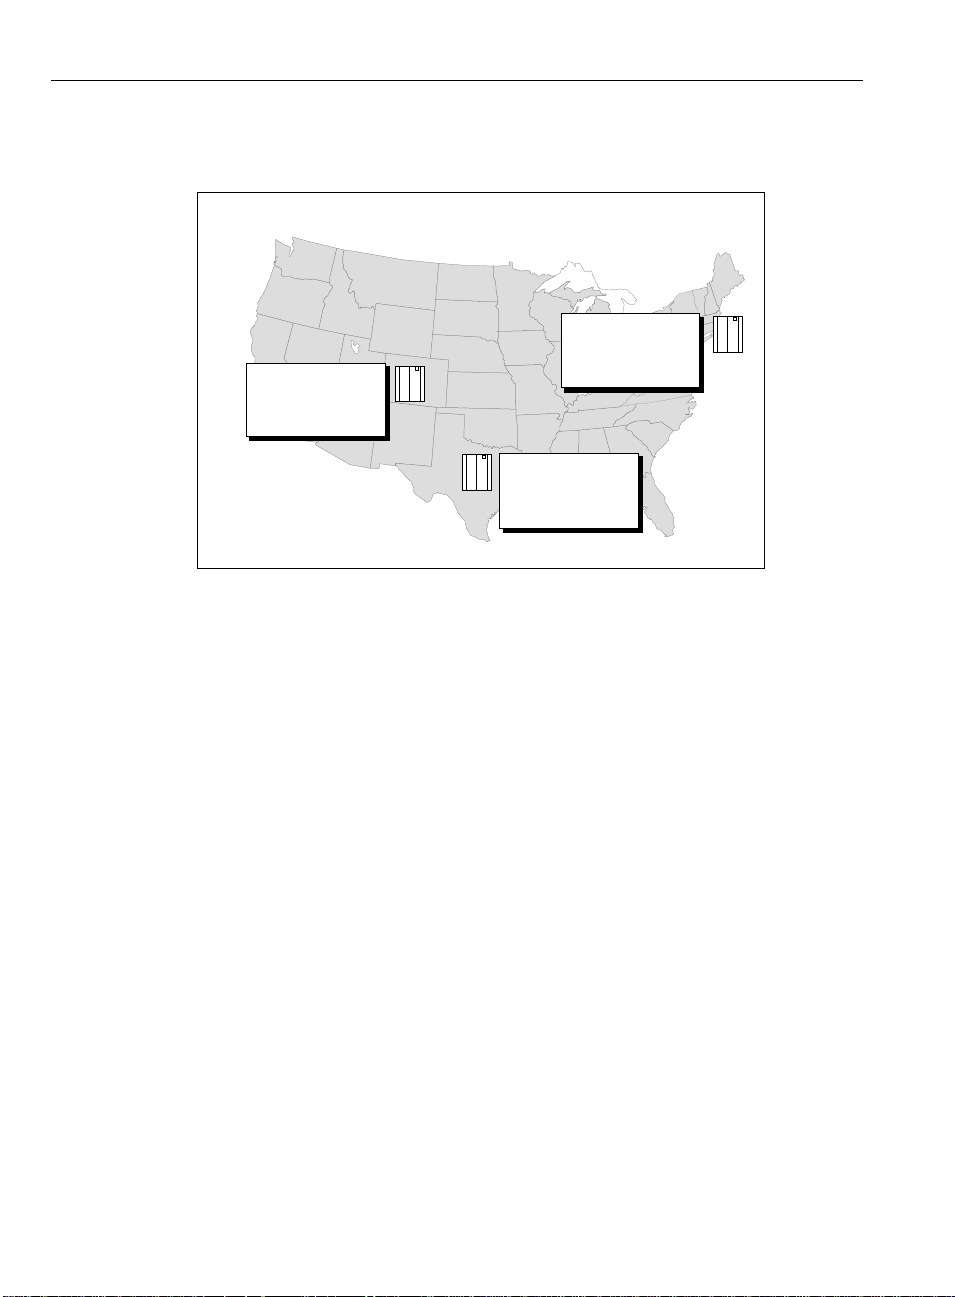
Peripheral services typically include a number of skill groups, each of
which can be set up to handle specific types of calls. For example,
within a Sales peripheral service you might have Spanish and Japanese
skill groups to support Sales calls from callers who speak these
languages.
Peripheral skill groups are skill groups that are tied to a specific ACD or
PBX. Each skill group contains a number of agents. Agents can be
assigned to one or more peripheral skill groups. Like services, skill
groups can be combined on an enterprise basis.
1. Overview
Page 26

26 Overview
Figure 6 shows the relationship between enterprise and peripheral skill
groups.
HelpDesk
HelpDesk Pri.
HelpDesk Sec.
Denver.HelpDesk
Denver.HelpDesk.Pri
Denver.HelpDesk.Sec
Denver.Spanish
Denver.Spanish.Pri
Denver.Spanish.Sec
Enterprise Skill Groups
Spanish
Spanish Pri.
Spanish Sec.
Peripheral Skill Groups
Boston.HelpDesk
Boston.HelpDe sk.Pri
Boston.HelpDesk.S ec
Boston.Spanish
Boston.Spanish.Pri
ACD
Dallas.HelpDe sk
Dallas.HelpDesk.Pri
Dallas.HelpD esk.Sec
ACD
Dallas.Spanish
Dallas.Spanish.Pri
Dallas.Spanish.Sec
These peripheral skill groups are logically combined to form the
enterprise skill group, HelpDesk Pri.
Boston.Spanish.Sec
ACD
Figure 6: Enterprise and Peripheral Skill Groups
On Lucent DEFINITY ECS ACDs running in EAS mode, and on
Rockwell Galaxy ACDs, each skill group has primary and secondary
subgroups. The ICR emulates this by automatically creating additional
skill groups for these peripheral types. For example, if you configured a
HelpDesk skill group for a Galaxy ACD, the ICR would automatically
create HelpDesk.Pri and HelpDesk.Sec skill groups in addition to the
base HelpDesk skill group.
In routing and reporting, you can reference the .Pri and .Sec skill groups
directly or you can refer to the base skill group. In Figure 6, the base
skill groups are Denver.HelpDesk, Boston.HelpDesk, and
Dallas.HelpDesk. These base skill groups include the .Pri and .Sec
HelpDesk skill groups configured on the ACD. These base skill groups
can be combined to form the enterprise skill group, HelpDesk, which
would include all HelpDesk skill groups across the enterprise.
Page 27

The Call Center Enterprise 27
1.2.2. Agents and Agent Teams
Within the call center enterpri se, an agent is anyone who can answer
incoming phone calls. A peripheral agent is an agent who is associated
with a particular peripheral (ACD, PBX) in the call center enterprise. A
peripheral agent can be a member of one or more skill groups. (Some
peripheral types limit each agent to one skill group assignment.)
Figure 7 shows how agents are organized in a call center enterprise.
Agent Teams
Agents
Agents Agents
Enterprise Service
Peripheral
Services
Enterprise Skill Group
Peripheral
Skill Groups
Figure 7: Agent Hierarchy
Peripheral agents are grouped first into peripheral skill groups. You can
group peripheral skill groups into services or enterprise skill groups.
Optionally, you can group peripheral agents into agent teams. Agent
teams are groups of peripheral agents configured on the same peripheral
to meet a business need. You can have an agent team that includes
agents at the call center and agents who work at home. Although these
agents are at different locations, they are associated with a particular
ACD at the call center. Members of an agent team can also be members
of one or more skill groups.
1. Overview
1.2.3. Trunk and Network Trunk Groups
A trunk group is a collection of trunks (that is, telephone lines). Trunk
groups typically contain trunks that are used for a common purpose. The
ICR routes calls to specific trunk groups; not to specific trunks. Within
Monitor ICR, you can monitor activity for a specific trunk group, but not
for a specific trunk.
A simple trunk group is associated with a single peripheral and typically
reflects the peripheral’s view of the trunks (that is, how the peripheral
organizes its trunks). However, trunks can also be viewed from the
routing client’s perspective. A routing client is an entity that sends
routing requests to the ICR.
Page 28

28 Overview
A network trunk group is a group of trunks organized to reflect the
routing client’s view of trunks. A network trunk group can map to one or
more peripheral trunk groups. For example, say you have two VRUs at a
call center site in Dallas. Each VRU has two T1 circuits (see Figure 8).
Figure 8: Network and Peripheral Trunk Groups
The VRU may divide its trunk groups differently than the routing client
(for example, the IXC). In this example, the VRUs view each T1 circuit
as a trunk group (two trunk groups on each VRU). To the routing client,
however, the four T1 circuits might represent a single pool of 96 trunks.
The routing client can deliver calls with the same Dialed Number
Information Service (DNIS) to any of these 96 trunks, so it treats this
pool of trunks as a single entity—a network trunk group.
The use of network trunk groups simplifies the configuration of trunk
groups for some types of ACDs. Rather than deliver calls to specific
trunk groups and peripherals, the routing client need only deliver the call
to a network trunk group. The peripheral can then choose a target that
matches the DNIS and thereby classify the call.
Network Trunk
Routing Client
(IXC, PG)
Group
NY
Trunks
T1’s
NY.Megacom.Trkgrp1
NY.Megacom.Trkgrp2
T1’s
NY.Megacom.Trkgrp103
NY.Megacom.Trkgrp104
ACD1
ACD2
Peripheral Trunk
Groups
1.2.4. Service Arrays
Service arrays are closely tied to network trunk groups. Typically,
service arrays are defined in instances where you have similar peripheral
services defined on multiple VRUs and the VRUs all share the same
network trunk group. By grouping the services of multiple VRUs into a
service array, you can send calls to a single target (a service array) and
let the network deliver the call to any one of the peripheral services that
make up the service array.
Page 29
The Call Center Enterprise 29
Figure 9 shows an example of how service arrays relate to peripheral
services and network trunk groups.
Network Trunk
Group
Routing Client
(IXC, PG)
DAL
Trunks
T1’s
Dal_VRU2.Sales Dal_VRU3.Sales Dal_VRU4.Sales
Dal_VRU2.Help Dal_VRU3.Help Dal_VRU4.Help
VRU2
VRU4VRU3
Serv ice
Array
Dal_VRU1.Sales
Dal_VRU1.Help
VRU1
Figure 9: Service Arrays
When several VRUs each support a peripheral service, as shown in
Figure 9, you can define a service array for those VRUs. You can define
one or more peripheral services on a VRU. Each VRU can have more
than one service array defined.
Service arrays also give you flexibility in reporting on call center
performance by providing a separate view into the performance of
peripheral services on VRUs. For example, in Figure 9 a peripheral
service report would provide data for one VRU. An enterprise service
report would provide data for an arbitrary collection of VRUs and
ACDs. A service array report, however, would provide data on one
group of VRUs that are sharing a network trunk group.
1.2.5. Routes
A route is a value that is returned by a routing script. The value maps to
a target at a peripheral. This target can be a service, skill group, agent, or
translation route. More simply, a route is the destination of the call after
the ICR has made its routing decisions.
1. Overview
Page 30
30 Overview
Routes are associated with a single peripheral and are not organized on
an enterprise-wide basis. Figure 10 shows some examples of routes and
how they map to individual peripheral targets.
Figure 10: Routes
The ICR converts the route value that is re turn ed by the routing scrip t to
a routing label. This routing labe l is then retu rned to the routing client.
The routing client uses the routing label to deliver the call to the
appropriate trunk group and DNIS combination.
See also:
The Intelligent CallRouter System Manager Guide contains a more
in-depth discussion of routes and how they are mapped to specific
targets.
Denver Sales
Denver.Sales.Pri
Agent 325
Denver.Trunks + DNIS
ACD
Routes
ACD
Boston Sales
Boston.S ales.Sec
Agent 123
Boston.Trunks + DNIS
Dallas.Sales
Dallas.Sales.Pri
Agent 81
Dallas.Trunks + DNIS
ACD
1.2.6. Other Parts of the Enterprise
In addition to viewing data for services, skill groups, agents, trunk
groups, and routes, you can view data for the following call center
entities:
Application Gateways
You can report on data related to the Application Gateways set up in the
system. The G
host systems that are running other call center applications.
The Application Gateway is implemented via a node in the ICR Script
Editor. A routing script that contains an Application Gateway node can
query an application running on a host system in order to obtain data to
use in call routing. The ICR can then base subsequent routing decisions
on the results obtained from the query.
EOTELìGateway feature allows the ICR to interface to
Page 31

The Call Center Enterprise 31
Call Types
A call type is a category of incoming calls. Calls are categorized based
on dialed number (DN), caller-entered digits (CED), and calling line ID
(CLID). Each call type has a schedule that determines which routing
script or scripts are active for that call type at any time. In reports, you
might want to display data such as the number of calls of a certain call
type that used default routing during a specified interval.
Peripherals
A peripheral is the switch (for example, ACD, PBX, or VRU) that
receives the calls routed by the ICR. In the course of managing the call
center enterprise, you might want to view switch-specific hardware and
software status data along with call and agent information. You can view
this type of data for any supported peripheral in the call center
enterprise.
Routing Clients
A routing client is an entity that sends routing requests to the ICR. A
routing client typically corresponds to a subsystem within an
interexchange carrier or to a peripheral (ACD, VRU, PBX) that is
performing Post-Routing. You can report on statistics for the different
routing clients defined in the ICR system. For example, you might want
to report on the maximum delay of route responses to the routing client
for a specified interval.
1. Overview
Schedules
The G
EOTEL•Schedule Link option allows the Intelligent CallRouter to
import schedule data from an external workforce management system.
The Intelligent CallRouter can then use the workforce scheduling data to
make call routing decisions.
You can also generate reports on staffing schedule data that has been
imported from a third-party workforce management system. The
ICR
Workforce Management System is an optional tool for the AW that
allows you to import schedule data and store it in Schedule_Import
tables in the ICR database. For example, you might create a report that
compares scheduled agent states to actual real-time states monitored by
the ICR (for example, Logged In, Ready, Closed Key). You can also
export data for use in ACD reports.
Page 32

32 Overview
1.3. Peripheral -Specific Terminology
The ICR supports several models of call center peripherals. Specifically,
the ICR supports the following ACDs:
Alcatel 4400
Aspect CallCenter
Ericsson ACP1000
Lucent DEFINITY ECS
NEC NEAX 2400
Nortel DMS-100, SL-100
Nortel Meridian
Rockwell Galaxy
Rockwell Spectrum
Siemens Hicom 300E (Release 9006)
Siemens Rolm 9751CBX (Release 9005)
VRUs from AT&T, Brite, Edify, IBM, InterVoice, Lucent,
Microlog, Periphonics, Tandem, and VoiceTek.
See also:
For more information on VRU support, see the Intelligent CallRouter
Product Description.
Each of these peripherals has its own terminology to describe the call
center. In most cases, the ICR terms map very closely to the
corresponding ACD terms. In some cases, the mapping of ICR to ACD
terms is not as precise. For example, although it might make sense to
associate each VDN on a DEFINITY ECS with an ICR service, you
could also map each hunt group to a service. Tables 1, 2, and 3
summarize the mapping of ICR call center terminology to ACD-specific
terminology.
On Rockwell Galaxy ACDs, and on Lucent DEFINITY ECS ACDs
running in EAS mode, each skill group has primary and secondary
subgroups. The ICR emulates this by automatically creating additional
skill groups for these peripheral types. In reports and scripts, you can
reference the .pri and .sec skill groups directly or you can refer to the
base skill group. The base skill group is an inclusive skill group that
organizes related primary and secondary subgroups.
Page 33

Peripheral-Specific Terminology 33
Table 1 : Aspect, Lucent, and Nortel—ICR Terminology Mapping
GEOTEL
ICR
Service Application Vector Directory
Aspect
CallCenter
Lucent DEFINITY
ECS
Number (VDN)
Nortel DMS100/ SL-100 Nortel Meridian
Primary or
supplementary
ACD DN
ACD Directory
Number
(ACD DN) or ACD
Controlled
Directory Number
(ACD CDN)
Skill Group Agent group Skill group or hunt
group
2
ACD group ACD DN
Agent Agent Agent Agent Agent
Trunk Group Trunk group Trunk group None
4
Trunk Instrument
Peripheral
Target
Trunk group
and DNIS
Trunk None Member of route
Trunk group and
5
DNIS
6
Primary or
supplementary
3
Route
Trunk group and
DNIS
ACD DN
1
1. Overview
1
Without Customer Controlled Routing (CCR), o ne or more services map to an
ACD DN. With CCR, one or more services map to an ACD CDN.
2
If Expert Agent Selection (EAS) is configured, a skill group maps to an ECS
skill group; otherwise, it map s to a hunt group.
3
One network trunk group and one associated trunk group are defined for each
DMS-100 ACD.
4
A CallCenter instrument can be a trunk, a teleset, or a workstation.
5
The CallCenter maps a trunk group and DNIS to a Call Control Table (CCT).
6
The DEFINITY ECS uses the trunk group and DNIS for incoming calls. It
uses the VDN extension for other calls. A DNIS can refer to either a VDN
extension or hunt group extension.
Page 34

34 Overview
Table 2: Rockwell and Siemens—ICR Terminology Mapping
GEOTEL
ICR
Service Application Gate ACD Routing Table
Skill Group Agent group Primary,
Agent Agent Agent Agent Agent
Trunk
Group
Trunk Trunk Trunk group Trunk Trunk
Peripheral
Target
Rockwell
Spectrum
Trunk group Trunk group Trunk group Trunk group
Trunk group
and DNIS
Rockwell
Galaxy
secondary, and
tertiary groups
for a gate.
DNIS Destination ACD
Siemens HICOM
300E (9006)
(ART)
ACD Group ACD Group
Number (DNIT)
Siemens Rolm
9751 CBX (9005)
Pilot Number
associated with
ART
Destination ACD
Number (DNIT)
Table 3: Alcatel, NEC, and Ericsson—ICR Terminology Mapping
GEOTEL
ICR Alcatel 4400 NEC NEAX 2400 Ericsson ACP1000
Service Pilo t CCV number Trunk group/cal led
number
Skill Group Agent PG Split number Agent group
Agent Agent Agent Agent
Trunk Group None Trunk group Trunk group
Trunk None Trunk Trunk
Peripheral
Target
DNIS Pilot number Trunk group or queue
Page 35

Peripheral-Specific Terminology 35
The ICR comprises a set of the functions of the supported peripherals.
Because the features of each ACD vary, one type of ACD cannot take
advantage of every capability the ICR offers. Some ACDs have
limitations that prevent them from making full use of specific features of
the ICR. Table 4 summarizes these limitations.
Table 4: Features Not Supported for Specific Peripherals
Peripheral Type Restrictions
Aspect CallCenter Only one skill group assig nment per agent.
Alcatel 4400 No trunk group monitoring.
Ericsson ACP1000 Only one skill group assignment per agent.
Nortel DMS-100/
No trunk gro up monitoring.
SL-100
1
Nortel Meridian Limited trunk group monitoring
.
No peripheral service level reporting.
Ring time for a call is included in either queue time or
delay time.
Cannot specifically track agents as Talking Out (this
time is included in Talking Other).
Rockwell Galaxy No Post-Routing or translation routing.
G
EOTEL•
EOTEL•
G
Enterprise CTI not supported.
Agent Reporting not supported.
No duplexed PG operation.
No Longest Available Agent (LAA) routing.
Can route only to services; not to specific agents or
skill groups. (The ACD chooses the best group or agent
to provide the service.)
No real-time agent state data (but accumulated times in
each state are reported).
1. Overview
(continued)
1
The Meridian ACD supports a subset of trunk group real-time and half-hour
data in the ICR database schema.
Page 36

36 Overview
Peripheral Type Restrictions
Rockwell Spectrum No trunk group monitorin g.
Duplexed PG operation supported only for TCP/IP
Transaction Link configurations.
Siemens
HICOM 300E (9006)
Siemens/Rolm
9751CBX (9005)
No trunk gro up monitoring.
Limited conference call monitoring.
No Post-Routing or tra nsl ation routing.
EOTEL•
G
EOTEL•
G
Enterprise CTI not supported.
Agent Reporting not supported.
No Automatic Configuration.
No Longest Available Agent (LAA) routing.
No routing to a specific agent.
No trunk gro up monitoring.
No termination call detail data.
Limited real-time service and skill group routing.
Page 37

2. The Admin Workstation
The Admin Workstation (AW) is the human interface to the Intelligent
CallRouter. The Admin Workstation is a PC running G
on the Microsoft
Workstations can be located throughout the call center enterprise.
Using the Admin Workstation, you can
®
Windows NT™ operating system. Admin
Monitor the performance of agents, skill groups, services, routes,
and trunks.
Generate historical reports.
Provide web access to ICR reports and scripts.
EOTEL software
37
Change the ICR system configuration.
Define, modify, and view call routing and administrative scripts.
Monitor the execution of scripts.
This chapter introduces the Admin Workstation (AW) with a special
emphasis on call center reporting.
See also:
For information on ICR system configuration or call routing scripts, see
the Intelligent CallRouter System Manager Guide. For information on
system maintenance tasks, see the Intelligent CallRo uter Administrator
Guide.
2. Admin Workstation
Page 38

38 The Admin Workstation
2.1. The GEOTEL Admin Workstation Group
Each Admin Workstation contains the GEOTEL Admin Workstation
group. When open, the G
follows:
Not all AWs have an identical sets of tools. The tools on each AW may
vary depending on the ICR features you ordered. In general, the
following programs are available:
Application Wizard. Lets you setup the configuration elements
need to route a call from a routing client to a target at a peripheral.
EOTEL Admin Workstation group appears as
AW Select. Lets you start and stop the services needed to run
Admin Workstation applications.
Bulk Configuration. Lets you efficiently add or modify multiple
rows in certain ICR configuration tables.
Call Tracer. Lets you send test calls to the ICR and see how they
are processed and the target chosen for the call.
Check Routes. Lets you validate the configuration of routes
referenced by a script.
Configure ICR. Lets you set up and maintain your GEOTEL
environment. The configuration includes the hardware within the
system, the services provided by the system, and the agents who
provide them.
Custom Screen Builder. Lets you create your own report templates
for use in the Monitor ICR reporting application.
Glossary. Defines terms related to the ICR.
Initialize Local Database. Lets you copy current information from
the ICR’s central database to the local database on the Distributor
Admin Workstation. (Normally, this is done automatically.)
Job Scheduler. Lets you schedule reports to be generated and
printed at a later time.
Page 39

Distributor and Client Admin Workstations 39
Lock Admin. Lets you check or change the status of locks in the
ICR central database.
Monitor ICR. Lets you view graphs and reports to monitor the
performance of specific agents, skill groups, services, and other
groups within the ICR call center enterprise.
Print Server. Works with the Job Scheduler to allow you to
automatically print reports at specific times.
Route Explorer. Displays the associations between dialed numbers,
labels, peripheral targets, services, and routes.
Router Log Viewer. Displays information about calls processed by
the ICR and any errors encountered in processing them.
Scheduled Target Manager. Lets you configure and manage
scheduled targets.
Schema Help. Describes the structure of the ICR databases.
Script Editor. Lets you create, modify, and schedule routing scripts.
The ICR executes these scripts to determine where to route each
call.
Send Home. Lets you report issues or submit orders directly to
G
EOTEL Customer Support.
Service Control. Lets you stop and start ICR-related services.
2. Admin Workstation
Setup. Lets you modify ICR setup parameters.
Translation Route Wizard. Lets you configure and manage
translation routes.
Workforce Management Integration System. Lets you exchange
data between the ICR and an external workforce management
system. It also lets you define custom or periodic schedules.
These tools are covered in detail in the ICR product documentation.
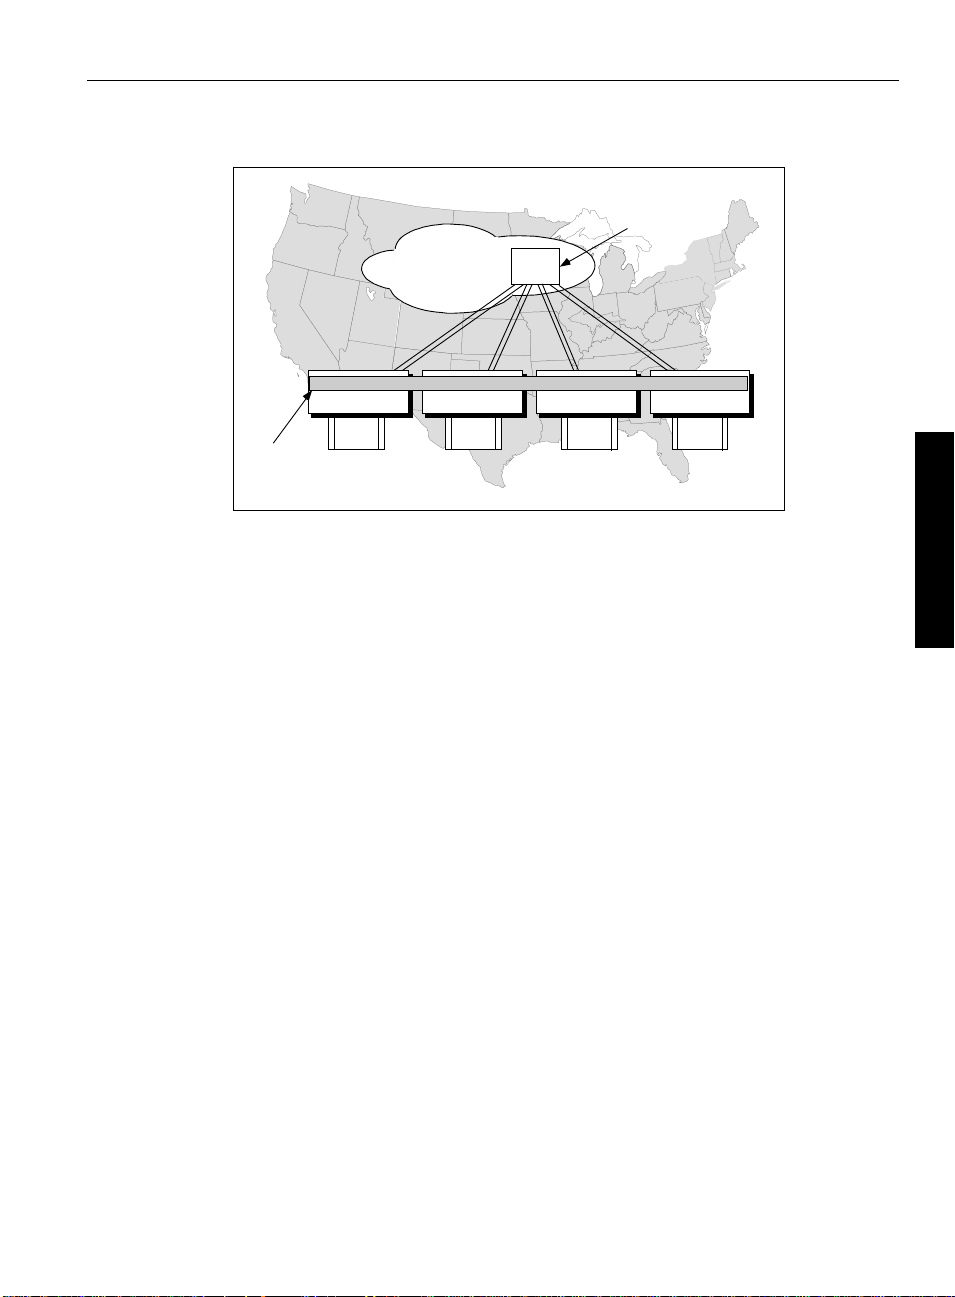
2.2. Distributor and Client Admin Workstations
One Admin Workstation at each site maintains a connection directly
with the Intelligent CallRout er central controller. The ICR central
controller contains the call routing logic for the system. It also acts as
historical and real-time data server for the system.
The connection between the ICR central controller and an AW is
referred to as the real-time feed. The real-time feed connection is used to
send real-time monitoring data to a Distributor AW. The Distributor
Admin Workstation receives the real-time data and acts as a data
distributor to all other AWs at the site. Admin Workstations that do not
serve as data distributors are called Client Admin Workstations.
Page 40

40 The Admin Workstation
Each Distributor AW has its own local database that contains a copy of
data from the central database. The ICR’s Update AW background
process automatically keeps the local database synchronized with the
central database.
2.2.1. Real-Time and Historical Data
The ICR collects real-time and historical data from each call center to
determine where to route each call. The real-time data provides current
information about specific skill groups, services, trunk groups, routes,
and scripts. Real-time data are stored in the Distributor AW’s local
database where it is constantly overwritten by new data. The historical
data are stored in the ICR central database in summary five-minute and
half-hour intervals. The ICR also saves call detail records in the central
database for each call routed.
2.2.2. Historical Database Server (HDS)
A Distributor AW may optionally serve as an Historical Data Server
(HDS). In this configuration, the ICR Logger (the system’s database
server) automatically forwards historical data to the Distributor AW
where it is stored in a special HDS database. Other AWs at the site can
read historical data from the Distributor AW rather than from the central
database.
2.2.3. Monitor-Only AW
Some Intelligent CallRouter systems might incorporate a monitor-only
version of the Admin Workstation. This is a scaled-down client AW that
allows you to use the ICR’s reporting tools on desktop PCs running
Windows 95 or Windows NT. The monitor-only AW is used exclusively
for reporting and does not have the tools necessary for changing call
routing and system configuration data, or scheduling reports for printing.
See also:
The monitor-only AW comes with on-line help that explains the
workstation’s features in more detail.
Page 41

Monitor ICR Reporting 41
2.2.4. Admin Workstation Users
Three kinds of people use the Admin Workstation:
System Manager. Uses the Admin Workstation to update the ICR
system configuration, create and edit call routing scripts, and
download Admin Workstation configuration information from the
central database.
Supervisor. Uses the Admin Workstation to monitor call center,
agent, and agent group performance and produce real-time and
historical call center management reports. The tool of most
importance to the Supervisor is Monitor ICR.
Administrator. Uses the Admin Workstation to maintain the ICR
databases, register new users in Windows NT, and view system
event log files.
2.2.5. Open Database Architecture
The ICR employs an open database architecture. Monitor ICR is just one
of many tools you can use to access the ICR central and local databases.
Other third-party tools can be used to manage the data in these
databases.
Applications like Microsoft
Powersoft InfoMaker
reports. You are also free to use other standard Windows tools to access
data. For example, you can access data directly from the ICR databases
using Microsoft SQL Server and Open Database Connectivity (ODBC)
tools.
Note: Although you can read any data you want from the ICR databases,
G
EOTEL recommends that you do not directly modify data in the central
database by using third-party tools. Modifying data with third-party
tools can cause disruptions in the system. Use the ICR tools when
modification is necessary.
Excel, Microsoft Visual Basic, and
allow you to access the databases and create
2. Admin Workstation
2.3. Monitor ICR Reporting
Monitor ICR is the reporting and monitoring tool of the Admin
Workstation. It is an integral part of the AW and is the main subject of
Monitor ICR
this manual. Monitor ICR features an extensive set of predefined report
templates. The ICR report templates allow you to quickly generate
reports of the call center and agent performance data that are stored in
the ICR databases.
See also:
Chapter 8, “Template Reference,” provides details on each report
template that comes with Monitor ICR.
Page 42

42 The Admin Workstation
You can change the predefined templates to suit your particular business
needs by using the optional ICR Custom Screen Builder. The Custom
Screen Builder is a client database access application that is based on
Powersoft
InfoMaker. The Custom Screen Builder also allows you to
create new report templates for use in Monitor ICR.
See also:
The Intelligent CallRouter Custom Screen Builder Tutorial provides an
introduction to the ICR Custom Screen Builder tool.
2.3.1. Enterprise and Peripheral Reporting
The ICR’s reporting structure allows you to view organizational entities
independently or generally over the entire enterprise. For example, in
one report you can see how calls are being handled generally by using an
enterprise service. In a second report, you can see how calls are being
handled by individual agents, agent teams, peripheral services, or skill
groups. Figure 11 shows an example of two Monitor ICR reports:
Figure 11: Enterprise and Peripheral Reporting
The first report contains data for several enterprise services. One of
these services is called MidTier. Like all enterprise services, the MidTier
enterprise service has several component peripheral services. The
enterprise service report prov ide s data for the component peripheral
services on an enterprise-wide basis.
To see the data broken out by individual peripheral service, you would
generate a peripheral service report. Three components of the MidTier
enterprise service are the subject to the peripheral service report:
Bellevue.MidTier, Boston.MidTier, and Denver.MidTier.
Page 43

Monitor ICR Reporting 43
2.3.2. Agent Reporting
GEOTEL•Agent Reporting is an optional feature that can be licensed for
peripherals (ACDs, PBXs) in the call center enterprise. With this feature
enabled, you can generate reports of agent-level data through Monitor
ICR. (The Siemens 9751 CBX (9005) and Rockwell Galaxy ACDs do
not support agent reporting.)
The types of reports you can generate vary in scope. For example, you
might want to report on the activity of specific agents within the
enterprise. Optionally, you might report on the activity of agents
associated with a particular skill group or agent team. Table 5
summarizes the types of agent reports you can generate.
Table 5: Agent Report Types
Report Type Scope
Peripheral agent Displays information about selected agents throughout
the enterprise regardless of peripheral associations.
Agent by
peripheral
Agent by skill
group
Agent by team Displays information about each agent in one or more
Displays information about each agent currently logged
into one or more selected peripherals.
Displays information about each agent currently logged
into one or more selected skill groups.
selected agent teams.
The data that are displayed in these reports include real-time and
historical data that cover:
Agent status
Agent activity
Agent performance
See also:
Chapter 7 “Available Data,” provides an overview of the data available
for agent-level reporting. Chapter 8, “Template Reference,” provides
details on each agent-level Monitor ICR report template.
Enabling Agent Reporting
A call center enterprise can contain many agents whose states are
changing frequently. Consequently, while monitoring agent states the
ICR might generate and store a large amount of data. To limit the
amount of data generated and stored, the ICR provides two ways to
control the generation of agent data:
2. Admin Workstation
Specify which peripherals in the enterprise provide agent data.
Define the flow of data from a specific peripheral to a Distributor
AW site. This is called an agent distributio n.
Page 44

44 The Admin Workstation
See also:
The Intelligent CallRouter System Manager Guide provides specific
instructions for enabling agent-level reporting. Some general guidelines
are presented here.
À To specify which peripherals provide agent data:
Run Configure ICR. In the Peripheral Configuration window, set the
Agent Reporting option for each peripheral you want to provide
Configure ICR
agent-level data. You can set this option on a peripheral-by-peripheral
basis.
À To define an agent distribution:
Run Configure ICR. In the Agent_Distribution_Configuration window,
define which peripherals feed agent data to each Distributor AW site.
Configure ICR
You can enable or disable an agent distribution at any time. Disabling an
agent distribution allows you to stop the flow of all agent data to a
Distributor AW when you are not viewing real-time agent reports.
Enabling Agent State Trace
Optionally, you can track every state an agent passes through and
display this data in Monitor ICR reports. You can enable the agent state
trace feature for individual agents.
À To enable agent state trace:
Run Configure ICR. Enable the Agent State Trace option in the Agent
Configuration window.
Configure ICR
Tracking every state of an agent puts an added load on the ICR.
Therefore, you should use this feature only for short-term tracking of
specific agents.
See also:
See the Intelligent CallRouter System Manager Guide for more
guidelines on using the agent state trace feature.
2.4. Monitor ICR Reporting Scenario
In order to quickly detect changes in call volumes and service levels,
you need access to up-to-the-minute data. You also need historical data
in order to analyze trends and gauge resources across the call center
enterprise. Monitor ICR allows you to combine real-time and historical
data in a single report. In addition, you can and have several reports
displayed on the workstation screen at once.
2.4.1. Viewing Multiple Reports
By viewing multiple reports, you can get a clear picture of current and
past call center performance. For example, say you are viewing a report
that shows service levels for several enterprise services. You notice that
the PremiumSales enterprise service has had a sharp drop in its service
Page 45

Monitor ICR Reporting Scenario 45
level over the last half-hour. To further investigate the problem, you
open two additional call analysis reports:
One report provides real-time data such as calls offered, calls
abandoned, average speed of answer, and service levels for the
PremiumSales enterprise service.
The other report displays the same data for the PremiumSales
enterprise service, but historically over the last two weeks.
You now have three reports on the screen, each displaying a different set
of data for the PremiumSales enterprise service. Figure 12 shows an
example.
Figure 12: Sample Report
2.4.2. Analyzing the Data
As you analyze the historical data, a trend becomes obvious: between
3:00 and 5:00 P.M. each day, the number of calls offered to the
PremiumSales enterprise service increases dramatically. Since agents
become increasingly busy during this time, calls are being held longer
than necessary, which consequently causes the service level to drop.
2. Admin Workstation
Page 46

46 The Admin Workstation
2.4.3. Correcting the Situation
To correct the situation, you consider two options:
First, you find out if there is an excess of qualified agents in other
skill groups in the call center enterprise. Are these agents available
to handle PremiumSales calls between 3:00 and 5:00 P.M.? If they
are, you can add these skill groups to the search list of the ICR call
routing script currently in effect for the PremiumSales enterprise
service. The routing script will activ ate the back up sk ill groups as
necessary to ensure that service levels remain high.
As a second option, you may decide to work with the appropriate
site personnel to determine if you can add more agents. For
example, you might have several call centers in the enterprise each
assign an agent to the PremiumSales enterprise service.
2.4.4. Monitor ICR Reporting Terms
Before you begin using Monitor ICR, it may be helpful to review some
of the terms that are frequently used in this manual:
Template. You use templates to create reports. A template is a file
that specifies the types of data to be displayed in a report and how
the data will be displayed (for example, in a graph, a chart, etc.). The
types of data and the display format are fixed in the template file.
However, you can specify that you want data for a particular agent,
service, skill group, trunk group, route, etc. You can also specify a
range of dates for which to retrieve data.
A number of predefined templates are provided with Monitor ICR.
You can use the ICR Custom Screen Builder to modify these
templates or to create new ones.
Historical templa te. A historical template is a template that is
based on historical data from the ICR central database. You can use
historical templates to create reports that contain half-hour and daily
summaries of agent and call center data.
Real-time templa te. A real-time template is a template that is based
on real-time data from the Distributor AW local database tables.
You use real-time templates to create reports that provide a view
into current agent and call center activity.
Report. A report is the final presentation of data, titles, dates and
times, and graphic elements displayed on the AW screen or printed.
A single report can include components generated by one or more
templates. For example, one report can contain a real-time pie chart
and a historical grid, each generated with a different template. Once
the report is displayed on the screen, it can be saved as a report
definition.
Page 47

Report definition. A report definition is a file that specifies the
2.5. Web View
GEOTEL•Web View is the web-based reporting and script monitoring
tool of the ICR. You can install Web View on an Admin Workstation to
make it a web server in your corporate intranet. Other computers with
access to the web can use the G
ICR reports and monitor call routing scripts in real-time. Figure 13
shows an example of the type of Web View report that can be displayed
in a web browser:
Web View 47
templates the report uses to retrieve data. The report definition also
specifies other values that the report includes (for example, dates
and times, particular services, skill groups, etc.). Report definitions
are saved as files with .CMB extensions in the subdirectories of the
icr\aw\custname\custom directory. They can be displayed at any
time in Monitor ICR.
EOTEL•Web View Server to generate
Figure 13: Web View Report
The URL for the Web View internal web site address depends on the
name of the Distributor AW machine where the server component is
installed. See your network administrator for more information.
WebView currently supports Microsoft
Netscape Navigator
™
versions 3.0 or higher. The Web View on-line help
®
Internet Explorer version 4.0 or
provides instructions on generating web-based reports.
See also:
For details on using and installing Web View, refer to the GEOTEL•Web
View Administrator Guide.
2. Admin Workstation
Page 48

48 The Admin Workstation
Page 49

3. Creating a Report
The Monitor ICR reporting tool allows you to report on call and agent
activity throughout the call center enterprise. You can use real-time data,
historical data, or a combination of the two in a single report. You can
also display multiple repo rts on the screen, save repor ts, and print
reports.
This chapter provides a tutorial that guides you through the process of
generating a report. In this tutorial, you will learn how to:
Start Monitor ICR.
Set up the Template Launcher.
Set thresholds in reports.
49
Add drill-downs to reports.
Save report definitions.
Display reports automatically at startup.
See also:
If you need details on the features and functions of Monitor ICR, see
Chapter 4, “Reporting Basics.”
3. Creating a Report
Page 50

50 Creating a Report
3.1. The Report Example
The report you will be creating includes a real-time bar graph that
displays call queue status data for selected peripheral services. This data
includes:
Average Delay in Queue
Expected Delay in Queue
Longest Call in Queue
Average Speed of Answer (ASA)
The data for the real-time bar graph is taken from the
Service_Real_Time table in the Admin Workstation local database.
See also:
For more information on the tables of the central and local databases, see
the Intelligent CallRouter Database Schema Handbook.
The report example also includes a histo ri cal grid that displays half-hour
call analysis data for selected peripheral services. This data includes:
Service Level
Average Speed of Answer (ASA)
Average Handle Time (AHT)
Average Delay in Queue
Calls Offered
Calls Handled
Calls Abandoned in Queue
The historical data is taken from the Service_Half_Hour table in the ICR
central database. The historical grid displays data for a specific range of
dates and times that you specify.
Page 51

The Report Example 51
The completed report looks similar to the following example:
Often when using Monitor ICR, you create reports that contain only one
report component (for example, a real-time graph showing the delay in
queue). In some cases, you might want to display real-time and historical
data in a single report. With Monitor ICR, you can launch several report
templates at the same time to create a report with multiple real-time and
historical components.
Although the report generation process is basically the same whether
you use one or more templates, some Monitor ICR features are specific
to multiple-component reports. Therefore, it’s worthwhile to learn how
to use Monitor ICR by creating a multiple-component report.
3. Creating a Report
Page 52

52 Creating a Report
3.2. Starting Monitor ICR
To start Monitor ICR, click Start, then point to Programs. In the
Monitor ICR
Programs menu, point to G
ICR. The Monitor ICR main window appears:
EOTEL Admin Workstation and click Monitor
The Monitor ICR toolbar provides buttons that allow you to quickly
activate the most common functions (for example, New, Open, and
Save).
See also:
The Monitor ICR buttons are described in more detail in the on-line help
and in Chapter 4, “Reporting Basics.”
3.2.1. Controller Time
The Controller Time window appears whenever the Monitor ICR
window is displayed:
This window shows the current date and time at the Intelligent
CallRouter central controller. The central controller is the computer that
is routing calls and logging management data to the ICR databases. The
main central controller processes are the CallRouter and the Logger
(Database Server).
Page 53

Setting Up the Template Launcher 53
3.3. Setting Up the Template Launcher
To generate the report, open the Template Launcher window.
À To open the Template Launcher:
In the Monitor ICR window, click the New button. The Template
Launcher window appears:
The Template Launcher allows you to choose reporting options from
several tabs.
À Choose the Category and Scope options:
1. Select Service as the data Category. (By default, Service is already
selected.)
2. Select Peripheral as the Scope. (In this tutorial, you are reporting on
peripheral services rather than enterprise services. Peripheral
services are services that are tied to specific ACDs or VRUs.)
The Category and Scope selections you make specify the general
subject of the report.
À Choose a Business Entity:
If your ICR system has more than one business entity, choose one from
this list. Otherwise, accept the default selection. The business entity
specifies which subset of the ICR enterprise you will be reporting on.
For example, a business entity may represent a division within a large
corporation or a single customer within a service bureau.
À Choose the Date and Time options:
1. Click on the Date and Time tab and choose Absolute Dates (the
default). (Dates and times have no effect on the real-time portion of
the report, but you need them for the historical report component.)
3. Creating a Report
Page 54

54 Creating a Report
2. In the From field, click on the down-arrow. A calendar appears:
3. Double-click on a day (three or more days ago). A date is entered in
the From field.
4. For this tutorial, do not change the To field. The default setting will
provide data up to the present day.
5. Enter 8:00 in the From time field by highlighting the first two digits
and incrementing the time using the up-arrow.
6. Leave the To time set to the default (11:59 PM). This provides data
up to the current time.
7. Click on the “Show a date and time label…” option to indicate that
you want to show the dates and times as a separate component in the
report. Your dates and times should appear similar to the following:
You can now choose the specific parts of the call center enterprise
that the report will cover.
À Choose the specific Items on which to report:
In the Items tab, click on two or more peripheral services from the
selection list. This specifies that you want data for these specific
peripheral services.
To select more than one item, hold down the CTRL key as you click
on each item.
To select a range of items, click the first item in the range, press
S
HIFT, and click on the last item in the range.
To select and deselect all items in the list, click the Select All
button.
Page 55

Setting Up the Template Launcher 55
You can now choose the templates to use in the report.
À Choose the Templates:
In the Templates tab, choose the following templates:
persvc01_queue_delay_status
persvc12_calls_analysis_half_hour
The Template Launcher is now set up to generate a report. Your screen
should appear similar to the following example:
3. Creating a Report
Page 56

56 Creating a Report
3.4. Launching the Report
To launch the report, click OK. An untitled report window appears:
À To design the report:
1. Click on the Maximize button
report window. The report window is maximized. You may also
want to maximize the Monitor ICR window.
2. Drag the graph, chart, and text objects and resize them. Try to lay
out the report so that you can see all the data and the graph and chart
titles. In tabular report components, like persvc12, you can use the
scroll bar on the right side of the window to view more data.
in the upper right corner of the
Page 57

Launching the Report 57
The following example shows the items in the report resized and
repositioned. You may choose to use a different layout:
3. Click inside the title box and enter a title for the report (for example,
“Call Analysis for Bellevue, Denver, and Omaha MidTier
Services”). Resize the Title window, if necessary.
4. When you are satisfied with the appearance of the report, choose
Edit→Shuffle Mode from the Monitor ICR menu to deselect Shuffle
Mode. When you deselect Shuffle Mode, the window borders and
title bars of the individual report components are hidden.
3. Creating a Report
Page 58

58 Creating a Report
Your report should appear similar to the following example:
3.4.1. What the Report Shows
The report you created contains a real-time bar graph that shows the
average delay in queue, expected delay in queue, length of the longest
call in queue, and the average speed of answer for each service. In this
example, the real-time monitoring data is displayed for three peripheral
services. Notice that the real-time data in the bar graph is continually
updated.
The historical section of the report displays several categories of
information related to call analysis for each of the peripheral services.
Some categories in historical reports are displayed as counts, while
others such as Service Level are displayed as a percentage. Depending
on the type of data, the summary rows total, average, or perform another
calculation on the data for each column.
See also:
Chapter 7, “Available Data,” describes the common types of data
displayed in Monitor ICR reports. The Monitor ICR on-line help system
also provides information on how specific data is calculated.
Page 59

3.4.2. The Status Bar
If you click on a bar in the graph, a message appears in the status bar at
the bottom of the Monitor ICR window. The status bar describes what
the bar represents and its current numerical value. For example:
You can use this feature to get a precise reading of a value in the graph
or to differentiate the bars if you have trouble distinguishing their colors.
3.5. Retrieving the Latest Historic al Data
Now that the report is displayed on the screen, you can retrieve the latest
half-hour summary data accumulated by the ICR while you were
creating the report.
À To retrieve the latest historical data:
Click the Retrieve button. The historical grid is updated with new
half-hour summary data that has been collected by the ICR.
3.6. Printing the Report
With the report displayed, choose File→Print, or click the Print button in
the tool bar. The report is sent to the printer.
Saving the Report 59
3.7. Saving the Report
At this point, it’s a good idea to save the report. After you save the
report, you can open it again at any time without having to re-launch the
templates.
Within Monitor ICR, reports are saved as report definitions, which are
files that specify the templates to be used to retrieve data. Report
definitions also specify other items that the report includes, such as dates
and times or the particular subjects of the report (for example, specific
peripheral services or skill groups). Report definitions can be opened at
any time in Monitor ICR.
3. Creating a Report
Page 60

60 Creating a Report
À To save the report definition:
1. Choose File→Save, or click the Save button. The Save Report
Definition dialog box appears.
Since you created a report on peripheral services, the Save Report
Definition dialog box defaults to the persvc directory. The “persvc”
directory is reserved for storing peripheral services report
definitions. Similarly, other subdirectories of the Admin
Workstation’s \custom directory exist to hold other types of report
definitions (for example, skill group, route, and trunk group reports).
2. Type TUTOR as the file name. The .CMB extension is retained.
3. Click OK. The report definition is saved.
4. At the Monitor ICR menu, choose File→Close. The report file is
closed, but the Monitor ICR window remains displayed.
The next time you open the TUTOR.CMB report, the real-time graph
component of the report displays real-time data. The historical grid
displays data for the range of dates you specified when your originally
created the report. Since you did not change the end date and end time,
the historical grid always displays data up to the present date and time.
You can change report definitions like TUTOR.CMB by using the
Monitor ICR Definition Editor. For example, you might want to change
the start dates and times in the historical component of the report.
See also:
The Definition Editor is described in Chapter 4, “Reporting Basics.”
Note: The saved report definition (TUTOR.CMB) does not appear in the
Template Launcher list of templates. It is stored as a .CMB report
definition file, not as a template.
Now that you have created and saved a report definition, you can open
the report and make changes and improvements such as setting
thresholds and adding drill-downs. Thresholds allow you to set yellow
and red indicators on important fields of data in a report. Drill-downs
allow you to launch additional reports from within the current report
window.
Page 61

3.8. Opening the Report
You can open the TUTOR.CMB report by selecting the Open command
from the File menu or by clicking the Open button.
À To open the TUTOR.CMB report:
1. In the Monitor ICR window, choose File→Open, or click the Open
button. The Select Report Definition dialog box appears.
2. Scroll down in the Folders list and double-click the persvc folder
(this is the subdirectory in which the TUTOR.CMB report was
saved). The TUTOR.CMB report definition appears in the file list:
3. Choose TUTOR.CMB from the list.
4. Click OK. The report is opened and appears on the screen.
Now you are ready to set thresholds in both the real-time and historical
components of the report.
Setting Thresholds 61
3.9. Setting Thresholds
As you examine data in the report, you might decide that you want
certain data categories to stand out, especially if the values are out of an
expected performance range. For example, maybe you’d like the Service
Level column in a report to turn red when the service level drops too
low. You can set thresholds such as these to alert you when certain
values exceed or fall below expected levels.
In the real-time bar graph, the threshold alert notifies you immediately
of an unacceptable condition. In the historical grid, the threshold alert
highlights areas that were out of an expected performance range over a
period of time.
À To set thresholds in the real-time graph:
1. With the TUTOR.CMB report displayed, place the mouse pointer
over the real-time graph and hold down the right mouse button. A
pop-up menu appears:
3. Creating a Report
Page 62

62 Creating a Report
2. Choose Thresholds. The mouse pointer changes to a cross hair (+).
(Alternately, you can choose the Thresholds option from the Edit
menu.)
3. Click anywhere inside the real-time graph. The Threshold Editor
dialog box appears:
You can set thresholds for the four attributes displayed in the Queue
Delay Status bar graph (that is, Avg. Delay, Expected Delay,
Longest Call, and Average Speed of Answer (ASA)). These
thresholds can be set for all the peripheral services displayed in the
graph.
4. The default Relation (>=) is appropriate for the Avg. Delay
thresholds you are about to set, so press T
graph, you want to highlight values that equal or exceed (>=) a
certain threshold.)
5. Enter 15 as the yellow threshold and press T
6. Enter 25 as the red threshold and press TAB.
7. Tab down to the Longest Call yellow threshold field. (You do not
have to set a threshold for the Expected Delay attribute. The
Expected Delay is the ICR’s predicted delay for a new call added to
the service queue.)
8. Set the thresholds for Longest Call and Average Speed of Answer
(ASA) as you did for Avg. Delay. Enter the values as shown:
AB. (In the real-time
AB.
9. Click on Apply. (Don’t close the Threshold Editor yet.)
Page 63

Setting Thresholds 63
The thresholds you just set will have the following effects, possibly
immediately, depending on the values in the graph:
When the Average Delay in Queue is greater than or equal to 15
seconds, the Avg. Delay bar in the real-time graph will turn yellow,
indicating a first-level warning. The first-level warning (yellow) is
intended to inform you when a count or value is approaching an
unacceptable level.
When the Average Delay in Queue is greater than or equal to 25
seconds, the bar in the graph will turn red, indicating a more serious
condition. This indicates that for the affected peripheral services, the
Average Delay in Queue has reached an unacceptable level.
When the Longest Call (Waiting in Queue) is greater than or equal
to 30 seconds but less than 45 seconds, the Longest Call bar in the
graph will turn yellow, indicating that the 30 second delay is
approaching an unacceptable level. If that number equals or goes
over 45 seconds, it means that an unacceptable performance level
has been reached or exceeded. The Longest Call bar will turn red to
indicate this more serious condition.
The Average Speed of Answer yellow and red thresholds will also
be triggered when performance levels equal or exceed 15 and 20
seconds respectively.
You can now set thresholds in the historical portion of the report.
À To set thresholds in the historical grid:
1. Within the Threshold Editor, click the Next button. The Threshold
Editor displays the data attributes for the historical Calls Analysis
grid.
2. Enter the threshold values as shown in the following example. (Note
that service level threshold values must be set in decimal format.)
3. Creating a Report
3. (Important.) Be sure to change the Relation for service_level to <=.
You want the Service Level threshold to be triggered when the value
equals or falls below a certain value.
4.
Click Apply.
You just set the number of Calls Offered thresholds to highlight the
column if the number of calls equals or exceeds (>=) 50 and 60 in any
Page 64

64 Creating a Report
half-hour interval. You also set the Service Level thresholds to <= to 80
percent for the yellow warning and <= 75 percent for the red warning.
If the Service Level equals or falls below 80 percent, the Service Level
column in the chart will turn yellow to indicate that the Service Level
approached an unacceptable level. If the Service Level equals or falls
below 75 percent, a red warning will indicate that a serious performance
problem existed.
Note: Setting thresholds on the service level can alert you to other potential
performance problems. A service level that is dropping indicates that
some type of performance problem exists. To find out what is causing
the service level to drop and to see if the problem still exists, you can
launch an appropriate real-time template or open another report
definition.
À To set the other attributes:
Choose relations and enter values that you feel set proper threshold
levels for the other attributes li ste d in the Thre shold Editor.
When you are ready to close the Threshold Editor, click Apply and then
click Done.
À To preserve the thresholds you set:
Although you applied thresholds to the report, you must save the report
itself in order to keep the threshold settings. Save the report definition by
choosing File→Save from the menu bar, or by clicking the Save button.
3.10. Adding Drill-Downs
The DrillDown Editor lets you add another level of detail to the report.
For example, if you are looking at information about a peripheral
service, you might want to see more information about the individual
routes associated with the service. Similarly, if you have a report on an
enterprise service you might want to “drill-down” to see data for the
component peripheral services. The DrillDown Editor allows you to get
this kind of detail quickly and easily from within a report window.
À To add drill-downs to a report:
1. Open the TUTOR.CMB report definition.
2. Choose Edit→DrillDown. The report window is maximized.
Page 65

Adding Drill-Downs 65
3. Click anywhere inside the “Periph era l Se rv ice s Queue Delay Status”
report window. The DrillDown Editor appears. In this example, the
DrillDown Editor lists the corresponding real-time templates for
Routes:
Monitor ICR has rules that specify the groups of drill-down
templates that can be used in particular types of reports. Chapter 4,
“Reporting Basics,” provides a list of the drill-down rules and
defaults.
4. Click on the “routes02_call_status” template in the DrillDown
Editor. In this tutorial, you are setting a drill-down in order to view
additional call status data for the routes associated with a peripheral
service.
5. Click Apply to assign the drill-down template to the “Peripheral
Services Queue Delay Status” real-time graph. (Don’t close the
DrillDown Editor yet.)
You will be able to invoke the drill-down routes template for each
peripheral service in the graph. In other words, you can display a
separate drill-down report for each peripheral service listed in the graph.
3. Creating a Report
Page 66

66 Creating a Report
Now that you have added drill-down capability to the real-time graph,
you can do the same with the historical grid.
À To add drill-downs to the historical grid component:
1. Click on Next. The DrillDown Editor changes to reflect the route
templates that can be added to the historical grid.
2. Click the “routes12_calls_analysis_half_hour” template in the
DrillDown Editor.
3. Click Apply to assign the drill-down template to the Call Analysis
chart.
4. When you are finished, click Done. The DrillDown Editor is closed
and you are returned to the original report window.
You will also be able to invoke a drill-down report for each peripheral
service displayed in the historical grid.
You must save the changes you made to the report in order for the
drill-down capabilities to take effect. If you close the report without
saving it, the drill-down capabilities will be lost.
À To save the drill-down capabilities:
Choose File→Save or click the Save button. You can now invoke the
drill-downs you just set.
À To invoke the drill-downs:
1. With the report displayed, double-click on a bar in the “Peripheral
Services Queue Delay Status” real-time graph. A “Route Status”
drill-down report appears.
Page 67

Saving Your Workspace 67
2. Double-click on a bar for another peripheral service to specify that
you want data for that peripheral service. A new “Routes Status”
drill-down report appears.
3. To close a drill-down report, make the window active and choose
File→Close.
For the historical portion of the report, follow this same procedure, but
invoke the drill-down by double-clicking on a specific name in the
Peripheral Service column of the grid:
Once displayed, the drill-down reports can be saved as Monitor ICR
report definitions.
See also:
Chapter 5, “Setting Thresholds and Drill-Downs,” provides more
information on saving drill-downs as report definitions.
You can now learn how to set up Monitor ICR to save your workspace.
3.11. Saving Your Workspace
You can have Monitor ICR display the screen as you left it each time
you start the application. This feature is useful in displaying your most
important and frequently used reports immediately upon startup.
3. Creating a Report
Page 68

68 Creating a Report
For example, say that the first thing you want to see at the start of the
workday is a real-time report on call queue delays for a certain group of
peripheral services. You can easily set up Monitor ICR to display this
report at startup.
Note: Only saved report definitions (.CMB files) can be displayed at startup.
À To set up Monitor ICR for automatic report display:
1. Open the TUTOR.CMB report.
2. Choose Edit→Shuffle Mode and adjust the report to appear the way
you want it displayed at startup. (For example, you may want to
enlarge the real-time graph in the report.)
3. When you are satisfied with the appearance of the report, choose
Edit→Shuffle Mode again to disable shuffle mode.
4. Choose Options→Save Settings Now. This saves the current screen
settings and component positions.
Note: Make sure that Options→Save Settings on Exit is not selected when you
exit from Monitor ICR; otherwise, the settings you have saved will be
overwritten.
À To test the startup settings:
Choose File→Exit to end the current Monitor ICR session. Then
double-click on the Monitor ICR icon to restart the application. The
report is displayed automatically.
À To return to default display mode:
1. Start Monitor ICR.
2. Choose File→Close to close the TUTOR.CMB report.
3. Choose Options→Save Settings Now.
4. Ensure that Options→Save Settings on Exit is deselected when you
exit from Monitor ICR.
The report you created in this chapter used some of the major features of
Monitor ICR. However, Monitor ICR has other features that can help
you manage your call center enterprise data.
See also:
Chapter 4, “Reporting Basics,” provides more details on the Monitor
ICR interface and several other reporting and monitoring features.
Page 69

4. Reporting Basics
This chapter describes the basics of creating reports with the Monitor
ICR tool. It provides details on using the toolbar, menu commands,
on-line help, and the Template Launcher. Several common reporting
tasks are covered in this chapter, including:
Starting Monitor ICR.
Working with templates and reports.
Exporting report data.
Printing reports.
This chapter also describes how to set Admin Workstation preferences
such as the real-time refresh rate and the background color used in
reports.
69
4. Reporting Basics
Page 70

70 Reporting Basics
4.1. The GEOTEL Admin Workstation Group
From the Windows NT desktop, open the GEOTEL Admin Workstation
group. The group contains several applications:
The following applications are used in reporting on and monitoring call
center activity:
Job Scheduler. Lets you schedule reports to be generated and
printed at a later time.
Monitor ICR. Lets you view graphs and reports to monitor the
performance of the system as a whole or specific services and skill
groups within the system. You can also generate new graphs and
reports using templates provided.
Print Server. Works with the Job Scheduler to allow you to
automatically print reports at specific times.
See also:
See the Intelligent CallRouter System Manager Guide, Installation
Guide, and Administrator Guide for information on the other ICR
applications.
Page 71

4.2. Starting Monitor ICR
To start Monitor ICR, double-click the Monitor ICR icon in the GEOTEL
Admin Workstation group. The Monitor ICR main window appears:
Monitor ICR
Starting Monitor ICR 71
See also:
For information on starting Monitor ICR from the command prompt, see
“Command Prompt Startup Options,” later in this chapter. For
information on starting Monitor ICR from the Windows NT Explorer
see “File Association,” later in this chapter.
4. Reporting Basics
Page 72

72 Reporting Basics
4.2.1. Toolbar Options
You can use the buttons on the Monitor ICR toolbar to quickly activate
the most common functions. Table 6 summarizes these buttons.
Table 6: Monitor ICR Toolbar
Button Action
Create a new report.
Open a report that you have previously saved.
Save the current report to a file.
Print the current report.
Invoke the ICR Event Viewer.
Pause the real-time refreshing of the Monitor ICR screen.
Resume the real-time refreshing of the Monitor ICR screen.
Retrieve the latest half-hour historical data from the central
database.
Invoke on-l ine help.
You can also invoke these actions by using menu commands. A few of
the commands also have keyboard shortcuts.
See also:
The Monitor ICR on-line help provides more information about the
toolbar and keyboard shortcuts.
You can toggle the Options→Show Text option from the Monitor ICR
menu to display the toolbar without text:
Page 73

Starting Monitor ICR 73
Monitor ICR provides a pop-up menu that allows you to display the
toolbar in several different ways. Click the right mouse button in the
area to the right of the toolbar. A menu appears:
Toggle the Frame Bar option to hide the toolbar. To redisplay the
toolbar, choose Options→Toolbar from the Monitor ICR menu. The
other options in this window (except Show Text) allow you to display
the toolbar in different positions and toggle between displaying large
buttons with text (Show Text) or smaller buttons with no text.
Toolbars can appear “docked” to an edge of the window or floating as in
the following example:
You can drag a floating toolbar anywhere within the window. If you
drag it to an edge of the window, it docks to that edge.
4.2.2. On-Line Help
The on-line help system provides information on the user interface and
menus of Monitor ICR. For details on the menu options and other
subjects, invoke the Monitor ICR on-line help.
4. Reporting Basics
Page 74

74 Reporting Basics
À Invoke on-line help by using one of these methods:
In the Monitor ICR window, click the Help button.
Select Help from the Help menu.
Press F1.
The Help contents window is shown in the following example:
Each Help system on the Admin Workstation works in the same way. If
you click the Master Help button in any of the ICR help systems,
another help window appears which lets you navigate to other help
systems via a Help Topics window.
4.2.3. Controller Time
The Controller Time window appears whenever the Monitor ICR
window is displayed. You can position the Controller Time window
anywhere on the screen while you are working in Monitor ICR. It is part
of the Monitor ICR application and is closed and minimized along with
Monitor ICR:
The Controller Time window shows the current date and time at the ICR
Central Controller. The Central Controller is the computer or computers
running the CallRouter and the Database Server. An up-to-date
controller time indicates that the real-time feed process is active and
providing real-time data to the Admin Workstation. You can click on the
radio button () to display the time zone for the Central Controller.
By default, the controller time is updated approximately every 10 to 30
seconds, depending on the AW type. You can change these valueson
some AWs by using the Preferences dialog box.
Page 75

Working with the Template Launcher 75
To change the refresh rate, change the value in the Refresh Rate field in
the Preferences dialog box. This field also affects the rate at which
real-time data is updated in Monitor ICR real-time reports.
See also:
See “Setting Workstation Preferences,” later in this chapter, for more
information on using the Preferences dialog box.
You may also want to see the local time at the Admin Workstation while
you run Monitor ICR. To display the local time, run the Clock task from
the Windows NT Run window.
4.2.4. Command Prompt Startup Options
You can start Monitor ICR and open existing reports from the DOS
command prompt. For example, in a DOS command prompt window
you can type:
C:\>monitor \icr\
This command starts Monitor ICR and opens the specified report
definition file. To open a specific report, you must provide the complete
path along with the filename.
If you want to start Monitor ICR without opening a specific report, you
can type the following command:
C:\>monitor
The monitor command can be entered in any DOS command prompt
window or in the Task List window. You can open the Task List
window by pressing C
Once Monitor ICR and the specified report are displayed on the screen,
you can open additional reports by issuing the command again. For
example, the following command opens a report from the “trkgrp”
directory:
C:\>monitor \icr\
Each time you enter the monitor command, the specified report is
opened and a new instance of Monitor ICR is started.
See also:
For information on starting Monitor ICR and opening reports from the
Windows NT File Manager or the NT Explorer, see “File Association,”
later in this chapter.
customer
TRL + ESC.
customer
\aw\custom\persvc\
\aw\custom\trkgrp\
filename.cmb
filename.cmb
4.3. Working with the Template Launcher
The Template Launcher allows you to generate a new report using the
predefined templates that come with Monitor ICR. You can also launch
any custom templates that were created with the ICR Custom Screen
Builder. Once you launch the selected templates, you can add features,
lay out the report components, and save the report as a report defini tion .
Report definitions can later be opened and modified.
4. Reporting Basics
Page 76

76 Reporting Basics
À To invoke the template launcher:
In the Monitor ICR window, click the New button. The Template
Launcher window appears:
In the Template Launcher window, you choose the options that define
how a report will be generated. These options include:
Category and Scope
Date and Time
Items
Templates
After you select options in each tab, you can click OK to launch the
report.
The Template Launcher window can be closed. To close the Template
Launcher, choose Close from the Template Launcher’s control panel or
click the Close
(X) button.
Page 77

Working with the Template Launcher 77
4.3.1. Category and Scope
Choose a report Category. You can select only one category on which to
base the report.
You can create reports on the following logical groups, or categories,
within the call center enterprise:
Agent: An agent is anyone who can answer incoming phone calls. A
peripheral agent is an agent who is associated with a particular
peripheral (ACD, PBX) in the call center enterprise. A peripheral
agent can be a member of one or more skill groups. (Some
peripheral types limit each agent to one skill group assignment.)
Application Gateway. You can report on several types of data
related to the Application Gateways set up in the system. The
Application Gateway allows the ICR to query host systems that are
running other call center applications. The ICR can then base
routing decisions on the results obtained from the query. For
Application Gateways, you can report on data such as the number of
query requests issued to a host system and the delay involved in
making queries.
Call Type. You can report on statistics for the call types defined in
the ICR system. A call type is a category of incoming calls. Calls are
categorized based on dialed number (DN), caller-entered digits
(CED), and calling line ID (CLID). In reports, you might want to
display data such as the number of calls of a certain call type that
used default routing during a specified interval.
Peripheral. You can use the Peripheral category to report on
switch-specific hardware and software status and some types of call
and agent information.
Route. For routes, you can report on data such as the number of
calls in progress, calls in queue, or calls handled. A route is value
that is returned by a routing script. This value maps to a service and
a specific target at a peripheral (for example, a service, skill group,
agent, or translation route).
4. Reporting Basics
Page 78

78 Reporting Basics
Routing Client. You can report on statistics for the different routing
clients defined in the ICR system. A routing client is an enti ty that
sends routing requests to the ICR. Routing clients typically
correspond to a subsystem within the interexchange carrier (IXC) or
to a peripheral (ACD or PBX) that is performing Post-Routing.
Within Monitor ICR, you might want to report on the maximum
delay of route responses to the routing client for a specif i ed inte rv al.
Schedule. You can generate reports that include staffing schedule
data that has been imported from a third-party workforce
management system. The G
System allows you to import schedule data and store it in the ICR
database. The exact data that appears in Monitor ICR reports
depends on the specific workforce management system you are
using with the ICR system.
Service. You can report on many types of data for services, such as
service level, number of calls abandoned, number of calls offered,
and average handle time. A service is a particular type of processing
that the caller requires. For example, in a software company’s call
center, callers having questions about installing software would be
directed to the Technical Support service.
EOTEL Workforce Management Import
Skill Group. A skill group is a collection of agents who share a
common set of skills, such as being able to handle Spanish-speaking
callers. For skill groups, you can generate reports that cover agent
activity (for example, the number of agents talking, available, or in
wrap-up for a particular skill group).
Trunk Group. A trunk group is a collection of trunks that are
associated with a single peripheral. Often, the trunks in a trunk
group are used for a common purpose. In Monitor ICR, you can
report on trunk group (and network trunk group) data, such as the
number of trunks in service, number of trunks idle, and the time
during which all trunks in a trunk group were simultaneously busy
(All Trunks Busy).
Specify the Scope of the report. These options help you to further focus
your report on specific services, skill groups, routing clients, etc.
Page 79

Working with the Template Launcher 79
The Scope options include:
Base Only. This option is available only if you select Skill Group as
the Category. Base skill groups are used to organize related
subgroups on some types of ACDs. For example, you might have
skill groups called HelpDesk.pri and HelpDesk.sec to prioritize call
routing. In a report, you can reference the .pri and .sec skill groups
directly or you can refer to the base skill group.
Enterprise. Select Enterprise to report on enterprise services or
enterprise skill groups. Enterprise services and skill groups are
collections of services and skill groups that span call centers.
Network. This option is available only if you choose Trunk Group
as the Category. Select Network to report on Network Trunk
Groups.
Peripheral. This option allows you to report on Peripheral Agents,
Peripheral Services, Peripheral Skill Groups, or Peripheral Trunk
Groups.
Array. Select Array to report on Service Arrays. A Service Array is
a collection of peripheral services across VRUs that share a common
network trunk group.
By Peripheral. This option is available only if you choose Agent as
the Category. It allows you to report on each agent currently logged
into one or more selected peripherals.
By Skill Group. This option is available only if you choose Agent
as the Category. It allows you to report on each agent currently
logged into one or more selected skill groups.
By Team. This option is available only if you choose Agent as the
Category. It allows you to display information about each agent in
one or more selected agent teams.
See also:
For more information on call center entities such as Network Trunk
Groups and Service Arrays, see Chapter 1, “Overview.”
Specify the Business Entity. A business entity is a subset of the ICR
enterprise that contains its own scripts, enterprise services, enterprise
skill groups, enterprise agent groups, and schedules.
4. Reporting Basics
Page 80

80 Reporting Basics
A business entity may represent a division within a large corporation or
a single customer within a service bureau. By default, the ICR enterprise
consists of only one business entity. If you enable partitioning, you can
define multiple business entities.
If you have only one entry under Select Business Entity, you need not
make a selection. Otherwise, select a business entity from the list.
4.3.2. Date and Time
For historical reports, choose the type of date and time you want to use
in the report:
Absolute Dates
Absolute dates allow you to enter an exact period of time with From and
To dates and times. Choose this option if you want the report to display
data from a specific time period (for example, from January 18, 1999 to
January 21, 1999).
The default From and To dates and times are from the present date at
12:00 AM (midnight) to 11:59 PM. These defaults provide data up to the
present time.
Page 81

Working with the Template Launcher 81
If you select Absolute Dates, click the down arrow in the From and To
boxes to display a calendar:
Double-click on a day in the calendar to select it. You can also click on
the left and right arrows in the calendar to display different months.
To enter times, highlight the time values and use the up and down
arrows to adjust them. Time is shown in 24-hour format. For example,
8:00 is 8:00 A.M. and 17:00 is 5:00 P.M.
If you leave the To time field set to 23:59, the report displays data up to
the current time. (Optionally, you can type dates and times directly into
the From and To boxes.)
Relative Dates
Relative dates allow you to select a predefined period of time for the
report relative to today’s date. Choose this option if, for example, you
want the report to display data for the previous day, last week, or the
current month. For example, if you choose Relative, you can choose an
option such as “Last Week” as a Date Time. This would provide data for
the last full week (that is, Sunday through Saturday).
If you select Relative Dates, click the down arrow in the From box to
display a drop-down list of relative date ranges:
Choose options such as Today, This Week, or Yesterday. Enter From
and To times by highlighting the values and using the up and down
arrows to adjust the times. If you leave the To time field set to 23:59, the
report will display data up to the current time. (Optionally, you can type
the dates and times directly into the From and To boxes.)
4. Reporting Basics
Page 82

82 Reporting Basics
The Relative options include:
Today. Provides data for the current day and the time period
entered. (The 00:00 to 23:59 defaults provide data from midnight of
the current day up to the current time.)
Yesterday. Provides data for the previous day and the time period
entered. (The 00:00 to 23:59 defaults provide data for the full day
(that is, midnight to 11:59 P.M.).
This Week. Provides data for the current week beginning on Sunday
and ending on the current day. You can specify a From time for the
first day in the week (Sunday) and a To time for the current day.
(The 00:00 to 23:59 defaults provide data from midnight on Sunday
to the current day and time.)
Last Week. Provides data for the last full week (Sunday through
Saturday). For example, if today is Sunday, the last full week would
be the previous Sunday through Saturday. You can specify a From
time for Sunday and a To time for Saturday. For example, you might
only want to include data from 8:00 A.M. on Sunday to 5:00 P.M.
on Saturday. (The 00:00 to 23:59 defaults provide data from
midnight on Sunday to Saturday at 11:59 P.M.)
This Month. Provides data from the first of the month up to the
current day. For example, if today’s date is Feb. 22, data for this
month would be Feb. 1 to Feb. 22. You can specify a From time for
the first day in the month and a To time for the current day. (The
00:00 to 23:59 defaults provide data from midnight on the first day
of the month to the current day and time.)
Last Month. Provides data for the last full month. For example, if
the current date is Feb. 8., then the last full month of data would be
Jan 1. to Jan 31. You can specify a From time for the first day of the
month and a To time for the last day. (The 00:00 to 23:59 defaults
provide data from midnight on the first day of the month to the last
day at 11:59 P.M.)
This Year. Provides data for this year from 1 Jan. to the current day.
You can specify a From time for the first day in the year and a To
time for the current day. (The 00:00 to 23:59 defaults provide data
from midnight of the first day to the current day and time.)
Last Year. Provides data for the last full year. For example, if the
current month is April 1997, the last full year would be Jan. 1, 1996
to Dec. 31, 1996. (The 00:00 to 23:59 defaults provide data from
midnight on the first day of the year to the last day at 11:59 P.M.)
Page 83

Working with the Template Launcher 83
Advantages of Using Relative Dates
The Relative Dates option provides a unique advantage over entering
specific dates and times. When you use relative dates, you do not have to
edit the report definition to change the report dates and make them
current. Every time you bring up the report, you get data for the
specified period of time relative to the present date.
For example, if you created a report and specified “Last Week” as the
relative date, you could open the report on any day and automatically see
data for last week. You could have other reports that displayed data for
yesterday or for the last month. By using reports with different relative
dates, you can see daily activity as well as activity on a weekly,
monthly, or even yearly basis.
Show Date and Time Option
Click the “Show a date and time…” check box to display the date and
time range as a label in the report.
Hourly Boundaries
When you indicate an hourly boundary such as 10:00 in a historical
report, you get data for the 9:30 to 10:00 half-hour summary interval,
not for the 10:00 to 10:30 interval. Also, the ICR central database
provides half-hour summary data only for complete intervals. Half-hour
summary data for the 10:00 to 10:30 half-hour interval is not available
until 10:30.
4.3.3. Items
A selection list on the left side of Items tab displays specific names
based on the options you chose for Category and Scope. The header of
the selection list indicates the type of items in the list. The following
example shows an example of a Peripheral Skill Groups selection list:
Choose the specific names of the services, skill groups, peripherals,
trunk groups, etc., that are going to be the subject of the report. This list
is obtained from the ICR central database. It shows the items as they are
4. Reporting Basics
Page 84

84 Reporting Basics
defined in the ICR system. You can scroll down in the list to view
additional items.
You have several options for selecting items from this list:
To select a single item, click on it.
To select more items, press the CTRL key and click on the items.
To select a range of items, click on the first item in the range. Press
S
HIFT and click on the last item in the range.
To select (or deselect) all items in the list, click the Select All
button.
4.3.4. Templates
The Templates tab contains the predefined real-time and historical
templates and any templates you created with the ICR Custom Screen
Builder. The templates you select here specify the type of report and the
types of data you want to view. For example, if you selected a peripheral
service as a report item, you could select the
“persvc01_queue_delay_sta tu s” template to view the call queue status
for that peripheral servic e.
Click on a template name in the list to select it. If necessary, use the
scroll bar to view additional templates. To select multiple templates
from one list, hold the C
If you select a single te mp la te, such as a real-time graph, the report will
contain one real-time graph component. If you select multiple
templates, for example, two real-time graphs and a historical grid, the
report will contain all three components.
Reports can have up to ten components. In other words, you can select
up to ten templates to use in a single report. This allows you to mix and
match real-time and historical templates to create a report that displays
exactly the data you want to view.
TRL key as you click on each template.
Page 85

Working with the Template Launcher 85
The template lists provide the following information about each
template:
Template name. The name of the template. Each template uses a
naming convention that includes a directory (for example, persvc,
routes, trkgrp), a number, and a brief descriptive title. This is a
EOTEL naming convention. If you create your own templates using
G
the ICR Custom Screen Builder, be sure to use a different naming
convention. Otherwise, you may risk overwriting one of the G
EOTEL
predefined report templat es.
Description. A description of the purpose of the template, including
the display style (for example, graph, pie chart, or grid) and the
types of data the template displays.
4.3.5. Launching Templates
To launch the templates, click OK. An untitled report window appears
and the Template Launcher is closed.
Typically, you launch templates after you make your final selections in
the Templates tab. However, you can launch the templates from within
any of the other Template Launcher tabs. For example, if you needed to
go back to change your Item selections, you could click OK from within
the Items tab to launch the templates.
The following example shows the Template Launcher set up for
launching two real-time templates and a historical template:
To close the Template Launcher without launching the templates, click
Cancel.
4. Reporting Basics
Page 86

86 Reporting Basics
4.4. Working with Reports
When a report first appears on the screen, it is untitled. To keep the
report, you need to save it as a report definition file. This section
describes several common tasks you perform when working with
reports:
Saving report definitions
Working with multiple-component reports
Using shuffle mode
Printing reports
Opening reports you have saved
Displaying reports at startup
Modifying report definitions
Deleting report definitions
4.4.1. Saving Report Definitions
Once you save a report definition, you can open it at any time by using
the File→Open command. Reports are saved as report definition files
with .CMB extensions.
À To save report definitions:
1. Choose File→Save, or click the Save button. The Save Report
Definition dialog box appears:
Notice that the Save Report Definition dialog box defaults to the
appropriate directory for the report. For example, if you create a
report on a peripheral service, the Report Definition dialog box
defaults to the persvc directory. The persvc directory is reserved for
storing only reports on peripheral services. Similarly, other \custom
subdirectories on the AW exist to hold certain types of reports. See
Table 7 for a list of these subdirectories.
2. Type a file name. The .CMB extension is retained.
3. Click OK. The report definition is saved.
Page 87

Working with Reports 87
If you have already saved the file, you can choose File→Save As to save
the report definition to a new file with a new name. The File→Save As
option also displays the Save Report Definition dialog box.
Note: Saved reports do not show up in the Template Launcher list of
templates. You must open report definitions by using the File→Open
command or clicking the Open button.
Table 7: Default ICR Subdirectories
Subdirectory Report Category
agteam Agent Teams
agtper Agents by Peripheral
agtskg Agents by Skill Group
apgate Application Gatewa ys
caltyp Call Types
entagt Enterpr ise Age nts
entskg Enterprise Skill Groups
1
entsvc Enterprise Services
nettrk Network Trunk Groups
peragt Peripheral Agents
periph Peripherals
perskg Peripheral Skill Groups
persvc Peripheral Services
routes Routes
rtecli Routing Clients
schimp Schedules
trkgrp Peripheral Trunk Groups
When you save a report definition, the saved version includes the
following:
The specific data elements (that is, the specific services, skill
groups, etc.) displayed in the report.
Relative or absolute dates and times for historical data.
1
Not currently implemented.
4. Reporting Basics
Page 88

88 Reporting Basics
Any thresholds you have defined.
Any drill-downs you have defined.
The names of the templates used in the report. The templates
themselves are not saved in the report. However, references to the
templates are saved. Any subsequent modifications to the templates
used by the report are reflected in the report.
The current data values are not stored in the report.
See also:
For information on saving just report data, see “Exporting Report Data,”
later in this chapter.
4.4.2. Single- and Multiple-Component Reports
Each template you select in the Template Launcher becomes a
component in the report. A report with a single component is
straightforward. You generate a single-component report by using one
template. Therefore, the report definition file references only one
template.
For example, you might generate a report for several peripheral services
using a single Calls Offered template. In this report, you might enter
Last Week as a Relative date option. You could save this report and
display it at any time. Each time you displayed the report, you would be
able to see the number of calls offered over the last week for each
peripheral service. The following report provides an example:
Single-component reports have standard window features and can be
resized, moved, minimized, and maximized.
Page 89

Working with Reports 89
You might want to create a more complex report that uses more than one
template. For example, if you launch two real-time templates and a
historical template, the report contains three components. You save the
report definition in the same way you save a single-component report
definition. However, the multiple-component report definition
references three templates instead of one. You can use up to ten
templates to create a single report.
Multiple-component reports are useful in displaying different types of
data in the same report. Real-time components display current data and
historical components display data based on a range of dates and times
that you enter.
The following example shows a report that has four components:
This example is one report, not four different reports. You can
distinguish the difference by looking at the title bars of each component.
A report component displays a template name (for example,
persvc02_calls_status). A report window displays a .CMB title in its title
bar. This report example is shown in Shuffle Mode, which is a display
mode that allows you to move and resize report components on the
screen.
A multiple-component report can be enclosed in one window or
expanded by clicking on the Maximize and Minimize buttons.
Expanding the report removes the window border and report title bar. In
addition, three options in the Window menu place a window around a
multiple-component report: Tile, Layer, and Cascade. These options are
used in arranging reports on the Monitor ICR screen.
4. Reporting Basics
Page 90

90 Reporting Basics
See also:
For more information on working with more than one report on the
screen, see “Working with Several Reports,” later in this chapter.
Multiple-component reports can be useful in displaying different types
of data in a single report. Note, however, that each component can
display only one type of data (that is, real-time or historical). This is
because a single template can retrieve data from only one source: the
local database or the central database. A single template cannot retrieve
data from both databases.
A report created with several templates, on the other hand, can display
data from both the local and central databases.
4.4.3. Shuffle Mode
When you have a report that contains more than one component, you
need a way to move and resize the components within the report
window. Shuffle mode allows you to lay out and resize report
components on the screen. The following example shows how a report
with two components first appears after it is created through the
Template Launcher. When a multiple-component report first appears, it
is automatically displayed in Shuffle Mode.
Note: Shuffle Mode is not required in a single-component report.
When you lay out report components, it helps to click the Maximize
button so you have more screen area in which to work.
Page 91

Working with Reports 91
À To lay out and resize report components:
1. Select Edit→Shuffle Mode.
2. Drag the graph, chart, and text objects and resize them. (Sometimes
a grid style report is too long to display all the data it contains. In
this case, you can use the scroll bar on the right side of the grid
window to view more data.)
3. Click inside the Title box and enter text for a title. (You can also
resize the Title window if necessary.) The title you type has nothing
to do with the report definition file name. You enter a separate file
name when you save the report.
4. When you are satisfied with the appearance of the report, choose
Edit→Shuffle Mode from the Monitor ICR menu to deselect Shuffle
Mode. The following example shows a completed two-component
report:
This is the final presentation mode. Title bars and window frames do
not appear in this mode. To move and resize the components again,
reselect Shuffle Mode.
4. Reporting Basics
Page 92

92 Reporting Basics
4.4.4. Working with Several Reports
Often, you will have more than one report displayed on the screen. You
can move between reports by clicking on a window to make it active.
The following example shows a Monitor ICR screen with three reports
displayed (one of the reports, fourcmp.cmb, is a multiple-component
report).
You can also use the options of the Window menu to move between
report windows and arrange reports on the screen.
The Windows menu provides the following options for working with
more than one report on the screen:
Tile Horizontal. Arranges all currently open windows within
Monitor ICR horizontally on the screen. The windows are sized
evenly and fit within the Monitor ICR screen without overlapping.
Tile Vertical. Arranges all currently open windows within Monitor
ICR vertically on the screen. The windows are sized evenly and fit
within the Monitor ICR screen without overlapping.
Page 93

Working with Reports 93
Layer. Stacks all windows within Monitor ICR on top of each other.
Cascade. Arranges all windows within Monitor ICR so that they
overlap, but each is still partially visible.
1, 2, 3.... Lets you quickly change to a different report window.
The other options of the Window menu are described in the on-line help
system.
4.4.5. Status Bar
If you click on a bar in a graph style report, a message appears at the
bottom left corner of the Monitor ICR window describing what the bar
represents and its current numerical value. For example:
You can use this feature to get a precise reading of a value in the graph
or to differentiate the bars if you have trouble distinguishing their colors.
4.4.6. Retrieving Historical Data
Although Monitor ICR automatically updates real-time data while you
are viewing a report, it does not automatically update the historical
half-hour data that is displayed. While a historical report is displayed,
you can click the Retrieve button to update the report with new half-hour
data that has been collected by the ICR.
For example, if you had a historical report displayed on the screen and
you left your desk for an hour or so, you would need to click the
Retrieve button when you returned in order to display the latest
half-hour data. Monitor ICR retrieves the latest half-hour data from the
ICR central database and updates the data displayed in the report.
4.4.7. Pausing the Screen Refresh
You can pause the real-time refreshing of the Monitor ICR screen. The
Pause button allows you to prevent real-time reports from being
continually refreshed while you are working in Monitor ICR. This
feature is useful in several ways. For example, say you are viewing a
real-time graph and you notice that an unusual number of calls are being
offered to a particular service. You might want to “freeze” the real-time
graph in its current state in order to print it, or you might want to simply
keep the graph displayed the way it is while you further investigate the
condition.
4. Reporting Basics
Page 94

94 Reporting Basics
You might also want to pause screen refreshing while you are working
with the Definition Editor, the Threshold Editor, or the DrillDown
Editor. This ensures that the function you are working with (for
example, the Definition Editor) is not interrupted by the real-time
refreshing of the screen.
To pause the real-time refreshing of the screen, click the Pause button in
the Monitor ICR tool bar. To enable the real-time refreshing of the
screen, click the Resume button.
See also:
For more information on the Threshold Editor and the DrillDown Editor,
see Chapter 4, “Setting Thresholds and Drill-Downs.”
4.5. Reconnecting to the Central Database
If the Admin Workstation loses its connection to the ICR central
database or the Distributor AW’s local database, a dialog box appears on
the screen to inform you that the connection has been lost. If this
happens, choose File→Reconnect to ree sta bl ish the Admin
Workstation’s connection to the ICR central or Distributor AW local
database. At all other times, the Reconnect option is not available.
The Admin Workstation can lose its connection to the central or local
database if there are problems with the network or with the central
controller CallRouter or Logger. The Reconnect option allows you to
quickly connect to the databases without having to restart Monitor ICR.
4.6. Printer Setup
Before you print reports with Monitor ICR, check to see which printer
you are using. You may want to use a special printer for Monitor ICR
reports such as a high-resolution or color printer.
In addition, you should set up the printer (through Monitor ICR) to use
landscape paper orientation rather than portrait orientation. Although
you can use portrait paper orientation to print reports, reports with
several columns of data may not fit properly on the pages.
When you use landscape printing, Monitor ICR repeats titles and dates
on each page and inserts page breaks where appropriate. Often, several
pages are required to print lengthy, grid-style historical reports.
Graph-style reports typically require only one page; however, you
should still use landscape orientation to print graphs. This ensures that
even wide graphs print properly. In general, landscape paper orientation
provides a more consistent and neater format than portrait orientation.
Note: Once you make these changes to the printer setup, they are in effect for
every report generated in Monitor ICR (until you change the settings
again).
Page 95

Printer Setup 95
À To specify the report printer:
1. Choose File→Printer Setup. The Printer Setup dialog box appears.
2. Click on a printer to use for reports and perform one of the
following steps:
Click on OK to save the printer settings and close the Printer
Setup dialog box.
Click the Setup button to specify landscape printing for reports.
À To set up reports for landscape printing:
1. In the Page Setup tab, select the Landscape option:
2. Click OK to save your changes and dismiss the Document Properties
dialog box.
3. Click OK again to close the Printer Setup dialog box.
You can also use the Document Properties window to choose form type,
color, or black and white printing, and number of copies. To get more
information on printing options, click the Help button in the Document
Properties box.
4. Reporting Basics
Page 96

96 Reporting Basics
4.7. Printing Reports
You can print reports that are displayed on the Monitor ICR screen.
First, display the report and make it the active (current) window. Then
choose File→Print from the Monitor ICR menu or click the Print button
in the toolbar. The report is sent to the printer. A dialog box appears to
inform you that the report is printing.
Note: Print reports using landscape paper orientation to ensure that all data and
graphic elements fit properly on the pages. See the previous section,
“Printer Setup,” for information on setting up reports for landscape
printing.
You can also print reports that you have not yet saved. For example,
when you create a report, it remains untitled until you save it as a report
definition file. You might have one or more untitled report windows
displayed on the screen. To print an untitled report, make it the active
window and choose File→Print.
4.7.1. Printing Multiple-Component Reports
When you print a multiple-component report, Monitor ICR selects one
report component at a time and sends it to the printer. You can see the
order in which the components will print by displaying the report and
choosing Edit→Definition to view the report definition. The order of
printing follows the top down order of the templates selected in the
report definition.
To print reports with multiple com ponents, fo llow the same procedure as
in the previous section, “Printing Reports.” A new printing dialog box
appears for each report component sent to the printer. Monitor ICR runs
through each component in the report until the entire report is printed.
4.8. Opening Saved Reports
After you have saved a report definition, you can invoke it at any time
by choosing the Open command from the File menu or by clicking on
the Open button.
Note: You do not launch saved reports through the Template Launcher.
Page 97

File Association 97
À To open a report:
1. In the Monitor ICR window, choose File→Open, or click the Open
button. The Select Report Definition dialog box appears.
Only report definition files appear in the Select Report Definition
dialog box. You do not see the templates, although they are also
stored in these directories. (To open templates, use the ICR Custom
Screen Builder.)
2. In the Folders (or Directories) list, double-click the directory where
you saved the report.
By default, reports are saved in subdirectories under icr\aw\custom.
The specific subdirectory depends on the data that is included in the
report. See Table 7, earlier in this chapter, for a list of the custom
subdirectories and their contents.
3. Choose the file name (for example, MYREPORT.CMB) from the
list on the left side of the dialog box.
4. Click OK. The report appears in the Monitor ICR window.
4.9. File Association
The most common way to open report definition files is to click the
Open button from within Monitor ICR and then choose a report file from
the Select Report Definition dialog box. However, you might want to
quickly open a specific report without having to start Monitor ICR and
go through the menu selections. It might be easier to simply double-click
on a report definition file name from within NT Explorer to start
Monitor ICR and open the report, especially when Monitor ICR is not
yet running.
File association makes it possible to associate a file’s file name
extension with an application. For example, once you associate the
.CMB extension with the Monitor ICR application, you can double-click
any .CMB report file from within Windows NT Explorer to start
Monitor ICR and open the report. Once Monitor ICR is started you can
double-click on other .CMB files to open those reports. Additional
reports are opened in the currently active Monitor ICR application.
Monitor ICR is not started again.
4. Reporting Basics
Page 98

98 Reporting Basics
À To apply file association through NT Explorer:
1. Start the Windows NT Explorer program.
2. Change to the ICR’s \custom directory.
3. Open one of the custom subdirectories (for example, persvc), and
select (highlight) a .CMB report definition.
4. Press
appears.
5. Choose Open With. The Open With dialog box appears with a list of
standard Windows NT executables.
6. Click Other. A secondary Open With dialog box appears, prompting
you to look in a directory for a specific executable to apply.
7. Change to the \icr\bin directory.
8. Within the \icr\bin directory, find “monitor.exe.”
9. Select monitor.exe and click Open. You are returned to the Open
With dialog box.
10. Check the option, “Always use this program to open this type of
file.”
11. Click OK to associate .CMB files with Monitor ICR. You can now
open reports by double-clicking on .CMB file names.
SHIFT and click the right mouse button. A pop-up menu
4.10. Saving Your Workspace
To maintain continuity between Monitor ICR sessions, you might
choose to save your workspace automatically when you exit. This means
that the state of your workspace at the end of the session will be restored
when you next start Monitor ICR.
You can also set up Monitor ICR to always give you the same initial
workspace. For example, you might want to see a certain Calls Offered
pie chart each time you start Monitor ICR. To do this, you set up your
workspace once and save it manually. Monitor ICR displays the same
initial workspace until you change it again.
Note: Only reports that have been saved can be displayed at startup.
À To automatically save your workspace when you exit:
Choose Option→Save Settings on Exit from the main menu.
À To manually save your workspace:
1. Set up your workspace. For example, you might open one or more
reports and arrange them on the screen.
2. When you are satisfied with the appearance of the screen, choose
Options→Save Setting s Now . Thi s saves the cur ren t work spa ce
settings.
Page 99

Note: Before you exit from Monitor ICR, make sure that
Options→Save Settings on Exit is deselected. Otherwise, the
settings you have saved will be overwritten by the settings in
place when you exit.
To test the settings, choose File→Exit to end the current Monitor ICR
session. Double-click on the Monitor ICR icon to restart the application.
You can easily change the start-up display if you want to return to
default mode or if you want to display different reports.
À To return to default display at startup:
1. Start Monitor ICR.
2. Use the File→Close command to close any open reports. (You can
also close the template launcher window if it is displayed.)
3. Choose Options→Save Settings Now.
4. Make sure that Options→Save Settings on Exit is deselected.
4.11. Modifying Report Definitions
You can edit report definitions to choose additional items to include in
the report, to change dates and times, or to select different templates to
use in the report.
The fields of the Definition Editor match those of the Template
Launcher. However, in the Definition Editor you are not allowed to
change the Category or Scope of a report. The Definition Editor is not
used to launch reports, but rather to change existing reports. If you need
to change the Category and Scope of a report, use the Template
Launcher to create a new report.
Note: If you are modifying a real-time report, you may want to click the Pause
button to pause the real-time refreshing of the screen. This ensures that
the continual refreshing does not interrupt your work with the Definition
Editor.
Modifying Report Definitions 99
4. Reporting Basics
Page 100

100 Reporting Basics
À To modify a report definition:
1. With a report displayed, choose Edit→Definition. The Definition
Editor appears.
2. Make the changes you want, such as choosing different Items
(services, skill groups, etc.), or entering different dates and times.
Note: You cannot make changes to the Category and Scope of the
3. Click OK to save your changes. The changes take effect
immediately. For example, if you chose another template to include
in the report, that template is launched and appears in the report.
You must save the report in order to preserve the changes you made
to the report definition.
À To save changes in the report definition:
Choose File→Save to save the changes in the same report definition file.
Optionally, you can choose File→Save As to save the report as a new
report definition file. You are required to enter a new file name.
report. If you want to change the Category and Scope of a
report, you should generate a new report through the template
launcher.
4.12. Deleting Report Definitions
If you want to delete a report definition, you need to know the report file
name and the directory in which it is stored. By default, reports are
stored in subdirectories under the \custom directory. The specific
subdirectory depends on the data elements included in the report. See
Table 7, earlier in this chapter, for more information on ICR custom
subdirectories.
Warning: Be sure that you want to delete the report definition file. The DEL
command is irreversible.
 Loading...