

Page 1

AN257
Application Note
MEASURING THE PERFORMANCE OF POWER SUPPLY
REJECTION FEEDBACK AS USED IN CS44800/44600
DIGITAL CLASS-D PWM AMPLIFIERS
by Randy Boudreaux and Sean Davis
1. Introduction
Most currently available digital Class-D amplifiers are termed “open-loop” systems since no
mechanisms have been developed to provide real-time feedback to reject unwanted tones (ripple) generated by the power supply, or the noise coupled onto the power rail due to ripple currents flowing through large decoupling capacitors. Since the high sides of the power MOSFETs
are connected directly to the power supply rail, all tones and associated harmonics generated on
the power supply rail are coupled onto the output of the audio amplifier channel.
Costly detection and feedback circuitry must be added to the power supply to account for output
voltage variations due to load current fluctuations. In addition, the output voltage rail must be designed to remain stable as the input AC voltage deviates from the nominal 120 V. Any drift from
the nominal design point will be directly reflected in the output DC voltage rail causing audible
volume changes during playback. To overcome these inherent limitations of conventional “openloop” Class-D amplifiers, tightly regulated power supplies are commonly employed.
Utilizing the integrated PSR Feedback, it is shown that a digital Class-D PWM amplifier implemented with the CS44800/44600 PWM Controller is now an effective power supply “closed-loop”
system by employing real-time feedback of the voltage rail. Real-time voltage feedback now enables this digital Class-D PWM amplifier to operate with any type of power supply, with any measure of output regulation. To demonstrate the rejection/compensation for the above-mentioned
deficiencies, a procedure is described below that uses the CDB44800 development board to emulate a system which contains a large amount of tones and harmonics on the power supply rail.
Power supply costs can now be reduced and other power supply technologies used. “Open-loop”
digital Class-D PWM amplifiers prohibit the use of traditional low-cost, dependable, low-EMI-radiated-noise, unregulated, linear power supplies. Published application notes for current ClassD amplifier systems on the market recommend the use of switch mode power supplies with very
low output voltage ripple and tight regulation for both load and line variations, in conjunction with
large, expensive, low-ESR electrolytic capacitors. The CS44800/44600 PSR circuitry eliminates
these dependencies and allows for inexpensive power supply alternatives to be used.
www.cirrus.com
Copyright © Cirrus Logic, Inc. 2005
(All Rights Reserved)
FEB ‘05
AN257REV1
1
Page 2
AN257
2. PSR Feedback Measurement Procedure
2.1 Power Supply Rejection Performance Test
The test platform used for the performance measurement plots below consists of the CDB44800
(half-bridge channels), with Vpower = +40 V, and a resistive load of 6 Ω. Channel A of the input
audio stream was set to channel 3 on the development board and channel B was set to channel
8.
1) Use an unregulated power supply if available. The PSR rejection performance can be seen using any
type of power supply, however the actual amount of rejection due to PSR feedback will be more visible
with a lightly regulated power supply than with a highly regulated power supply. PSR calibration
should be done before any of the channels are enabled so an accurate representation of the nominal
voltage rail can be captured. See the CS44800/600 datasheet for the PSR calibration routine.
2) Set up the board under test for 2-channel operation with 6priate script file such that amplified audio is playing from the board and PSR is calibrated. Verify that
PSR Feedback is disabled (CS44800/44600 bit 5 in register 34h set to 0b). The two channels being
used should be in separate power packages, such as channel 3 and channel 8 on the CDB44800, to
minimize the effects of switching noise.
3) Using a digital audio source (such as an Audio Precision), set channel A to be a
wave and set channel B to be a 0-dB, 60-Hz sine wave. Channel B is being used to emulate the harmonics generated by an inexpensive, poorly regulated power supply. The 60-Hz switching output of
channel B will generate a corresponding ripple voltage on the rail, which will couple into the channel
under test, in this case
channel A.
Ω resistive loads and execute the appro-
-1-dBFS, 1-kHz sine
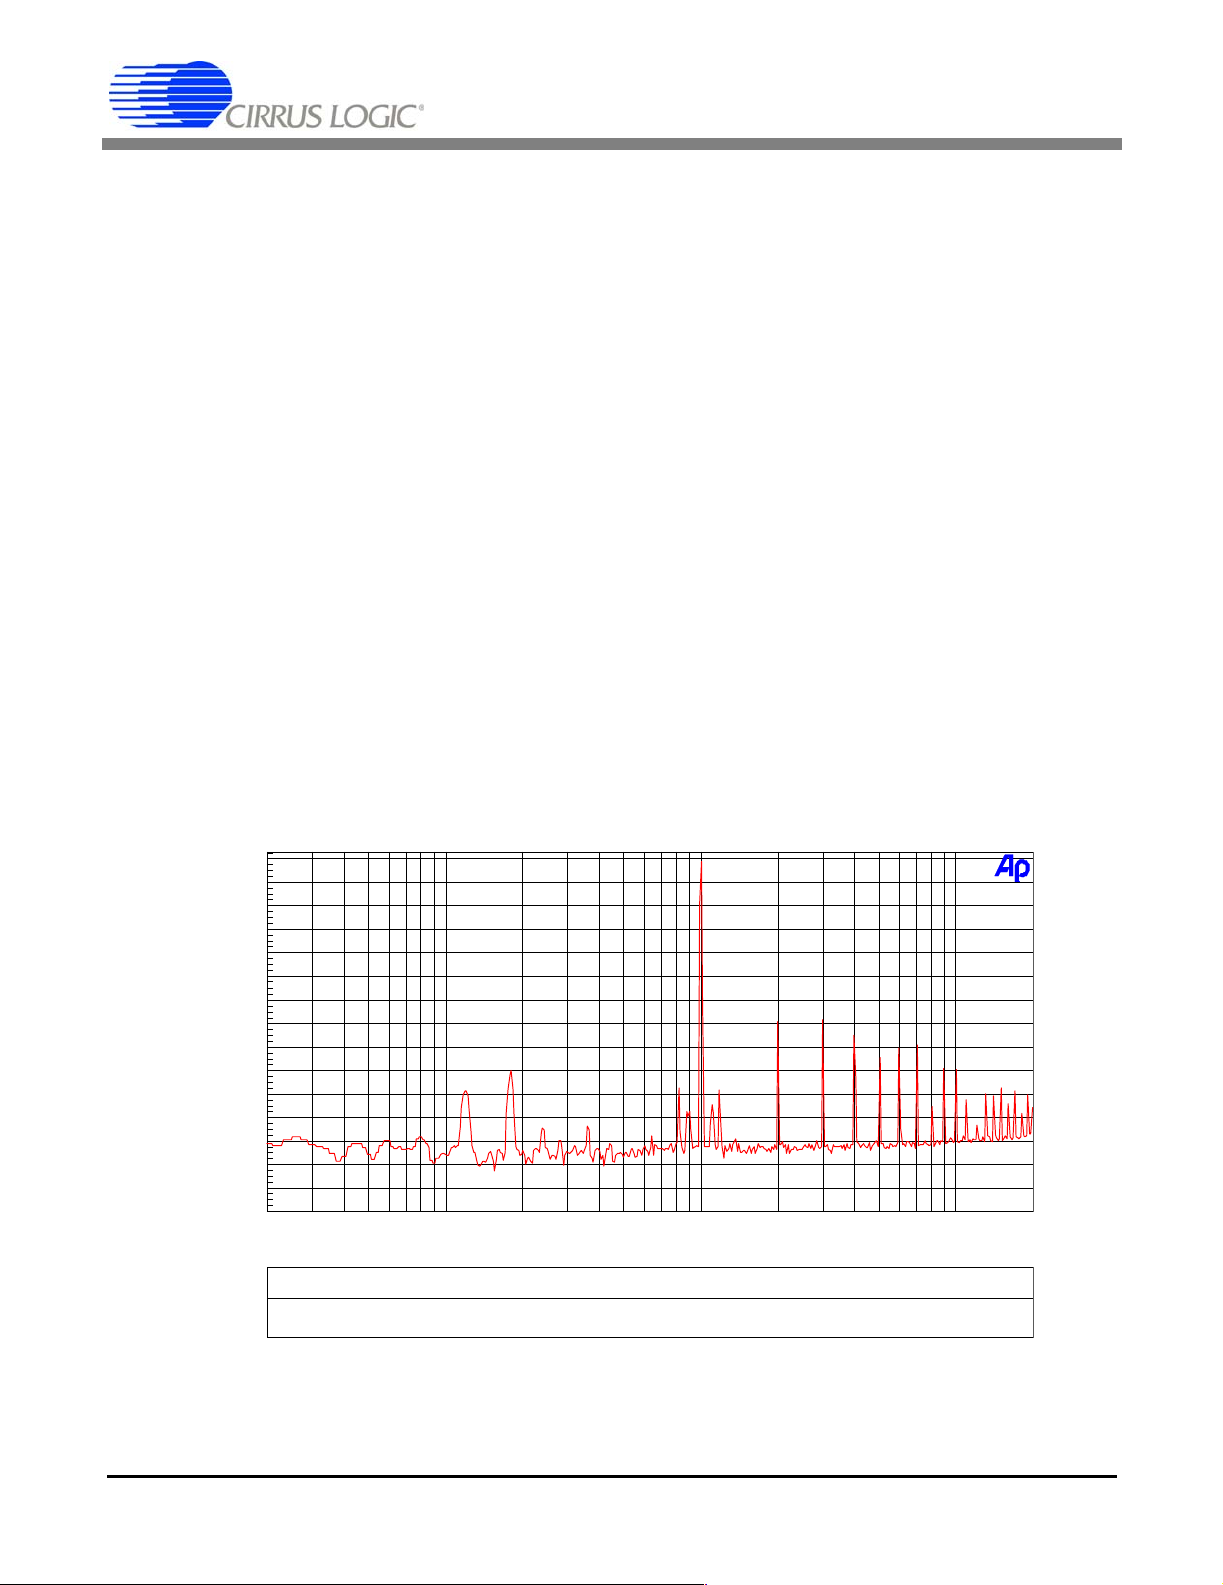
4) With only the channel A PWM output turned on, use an analog analyzer (such as an Audio Precision)
and take an FFT of amplitude versus frequency for channel A. The 1-kHz tone should be present with
an amplitude of
d
B
r
A
-1 dBFS. Figure 1 shows the results with only channel A enabled as a baseline.
+0
-10
-20
-30
-40
-50
-60
-70
-80
-90
-100
-110
-120
-130
-140
-150
20 20k50 100 200 500 1k 2k 5k 10k
Hz
ColorSweep Trace Line St y l e Thick Data Axi s Comment
1 1 Red S ol i d 1 Fft.Ch.1 Am pl Left Channel B = disabl ed, P SR feedback di sabled
Figure 1. FFT Amplitude vs. Frequency,
Channel A = 1 kHz,
-1 dBFS, Channel B = disabled, PSR feedback disabled
2 AN257REV1
Page 3
AN257
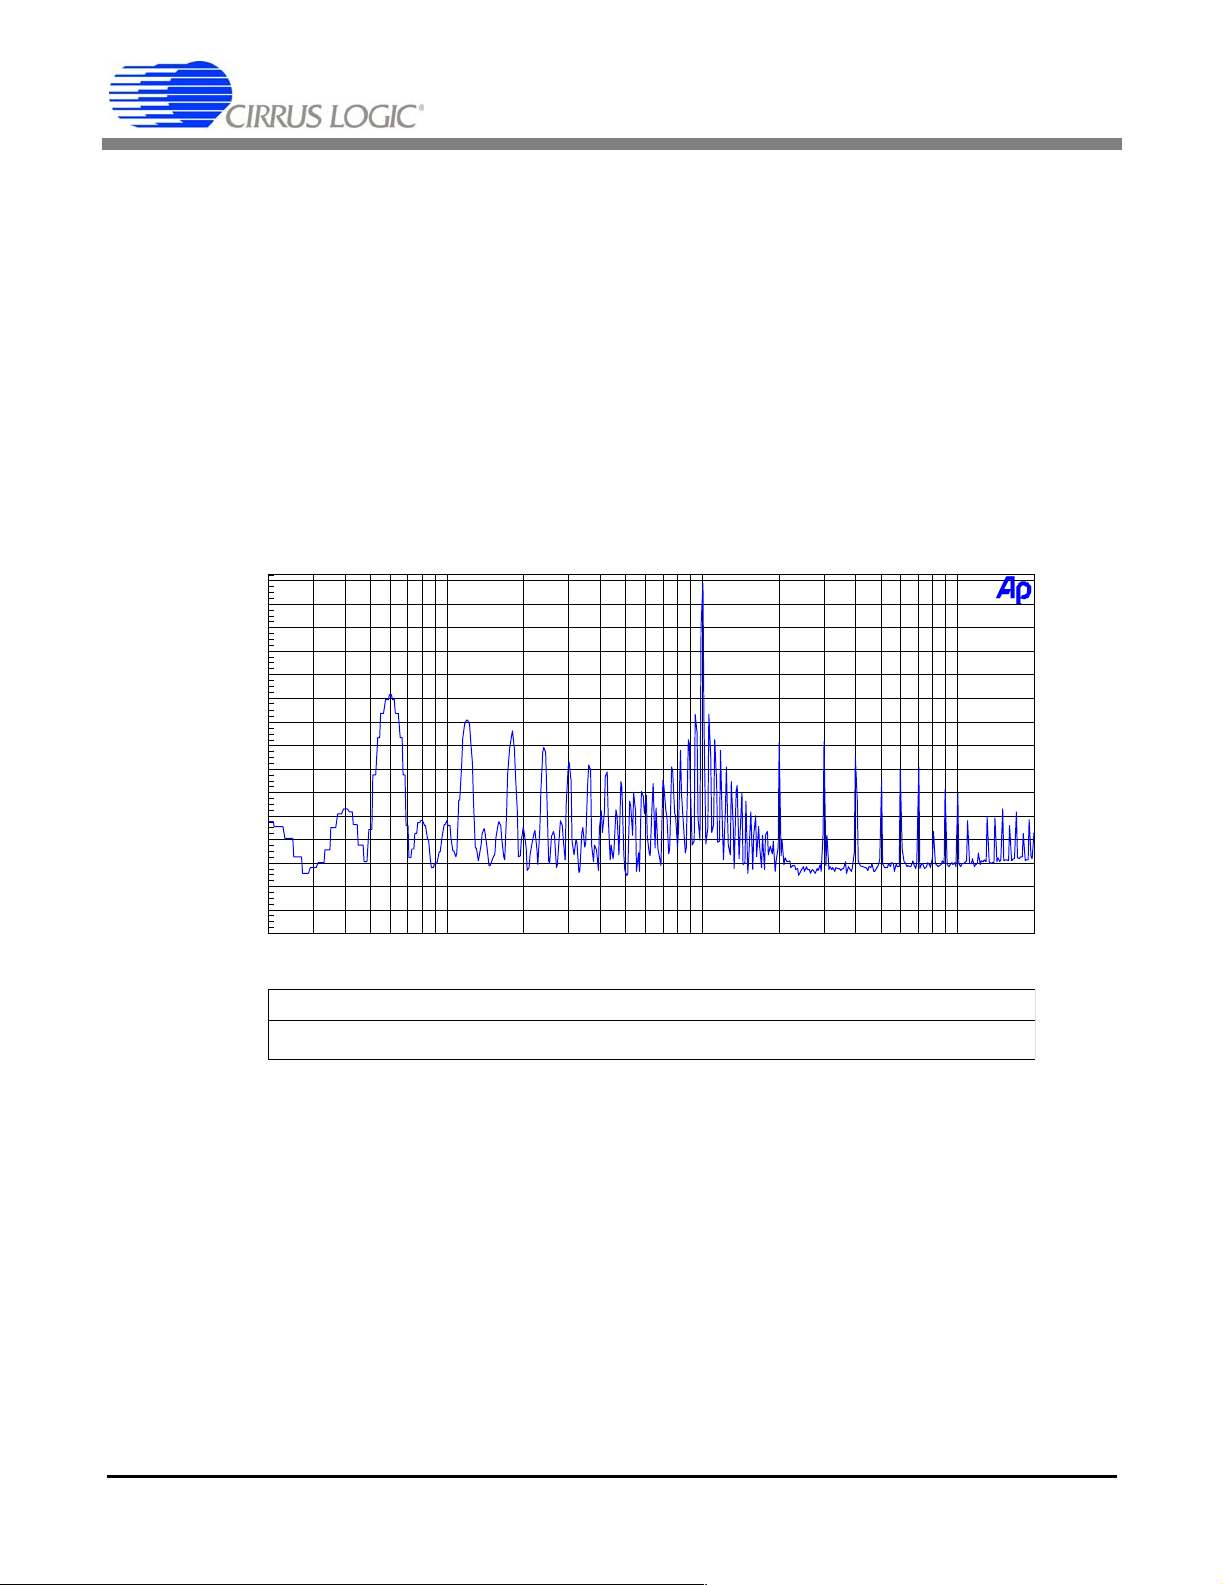
5) Turn on the channel B PWM output and take an FFT of amplitude versus frequency for channel A. The
1-kHz tone should be present with an amplitude of
60-Hz tone and associated harmonics. Figure 2 shows the FFT of channel A with both channel A and
channel B PWM outputs enabled. The original 1-kHz tone is shown at
Hz tone from channel B shown at
-50 dBFS. The full scale, 60 Hz tone being played back on
channel B’s MOSFET devices causes an associated 60-Hz ripple current on the power voltage rail.
This ripple current, along with the capacitor’s equivalent series resistance (ESR), causes the discrete
tones on the power supply rail. Notice the 2nd, 3rd, 4th, 5th, etc. harmonics at 120 Hz, 180 Hz,
240 Hz, 300 Hz, etc. due to the system non-linearities. Because all of these tones are being modulated onto channel A’s audio output by the power MOSFETs switching at a 384-kHz rate, these discrete
tones will also be modulated onto the 1-kHz tone being played back (see tones grouped around
1 kHz). These modulated tones appear as symmetrical, equidistant tones on each side of the 1-kHz
tone. The amplitude and frequency of each modulated tone is easily calculated using standard FM
modulation formulas.
+0
-10
-20
-30
-40
-50
-60
d
B
-70
r
-80
A
-90
-100
-110
-120
-130
-140
-150
20 20k50 100 200 500 1k 2k 5k 10k
-1 dBFS (with modulated side tones) along with a
-1-dBFS, with the coupled 60-
Hz
ColorSweep Trace Line St y l e Thick Data Axi s Comment
2 1 Blue Solid -1 Fft.Ch. 1 A m pl Left Channel B = 60 Hz , 0 dB F S , PSR feedbac k di s abl ed
Figure 2. FFT Amplitude vs. Frequency,
Channel A = 1 kHz,
-1 dBFS, Channel B = 60 Hz, 0 dBFS, PSR feedback disabled
6) Enable PSR Feedback (CS44800/44600 bit 5 in register 34h set to 1b). Take an FFT of amplitude versus frequency on the output of channel A. The 1-kHz tone should be present with an amplitude of
-1 dBFS, however the 60-Hz tone and the modulated side tones will be greatly diminished in ampli-
tude. Figure 3 shows the results of having both channels on and PSR feedback enabled.
AN257REV1 3
Page 4

+0
-10
-20
-30
-40
-50
-60
d
B
-70
r
-80
A
-90
-100
-110
-120
-130
-140
-150
20 20k50 100 200 500 1k 2k 5k 10k
Hz
ColorSweep Trace Line Style Thick Dat a Axis Comm ent
3 1 Magenta Sol i d -1 Fft . Ch. 1 A m pl Left Channel B = 60 Hz , 0 dBFS, P S R feedbac k enabl ed
AN257
Figure 3. FFT Amplitude vs. Frequency,
Channel A = 1 kHz,
-1 dBFS, Channel B = 60 Hz, 0 dBFS, PSR feedback enabled
Figure 4 shows the results from Figure 2 and Figure 3 as an overlay.
+0
-20
-40
-60
d
B
r
-80
A
-100
-120
-140
20 20k50 100 200 500 1k 2k 5k 10k
Hz
ColorSweep Trace Line Style Thick Dat a Axis Comm ent
2 1 Blue Solid -1 Fft . Ch. 1 A m pl Left Channel B = 60 Hz , 0 dBFS, P SR feedback disabled
3 1 Magenta Sol i d -1 Fft . Ch. 1 A m pl Left Channel B = 60 Hz , 0 dBFS, P S R feedbac k enabl ed
Figure 4. FFT Amplitude vs. Frequency,
Figure 2 & Figure 3 overlay
4 AN257REV1
Page 5

AN257
7) To show the effect of this noise modulation on low-level audio signals, set the amplitude of the 1kHz
tone on channel A to
tests as above. The blue trace is the FFT of channel A’s output with PSR turned off. The magenta
trace represents channel A’s output with PSR feedback enabled.
+0
-20
-40
-60
d
B
r
-80
A
-100
-120
-140
20 20k50 100 200 500 1k 2k 5k 10k
-60 dBFS. Channel B remains at 60 Hz, 0 dBfs signal. Figure 5 shows the same
Hz
ColorSweep Trace Line S t yle Thick Data Axis Comm ent
2 1 Blue Solid 1 Fft.Ch.1 Am pl Left Channel B = 60 Hz , 0 dBFS , P S R feedbac k di sabled
3 1 Magenta Sol i d 1 Fft.Ch. 1 A m pl Left Channel B = 60 Hz , 0 dB F S , PSR feedback enabled
Figure 5. FFT Amplitude vs. Frequency,
Channel A = 1 kHz,
-60 dBFS, Channel B = 60 Hz, 0 dBFS, PSR feedback enabled/disabled
2.2 PSR Feedback Performance Versus Frequency
The following graph in Figure 6 shows the amount of rejection that PSR Feedback will provide
versus the frequency of the power supply noise (typically in the low-frequency range). The frequency on channel B, which induces the ripple voltage on the channel under test (channel A), is
varied from 20 Hz to 20 kHz. The plot represents the amplitude of the coupled noise from the
power supply rail onto channel A vs. the frequency of the coupled noise.
Zero data is sent to channel A, which is equivalent to muting the amplifier output (not
MUTE50/50). Channel A’s output is not turned off, but rather switches at a modulated nominal
50% duty cycle at a 384-kHz rate. The red trace in the graph represents the amount of ripple voltage which is coupled onto channel A’s output from the 0-dBFS signal being played back on channel B. Since the output of channel A continues to switch, modulation with another channel will
still occur. The natural decay in the amount of ripple voltage present on channel A’s output at
higher frequencies is due to the frequency-dependant reactance of the large, bulk decoupling
electrolytic capacitor.
AN257REV1 5
Page 6

+0
-20
-40
-60
d
B
r
-80
A
-100
-120
-140
20 20k50 100 200 500 1k 2k 5k 10k
Hz
ColorSweep Trace Line S t yle Thick Data A xis Comm ent
1 1 Red S oli d 1 Anlr.Am pl Left PSR feedback disabl ed
2 1 Blue Solid 1 Anlr. A m pl Left PSR feedbac k enabl ed
AN257
Figure 6. PSR Disabled vs. PSR Enabled
Channel A = “on”, but muted (zero data), sweep Channel B frequency @ 0 dBFS
2.3 Power Supply Droop Test
To demonstration how PSR Feedback can compensate for droop in the power supply rail, perform the following using the CDB44800:
1) Using the setup from above, with PSR calibrated and enabled, and Vpower set to +40 V, playback a
1-kHz tone with an amplitude of approximately 10 V peak-to-peak (or any amplitude desired). Use one
channel of an oscilloscope to monitor the sine wave output of channel A. Use another channel of the
oscilloscope to monitor the DC voltage on Vpower.
2) Vary Vpower down to +30 V. Even though the Vpower supply will drop to +30 V from +40 V, the peakto-peak level of the sine wave output from channel A will remain constant.
This test shows how PSR Feedback will maintain the amplified audio level even if the power supply drops in voltage (common when low-frequency audio is played). The maximum amount of
voltage rail droop compensation is limited to 10% of the nominal rail when playing back a fullscale signal. As the signal being played back is reduced in amplitude, more droop in the voltage
rail can be compensated.
6 AN257REV1
Page 7

3. Revision History
Release Date Changes
Rev 1 Febuary 2005 Initial Release
Table 1. Revision History
AN257
Contacting Cirrus Logic Support
For all product questions and inquiries contact a Cirrus Logic Sales Representative.
To find the one nearest to you go to
IMPORTANT NOTICE
"Advance" product information describes products that are in development and subject to development changes. Cirrus Logic, Inc. and its subsidiaries ("Cirrus")
believe that the information contained in this document is accurate and reliable. However, the information is subject to change without notice and is provided "AS IS"
without warranty of any kind (express or implied). Customers are advised to obtain the latest version of relevant information to verify, before placing orders, that
information being relied on is current and complete. All products are sold subject to the terms and conditions of sale supplied at the time of order acknowledgment,
including those pertaining to warranty, indemnification, and limitation of liability. No responsibility is assumed by Cirrus for the use of this information, including use
of this information as the bas is for manufact ure or sale of any items , or for infr ingemen t of pat ents o r othe r rights of thi rd pa rties . This doc ument is th e proper ty of
Cirrus and by furnishing this information, Cirru s gr an ts n o li cen se, express or implied under any patents, mask work ri gh ts, copyrights, trademarks, trade secrets or
other intellectual pr oper t y ri g hts . Ci rr us owns the copy r i ght s as so cia te d wit h t he in f ormation contained herein and give s cons ent for copies to be made of the inf o rmation only for use within your organization with respect to Cirrus integrated circuits or other products of Cirrus. This consent does not extend to other copying such
as copying for general distribution, advertising or promotional purposes, or for creating any work for resale.
CERTAIN APPLICATIONS USING SEMICONDUCTOR PRODUCTS MAY INVOLVE POTENTIAL RISKS OF DEATH, PERSONAL INJURY, OR SEVERE PROPERTY OR ENVIRONMENTAL DAMAGE (“CRITICAL APPLICATIONS”). CIRRUS PRODUCTS ARE NOT DESIGNED, AUTHORIZED OR WARRANTED FOR USE
IN AIRCRAFT SYSTEMS, MILITARY APPLICATIONS, PRODUCTS SURGICALLY IMPLANTED INTO THE BODY, AUTOMOTIVE SAFETY OR SECURITY DEVICES, LIFE SUPPORT PRODUCTS OR OTHER CRITICAL APPLICATIONS. INCLUSION OF CIRRUS PRODUCTS IN SUCH APPLICATIONS IS UNDERSTOOD TO BE FULLY AT THE CUSTOMER’S RISK AND CIRRUS DISCLAIMS AND MAKES NO WARRANTY, EXPRESS, STATUTORY OR IMPLIED,
INCLUDING THE IMPLIED WARRANTIES OF MERCHANTABILITY AND FITNESS FOR PARTICULAR PURPOSE, WITH REGARD TO ANY CIRRUS PRODUCT
THAT IS USED IN SUCH A MANNER. IF THE CUSTOMER OR CUSTOMER’S CUSTOMER USES OR PERMITS THE USE OF CIRRUS PRODUCTS IN CRITICAL
APPLICATIONS, CUSTOMER AGREES, BY SUCH USE, TO FULLY I NDEMNIF Y CIRRUS, ITS OF FICERS, DIRE CTORS , EMPLOY EES, DIS TRIBUTO RS AND
OTHER AGENTS FROM ANY AND ALL LIABILITY, INCLUDING ATTORNEYS’ FEES AND COSTS, THAT MAY RESULT FROM OR ARISE IN CONNECTION
WITH THESE USES.
Cirrus Logic, Cirrus, and the Cirrus Logic logo designs are trademarks of Cirrus Logic, Inc. All other brand and product names in this document may be trademarks
or service marks of their respective owners.
AN257REV1 7
www.cirrus.com
 Loading...