

Page 1

UV-3 SERIES SPECTROPHOTOMETER
Contents
SAFETY ………………………………………………………………….……… 1
General ………………………………………………………………………. 1
Electrical …………………………………………………………………….. 1
Warning ………………………………………………………………………… 1
Working Principle ………………………………………………………… 2
Unpacking Instructions …………………………………………………… 2
Specifications ……………………………………………..……………… 3
Installation …………………………………………………………………… 3
Operation ………………………………………………………..……………… 4
Prepare the Spectrophotometer ………………………………………… 4
Description of keys ………… …………………………………… 5
Turn on spectrophotometer … …………………………………………… 6
Basic operation…………………………………………………………… 7
Analyse Sample …………………………………………………………… 12
Basic Mode …………………………………………………………….. 12
Quantitative ….……………………………………………………….. 14
WL Scan ………………………………………………………………... 20
Kinetics …….………………………………………………………………… 25
DNA/Protein ……………………………………………………………… 28
Multi Wavelength ………………………………………………………….. 31
Utility ……………………………………………………………………… 33
Appendix A ………………………………………………….………… 41
Appendix B ………………………………………………….………… 42
Appendix C ………………………………………………….………… 44
Lamp replacement………………………………………………….…… 44
Replace W lamp………………………………………………….……44
Replace D2 lamp………………………………………………….… 45
Battery replacement………………………………………………….…… 46
Trouble shooting………………………………………………….………… 47
Page 2
UV-3 SERIES SPECTROPHOTOMETER
Safety:
The safety statements in this manual comply with the requirements of the
HEALTH AND SAFETY AT WORK ACT, 1974.
Read the following before installing and using the instrument and its
accessories. The ChromTech UV-3 SERIES should be operated by
appropriate laboratory technicians.
General:
The apparatus described in this manual is designed to be used by properly
trained personnel in a suitable equipped laboratory. For the correct and safe
use of this apparatus it is essential that laboratory personnel follow generally
accepted safe procedures in addition to the safety precautions called for in this
manual.
The covers on this instrument may be removed for servicing. However, the
inside of the power supply unit is a hazardous area and its cover should not be
removed under any circumstances. There are no serviceable components
inside this power supply unit. For ChromTech UV-3 SERIES, avoid touching
the high voltage power supply at all times.
Some of the chemicals used in spectrophotometry are corrosive and/or
inflammable and samples may be radioactive, toxic, or potentially infective.
Care should be taken to follow the normal laboratory procedures for handling
chemicals and samples.
Electrical:
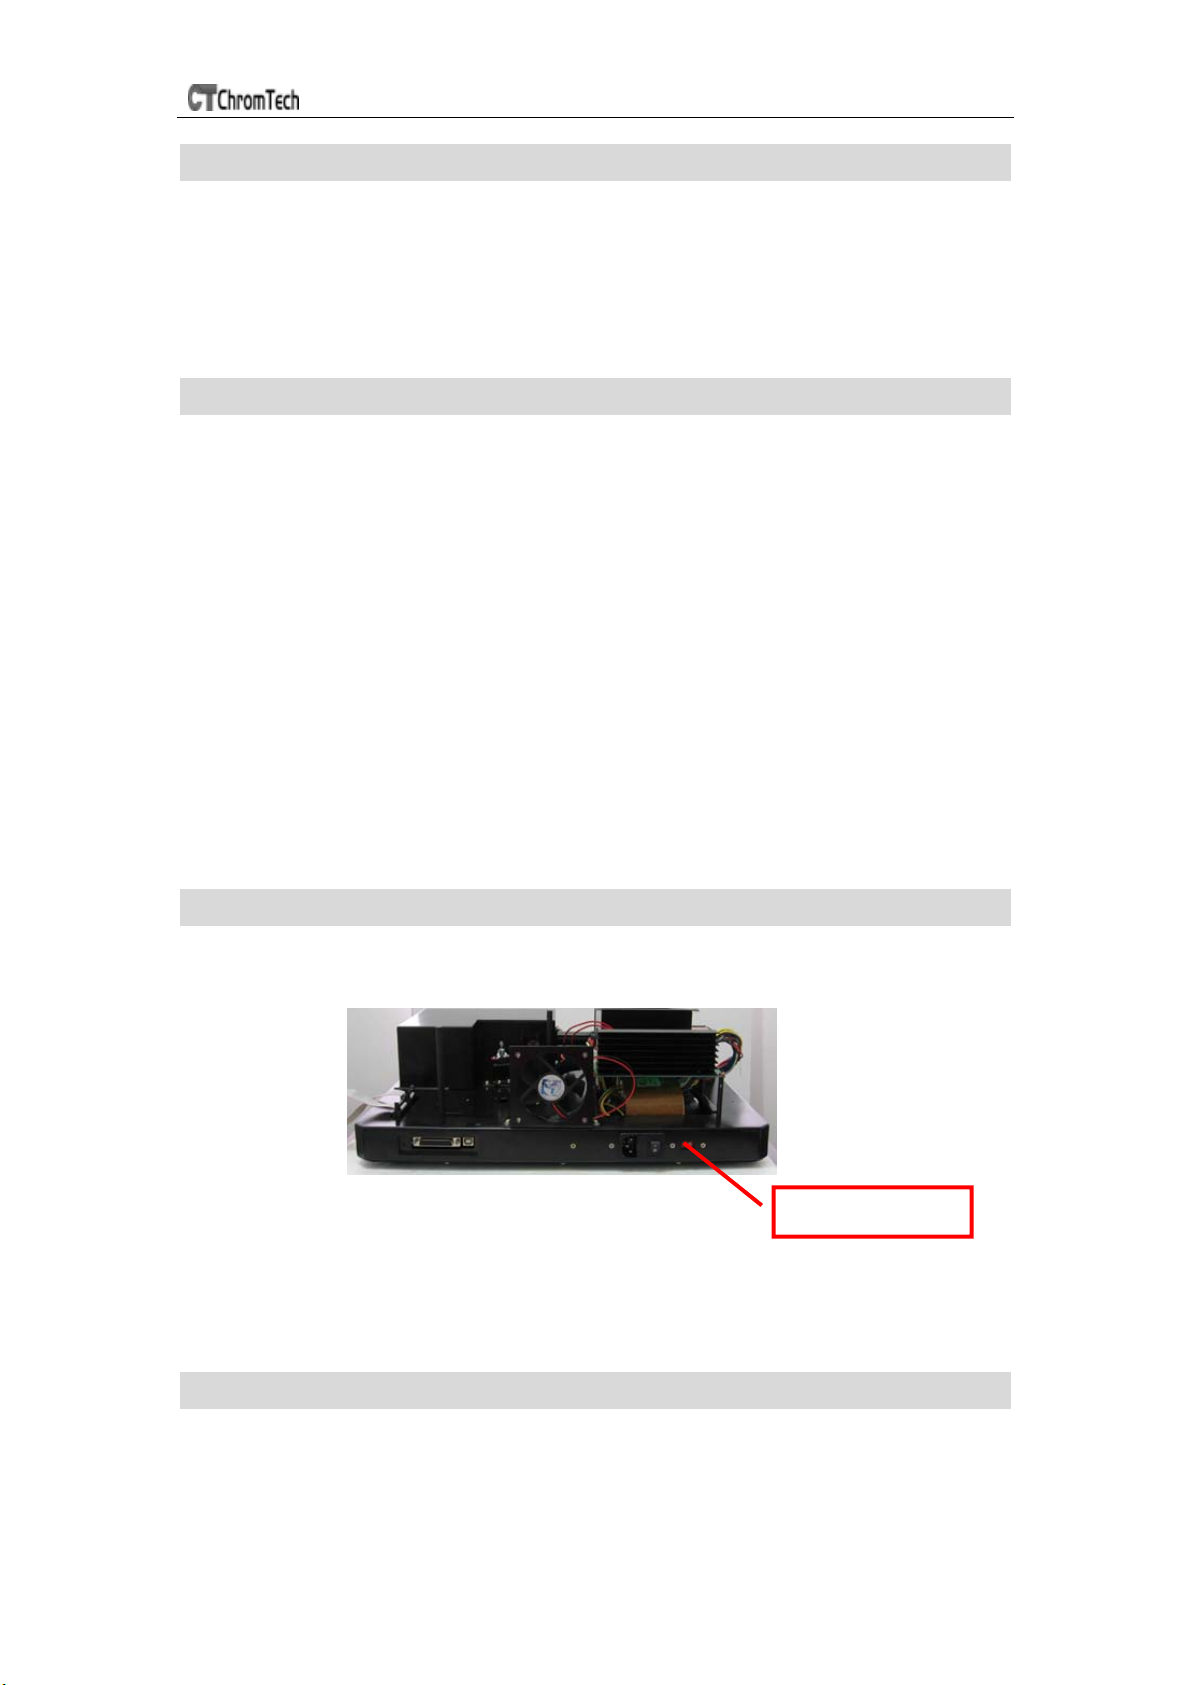
Before switching on the apparatus, make sure it is set to the voltage of the
local power supply (see Fig.1-1).
Fig. 1-1
The power cord shall be inserted in a socket provided with a protective earth
contact. The protective action must not be negated by the use of an
extension cord without a protective conductor.
Voltage Switch
Warning:
Any interruption of the protective conductor inside or outside the apparatus or
disconnection of the protective earth terminal is likely to make the apparatus
dangerous. Intentional interruption is prohibited.
2
Page 3
UV-3 SERIES SPECTROPHOTOMETER
Whenever it is likely that the protection has been impaired, the apparatus shall
be made inoperative and be secured against any unintended operation.
NEVER touch or handle the power supply on ChromTech UV-3 SERIES due to
the high voltage.
The protection is likely to be impaired if, for example, the apparatus
Shows visible damage
Fails to perform the intended measurements
Has been subjected to prolonged storage under unfavorable conditions
Has been subjected to severe transport stresses
Working Principle:
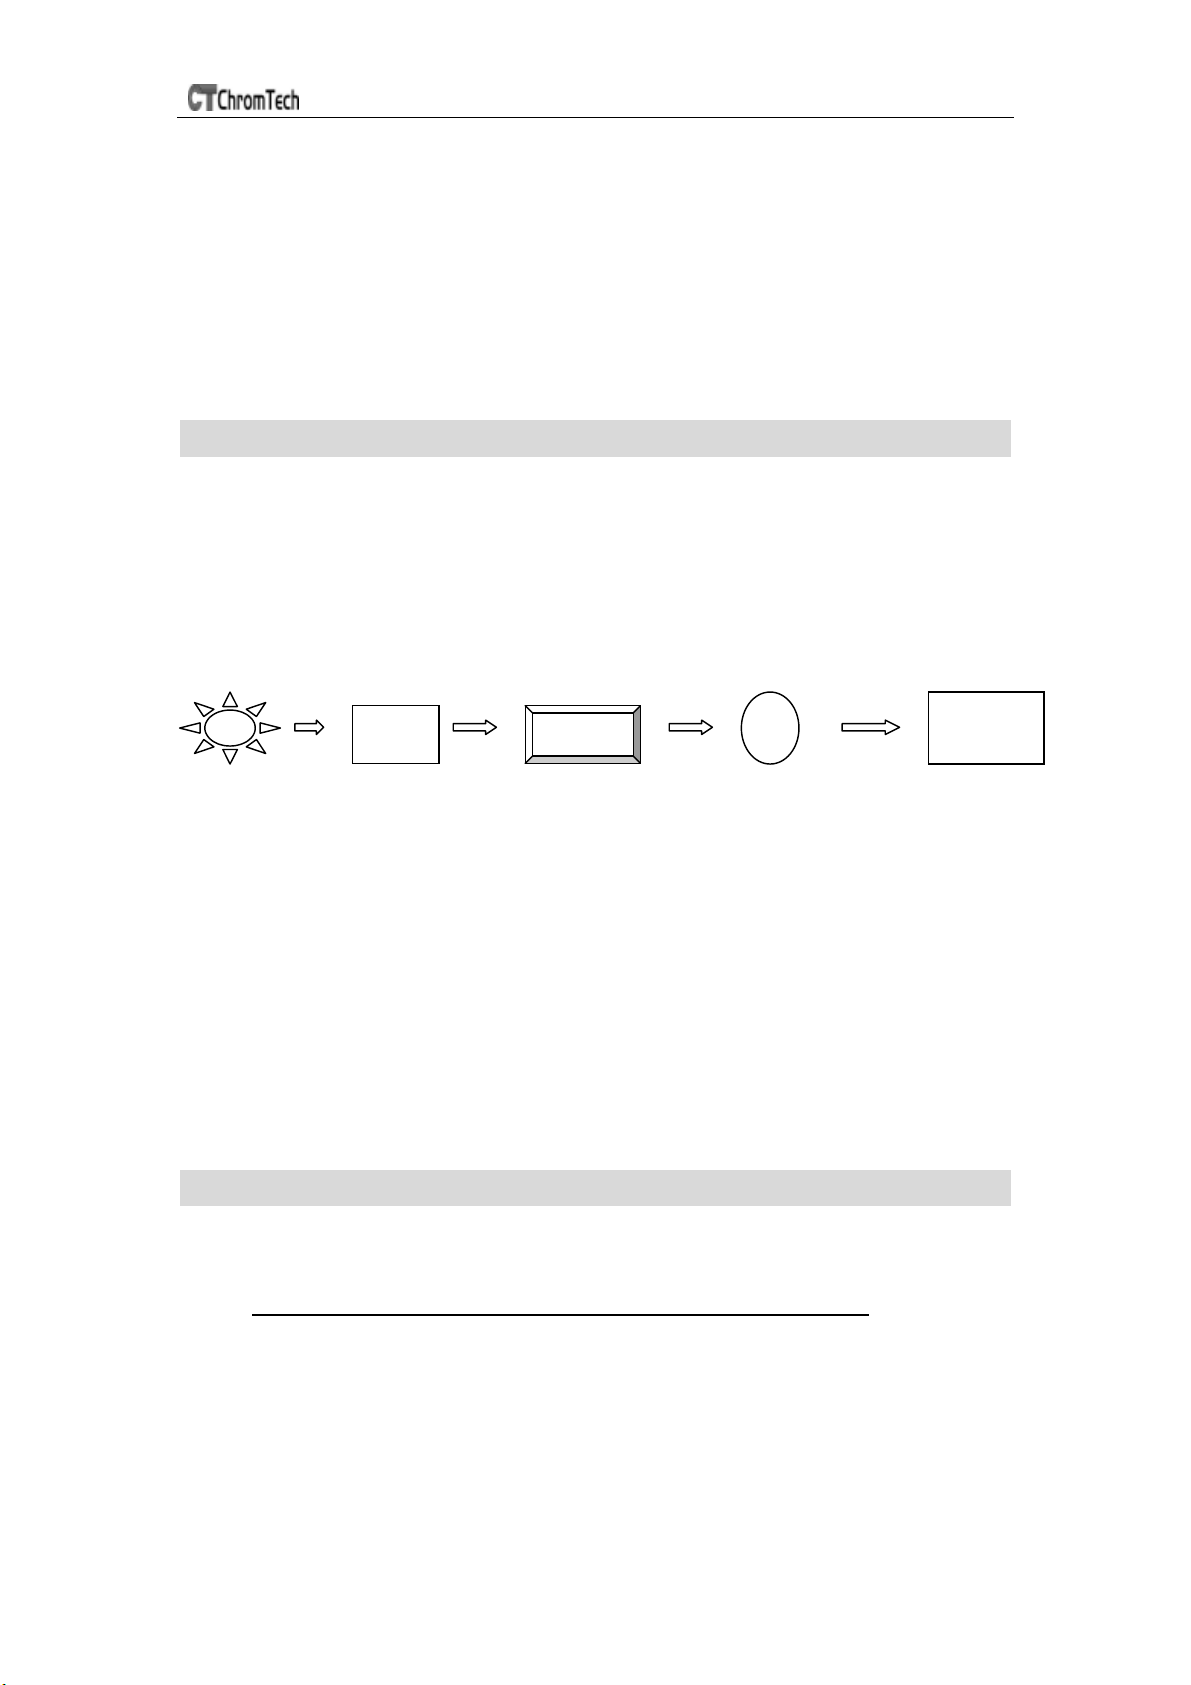
The spectrophotometer consists of five parts: 1) Halogen or deuterium lamps
to supply the light; 2) A Monochromator to isolate the wavelength of interest
and eliminate the unwanted second order radiation; 3) A sample compartment
to accommodate the sample solution; 4) A detector to receive the transmitted
light and convert it to an electrical signal; and 5) A digital display to indicate
absorbance or transmittance. The block diagram
relationship between these parts.
Block diagram for the Spectrophotometer
Light Mono- Sample Detector Display
Source chromator Compartment
Fig1-2
In your spectrophotometer, light from the lamp is focused on the entrance slit
of the monochromator where the collimating mirror directs the beam onto the
grating. The grating disperses the light beam to produce the spectrum, a
portion of which is focused on the exit slit of the monochromator by a
collimating mirror. From here the beam is passed to a sample compartment
through one of the filters, which helps to eliminate unwanted second order
radiation from the diffraction grating. Upon leaving the sample compartment,
the beam is passed to the silicon photodiode detector and causes the detector
to produce an electrical signal that is displayed on the digital display.
(Fig 1) below illustrates the
100%T
0
Unpacking Instructions:
Carefully unpack the contents and check the materials against the following
packing list to ensure that you have received everything in good condition.
Packing List
Description Quantity
Spectrophotometer .................................................. 1
Mains Lead .............................................................. 1
Cuvettes .................................................................. Set of 4, glass
............................................................ Set of 2, quartz
Dust Cover............................................................... 1
Manual..................................................................... 1
3
Page 4
UV-3 SERIES SPECTROPHOTOMETER
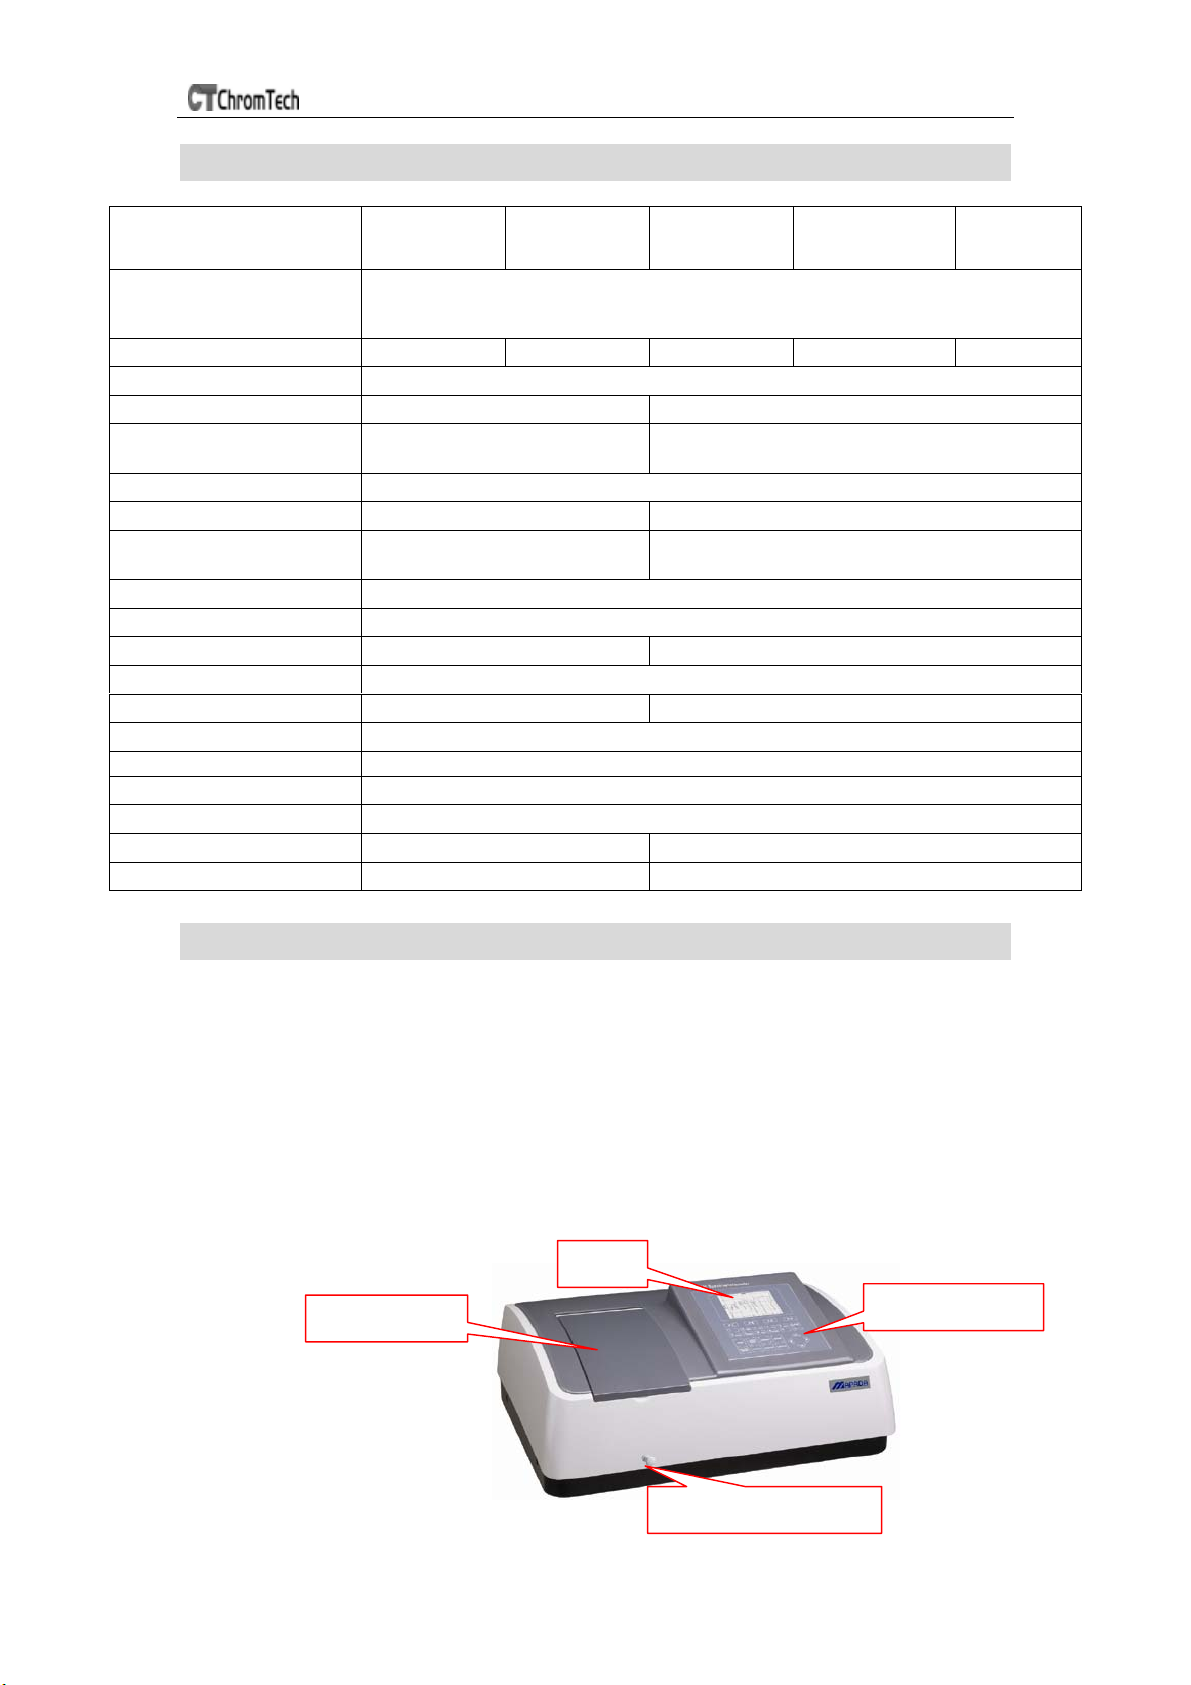
Specifications:
Model
Wavelength Range 190-1100nm
Spectral Bandwidth
Optical System
Wavelength Accuracy
Wavelength
Repeatability
Scanning Speed
Photometric Accuracy
Photometric
Repeatability
Photometric Range
Stray Light
Stability
Display
Baseline Flatness
Sample Compartment
Light Source
Output
Power Requirement
Dimensions (W x D x H)
Weight
UV-3000/
UV-3000PC
4.0nm 2.0nm 1.8nm
±0.5nm ±0.3nm
0.3nm 0.2nm
±0.3%T ±0.2%T
±0.2%T ±0.15%T
±0.002A/h 0.001A/h
±0.002A(200-1000nm) ±0.001A(200-1000nm)
Accommodates 100mm path-length cuvette with optional holder
480x 360 x 160mm 600x 450 x 200mm
UV-3100/
UV-3100PC
UV-3200/
UV-3200PC
Single Beam, Grating 1200lines/mm
Hi, Med.,Low.Max.3000nm/min
-0.3-3A, 0-200%T.0-9999Conc.
0.05%T
LCD(320x240) or PC Model
Halogen & Deuterium lamp (pre-aligned)
USB Port & Parallel Port (Printer)
AC 220V/50Hz or AC 110V/60Hz
14kg 20kg
UV-3200S/
UV-3200PCS
0.5/1.0/2.0/4.0nm
UV-3300/
UV-3300PC
1.0nm
Installation:
1. After carefully unpacking the contents, check the materials with the
packing list (page 2) to ensure that you have received everything in
good condition.
2. Place the instrument (Fig.1-3) in a suitable location away from direct
sunlight. In order to have the best performance from your instrument,
keep it as far as possible from any strong magnetic or electrical fields
or any electrical device that may generate high-frequency fields. Set
the unit up in an area that is free of dust, corrosive gases and strong
vibrations.
Compartmen
Fig.1-3
LCD
Control Panel
Holder Changer
4
Page 5
UV-3 SERIES SPECTROPHOTOMETER
3. Remove any obstructions or materials that could hinder the flow of air
under and around the instrument.
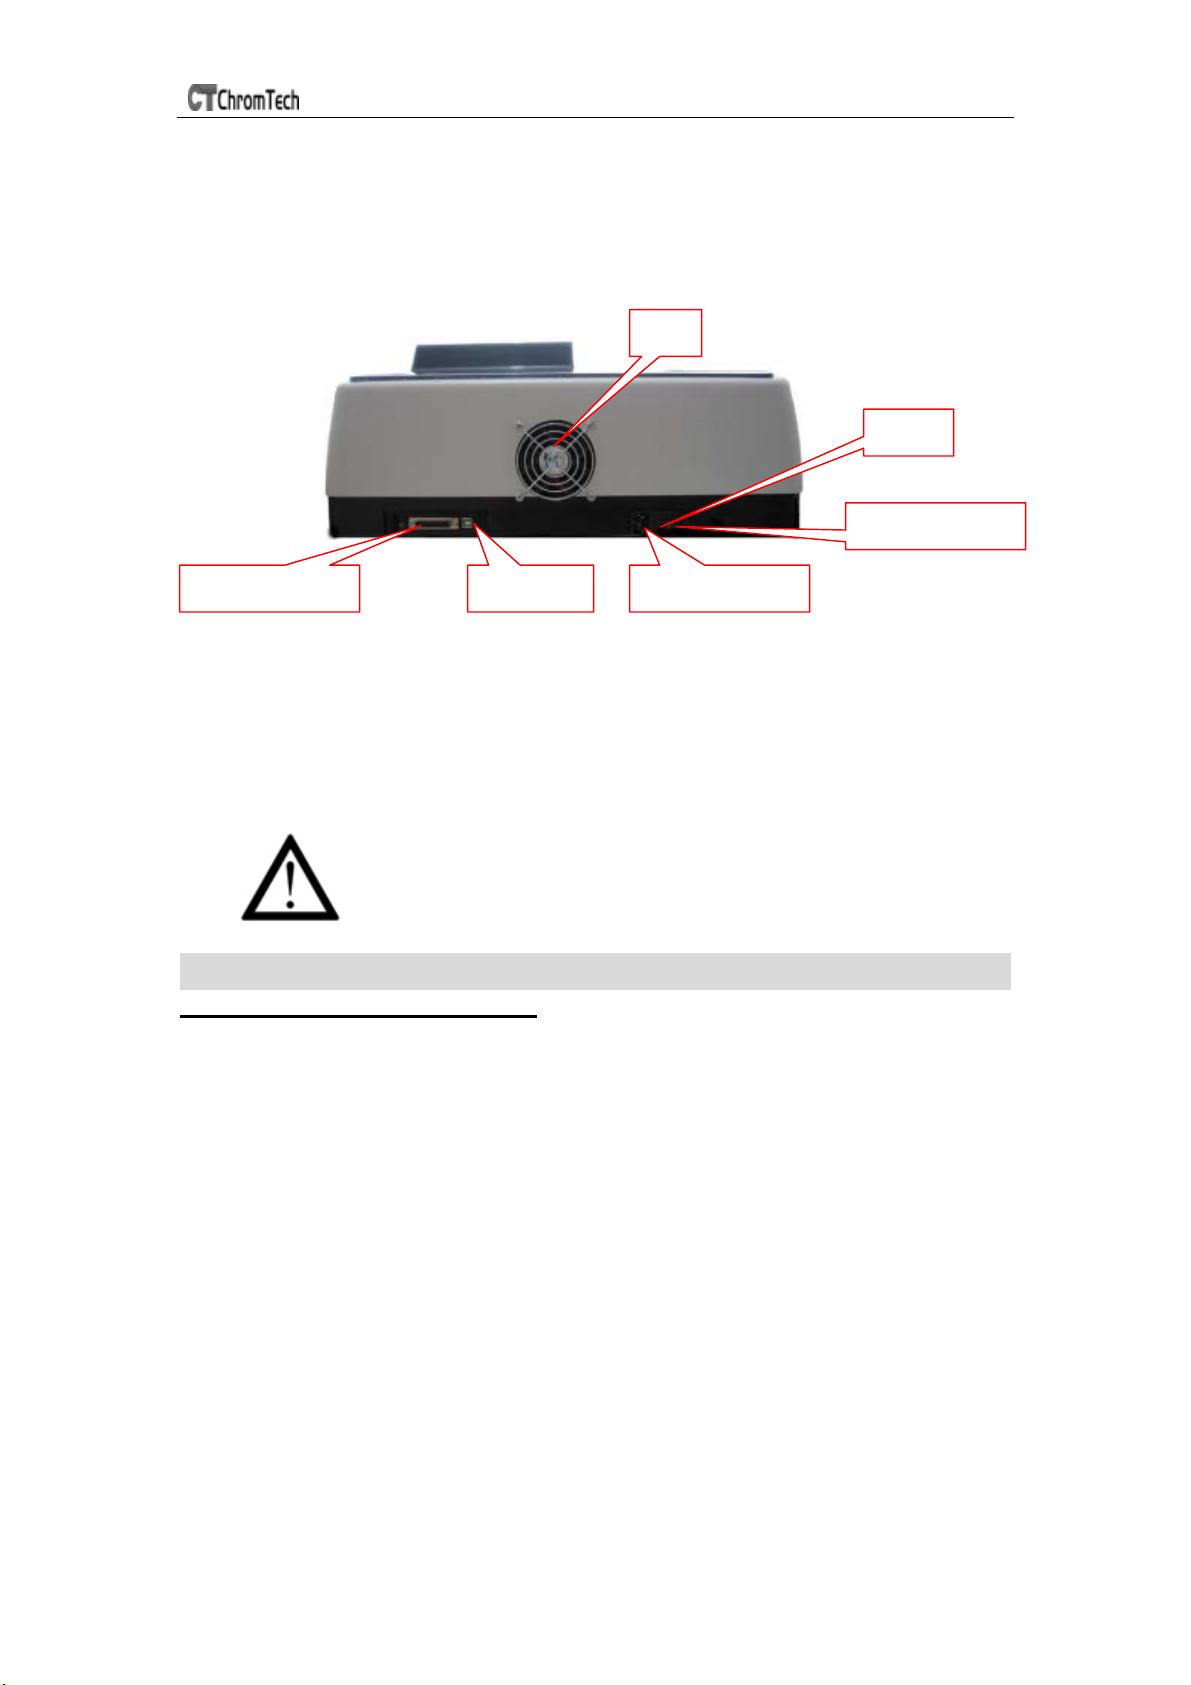
4. Use the appropriate power cord and plug into a grounded outlet.
Fan
Fuse
Parallel Port
5. Turn on your spectrophotometer. Allow it to warm up for 15 minutes
before taking any readings. We suggest you then do the Calibrate
System with the Search 656.1nm to set the wavelength to the
deuterium lamp emission line.
NOTE:
This symbol means Caution, Risk of Danger.
USB Port
Fig.1-4
Power Cord
Power Switch
Operation:
Prepare the spectrophotometer
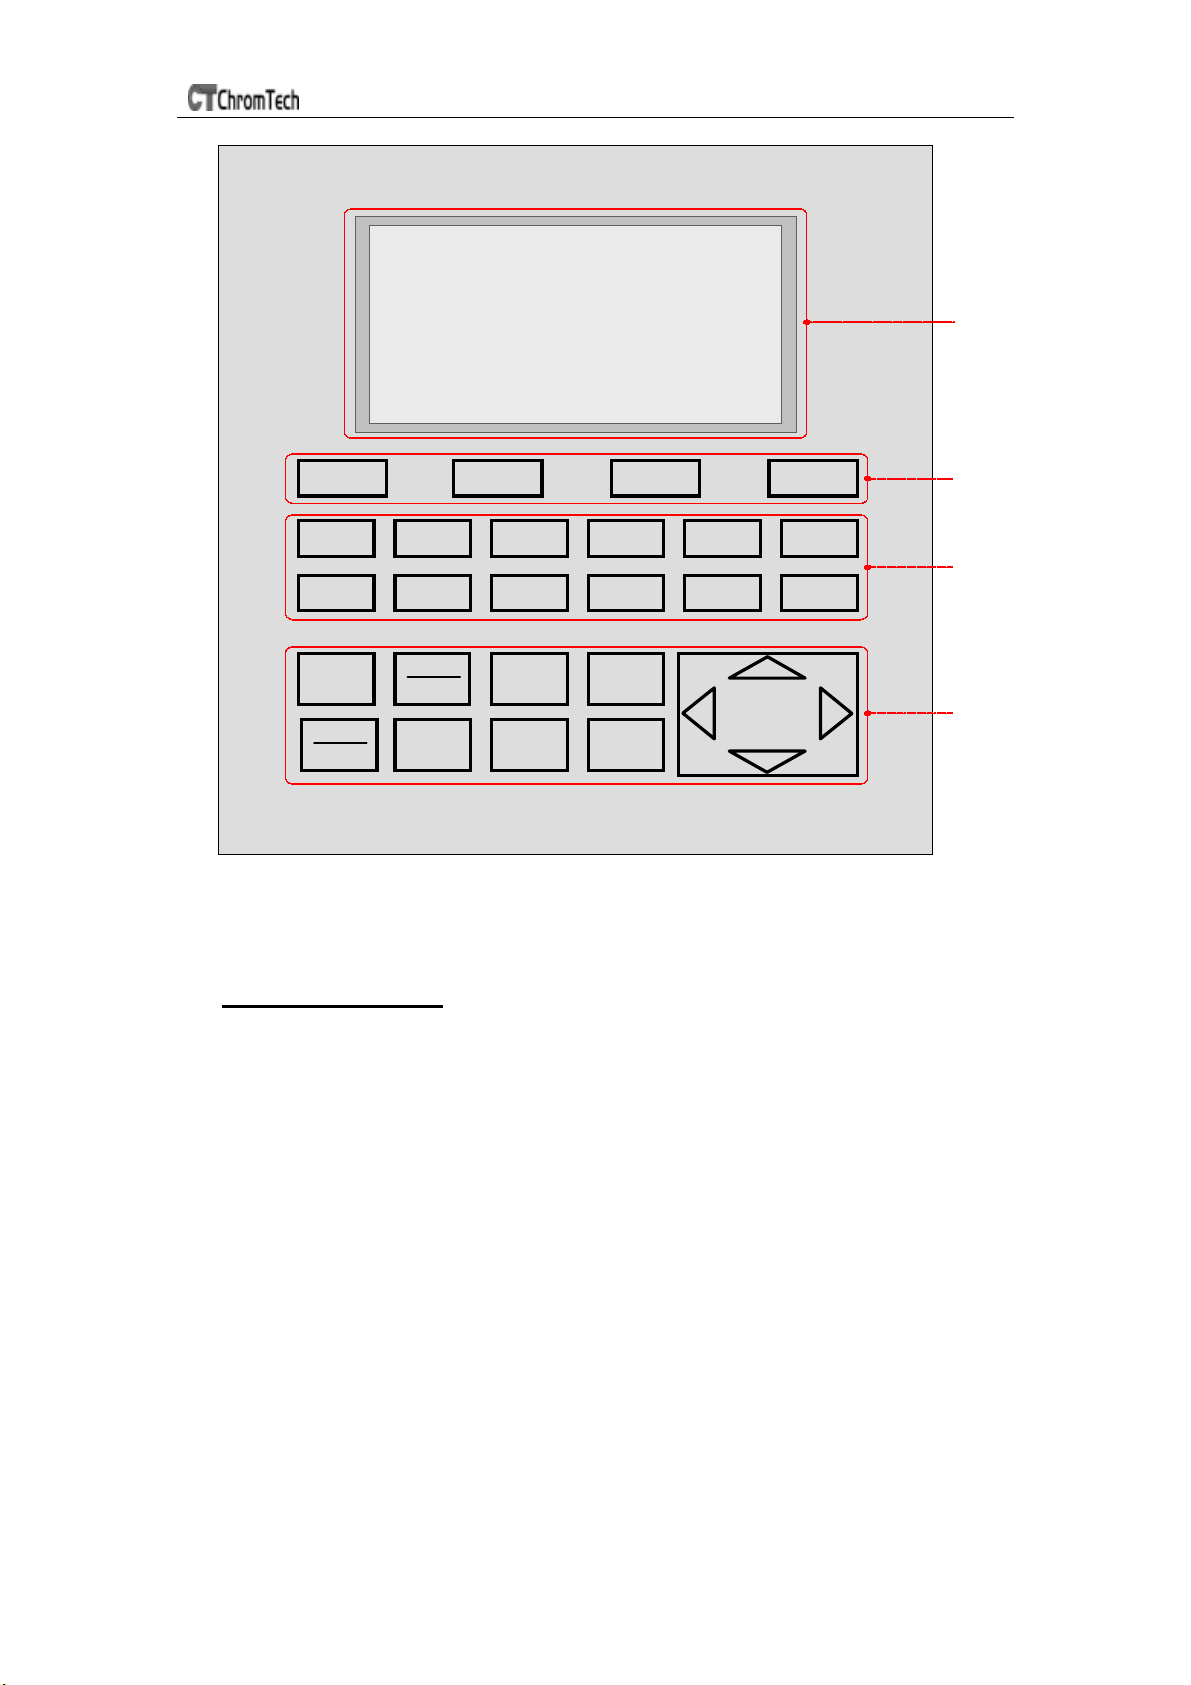
Fig 2 is the control panel. User can perform all operations by pressing the
keys and all the results and operation information are displayed on the LCD.
5
Page 6
UV-3 SERIES SPECTROPHOTOMETER
ON
LCD
F1 F2 F3 F4
1
6
MNO
ESC
START
STOP
2
ABC
7
PQRS
100%T
OABS
GOTO
3
DEF
8
TUV
OPEN SAVE
PRINT ENTER
λ
4
GHI
9
WXYZ
5
JKL
0
CLEAR
+/-/.
FUNCTI
KEY
NUMBER
KEY
CONTROL
KEY
Fig 2
Description of keys
【ESC】 Exit to previous screen or cancel the operation;
【100%T /0Abs】 Blank or scan the base line;
【OPEN】 open data or curve saved before;
【SAVE】 Save data or curve;
【START/STOP】 Start testing or scanning sample;
【GOTOλ】 Set wavelength;
【PRINT】 Print test results or screen
【ENTER】 Confirm the inputted data or selected item; Go into next
setup or screen;
【F1】- 【F4】 Function based on the information on the screen;
Note: No symbols printed on the Function Keys! For convenient description in the manual, we
call them F1, F2, F3 and F4 respectively.
【0】-【9】 Input number or letter, consecutively press a numeric key
to select a character;
【+/-/.】 Input +,- or dot;
【CLEAR】 Clear all characters when you are inputting or clear curve
displays on the screen;
6
Page 7
UV-3 SERIES SPECTROPHOTOMETER
【<】,【>】 Change “x” scale; Search point after scan; 【<】 clear a
character;
【∧】,【∨】 Change “y” scale; Search peak after scan; Scroll items for
selecting; Change capital/small letter last typed in; Browse
the items for selection;
Turn on spectrophotometer
Turn on spectrophotometer by pressing the Power Switch (IO). The
instrument starts to initiate and the steps are as below:
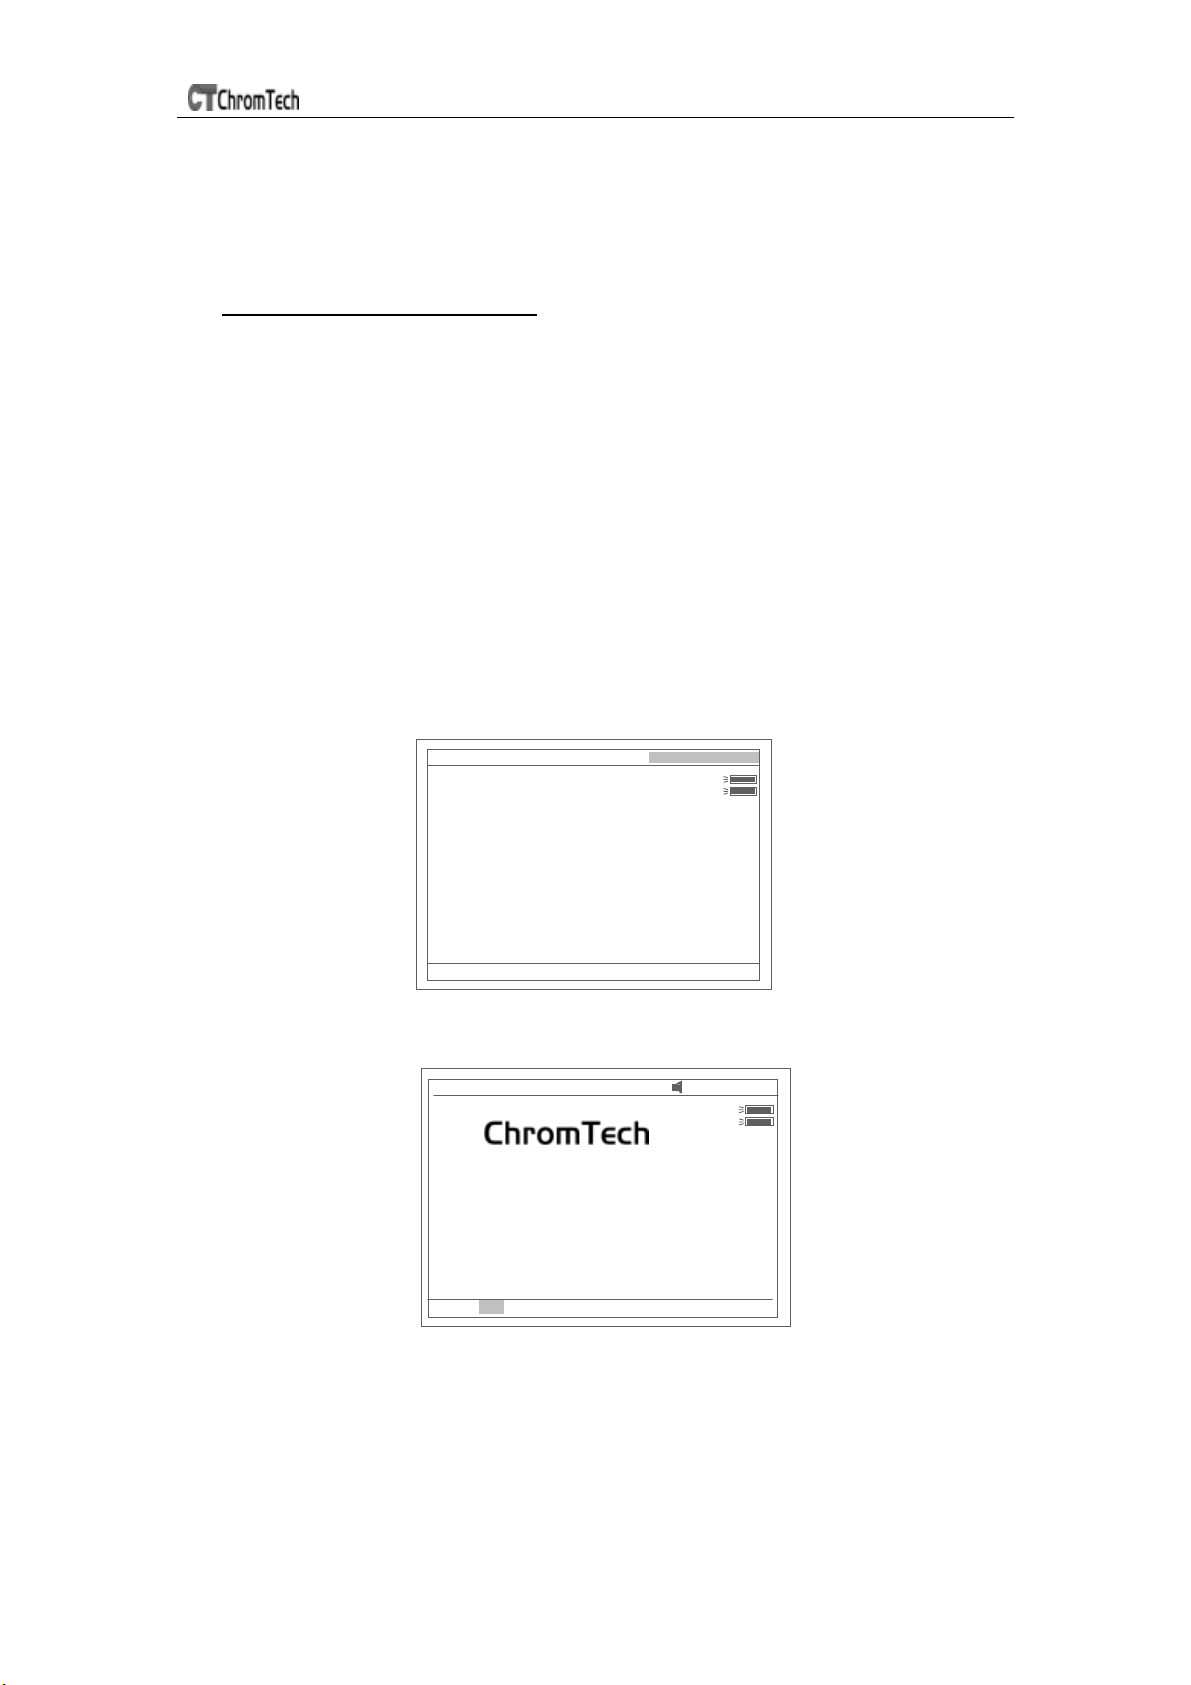
1.The instrument will warm up D2 lamp first(Fig 3), then initialize
com-port and printer, then start kernel, after positioning filter, auto-cell
changer(if installed) and D2 / W lamps, the screen display as Fig 3A. 15
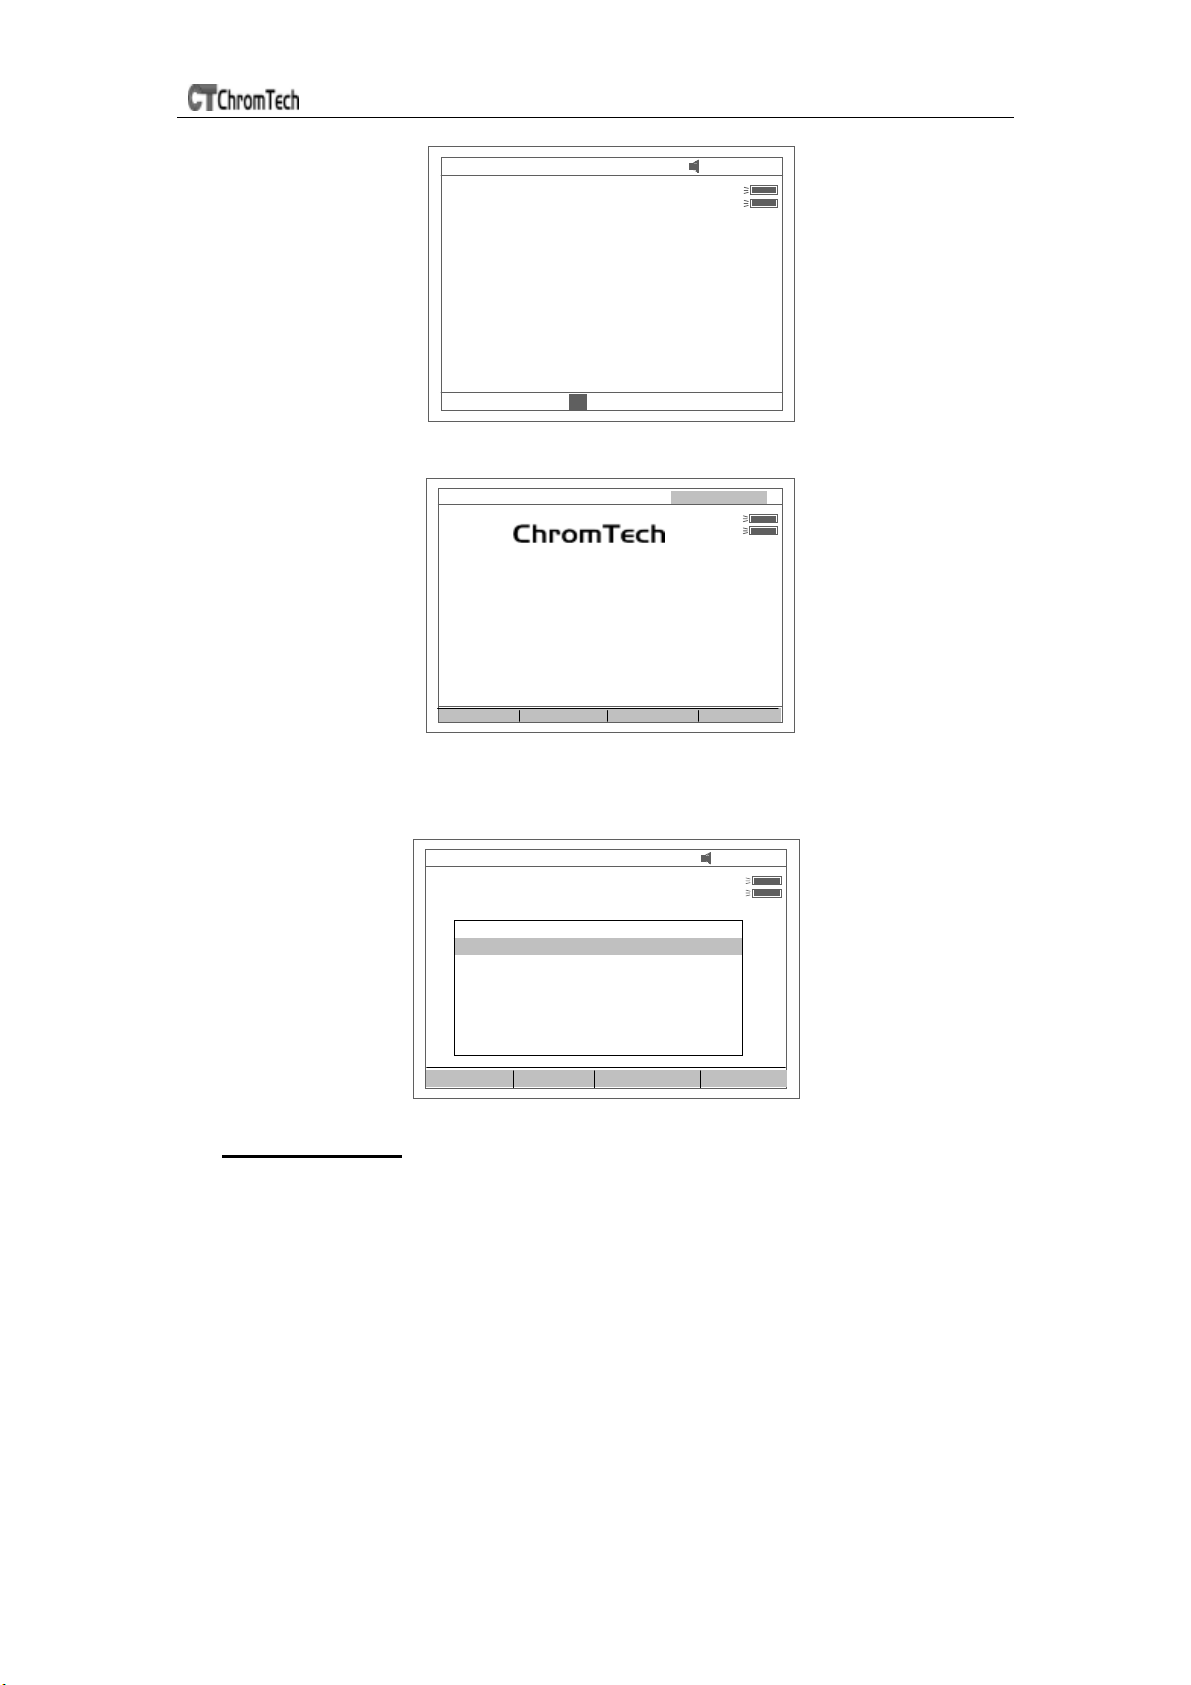
minutes pass or press【ESC】, the screen display as Fig 4,Select “No” to skip
to main menu( Fig 6) or select “Yes”(recommended) to calibrate system (Fig
5).The calibrating process include “get dark current”, “searching 656.1nm” and
“check energy”. After finish the calibration system, go to main menu too (Fig 6).
2 .If the data in memory has been lost, the instrument will directly
calibrate system without any choice for you.
3. If no auto-cell changer installed
,
“cell #1” will disappear in Fig6
WL : 656.1n m D2 La mp W arm ing
D2
W
Wait until E asyRTO S booted:
Shanghai Mapada Instruments Co., Ltd
Fig 3
WL : 656.1n m 16:2 0:05
D2
W
Wait until EasyRTO S booted:
Ini t Comm Port . . . . . . . .
Ini t Prin ter . . . . . . . . . . .
Sta rt Ke rnel . . . . . . . . . .
Ini t AD C onve rter . . . . . .
Filter Posi tionin g . . . . . .
Lam p Positioning . . . . . .
Positioning . . . . . . . . . .
Wa rm up 15 m inutes . . . ?
Press ESC to skip ...
√
√
√
√
√
√
√
Fig 3A
Note: The instruments only display one checking step at a time, not display as Fig 3A
indicated.
7
Page 8
UV-3 SERIES SPECTROPHOTOMETER
WL : 656. 1nm 16:20 :18
D2
W
Wait until EasyRTOS booted:
Warm up 15 m inu tes. . . .
System calibrating? No
Fig 4
√
WL : 656.1n m S tep to 190n m
D2
W
Wait until E asyRTOS booted:
Sea rch 656.1 nm . . . . . .
Che ck Ene rgy. . . . . . . . . .
Cali brate S ystem . . . . . . .
Note: The instruments only display one checking step at a time, not display as Fig 5
indicated.
WL : 656 .1nm 16:31: 35
Main Menu For UV3100
1. Basic mode
2. Quantitati ve Mode
3. Wavelength Scan
4. Kinetics Mode
5. DNA/Protein Mode
6. Mul ti-Wavel ength Mode
7. System Utility
Fig 5
√
√
?
D2
W
Cell #1
Cancel Move Dn Select
Fig 6
Basic operation
Blank
Push the blank cuvette into the lightpath.
Press the key 【0Abs/100%T】for blanking
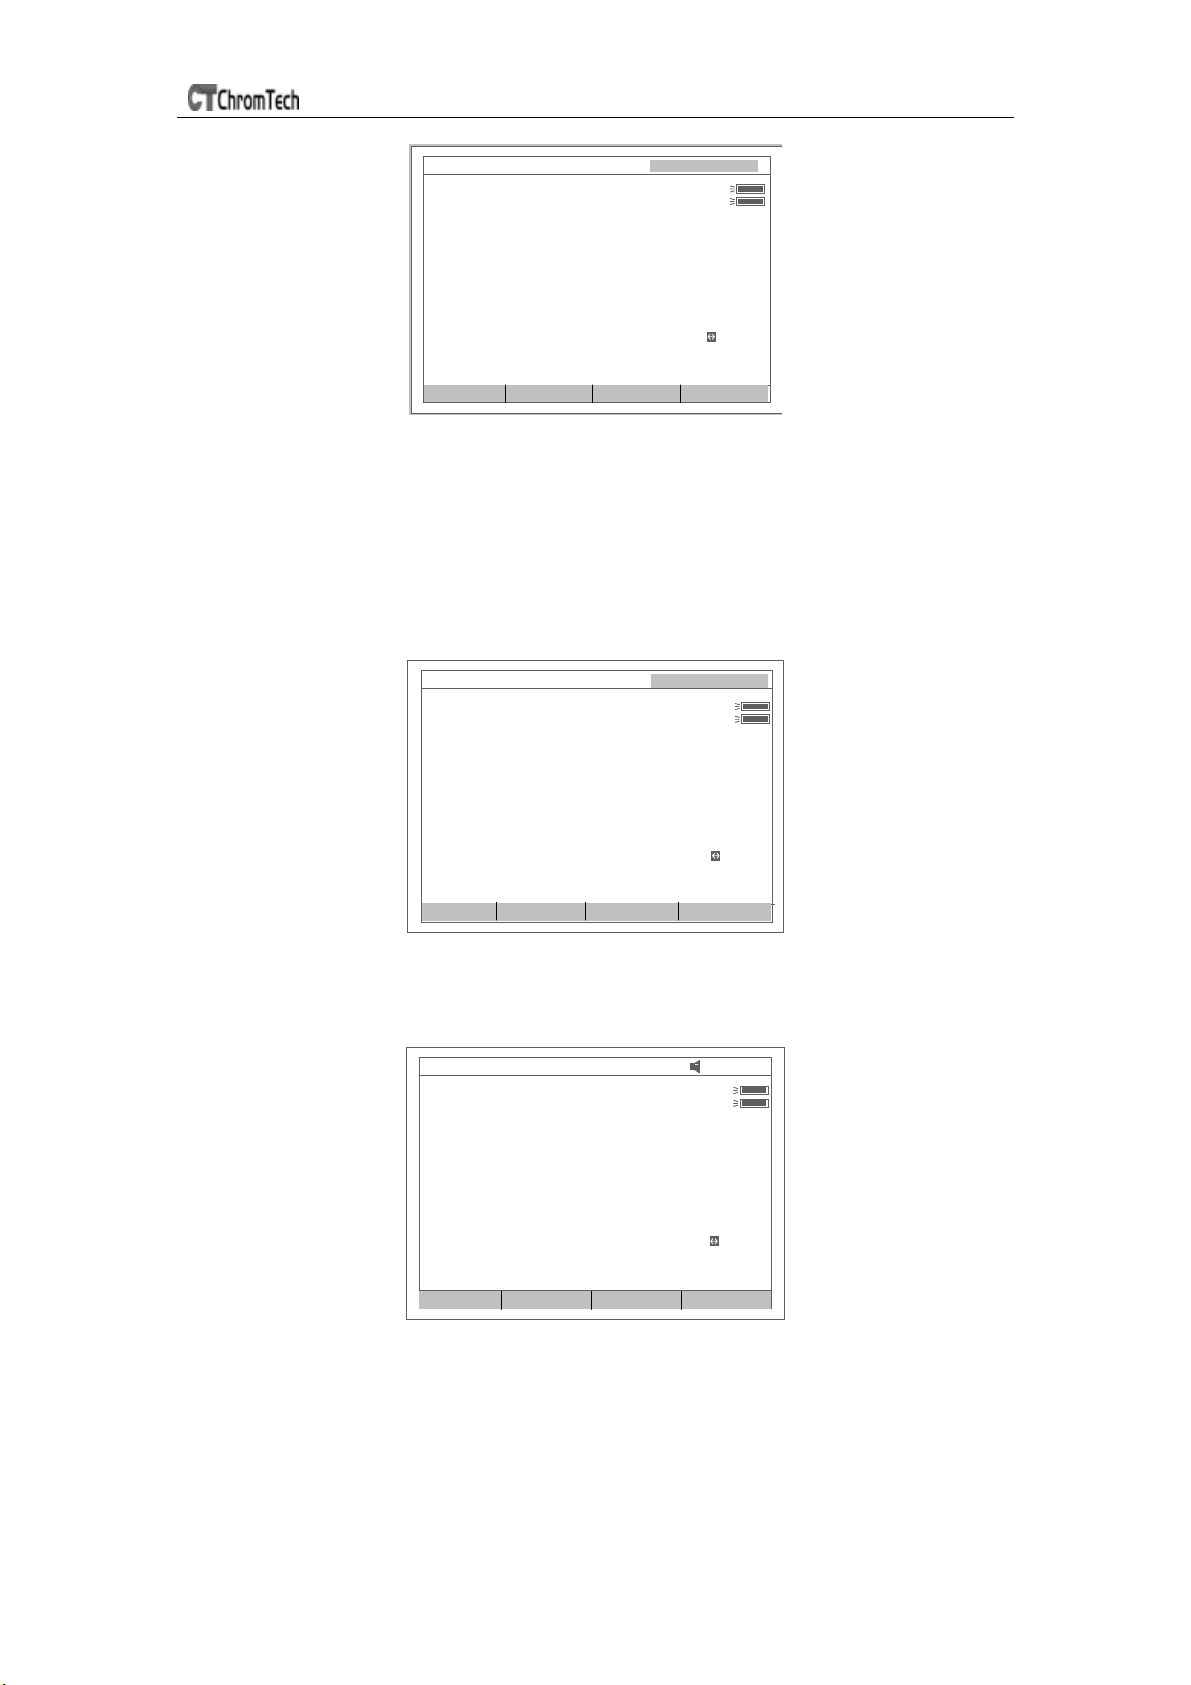
Note:1. If the reference solution is too thick, “Energy Low…” will appear
following the “Blanking…”on the screen (Fig 7).If “Energy too Low…” appears
following the “Blanking…”, the test will be paused and “Warning…”will appear
on the screen.(Fig 8).
2. If no automatic changer installed “cell #1” and “Max E” will disappear in
Fig 7
8
Page 9
UV-3 SERIES SPECTROPHOTOMETER
WL : 656.1n m
Blanking
Uni t Mode Fact or St anda rd
Energy Low. . .
D2
W
Cell #1
Max E
Fig 7
NOTE: 1.Blanking is automatic after a wavelength change
DO NOT OPEN SAMPLE COMPARTMENT LID DURING
BLANKING.
2. The dark current doesn’t be taken after power on, if you bypass the
calibrating system. It is recommended to take the dark current after
warm up. (See page 38)
WL : 656.1nm
Warning
……
Energy too Low. . .
D2
W
Cell #1
Max E
Unit Mode F actor Sta ndard
Fig 8
Set wavelength (Example: set wavelength in “Basic mode”)
Press【GOTOλ】(Fig 9).
WL : 656.1n m
0.001 Abs
Unit Mode Factor Sta ndard
12: 35 : 27
D2
W
Cell #1
Max E
Fig 9
Use numeric keypad to input wavelength (Fig 10).
9
Page 10
UV-3 SERIES SPECTROPHOTOMETER
WL : 656 .1nm
0.001 Abs
Please input wl : 656.1
12: 35: 27
D2
W
Cell #1
Max E
Fig 10
Press 【ENTER】 to change the wavelength from 656.1nm to
450.0nm,and then blank; After blanking, the screen displays as Fig
11.
WL : 450.0nm
0.000 Abs
12: 35 : 27
D2
W
Cell #1
Max E
Unit Mode F actor S tanda rd
Fig 11
open or delete data or curve (Take the “WL scan” test for example)
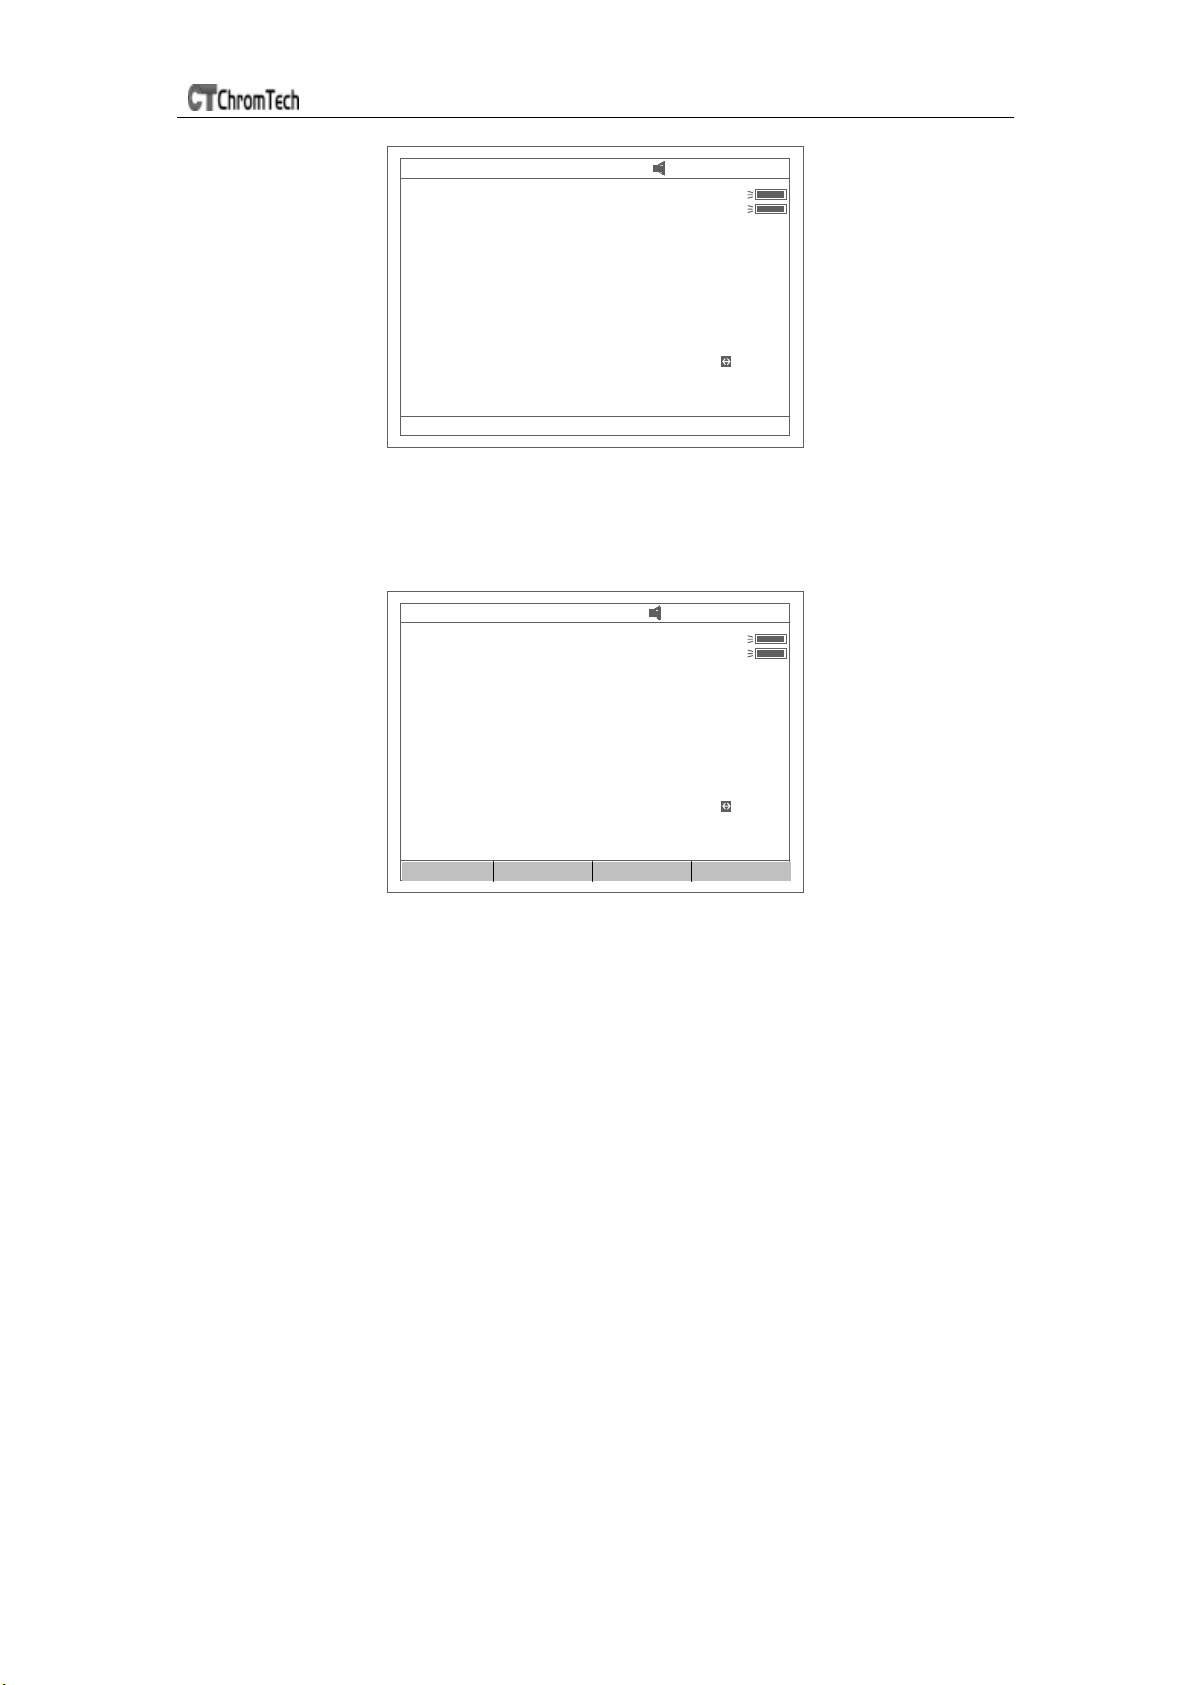
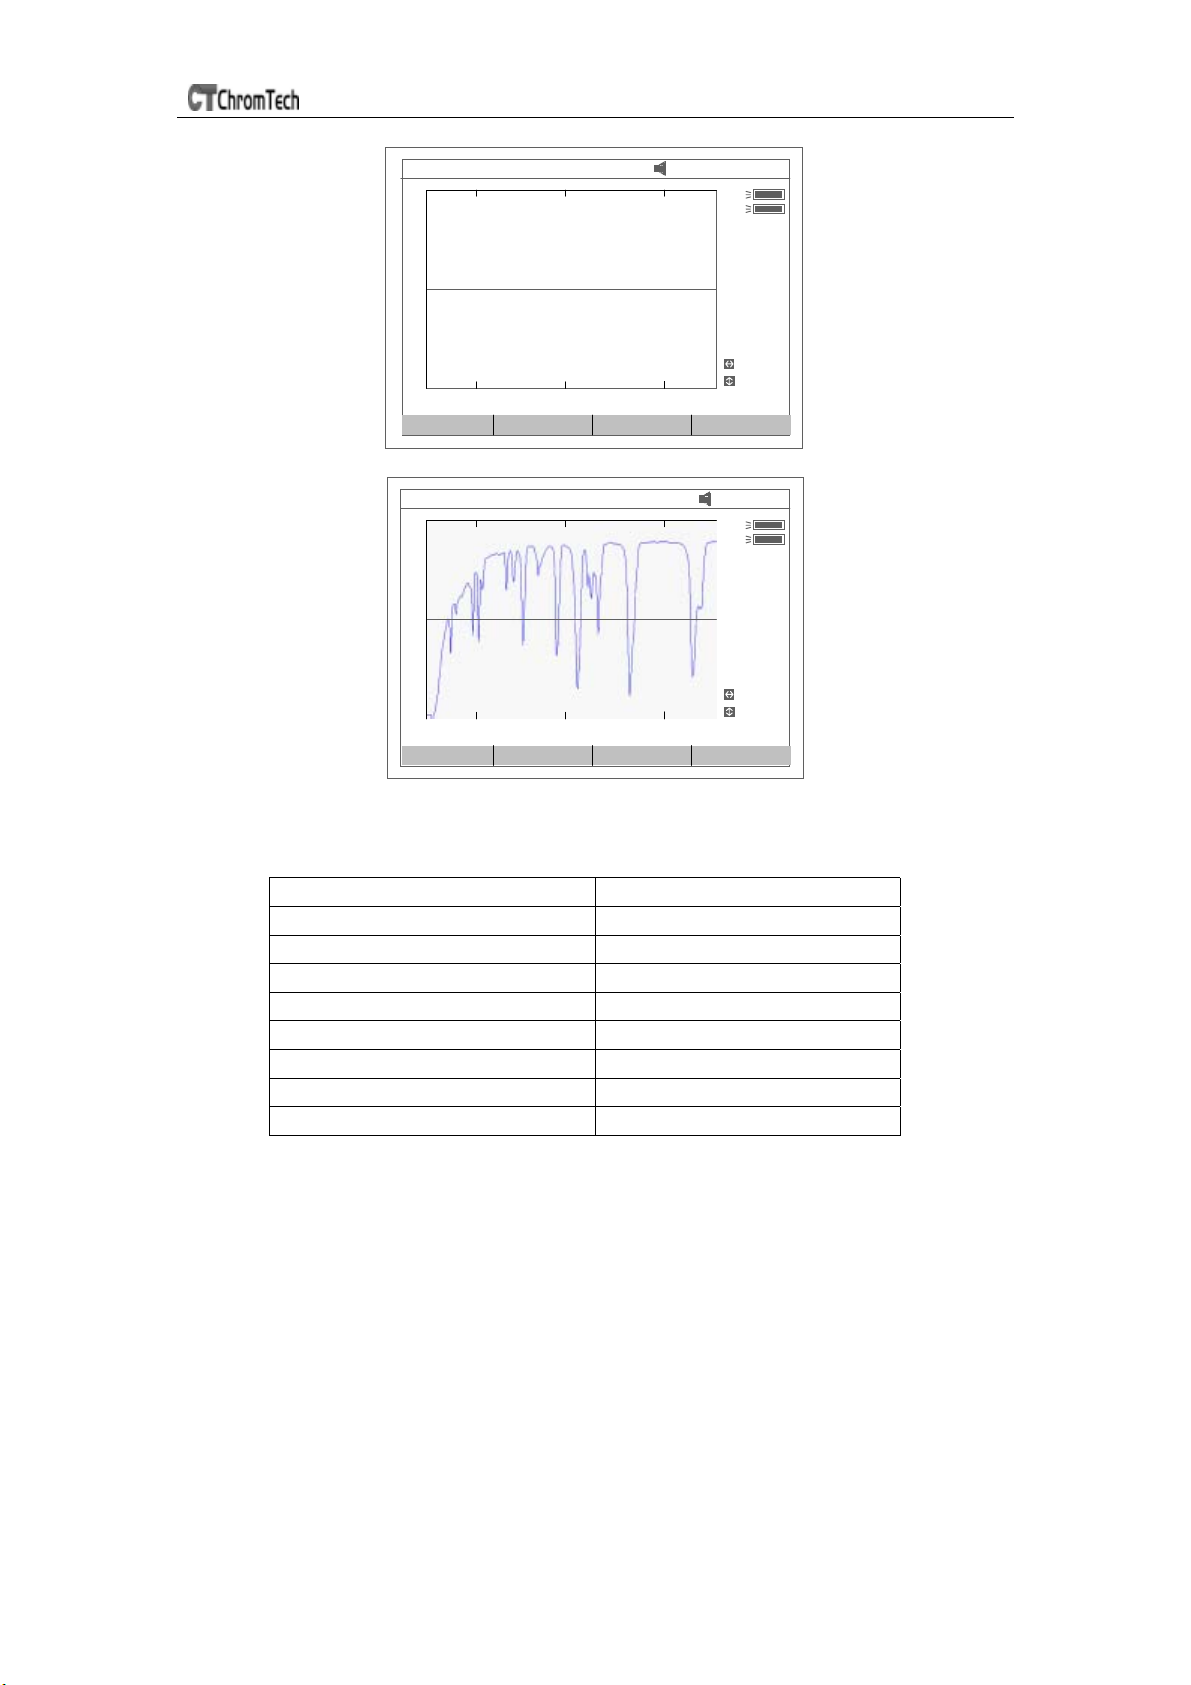
Press 【3】 in Fig.6 go into “WL scan”. After【OPEN】being pressed,
the first file (ABC.wav) in memory will appear on the bottom lines of
screen .Showed as Fig 12.
in memory.
The key.
1.
Then if
【ENTER】be pressed, the file selected will be opened and
Press 【∧】or【∨】 to browse the files stored
displays on the screen. Fig 13.
Note (1).The file selected must match “WL scan” test’s type. if not ,
the “file type error…” will appear on the right of top line.
(2).Different test has different file type. Refer to table 1 on page9.
The key
2.
selecting ”Yes”.
【CLEAR】be pressed the file selected
will be deleted by
10
Page 11
UV-3 SERIES SPECTROPHOTOMETER
WL : 680.0nm %T:
0 %T 120.0
200.0 Wavelength (nm) 680.0
Setup Mode Searc h Smooth
Fig 12
WL : 680.0nm %T:
0 %T 120.0
200.0 Wavelength (nm) 680.0
Setup Mode Searc h Smooth
12: 35: 27
D2
W
Cell #1
From:
200 . 0
To:
680 . 0
Step:
1 .0nm
XScale
YScale
12: 35 : 27
D2
W
Cell #1
From:
200 . 0
To:
680 . 0
Step:
1 .0nm
XScale
YScale
Fig 13
Table 1
Test File Type
Quantitative Curve ***.fit
Quantitative Test Result ***.qua
WL Scan ***.wav
Kinetics ***.kin
DNA/Protein ***.dna
Multi WL ***.mul
WL Validity
Accu. Validity
***. wlv
***.phv
Save data or curve (Example: Save curve in “WL scan”)
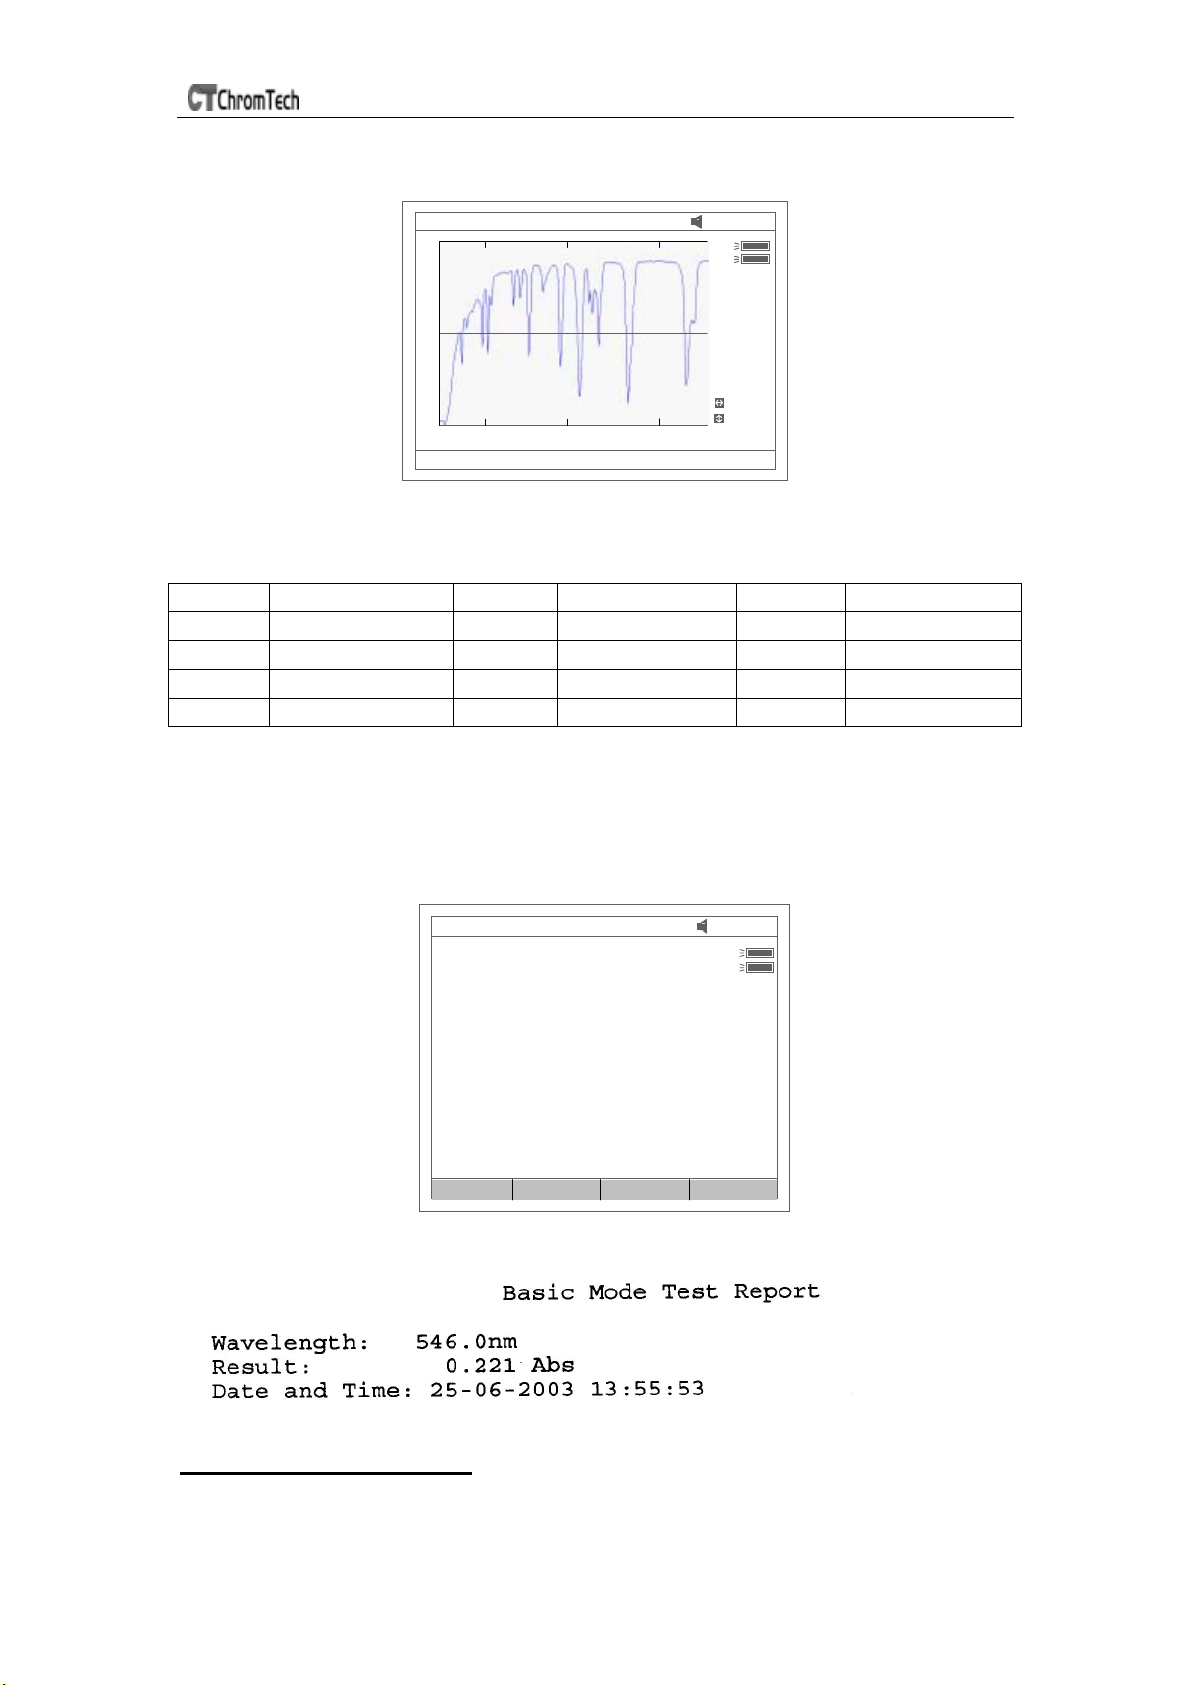
Press the key 【SAVE】 in Fig13 to save curve.
Name the curve by pressing the numeric keypad (Fig 14), press
the key【ENTER】 to confirm.
. Note(1). Pressing numeric key continually to scroll characters and
pressing 【∧】,【∨】 to alter capital letter to miniscule.
Table 2 shows all characters built in.
(2) If the name already exists in memory, the warning
“duplicated name, are you sure ?” will appear .
“Yes”for overwrite and“No”for Exit.
11
Page 12
UV-3 SERIES SPECTROPHOTOMETER
(3) The length of filename is less than 4.
WL : 680.0nm %T:
12: 35: 27
D2
W
Cell #1
From:
200.0
To:
680.0
Step:
1.0nm
0 %T 120.0
200.0 Wavelength (nm) 680.0
Plea se input File Nam e: 2
XScale
YScale
Fig 14
Table 2
key representing key representing key representing
0 0,+,-,* ,/ 1 1,#,?,:,I 2 2,A,B,C,=
3 3,D,E,F,% 4
6
6,M,N,O,~
7 7,P,Q,R,S, 8
4,G,H,I,{
5
5,J,K,L,}
8,T,U,V,“
9 9,W,X,Y,Z +/-/. -,.,
Print test report (For example: Print the report in “Basic mode”, Fig 16)
Press the key【PRINT】to print the report (curve or data you have opened or
tested, Fig 16).
WL : 546.0nm
0.221 Abs
12: 35: 27
D2
W
Cell #1
Unit Mode Factor Sta ndard
Max E
Fig 15
Fig 16
Before measurement
Make a blank reference solution by filling a clean cuvette (or test tube) half
full with distilled or de-ionized water or other specified solvent. Wipe the
12
Page 13
UV-3 SERIES SPECTROPHOTOMETER
cuvette with tissue to remove the fingerprints and droplets of liquid.
Fit the blank cuvette into the 4-cell linear changer and place the cuvette in
the slot nearest you. For the ChromTech UV-3 SERIES, push the
changer so that the cuvette is in the light path (Push the rod in). Close the
lid.
Analyze Sample
For different user requirements, we have provided different test methods.
Basic Mode
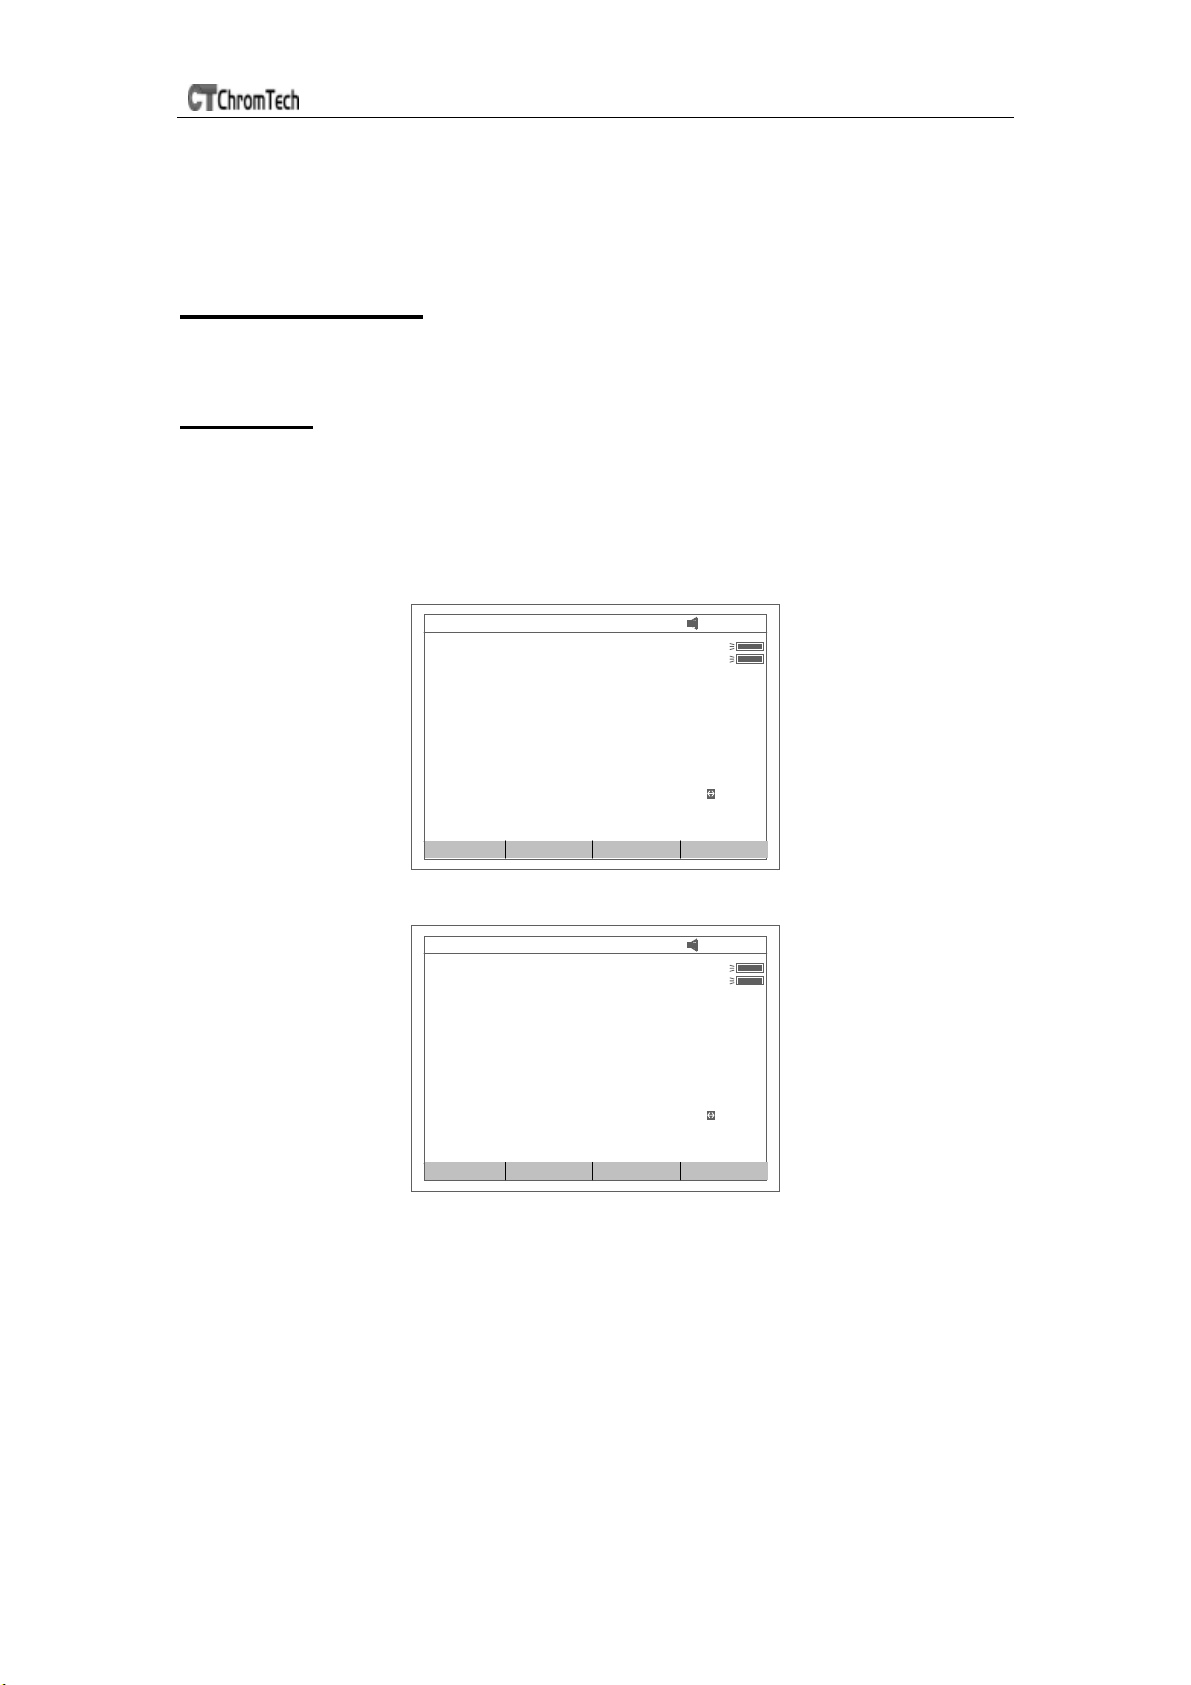
Push the blank cuvette into the light path. In main menu (Fig6),press【1】 to
enter “Basic mode” test . After automatically blanking, it will display as Fig 17
(automatic changer installed) or Fig 18 (automatic changer uninstalled) and
wait for the operator. 【ESC】to exit.
Note: .If no automatic changer installed “cell #1” and “Max E” will disappear
in Fig17
WL : 656.1n m
0.000 Abs
12: 35 : 27
D2
W
Cell #1
Max E
Unit Mode Fa ctor St andard
Fig17
WL : 656.1nm
0.000 Abs
Unit Mode Fa ctor St andard
12: 35 : 27
D2
W
Max E
Fig18
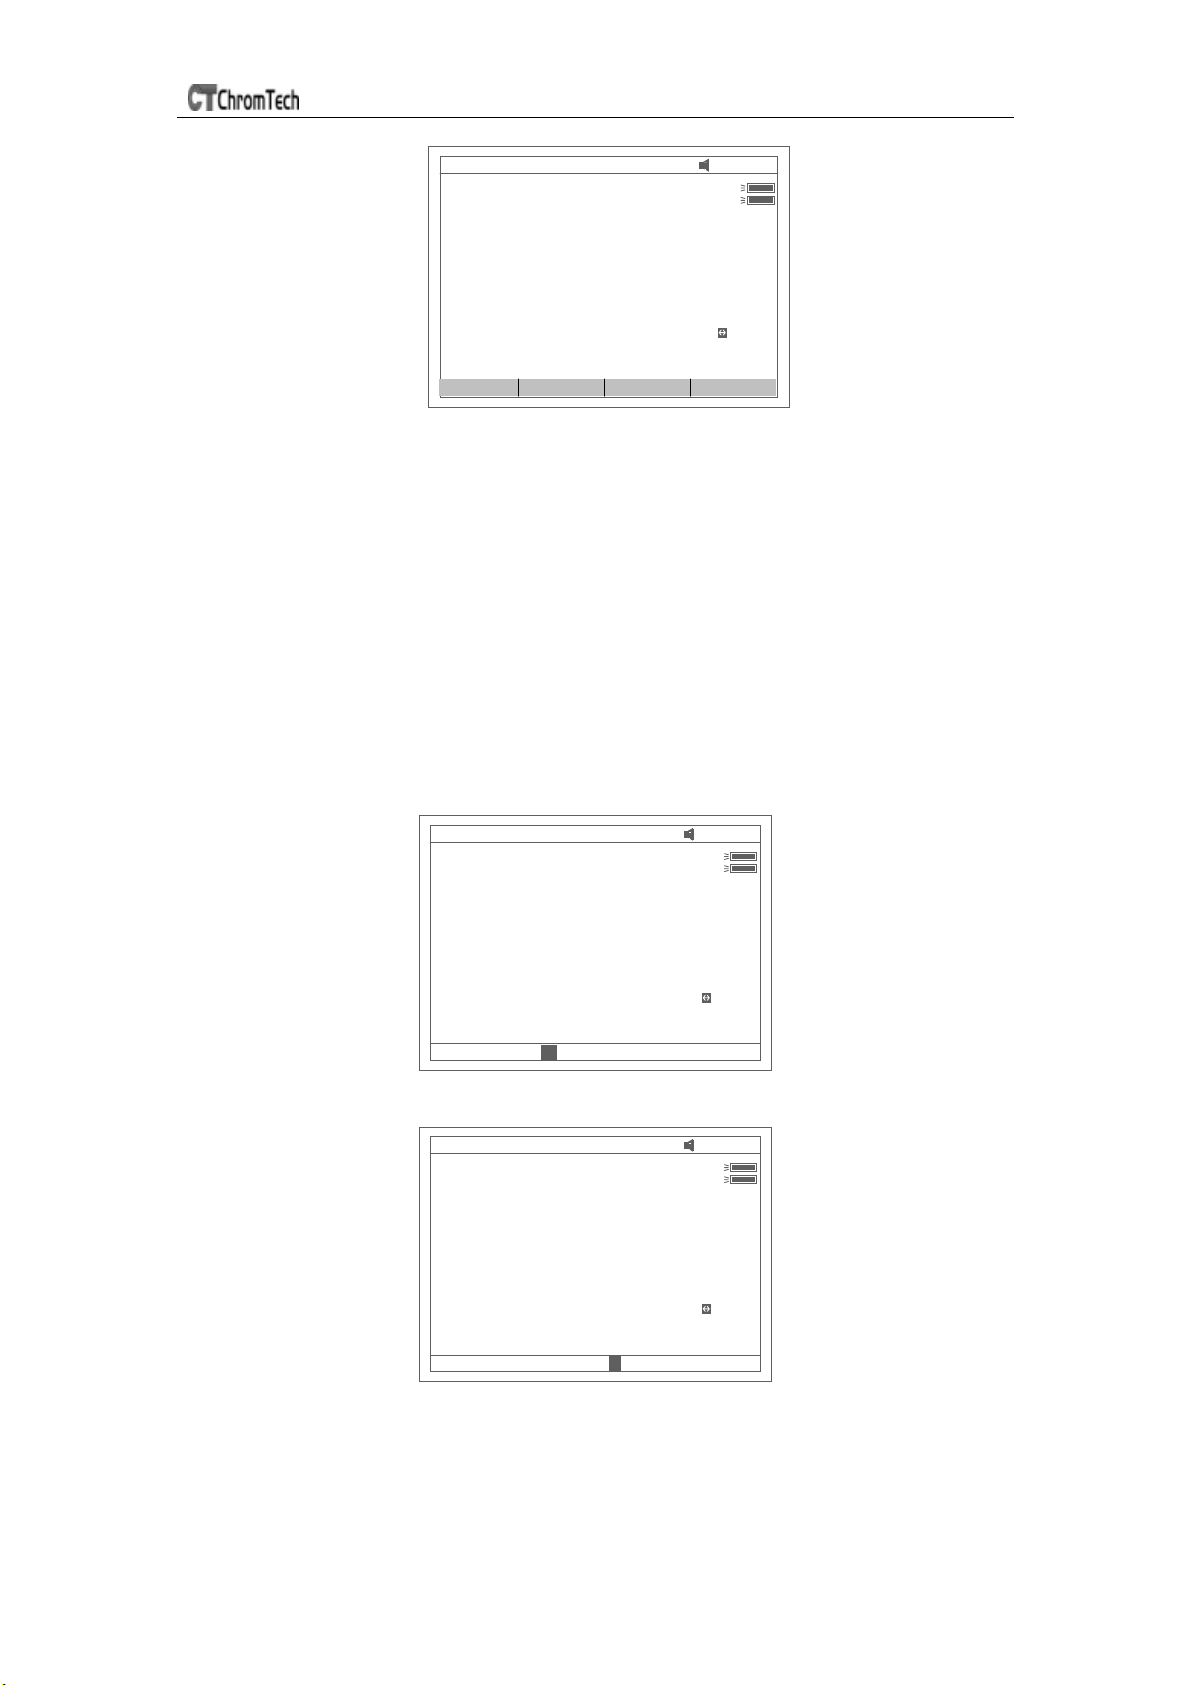
☺ Test
There are three modes (T%, Abs, Conc / factor) for you to select by
pressing 【F2】to make choice.
13
Page 14
UV-3 SERIES SPECTROPHOTOMETER
WL : 656 .1nm
0.104 Abs
Unit Mode Factor Standard
12: 35: 27
D2
W
Cell #1
Max E
Fig 19
1. Abs mode
Push the blank cuvette into the light path. Press 【F2】 to select Abs
mode ,Press 【0Abs/100%T】for Blanking , and then Push the sample into
light path to take reading(Fig 19 )
2. T% mode
The operation is the same as Abs test mode but pressing【F2】 to select
T% mode .
3. Conc/Factor mode
Press 【F1】 to select a concentration unit (Fig 20). If no unit is
suitable for your test, please select the item “Other”, press【Enter】 and
input a new unit by pressing the numeric keypad (Fig 21).
WL : 656.1nm
0.000 mg/ml
12: 35: 27
D2
W
Cell #1
F factor 2.000
Max E
Please select unit: %
Fig 20
WL : 656.1nm
0.000 mg/ml
F factor 2.000
Please input self defined unit: c
12: 35: 27
D2
W
Cell #1
Max E
Fig 21
4. Push the blank cuvette into the light path and press 【0Abs/100%T】for
Blanking. There are now two choices for you to take:
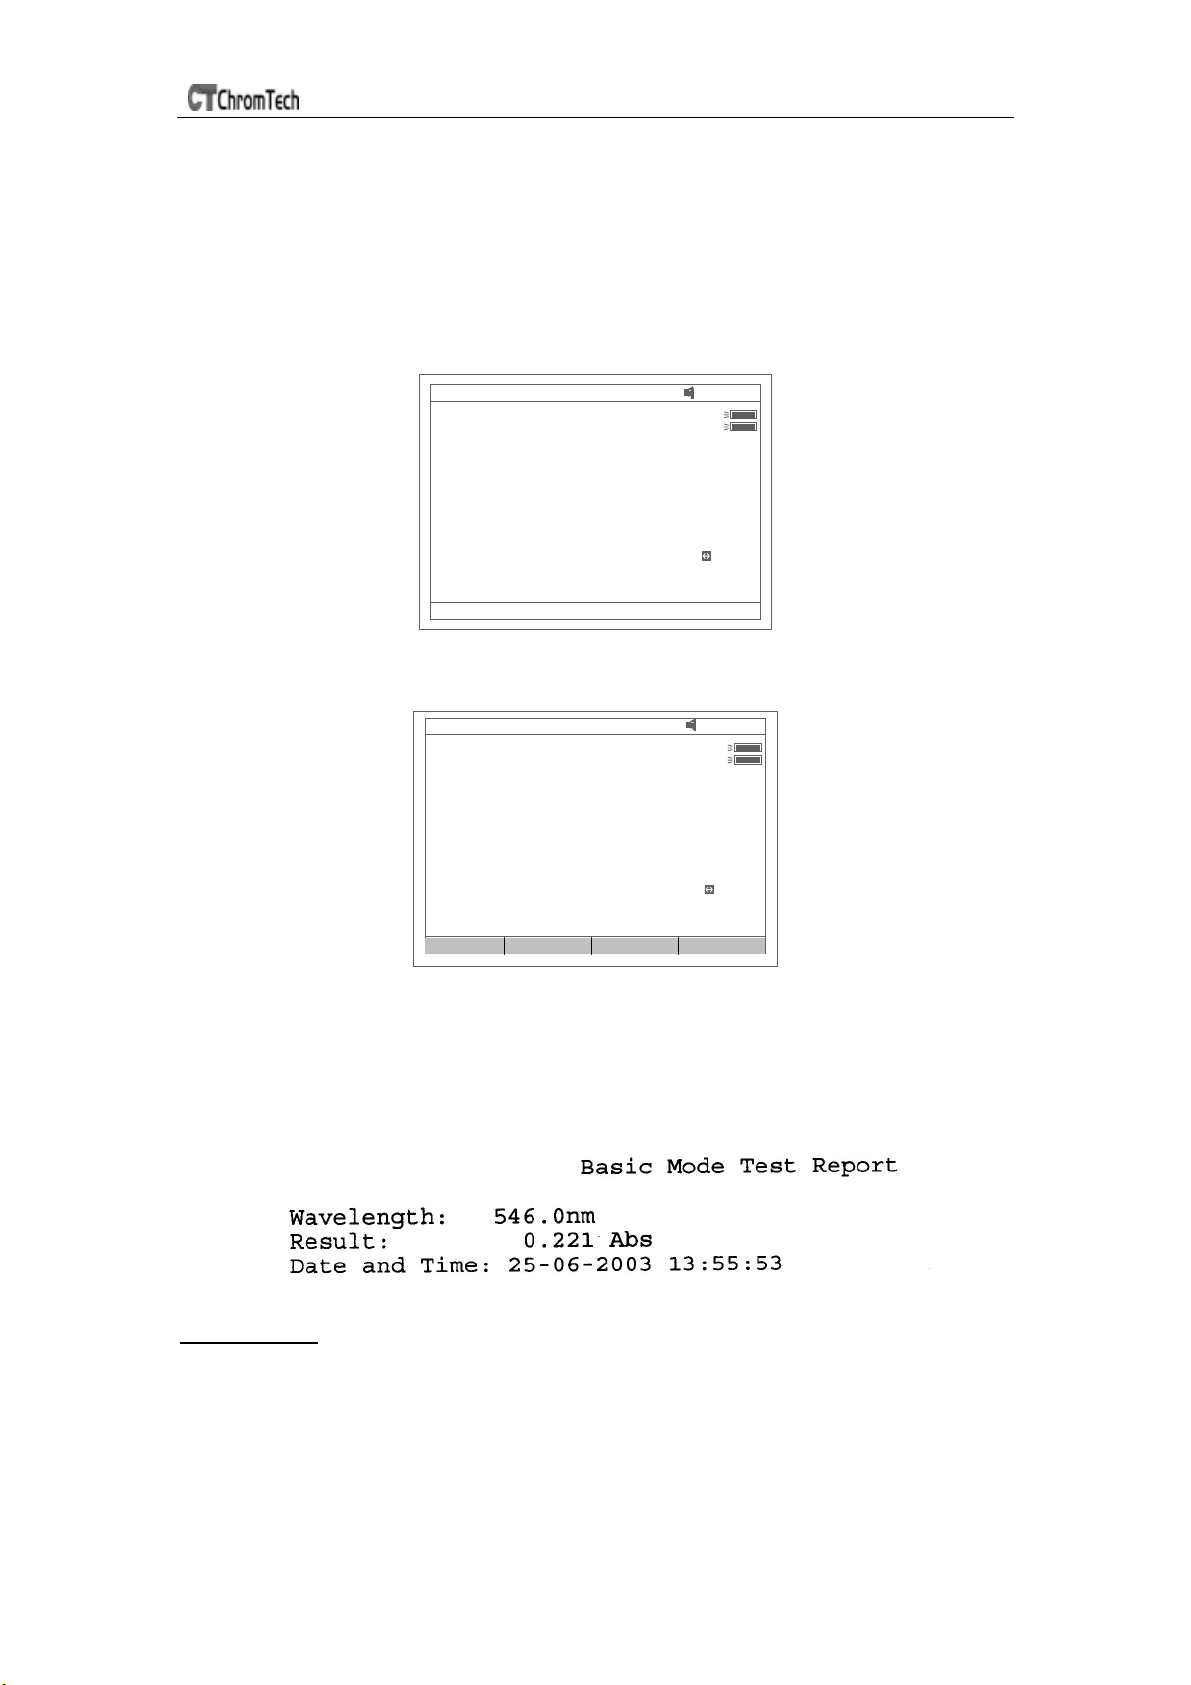
4.1 Press【F3】to input known F value, Fig 22. Then push the sample into
14
Page 15
UV-3 SERIES SPECTROPHOTOMETER
light path to take reading of concentration
4.2 Push sample of known concentration into the light path
Press【F4】to input known Conc value, Fig 23. Then push the sample
into light path to take reading of concentration.
Note:1.You can select wavelength at any time by pressing【GOTOλ】.
After your selection, instrument always blanks automatically.
2. If F value is more than 9999, the “out of range” will display on
screen.
WL : 656.1nm
0.000 mg/ml
12: 35: 27
D2
W
Cell #1
Max E
Please input F factor: 4
Fig 22
WL : 656.1n m
0.000 mg/ml
F=4.000
Unit Mode Fa ctor Sta ndar d
Fig 23
☺ Print Test Report
Press 【PRINT】to print test results (Fig 24).
12: 35: 27
D2
W
Cell #1
Max E
Fig 24
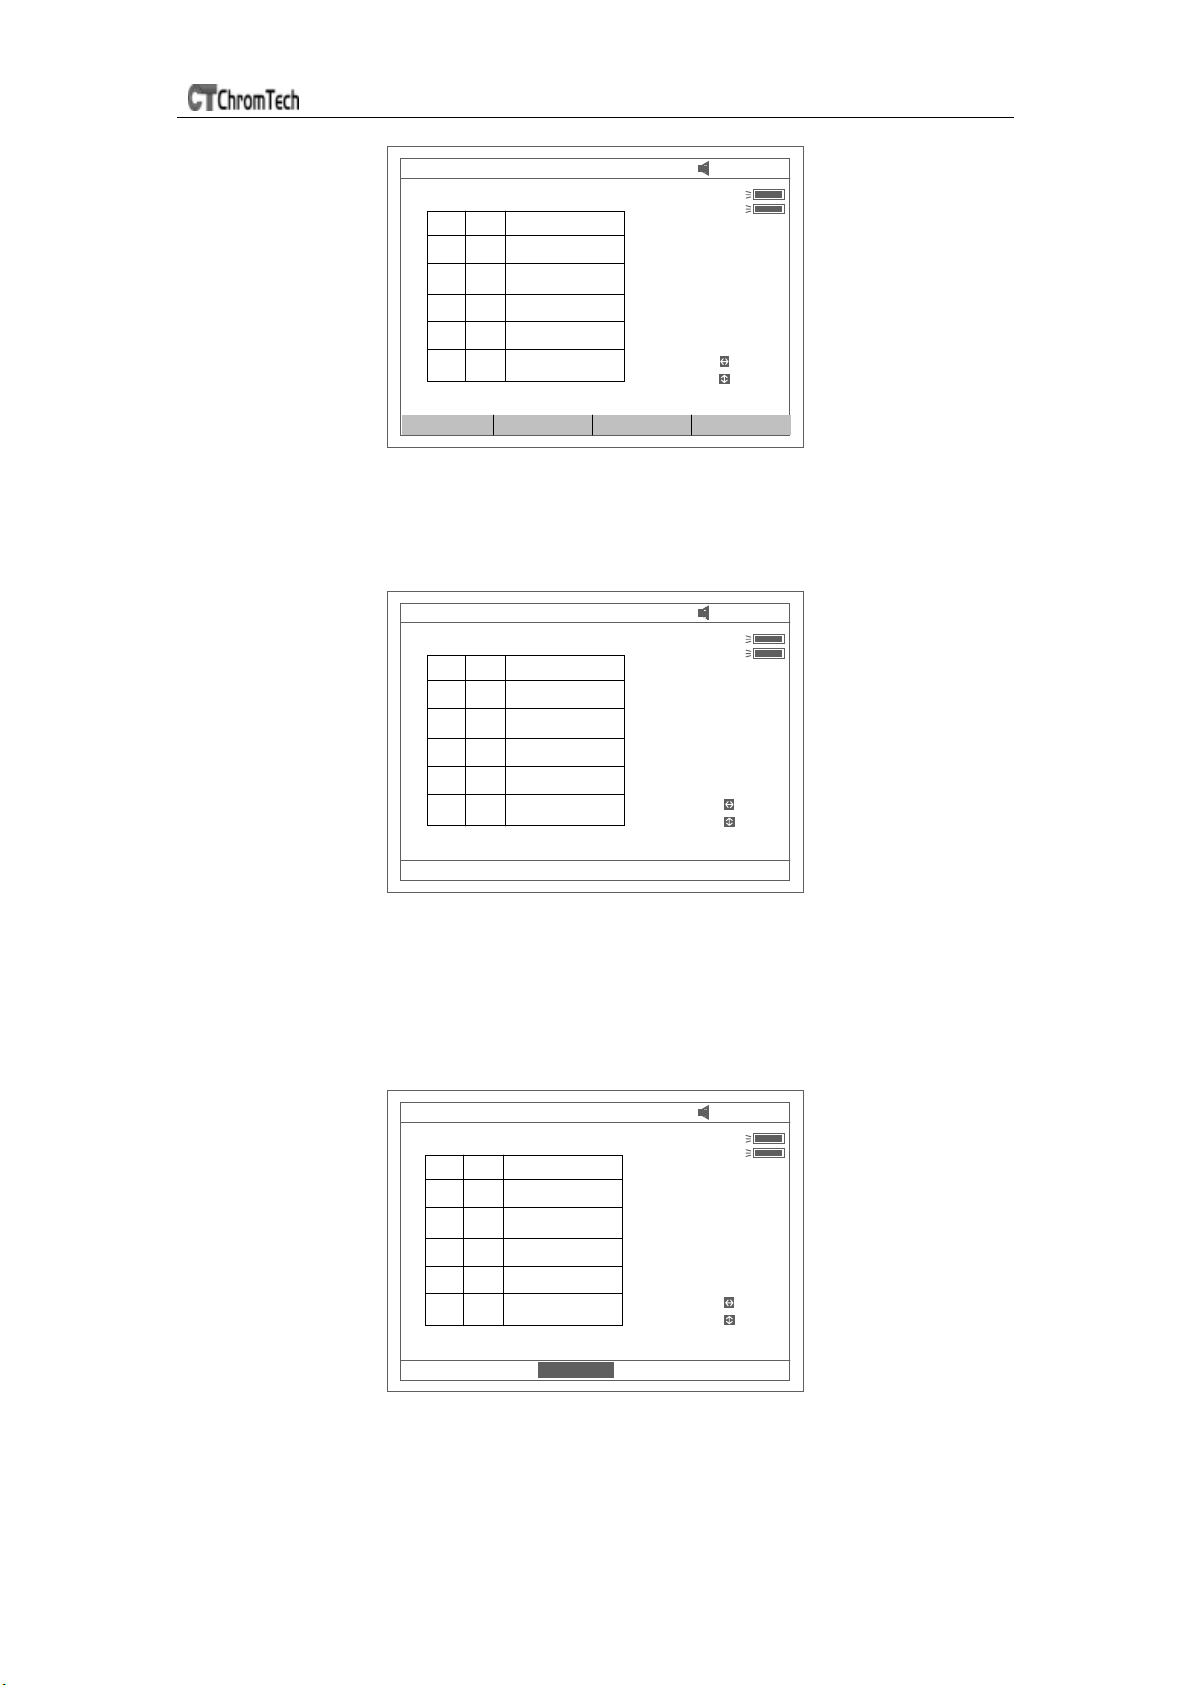
Quantitative
Press【2】in Main Menu for “Quantitative” Test (Fig 25). Press【ESC】to exit.
Note: .If no automatic changer installed “cell #1” will disappear in Fig25.
15
Page 16
UV-3 SERIES SPECTROPHOTOMETER
)WL(nm)
)WL(nm)
)WL(nm)
WL : 700.0nm Abs :
Quantitative Test
ID Abs Conc . ( mg/L
C=1.000 *A^1 r=1.000
Unit F it Curv e
12: 35 : 27
D2
W
Cell #1
700 .0
Search
Scroll
Fig 25
☺ How to operation
1. Press 【F1】to select unit of concentration (Fig 26).
WL : 700.0nm Abs:
Quantitative Test
ID Abs Conc . ( mg/L
12: 35: 27
D2
W
Cell #1
700 .0
Search
Scroll
C=1.000 *A^1 r=1.000
Please select unit: g/L
Fig 26
2 Press 【GOTOλ】 to select correction methods and enter the
wavelength. There are three correction methods (single WL,
Iso-absorbance and 3 point, Fig 27) .
Note: Please refer to the Appendix B for the correction method.
WL : 700.0nm Abs :
Quantitative Test
ID Abs Conc . ( mg/L
C=1.000 *A^1 r=1.000
Correction method: Single WL
12: 35: 27
D2
W
Cell #1
700 .0
Search
Scroll
Fig 27
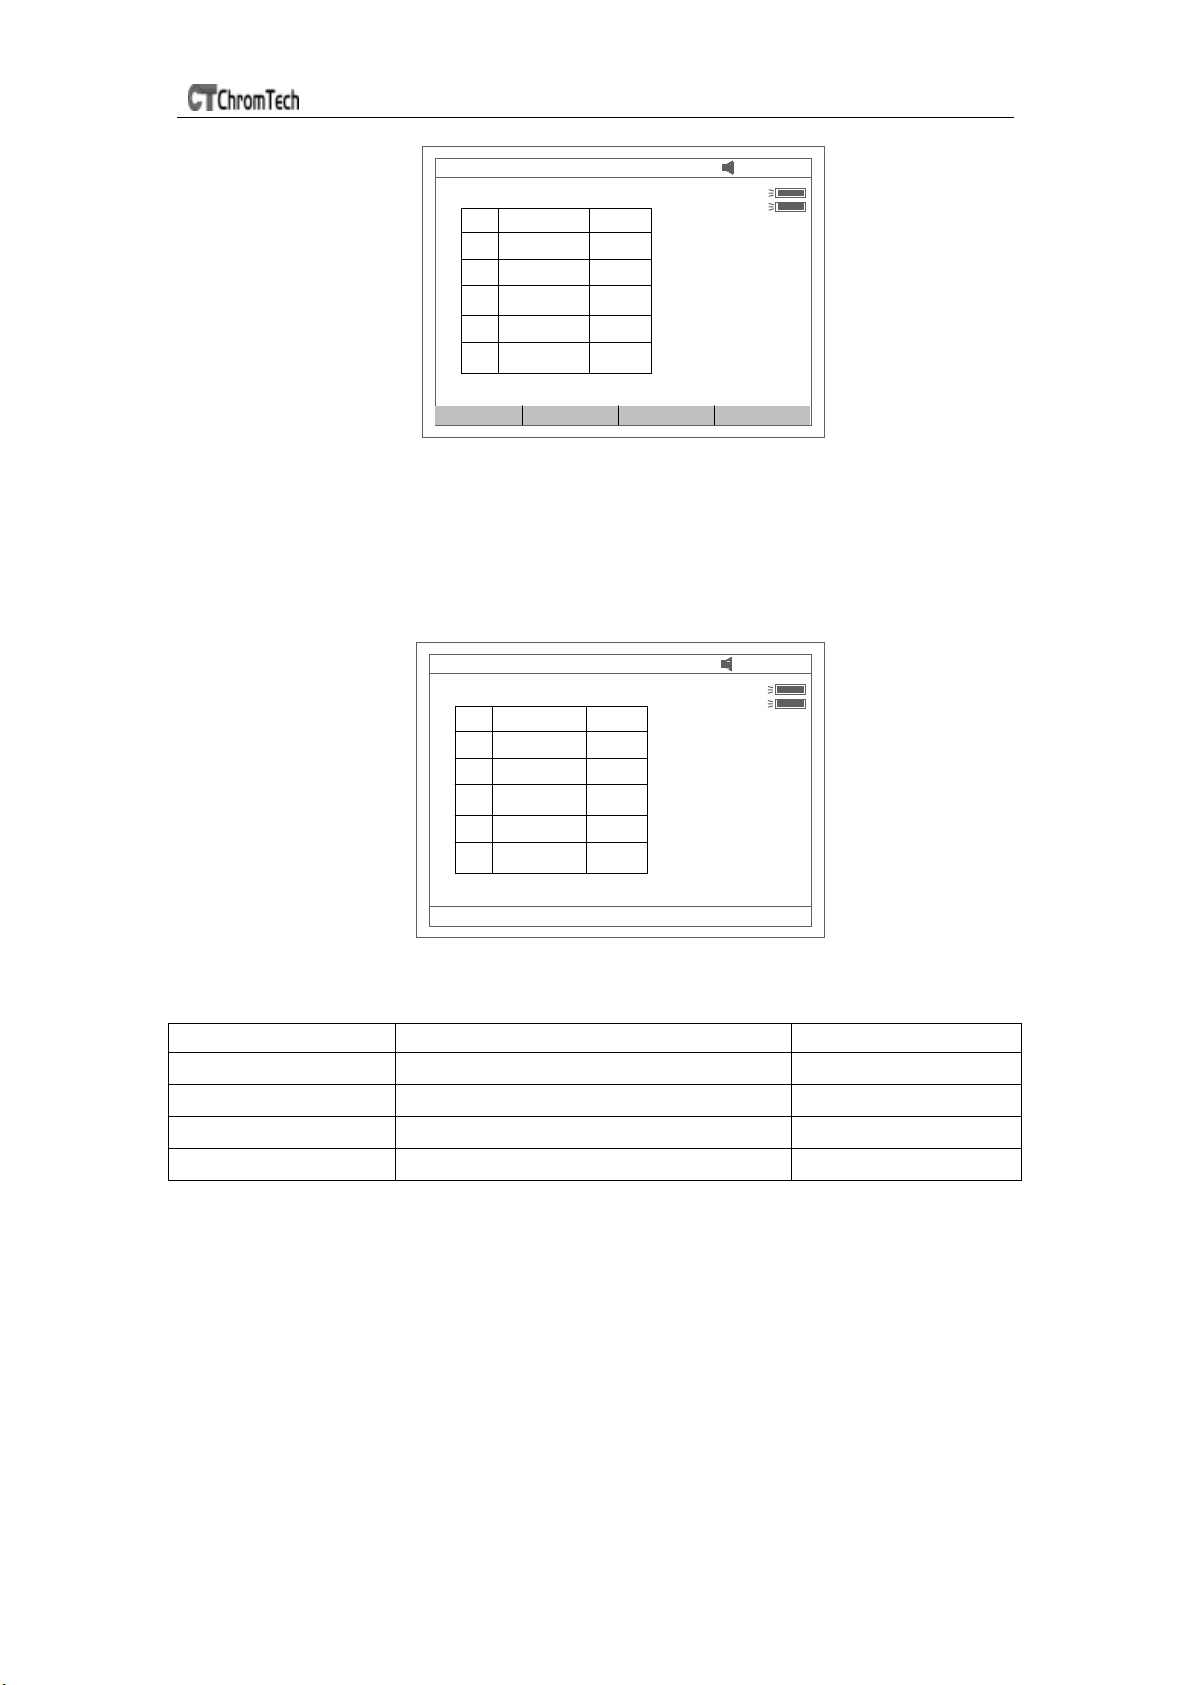
3.Press 【F2】in Fig 25 for more items to select .See Fig 28.
16
Page 17
UV-3 SERIES SPECTROPHOTOMETER
(nm)
WL : 700.0nm Abs :
Calibration table
No Conc . ( mg/L) Abs
C=1.000* A^1 r=1.000
Method Params Standard Show Curve
12: 35 : 27
D2
W
Cell #1
WL
700 .0
Fig 28
3.1 Press 【F1】in Fig 28 to select fitting method. There are 4 methods for
you to choose: Linear fit, linear fit through zero, square fit and cubic fit.
3.2 Press 【F2】in Fig 28 to enter directly a known standard curve.Fig29.
WL : 700 .0nm Abs :
Calibration table
No Con c. (m g/L) Abs
12: 35 : 27
D2
W
Cell #1
WL(nm)
700 .0
C=1.000 *A^1 r=1.000
Input K1=1.033
Fig 29
The constants to be entered are depending on which fitting method selected. The
table below lists their relation:
Fitting Method Fitting Equation constants
linear fit through zero
Linear fit
square fit
cubic fit
C=K1×A
C=K0+K1×A
C=K0+K1×A+K2×A2
C=K0+K1×A+K2×A2+K3×A3
K1, r*
K0,K1,r*
K0,K1,K2
K0,K1,K2,K3
* r : regression coefficients, default=1
3.3 Press 【F3】in Fig 28 to establish a standard curve by measuring a
group of standard samples. See Fig 30.
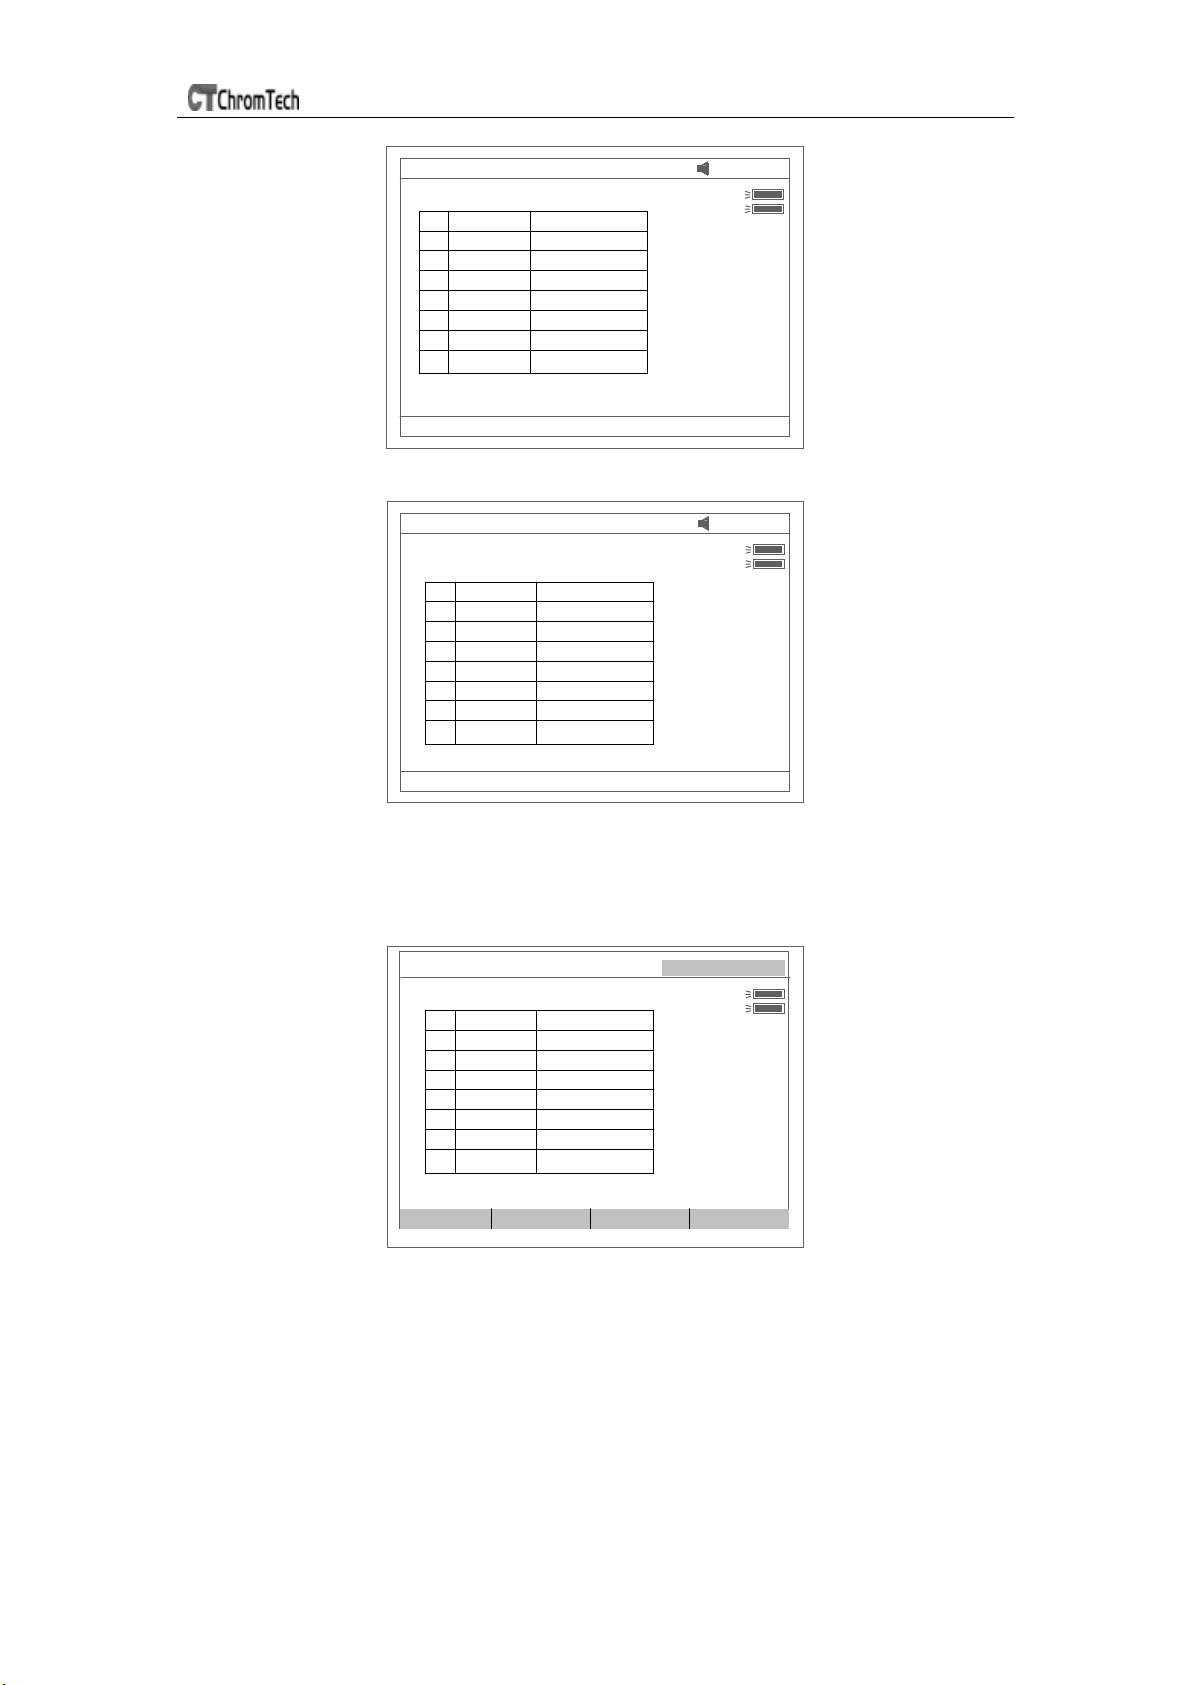
3.3.1 Enter standard concentrations of samples by pressing the
Numeric keypad followed by【ENTER】. Press 【∧】or【∨】 to
modify the inputted data (Fig31).
Press【ESC】to finish inputting and to exit (Fig 32).
17
Page 18
UV-3 SERIES SPECTROPHOTOMETER
(nm)
)
(nm)
WL : 700.0nm A bs :
Setup Standard Conc.
ID Abs Conc. (mg/L)
1 0.062 0.062
2 0.061 0.061
3 0.062 0.061
4 0.061 0.061
C=1. 000*A^1 r=1 .000
Edit the number . . .
Fig 30
WL : 700.0nm Abs :
Setup Standard Conc.
ID Abs Conc. (mg/L)
1 0.062 0.062
2 0.061 0.061
3 0.062 0.061
4 0.061 0.061
12: 35: 27
D2
W
Cell #1
WL
700 .0
12: 35: 27
D2
W
Cell #1
WL(nm
700 .0
C=1. 000*A^1 r=1 .000
Input Standard Conc: 3
Fig 31
3.3.2 Push the blank cuvette into the light path, press
【0Abs/%100T】,the instrument will step to the wavelength and
blank. See Fig 32.
WL : 700.0nm Abs : Blan king …..
Calibration table
ID Abs Conc. (mg/L)
1 0.062 0.062
2 0.061 0.061
3 0.062 0.061
4 0.061 0.061
C=1.000 *A^1 r=1.000
Method Params Standard Show Curve
D2
W
Cell #1
WL
700 .0
Fig 32
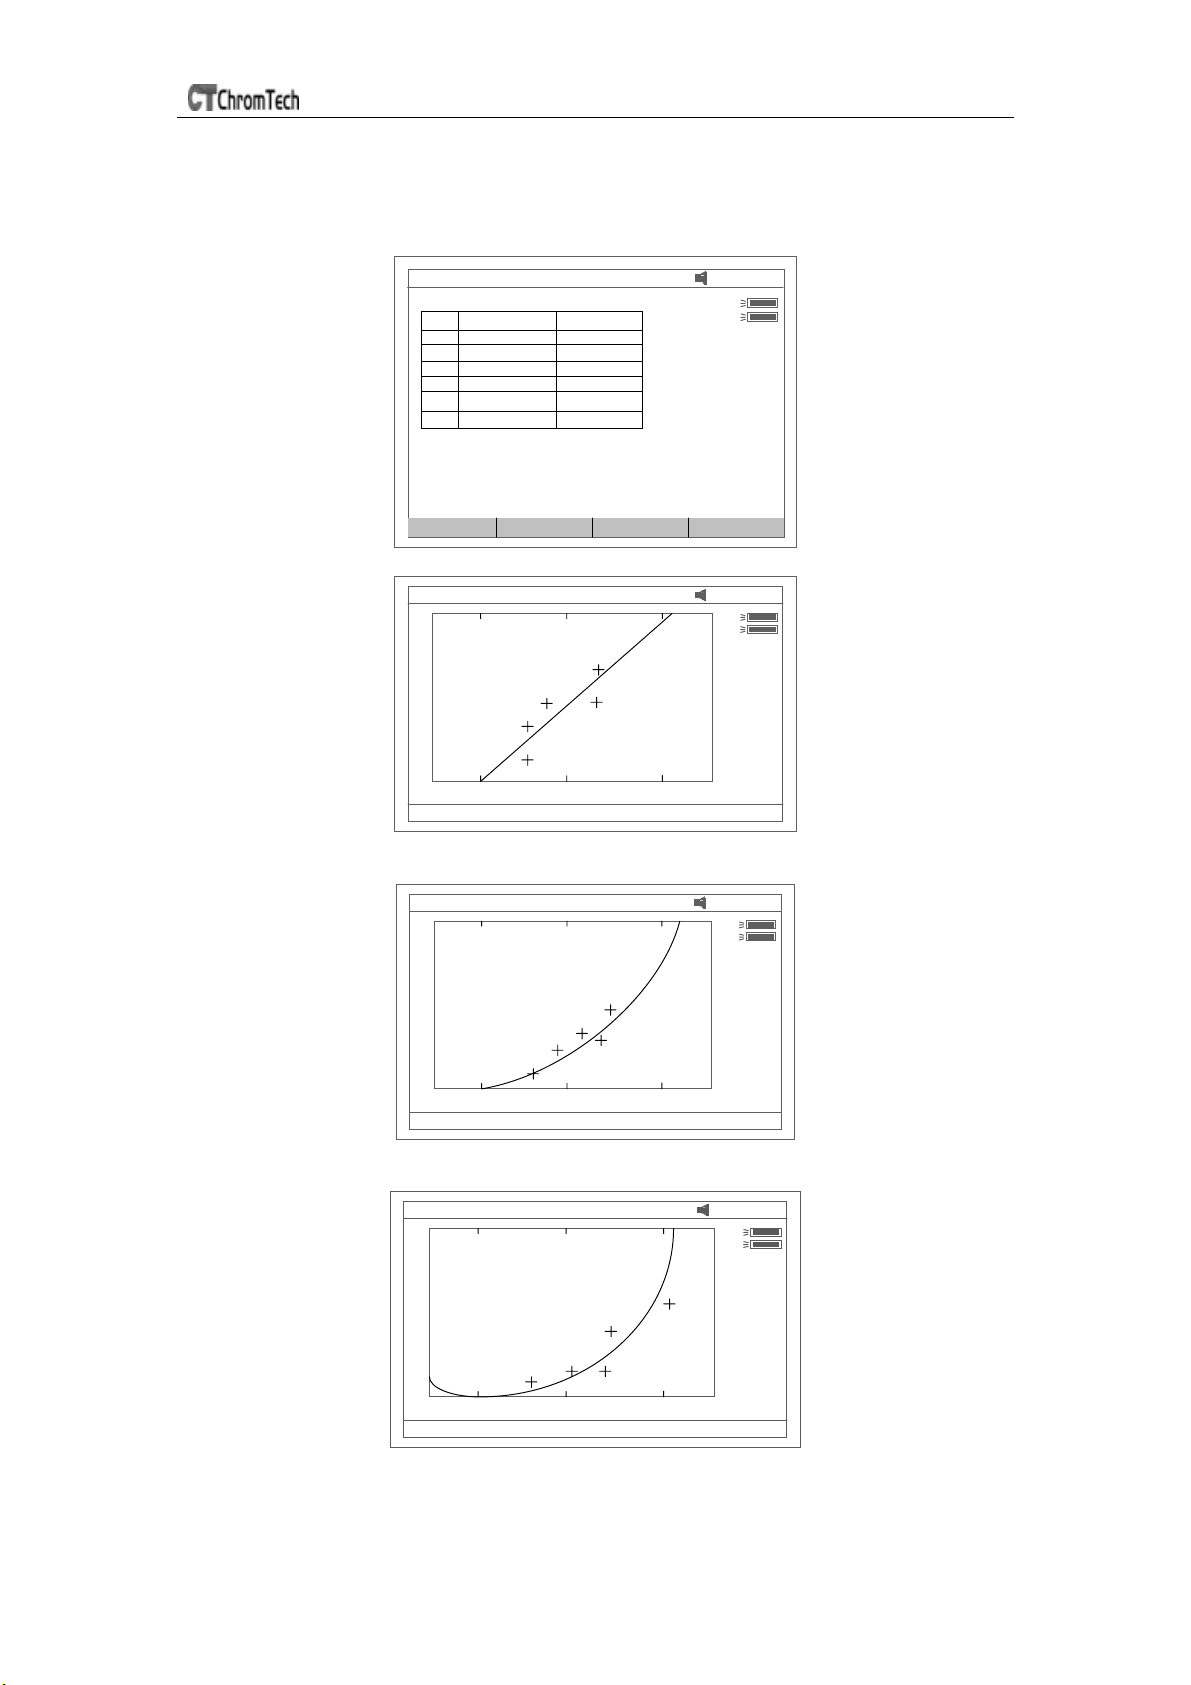
3.3.3 Pull the first sample cuvette of known concentration into the
light path, Press the key【START/STOP】to get values of
standard curve one by one (Fig 33).
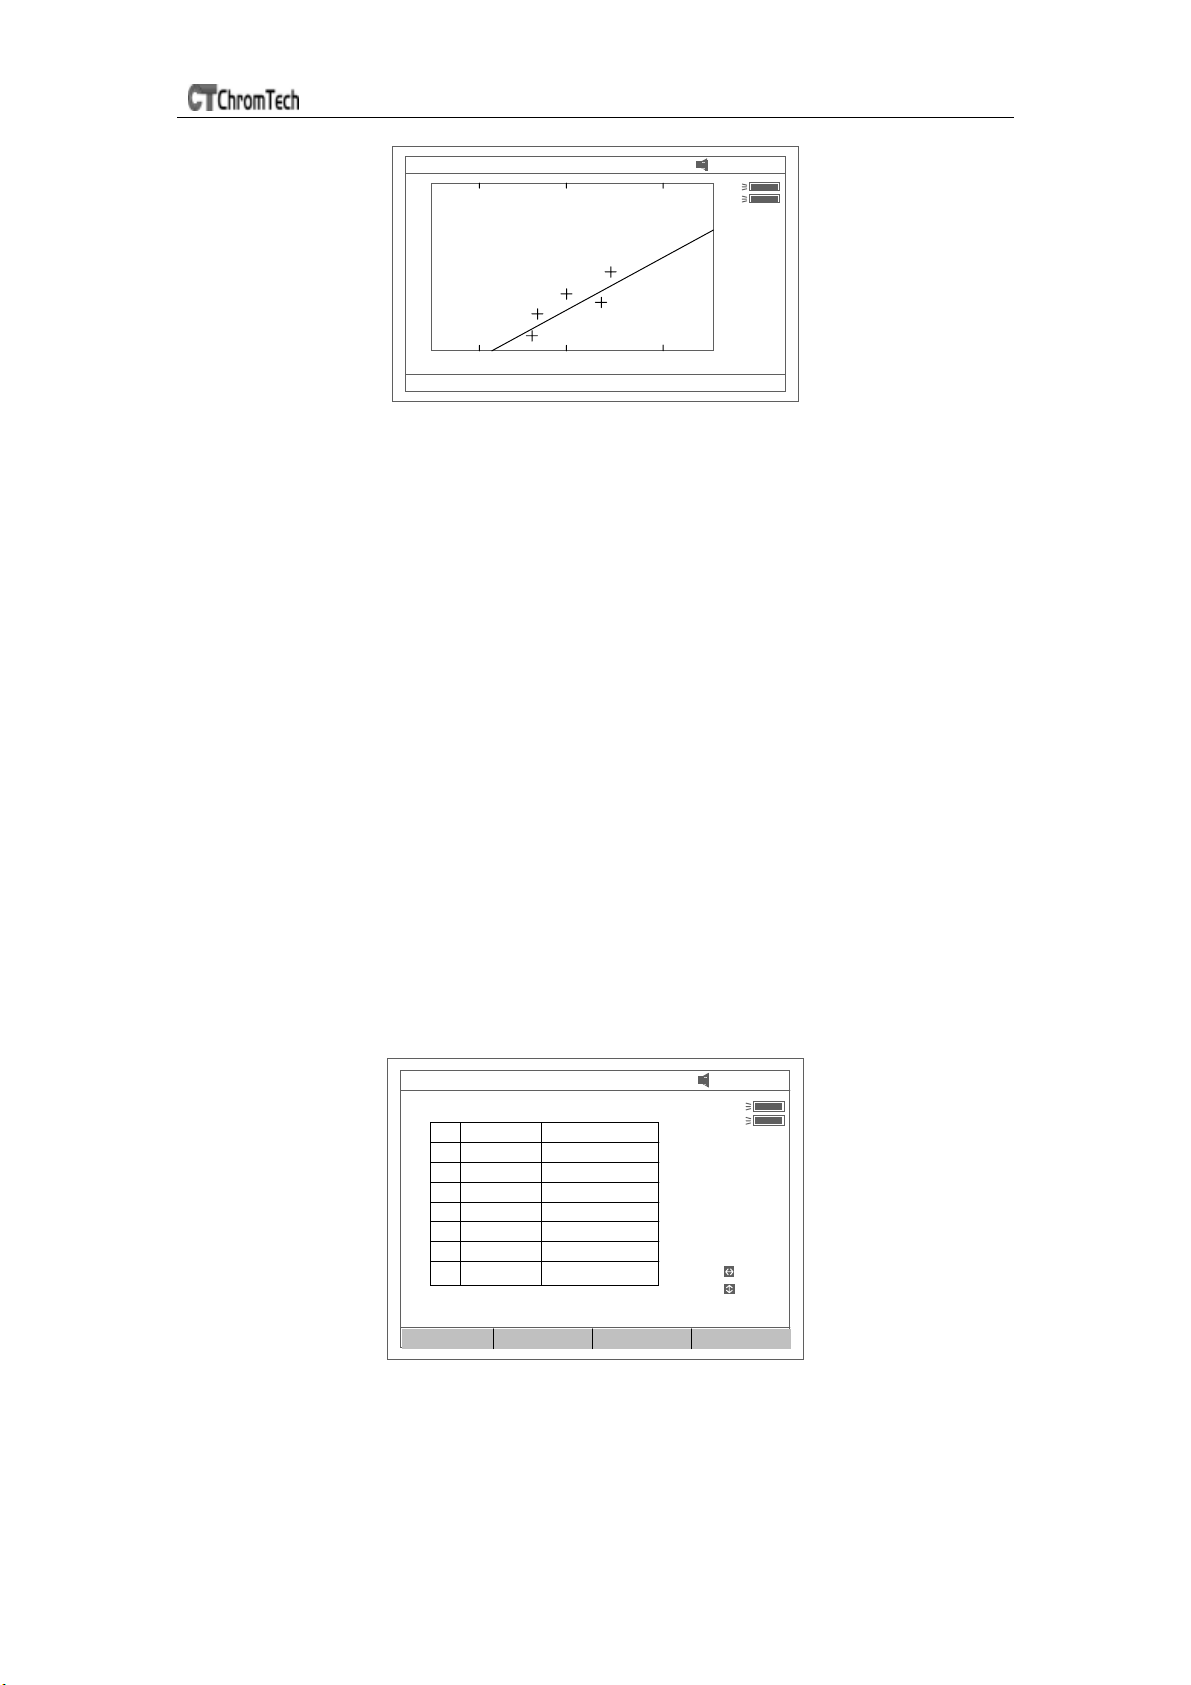
3.3.4 Press【F4】to draw the curve. You can get a different curve by
pressing【F1】 to select a different fitting method.
See Fig 34 - Fig37.
For linear fits, “ r ” represent fitting coefficient of linear
18
Page 19
UV-3 SERIES SPECTROPHOTOMETER
)
regression .r=1 is best fitting. Usually “ r ” is very close to 1.
Note: If there are few standard samples, it is not suitable for
selecting square fitting, especially cubic fitting, otherwise invalid
fitting result will be obtained.
WL : 656.1 nm Abs :
Calibration table
No Conc . ( mg/L) Abs
1 2.000 0 .247
2 3 .000 0 .375
3 4 .000 0 .532
4 5 .000 0 .603
5 6 .000 0 .764
C=1.000*A^1 r=1.000
Method Params Standard Show Curve
Fig 33
WL : 656.1nm Abs:
0 Conc. 76
-1.0 Abs 4.0
Press (ESC) to return . . .
Fig 34 linear through zero fit
12: 35: 27
D2
W
Cell #1
WL(nm
700 .0
12: 35: 27
D2
W
Cell # 1
WL : 656.1nm Abs:
12: 35: 27
D2
W
Cell #1
0 Conc. 76
-1.0 Abs 4.0
Press (ESC) to return . . .
Fig 35 square fit
WL : 656.1nm Abs :
0 Conc. 91438
-1.0 Abs 4.0
Press (ESC) to return . . .
Fig 36 cubic fit
19
12: 35: 27
D2
W
Cell #1
Page 20
UV-3 SERIES SPECTROPHOTOMETER
)
WL : 656.1nm A bs:
0 Conc. 76
-1.0 Abs 4.0
Press (ESC) to return . . .
12: 35: 27
D2
W
Cell #1
Fig 37 linear fit
3.3.5 Press 【SAVE】 to save calibration if required
3.3.6 Press【ESC】to exit
4. Quantitative Test
Before test, the standard curve must be obtained. There are three
ways for you to obtained it (a, b or c).
a) Standard curve built up and saved in the instrument.
In Fig 33 press【OPEN 】and then press【∧】or【∨】 to select the
file with type ***.fit. At last press【ENTER】to confirm.
b) Known standard curve, which is not saved in the instrument.
See 3.2. For Fig 28 enter a known standard curve directly.
c) Use the standard samples for the test. First the standard curve must
be established using the method shown in 3.3.
Note: All sample results must be taken in screen (Fig25).
4.1 Push the blank cuvette into the light path and press 【0Abs/100%T】for
blanking.
4.2 Pull the sample cuvette into the light path, press the key
【START/STOP】, the results will be displayed on the screen (Fig 38).
WL : 700.0nm Abs :
Quantitative Test
ID Abs Conc . (mg/L)
1 0.062 0.062
2 0.061 0.061
3 0.062 0.061
4 0.061 0.061
C=1.000 *A^1 r=1.000
Unit F it Curv e
12: 35 : 27
D2
W
Cell #1
WL(nm
700 .0
Search
Scroll
Fig 38
4.3 If there is more than one sample, repeat step 4.2 for the next sample
4.4 Press 【SAVE 】 to save the results and fitting parameters
20
Page 21
UV-3 SERIES SPECTROPHOTOMETER
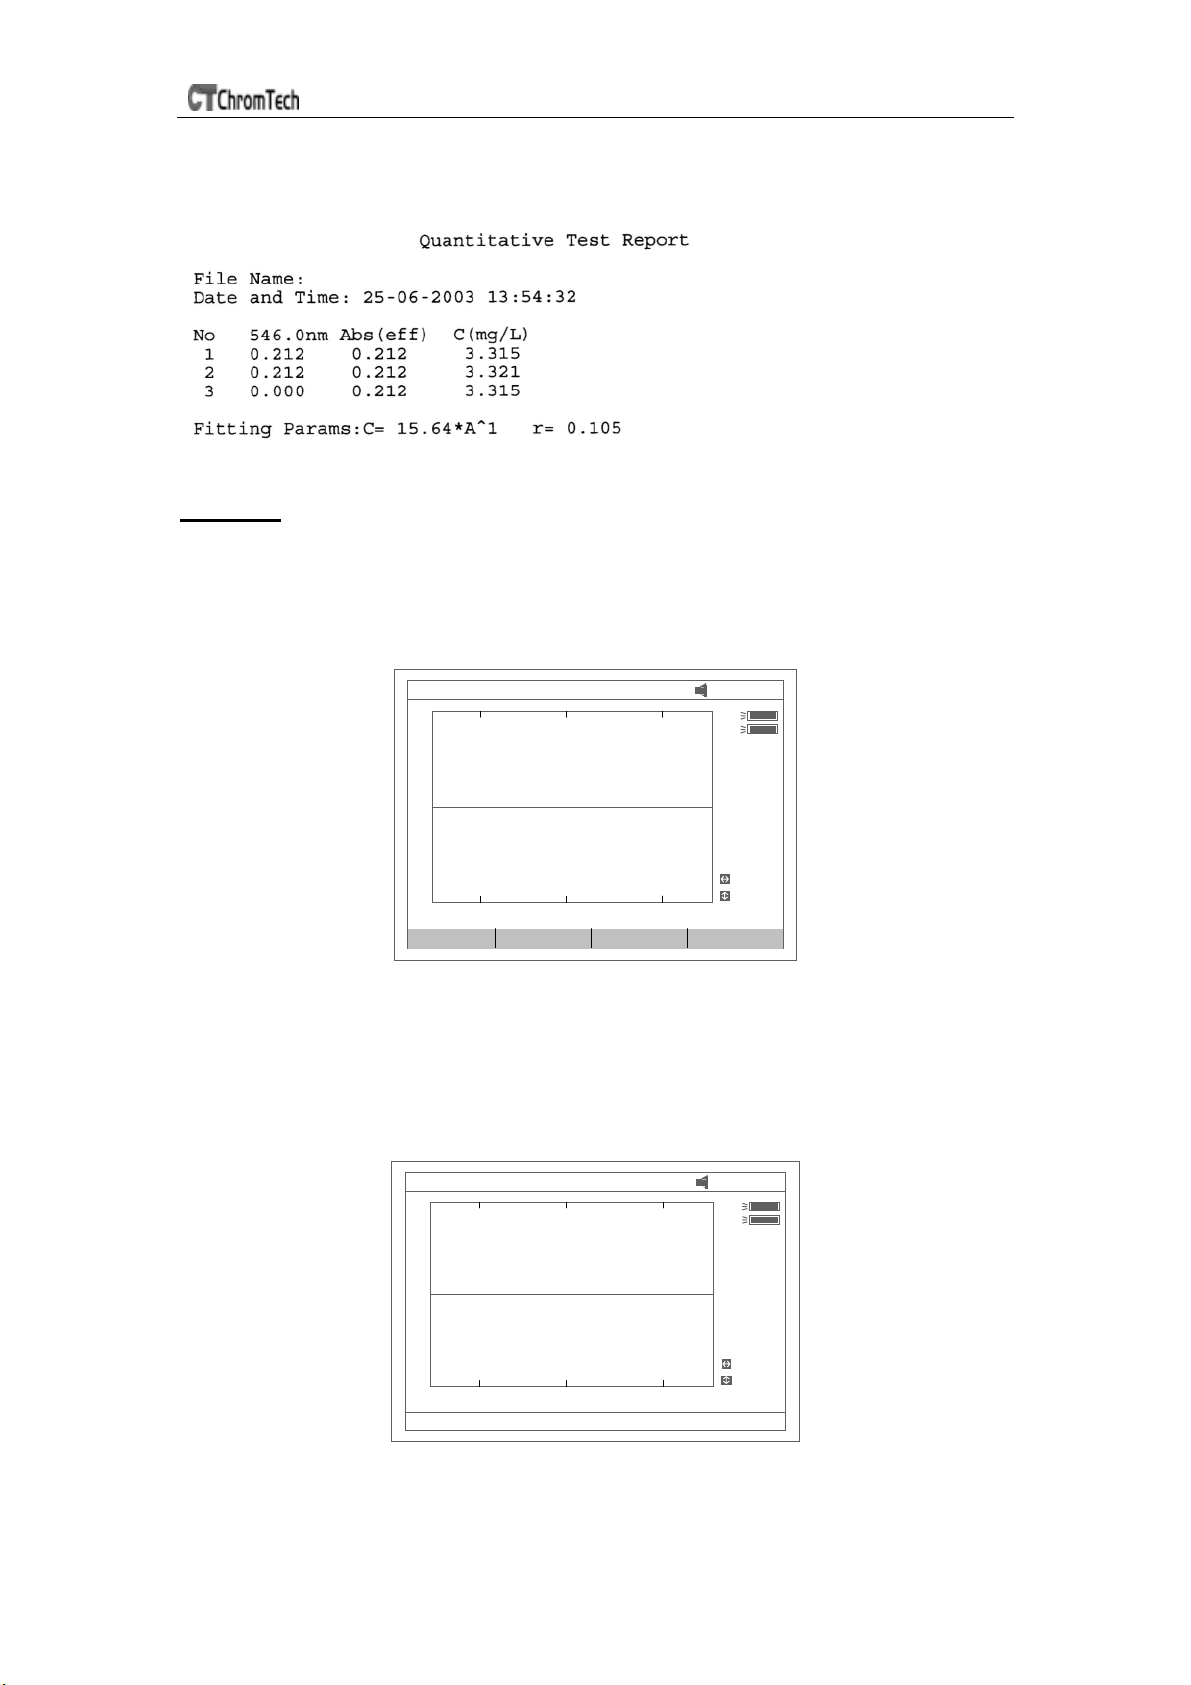
☺ Print Test Report
Press the key【PRINT】to print the test report (Fig 39).
Fig 39
WL Scan
Press【3】in main menu for “WL Scan” test (Fig 40). 【ESC】to exit.
To open a previous curve, press【OPEN】and select a previously stored curve
(.wav)
WL : 656.1 nm Abs :
0 %T 120.0
200.0 Wavelength (nm) 680.0
Setup Mode Search Smooth
12: 35: 27
D2
W
Cell #1
From:
200 .0
To:
680 .0
Step:
1 .0nm
XScale
YScale
Fig 40
☺ Scan sample
1. Press 【F1】 to setup, input the start wavelength, and end wavelength
by pressing the numeric keypad (Fig 41). Note: The uv-3 SERIES
scans from high to low wavelength. Browse and select the items of
scan step and scan speed by pressing 【∧】or【∨】.
WL : 656.1nm Abs:
0 %T 120.0
200.0 Wavelength (nm) 680.0
Scan from: 680
12: 35: 27
D2
W
Cel l #1
From:
200.0
To:
680.0
Step:
1.0nm
XScale
YScale
Fig 41
Note: “Scan step” allows the selection of 0.1nm, 0.2nm, 0.5nm,1nm ,2nm
21
Page 22
UV-3 SERIES SPECTROPHOTOMETER
and 5nm. “Scan speed” allows the selection of “HI”, “MEDIUM” and “LOW”.
For survey scan we suggest 5nm, HI. For detailed scan we suggest 0.5nm, HI
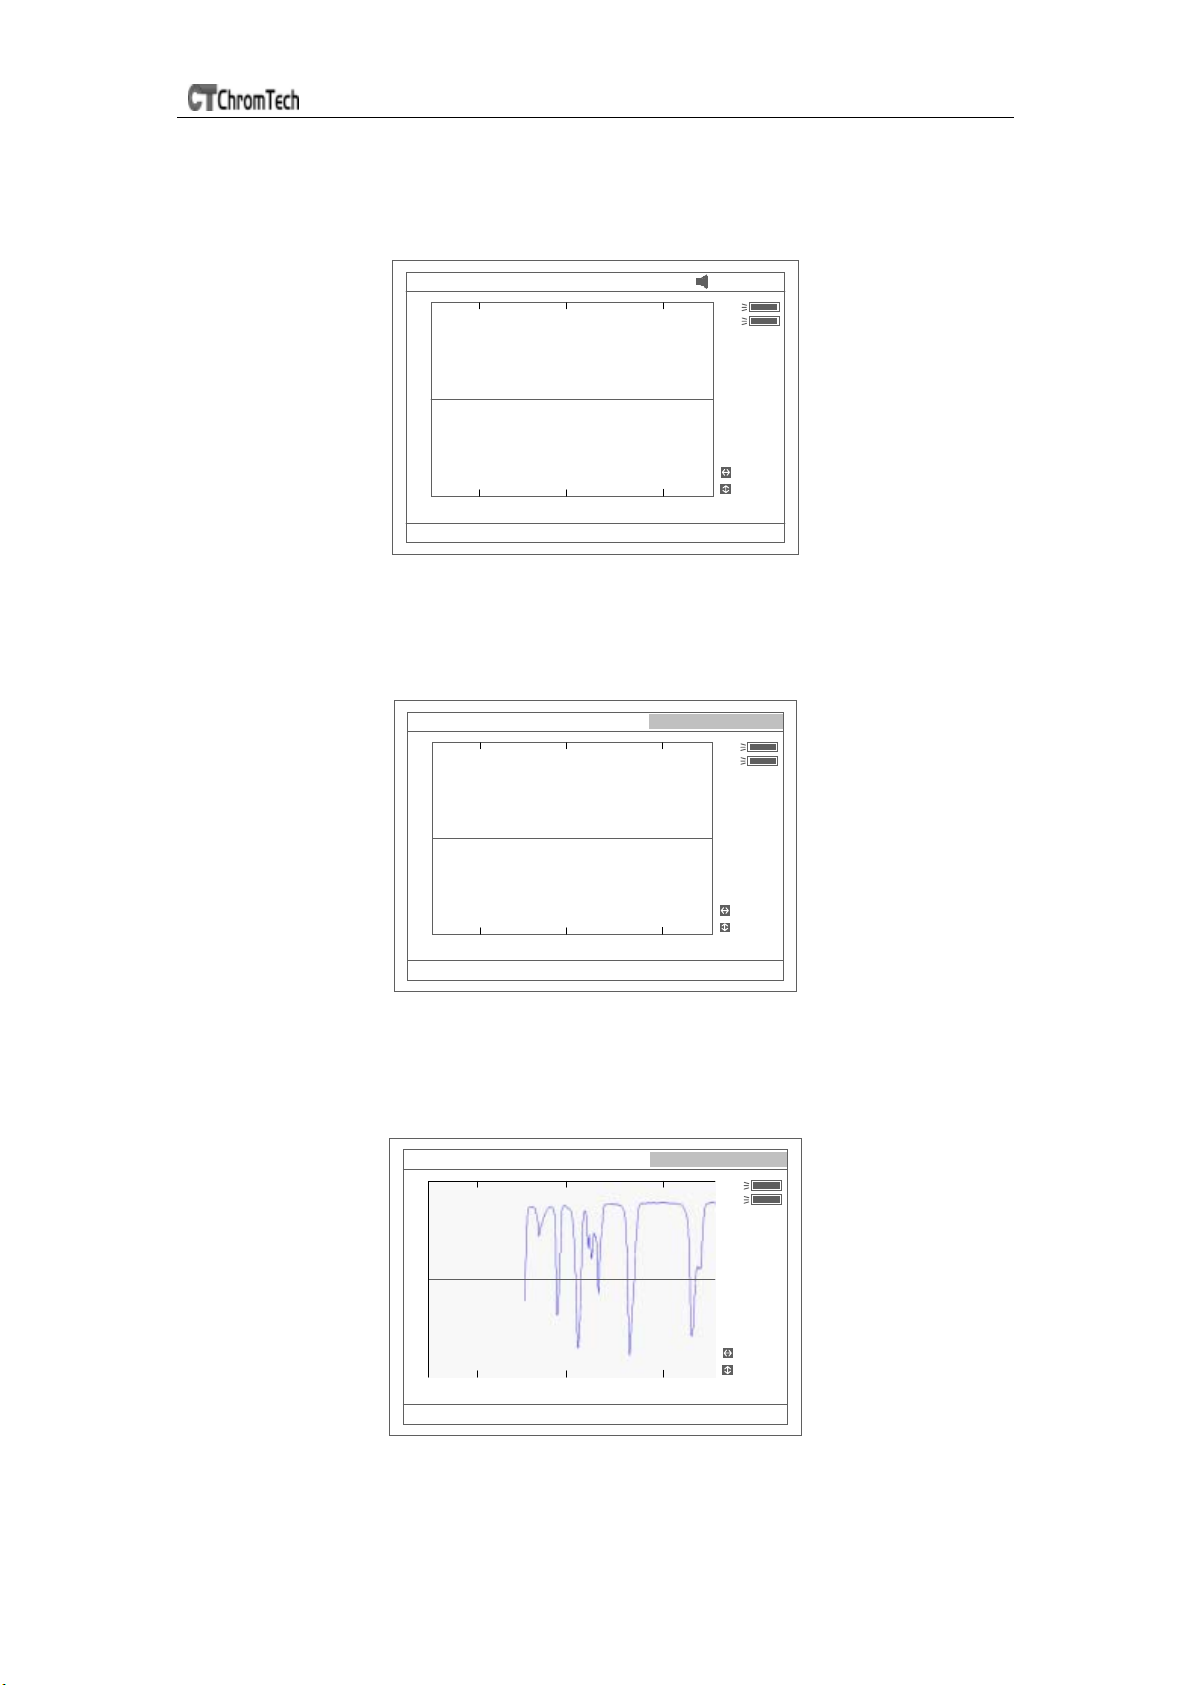
2. Press 【F2】to select the test mode, ”Abs” , “%T” or ”E”’ (Fig 42).
WL : 656.1nm Abs:
12: 35: 27
D2
W
Cell #1
From:
200.0
To:
680.0
Step:
1.0nm
0 %T 1 20.0
200.0 Wavelength (nm) 680.0
Please select mode: Abs
XScale
YScale
Fig 42
3. Push the blank cuvette into the light path, press 【0Abs/100%T】 to
scan the base line (Fig 43). Press the key 【ESC】to stop scanning;
WL : 520.0 nm Scan to 200. 0nm
D2
W
Cell #1
From:
200 .0
To:
680 .0
Step:
1 .0nm
0 %T 120.0
200.0 Wavelength (nm) 680.0
Press (ESC) to stop . . .
XScale
YScale
Fig 43
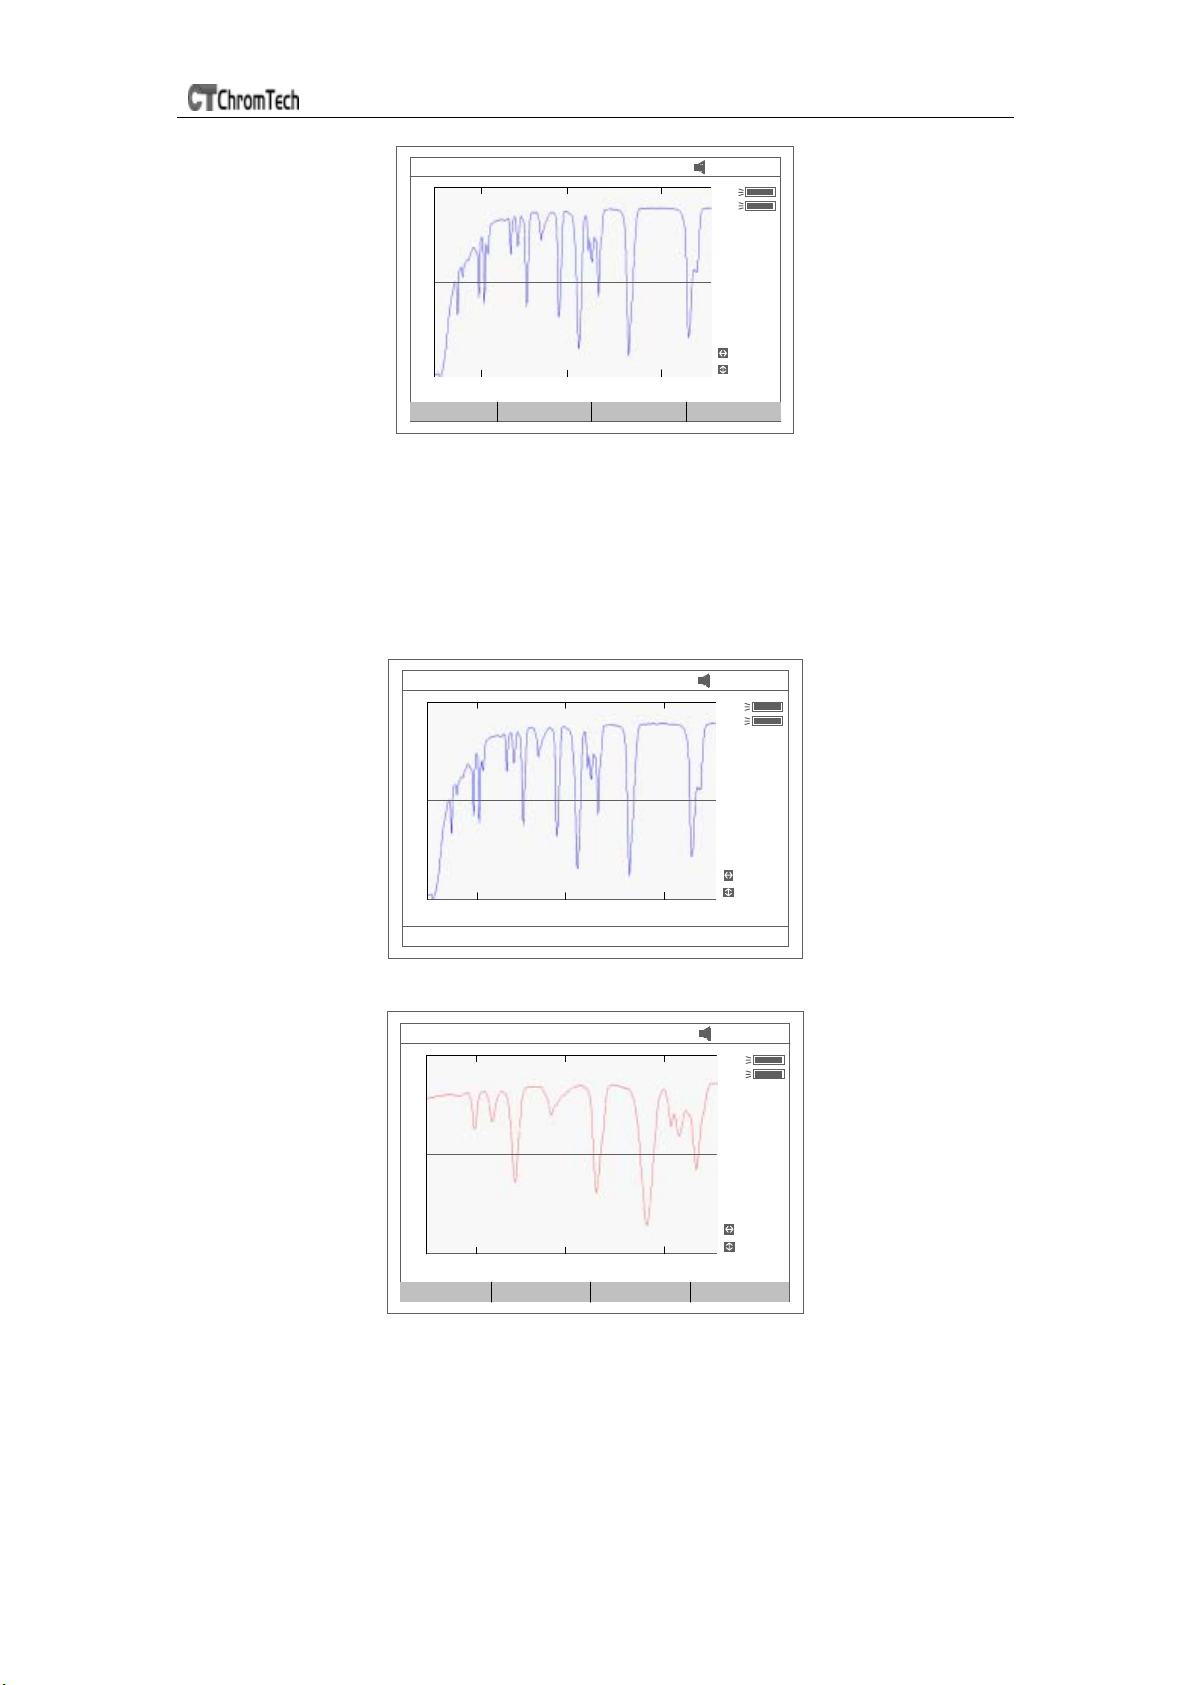
4. Pull the sample cuvette into the light path, press 【START/STOP】to
scan the sample(Fig 44) 【ESC】 to stop scanning. When scan has
finished the beeper beeps 3 times (Fig 45).
WL : 417.0 nm %T: 36 .73 Scan to 200.0 nm
D2
W
Cell #1
From:
200 .0
To:
680 .0
Step:
1 .0nm
0 %T 120.0
200.0 Wavelength (nm) 680.0
Press (ESC) to stop . . .
XScale
YScale
Fig 44
22
Page 23
UV-3 SERIES SPECTROPHOTOMETER
WL : 680 .0nm %T:
0 %T 120.0
200.0 Wavelength (nm) 680.0
Setup Mode S earch Sm ooth
12: 35 : 27
D2
W
Cell #1
From:
200 .0
To:
680 .0
Step:
1 .0nm
XScale
YScale
Fig 45
5 If you want to change the scale, press 【<】 or 【>】 to change “x” scale
(Fig 46), input upper limit and lower limit by pressing the numeric keypad .
To change “y” scale press 【∧】 or【∨】.
After these inputs the instrument will redraw the curve (Fig 47).
WL : 680.0nm %T:
12: 35: 27
D2
W
Cell #1
From:
200.0
To:
680.0
Step:
1.0nm
0 %T 120.0
XScale
YScale
200.0 Wavelength (nm) 680.0
Min X:300
Fig46
WL : 680.0nm %T:
0 %T 100.0
300.0 Wavelength (nm) 500.0
Setup Mode Searc h Smooth
12: 35 : 27
D2
W
Cell #1
From:
200 . 0
To:
680 . 0
Step:
1 .0nm
XScale
YScale
Fig 47
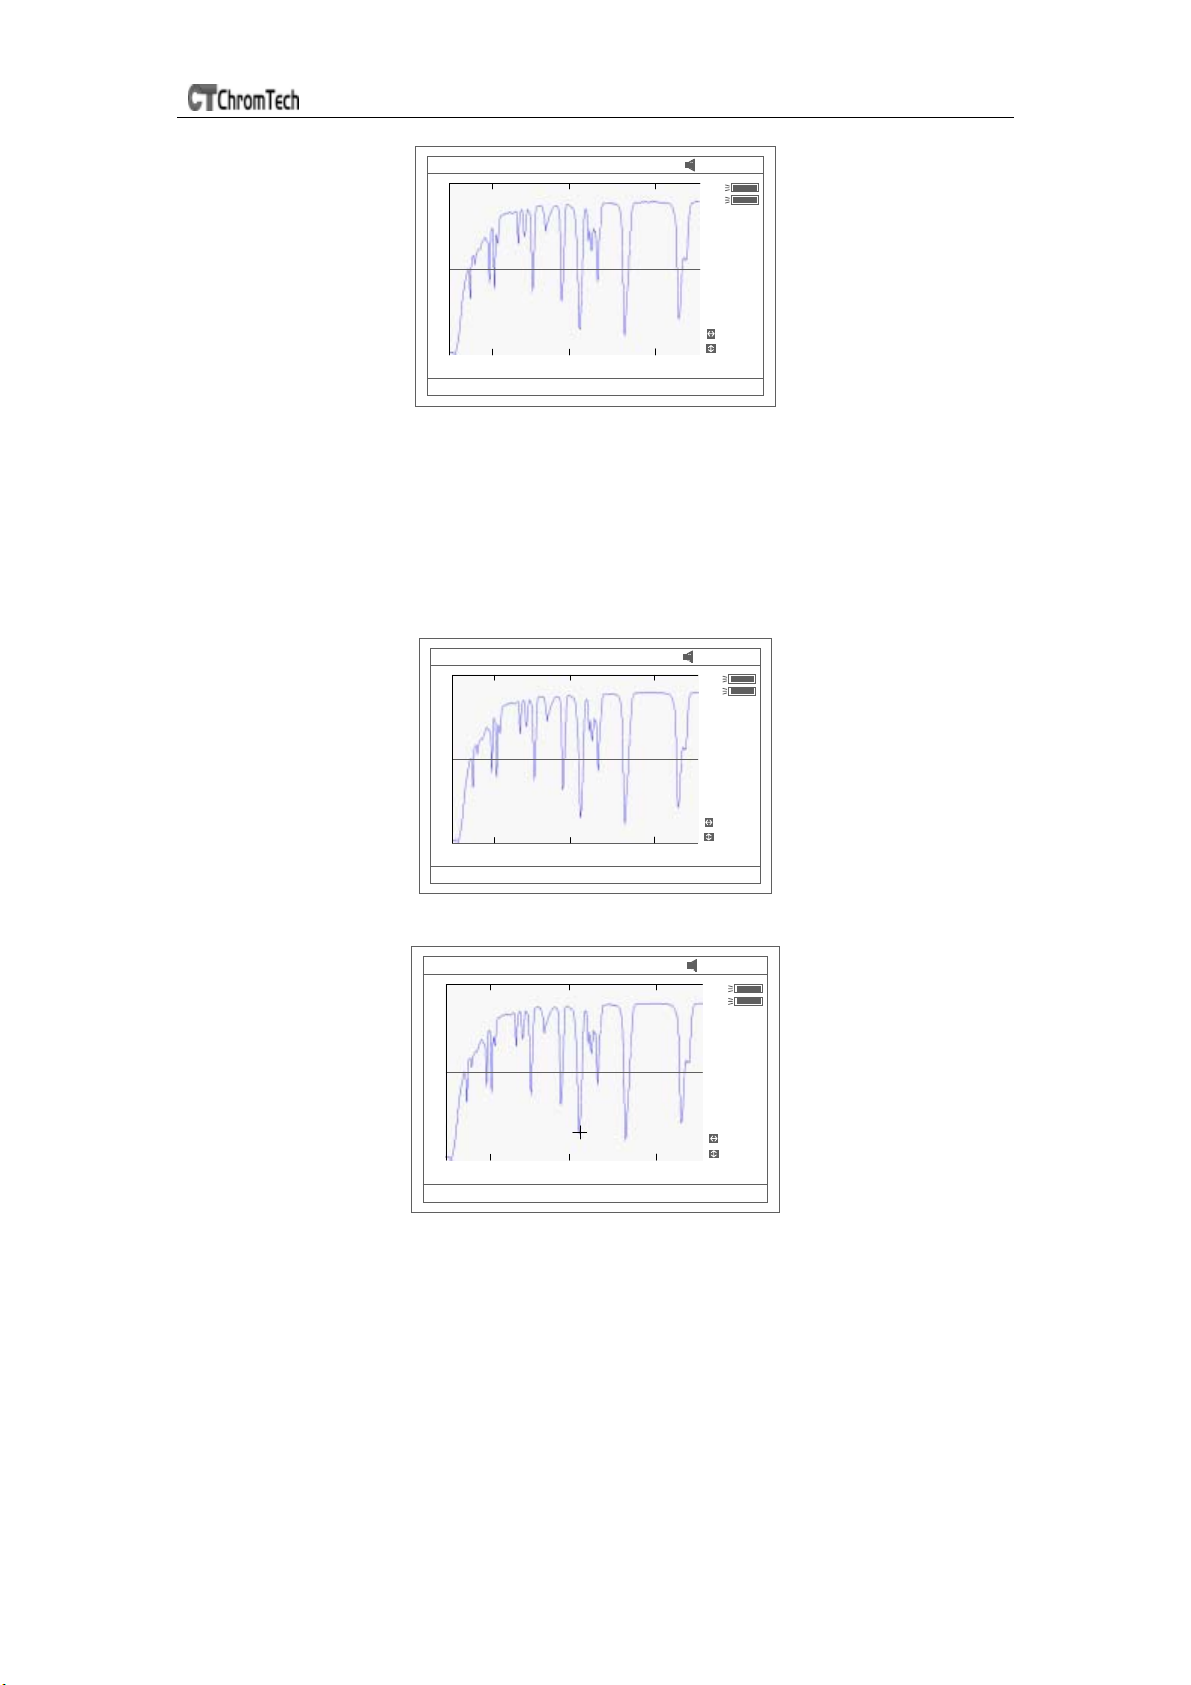
6 Press 【F3】 to search the Abs/%T value of the scan. There are two
ways for you to search (Fig 48).
23
Page 24
UV-3 SERIES SPECTROPHOTOMETER
WL : 680 .0nm %T:
0 %T 120.0
200.0 Wavelength (nm) 680.0
Set Peak Height
12: 35: 27
D2
W
Cell #1
From:
200 .0
To:
680 .0
Step:
1 .0nm
Point
Peak
Fig 48
a) Peak to peak, press
【F1】
pressing the numeric keypad (Fig 49). Press
peak from left to right and press
to set “peak height” and input value by
【∨】
【∧】
to search from right to left.
to search the
The value of every peak found will be displayed on the screen one
at a time (Fig 50).
WL : 680.0nm %T:
12: 35: 27
D2
W
Cell #1
From:
200.0
To:
680.0
Step:
1.0nm
0 %T 120.0
200.0 Wavelength (nm) 680.0
Please input peak height: 0. 100
Point
Peak
Fig 49
WL : 452.0 nm %T:22 .38
0 %T 120.0
200.0 Wavelength (nm) 680.0
Set peak Height
12: 35: 27
D2
W
Cell #1
From:
200 .0
To:
680 .0
Step:
1 .0nm
Point
Peak
Fig 50
b) Point to point, Press
press
【<)
to search from right to left. The search step interval is
【>】
to search the point from left to right and
the same as the scan step. The value of every point searched will
be displayed on the screen.
☺ Save Curve
Press 【SAVE】to save the curve. Note: Open/Save requires the first scan
display page Fig. 47. Press 【ESC】 if in Search to return to the required page
24
Page 25
UV-3 SERIES SPECTROPHOTOMETER
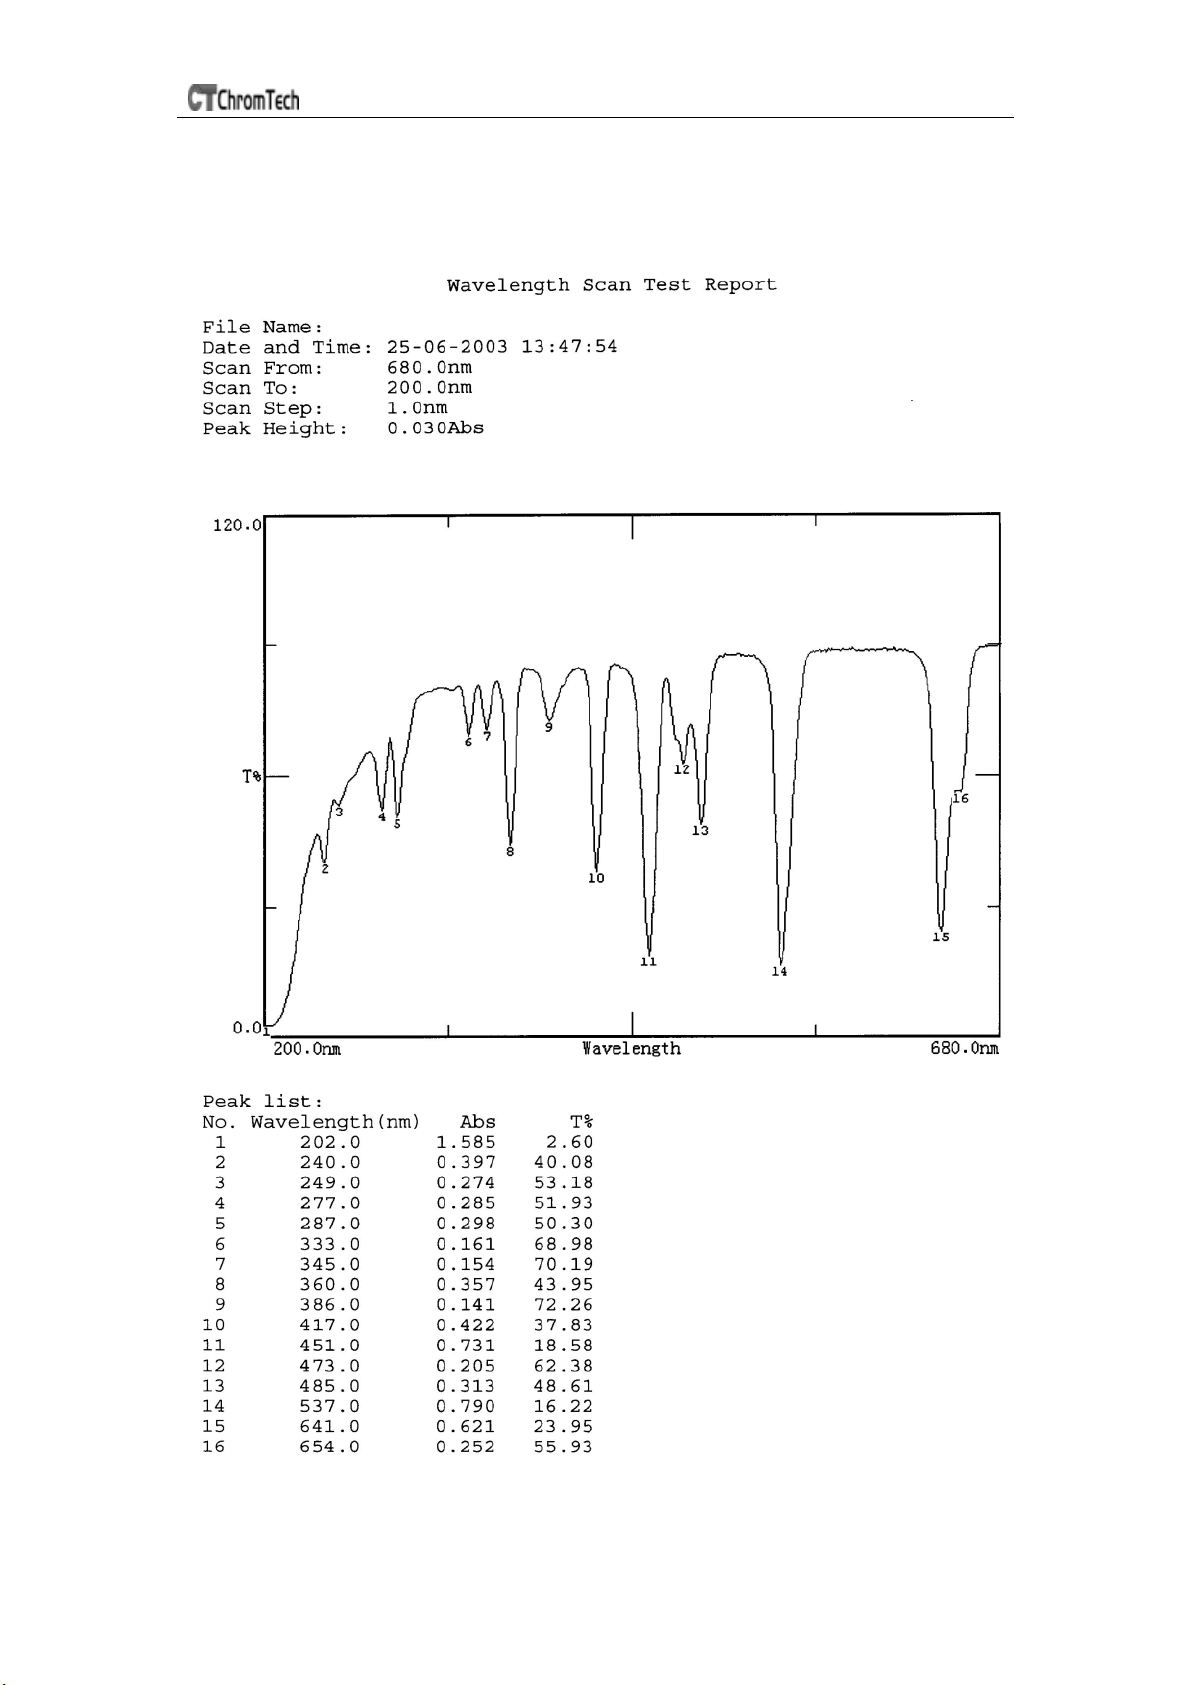
☺ Print Test Report
Press 【PRINT】to print the curve you have opened or scanned (Fig 51).
Note: The report always is printed in Fig 45
Fig 51
25
Page 26
UV-3 SERIES SPECTROPHOTOMETER
Kinetics
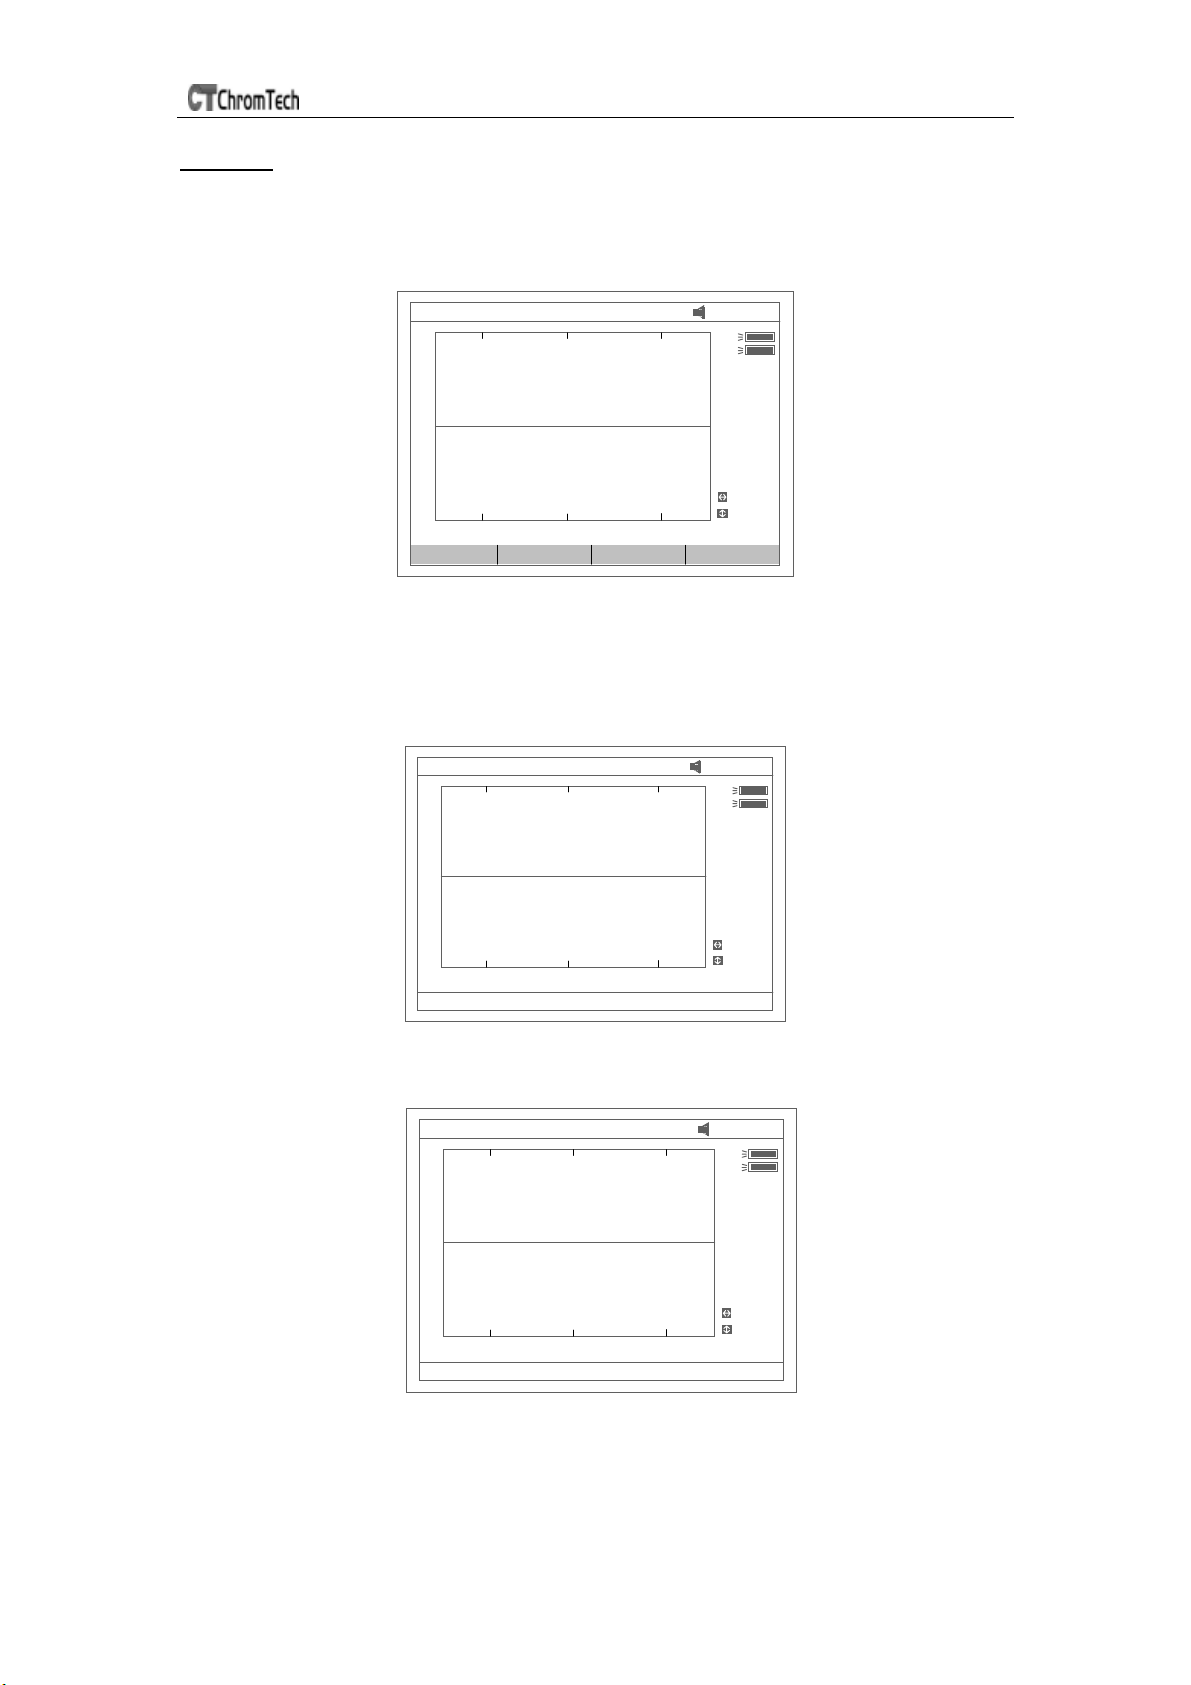
Press【4】in main menu for “Kinetics” (Fig 52). 【ESC】to exit.
To open a previous kinetics result, press 【OPEN】 and select a previously
stored result (.kin)
Tim : 60s Abs :
0 Abs 3.000
0 Time(s) 180
Setup Mode Process Search
12: 35: 27
D2
W
Cell #1
Total T
180 s
Inteval
1 .0s
XScale
YScale
Fig 52
☺ Test
1. Press 【F1】 to set “Total Time”, ”Delay Time”, ”Time interval”, and
input the value by pressing the numeric keypad (Fig 53).
Tim : 60s Abs:
12: 35: 27
D2
W
Cell #1
Total T
180s
Inteval
1.0s
0 Abs 3.000
0 Time(s) 180
Total Time:180
XScale
YScale
Fig 53
2. Select the test mode (“Abs” or “%T”) by pressing【F2】(Fig 54).
Tim : 60s Abs:
0 Abs 3. 000
0 Time(s) 180
Please select mode:Abs
Fig 54
12: 35: 27
D2
W
Cell #1
Total T
180s
Inteval
1.0s
XScale
YScale
3. Set wavelength by pressing【GOTOλ】 .Pull the blank cuvette into
the light path, press 【0Abs/100%T】for blanking
4. Pull the sample cuvette into the light path, press【START/STOP】 to
26
Page 27
UV-3 SERIES SPECTROPHOTOMETER
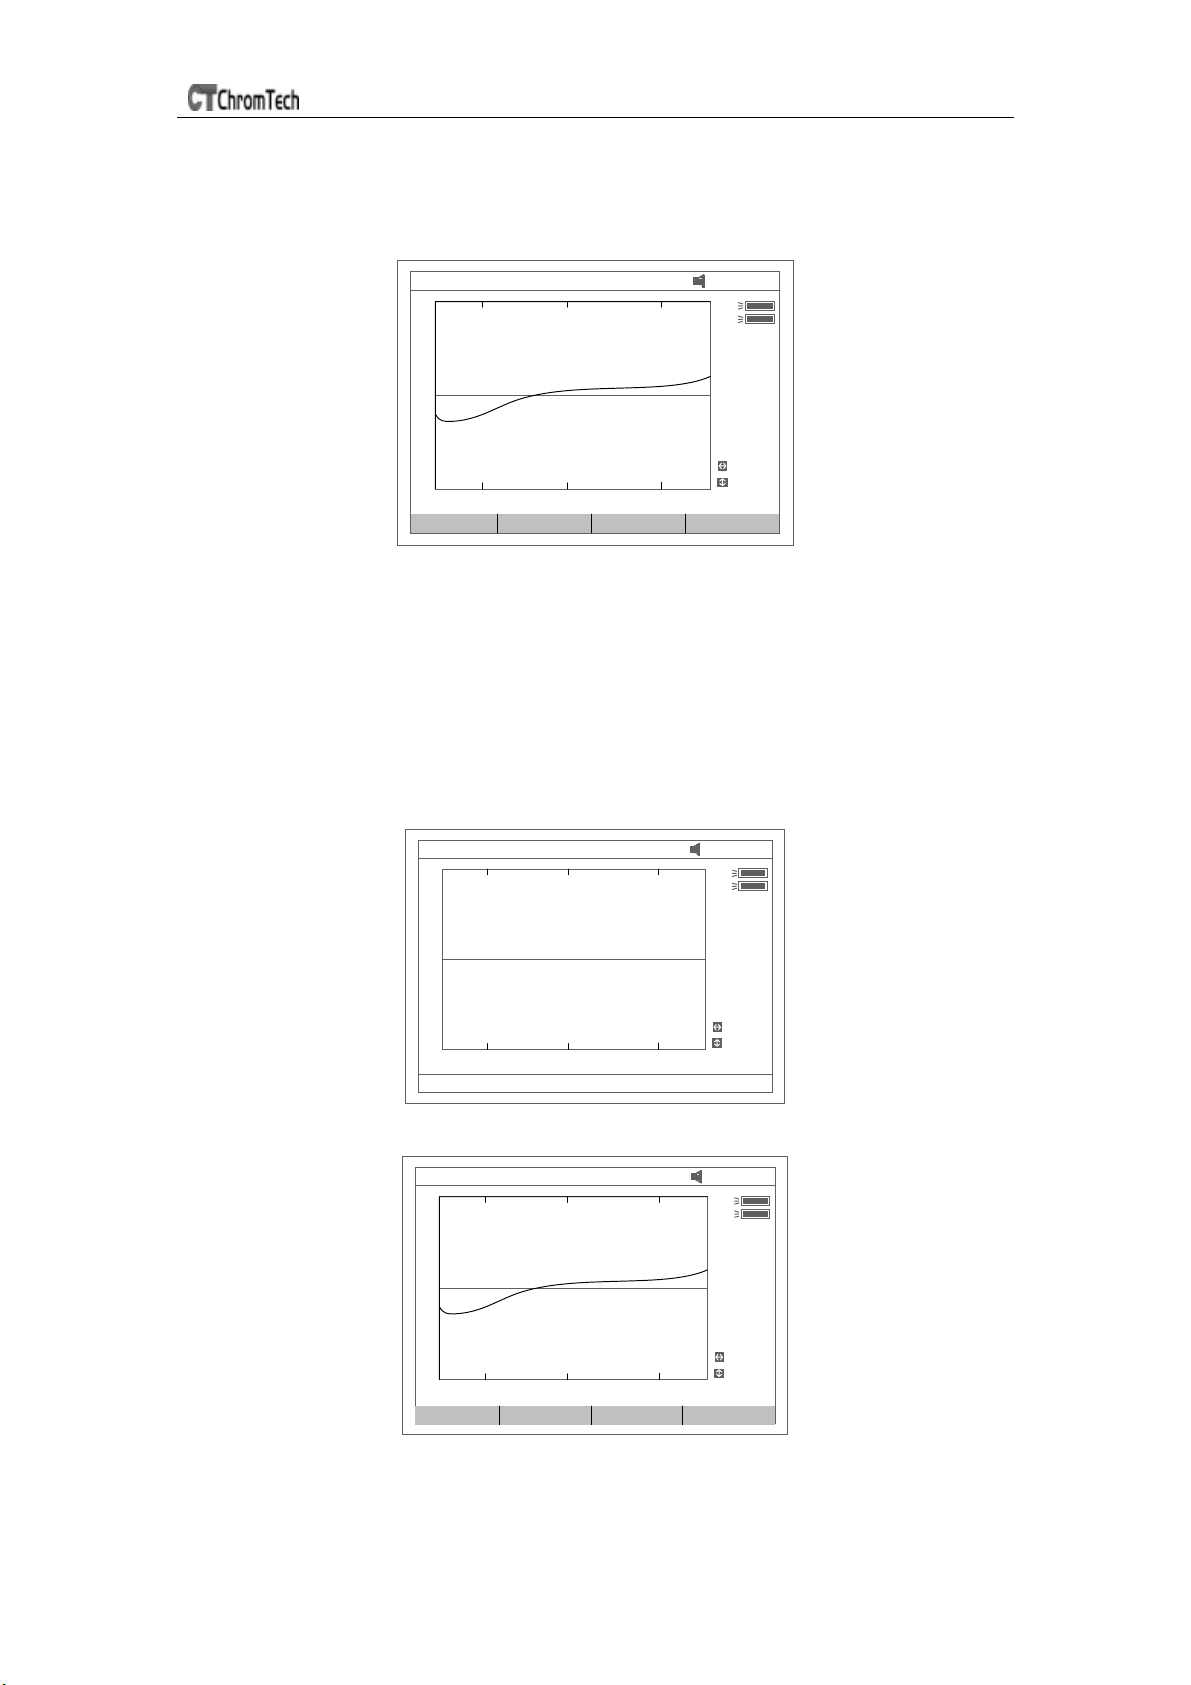
scan the sample. After the delay time, the beeper beeps 3 times and
time -scan starts. At the end of the time-scan, the beeper also beeps 3
times (Fig 55);
Tim : 180 s Abs :
12: 35: 27
D2
W
Cell #1
Total T
180 s
Inteval
1 .0s
0 Abs 1.000
0 Time(s) 180
Setup Mode Process Search
XScale
YScale
Fig 55
5. Press 【F3】to process the data, and enter “Begin Time”, “End Time”
and “Factor” (Fig 56) and the value in I.U. will be calculated and
displayed (Fig 57). The average straight line between the Begin Time
and End Time will be calculated. The gradient of this line gives the rate
of change of ∆A/min.
Note: I.U. =Factor×ΔA/min
Tim : 60s Abs:
0 Abs 3. 000
0 Time(s) 180
Begin Tim e:0
12: 35: 27
D2
W
Cell #1
Total T
180s
Inteval
1.0s
XScale
YScale
Fig 56
Tim : 180 s Abs :
12: 35: 27
D2
W
Cell #1
Total T
180 s
Inteval
1 .0s
I.U .=
+0.364
0 Abs 1.000
0 Time(s) 180
Setup Mode Process Search
XScale
YScale
Fig 57
6. If you want to change the scale, please refer to step 5 of “WL scan”.
27
Page 28
UV-3 SERIES SPECTROPHOTOMETER
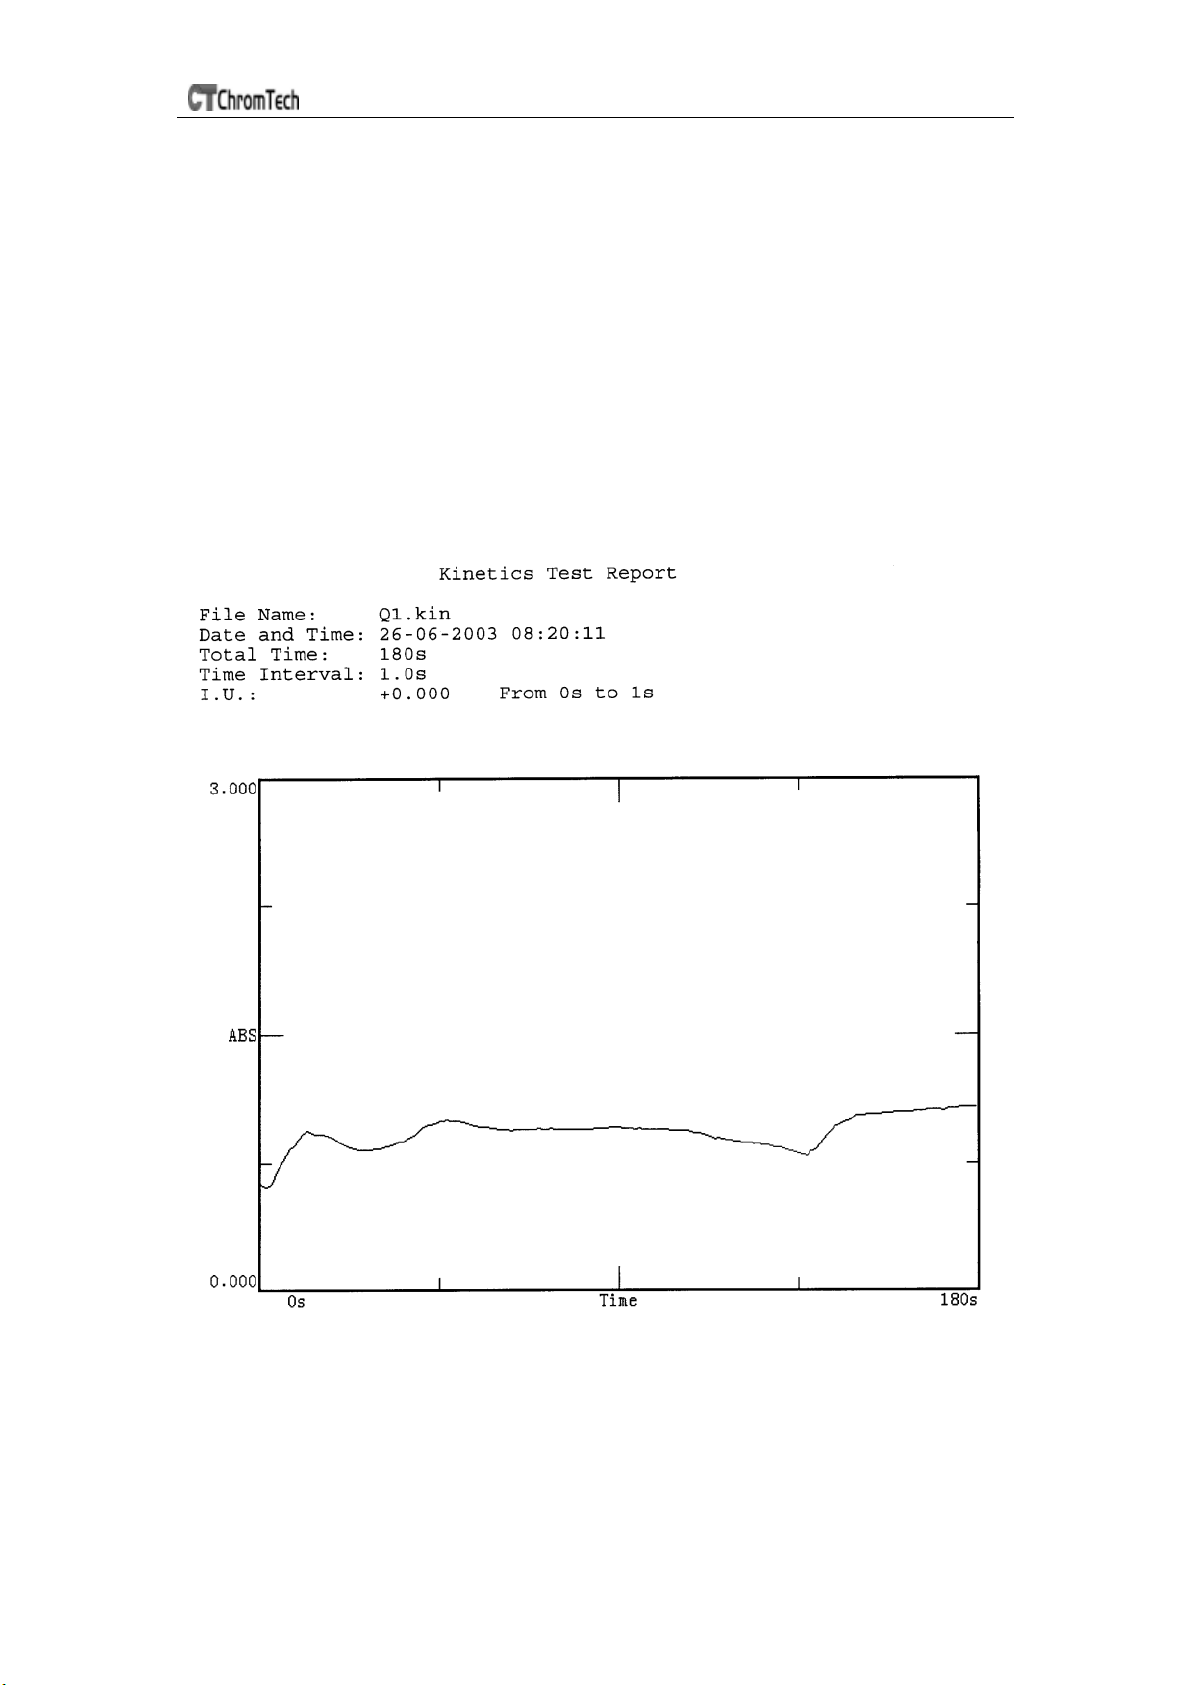
7. Press【F4】to search the Abs/%T value in relation to the time axis.
Search point to point by pressing the key【<】or【>】. Please refer
to step 6 of “WL scan”.
☺ Save Curve
Press the key 【SAVE】 to save curve. Note: Open/Save requires the first
kinetics display page Fig. 55. Press ESC if in Search to return to the required
page.
☺ Print Test Report
Press the key【PRINT】to print the curve you have opened or scanned (Fig 58).
Fig 58
28
Page 29
UV-3 SERIES SPECTROPHOTOMETER
)
)
DNA/Protein
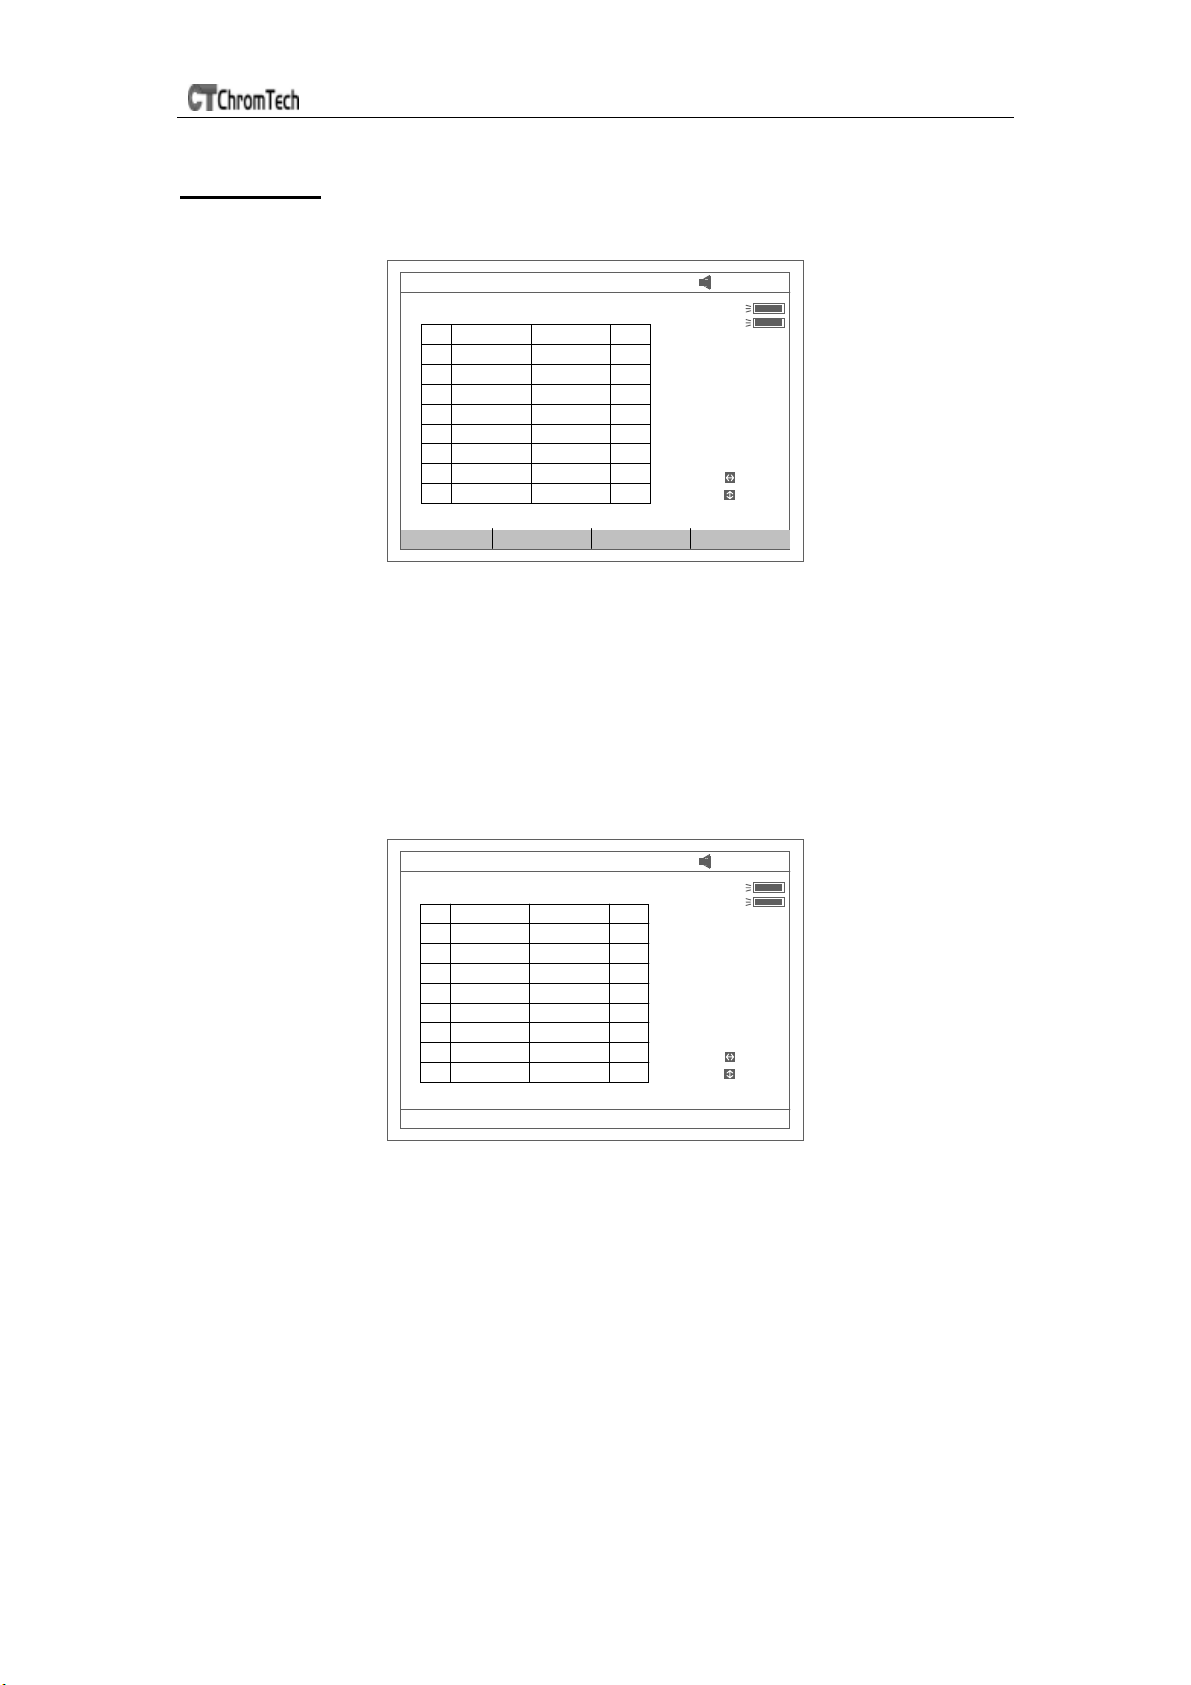
Press【5】in main menu for “DNA/Protein” (Fig 59). 【ESC】to exit.
Note: The algorithm of the test refer to Appendix A please.
WL : 900.0nm
DNA/Protein measurement
No Items Result Unit
Coeff Mode Unit Default
12: 35: 27
D2
W
Cell #1
WL(nm
260 .0
280 .0
320 .0
Search
Scroll
Fig 59
To open previous DNA results, press
dna)
【
OPEN
and select a previously stored result (.
】
☺ Test
1. To use a simpler or different algorithm, you can enter your own values
for f1-f4. Press【F1】to set f1-f4. Input the value by pressing the
numeric keypad (Fig 61).
WL : 900.0nm
DNA/Protein measurement
No Items Result Unit
12: 35 : 27
D2
W
Cell #1
WL(nm
260 .0
280 .0
320 .0
Search
Scroll
Input f1=62.90
Fig 60
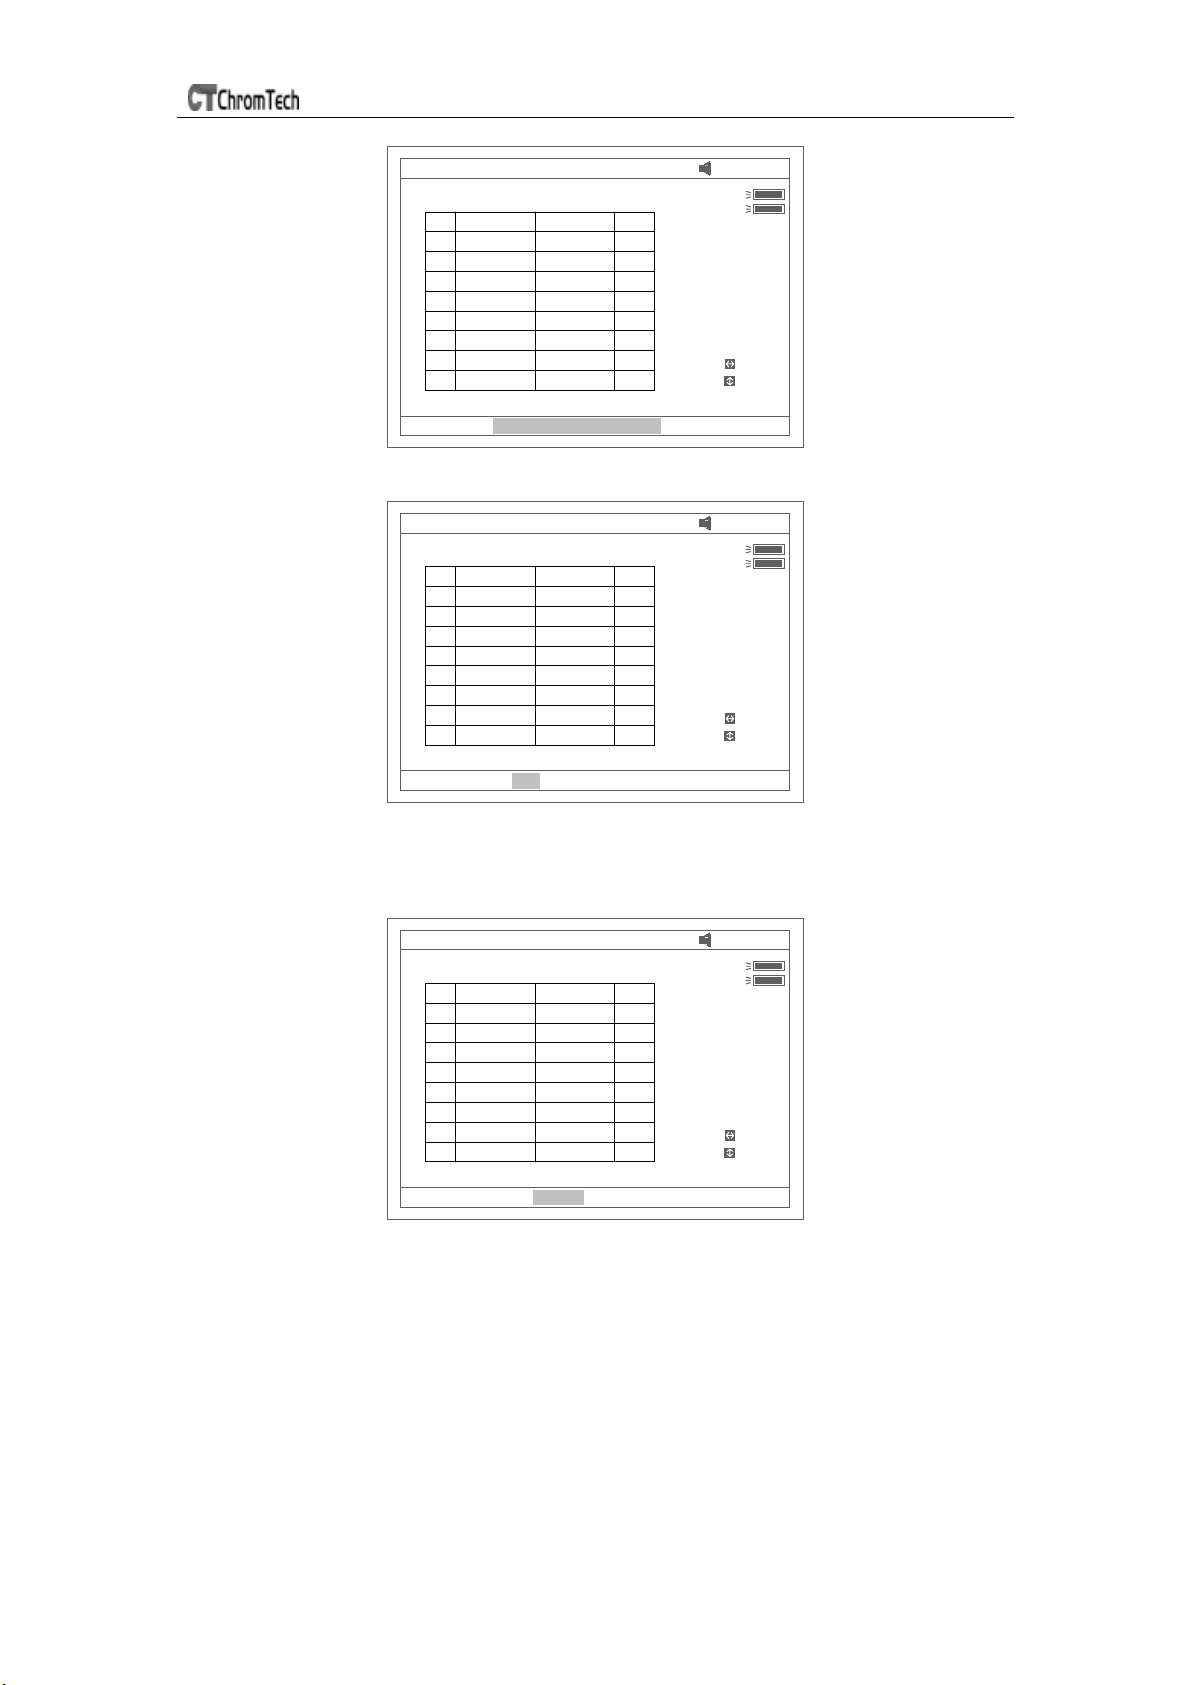
2. Press【F2】to select test mode. ”Absorbance difference 1” is for
testing at the wavelength 260nm,280nm and 320nm (optional),and
the ”Absorbance difference 2” is for testing at the wavelength
260nm,280nm and 320nm (Optional, Fig 61). Then select
with/without reference. If selected with reference (no), the A ref. will be
“0” (Fig 62).
29
Page 30
UV-3 SERIES SPECTROPHOTOMETER
)
)
)
WL : 900.0nm
DNA/Protein measurement
No Items Result Unit
Measum ent: Absorbance difference 1
Fig 61
WL : 900.0nm
DNA/Protein measurement
No Items Result Unit
12: 35 : 27
D2
W
Cell #1
WL(nm
260 .0
280 .0
Search
Scroll
12: 35 : 27
D2
W
Cell #1
WL(nm
260 .0
280 .0
Search
Scroll
With reference: Yes
Fig 62
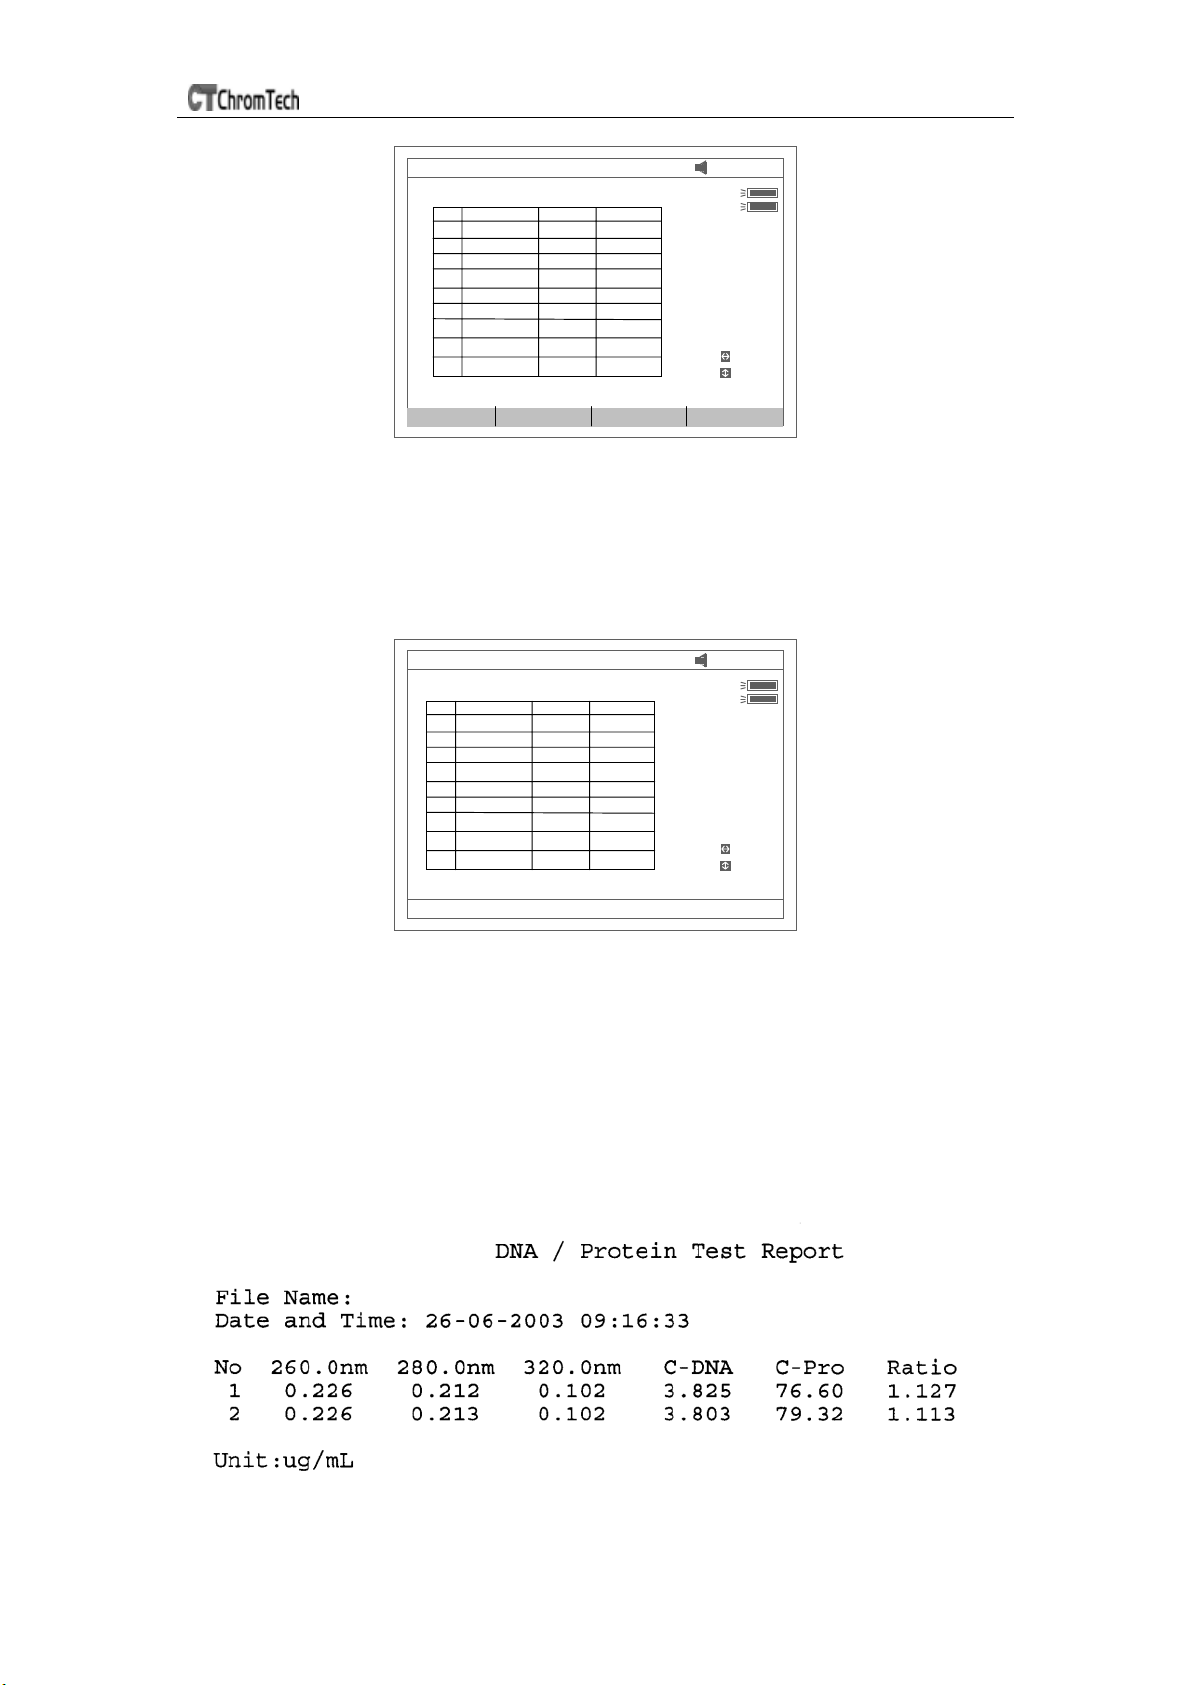
3. Press 【F3】to select the unit of concentration (Fig 63).
WL : 900.0nm
DNA/Protein measurement
No Items Result Unit
Please select unit: mg/mL
12: 35 : 27
D2
W
Cell #1
WL(nm
260 .0
280 .0
Search
Scroll
Fig 63
4. Push the blank cuvette into the light path, then press 【0Abs/100%T】
for blanking .
5. Pull the sample cuvette into the light path, press 【START/STOP】 to
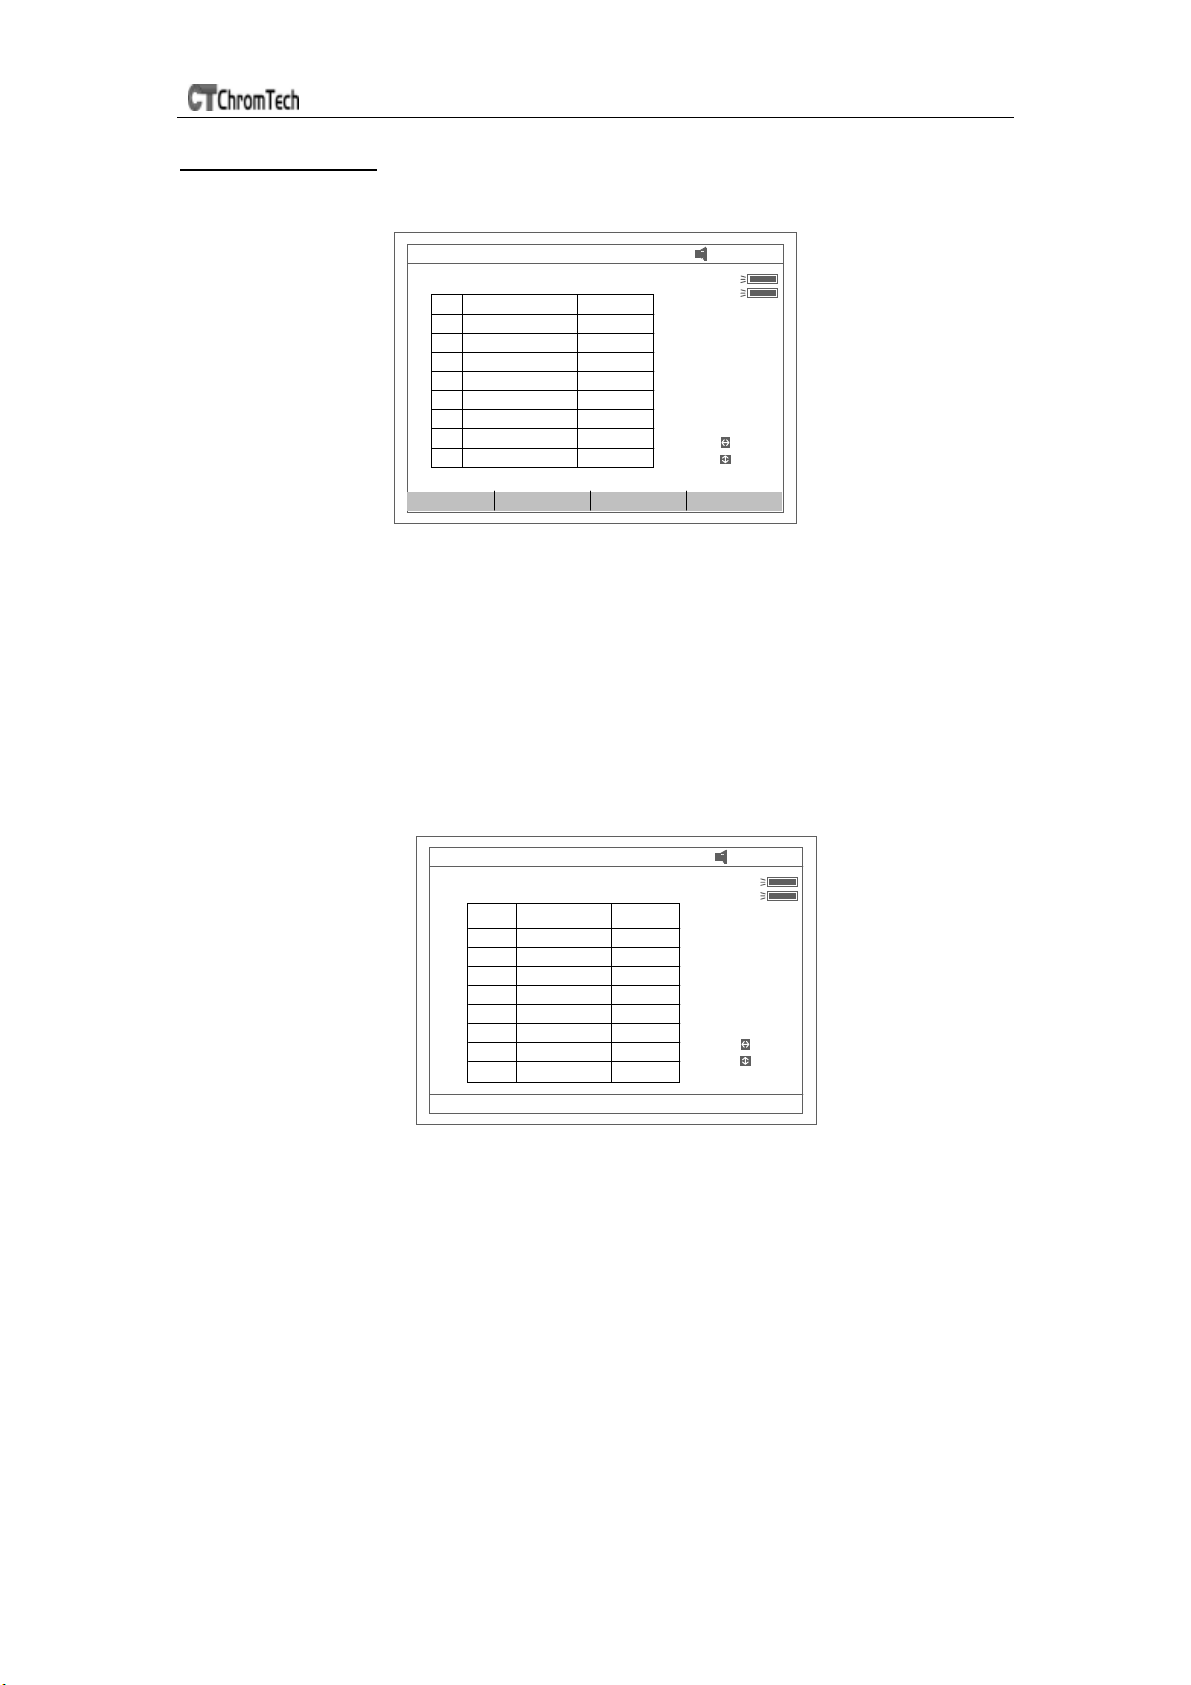
test the sample. The test result will be displayed on the screen (Fig
64).
30
Page 31
UV-3 SERIES SPECTROPHOTOMETER
)
)
: 900 .0nm Abs :
WL
DNA/Protein measurement
No Items Result Unit
1 A1 2 .947 Abs
A 2 2 .842 Abs
Aref 0.638 Abs
C -DN A 65.91 mg/mL
C -Pro 1672 m g/mL
Ratio 1.048
Coeff Mode Unit Default
12: 35 : 27
D2
W
Cell #1
WL(nm
260 .0
280 .0
320 .0
Search
Scroll
Fig 64
6. If there is more than one sample, repeat step 5 for the next sample.
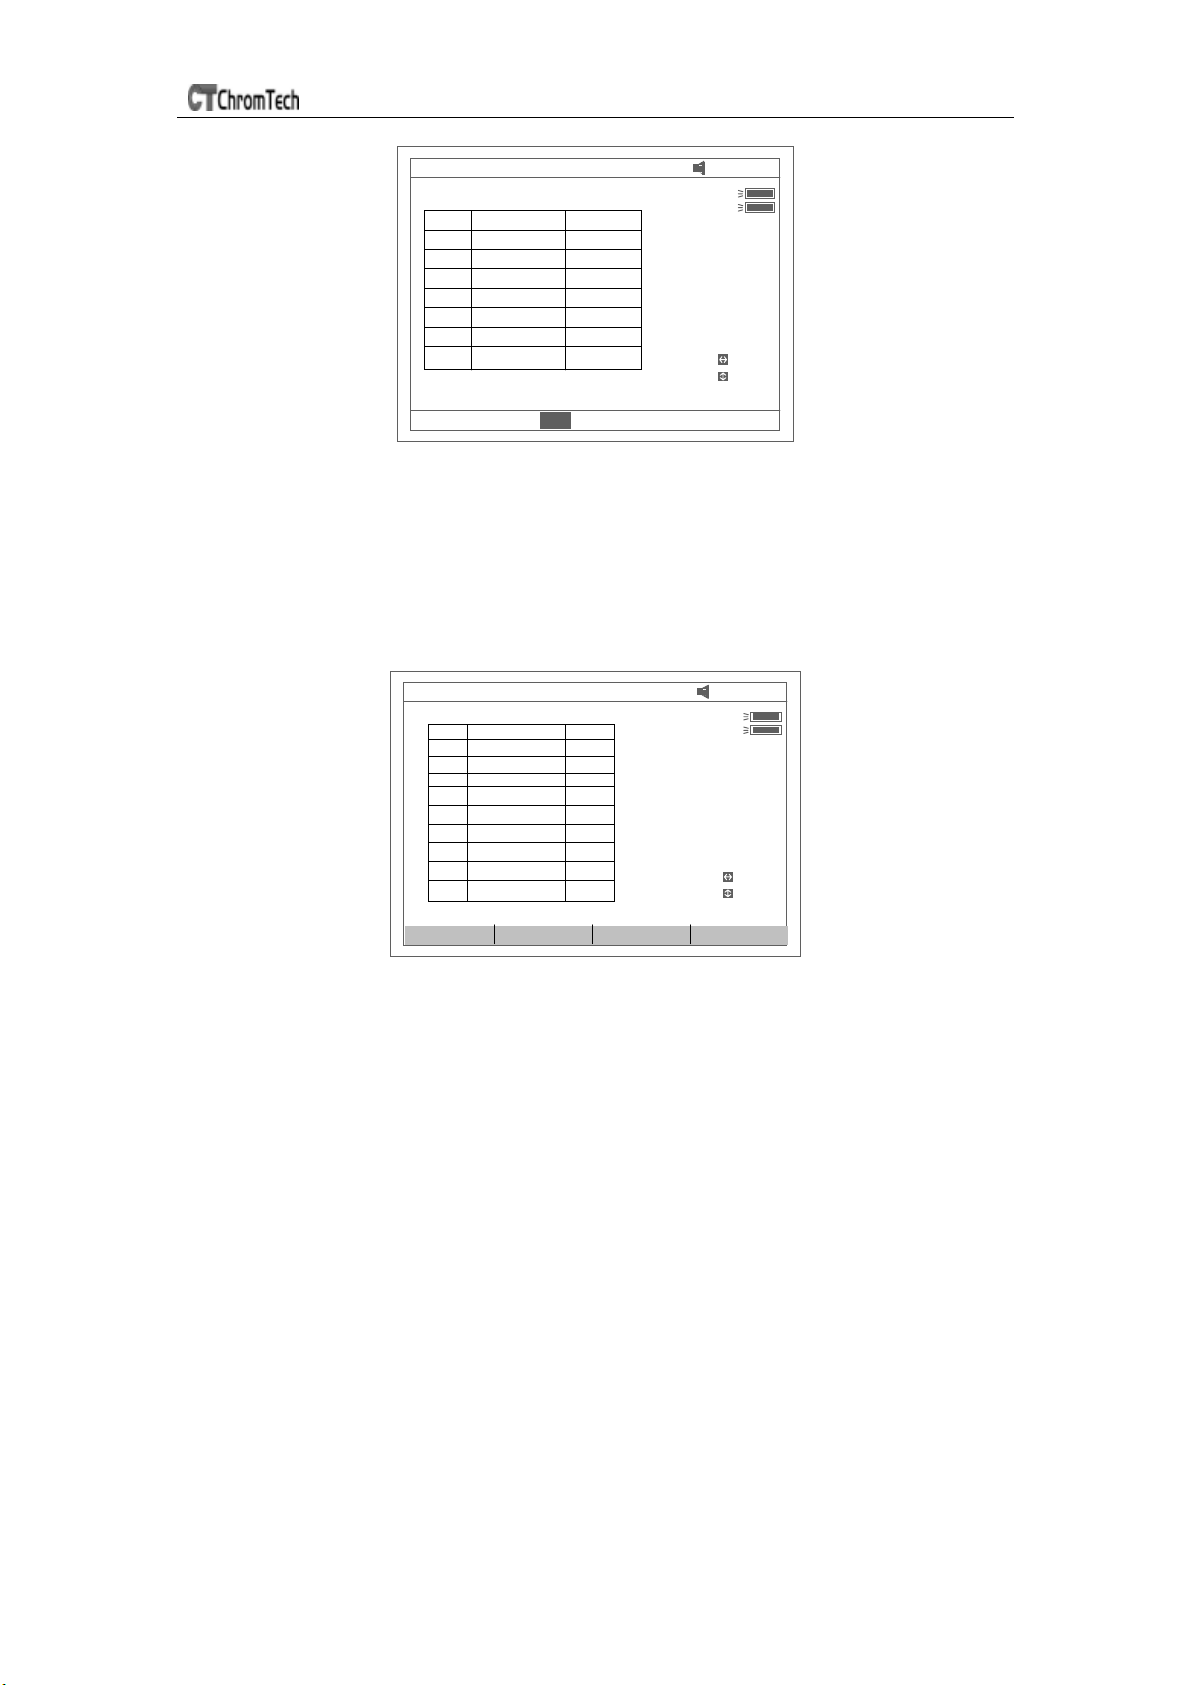
7. Press the key 【<】or【>】for searching. Input the sample number
(Fig 65), the result will be displayed on the screen. Press the key
【∧】or【∨】to browse the test results one by one.
WL : 900.0 nm Abs :
DNA/Protein measurement
No Items Result Unit
1 A1 2 .947 Abs
A 2 2 .842 Abs
Aref 0.638 Abs
C-DN A 65.91 mg/mL
C-Pro 1672 mg/m L
Ratio 1.048
12: 35 : 27
D2
W
Cell #1
WL(nm
260 .0
280 .0
320 .0
Search
Scroll
Search sample:3
Fig 65
☺ Recall the default
Press the key【F4】to recall the default of the f1-f4.
☺ Save Data
Press the key 【SAVE】 to save data.
☺ Print Test Report
Press the key【PRINT】to print the test result (Fig 66).
Fig 66
31
Page 32
UV-3 SERIES SPECTROPHOTOMETER
Multi Wavelength
Press【6】in main menu for “Multi WL” (Fig 67). 【ESC】to exit.
WL : 900.0 nm Abs :
Multi Wavelength Test
No WL(nm) Abs
500.0
WL Setup Mode
12: 35 : 27
D2
W
Cell #1
1 WL
Search
Scroll
Fig 67
To open previous Multi Wavelength results, press 【
results (.mul)
OPEN
and select previously stored
】
☺ Test
1. Press 【F1】to setup a group of wavelengths for testing by pressing the
numeric keypad followed by【ENTER】. (٨) or (٧) to modify the inputted
data (Fig. 68). Press【ESC】to finish setup and exit.
Note: It is recommended to enter the highest wavelength first.
WL : 900.0 nm Abs :
Multi Wavelen gth Test
No WL(nm) Abs
1 500.0
2 400.0
3 300.0
4
12: 35: 27
D2
W
Cell #1
2 WL
Please Input WL:260 .0
Fig 68
2. Press 【F2】to select mode (Fig 69).
Search
Scroll
32
Page 33
UV-3 SERIES SPECTROPHOTOMETER
WL : 900 .0n m Abs :
Multi Wavelength Test
No WL(nm) Abs
500.0
400.0
300.0
Please Select Mode: Abs
12: 35 : 27
D2
W
Cell #1
3 WL
Search
Scroll
Fig69
3. Push the blank cuvette into the light path, then press 【0Abs/100%T】
for Blanking .
4. Pull the sample cuvette into the light path, press【START/STOP】 to
test. The test results will be displayed on the screen (Fig 70).
WL : 500 .0nm Abs :
Multi Wavelength Test
No W L(nm) Abs
1 500.0 0 .87
400.0 0 .42
300.0 0 .81
12: 35 : 27
D2
W
Cell #1
3 WL
Search
Scroll
WL Setup Mode
Fig 70
5. If there is more than one sample, repeat step 4 for the next sample.
Note: When the test has finished, the wavelength will go to the first
WL.
6. Press 【<】or【>】for searching. Input the sample number, the result
will be displayed on the screen. Press 【∧】or【∨】 to browse the
test results one by one.
☺ Save Data
Press 【SAVE】 to save data.
☺ Print Test Report
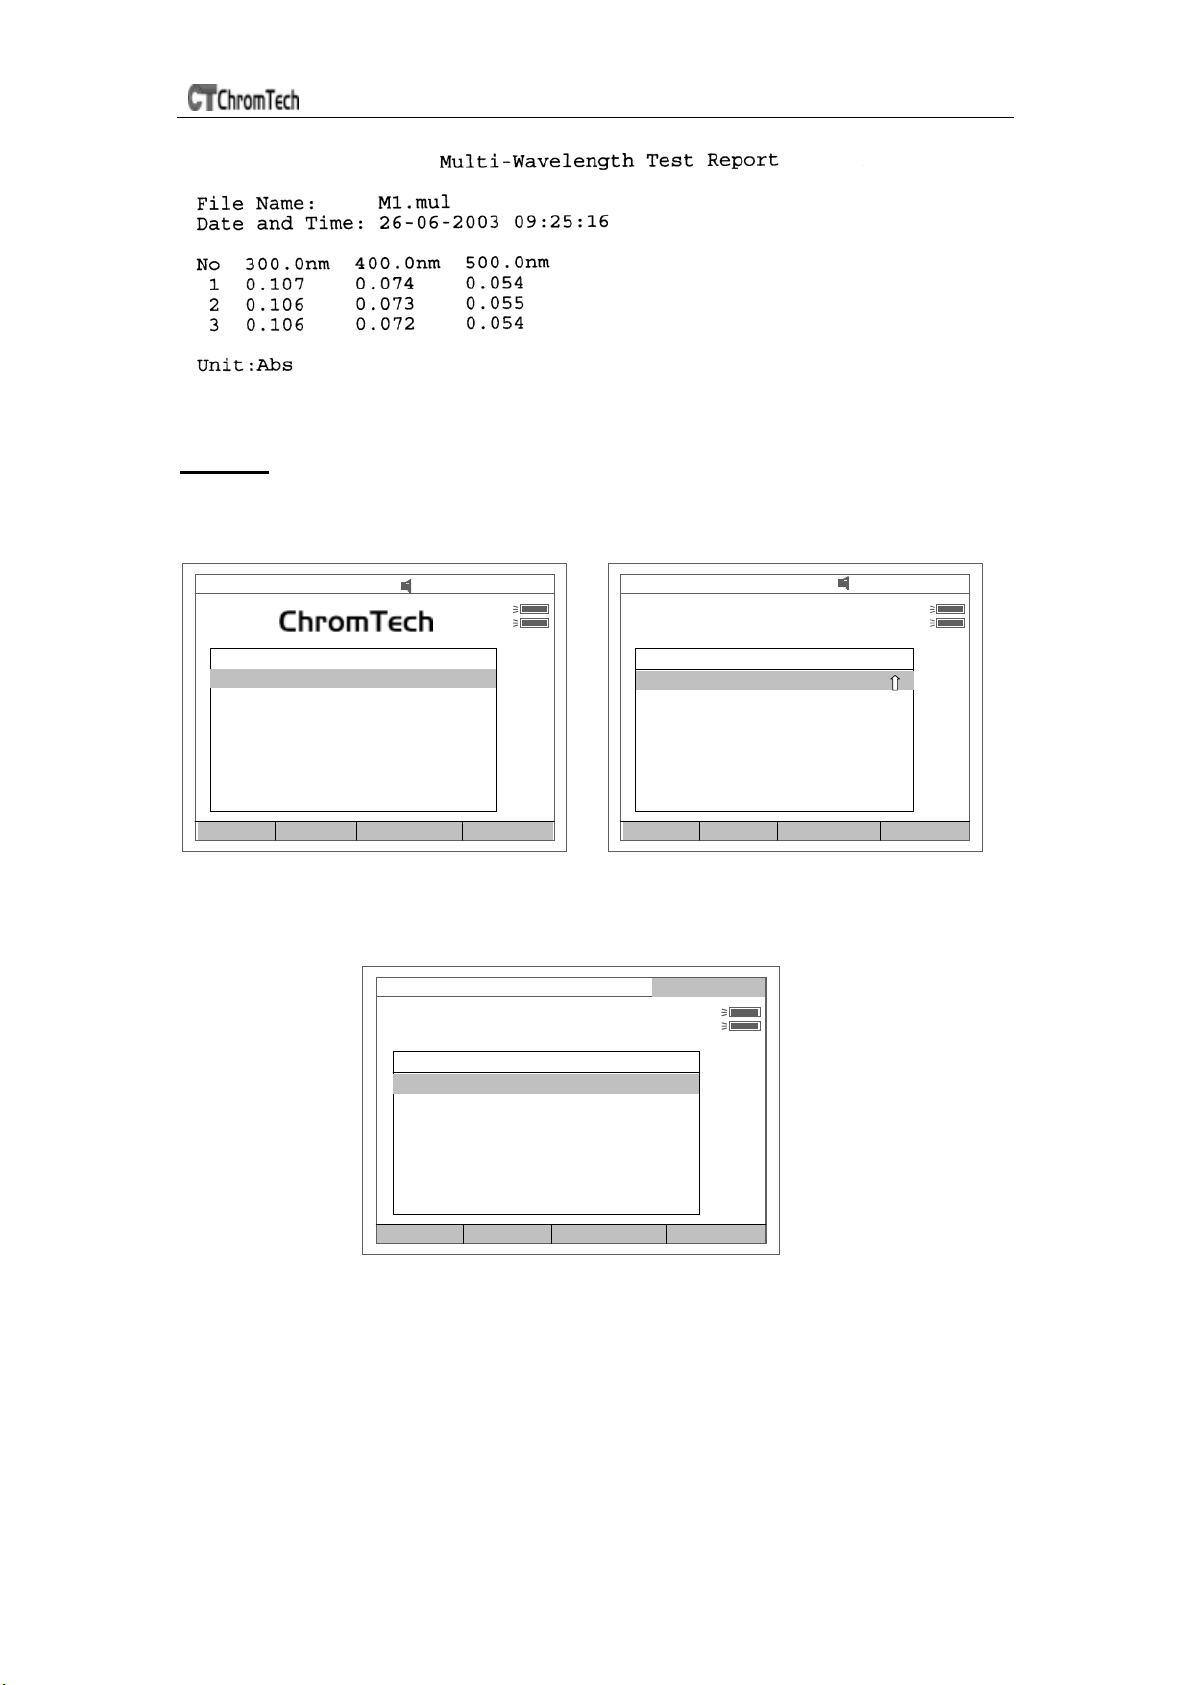
Press【PRINT】to print the test results (Fig 71).
33
Page 34
UV-3 SERIES SPECTROPHOTOMETER
Fig 71
Utility
Press【7】in Main menu for “Utility” (Fig 72). 【ESC】to exit.
WL : 656 .1nm 08: 04: 35
D2
W
Cell #1
System Service Routines
1. Wavelength Reset
2. Printer Setup
3. Lamp Service
4. Clock Setup
5. Refresh Dark Current
6. Connect to PC
7. Beeper on/off
Cancel
Move Dn Select
Fig 72 Fig 72A
☺ WL Reset
Press【1】to reset wavelength (Fig73).
W L : 656.1nm S te p to 1100nm
S ystem Service R outines
1. W avelength R eset
2. Printer S etup
3. Lam p S ervice
4. C lock S etup
5. R efresh D ark Current
6. C onnect to P C
7. Beeper on/off
C ancel
M o v e D n S e lect
WL : 656.1nm
System Service Routines
6. Connect to PC
7. Beeper on/off
8. Language Selection
9. Refresh System Baseline
10. Delete Entire Saved Files
11. Restore Default Settings
Cancel
Move Up M
ove Dn
D2
W
Cell # 1
08: 04: 35
D2
W
Cell #1
Select
Fig 73
☺ Printer
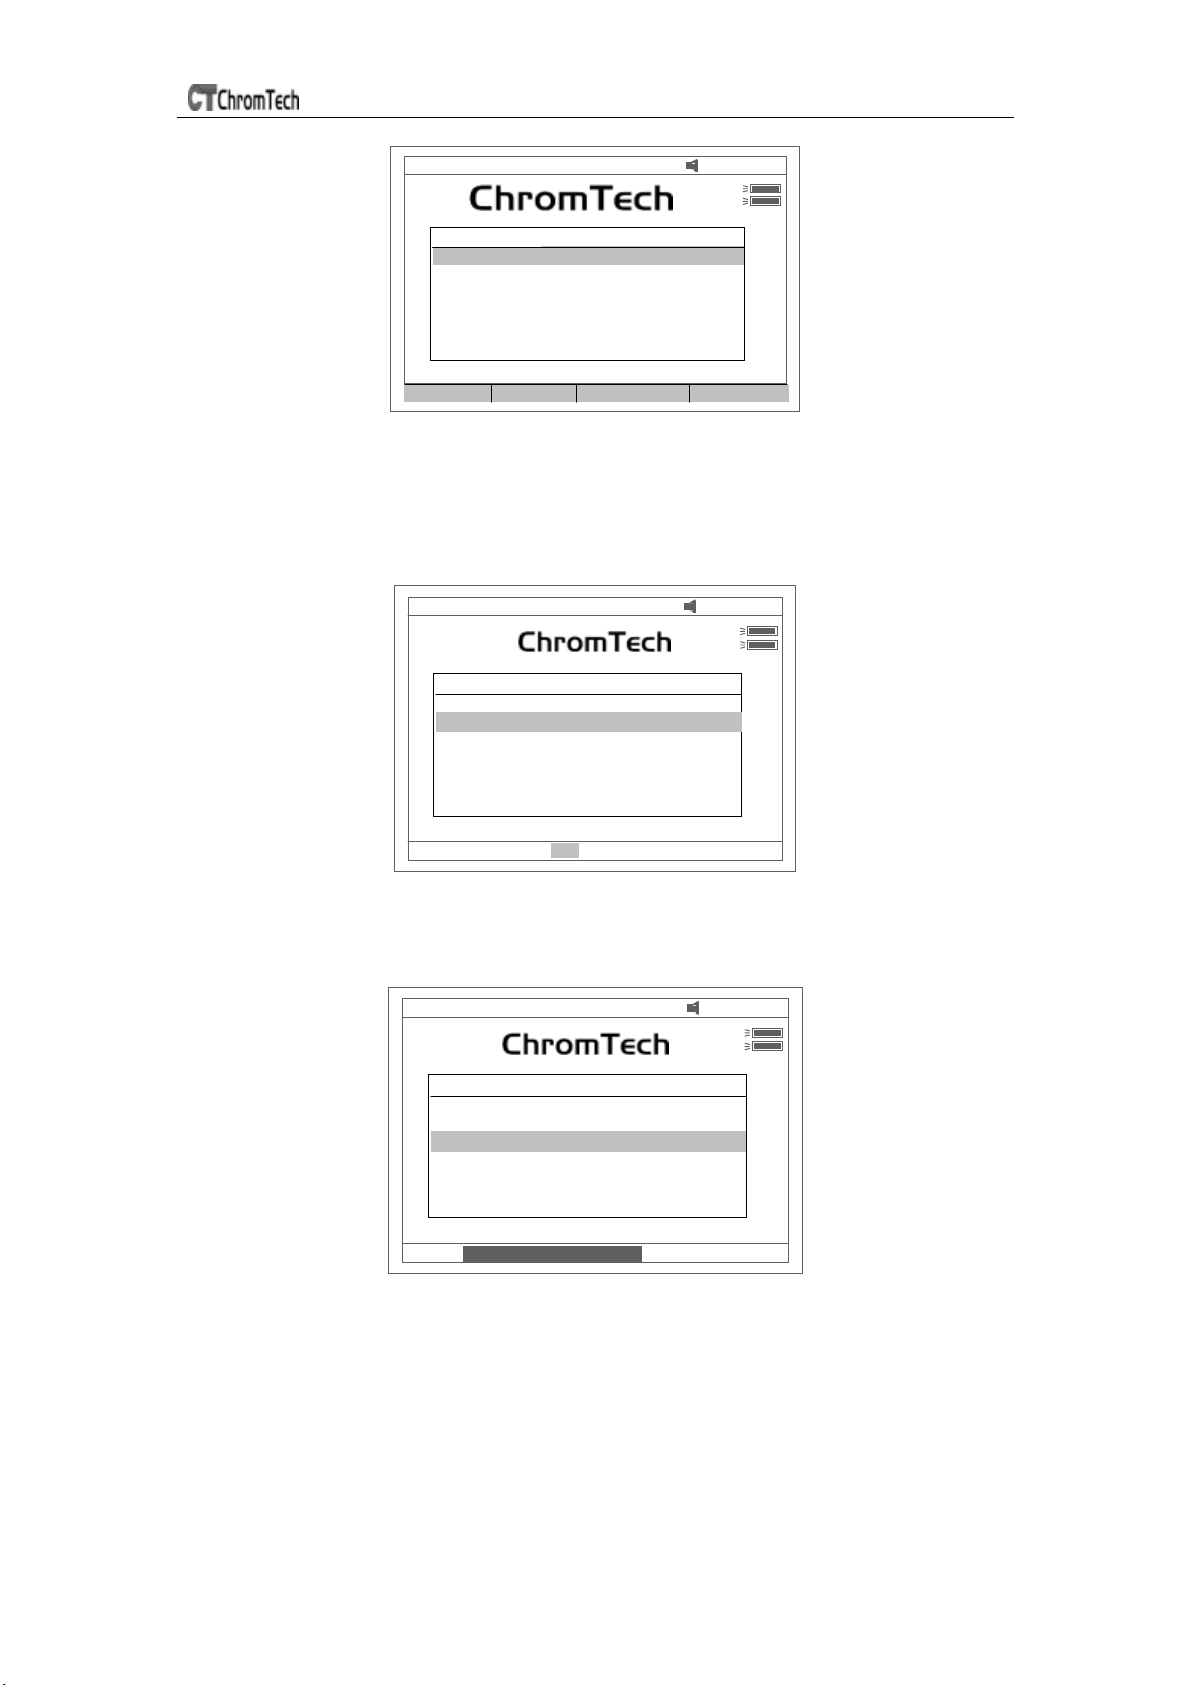
Press【2】to set printer (Fig 74). 【ESC】to exit.
34
Page 35
UV-3 SERIES SPECTROPHOTOMETER
WL : 656 .1nm 08 : 04: 35
D2
W
Cell #1
Setup Printer
1. Reset Printer
2. Select print port
3. Select printer
4. Change print m ode
Cancel
Move Dn Select
Fig 74
1. Press【1】in Fig 74 to Reset Printer.
2. Press【2】in Fig 74 to select print port (LPT or Comm., Fig 75).
WL : 656.1n m 08: 04: 35
D2
W
Cell #1
Setup Printer
1. Reset Printer
2. Select print port
3. Select printer
4. Change print m ode
Select the print port: LPT
Fig 75
3. Press【3】 in Fig 74 to select printer (HP PCL (1 color cartridge), PCL
(black mode), Epson ESC/P or Epson/P2 or above, Fig76).
WL : 656.1nm 08: 04: 35
D2
W
Cell #1
Setup Printer
1. Reset Printer
2. Select print port
3. Select printer
4. C hange print mode
Printer : HP PCL (1 color cartridge)
Fig 76
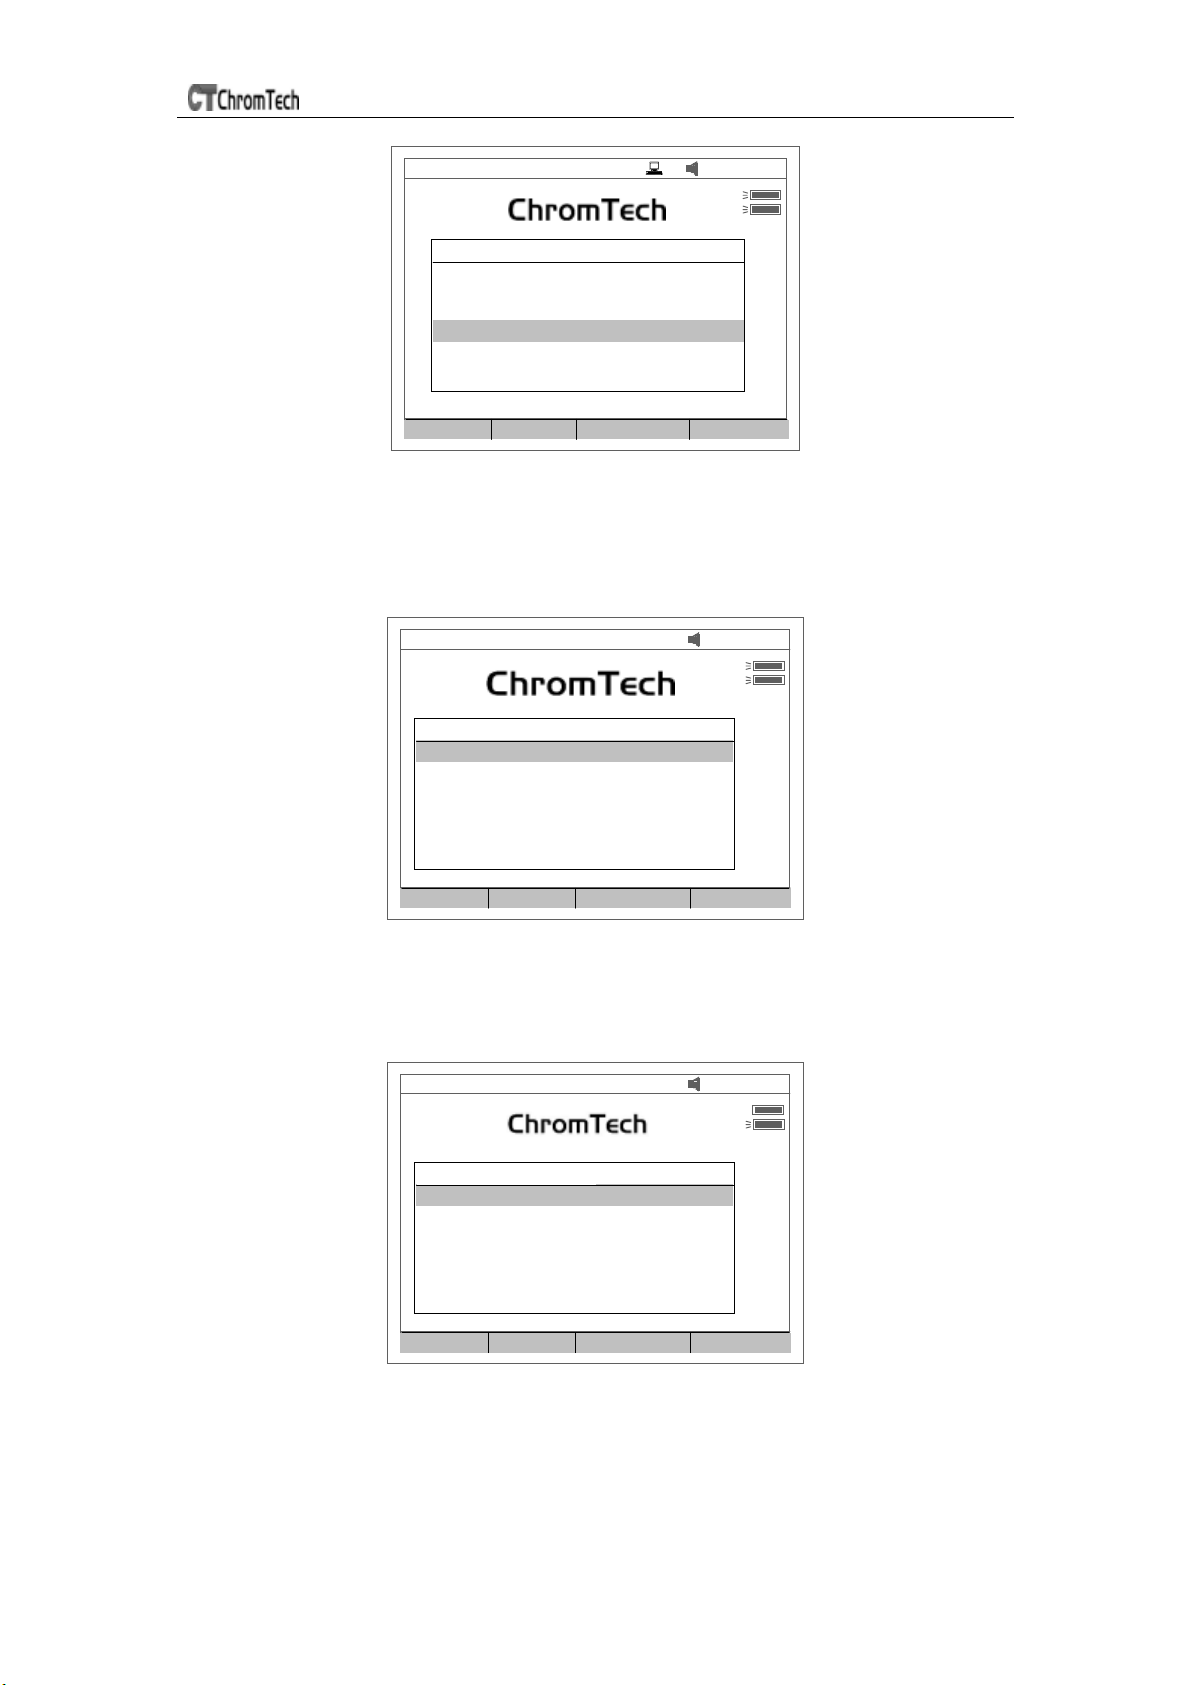
4. Press【4】in Fig 74 to change print mode. The first time 【4】 be pressed,
a little icon will be displayed on the top line of the screen (Fig 77). At this
mode, When 【Print】 be pressed, all the items on the screen will be
printed. The second time 【4】be pressed, the little icon will disappear. At
this mode, when 【Print 】be pressed, a test report will be printed.
35
Page 36
UV-3 SERIES SPECTROPHOTOMETER
WL : 656 .1nm 08: 04: 35
D2
W
Cell #1
Setup Printer
1. Reset Printer
2. Select print port
3. Select printer
4. Change print mode
Cancel Move Up
Move Dn Select
Fig77
☺ Lamp
Press【3】to set lamp (Fig 78). 【ESC】to exit.
WL : 656.1nm 08: 04: 35
D2
W
Cell #1
Lamps Management
Switch D 2:
1. S witch on/off D 2
Reset D2 lamp usage time
2. Reset D2 lam p usage time
Switch W :
3. Switch on/off W
Reset W lamp usage time
Switch point
4. Reset W lam p usage time
5. Change switch point
Cancel
Move Dn Select
Fig 78
1. Press【1】in Fig 78 to switch on/off D2. (Fig 79). Pay attention to the D2
icon on the top of the right screen.
WL : 656.1nm 08: 04: 35
D2
W
Cell #1
Lamps Management
Switch D 2:
1. S witch on/off D 2
Reset D2 lamp usage time
2. Reset D2 lam p usage time
Switch W :
3. Switch on/off W
Reset W lamp usage time
Switch point
4. Reset W lam p usage time
5. Change switch point
Cancel
Move Dn Select
Fig 79
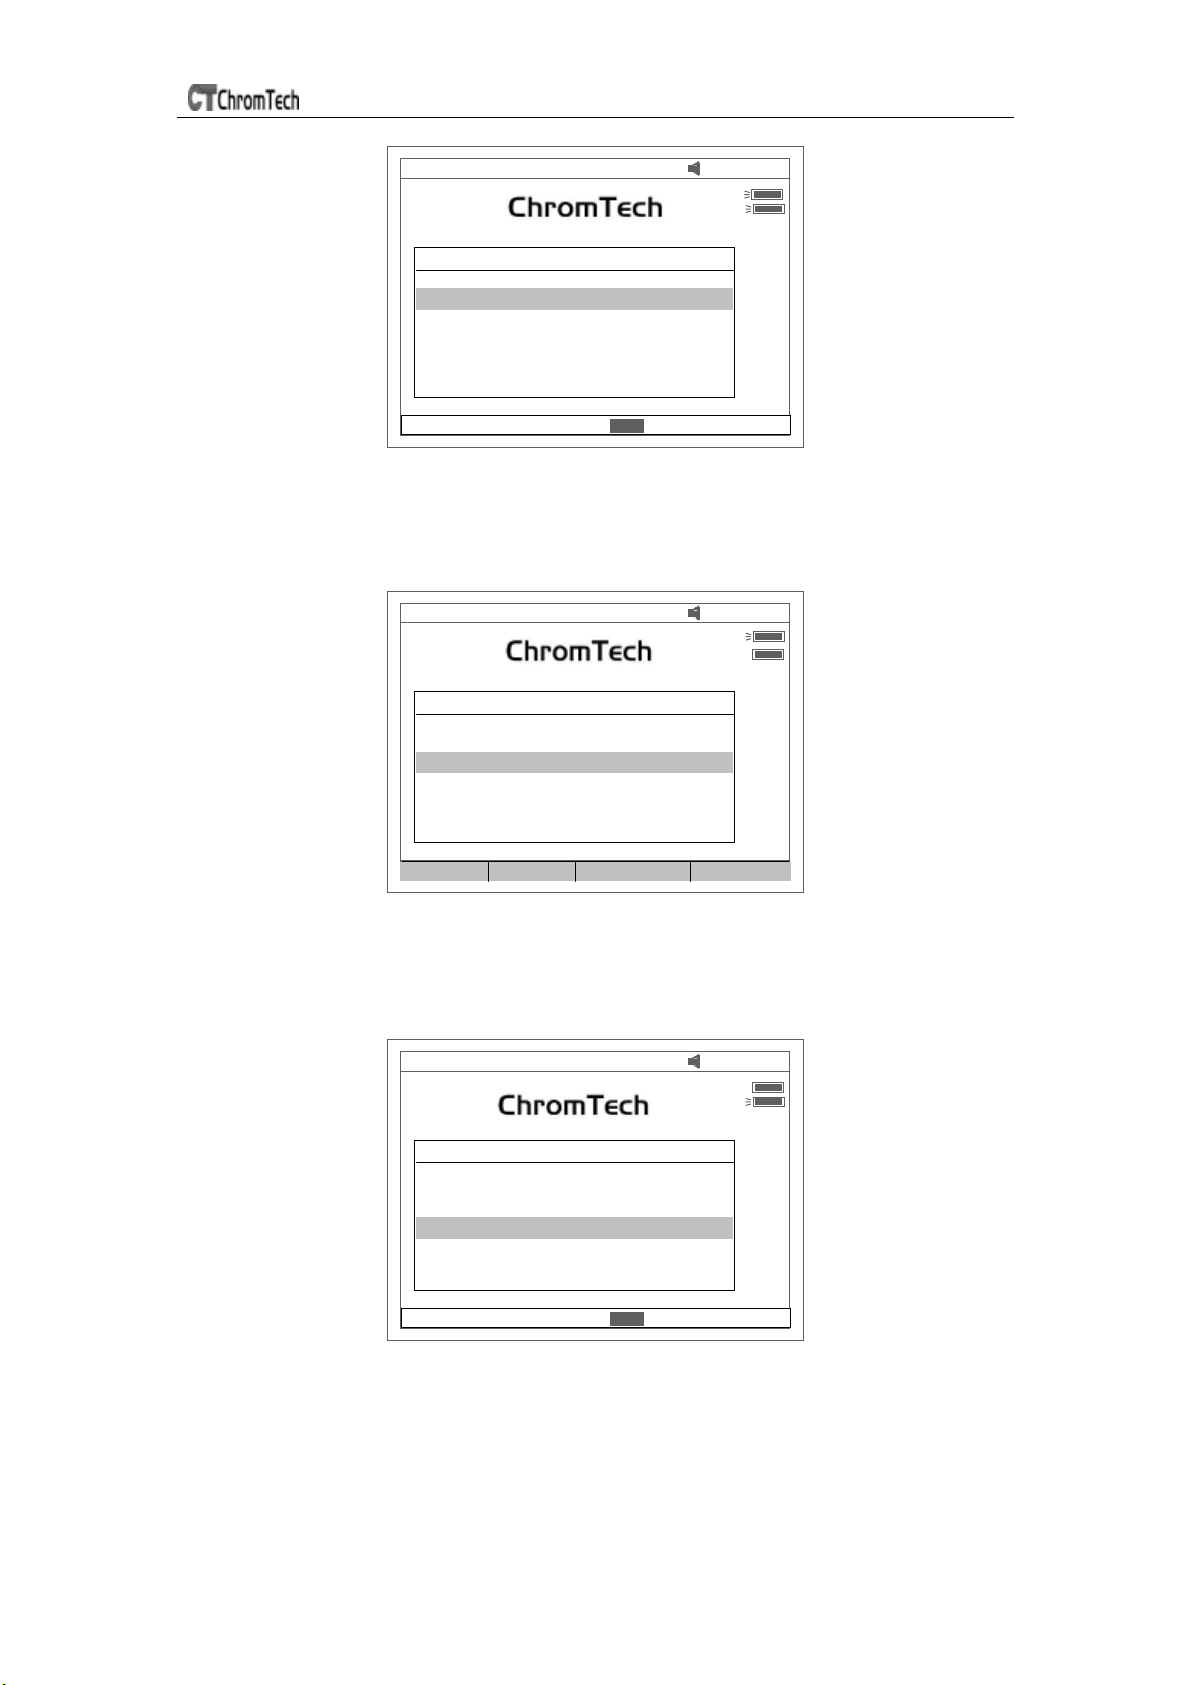
2. Press【2】in Fig 78 to reset usage time of D2(Fig 80). Press 【∧】or【∨】
to select “Yes” or “No”, and then press 【ENTER】.
36
Page 37
UV-3 SERIES SPECTROPHOTOMETER
WL : 656.1nm 08: 04: 35
D2
W
Cell #1
Lamps Management
Switch D 2:
1. S witch on/off D 2
Reset D2 lamp usage time
2. Reset D2 lam p usage time
Switch W :
3. Switch on/off W
Reset W lamp usage time
Switch point
4. Reset W lam p usage time
5. Change switch point
10 hours used. Are you sure?
NO
Fig 80
3. Press【3】in Fig 78 to switch on/off W. The indication is also on the top
right corner of the screen (Fig 81).
WL : 656.1nm 08: 04: 35
D2
W
Cell #1
Lamps Management
Switch D 2:
1. S witch on/off D 2
Reset D2 lamp usage time
2. Reset D2 lam p usage time
Switch W :
3. Switch on/off W
Reset W lamp usage time
Switch point
4. Reset W lam p usage time
5. Change switch point
Cancel Move Up
Move Dn Select
Fig 81
4. Press 【4】in Fig 78 to reset usage of W (Fig 82). Press 【∧】or【∨】
to select “Yes” or “No”, and then press 【ENTER】.
WL : 656.1nm 08: 04: 35
D2
W
Cell #1
Lamps Management
Switch D 2:
1. S witch on/off D 2
Reset D2 lamp usage time
2. Reset D2 lam p usage time
Switch W :
3. Switch on/off W
Reset W lamp usage time
Switch point
4. Reset W lam p usage time
5. Change switch point
10 hours used. Are you sure?
NO
Fig 82
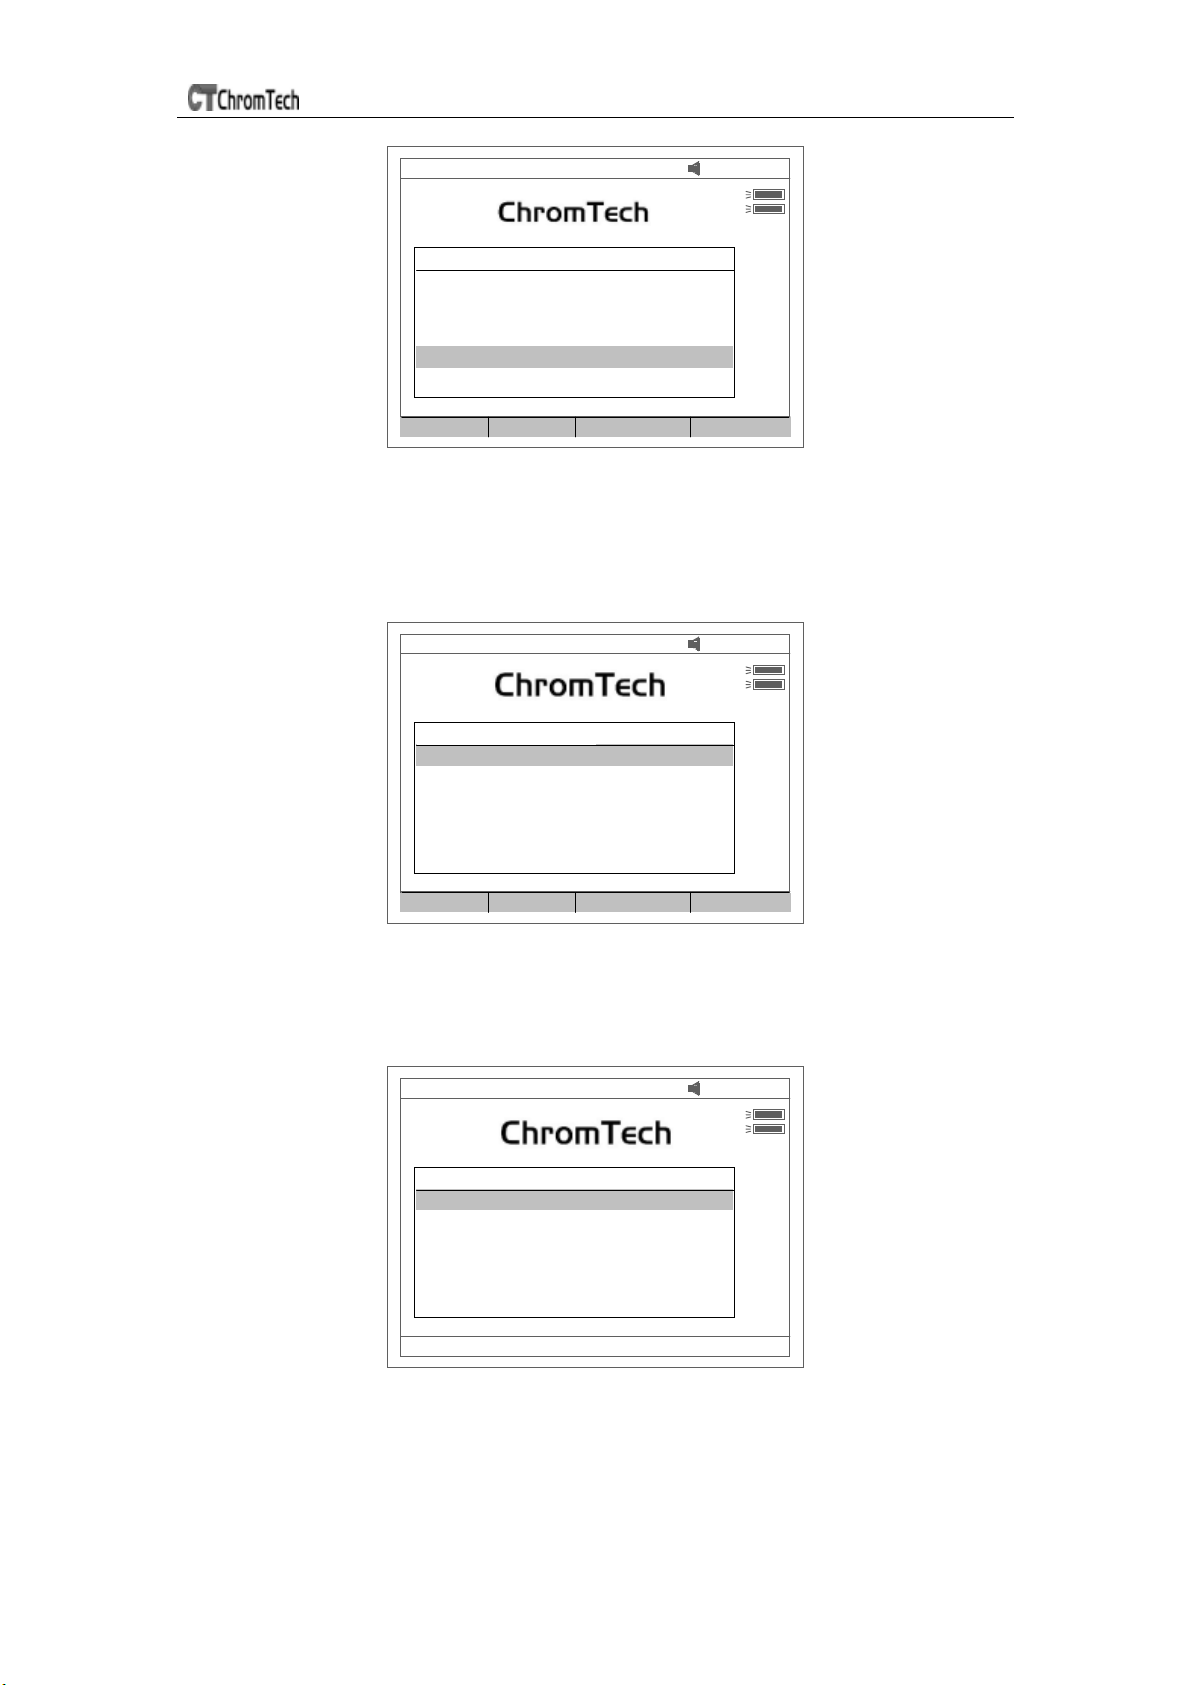
5. Press【5】 in Fig 78 to set the switch usage wavelength point of D2 and W
lamp (Fig 83).
37
Page 38
UV-3 SERIES SPECTROPHOTOMETER
WL : 656.1nm 08: 04: 35
D2
W
Cell #1
Lamps Management
Switch D 2:
1. S witch on/off D 2
Reset D2 lamp usage time
2. Reset D2 lam p usage time
Switch W :
3. Switch on/off W
Reset W lamp usage time
Switch point
4. Reset W lam p usage time
5. Change switch point
Cancel Move Up
Move Dn Select
83
☺ Clock
Press 【4】In Fig72 to set the display mode and modify the clock (Fig 84).
【ESC】to exit.
WL : 656.1nm 08: 04: 35
D2
W
Cell #1
Clock Management
Switch D 2:
1. Set tim e
Reset D2 lamp usage time
2. Set date
Switch W :
3. Display time
Reset W lamp usage time
Switch point
4. D isplay da te
Cancel
Move Dn Select
Fig 84
1. Press 【1】in Fig 84 to modify time by pressing the numeric keypad (Fig
85).
WL : 656.1nm 08: 04: 35
D2
W
Cell #1
Clock Management
Switch D 2:
1. Set tim e
Reset D2 lamp usage time
2. Set date
Switch W :
3. Display time
Reset W lamp usage time
Switch point
4. D isplay da te
Please input the time : 00.00.00
Fig 85
2. Press 【2】in Fig 84 to modify date by pressing the numeric keypad.
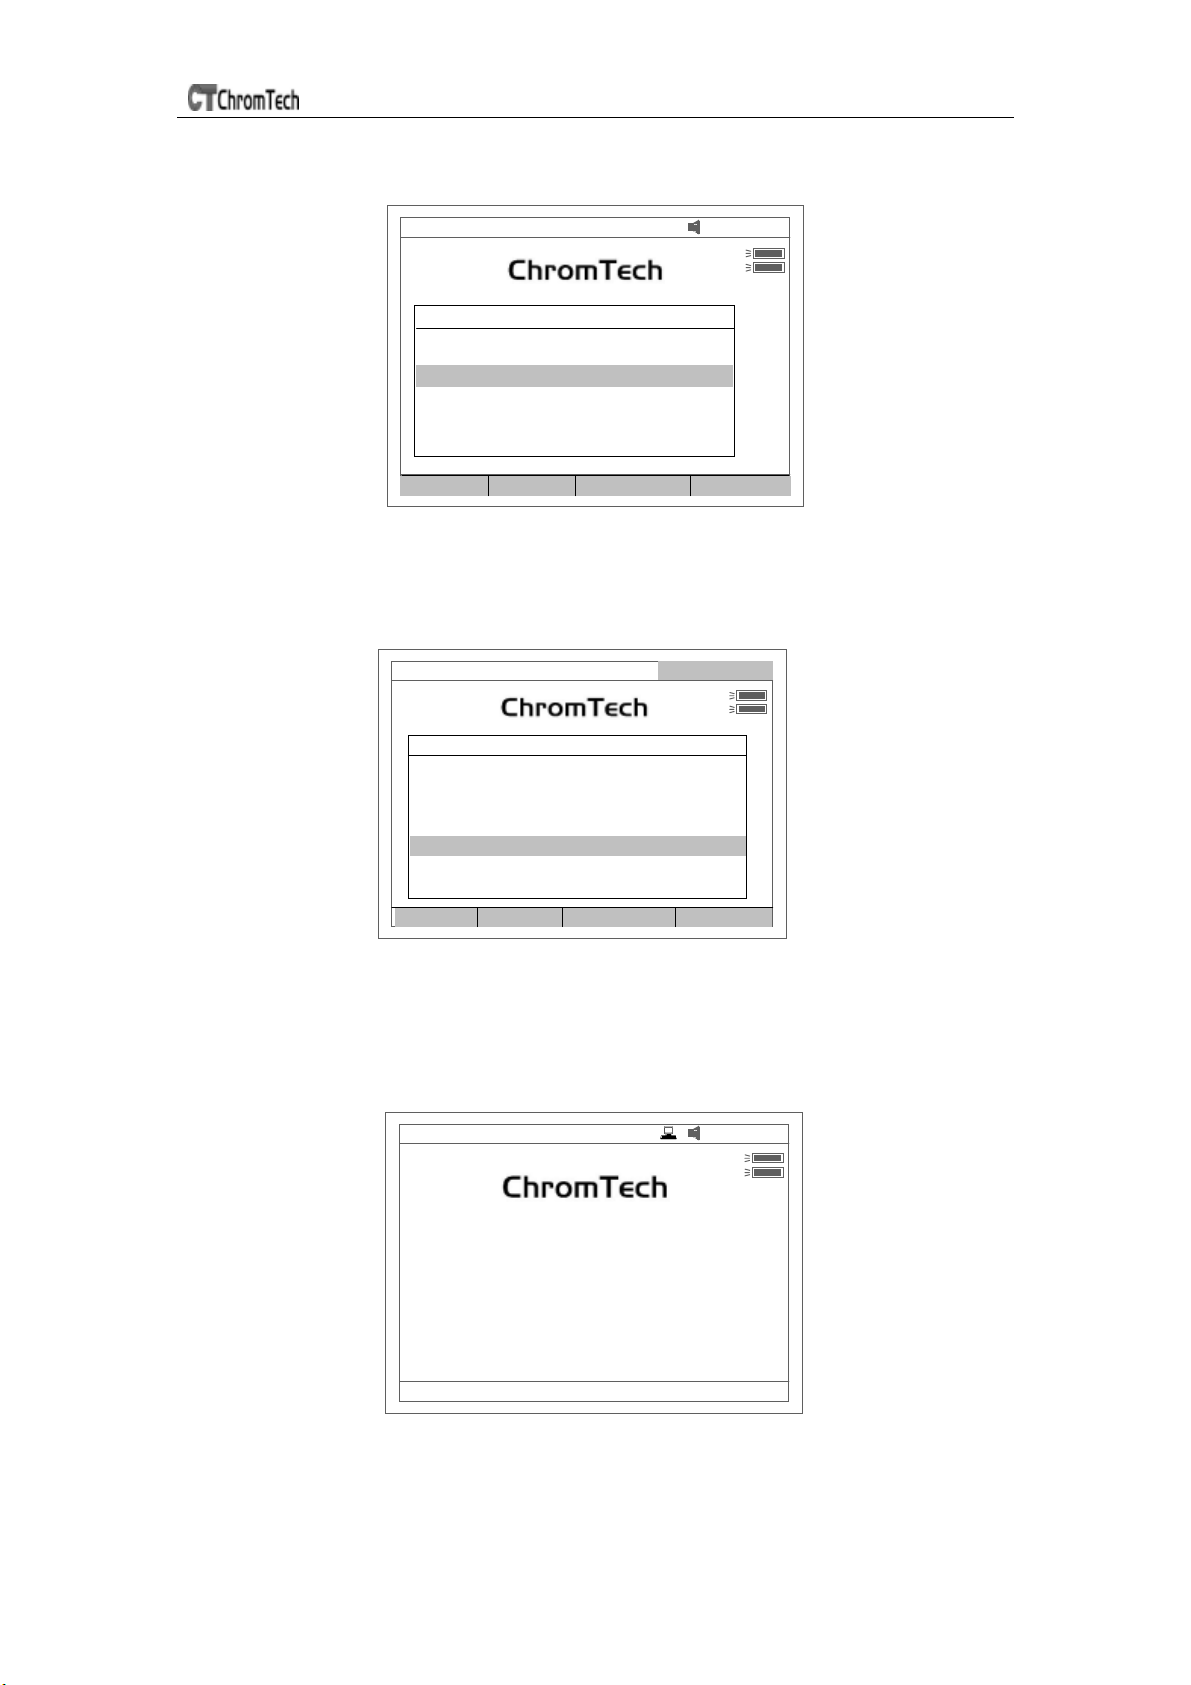
3. Press【3】in Fig 84 to set the time display on the top right corner of the
screen. (Fig 86).
38
Page 39
UV-3 SERIES SPECTROPHOTOMETER
4. Press【4】in Fig 84 to set the date display on the top right corner of the
WL : 656.1nm 08: 04: 35
D2
W
Cell #1
Clock Management
Switch D 2:
1. Set tim e
Reset D2 lamp usage time
2. Set date
Switch W :
3. Display time
Reset W lamp usage time
Switch point
4. D isplay da te
Cancel Move Up
Move Dn Select
Fig 86
☺ Dark Current
Press 【5】In Fig72 to get dark current (Fig 87).
WL : 656 .1nm Ge t dark curre nt
D2
W
Cell #1
System Service Routines
1. Wavelength Reset
2. Printer Setup
3. Lamp Service
4. Clock Setup
5. Refresh Dark Current
6. Connect to PC
7. Beeper on/off
Cancel Move Up
Move Dn Select
Fig 87
☺ Connect to PC
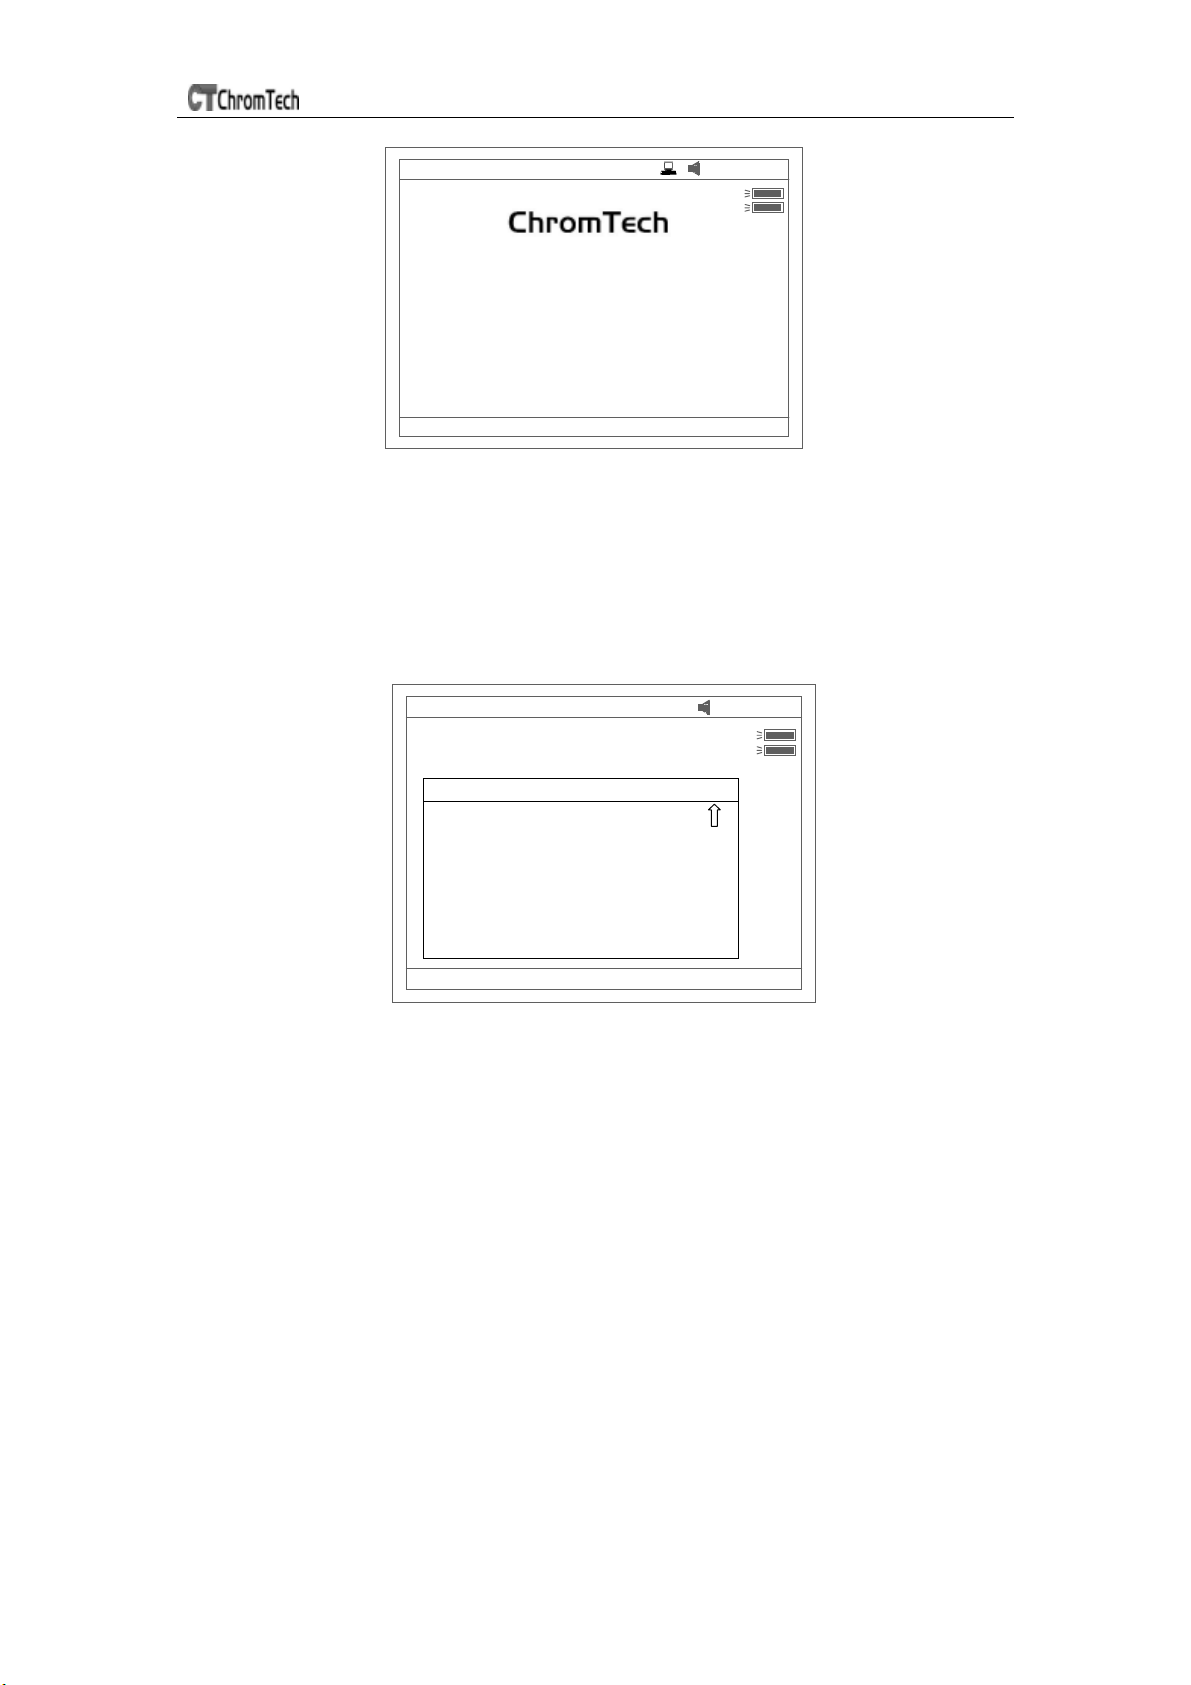
Press【6】in Fig 72 to connect to PC (Fig 88), if the instrument is on-line with the
PC. The screen displays as Fig 89. Press【ESC】to exit.
WL : 656.1nm 08: 04: 35
D2
W
Connectin g to computer . . .
Press (Esc ) to return...
Fig 88
39
Page 40
UV-3 SERIES SPECTROPHOTOMETER
WL : 656.1nm 08: 04: 35
D2
W
Contr olled by computer . . .
Press (Esc ) to return...
Fig 89
☺ Beeper on/off
Press【7】in Fig 72 to turn on/off the beeper
☺ Language selection
Press 【8】in Fig 72 to select working language, English and Chinese are
under your choice. (Fig 90)
WL : 656.1nm 08: 04: 35
D2
W
Cell #1
System Service Routines
Fig 90
☺ Refresh System Baseline
Press【9】in Fig 72 to refresh system baseline.
☺ Delete entire saved files
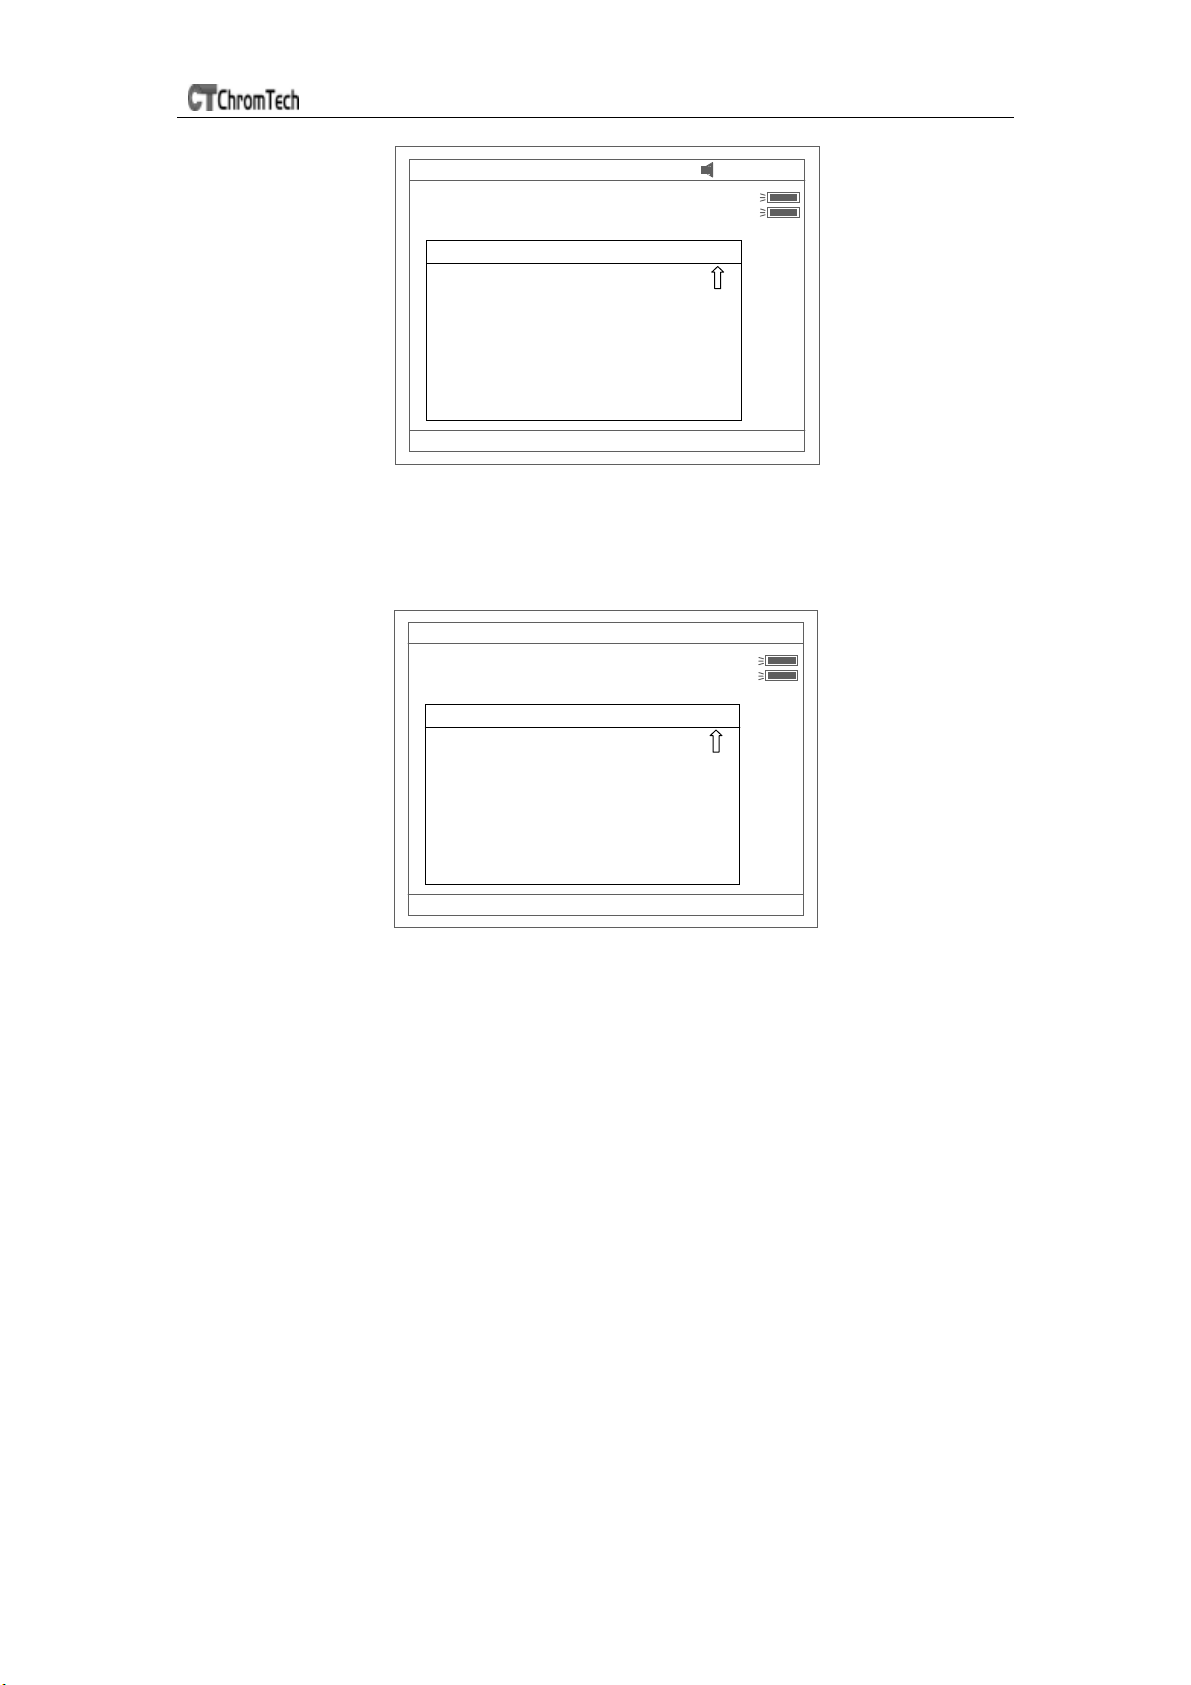
Move the cursor onto the tenth menu in Fig 72, then press 【ENTER】, all the
saved files will be deleted. Before deleting the files, double confirm need to
do.(Fig 91)
40
Page 41
UV-3 SERIES SPECTROPHOTOMETER
WL : 656.1nm 08: 04: 35
D2
W
Cell #1
System Service Routines
Fig 91
☺ Restore Default Settings
Move the cursor onto the eleventh menu in Fig 72, then press 【ENTER】to
restore the default parameters.(Fig 92)
WL : 656.1nm In itializing ...
D2
W
Cell #1
System Service Routines
Fig 92
41
Page 42
UV-3 SERIES SPECTROPHOTOMETER
Appendix A
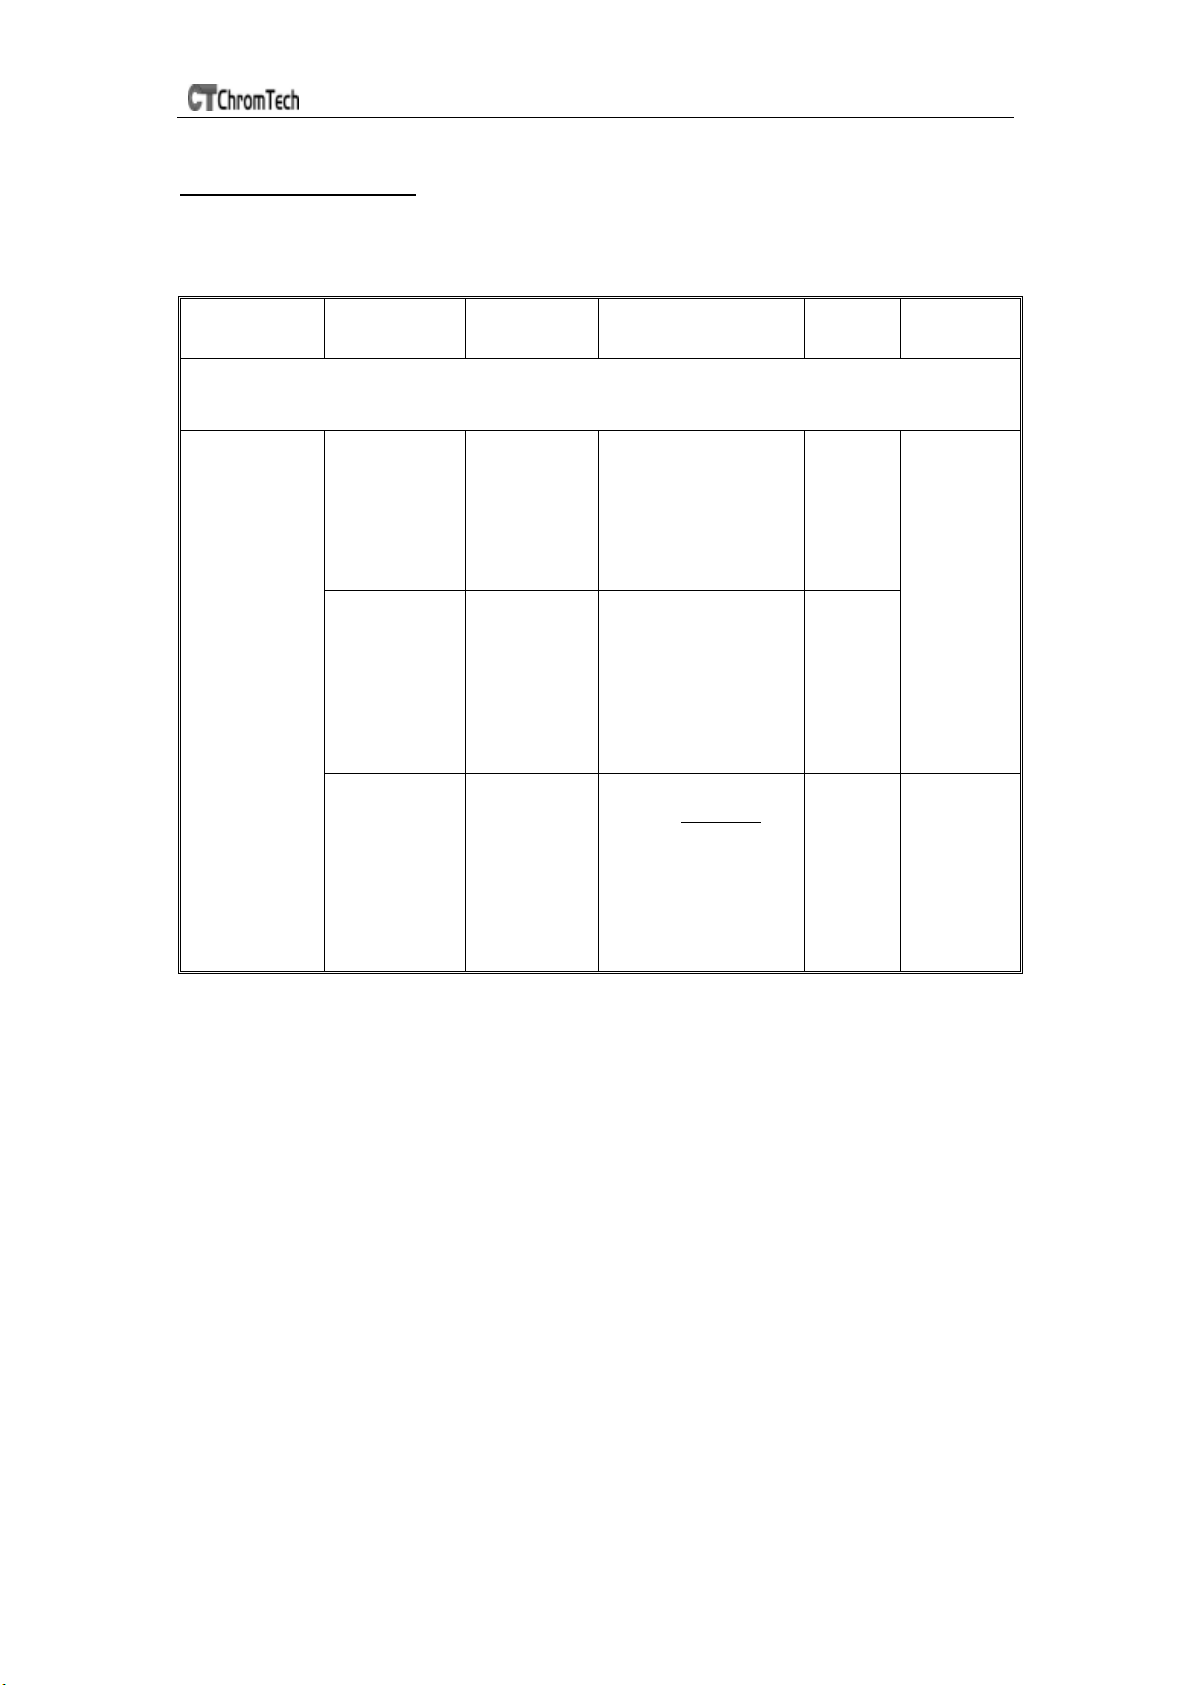
DNA/Protein Test Algorithm
Test Name
Method
DNA MEASUREMENT
Wavelength(s)
Calculations
Parameters
Displayed
Units
DNA/Protein
Concentration
and
DNA purity
Absorbance
difference
(260,280)
Absorbance
difference
(260,230)
Absorbance
ratio
A
1=A260nm
A2=A
280nm
A
ref=A320nm
(optional)
A
A2=A
A
(optional)
A
A2=A
or
A
A
(optional)
1=A260nm
230nm
ref=A320nm
1=A260nm
280nm
230nm
ref=A320nm
DNA
concentration:
(A1-A
ref)f1
-(A2-A
Protein
concentration
(A2-A
ref)f3
-(A1-A
DNA
concentration:
(A1-A
ref)f1
-(A2-A
Protein
concentration
(A2-A
ref)f3
-(A1-A
Ratio=
A
A1-A
2-Aref
ref
ref)f2
ref)f4
ref)f2
ref)f4
f1=62.9
f
2
f3=1552
=757.3
f
4
f1=49.1
f
2
f
3
f
4
None
=36.0
=3.48
=183
=75.8
DNA:
μg/ml
Protein:μ
g/ml
No units(ratio)
42
Page 43
UV-3 SERIES SPECTROPHOTOMETER
Appendix B
A number of correction techniques can be used to eliminate or reduce
interference errors. In general, if the source of the error is known and
is consistent from sample to sample, the error can be eliminated. On the
other hand, if the source is unknown and varies from sample to sample,
the error can be reduced but not eliminated. Correction techniques can
always require data from at least two wavelengths. The more sophisticated
correction techniques require multi-wavelength or spectral data.
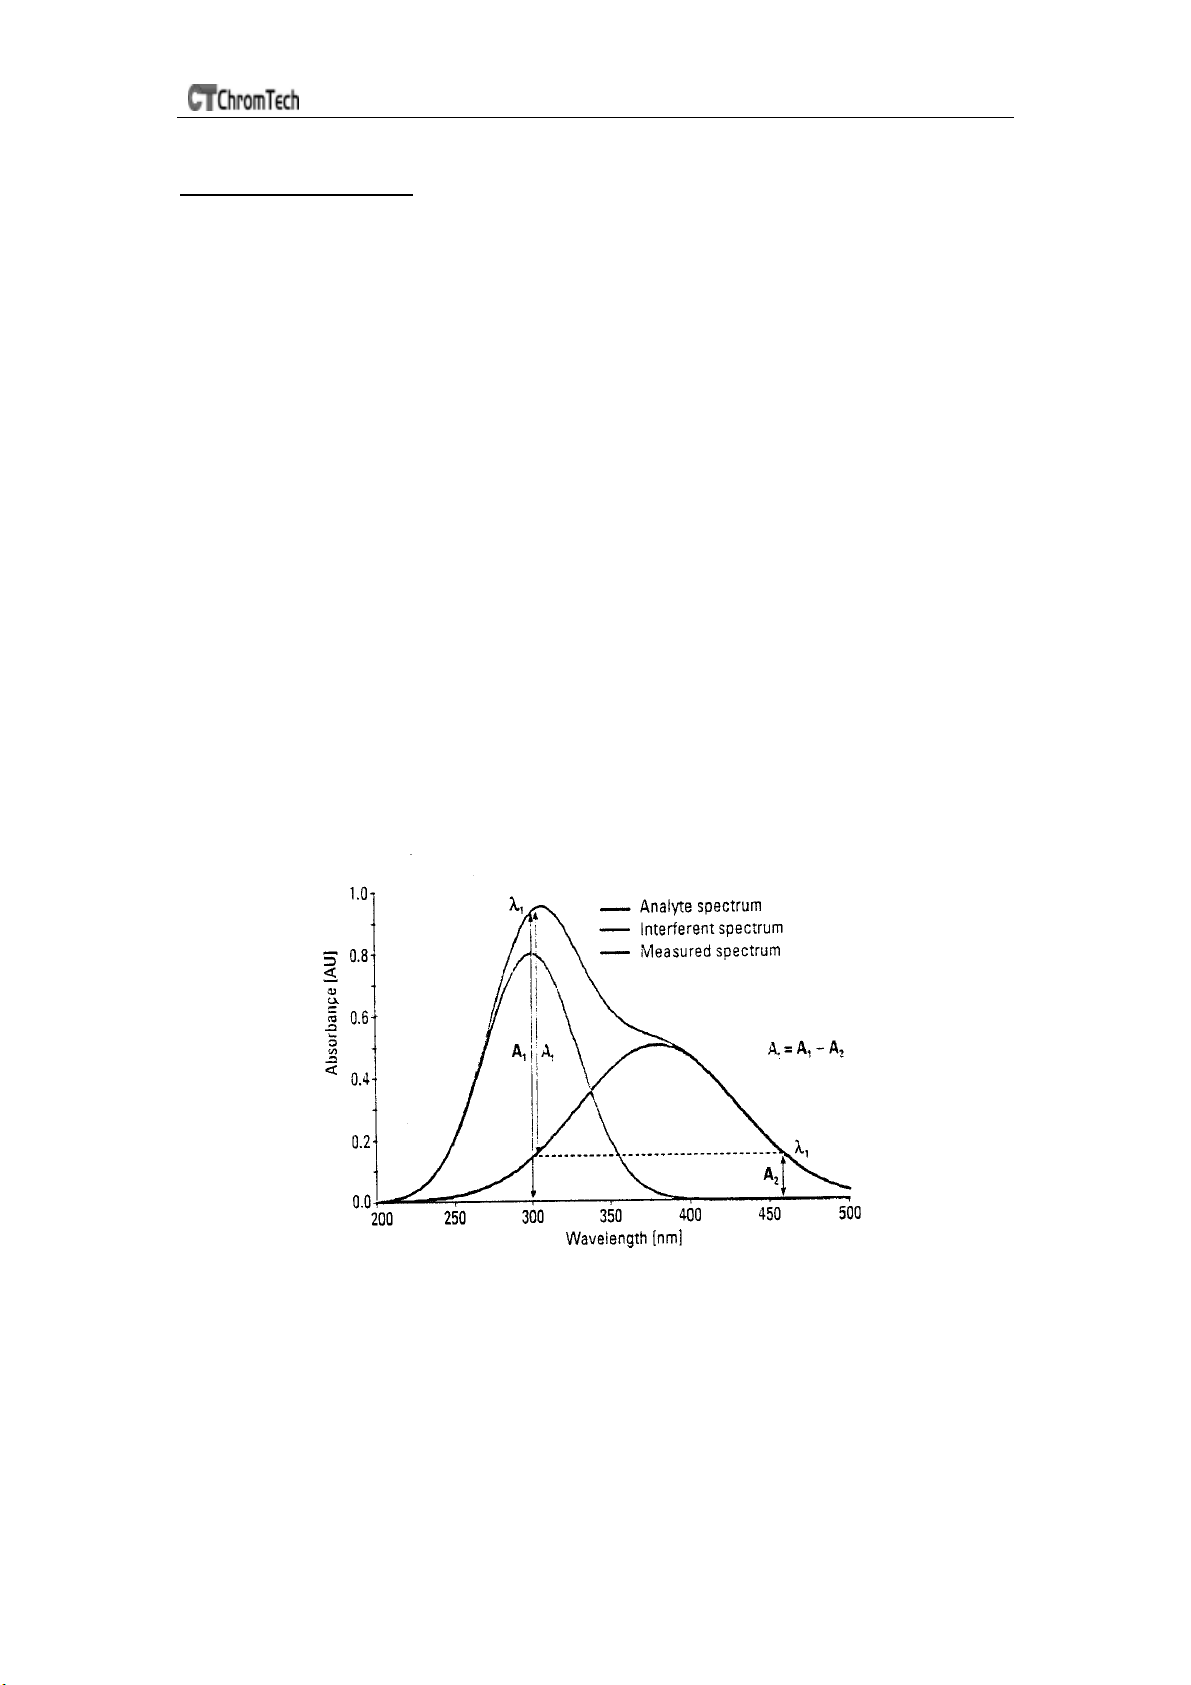
A.1 Iso-absorbance
When a known interfering component with a known spectrum is present, the
error introduced by this component at the analytical wavelength for the
target analyte can be eliminated by selecting a reference wavelength at
which the interfering compound exhibits the same absorbance as it does
at the analytical wavelength. The absorbance at this reference wavelength
is subtracted from the absorbance at the analytical wavelength, as shown
in Figure A1.The residual absorbance is the true absorbance of the
analyte.
This technique is less reliable when the spectra of the analyte and of
the interferent are highly similar. Moreover, it can correct for only one
interference
Fig A1 Iso-absorbance correction
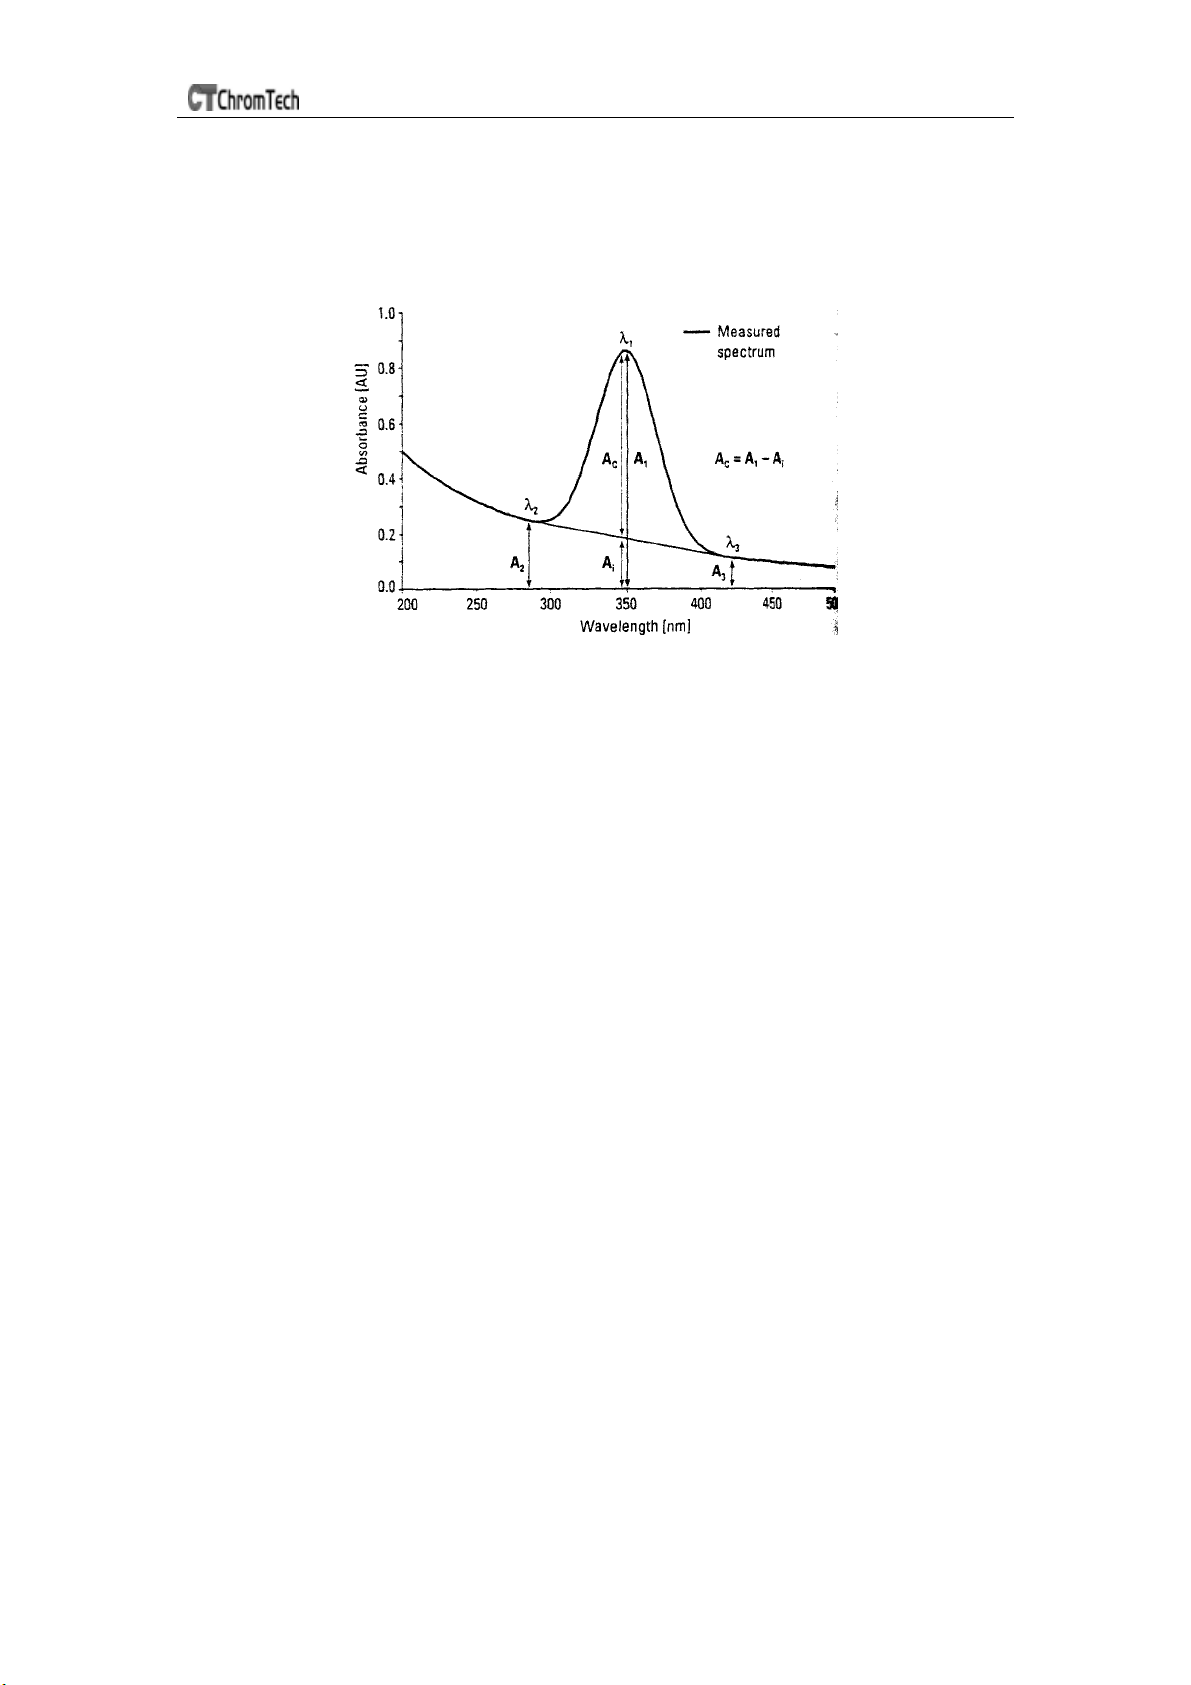
A.2 Three-point correction
The three-point, or Morton-Stubbs correction uses two reference
wavelengths, usually those on either side of the analytical wavelength.
The background interfering absorbance at the analytical wavelength is
then estimated using linear interpolation (see Figure A2).This method
represents an improvement over the single-wavelength reference technique
43
Page 44
UV-3 SERIES SPECTROPHOTOMETER
because it corrects for any background absorbance that exhibits a linear
relationship to the wavelength. In many cases, if the wavelength range
is narrow, it will be a reasonable correction for non-linear background
absorbance such as that resulting from scattering of from a complex
matrix
.
Fig A2
44
Page 45
UV-3 SERIES SPECTROPHOTOMETER
Appendix C
Maintenance
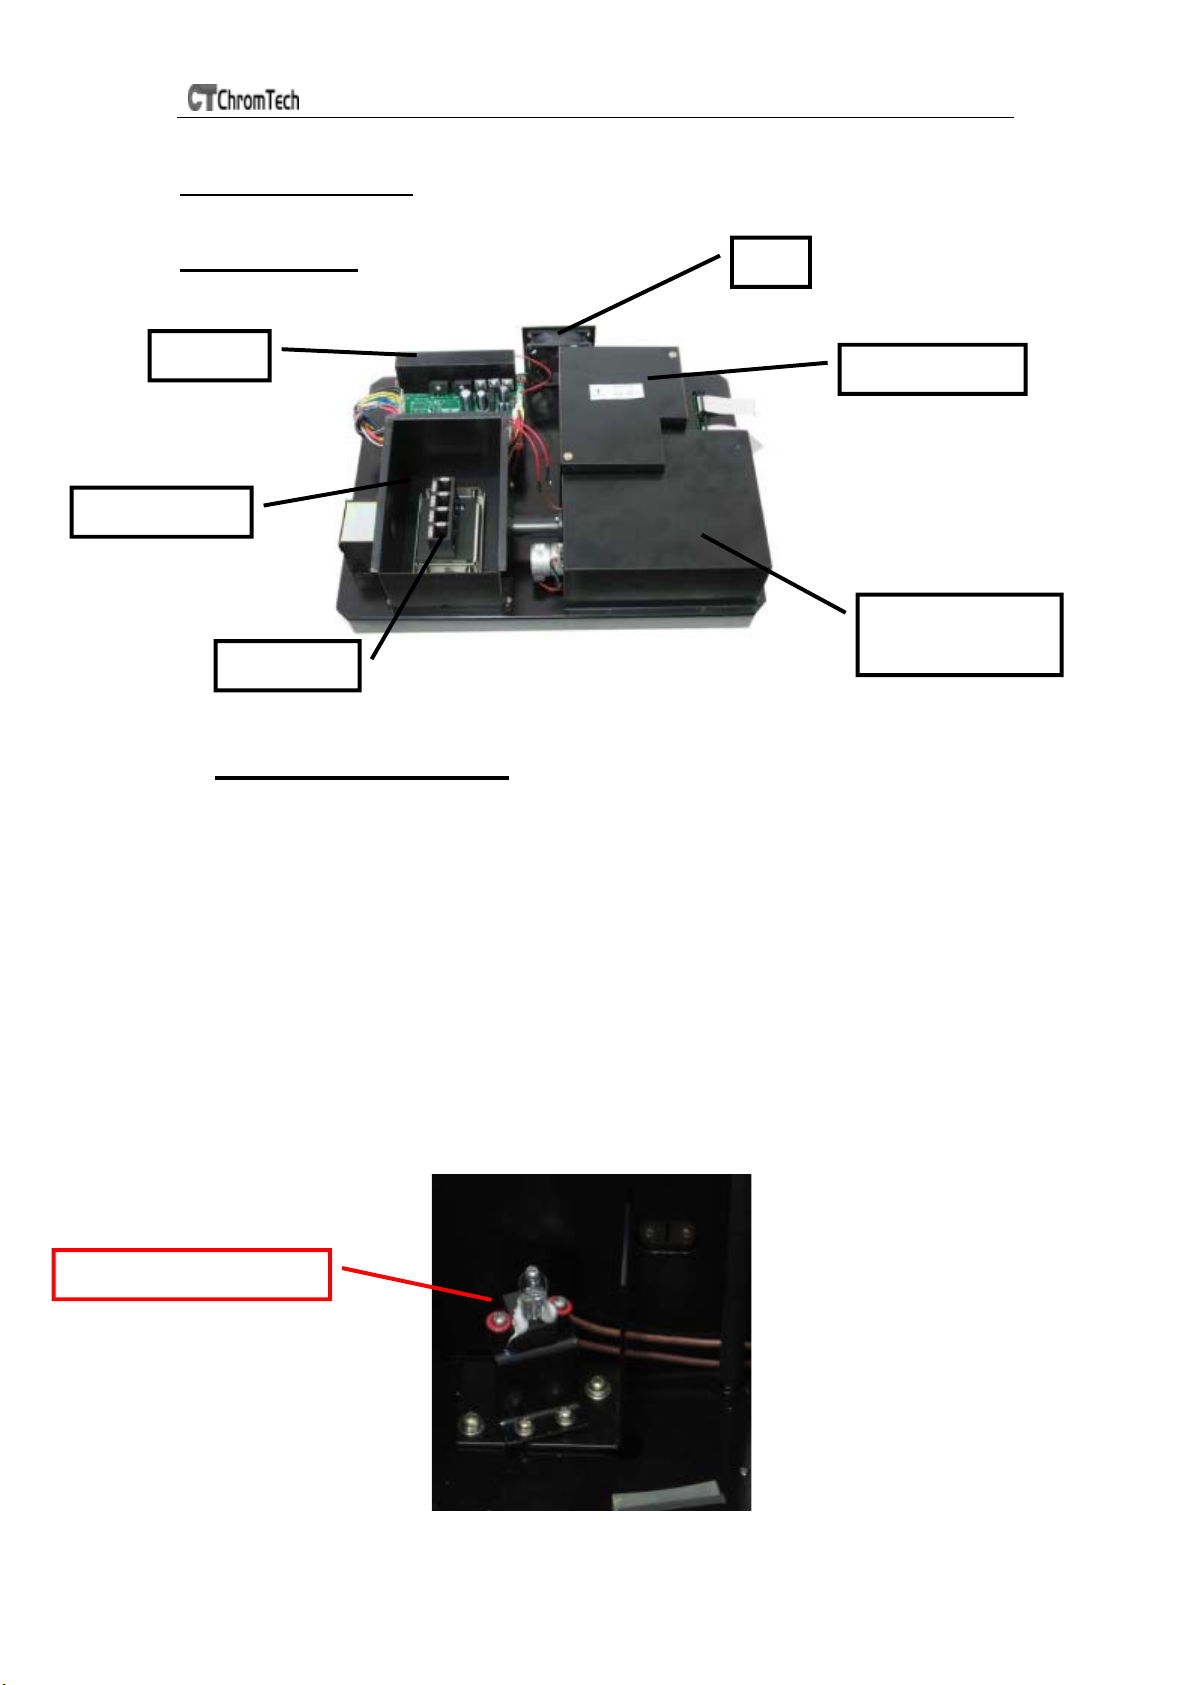
Inside Structure
Radiator
Compartment
Fig.4-1 Inside Planform
1. Lamp Replacement
A.
Turn off and unplug the instrument.
Remove the four screws on the sides of the spectrophotometer
Remove the Cuvette Holder Control Knob by unscrewing the rod
Remove the cover of the instrument very carefully and place it in the right of
Unscrew the two screws from the Lamp Chamber and remove its cover.
Unplug and remove the lamp from ceramic base (the black connector). Insert
Cell-holder
Fan
Lamp Chamber
Mono-chromator
Chamber
Replace Tungsten-Halogen Lamp
.
counterclockwise.
the instrument.
BE SURE NOT TO PULL PANEL WIRING LOOSE!
(Caution: The cover may be HOT,be sure to wear gloves when
act)
the new lamp; pushing it in as far as it will go.
Tungsten-Halogen Lamp
45
Page 46
UV-3 SERIES SPECTROPHOTOMETER
I
Fig.4-2
CAUTION:
1) Do not handle the lamp with bare fingers. Use tissue or cloth when
handling lamp.
2) There’s no difference in polarity of the two legs of Tungsten-halogen
lamp.
Switch the instrument on. Set the wavelength at 340 nm, insert an empty
cuvette, and blank the instrument. If the energy is low, adjust the lamp by
“pulling” or “pushing” it so that the light beam is focused on the entrance
slot of the mono-chromator. Since the lamp socket is pre-aligned, there
will be minimum, if any, adjustment required.
Switch the instrument off, re-cover the lamp chamber and tighten the two
screws.
Reinstall the instrument cover by positioning the front of the cover first and
then sliding the back
of the cover over the backside grill plate. Be sure to
prevent all wires from being pinched in the process.
Reinstall the four screws and the Cuvette Holder Control Knob.
B. Replace Deuterium Lamp
WARINING: Wear UV protection Glasses before changing the Deuterium
Lamp!
1. Turn off and unplug the instrument (
2. Remove the four screws on the sides of the spectrophotometer.
3.
Remove the Cuvette Holder Control Knob by unscrewing the rod
counterclockwise.
4. Remove the cover of the instrument very carefully and place it in the
right of the instrument.
BE SURE NOT TO PULL PANEL WIRING LOOSE!
5. Unscrew the two screws from the Lamp Chamber and remove its cover.
(Caution: The cover may be HOT,be sure to wear gloves when act)
6. Disconnecting the 3-wire connector by pulling it straight up. Remember the
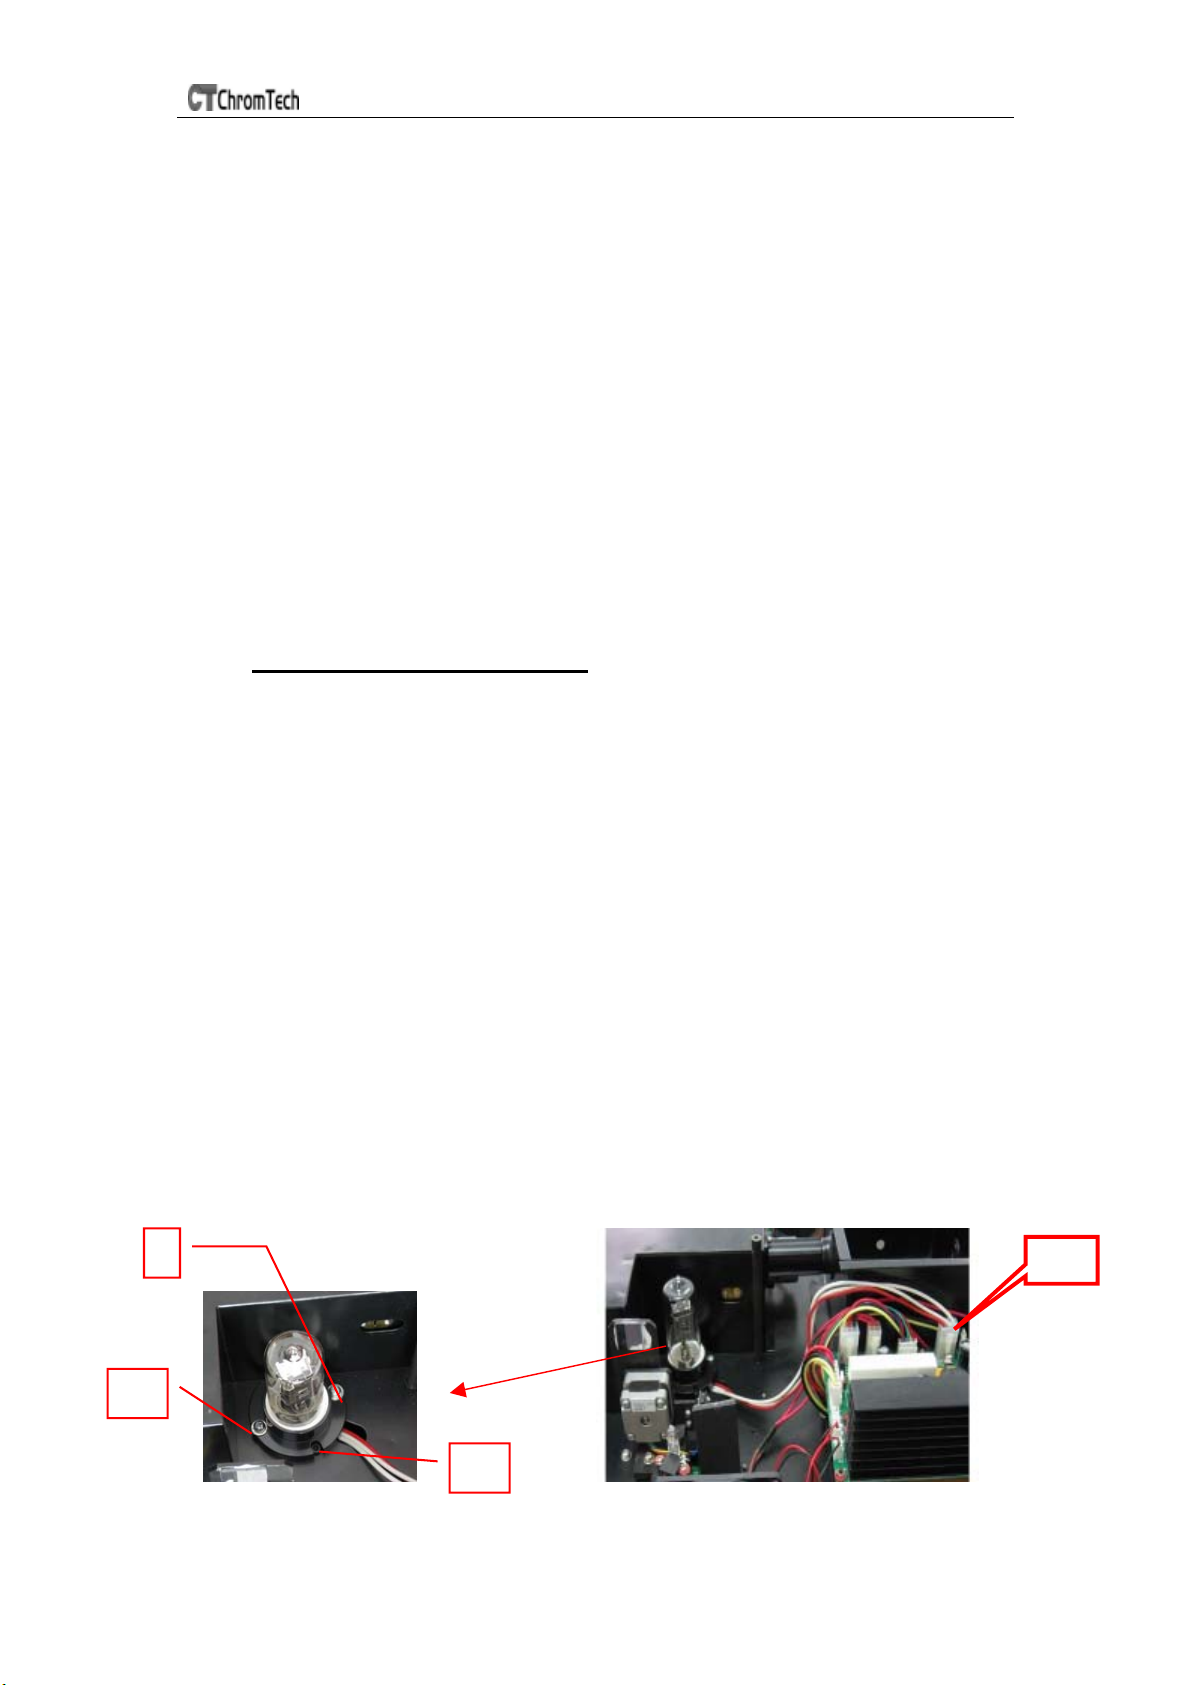
direction of the white connector. (Fig. IV in the following picture)
7. Loosen and remove the two white screws (Fig. I and II in the following
picture) from the deuterium flange. Then pull the Deuterium lamp out by
pinching its flange. (Note: Fig. III is a positioning bolt, there’s no need to
loosen it)
VERY IMPORTANT: HIGH VOLTAGE
).
IV
II
III
Zoom in of D2
46
Page 47
UV-3 SERIES SPECTROPHOTOMETER
Fig.4-3
8. Replace a new pre-aligned lamp provided by ChromTech or an
authorized ChromTech Service Provider. Be sure the socket of the lamp
flange matches with the positioning bolt. Then tighten the two screws.
9. Reconnect the wire connector (make sure the wire connection orientation
is the same as step 6.)
10. Turn on the instrument. After self-testing, select 300 nm and press
【ZERO】. Check to make sure that the light beam is focused on the
entrance slit of the monochromator. Since the lamp is pre-aligned, there
will be minimum, if any, adjustment required.
Switch the instrument off, re-cover the lamp chamber and tighten the two
screws.
Reinstall the instrument cover by positioning the front of the cover first and
then sliding the back
prevent all wires from being pinched in the process.
Reinstall the four screws and the Cuvette Holder Control Knob.
of the cover over the backside grill plate. Be sure to
2. Battery Replacement
ChromTech UV-1100 and 12 Series can save many data in the RAM, so a
battery must be used in the mainboard. When the battery is disabled, you’ll
have to replace it as the following indication.
1) Turn off and unplug the instrument (VERY IMPORTANT: HIGH
VOLTAGE).
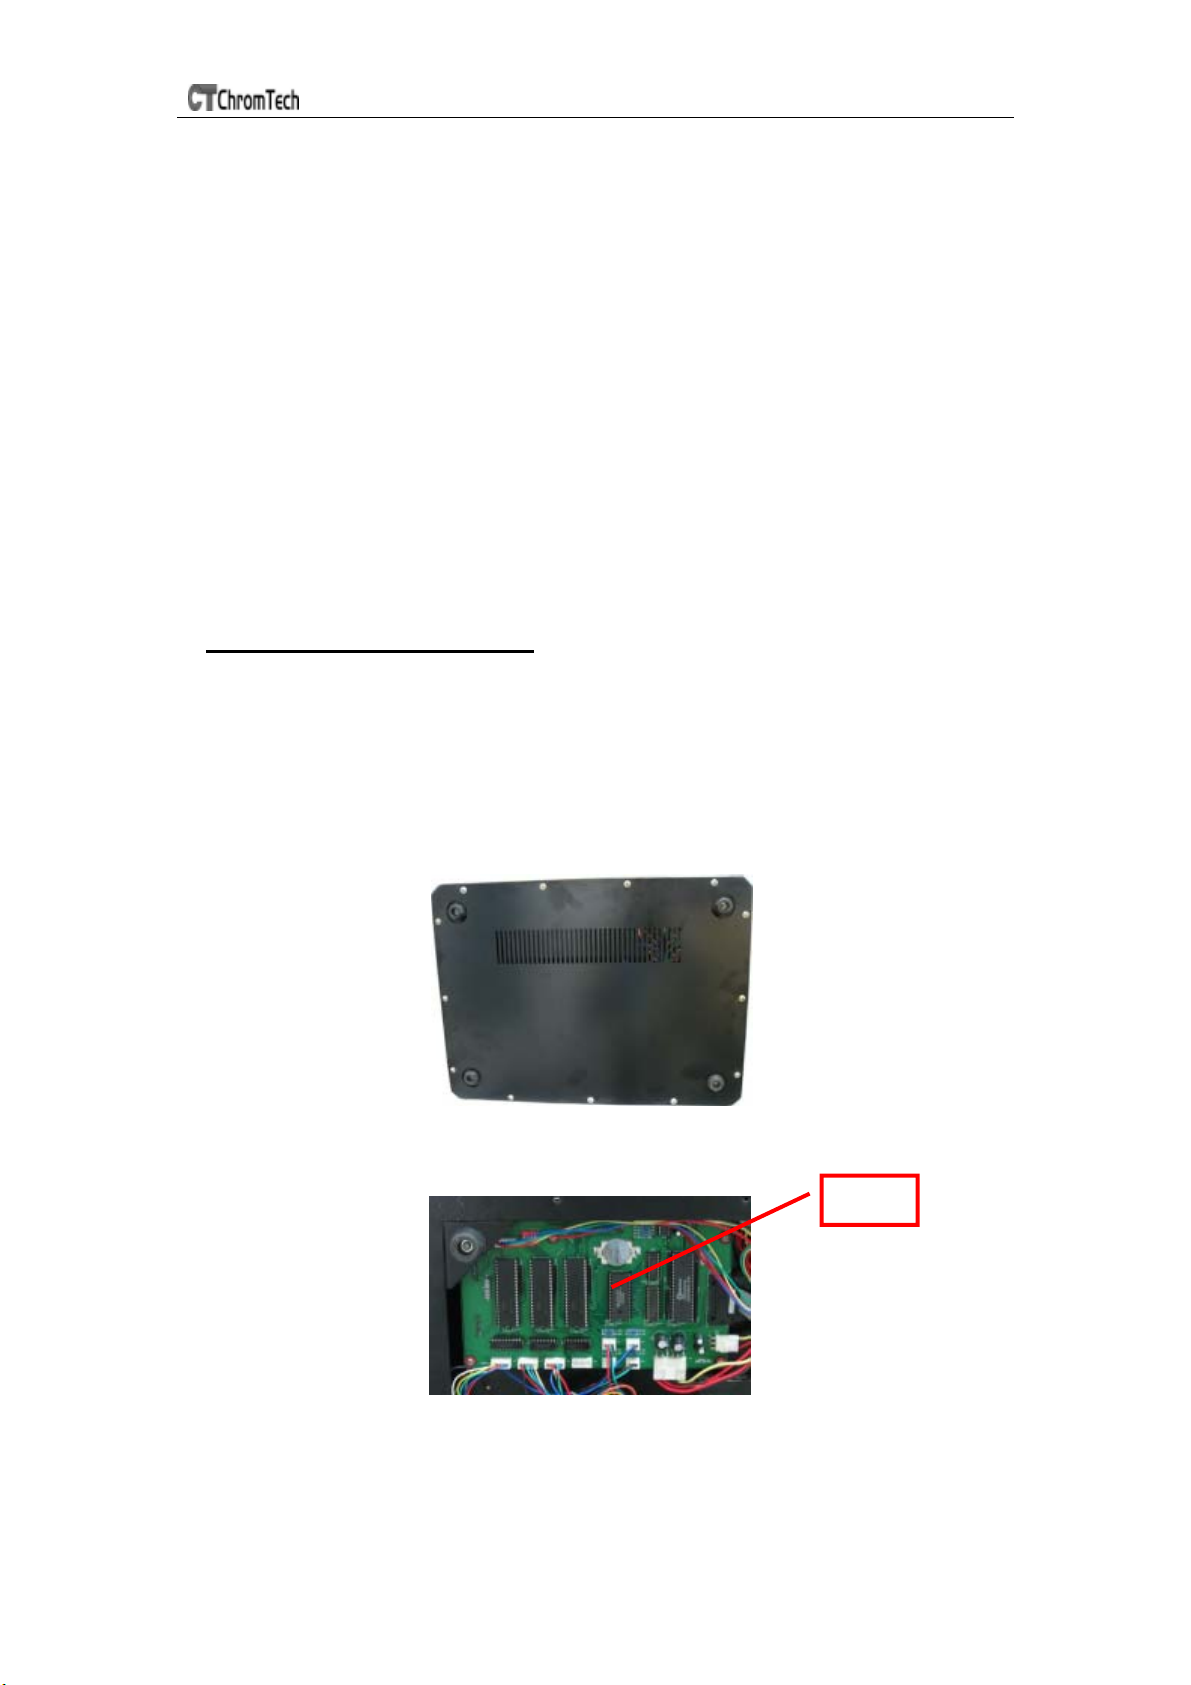
2) Unscrew the 13 white screws from the bottom board and remove the
board. (Fig.4-4)
Fig.4-4 Bottom
3) Pick out the old battery and replace a new one. (Fig.4-6)
Batter
Fig. 4-5 Main Board
4) Recover the bottom board and tighten the 13 screws.
47
Page 48
UV-3 SERIES SPECTROPHOTOMETER
3、Trouble-shooting
PROBLEM Possible Cause Solution
Instrument
Inoperative
after switch
power on
Instrument
cannot set
100%T (0.000A)
Power cord not connected to outlet Plug instrument in
Dead Power outlet Change to a different outlet
Wrong voltage setting Switch to your local voltage or call
an authorized service engineer
Internal fuse blown or defective
electronic component
Light beam blocked:
Holder misaligned
Lamp is old or defective Replace lamp
Lamp is off alignment Refer to lamp replacement
Defective electronic component Call an authorized service
Call an authorized service
engineer
Check sample holder
instructions in this manual
engineer
Instrument drift
and noise
Incorrect
readings
obtained
No sufficient warm up time warm up at least 20 minutes
Use glass cuvette in Ultra-violet range Change to quartz cuvette
Significant temperature change
Lamp not adjusted properly
Lamp old or defective Replace with a new lamp
Unstable power supply equip a manostat to make the
Defective or dirty detector or defective
electronic component
Insufficient sample volume Fill cuvette with more samples
Wrong wavelength setting
Failed to blank (0A/100%T)
Stray sample preparation vapors. Prepare sample away from
Bubbles or particles in solution Check sample preparation and
Check lamp if has been properly
installed. Refer
to lamp replacement instructions in
this manual
voltage stable
Call an authorized service
engineer
Check analytical procedure and
wavelength setting.
Get dark current and calibrate
wavelength in utility menu.
instrument. Use proper
ventilation
analytical procedure
Instrument out of electronic calibration Call an authorized service
engineer
48
 Loading...