

Page 1
INST No INE -403-0P0
IR-M2
□□□
Series
INFRARED MOISTURE METER
DESIGNED AS A FIBER OPTIC
(Model : IR-M21
□□
,IR-M22
□□
)
Please be sure to deliver these instructions
with the unit to the end user.
Always keep these instruction with the unit.
Page 2
INST No INE -403-0P0
−C1−
Request to designers, instrument controllers, and sale agents
Delivery this instruction manual to the operator of this instrument without fail.
Request to the operator of this instrument
This instruction manual is necessary for maintenance, too. Keep this manual with due
care until the instrument is discarded.
■
FOR SAFE USE
For the purpose of using this unit safely, observe the following cautions for safety during
the operation, maintenance, and repair of this unit without fail.
Take safety measures separately against wrong operation, troubles, and other circumstances
of this unit.
●The following warning mark is struck to this unit to enable users to use
this unit safely.
●This instruction manual uses the following symbol marks for safe use.
■
PREFACERequests and notices
Thank you for your purchase of IR-M21□□□□, IR-M22□□□□series Infrared
m oisture meter designed as a fiber optic. Please read this instruction manual without fail
for using this instrument correctly and safely and also preventing troubles in advance.
1.For the contents of this manual, alteration is reserved without notice in the future.
2.This manual has been prepared by making assurance doubly sure about its contents.
However, if any question arises or if any error, an omission, or other deficiencies
were found, please inform your nearest CHINO’s sales agent of them.
3.Y ou are requested to understand that CHINO is not responsible for any operation
results.
Note
This warning mark is struck to the portions being subject to an electric shock
acc
ident. Turn off the power supply of the feed source without fail before starting
wiring, maintenance, and repair.
Observe this caution item strictly for avoiding a danger, otherwise
negligence of this caution may possibly cause troubles of this unit and
accidents
Observe this caution item strictly, otherwise negligence of this caution
may cause the damage of the unit or measuring errors.
This mark is described in each title covering or
instructions.
!
War ning
Caution
!
Warning
DANGER
Refere nce
Information that you can use as a reference.
Page 3

INST No INE -403-0P0
−C2−
●
Power supply
Make sure that the power voltage of this unit meets the feed power voltage without fail
before feeding power to this unit.
●
Protective grounding
Perform the protective grounding without fail before turning on the power supply of this
unit for the purpose of preventing an electric shock accident.
●
Necessity of protective grounding
Don’t cut the internal or external protective grounding wire of this unit nor disconnect
the wiring at the protective grounding terminal.
●
A defect of protective functions
Don’t operate this unit, if the protective grounding, fuse, or other protective functions
seem to be defective. Check the protective functions for defects before operating this
unit.
●
Use in a gaseous atmosphere
Never operate this unit at a place where a combustible gas, an explosive gas or their
vapors exist., otherwise a very dangerous accident will occur.
●
Never touch the interior by hand.
This unit is internally provided with high-voltage circuits. Never touch the interior by
hand when the voltage is applied to this unit.
●
External connections
Perform the protective grounding securely without fail before connecting this unit to a
measuring object and/or an external control circuit.
■
CAUTIONS FOR SAFETY
Page 4
INST No INE -403-0P0
−C3−
CONTENTS
1.General
・・・・・・・・・・・・・・・・・・・・・・・・・・・・
1
1.1Summary
・ ・・・ ・・・ ・・・ ・・・ ・・・ ・・・ ・・・ ・・・ ・・
1
1.2Configuration
・ ・・・ ・・・ ・・・ ・・・ ・・・ ・・・ ・・・ ・・
1
2 .Model s and accessories
・・・・・・・・・・・・・・・・・
2
2.1Models・・・・・・・・・・・・・・・・・・・・・・・・・・・・・ 2
2.1.1 Detector unit
・ ・・・ ・・・ ・・・ ・・・ ・・・ ・・・ ・・・ ・・
2
2.1.2 Reflective type fiver
・ ・・・ ・・・ ・・・ ・・・ ・・・ ・・・
2
2.1.3 Output checker plate for reflective
type fiver optics
・ ・・・ ・・・ ・・・ ・・・ ・・・ ・・・ ・・・
2
2.1.4 Reflective type fiver opt ics with lens attachment 2
2.1.5 Output checker plate for reflective
type fiver optics with lens attachment
・ ・・・ ・・・ ・
2
2.1.6 Transparent type fiver optics
・ ・・・ ・・・ ・・・ ・・・
2
2.1.7 Measuring cell for liquids
・ ・・・ ・・・ ・・・ ・・・ ・・
2
2.1.8 Connection cable
・ ・・・ ・・・ ・・・ ・・・ ・・・ ・・・ ・・
2
2.2Accessories
・ ・・・ ・・・ ・・・ ・・・ ・・・ ・・・ ・・・ ・・・ ・
2
3.Setting
・・・・・・・・・・・・・・・・・・・・・・・・・・・・・
3
3.1Settin g of dispswitches ・・・・・・・・・・・・・・・・・・ 3
3.2Installation of reflective type fiver optics ・・・・・・ 5
3.2.1 Installation of tip part・・・・・・・・・・・・・・・・・・・ 5
3.2.2 Air purge(Only IR-WCRN)・・・・・・・・・・・・・・ 6
3.2.3 Connections with detector unit ・・・・・・・・・・・・ 6
3.2.4 Optical path ・・・・・・・・・・・・・・・・・・・・・・・・・ 7
3.2.5 Measuring place
(for objects of pulverized or granul ar substance) 7
3.2.6 For the objects in sheet state such as paper, etc.7
3.3Installation of transparent type fiver optics ・・・・ 8
3.3.1 Installation of cell for liquids ・・・・・・・・・・・・・・ 8
3.3.2 Connections with detector unit ・・・・・・・・・・・・ 9
3.3.3 Disassemble cleaning ・・・・・・・・・・・・・・・・・・・ 9
3.4Installation of detector unit ・・・・・・・・・・・・・・・10
3.4.1 Outside and mounting dimensions of
detector unit ・・・・・・・・・・・・・・・・・・・・・・・・・10
4. Connections
・・・・・・・・・・・・・・・・・・・・・・・・・
11
4.1Connections
・ ・・・ ・・・ ・・・ ・・・ ・・・ ・・・ ・・・ ・・・ ・
11
4.2Layout of connection cable
・ ・・・ ・・・ ・・・ ・・・ ・・
11
4.3Multi -detector connections
・ ・・・ ・・・ ・・・ ・・・ ・・
12
4.3.1 Connections through relay box
・ ・・・ ・・・ ・・・ ・・・
12
4.3.2 Connections without rela y box
・ ・・・ ・・・ ・・・ ・・・
13
5.Names and functions of component parts
・・・
14
5.1Names and functions of detector unit
・ ・・・ ・・・ ・
14
5.2Names and functions of setting display part
・ ・・・
15
6. Operation
・・・・・・・・・・・・・・・・・・・・・・・・・・・・
16
6.1Confirmation before operation
・ ・・・ ・・・ ・・・ ・・
16
6.2Setting of detector unit number
・ ・・・ ・・・ ・・・ ・・
16
6.3Setting of calibration curve data
・ ・・・ ・・・ ・・・ ・・
16
6.3.1 Setting data
・ ・・・ ・・・ ・・・ ・・・ ・・・ ・・・ ・・・ ・・・ ・
17
6.3.2 Setting of calibration curve data
・ ・・・ ・・・ ・・・ ・
18
6.4Preparation of calibration curbe
by knee point line approximation
・ ・・・ ・・・ ・・・ ・
18
6.4.1 Setting of knee point data
・ ・・・ ・・・ ・・・ ・・・ ・・・
18
6.4.2 Knee point line setting data
・ ・・・ ・・・ ・・・ ・・・ ・・
19
6.4.3 Setting of calibration curbe data
for knee point line approximation
・ ・・・ ・・・ ・・・
20
6.5 Setting of operating conditions
・ ・・・ ・・・ ・・・ ・・・
21
6.5.1 Setting data
・ ・・・ ・・・ ・・・ ・・・ ・・・ ・・・ ・・・ ・・・ ・
21
6.5.2 Setting
・ ・・・ ・・・ ・・・ ・・・ ・・・ ・・・ ・・・ ・・・ ・・・ ・
23
6.6Calibration
・ ・・・ ・・・ ・・・ ・・・ ・・・ ・・・ ・・・ ・・・ ・
23
6.7Setting of calibration curve number・・・・・・・・・24
6.8Correction of calibration curve
・ ・・・ ・・・ ・・・ ・・
24
7.Preparation of calibration curve
・・・・・・・・・・
25
7.1Sample preparation ・・・・・・・・・・・・・・・・・・・・ 25
7.1.1 Powder or guranular
・ ・・・ ・・・ ・・・ ・・・ ・・・ ・・・
25
7.1.2 Paper(sheet substance)
・ ・・・ ・・・ ・・・ ・・・ ・・・ ・・
26
!
!
!
!
!
!
!
!
!
Page 5

INST No INE -403-
−C4−
7.1.3 Liquid
・ ・・・ ・・・ ・・・ ・・・ ・・・ ・・・ ・・・ ・・・ ・・・ ・・
26
7.2Sample measuremernt ・・・・・・・・・・・・・・・・・・ 27
7.2.1 Powder or granular
・ ・・・ ・・・ ・・・ ・・・ ・・・ ・・・ ・
27
7.2.2 Paper(sheet substance)
・ ・・・ ・・・ ・・・ ・・・ ・・・ ・・
28
7.2.3 Liquid
・ ・・・ ・・・ ・・・ ・・・ ・・・ ・・・ ・・・ ・・・ ・・・ ・・
28
7.3Preparation of calibration curves・・・・・・・・・・・ 29
7.3.1 Computation of regression expression
・ ・・・ ・・・ ・
29
7.3.2 Confirmation of regression expression
・ ・・・ ・・・
30
8.Correction function by sample temprature
from external input (option)
・・・・・・・・・・・・
31
8.1Summary ・・・・・・・・・・・・・・・・・・・・・・・・・・・ 31
8.2Model・・・・・・・・・・・・・・・・・・・・・・・・・・・・・・ 31
8.3Wiring of detector unit ・・・・・・・・・・・・・・・・・・ 31
8.4S etting of dipswitch ・・・・・・・・・・・・・・・・・・・・ 31
8.5Setting of correction enabled/disabled
by sample temperature ・・・・・・・・・・・・・・・・・ 32
8.5.1 Setting at the detector unit
・ ・・・ ・・・ ・・・ ・・・ ・・・
32
8.5.1 Setting at the display unit
・ ・・・ ・・・ ・・・ ・・・ ・・・
32
8.6Setting of sample temperature scaling
(Only 4 to 20mA DC) ・・・・・・・・・・・・・・・・・・・ 33
8.6.1 Setting at the det ector unit
・ ・・・ ・・・ ・・・ ・・・ ・・・
33
8.6.2 Setting at the display unit
・ ・・・ ・・・ ・・・ ・・・ ・・・
33
8.7Setting of sample temperature ・・・・・・・・・・・・ 33
8.8Setting of calibration curve data ・・・・・・・・・・・ 34
8.9Measurement ・・・・・・・・・・・・・・・・・・・・・・・・ 35
8.10Display of sample temperature Ts ・・・・・・・・・ 35
8.10.1 Display at the detector unit
・ ・・・ ・・・ ・・・ ・・・ ・
35
8.10.2 Display at the set ting display unit
・ ・・・ ・・・ ・・・
35
9.Inspection and maintenance
・・・・・・・・・・・・・
35
9.1Periodical inspection ・・・・・・・・・・・・・・・・・・・ 35
9.2Self-diagnosis function ・・・・・・・・・・・・・・・・・・ 36
9.3 Measures against troubles not included in
self-diagnosis ・・・・・・・・・・・・・・・・・・・・・・・・・ 37
9.4Maintenance parts・・・・・・・・・・・・・・・・・・・・・ 38
9.4.1 List of maintenance parts
・ ・・・ ・・・ ・・・ ・・・ ・・・
38
9.4.2 Repla cement of light source lamp
・ ・・・・・・・・・ ・
38
9.4.3 Replacement of motor
・ ・・・・・・・・・ ・・・・・・・・・
39
9.4.4 Replacement of lithium batterty
・ ・・・ ・・・ ・・・ ・・
40
9.4.5 Replacement of power supply unit
・ ・・・ ・・・ ・・・
41
9.4.5 Ram clearing
・ ・・・ ・・・ ・・・ ・・・ ・・・ ・・・ ・・・ ・・・
41
10.Specifications
・・・・・・・・・・・・・・・・・・・・・・・
42
10.1Detector unit ・・・・・・・・・・・・・・・・・・・・・・・・42
10.2Fiver optics ・・・・・・・・・・・・・・・・・・・・・・・・・43
10.2.1 Reflective type fiver optics IR-WCRN
・ ・・・ ・・・
43
10.2.2 Output checker plate for reflective type
fiver optics IR-WCNB
・ ・・・ ・・・ ・・・ ・・・ ・・・ ・
43
10.2.3 Raflective type fiver optics with lens IR-WCRE 43
10.2.4 Output checker plate for reflective type
fiver optics with lens IR-WCREB
・ ・・・ ・・・ ・・・
43
10.2.5 Measuring cell for liquid IR-WCC1
・ ・・・ ・・・ ・
44
10.2.6 Transparent type fiver optics IR-WCT
・ ・・・ ・・
44
10.3Accessories ・・・・・・・・・・・・・・・・・・・・・・・・・44
10.3.1 Power supply unit (conforming to CE) IR-WEP 44
10.3.2 Connection cable IR-WERT
・ ・・・ ・・・ ・・・ ・・・
44
CONTENTS
!
!
!
!
Page 6
INST No. INE -403-0P0
−1−
1.1 Summary
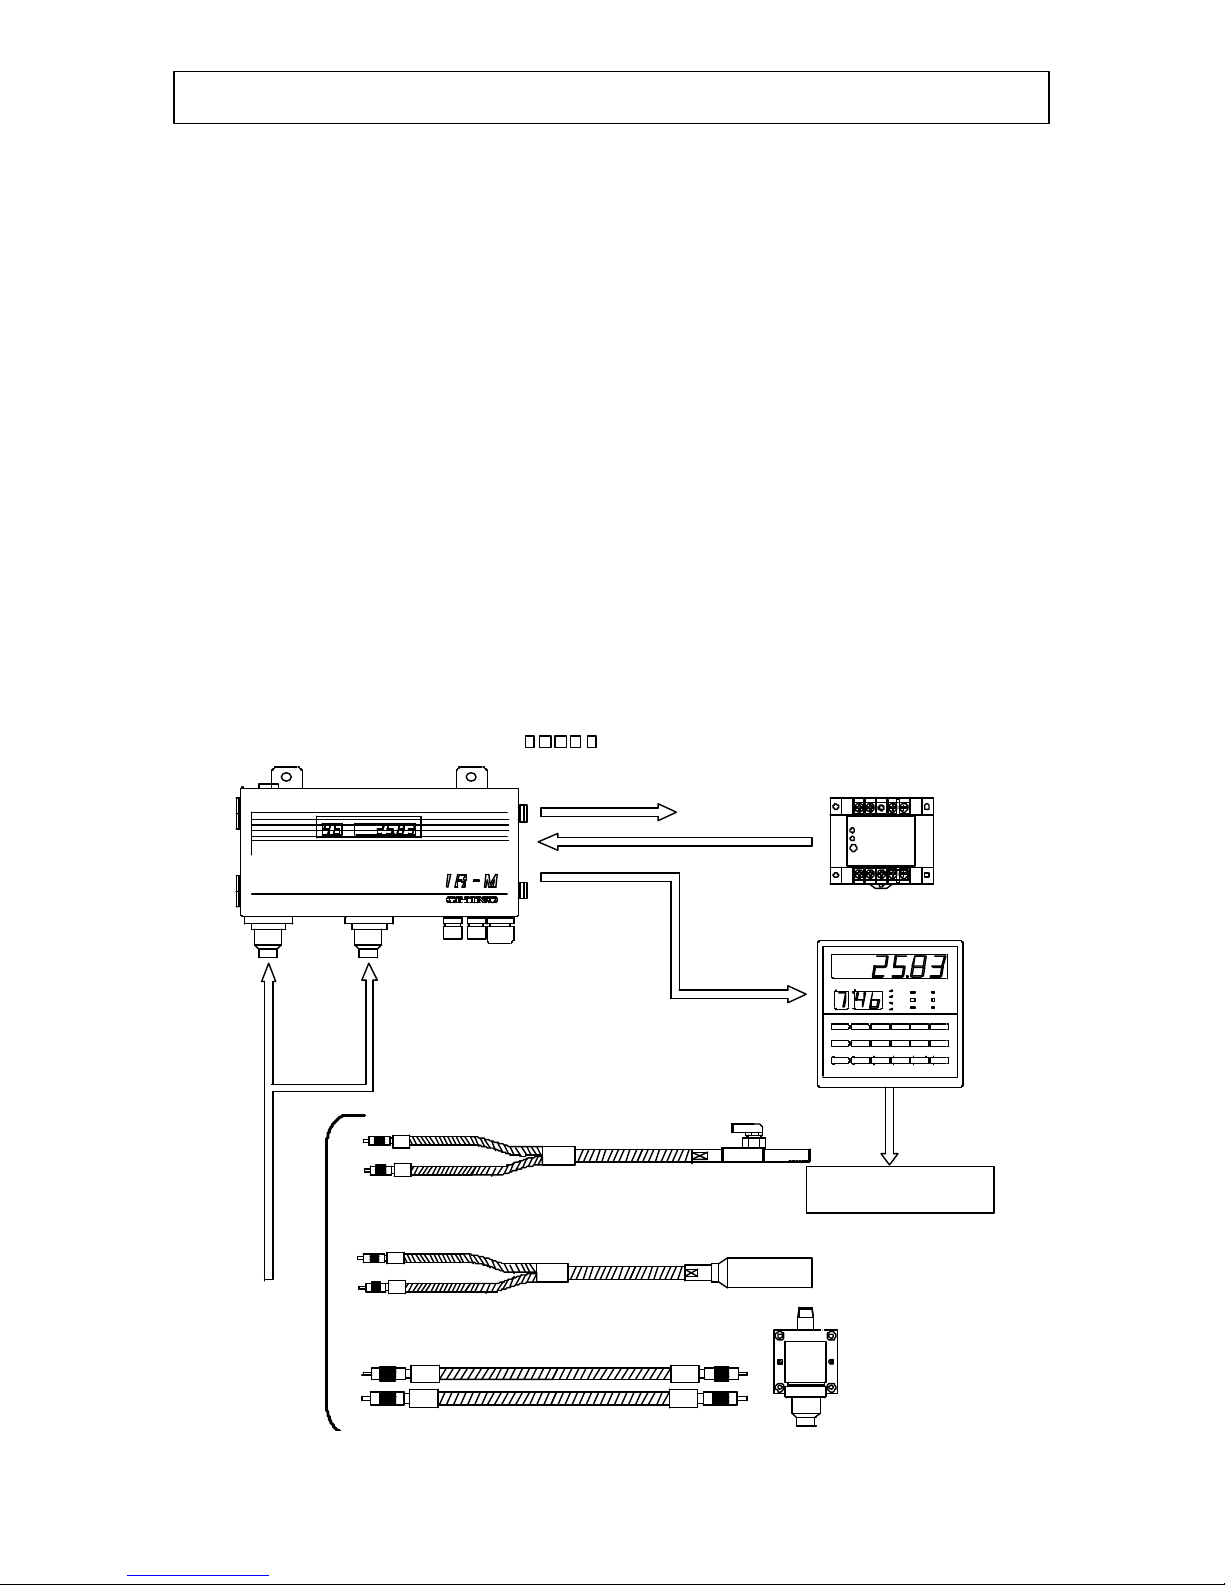
The infrared moisture meter IR-M2 series is designed as a fiber optic moisture meter for
on-line moisture meter utilizing infrared absorption of moisture, and it consists of a detector
unit, a fiber optics, a setting display unit and accessories.
The detector unit is provided with 99 built-in calibration curves to output linear analog
signals according to the moisture.
Since the detector unit provides keys, digital displays and communications function, it can be
used as a single unit or combined with a personal computer.
Two kinds of fiber optics, reflective type and transparent type, are available. The reflective
type fiber optics is for moisture measurement in powder state or in sheet state objects and the
transparent type fiber optics is for moisture measurement in liquids by combining with a
measuring cell for liquids.
Up to 9 detector unit can be connected with the setting display unit which can set various
parameters of the detector unit and displays the moisture value digitally.
Accessories including cables and output checker plate are available for various applications.
This manual describes about the detector unit, the fiber optics (reflective type and transparent
type), the measuring cell for liquids and accessories.
For the setting display unit, refer to a separate instruction manual for it.
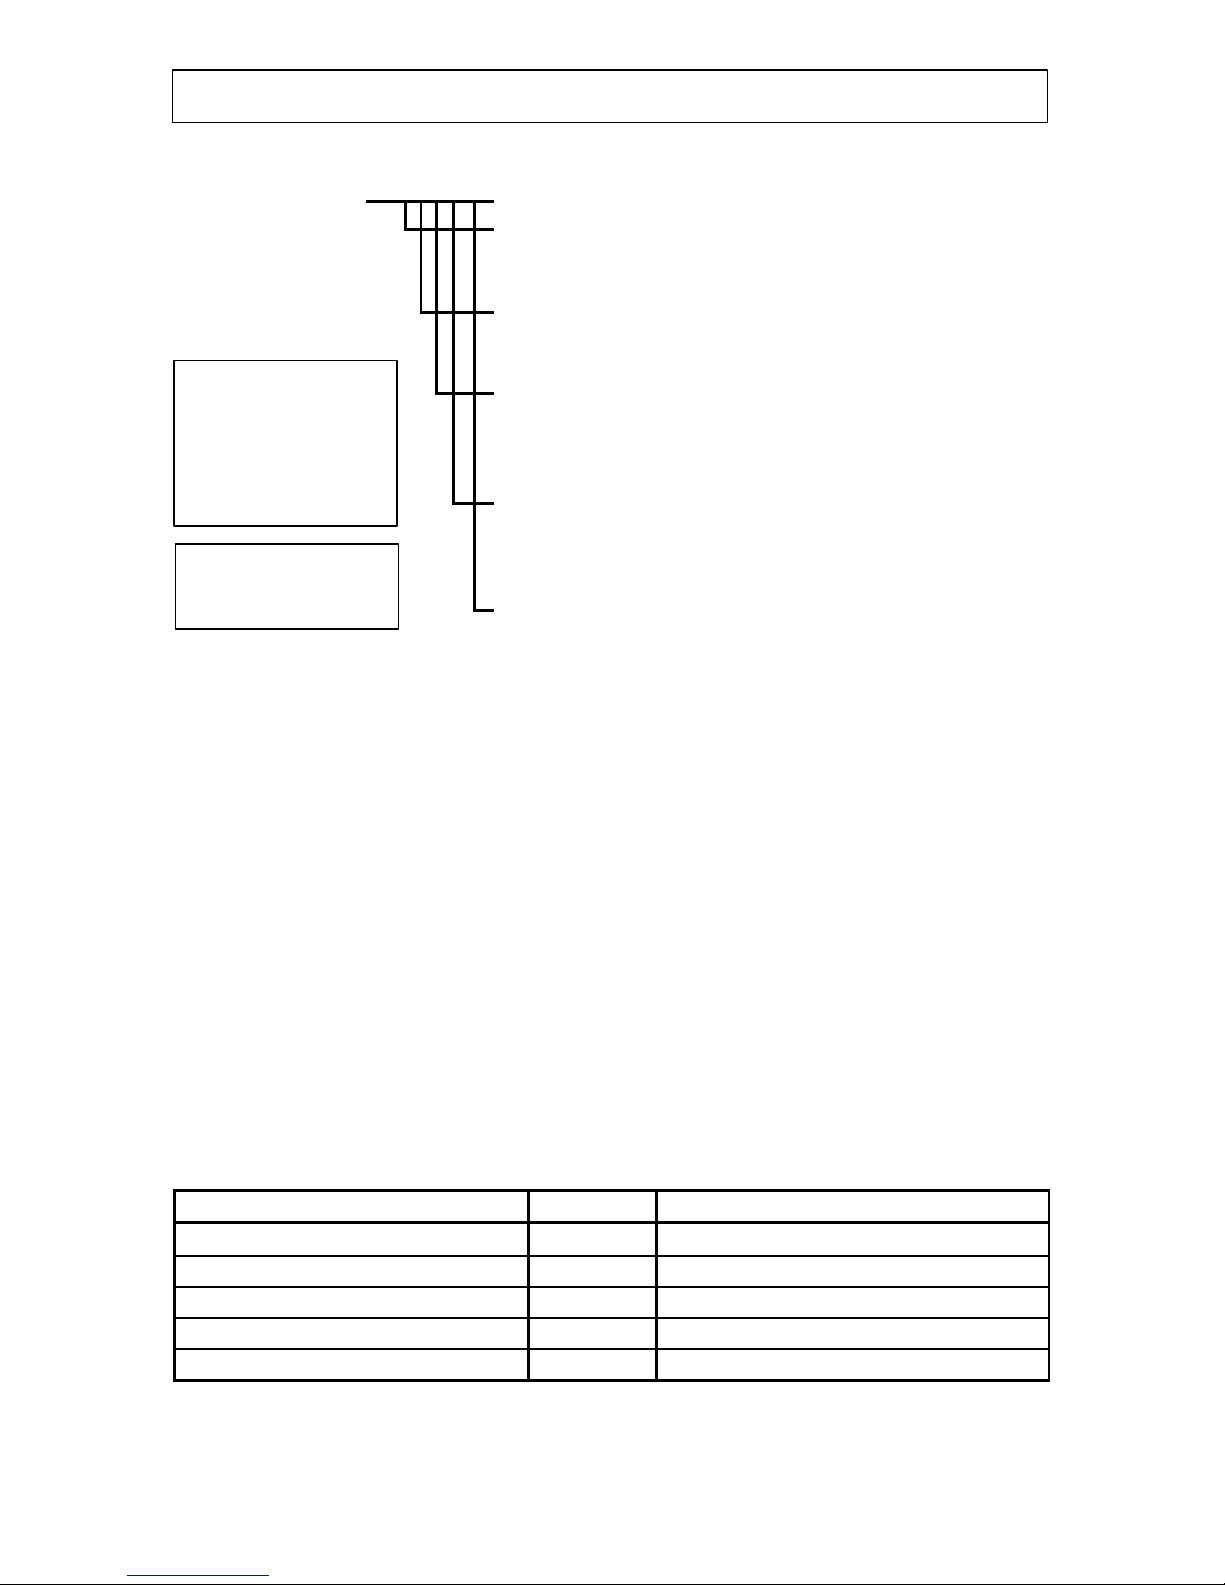
1.2 Configuration
1. General
C H DATA
Transpa rent type fib er op tics
IR-WCT
Reflective type fiber opticswith lens attachment IR-WCRE
Reflective type fiber opticsIR- WCRN
Measuring
cell fo rliquids
IR-WCC1
Detector:Model for IR-M2
Analog output
IR-WERT
(connection
cable)
24V DC
IR-WEP
(power supply unit)
IR- GMEG1
(settin g displayunit)
Optical
fiber
RS- 485
Communication and
Analogoutput
Page 7
INST No. INE -403-0P0
−2−
2.1 Models
2.1.1 Detector unit IR-M2
Measurement object
1 : Universal type
2 : High moisture type
Fiber optics combined
0 : Reflective type
5 : Transparent type
External input/output
0 : Moisture output 4 to 20mA (Standard)
5 : Correction input 4 to 20mA (Option) *1
8 :Correction input Pt100 (Option) *1
Communications interface
S : RS-485 (Standard) *2
R : RS-232C (Option)
A : RS-422A (Option) *1
Special specification
Blank: None
x: Other special specification
2.1.2 Reflective type fiber IR-WCRN
2.1.3 Output checker plate for IR-WCRNB
reflective type fiber optics
2.1.4 Reflective type fiber optics with lens attachment IR-WCRE
2.1.5 Output checker plate for reflective
type fiber optics with lens attachment IR-WCREB
2.1.6 Transparent type fiber optics IR-WCT
2.1.7 Measuring cell for liquids IR-WCC1
2.1.8 Connection cable IR-WERT
2.2 Accessories
Component name Quantity
Remarks
Power supply unit (IR-WEP) 1no. S82K-05024 (Omron)
Fuse 2 nos. SMP20 (Daito)
Instruction manual 1 copy This document
Communications instruction manual 1 copy Attached to IR-M2R/A only
Inspection certificate 1 copy
2. Models and accessories
*1:
Combination of “5”
or “8” of
optional
external I/O and
communications
interface “A” is not
possible.
*2:Specify “S” for
combination with the
setting display unit.
Page 8
INST No. INE -403-0P0
−3−
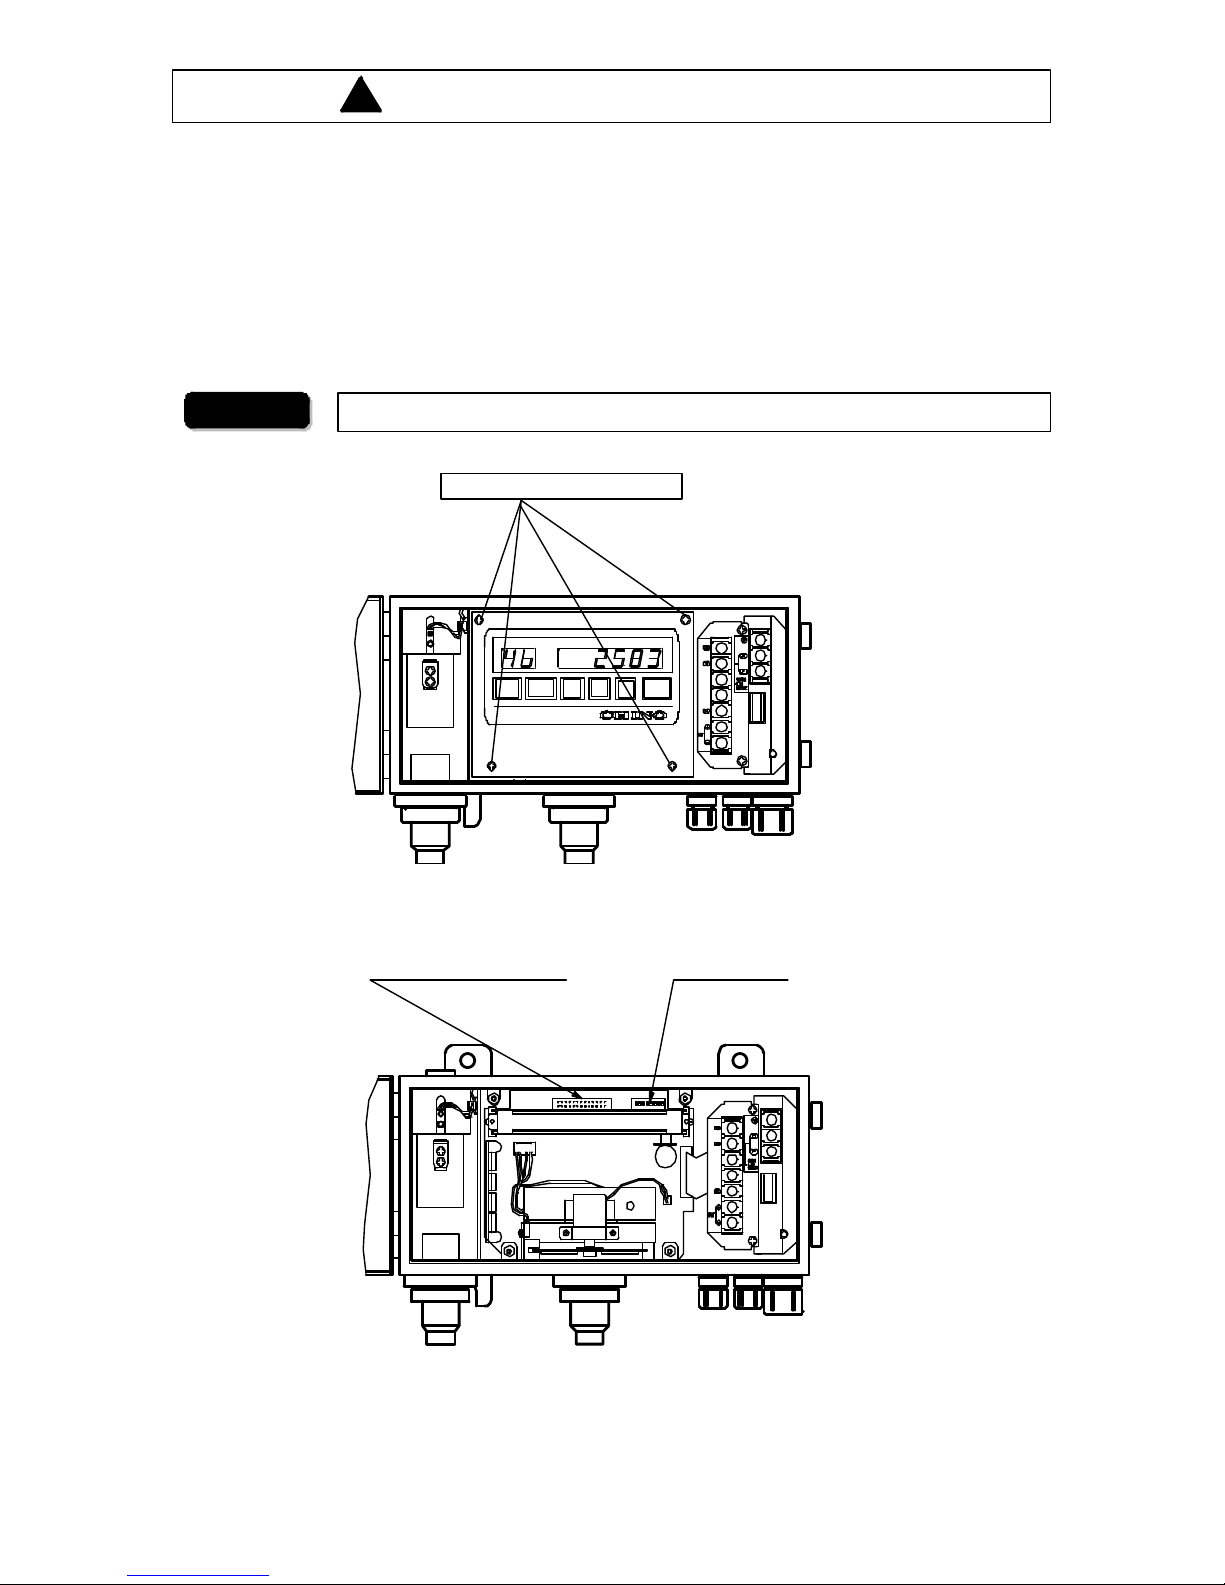
3.1 Setting of dipswitch es
Set the internal dipswitches before installation of the detector unit.
1) Open a door, remove 4 screws for fixing a setting display part and then remove the setting
display part.
2) The setting display part is connected to the interior through cables. Lift the setting display
part with due care so as not to damage the cable and disconnect the connector for the
setting display part at the position shown in the figure.
3) Set the dipswitches according to the working conditions.
3. Setting
Turn off the power supply before removing the setting display part. War ning
Loosen the se fou rscrews
CH
DATA
△
△▽
SEL
ENT
CH/
□
DIP switch 1
Connector fordisplay
!
Page 9
INST No. INE -403-0P0
−4−
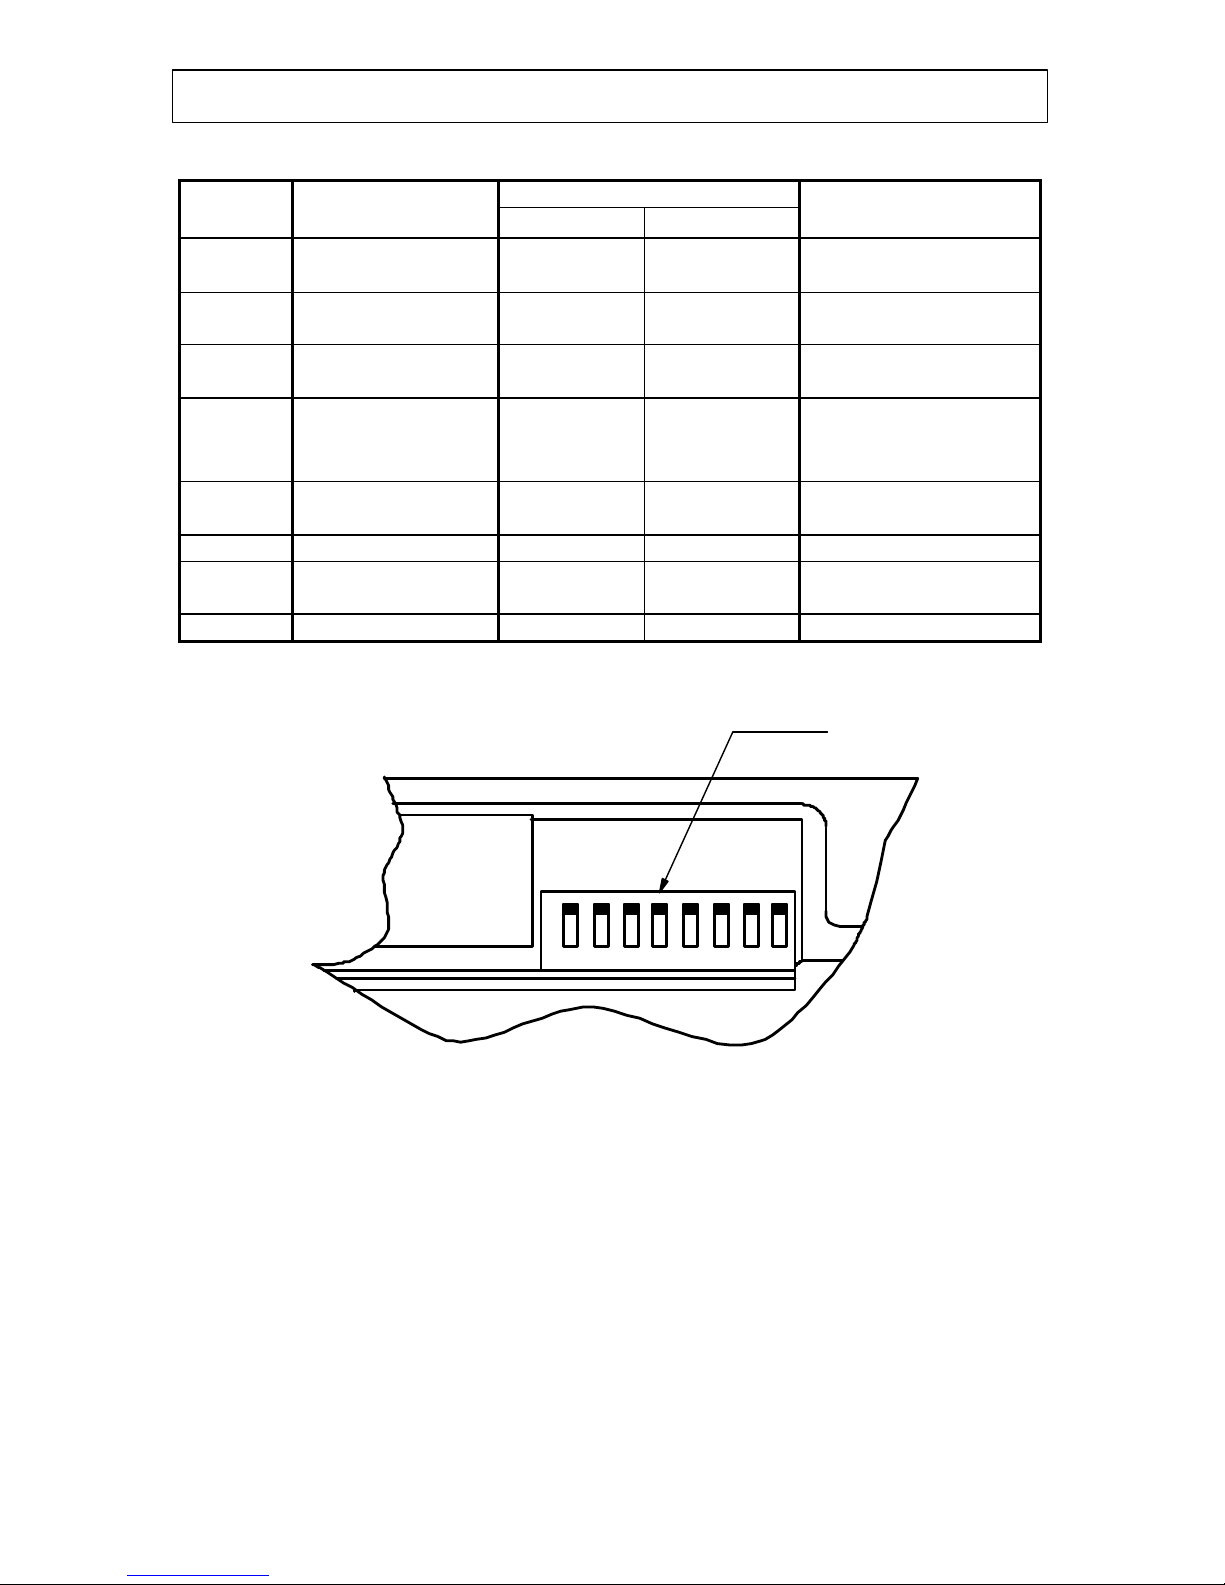
3.1 Setting of dipswitch es
SW Dipswitch
No
Function
OFF ON
Defaults
1 Measurement/
Calibration mode
Measurement
mode
Calibration
mode
OFF (Don’t change.)
2 Mathematical
operation format
Logarithm
operation
Ratio operation ON (Don’t change.)
3 No.2 calibration
enable/disable
Disable Enable OFF
4 Connection
destination
Setting display
unit
PC
OFF : IR-M2 S
ON : IR-M2R
IR-M2A
5 Key/display
enable/disable
Enable Disable OFF
6 Not used OFF
7
Correction input
enable/disable
Disable Enable OFF
8 Correction input 4 to 20mADC Pt100 OFF
3. Setting
1 2 3 4 5 6 7 8
O
N
DIP switch 1
Page 10
INST No. INE -403-0P0
−5−
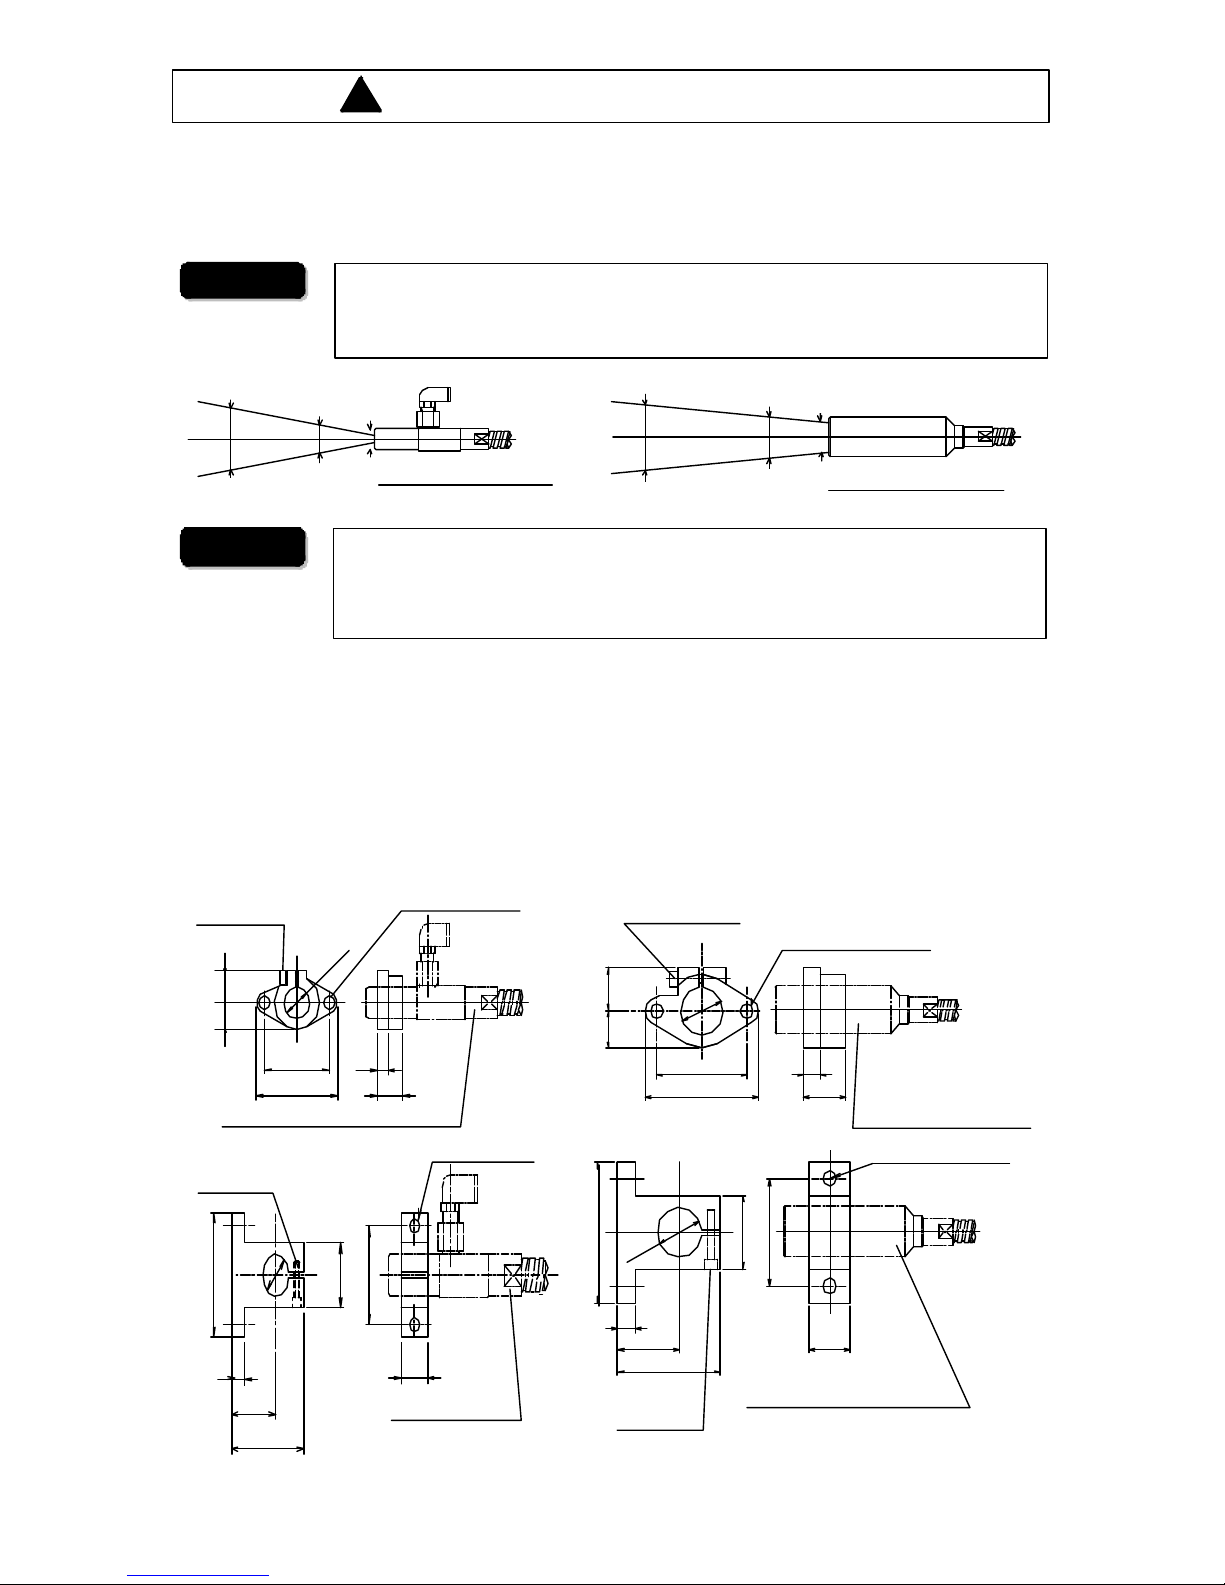
3.2 Installation of reflective type fiber optics
There are two types of reflective type fiber optics. One is “Without lens (IR-WCRN)” and
the other is “With lens (IR-WCRE)”.
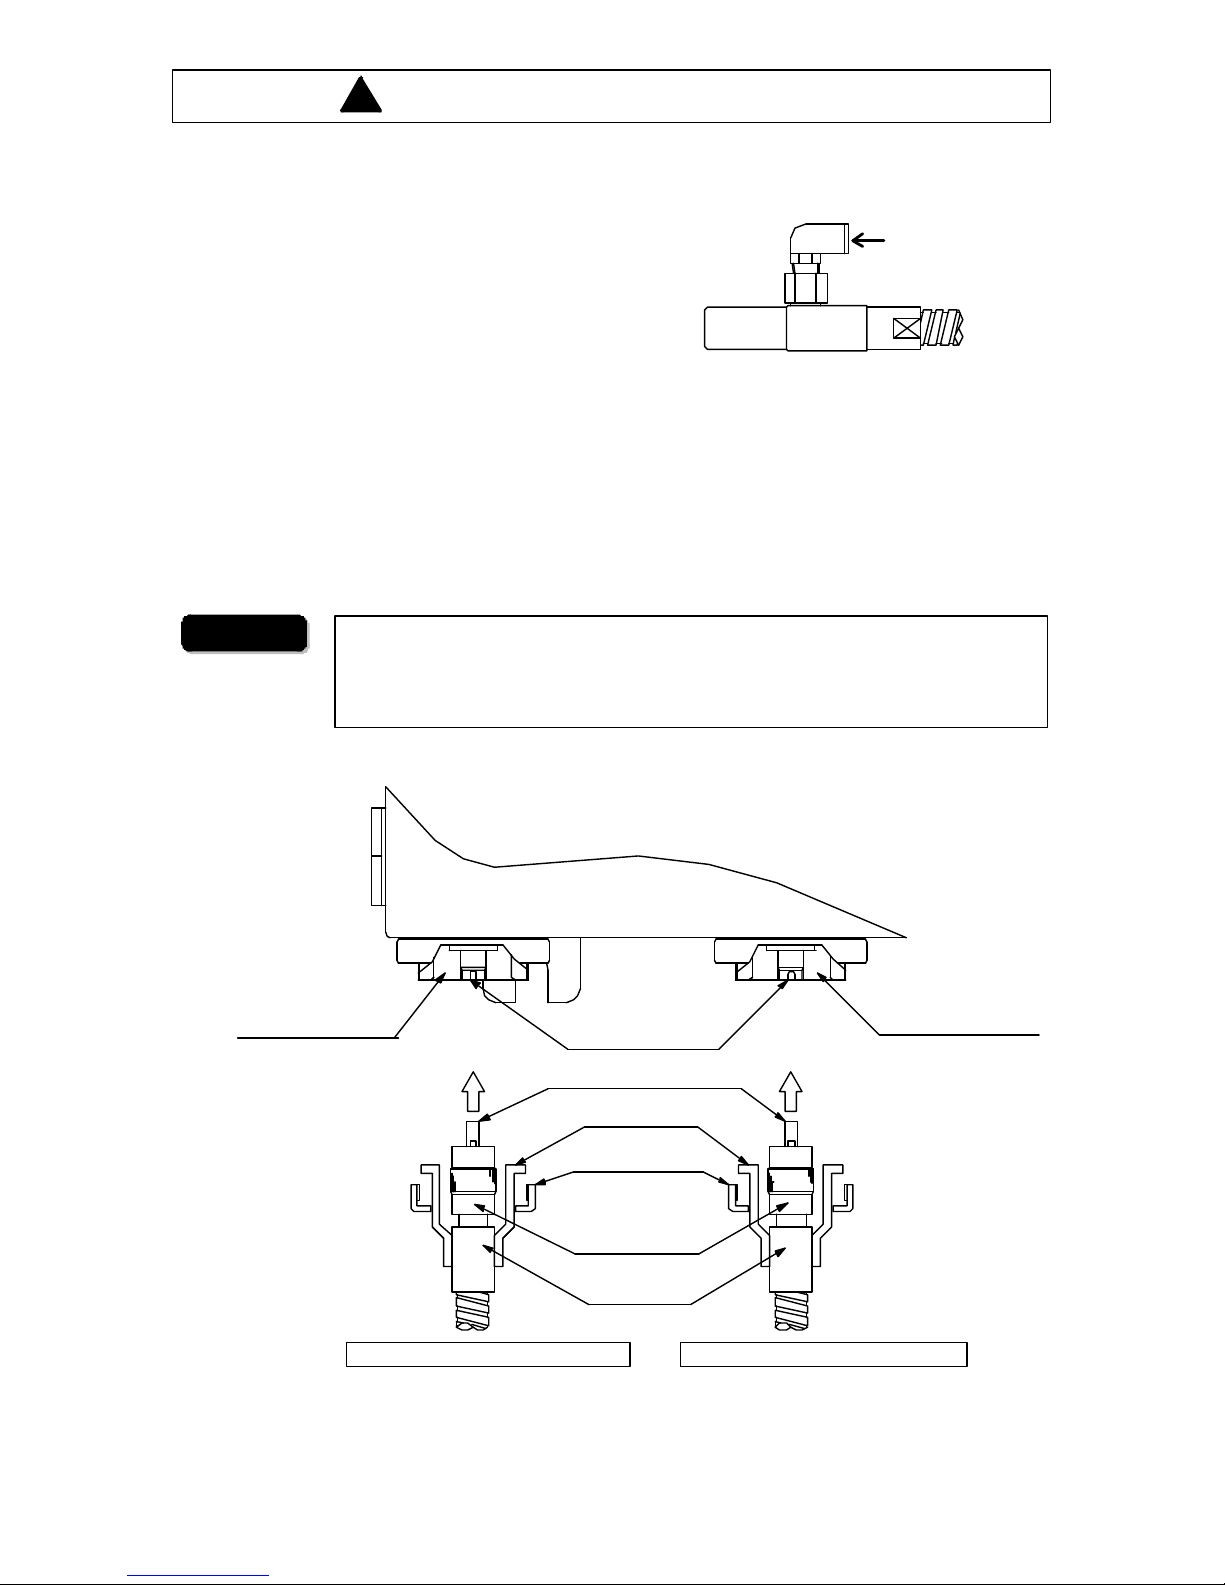
3.2.1 Installation of tip part
Set an attached holder to the installation place first. Insert the tip of fiber optics into the hole
of the holder and fix it by tightening the tip fixing screw. Two types of holder, horizontal
mounting type and flange type are attached.
The tip of reflection
type fiberoptics with
lens attachment
The tip of reflection type
fiber opticswith lens attachment
23 27
84
64
(
Ø
3
0
)
(
Ø
3
0
)
64
80
12
30
42
12
70
28
2-Ø9Mountinghole
2-Ø9Mounting hole
Tipfixing screw
Tipfixing
screw
Place the tip of fiber optics with t
he following measurement distance from
an object. ・Reflective type fiber optics 15 to 50mm
・Reflective type fiber optics with lens 25 to 100mm
War ning
Fix the fiber optics with appropriate metal tools at several places
for
avoiding affect with vibrations, etc. Make sure not to bend the fiber
optics
below its minimum bending radius (100R).
Warning
[ Model for IR-WCRN ]
15mm
Ø
50
Ø
20
Ø
6
[ Model for IR-WCRE ]
100m
25mm
Ø
40
Ø
25
Ø
20
Tipfixing screw
17
14
40
50 16
7
The tip of reflectiontype fiberoptic s
(
Ø
1
6
)
2-Ø6.6Mountingho le
(
Ø
1
6
)
2-
Ø5.5
Mountinghole
The tipof reflection
typefiber optics
44
8
27
16
48
38
25
Tipfixingsc rew
1)Reflection-typefiber
2)Reflectiontypefiberoptics
withlensattachment
3. Setting
!
Page 11
INST No. INE -403-0P0
−6−
Purgeair
inlet
Purge air flow:50 to 200Nl/min
Purge air pressure:Lower than200kPa
3.2.2 Air purge (Only IR -WCRN)
When air purging is required, supply dry air not
containing oil, dust, etc. from a purge air inlet.
Connect a nylon tube of φ6mm in outer diameter and
φ4mm in inner diameter to the purge air inlet.
(When the reflection type fiber optics is used in
ambient temperature more than 60°C, remove the
purge air inlet and pipe to the screw hole of RC1/8
directly .
Purge air flow: 5 to 20NI/min
Purge air pressure: Less than 200kPa (2kgf/cm2)
3.2.3 Connection s with detector unit
Connect the side being separated into two parts of light projecting side and light receiving
side with the fiber optics connectors of the detector unit.
The fiber optics has “Light project ing
side (D)”and “Light receiving side
(E)”and each one has a carved mark. Connect the fiber optics through the
rubber bush as shown in the following figure.
War ning
3. Setting
!
Connector forfiber
[Light projecting side]
Connector forfiber
[Light receivingside]
Dent department
Protrusiondepartment
D E
Rubberbush
Bushfittingring
Connector ring
Optical fiber
D:Connect tolight projectingside E:Connectto light receivingside
Page 12
INST No. INE -403-0P0
−7−
3.2.4 Optical path
Select a place where water drops, dust particles, smoke, water steam, etc. will not enter
between the tip of fiber optics and an object. If these substances cannot be prevented and
their influences are negligible, purge them with air, or other remedial measure is necessary.
If direct current (DC) light like the natural light, which does not change its intensity
momentarily , comes to an object, it does not cause any disturbance in measurement, but
alternate current (AC) light like as electric bulb, flame, etc., causes disturbance. Further,
strong light such as direct sunlight also causes disturbance. In such cases, it is necessary to
shade the disturbing light to prevent it from direct shining on an object.
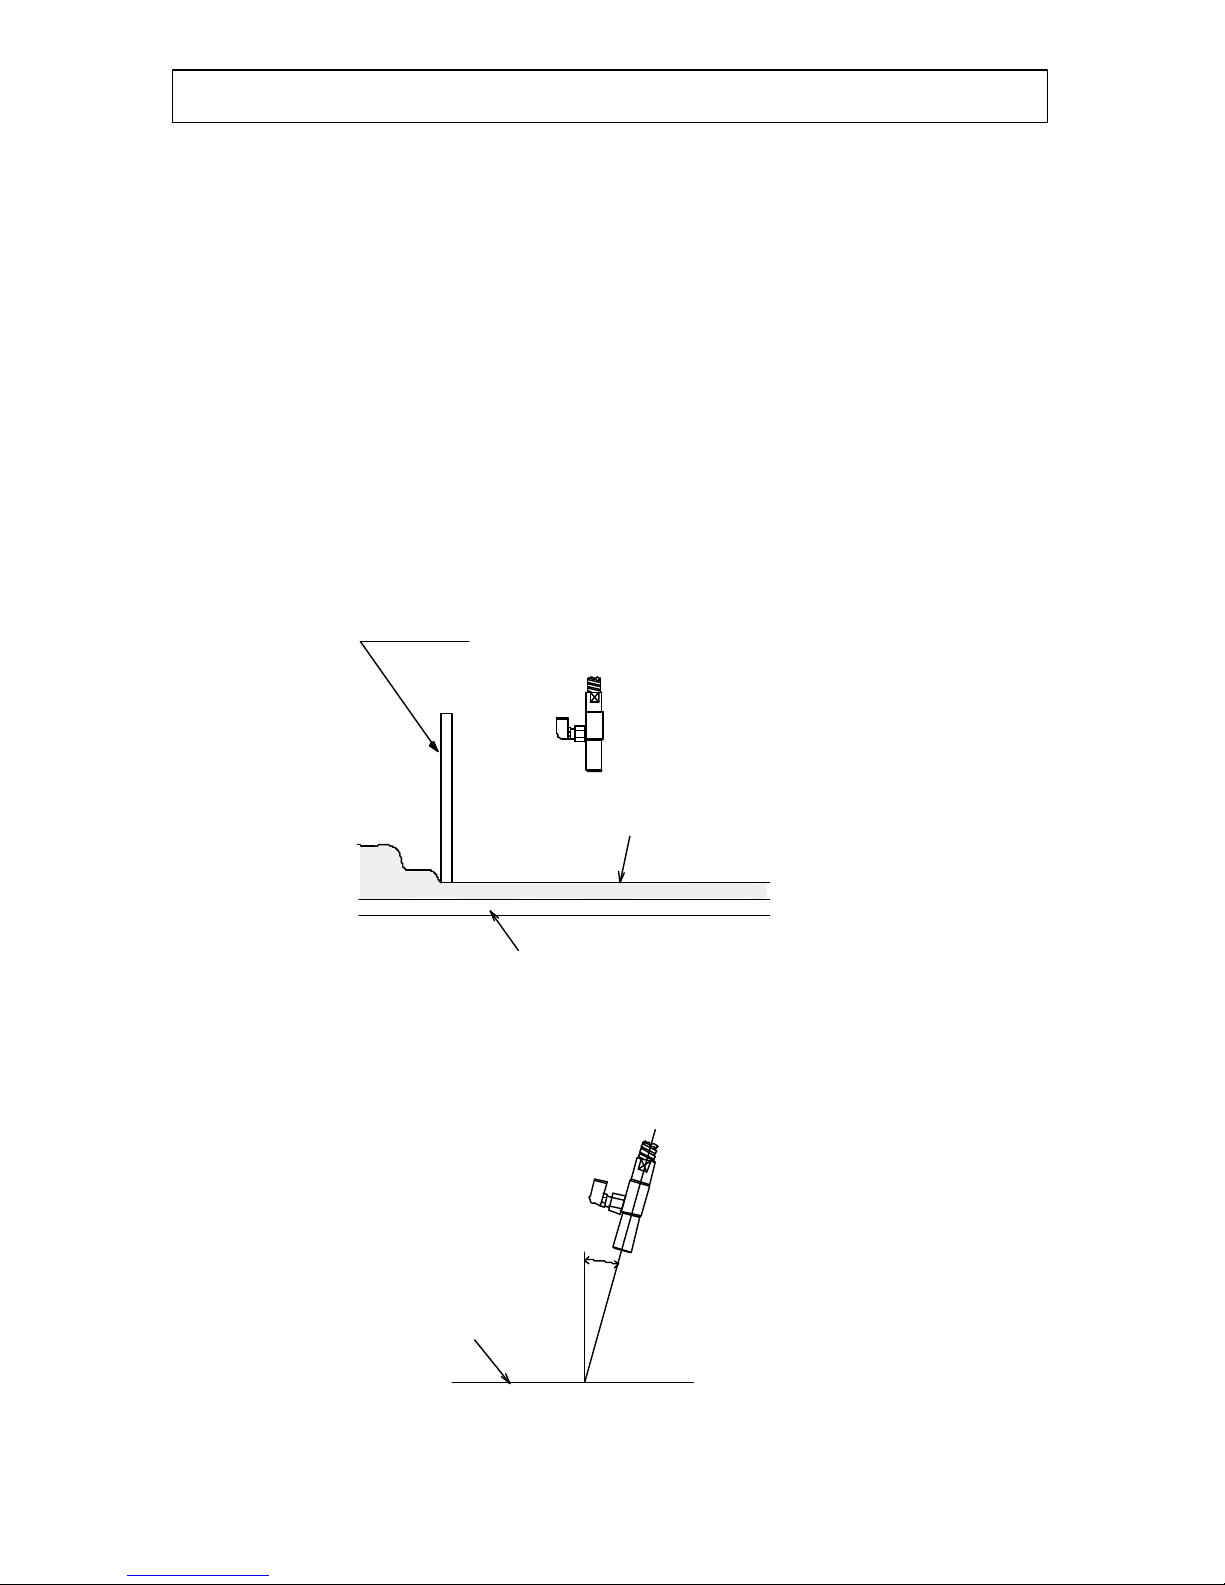
3.2.5 Measuring place (for objects of pulverized or granular substance)
For installation of the tip of fiber optics on on-line, select a place where the moisture
difference is small between the surface and the inside of an object, like as at a hopper outlet
or just behind the conveyor belt transfer place. If such a place cannot be selected, face the
inside to the surface by using a baffle plate during measurement as shown in the figure.
3.2.6 For the objects in sheet state such as paper, etc.
Tilt the tip of fiber optics by 15° from the vertical face as shown in the figure.
3. Setting
Baffle plate
Measuringobject
Belt conveyor
Paperor
othersheets
15°
Page 13
INST No. INE -403-0P0
−8−
3. Installation of transparent type fiber optics
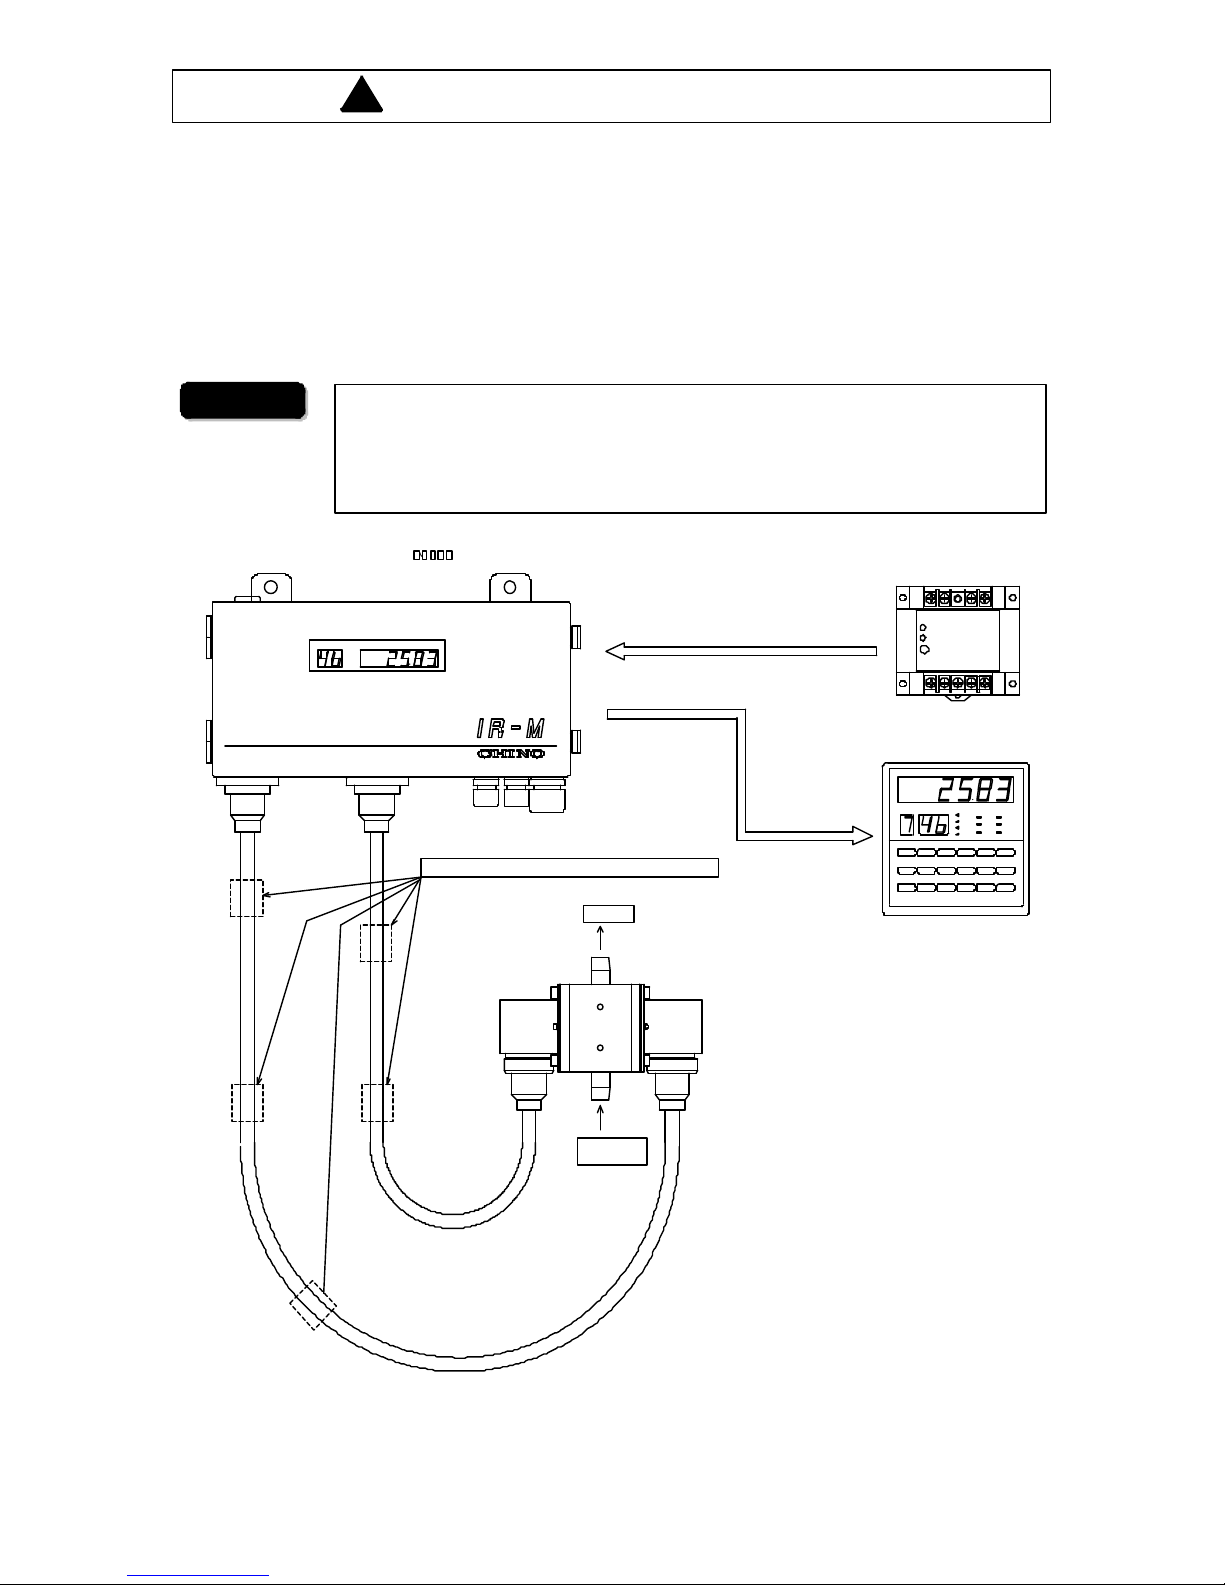
3.3.1 Installation of cell for liquids
Install a measuring cell to flow a sample liquid from down to up. Connect with the fiber optics
between the detector unit and the measuring cell. Make sure to connect the light projecting side
and the light receiving side of the fiber optics to the correct sides of the detector unit and the
measuring cell.
Fix the fiber optics with appropriate metal tools at several places for
avoiding affect with vibrations, etc.
Make sure not to bend the fiber optics below its minimum bending
radius
(250R).
War ning
C H D ATA
Detector:Mode l for IR-M2
Power supply unit:
Model for IR-WEP
Setting display unit:
Model for IR- GMEG1
Measuring cell
Output
Input of
sample liquid
Light receiving side fiber optics
Light projecting side fiber optics
Fixthe fiberoptics with appropriatemetaltools atseveral places.
3. Setting
!
Page 14
INST No. INE -403-0P0
−9−
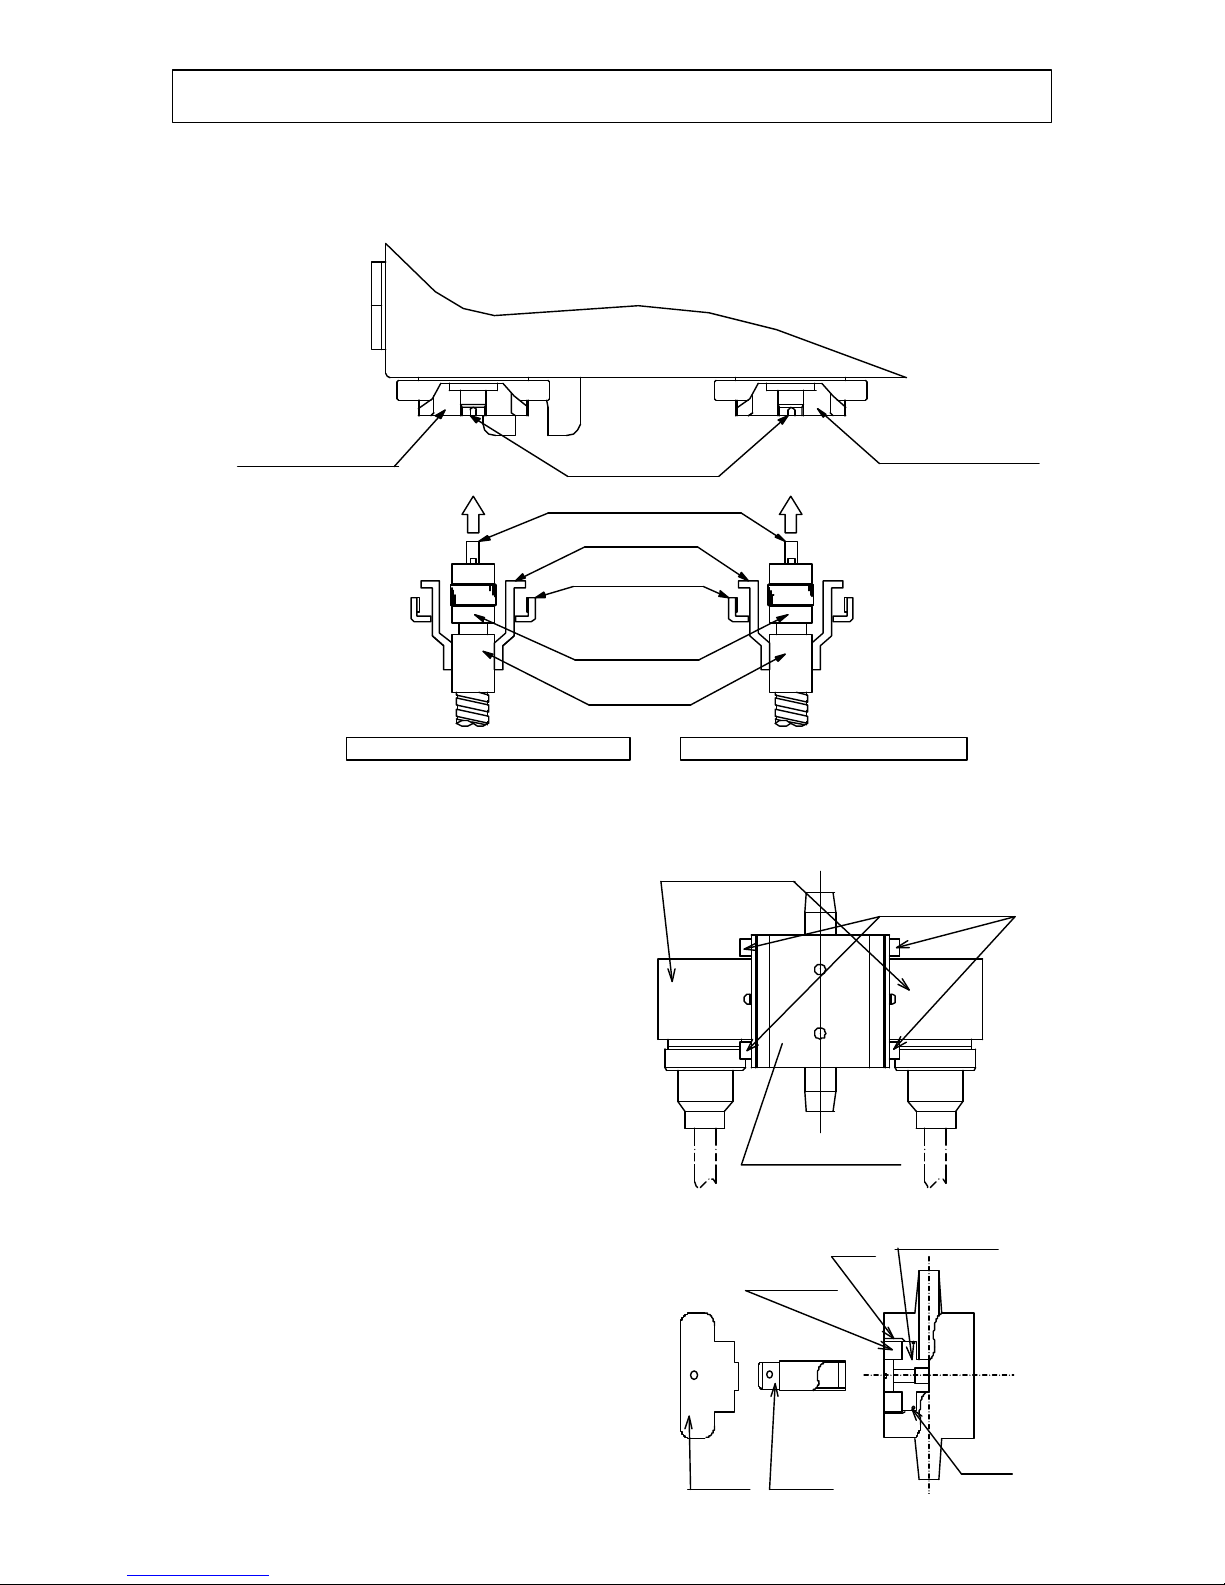
3.3.2 Connection with detector unit
Connect the fiber optics, as shown in the following figure, through the rubber bush attached
to the detector unit .
3.3.3 Disassemble cleaning
For accurate measurements, recommend periodical cleaning of the cover glass in a liquid
contacting part of the measur ing cell.
1) Remove the fiber optics (both of light
projecting side and light receiving side),
from the measuring cell.
2) Next, remove 4 screws fixing a connecting
part and remove the connecting part from
the liquid-contacting part.
3) Remove a fitting ring by using the tool A.
Then after screwing the tool B into the
cover glass, pull out the cover glass from
the liquid-contacting part.
4) Wipe off dirt on the glass surface with a
gauze, etc.
5) Confirm that an O ring is inserted in
liquid-contacting part and push in the
cover glass to the liquid-contacting part.
6) Match the positions of E and D characters
of the connecting part and the liquid
contacting part, and fix the connecting
part.
7) After the cleaning of the cover glass, make
sure to re-calibrate your moisture meter.
3. Setting
OUT
I N
Connectingpart
4- Fixingscew
Liquidcontacting
part
Tool A
ToolB
Fittingring
Curler
Cover glass
Oring
Connector for fiber
[Lightprojectingside ]
Connector for fiber
[Lightreceiving side]
Dent department
Protrusion department
D
E
Rubberbush
Bushfittingring
Connector ring
Optical fiber
D:Connect to light projectingside E:Connectto light receivingside
Page 15
INST No. INE -403-0P0
−10−
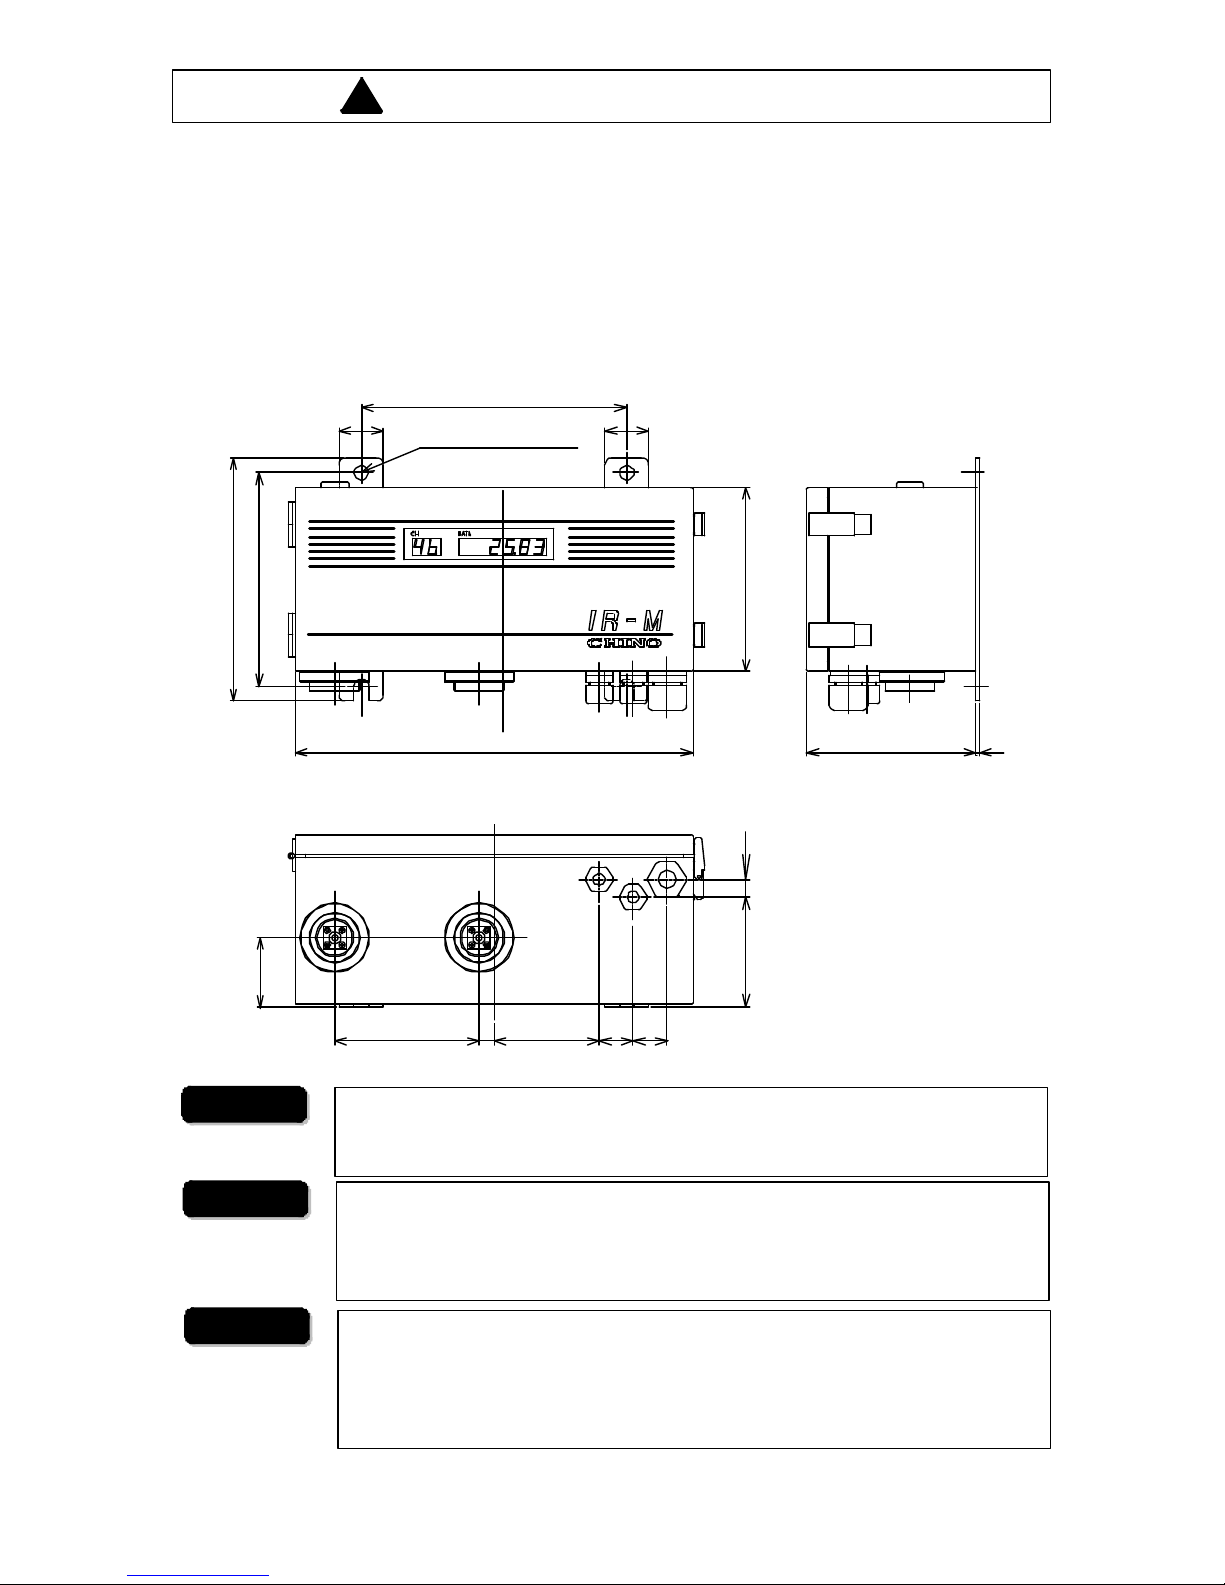
3.4 Installation of detector unit
The detector unit is a wall-mounting type with 4 mounting holes. Fix the detector unit to wall
surface, etc. with 4 pieces of M8 screw. The outside and mounting dimensions are shown in
the figure.
3.4.1 Outside and mounting dimensions of detector unit
115
2
270
180
3 03 0
98
10
12
2323
74.5
47
47
165
145
125
4-M8Mountin g hole
Vibrations and impacts
Use the detector unit in a place where is free of any noticeable
vibrations
or impacts.
War ning
Induction
The detector unit is designed for anti-induction. However separate
the
detector unit from induction heating oscillators or power
lines as far as
possible.
War ning
Ambient temperature and humidity
The ideal ambient temperature of the detector unit is 10 to 30°C
and the
ambient humidity as low as possible is recommended. In high
humidity
environment,
you may have error in measurement due to condensation of
steam by change in temperature.
War ning
3. Setting
!
Page 16

INST No. INE -403-0P0
−11−
4.1 Connections
The terminal board is accessible by opening the door of the detector unit. Lead in cables
through a small sized cable inlet at the lower part and connect them to terminals. Lead in the
exclusive cable IR-WERT through the large cable inlet.
4.2 Layout of connection cable
For connection of cables, be careful of the following points.
4. Connections
For preventing electric shock,
make sure to turn the power supply off
before wiring.
Warning
Caution
Use a cable conforming to the applicable outer diameter (φ4.5 to 6.5
mm)
of the small cable inlet; otherwise waterproofing of the
detector unit may
deteriorate. Tighten the nut at the cable inlet securely after connections.
・Separate the cables from induction heating oscillator and power lines.
・Keep the cables free of deposit of water, oil, etc.
・Don’t bend the cables extremely or apply any excessive force to them .
・
For permanent layout, protect the cables with conduits, etc.
SA
(Black)
SB
(White)
SG
(Brown)
G*1
(Green)
P+
(Red)
P(Blue)
P(Blue)
P+
(Red)G(Green)
V+ V-
LN
24V DC
Ground
Power supply
(IR-WEP)
100-120V AC
200-240V AC
Terminal
board
Cable inlet (small):
Outer diameter of
applicable cableØ4.5toØ6.5
Cable inlet (large):
[For IR-WERT]
Outer diameter of
applicable cableØ8.5 to
Ø10
.5
Connection cable
(IR-WERT)
Communication output
forIR-GMEG1, pe rsonal
computerand PLC.
Communication output RS-485
(Optional:RS-232C,RS-42 2A)
*1:
Don't connect this cable usually,
but connect it, if the unitis interfared
withnoises.
SA
SB
SG
OUT
Measuredvalue output :
4 to 20mADC
Loadresistance:Lower than 500
Ω
(Optional:RS- 232C, RS-422A)
P+
P-
24VDC
1.5A
SUPPLY
!
Page 17

INST No. INE -403-0P0
−12−
4.3 Multi-detector connections
By using the setting display unit, you can connect the detector unit up to 9 sets.
Two wiring methods are available. One is wiring through a relay box (IR-WEE) and the other
is without the relay box (IR-WEE).
4.3.1 Connections through relay box
4. Connection
Caution
For
both wiring methods, before connecting with the setting display unit or
before turning on the power supply of the setting display unit,
number
setting to the detector units is required. For the number setting, be careful
not to overlap any detector unit number of each detector unit.
Refer to [6.2 Setting of detector unit number ] for the details.
Caution
1. Shorten the length of exclusive cable (IR-WERT * mark) as much as
possible.
2. For wiring to the relay box, refer to “Instruction manual of relay box”.
Detecto r
IR-WERT*
IR-WERT*
IR-WERT*
Relayin g box
(Power supply unit is built in)
Relayin g box(Power supplyunit isbuilt in)
Relayin g box(Power supplyunit isbuilt in)
2-conductor twisted
cable(withshield)
2-conductor twisted
cable(withshield)
2-conductor twisted
cable(withshield)
100-240 V AC
Detecto r
Detecto r
Setting diplayunit
Page 18

INST No. INE -403-0P0
−13−
4.3.2 Connections without relay box
4. Connection
Detector
Detecto r
Detecto r
IR-WERT*
IR-WERT*
IR-WERT*
Setting diplay unit
100-240 V AC
2-conductor twisted
cable(withshield)
2-conductor twisted
cable(withshield)
2-conductor twisted
cable(withshield)
Taping
Taping
Taping
Connect theP+(Red), P-(Blue),
and G(external shield wire) of
IR-WERT to power supply.
And connect the SA (Black),
SB(White)and SG(internal shield
brown) of signal wire to the
2-conductor twistcable(with shield)
Fasten the signal wires in
IR-WERT (SA, SB andSG)
and thesignal wirein 2-conductor
twist cable(SA,SB and SG)together
at the terminal board of the detector.
Page 19

INST No. INE -403-0P0
−14−
5.1 Names and functions of detector unit
(1) Hole for installation of detector unit: Four M8 holes for installation of the detector unit
to wall surface, etc.
(2) Data display window: Displays calibration curve number and measured value.
(3) Door: By opening the door, key switches and the terminal board are accessible.
(4) Cable inlet (small): Cable inlet for connection cable. Outside diameter of connection
cable applicable to this inlet: φ4.5 to 6.5mm.
(5) Cable inlet (large) Cable inlet for exclusive cable IR-WERT. Outside diameter: φ10mm.
(6) Serial No plate: Serial No plate of this detector.
(7) Connector on light projecting side : Connector for the light projecting side of the fiber
optics. Rubber bush is prepared for the connection.
(8) Connector on light receiving side : Connector for the light receiving side of the fiber
optics. Rubber bush is prepared for the connection.
(9) Setting display: Display part of this detector.
(10) Measurement part : Optical assembly, detector element and electric circuits are built-in.
(11) Lamp housing : Lamp is located inside.
(12) Power supply part: Terminal board for wiring, power fuse, power supply unit and
output board are built in.
(13) Power fuse: A power fuse is mounted to the fuse holder.
Power fuse: Insertion type, 2A, time lag fusion type
(14) Terminal board: For wiring of connection cable. Terminus screw size: M4.
5. Names and functions of component parts
DATACH
SEL CH/・ ENT
DATACH
(1) Detector mounting
screw hole- 2
(2) Data display
window
(3) Door
(5) Connection cableinlet (small)
(6) Connection cableinlet (large)
(6) Manufacturing
nameplate
(8) Connector on lightreceiving side
(7) Connector on lightprojecting side
(11) Lamp (9) Setting display
part
(14) Terminal board
(10) Measuring part
(12) Power supply part
(13) Power
supply
fuse
For preventing electric shock,
make sure to turn the power supply off
before wiring.
War ning
!
Page 20

INST No. INE -403-0P0
−15−
5.2 Names and functions of setting display part
(1) CH display: Displays a calibration curve number in measurement mode and a parameter
item in setting mode.
(2) Data display Displays a measured value in the measurement mode and a parameter in
the setting mode.
(3) Setting keys
SEL : For entering into the setting mode and switching a setting screen.
CH/・ : For setting a calibration curve number in the measurement mode and for
entering a decimal point in the setting mode. When the key is pressed again,
the decimal point disappears.
: For entering into a parameter setting in the setting mode and changing the digit
of the parameter.
: For changing the parameter in the setting mode.
: For changing the parameter in the setting mode.
ENT : For storing the parameter in the setting mode.
5. Names and functions of component parts
CH/・
SEL
ENT
CH
DATA
Setti ng display part
(1) CH Display
(2) DataDisplay
(3) Setting
keys
Page 21

INST No INE -403-0P0
−16−
6.1 Confirmation before operation
Check the following two points before turning on the power supply.
1) Have the dipswitches been set? (Refer to [3.1 Setting of dipswitches])
2) Is wiring correct? (Refer to [4.1 Wiring]).
6.2 Setting of detector unit number
Detector unit number s are for identifying each detector unit when multiple detector units are
connected to the setting display unit. (Refer to [4.3 Multi-detector connection]). Set a
detector unit number before connecting the setting display unit.
1) Enter into the operation condition setting mode by
pressing SEL key and ENT key simultaneously to
set CH display “t” for 2 seconds.
2) Press SEL key 4 times to set CH display to “Hn”.
3) By pressing key, the numeric blinks for entering a
detector unit number.
4) Change the numeric by key or key.
When key is pressed, the num eric is increased.
When key is pressed, the num eric is decreased.
When key is pressed, the blinking digit shifts.
5) When ENT key is pressed, the numeric stops
blinking and the detector number is stored.
6) Return to the measurement mode by pressing SEL
key for 2 seconds.
6.3 Setting of calibration curve data
The output characteristic of infrared moisture meter depends upon measuring objects. It may
also change according to the process conditions and sample moisture measuring conditions.
Therefore, it is necessary for accurate moisture measurements to perform a sample test of the
object and obtain the correlation (This is called as calibration curve.) between the moisture value
(%H2O) obtained by a drying method or other measuring methods and the absorbance “x”
measured by the moisture meter.
This paragraph describes the setting method for calibration curve data, assuming that calibr ation
curves have been already created.
When the calibration curves have not been created yet, refer to [7. Creation of calibration
curves].
Refere nce
The default number of the detector unit is “1”.
For using it with a number other than 1, set the detector unit number
by
following order.
CH
DATA
t 0.0
CH
DATA
Hn
1
Detector No
6. Operation
Page 22

INST No INE -403-0P0
−17−
6.3.1 Setting data
The followings are the setting data of calibration curve.
Data name Disp
lay
Setting
range
Defaul
t value
Remarks
(1) Calibration curve No. CH 1 to 99 1
(2) Polynomial coefficient a0 A0 0 to ±99999 0.0000 Effective numeric: 5 digits
(2) Polynomial coefficient a1 A1 0 to ±99999 0.0000 Effective numeric: 5 digits
(2) Polynomial coefficient a2 A2 0 to ±99999 0.0000 Effective numeric: 5 digits
(2) Polynomial coefficient a3 A3 0 to ±99999 0.0000 Effective numeric: 5 digits
(3) Correction expression coefficient b0 B0 0 to ±9999.9 0.0000 Effective numeric: 5 digits
(3) Correction expr ession coefficient b1 B1 0 to ±9999.9 1.0000 Effective numeric: 5 digits
(4) Output low limit moisture Hi 0 to 9999.9 0.00
Decimal digit depends on
specification.
(4) Output high limit moisture Hi 0 to 9999.9 100.00
Decimal digit depends on
specification.
(5) Low limit alarm moisture AL 0 to 9999.9 0.00
Decimal digit depends on
specification.
(5) High limit alarm moisture AH 0 to 9999.9 100.00
Decimal digit depends on
specification.
(6) Preset moisture PS 0 to 9999.9 0.00 Decimal digit depends on
specification.
(1) Calibration curve number
An optional number from 1 to 99 can be designated as the calibration curve. It is
designated sequentially from “1” usually.
(2) Polynomial coefficient “a0 to a3”
Assume that the calibration curve is represented by third-degree or lower-degree
polynomial as shown below.
y = a3x3 + a2x2 + a1x + a0
where, “y” is the moisture value (%H2O) and “x” is the absorbance (“CH0” data of this
moisture meter).
(3) Correction expression coefficient “b0 to b1”
These coefficients are provided for primary expression correction (zero and span
correction) with reference to moisture value “y”. Assuming that the moisture value after
correction be “Y”, we obtain,
y = b1y + bo
(4) Output low limit moisture, output high limit moisture
These moisture values are specified as the output low limit and output high limit on the
analog output scaling. These values are scaled to be 4mA at the output low limit moisture
and 20mA at the output high limit moisture.
(5) Low limit alarm moisture, high limit alarm moisture
The low limit alarm activates when a measured value is lower than the low limit alarm
moisture, while the high limit alarm activates when a measured value is higher than the
high limit alarm moisture. Since the detector unit does not provide any alarm output
function, the setting display unit is required when an alarm output is necessary.
(6) Preset moisture
By turning on the preset output by key operations or through communications, the
moisture value being set as preset moisture is displayed and output, regardless of the
measured value.
6. Operation
Page 23

INST No INE -403-0P0
−18−
y
1
y
2
y
3
y
4
y
5
y
7
99.999
y
6
-10
0
10
x
1
x2x3x
4
x5x
6
x
7
6.3.2 Setting of calibration curve data
1) Press SEL key for 2 seconds to enter into the calibration
curve data setting mode.
2) By pressing key, a numeric blinks for entering a
calibration curve number.
3) Change the numeric by key, key or key.
When key is pressed, the numeric is increased.
When key is pressed, the numeric is decreased.
When key is pressed, the blinking digit shifts.
4) When ENT key is pressed, the numeric stops blinking
and the calibration curve number is stored.
5) Press SEL key to enter into the setting mode for
polynomial coefficient a0.
6) Enter into a numeric setting mode by pressing key.
Change the numeric by key or key and store it by
pressing ENT key.
For entering a decimal point, press CH/・ key at the
blinking digit.
7) Press SEL key to enter into the next data setting mode.
8) Repeat the above procedure to set all data.
9) After the above setting procedure is completed, return to the measurement mode by
pressing SEL key for 2 seconds. The automatic return is made if no key is pressed for one
minute.
6.4 Preparation of calibration curve by knee point line approximation
When a calibration curve is obtained in a graph but it cannot be expressed in third-degree or
lower-degree polynomial, the calibration curve can be created by broken line approximation.
6.4.1 Setting of knee point data
1) Supposing that the calibration curve graph
is as shown in the following figure.
2) Divide the calibration curve graph
appropriately and express it with broken
line approximation.
3) In this case, the first junction point and the
last junction point should sufficiently
include the measuring range. You can plot
up to 20 junction points including the first
junction point and the last junction point.
Determine intermediate junction points
appropriately according to the
approximation accuracy.
4) Supposing that the junction point data
obtained by the above are as shown below.
First junction point D1: (x1, y1)
D2: (x2, y2)
Last junction point Dn: (xn, yn)
↑
Setting data number
displayed
CH
DATA
CH 0
Blinking Detector No
CH
DATA
CH 0.0000
Setting data
displayed
CH
DATA
CH 0
6. Operation
Data number
Page 24

INST No INE -403-0P0
−19−
6.4.2 Knee point line setting data
The following data is necessary for the creation of the calibration curve by knee point line
approximation.
Data name Display Setting
range
Default
value
Remarks
(1) Calibration curve
number
CH 1 to 99 1
(2) Data count N 3 to 20 3
(3) Data number Dn 1 to 20 1
(3) Sample data
xn
Hn 0 to ±9999.9 0.0000 Valid number 5 digits
(3) Sample data
yn
yn 0 to ±9999.9 0.0000 Valid number 5 digits
(4) Regression/Broken
line
Pb 1 to 4 1
1 to 3:
Polynomial expression degree
(Regression operation)
4: Broken line approximation
(5) Standard deviation Sd 0 to 999.99 0.0000
Setting not required in broken line
approximation
(1) Calibration curve number: Calibration curve number can be specified in optional
numbers from 1 to 99 but usually it is specified in order
from 1.
(2) Data count: It is the number of knee point data and the maximum is 20 points.
(3) Data number, sample data x
n,
sample data yn:
Enter the knee point data obtained in [6.4.1 Setting of knee point data].
(4) Regression/knee point line: With entering 1, 2 or 3, the polynomial expression with that
degree can be obtained according to the above sample data
by regression operation. When 4 is entered, knee point line
approximation is obtained.
(5) Standard deviation: When the regression operation is specified, standard deviation is
displayed. This setting is not required in knee point line
approximation.
6. Operation
Page 25

INST No INE -403-0P0
−20−
6.4.3 Setting of calibration curve data for knee point line approximation
(1) Setting of calibration curve number
1) Press SEL key and CH/. key simultaneously for
2 seconds to enter into the sample data setting mode.
2) By pressing key, a numeric blinks for entering a
calibration curve number.
3) Change the numeric by key, key or key.
When key is pressed, the numeric is increased.
When key is pressed, the numeric is decreased.
When key is pressed, the blinking digit shifts.
4) When ENT key is pressed, the numeric stops blinking
and the calibration curve number is stored.
(2) Setting of data count
1) Press SEL key to enter into the data count setting
mode.
2) Change a numeric by the procedure mentioned in the
above “(1) Setting of calibration curve number 2) and
3)” and store it with ENT key.
(3) Setting of data number, sample data xn and
sample data yn
1) Press SEL key to enter into the data number setting
mode.
2) Change a numeric by the procedure mentioned in the
above “(1) Setting of calibration curve number 2) and
3)” and store it with ENT key.
3) After setting the above, press SEL key for entering
into the sample data xn setting mode.
4) After setting the above, press SEL key for entering
into the sample data yn setting mode.
5) After setting the above, press CH/. key to return to
“1) Data number setting mode” and then set the next
data number.
6) Repeat the above procedures for setting all junction point
data.
(4) Regression/Knee point line
1) After completing the setting of knee points, press SEL
key to enter into the regression/knee point line setting
mode.
2) Enter “4” in the selection of regression/knee point line.
3) After the settings are completed, press SEL key for 2
seconds to return to the measurement mode.
Automatic return to the measurement mode is made if
any key is operated for 1 minute.
CH
DATA
Dn 0.0000
CH
DATA
yn 0.0000
CH/・ SEL
CH
DATA
pb 4
CH
DATA
CH 1
CH
DATA
CH 01
Detector No
Blinking
CH
DATA
n 4
Setting data
displayed
Setting data number
displayed
CH
DATA
Dn 1
6. Operation
Page 26

INST No INE -403-0P0
−21−
6.5 Setting of operating conditions
Set the operating conditions including time constant and decimal place in the display.
6.5.1 Setting data
Set the following data in operating conditions.
However, the number of displayed setting data varies depending on the setting of dipswitches.
Data name Display Setting range Default value Remarks
(1) Time constant t 0 to 9, 9 to 99 0.0 Unit: Seconds
(2) Hold ON/OFF Hd ON, OFF OFF
(3) Preset output ON/OFF PS ON, OFF OFF
(4) Decimal place in display Dt 0 to 4 1
(5) Detector unit number Hn 1 to 9 1
(6) Communications
speed *1
SP
1200, 2400, 4800,
9600, 19200
9600
(6) Parity *1 P None
odd
EVEn
EVEn nonE :Non parity
odd : Odd parity
EVEn :Even parity
(6) Data length *1 D 7, 8 7
(6) Stop bit length *1 B 1 to 2 1
(6) BCC enable/disable *1 Bc ON, OFF OFF (disable)
(7) Sample temperature
correction enable/disable
St ON, OFF OFF (disable)
(8) Correction input
scaling L*2
TL -999 to 999 0
(8) Correction input
scaling H*2
TH -999 to 999 100
〔Engineering mode
〕
(9) Weightα
Af 0 to 1.000 0.500
(10) Calibration constant k1 k1 0 to ±9.9999 1.0000
(11) Calibration constant
k2 *3
k2 0 to ±9.9999 0.0000
(
Note) The setting data of *1 to *3 is displayed or not depending on the setting of
dipswitches.
Displayed data Setting of dipswitch 1 Contents
*1 Setting data No. 4 : ON Connection destination: Personal computer
*2 Setting data No. 7 : ON No. 8 : OFF Corrected input: Enable
Corrected input specification: 4 to 20mADC
*3 Setting data No. 3 : ON No. 2 Calibration: Enable
6. Operation
Page 27

INST No INE -403-0P0
−22−
(1) Time constant:
If a measured value fluctuates noticeably, the signal can be set to be dull by delaying the
response of this moisture meter. Set the smoothing time (equivalent to the time constant of
analog instrument) in 0.1-second increment for less than 10 seconds and in 1-second
increment for more than 10 seconds.
(2) Hold ON/OFF:
When holding of measured value is desired, turn it ON. At this time, analog output will
also be held.
(3) Preset output ON/OFF:
By turning on the preset output, this moisture meter displays the preset moisture value and
the analog output becomes the value corresponding to the preset moisture value.
(4) Decimal place in moisture display:
The decimal place can be set for easily monitoring the moisture value measured.
(5) Detector unit number:
This is the number for identifying the detector unit for connection of multiple detector units.
This setting has been completed in [6.2 Setting of detector unit number].
(6) Communications speed, Parity, Data length, Stop bit length, BCC enable/disable:
These are for communications with a personal computer, a sequencer or other similar
devices. These data are not necessary to set for combining this moisture meter with the
setting display unit.
(7) Sample temperature correction enable/disable:
These are used for sample temperature correction enabled.
(8) Correction input scaling L, Correction input scaling H
These are used for scaling of 4 to 20mA correct ion input.
(9) Weight á
In 3-wavelength operation, the ratio of 2 comparative wavelengths is determined by this
value.
(10) Calibration constant K1:
This is the calibration constant at the time of zero side calibration.
(11) Calibration constant k2:
This is the calibration constant at the time of span side calibration.
6. Operation
Page 28

INST No INE -403-0P0
−23−
6.5.2 Setting
1) Press SEL key and ENT key simultaneously for 2
seconds to enter into the operation condition setting
mode.
2) By pressing key, a numeric blinks for entering a data.
3) Change the numeric by key, key or key.
When key is pressed, the blinking digit shifts.
For entering the decimal point, press CH/. key.
4) When ENT key is pressed, the numeric stops blinking
and the data is stored.
5) Press SEL key to enter into the setting mode of the
next data. Repeat the above procedures to set all data
except the engineering mode.
6) For setting of data in the engineering mode, press ENT
key in the screen shown in the right side to enter into the
setting mode of the engineering mode.
7) After the settings are completed, press SEL key for 2
seconds to return to the measurement mode. Automatic
return to the measurement mode is made if any key is
operated for 1 minute.
6.6Calibration
For using this moisture meter accurately, regular calibration once in three months is requested.
1) Supply power more than one hour to this moisture meter
before calibration.
2) Turn the calibration curve number to 0. (For the change
in calibration curve number, refer to [6.7 Setting of
calibration curve number]. By this setting, absorbance
“x” is displayed as a data.
3) Execute the calibration by pressing the three keys SEL , , and ENT
simultaneously .
Make sure that light absorbance “x” is within 0.00000±0.0010. The calibration is
completed.
CH
DATA
Eng
CH DATA
t 0.0
Setting data
displayed
Setting data number
displayed
CH
DATA
0 0.0021
Refere nce
・For the reflective type fiber, place the output checker plate
at the tip of
fiber to see the plate.
Refere nce
・For the transparent type fiber, disassemble the measuring cell
to be
empty.
6. Operation
Page 29

INST No INE -403-0P0
−24−
6.7 Setting of calibration curve number
Set the calibration curve number according to the
measuring object.
1) By pressing CH/. key, a numeric blinks for entering a
calibration curve number.
2) Change the numeric by key, key or key.
3) When ENT key is pressed, the numeric stops blinking
and this moisture meter becomes the measurement mode
at the calibration curve number changed.
6.8 Correction of calibration curve
If the actual moisture value is different from the moisture value being preset due to the
difference of one-line and off-line, or other causes, correct it by the correction coefficients b0
and b1 in [6.3 Setting of calibration curve data]. Usually, the shift correction is done with
b0 only.
CH
DATA
01 10.0
Blinking
Refere nce
[Example]
When the measured moisture before correction is 15(%H2O)
and actual
moisture value is 13 (%H2O),
Set b0 = -2(%H2O) .
6. Operation
Page 30

INST No INE -403-0P0
−25−
7. Preparation of calibration curves
The output characteristics of the moisture meter depend upon the measuring objects. Also, the
output characteristics may also change according to the process conditions and moisture
measurement conditions of samples for certain measuring objects.
Therefore, for accurate measurement of moisture, it is necessary to carry out the sample tests
of each measuring object in advance and obtain the relative relation (this is called as
calibration curve) between the moisture value (%H2O) obtained by the drying method or other
measuring methods and the absorbance "x" measured by the moisture meter This chapter
describes the measurement of the moisture value by the drying method. However, the method
of creation of the calibration curves is same even if the moisture value is measured by the
Karl Fischer method or other methods.
7.1 Sample preparation
7.1.1 Powder or granular
(1) Take a sample of about 2 to 4 liters from the measuring object.
(2) Dry up the sample up to the absolute dry condition by a dryer. Particularly be careful with
the heating temperature so as not to denature the sample.
(3) Divide the dry sample every 100 to 200cc into 5 to 6 samples separately, although it is
recommendable to divide the sample into many samples.
(4) Add water to these 5 to 6 samples bit by bit so that the moisture values of each sample
divides the measuring range almost evenly.
(5) Stir each sample with water addition sufficiently, and put it into a polyethylene bag and
seal it tightly.
(6) Leave each sample for about 2 days until its moisture is stabilized.
If a sample cannot be heated or if it is hardened by adding water and thus
can ’
t be measured, adjust the moisture correspondingly according to the
procedure in case of a paper s hown below.
Caution
7. Preparation of calibration curves
1
2 3 N
Page 31

INST No INE -403-0P0
−26−
7.1.2 Paper (sheet substance)
(1) Cut a sample to have a size of about 100 x 100mm by using a cutter or the like. (Number
of samples: 9 sheets)
(2) Divide nine sheets of the sample into 3 groups with 3 sheets in each group. Adjust the
moisture of each group under the following conditions.
Drying : Leave the samples in a desiccator containing silica gel for 2 days. In case of
papers, the moisture becomes about 4%H2O.
In the air: Leave the samples in an indoor atmosphere.
In case of papers, the moisture becomes about 7%H2O in summer or about
5%H2O in winter.
Moistening: Leave the samples in a desiccator containing salt water for 2 days.
In case of papers, the moisture becomes 8 to 9%H2O usually or
maximum about 11% H2O.
7.1.3 Liquid
(1) Prepare 500 to 1000cc of sample dried nearly up to the lower limit moisture of the
measuring range.
(2) Prepare 5 to 10 containers (with lid) of 100 to 200cc capacity and put the above sample
till the containers are full.
(3) Add water to these 5 to 10 samples bit by bit so that the moisture values of each sample
divides the measuring range almost evenly.
(4) Stir each sample with water addition sufficiently, and put a lid on the container tightly.
Wear clean gloves when handing samples so as not to touch them by
naked hands directly.
It is convenient for you to mark the samples for identifying
its front and
back surfaces and its flow direction.
Caution
If a sample is with strong moisture absorption and low moisture less than
few % is required, even if water is not added,
the moisture of the sample
may reach to its level by absorption of moisture only.
For such samples, adjust moisture by changing a moisture absorption time.
Caution
7. Preparation of calibration curves
1
2
3
4
5
6
Withsilicagel
Withsalt water
Page 32

INST No INE -403-0P0
−27−
w1-w2
w1-w0
×100
(%H2O
)
7.2 Sample measurement
Be careful with the following cautions during measurement.
(1) Before measurement, warming-up of this moisture meter more than 1 hour is required.
(2) Place a sample at the same position as in actual measurement, set the calibration curve
number to 0, and read the display (absorbance "x").
(3) Perform the measurement rapidly.
7.2.1 Powder or granular
(1) Prepare the trays (Diameter 100 to 150mm, Depth about 20mm) by the same quantity as
the measuring sample quantity.
(2) Weigh the weight w0 of each tray.
(3) Spread the sample being sealed in the polyethylene bag on the tray it till the surface
becomes flat and the bottom cannot be seen.
(4) Put the tray at the measuring position, set the calibration curve number to 0, and read the
display (absorbance "x"). If the measured value cannot be read easily, delay the response
by the smoothing function.
(5) Stir the sample rapidly with a spoon and measure it again. Repeat this measurement 2 or
3 times per sample.
(6) Weigh the weight w1 of the tray together with the sample.
(7) Perform the same measurement sequentially about all samples.
(8) Put each sample together with its tray into a dryer, and dry it out to be the absolute dry
condition (for longer than 2 hours at 105 to 110ºC usually).
(9) Cool down the sample after drying, and weigh the weight w2 of each tray together with
the sample.
(10) Record the measured value in the following table every measurement, and obtain the
moisture value by the following formula.
No. Absorbance "x" w0 W1 w2 Moisture value (%H2O)
1 x1 y1
2 x2 y2
3
:
x3
:
y3
:
N xn y4
7. Preparation of calibration curves
Page 33

INST No INE -403-0P0
−28−
7.2.2 Paper (Sheet substance)
(I) Weigh the weight w1 of a sample before measurement.
(2) Hold the sample by a paper holder, put it by tilting at 15º to the measuring position, set
the calibration curve number to 0, and read its display (absorbance "x"). In this case,
match its front and back surfaces and flo w direction of the samples.
(3) Weigh the weight w
2
of the sample after measurement. Perform the measurement from
(1) to (3) as quickly as possible.
(4) Perform the same measurement sequentially for all samples.
(S) Put each sample into a dryer, and dry it out to be the absolute dry condition (for longer
than 2 hours at 105ºC usually by using paper stand).
(6) Cool down all samples in a desiccator containing silica gel after drying.
(7) Weigh the weight w3 of each sample.
(8) Record the measured value in the following table every measurement, and obtain the
moisture value by the following formula.
No. Absorbance "x" w0 W1 w2 Moisture value (%H2O)
1 x1 y1
2 x2 y2
3
:
x3
:
y3
:
N xn y4
7.2.3 Liquid
Execute the measurement in order from the object of low moisture to the object of high
moisture.
1) Put a sample into the measuring cell, set the calibration curve number to 0, and read the
display (absorbance "x").
If the measured value cannot be read easily, delay the response by the smoothing function.
2) With the Karl Fischer method or other methods, measure moisture value of the sample put
in the measuring cell.
3) Repeat the above measurements of 1) and 2) for 2 or 3 times per sample.
4) Record the measured value of all samples by the same measuring procedure in the
following table, and obtain the average value.
Absorbance "x" No.
1 2 3 Average
Moisture
(%H2O)
1 x1 y1
2 x2 y2
3
:
x3
:
y3
:
N xn y4
(w1+w2)/2-w3
(w1+w2)
×100
(% H2O
)
・For taking out a sample from a
container, shake the container well to
uniform the moisture in the container and then take the sample out.
・When the next sample is measured, throw away the sample
already
contained completely and wash the measurement cell
for two or
three times for the next measurement.
Caution
7. Preparation of calibration curves
Page 34

INST No INE -403-0P0
−29−
Absorbance (x)
M oisture value (y)
(%H2O
)
7.3 Preparation of calibration curves
Create a calibration curve by plotting data obtained by
[7.2 Sample measurement] on a graph. Plot the
absorbance "x" of this moisture meter on the X-axis
and also plot the moisture value (%H2O) on the Y-axis.
Obtain a curve with minimize errors from this graph as
a calibration curve. Usually the curve with minimize
errors is obtained by the regression operation. For the
creation of a calibration curve by the regression
operation, refer to [7.3.1 Computation of regression
expression] and [7.3.2 Confirmation of regression
expression].
If a graph contains inflection points, use the creation of
a calibration curve by broken line approximation. For
the creation of a calibration curve by broken line
approximation, refer to [6.4 Creation of calibration
curve by broken line approximation].
7.3.1 Computation of regression expression
This moisture meter has regression operation function by the minimum mean square method.
By this function, first-degree to third-degree polynomials can be obtained by entering the data
obtained in [7.2 Sample measurement].
Assume that there are “n” sets of sample data ("xn, yn). (in condition that “n” is 20 or less)
(1) Setting of calibration curve number
1) Press SEL key and CH/. key simultaneously
for 2 seconds to enter into the sample data setting mode.
2) By pressing key, a numeric blinks for entering a
calibration curve number.
3) Change the numeric by key, key or key.
When key is pressed, the numeric is increased.
When key is pressed, the numeric is decreased.
When key is pressed, the blinking digit shifts.
4) When ENT key is pressed, the numeric stops blinking
and the calibration curve number is stored.
(2) Setting of data count
1) Press SEL key to enter into the data count setting
mode.
2) Change a numeric by the procedure mentioned in the
above “(1) Setting of calibration curve number 2) and
3)” and store it with ENT key.
CH
DATA
CH 0
CH
DATA
CH 00
CH
DATA
n 3
Setting data
displayed
Setting data number
displayed
Blinking
Calibration
Curve number
7. Preparation of calibration curves
Page 35

INST No INE -403-0P0
−30−
(3) Setting of data number, sample data xn and sample
data yn
1) Press SEL key to enter into the data number setting
mode.
2) Change a numeric by the procedure mentioned in the
above “(1) Setting of calibration curve number 2) and
3)” and store it with ENT key.
3) After setting the above, press SEL key for entering
into the sample data xn setting mode.
4) After setting the above, press SEL key for entering
into the sample data yn setting mode.
5) After setting the above, press CH/. key to return to
“1) Data number setting mode” and then set the next
data number.
6) Repeat the above procedures for setting all sample data.
(4) Computation of regression expression
1) After completing the setting of sample data, press SEL
key to enter into the regression/ broken line setting mode.
2) Enter “1, 2 or 3” in the selection of regression/broken line.
A polynomial with corresponding degree can be obtained.
3) By pressing SEL key, the standard deviation
(approximate accuracy of the regression expression) of
the above regression expression is displayed.
3) After the settings are completed, press SEL key for 2
seconds to return to the measurement mode.
Automatic return to the measurement mode is made if any
key is operated for 1 minute.
7.3.2 Confirmation of regression expression
The coefficient of the regression expression obtained by
the above can be confirmed by the following procedure.
1) Press SEL key for 2 seconds to enter into the
calibration curve setting mode.
2) Set calibration curve number, for which the regression
expression is obtained.
3) Press SEL key to display the coefficient a0 of the
regression expression.
4) For displaying a1 to a3, press SEL key in the same way.
5) After the confirmation is completed, press SEL key for 2
seconds to return to the measurement mode.
Automatic return to the measurement mode is made if any
key is operated for 1 minute.
CH
DATA
dn 1
CH DATA
Hn 1
CH
DATA
yn 1
CH/・ SEL
CH
DATA
pb 1
CH
DATA
Sd 0.12
CH
DATA
CH 1
CH DATA
A0 1.2544
7. Preparation of calibration curves
Page 36

INST No INE -403-0P0
−31−
Absorb ance (x)
M oisture value (y)
Calibrationcurveof
sample temperature"T3"
Calibrationcurveof
sampletemperature"T2"
Calibrationcurveof
sample temperature"T1"
8.1 Summary
When a calibration curve changes at the sample
temperature Ts, this function enables to change the
calibration curve to other one at this sample
temperature. For the input of the sample
temperature, a platinum resistance thermometer
(Pt100), a radiation thermometer or a
temperature/voltage converter with the output of 4
to 20mADC can be used. By utilizing this function,
10 calibration curves in one group (9 curves only
in the group 10) are changed with the sample
temperature Ts. Since 99 calibration curves can be
stored, up to 10 groups can be set.
8.2 Model
This is an optional function. The model number of the detector unit with this optional function
is as follows: IR-M2
External input
5: Correction input 4 to 20Ma
8: Correction input Pt100
Communications
S: RS-485
R: RS-232C
8.3 Wiring of detector unit
8.4 Setting of dipswitch (Ref to [3.1 Setting of dipswitches])
(1) Turn off the power supply of the detector unit and the setting display unit.
(2) Switch the dipswitch 7 (Correction input enable/disable) of the detector unit to ON side.
(3) For 4 to 20mA input: Switch the dipswitch 8 (Correction input)
to OFF side
(4 to 20mADC).
For Pt100 input: Switch the dipswitch 8 to ON side (Pt100).
(4) Turn on the power supply of the detector unit and then turn on the power supply of the
setting display unit.
[For Pt100
input]
SA
SB
SG
A
B
B
Correction
input
Pt100
[For 4 to
20mAinput ]
SA
SB
SG
-
Correction
input
4 to 20mA
+
I N
(mA)
8. Correction function by sample temperature from external input
Page 37

INST No INE -403-0P0
−32−
8.5 Setting of correction enabled/disabled by sample temperature
Execute this setting to either the detector unit or the setting display unit. When the correction
is disabled, the operation is normal which means the calibration curve is not changed
according to the sample temperature. When it is enabled, the calibration curve is changed
with the sample temperature.
8.5.1 Setting at the detector unit
(1) Enter into the operating condition setting mode.
SEL + ENT for 2 seconds
(2) Enter into the correction enable/disable setting mode (St). SEL Several times
(3) Select the correction enabled or disabled.
ENT (OFF) Correction OFF (disable)
ENT (ON) Correction ON (enable)
* For the setting of sample temperature scaling as the next step, skip (4) and step to (2) of [8.4
Setting of sample temperature scaling].
(4) Return to the measurement mode.
SEL for 2 seconds
8.5.2 Setting at the setting display unit
(1) Set the calibration curve number to 0.
CH 0 ENT
(2) Enter into the correction enable/disable setting mode (St).
MODE 1 9 ENT
(3) Select the correction enabled or disabled.
0 ENT (OFF) Correction OFF (disable)
1 ENT (ON) Correction ON (enable)
* For the setting of sample temperature scaling as the next step, skip (4) and step to (2) of [8.4
Setting of sample temperature scaling].
(4) Return the calibration curve number to the original one.
8. Correction function by sample temperature from external input
Page 38

INST No INE -403-0P0
−33−
8.6 Setting of sam ple temperature scaling (Only 4 to 20mA DC)
In case of using radio thermometer or thermoelectric converter, it is necessary to match the
temperature range of their 4 to 20mA DC output and the temperature range of 4~20mA DC
input of this instrument.
Carry out scaling in either detector unit side or setting display unit side, following the main
points given below.
8.6.1 Setting at the detector unit
(1) Enter into the operating condition setting mode.
SEL + ENT for 2 seconds
(2) Enter into the setting mode of sample temperature scaling low limit (tL).
SEL Several times
(3) Set the low limit (tL) of sample temperature scaling.
(Setting range: -999.9 to 999.9)
(4) Enter into the setting mode of sample temperature scaling high limit (tH). SEL Once
(5) Set the high limit (tH) of sample temperature scaling.
(Setting range: -999.9 to 999.9)
8.6.2 Setting at the setting display unit
(1) Set the calibration curve number to 0.
CH 0 ENT
(2) Enter into the sample temperature scaling setting mode
MODE 2 1 ENT
(3) Set the low limit (tL) of sample temperature scaling.
(Setting range: -999.9 to 999.9)
(4) Enter into the setting mode of sample temperature scaling high limit (tH). SEL Once
(5) Set the high limit (tH) of sample temperature scaling.
(Setting range: -999.9 to 999.9)
8.7 Setting of sample temperature
The key operation for this setting is common on the detector unit and the setting display unit.
(1) Enter into the calibration curve setting mode.
SEL for 2seconds
(2) Enter into the sample temperature set ting mode (tS).
SEL several times
(3)Set the sample temperature.(Setting range: -999.9 to 999.9)
8. Correction function by sample temperature from external input
Page 39

INST No INE -403-0P0
−34−
8.8 Setting of calibration curve data
(1) Specify a group for calibration curve number to be used.
The groups are from 1 to 10 and each one corresponds to the following calibration curve
numbers respectively.
Group 1: Calibration curve number 1 to 10 Group 6: Calibration curve number 51 to 60
Group 2: Calibration curve number 11 to 20 Group 7: Calibration curve number 61 to 70
Group 3: Calibration curve number 21 to 30 Group 8: Calibration curve number 71 to 80
Group 4: Calibration curve number 31 to 40 Group 9: Calibration curve number 81 to 90
Group 5: Calibration curve number 41 to 50 Group 10: Calibration curve number 91 to 99
(2) Example: Select the group 1.
Set the following calibration curve at the sample low limit temperature T1 to the
calibration curve No. 1.
Y = a3X3 + a2X2 + a1x + a0
Only the calibra tion curve by polynomial expression can be used. (The calibration curve
by broken line approximation cannot be used.)
Further, set the sample temperature T1. For its setting, refer to [8.7 Setting of sample
temperature].
(3) Set the calibration curves at the sample temperature Ti ( i = 2 to 10) to the calibration
curve numbers 2 to 10.
However, Ti should fulfill the following expression.
T1 (Sample low limit temperature) T2 ………. T9 T10 (Sample high limit
temperature)
(4) Enter 999.9 at the Ti, which is not used. Be careful that, if this value is not entered, a
calibration curve not used is computed as a data.
* The default of the sample temperature Ti is 999.9.
(5) For the correction expression coefficient s b1 and b0 and the constants (low limit range,
high limit range, low limit alarm, high limit alarm and preset value), use the values for
the first calibration curve number in a group.
Group 1: Calibration curve number 1 Group 6: Calibration curve number 51
Group 2: Calibration curve number 11 Group 7: Calibration curve number 61
Group 3: Calibration curve number 21 Group 8: Calibration curve number 71
Group 4: Calibration curve number 31 Group 9: Calibration curve number 81
Group 5: Calibration curve number 41 Group 10: Calibration curve number 91
8. Correction function by sample temperature from external input
Page 40

INST No INE -403-0P0
−35−
8.9 Measurement
(1) When the correction by sample temperature ON (enable) is selected and one calibration
curve number in a group is set, the calibration curve number changes automatically
corresponding to sample temperature.
For example, when the sample temperature Ts fulfills the following expression, the
calibration curve number becomes “i”.
T1 ….. Ti Ts < Ti + 1 ….. T10
(2) However, the measured value Y is not the measured value T1 on the calibration curve No.
“i”. The measured value Y becomes the following value interpolated from the measured
value Yi and the measur ed value Y
i+1
on the calibration curve No. “i+1”.
(3) When the sample temperature Ts is lower than the sample temperature of the first
calibration curve number in the group or when it is higher than the sample temperature of
the last calibration curve number, the following error display appears.
However, the calibration curve, of which sample temperature is set as 999.9, is ignored.
* For the sample temperature lower than the sample temperature of the first calibration
curve number in the group Er15 (Sample temperature too low)
* For the sample temperature higher than the sample temperature of the first calibration
curve number in the group Er14 (Sample temperature too high)
8.10 Display of sample temperature Ts
8.10.1 Display at the detector unit
(1) Set the calibration curve number to 0. CH 0 ENT
(2) For canceling of the sample temperature display SEL for 2 seconds or CH 2 for seconds
8.10.2 Display at the setting display unit
(1) Set the calibration curve number to 0. CH 0 ENT
(2) For displaying the sample temperature display MODE 2 0 ENT
(3) For canceling of the sample temperature display SEL for 2 seconds or CH for 2 seconds
9.1 Periodical inspection
The following inspection is required periodically.
(1) Cleaning of tip of fiber optics (for reflective type fiber optics)
Keep the tip of fiber optics clean.
If any dirt or dust is noticed, remove it with gauze etc. If the gauze is dipped in alcohol, it
is more effective.
(2) Disassemble cleaning of measuring cell (for transparent type fiber optics)
Regular cleaning of the cover glass in a liquid-contacting part of the measuring cell is
required by disassembling the measuring cell.
(3) Installation
Check the detector unit is installed firmly.
(4) Wiring
Check the wirings to the terminals of the detector unit, the setting display unit and other
instruments are connected completely.
(5) Calibration
Regular calibration one in 3 months is required.
8. Correction function by sample temperature from external input
9. Inspection and maintenance
Page 41

INST No INE -403-0P0
−36−
9.2 Self-diagnosis function
Error message for abnormal operation is displayed by the self-diagnosis function.
The same error message is displayed in the detector unit and the setting display unit.
Erro
r
No.
Item Contents Measures
Self -
diagnosed
abnormality
----- High limit over range Measured value is
higher than display
range.
Check calibration curve
data.
Check output b
y checker
plate.
----- Low limit over
range
Measured value is lower
than display range.
Check calibration curve
data.
Check output by checker
plate.
Er01 Calibration data error Calibration data is
damaged.
Clear RAM.
Er02 RAM error Detector unit ram data is
damaged.
Clear RAM.
Er03 Motor rotation
abnormal
Motor stops or rotates
abnormally.
Exchange motor.
Er04 Lamp power supply
abnormal
Lamp power supply
is
damaged.
Exchange lamp power
supply unit.
Er05 A/D abnormal A/D is over range. Check output by checker
plate.
Er06 Computation error Computation is
overflow.
Check output by checker
plate.
Er07 Element
temperature
abnormal
Element temperature
is
abnormal.
Need to return detector
unit to CHINO.
Er10 Calibration curve
data error
Calibration curve data is
not appropriate.
Reset calibration curve
data.
Er11 Knee point line
approximation error
Absorbance x is out of
range of broken line
approximation.
Reset broken line
approximation data.
Er12 Ambient
temperature
too high
Ambient tempera
ture of
detector unit is too high
Lower ambient
temperature.
Er13 Ambient
temperature
too low
Ambient
temperature of
detector unit is too low
Raise temperature.
Er14 Sample temperature
too high
Sample temperature is
higher than correction
range
Widen correction range.
Er15 Sample temperature
too low
Sample temperature is
lower than correction
range
Widen correction range.
Er16 Sample low
reflection
Reflection rate of
sample is low or the
lamp is damaged.
Close distance to sample.
If the lamp is damaged,
exchange it.
Er17
Regression operation
error
Regression operation
is
abnormal.
Check calibration curve
sample data.
(Note) For the items filled with ¡ in the self-diagnosed abnormality, an alarm output for
self-diagnosed abnormality is activated from the setting display unit.
9. Inspection and maintenance
Page 42

INST No INE -403-0P0
−37−
9.3 Measures against troubles not included in self-diagnosis
If a trouble occurred, take remedial measures referring to the corresponding items of this
instruction manual after checking the following points. For the troub les of the setting display
unit, refer to the separate instruction manual the setting display unit.
[1.] No display appears in detector unit.
(1) Is the power supply normal?
(2) Is the fuse normal?
(3) Are cables connected completely?
(4) Are connectors connecting the setting display part and the internal CPU board connected
securely?
(S) Turn off the power supply once and turn it on again.
(6) If the trouble cannot be repaired by the above check, the power supply unit in the
detector may be defective.
[2.] Measured value remains unchanged.
(I) Is HOLD set to OFF?
(2) Is PRESET set to OFF?
(3) Are the calibration curve data correct?
(4) Is the sample liquid flowing in the measuring cell?
(5) Turn off the power supply once and turn it on again.
(6) By using the output checker plate, check if the display at the calibration curve number 0
changes.
[3.] Measured value fluctuates.
(1) Is the measuring surface flat? (for reflective type fiber optics)
(2) Is the measuring position correct? Make sure that the detector unit does not measure a
bottom face like as a belt conveyor.
(3) Make sure that the disturbance light does not radiate onto the measuring surface. (for
reflective type fiber optics)
(4) Make sure that bubbles do not generate in the sample liquid. (for transparent type fiber
optics)
(5) Is the fiber optics fixed firmly? Make sure to fix it at a place without any vibration.
(6) Is the smoothing time proper? Certain smoothing time is necessary for stable
measurement.
(7) Make sure that any noise source does not exit around the detector unit or connection
cables.
(8) By using the output checker plate, check if the display at the calibration curve number 0
fluctuate. (for reflective type fiber optics)
(9) With the measuring cell emptied, check if the display at the calibration curve number 0
fluctuate. (for transparent type fiber optics)
(10) If the display fluctuates in (8) or (9), clear RAM. If the trouble is not recovered yet,
send back it to CHINO for repair.
(11) Make sure that the fiber optics is not disconnected.
[4.] Measured value is slightly higher than or lower than the actual value.
(1) Is the calibration curve number correct?
(2) Are the calibration curve data correct?
(3) Are HOLD and PRESET set to OFF?
(4) Is the measuring position correct? (for reflective type fiber optics)
(5) Is the top of the fiber optics free of dirt and foggy? (for reflective type fiber optics)
(6) Is the sample liquid flowing in the measuring cell? (for transparent type fiber optics)
(7) Correct the calibration curve. (Refer to [6.8 Correction of calibration curve])
9. Inspection and maintenance
Page 43

INST No INE -403-0P0
−38−
Protrusion
department
ofcase
Hexagonal
screw
plugs
Connector
Hole
Detector(Aview fromside)
Lamp
suppoting
part
Lampho lder
M4
Hexagonal
screw
plugs
Dent
department
Ring
Source
lamp
M3
Hexagonal
screw
plugs
Lamp
plate
9.4 Maintenance parts
9.4.1 List of maintenance parts
The replacing intervals are reference values. They var y according to the working condition.
Article name Quantity Replacing
interval
Remarks
Light source
lamp (With
connector)
1 5 years
Motor (with connector) 1 3 years
Fuse 2 Attached as an accessory
Lithium battery (mounted
on a printed circuit board)
1 3 years 3 years when no power is fed
Power supply unit (Note) 1 5 years 3 years when the ambient
temperature is 40°C or higher
(Note): This is built in the detector unit. (not IR-WEP)
9.4.2Replacement of light source lamp
(1) Turn off the power source to the detector
unit.
(2) Open the door of the detector unit and
remove the connector for the lamp.
(3) While holding the lamp supporting part,
loosen the hexagonal screw plugs on the
upside of the detector unit with a
hexagonal wrench and take out the lamp
assembly.
(4) Loosen two M4 hexagonal fixing screws
of the lamp holder and take out the lamp
holder.
(5) Loosen two M3 hexagonal fixing screws
of the lamp tube and take out the light
source lamp as shown in the figure.
(6) Put a new light source lamp in the lamp
tube and insert a ring. Then, fix the ring
with two M3 hexagonal screws.
(7) Mount the lamp holder by placing its slit
to the side of the lamp supporting part
and fix it with two M4 hexagonal
screws.
(8) By holding the lamp supporting part of the
lamp assembled, place the holes of the
lamp holder to the projecting parts of the
detector unit case and then fix it to the detector unit with the hexagonal screw plugs.
(9) Connect the connector for the lamp.
War ning
For replacing maintenance parts, make sure to turn off the power source.
Fix the ring to close to the lamp side.
W a r n ing
9. Inspection and maintenance
!
Page 44

INST No INE -403-0P0
−39−
9.4.3 Replacement of motor
(1) Turn off the power source to the
detector unit.
(2) Open the door of detector unit and take
out the setting display part by
removing four screws.
(3) The setting display part is connected
with the interior by a cable. Lift the
cable with care not to damage it and
disconnect the connector for the setting
display part as shown in the figure.
(4) Disconnect the connector for the motor.
(5) Loosen fixing screw s for the motor and
take out the motor and the motor band
by pulling them forward.
(6) Make the motor unit stand as shown in
the figure and hold the sector lightly.
Then separate the sector from the
motor by removing four M2 screws.
(7) Make a new motor stand, too, and
attach it to the sector. Be careful that
the sector has front and rear sides.
(8) Place the motor unit to make the top of
the motor touch the stopper of the
motor mounting base and wear the
motor band on the motor. (In this case,
place the motor lead wire to the
position shown in the figure.)
(9) Fix the motor band with motor fixing
screw.
(10) Insert the motor lead wire into the
connector.
(11) Return the setting display part to its
origin.
Connector fordisplay
Motor
Motormountingbase
Motor
Connector for
themo tor
Stopper
Motorfixing
screws
Filter
4-M2screws
Motor
band
[ Motor unit ]
Caution
Never scratch the sector filter during replacement.
9. Inspection and maintenance
Page 45

INST No INE -403-0P0
−40−
Connectorfor display
Guide forthe printed
circuit board
Fixing screws ofholderfor
the printed circuit board
Holder for theprinted
circuit board
The printedcircuit
board for battery
A/D
Board
9.4.4 Replacement of lithium battery
The detector unit has a built-in lithium battery for memory backup . The setting data are kept,
even if electricity is not supplied for 3 years or longer. When the battery has been co nsumed
after 3 years or longer without supplying electricity, replace it with a new battery by the
following procedure.
(1) Turn off the power source to the
detector unit.
(2) Open the door of detector unit and
take out the setting display part
by removing four screws fixing
it.
(3) The setting display part is
connected with the interior by a
cable. Lift the cable with care
not to damage it and disconnect
the connector for the setting
display part as shown in the
figure.
(4) Take out the holder for the printed
circuit board by loosing 2 M2.6
pan head screw.
(5) Pull the A/D board forward.
(6) Replace the lithium batter with
the mounting board by removing
fixing screws for the mounting
board placed on the A/D board.
(7) Insert the A/D board to the lower
connector along the guide
completely.
Return the holder for the printed
circuit board and the door to the
original positions.
Make sure polarities of the
battery are correct.
W arn ing
9. Inspection and maintenance
!
Page 46

INST No INE -403-0P0
−41−
9.4.5 Replacement of power supply unit
(1) Turn off the power source to the
detector unit.
(2) Open the door of detector unit.
(3) Disconnect the connection cable
and take out the connection cable
from the cable inlet.
(4) Pull out the output board from the
case inside by loosing two M3 pan
head screws and by disconnecting
the connector (14-pin).
(5) Pull out the power supply unit by
l oosing M3 nut and two M3 pan
head screws and by disconnecting
two connectors (10-pin, 2-pin).
(6) Connect the connector to a new
power supply unit and assemble it
by reversing the removing
procedure. Be careful not to step
the connection cable.
(7) Connect the connector to the output
board taken out and fix it to the
case inside.
(8) Connect the connection cable and
return the door to the original position.
9.5 Ram clearing
If the abnormal condition of the detector unit is not recovered, initialization of the RAM is
required.
(1) Turn on the power supply after pressing SEL key and > key simultaneously.
(2) The contents of ram will be initialized. Set the calibration curve data, etc. again.
Output board fixing screws
(2-M3 pan head screws)
Output board
Output board
connector(14-pin)
Power supply fixing screws
(2-M3 pan head screws)
Power supply
connector(10-pin)
M3 nuts
and spring
washers
Power supply
connector(2-pin)
Power supply
Fix it so that this part enters into the
dent department of out put board when
attaching the out put board.
9. Inspection and maintenance
Page 47

INST No INE -403-0P0
−42−
10.1 Detector unit
IR-M
Measuring system : Infrared reflection type 3-wavelength system
Reproducibility : Within detector unit output “x” ±0.003 with output checker plate
(Under same ambient temperature and humidity)
The above reproducibility is specified with the output checker plate and it is different from the
reproducibility in actual measurement.
Moisture output : 4 to 20mADC (Load resistance 500Ù or lower)
Output accuracy : ±0.5%FS
Correction input (option) : 4 to 20mADC、Pt100 3-wire type
(For corrections of sample temperature, measuring distance, etc.)
The moisture output is not available in the detector unit with
correction input.
Communications output : RS-485,RS-232C or RS-422A (to be specified)
For combination with the setting display unit : RS-485
Output update cycle : 28ms
Display : Data LED 5 digits
Calibration curve number LED 2 digits
Setting : By keys or through communications
Calibration curve : First to third degree expression or broken line
Calibration curve count : 99
Calibration curve correction: Zero and span correction
Calibration curve creation : Regression operation
Smoothing : 0 to 99 seconds Shorter that 10 seconds, 0.1 second increment
10 seconds or longer, 1 second increment
Calibration : Executed with the output checker plate (with the cell emptied for
transparent type)
Self -diagnosis : Output of calibration data error, RAM error, abnormal motor rotation,
abnormal lamp light source, abnormal communications, ambient
temperature high/low, sample low radiation etc. on display or
through communications
Working temperature range : 0 to 50ºC
Power voltage : 24VDC
Allowable voltage fluctuation: 18 to 30VDC
Power consumption : Maximum 36VA
Allowable fluctuation : Less than 3G
Connection : Fiber optics … Connector connection
Power supply, signal line …Terminal connection
Case : Steel plate Dust and water protection structure (Conforming to
IEC529 IP65)
Mounting : Wall-mounting M8 bolts 4
Weight : About 4kg
Accessories : Power supply unit IR-WEP 1piece
Fuse 2 pieces
10. Specifications
Page 48

INST No INE -403-0P0
−43−
10.2 Fiber optics
10.2.1 Reflective type fiber
optics
IR-WCRN
Measuring diameter and distance :
ö20/15mm to ö50/50mm
Fiber length : Standard 1.5m
(Maximum 10m)
Minimum bending radius: R100mm
Working temperature range :
0 to 150ºC
Fiber protection : Stainless hose
Purged airflow : 5 to 20Nl/min
Accessory : Horizontal mounting
holder, flange holder
10.2.2 Output checker plate for
reflective type fiber optics
IR-WCRNB
It is used for checking output of the
detector unit on site.
It is used by mounting it on the top of
the fiber optics.
10.2.3 Reflective type fiber
optics with lens IR -WCRE
Measuring diameter and distance :
ö20/25mm to ö40/100mm
Fiber length : Standard 1.5m
(Maximum 10m)
Minimum bending radius: R100mm
Working temperature range:
0 to 150ºC
Fiber protection: Stainless hose
Air purge function: Not provided
Accessory : Horizontal mounting
holder, flange holder
10.2.4 Output checker plate for
reflective type fiber optics
with lens IR-WCREB
It is used for checking output of the
detector unit on site.
It is used by mounting it on the top of
fiber optics.
10. Specifications
ºC
The tip of reflection
type fiber optics
Ø1 6
32
Pu rge airinlet 1:Max60
Esideco nnector
30 040
Len gth isas de signa ted. Ma x1500 mm)
Ø10
Ø8
Dsideco nnecto r
Purgeair inlet2 (R c1/8).
Unit:
mm
(Outerdiameterof applicableØ6nylontubeetc.)
Ø
40
Fitting sc rew for output
checker pl ate
The tip of reflection type fiber optics
Output checker plate
Guide pin
47 .5
(34 )
Unit:
mm
82.5
40 300
The tip ofreflection type fiber
optics w ith lens attachment
Ø8
Ø10
Ø30
Dsideco nnector
Esideconn ector
Un it:
mm
Len gth isas de signa ted. Ma x1500 mm)
Output checker plate
Fitting screw for output
checker plate
The tip of reflection type fiber
optics with lens attachment
Un it:
mm
Guide pin
Ø 40
41
(38)
Page 49

INST No INE -403-0P0
−44−
10.2.5 Measuring cell for liquid
IR-WCC1
Pipe diameter : PT1/4
Material : SUS316
Temperature of measuring liquid:
0 to100ºC
Pressure of measuring liquid :
Maximum 3.9Mpa(40kg/cm2)
10.2.6 Transparent type fiber
optics IR -WCT
Fiber length : Standard 2m
(Maximum 20m)
Ambient temperature: 0 to 150ºC
Fiber protection :Stainless hose
Minimum bending radius:R250mm
10.3 Accessories
10.3.1 Power supply unit
(conforming to CE) IR-WEP
Output voltage : 24VDC
Output current : 2.1A
Working temperature range:
-10 to 50ºC
Power supply: 100 to 240V/AC
47 to 450Hz
Allowable voltage fluctuation :
+10% to (-) 15% of rated value
Power consumption :
Maximum about 160VA
Case: Horizontal mounting holder,
flange holder
Mounting : Wall mounting type
(DIN rail)
Weight:About 380g
10.3.2 Connection cable
IR-WERT
It is the exclusive cable used for the
connection between the detector unit
and the setting display unit/power
supply unit.
Structure: 4-core cabtyre cable
(With double shield)
External diameter: ö10mm
Length :Maximum 200m
Connection:Both end tips
10. Specifications
OUT
I N
Liquid outlet(R 1/4)
Liquid inlet
(R1/4)
2-M5 Mounting s crew hole
dipth 5 (both sides)
30
142
6 0
Un it:
mm
Flexible tube(SU S)
Connector
Nu ts
Len gth isas designa ted. Ma x2000 mm)
Ø9
Ø10
Unit:
mm
4- Ø
4.5
90
75
80
±0.2
60
7.5
45
3 5.3
591
±0.2
M3.5 Terminal screws
Unit:
mm
To detector
30
11 0
20
200
Len gth isasdesignated. Max200m)
Ø1 0
To power supply and
setting display unIt
UNit:mm
Page 50

32-8, KUMANO-CHO, ITABASHI-KU, TOKYO 173-8632
Telephone: +81-3-3956-2171
Facsimile: +81-3-3956 -0915
E-mail: inter@chino.co.jp
Web site http://www.chino.co.jp/
INE- 403--0P0 Sep -'01 IR-M2□□□Series INFRARED MOISTURE METER DESIGNED AS A FIBER OPTIC(IR-M21□□, IR-M22□□)Printed in Japan ( Kuki )
 Loading...