

Page 1
INST.No.INE-394-0P2 Software version 1.3
(
)
IR-H Data Logging Software
Always keep this ins truction m anual wi th this sof t ware.
Please be sure to deliver this instruction manual to a person who
uses this Software.
Model: IR-VXG1E
Software Ver.1.3
Page 2

INST.No.INE-394-0P2 Software version 1.3
Request and notices
Thank you for purchasing so ftware for IR-H Data loggi ng software IR-VXG1E.
I would like you to read this manual before you using, in order to use IR-VXG1E correctly.
■ Application principals
This software could be used only under the agreement with these followings. Once you
install and start using this software, we will consider you made an agreement with our
application principals even if you did not made a clear statement on this.
■ Copyright
CHINO Corp. has the copyright on IR-VXG1E
.
■ Prohibition
Renting, distribution, and creating copies of IR-VXG1E are prohibited by law.
Any kind of action of making copy except backing up purpose for the product is prohibited
■ License
This software can be used at one purchase per one computer as a principle
Hardware
■
Any problem will be out of CHINO’s responsibility to support if the user caused the
problem by any kinds of computer exchange related procedures.
■ Included application software
This software is applicable to save data with Excel
functions this software has, installing Excel
*1
software will be required. You are able to
*1
format. In order to use all the
obtain Excel either through computer providers as a pre-install, Chino purchases Excel and
provides you Excel, or you purchase by your own. Please verify delivery specifi cation and
operational display specification tables.
■ OS
This software is designed for Windows95/98/NT4.0/2000/XP—feasible operation.
■ Accessories
Names Quantity Remarks
IR-H Data logging software 1 CD-R
Instruction manual 1 This manual
IR-VHC(RS-232C communication cable) 1 D-SUB 9pin female
*1: Microsoft Excel is registered trademarks of Microsoft Corporation in the USA.
*2: Windows95/98/NT4.0/2000/XP are registered trademarks of Microsoft corporation in the USA.
-F1-
Page 3

INST.No.INE-394-0P2 Software version 1.3
CONTENTS
1. Operation environment ··············································································· 1
1.1 Operation environment lists ··········································································· 2
2. Installing and Uninstalling ··········································································· 2
2.1 Installing your software program ····································································· 2
2.1.1 Automatic setup program ··········································································· 2
2.1.2 When the setup is not started automatically ······················································ 2
2.2 Uninstalling your software program ································································ 2
3. Connection with IR-H series ········································································· 3
4. Operation ································································································ 4
4.1 Start up ································································································· 4
4.1.1 Kinds of buttons and contents in the menu screen ············································· 4
4.2 Recalling stored data ················································································· 5
4.3 Saving the stored data ················································································· 6
4.4 Display of Multi-point monitoring and One-point historical trend ······························ 7
4.4.1 Display of Multi-point monitoring ······························································· 7
4.2.2 Display of One-point historical trend ···························································· 7
5. Multi-point monitoring ················································································ 8
5.1 Operation ································································································ 8
5.2 Operating the navigating buttons ····································································· 9
5.3 Quit ······································································································· 9
5.4 Write ····································································································· 9
5.5 Monitoring of the data in the table ······· ···························· ···························· · 10
5.6 Report format of the stored data ··································································· 10
5.6.1 Creation of table format ·········································································· 11
5.6.1 Creation of graph format ········································································· 12
5.7 Quit of the Multi-point monitoring ································································· 12
6. One-point historical trend ··········································································· 13
6.1 Operating the One-point historical trend ·························································· 13
6.2 Quit of the One-point historical trend ······························································ 13
7. Real-time measurement ·············································································· 14
7.1 Measurement preparation ··········································································· 14
7.2 Setting ································································································· 15
7.3 Measurement ························································································· 16
7.4 Stop, Save and Replay ·············································································· 17
7.5 Alarm summary ······················································································ 18
7.6 Quit of Real-time measurement ····································································· 19
8. Parameters in saving ·················································································· 20
8.1 Common parameters ················································································ 20
8.2 Parameters on real-time measurement ······························································ 20
-C1-
Page 4

INST.No.INE-394-0P2 Software version 1.3
1. Operation environment
1.1 Operation environment lists
Hardware
and
software
Contents and Condition
CPU
OS
Memory
CD-ROM drive
Hard disk
Pentium 90 MHz or faster (*1)
Windows95, Windows98, WindowsNT4.0
Windows2000, Windows XP (*2)
At least 16 MB (More than 32 MB recommended)
This memory capacity is the mini mum volume of memory required
for operating this software independently. More memory is
recommende d.
A CD-ROM drive is required for installing this software.
One or more hard disk drives of at least 20 MB free space
(It may be built-in or externally attached.)
Communications
port
Color high-resolution analog RGB.
Display
Printer
Software
This software is a 32-bit application software compatible to Windows95/98/NT4.0/2000/XP (*2).
It can be executed parallel to other applications but its normal operation is not guaranteed in all the
conditions.
It may not work properly in the following situations.
(1) When you have run any 32-bit application software not compatible to Windows 95/98/NT4.0/2000/XP (*2).
(2) When other application software have bugs causing trouble s in Windows.
(3) When other applications have used a large part of CPU or memory. (Especially software related to images.)
Compatible to applied resolution 640 480, 800 600, 1024 768, 1280 1024 dots and
more than 256 colors
Compatible to Windows. (*2)
If Microsoft Excel (*3) has been installed in your personal computer , data can be saved i n the
file of Excel format.
However, the program will run, even if Excel (*3)has not been insta lled.
The communications ports supported by Windows. (*2)
One communications port from COM1 to COM10 is used.
(4) When the computer has a special built-in hardware or software drive.
(5) When multiple applications have been activated and the performance of Windows (*2) has been degraded.
*1: Pentium is registered trademarks of Microsoft Corporation in the USA.
*2: Windows95/98/NT4.0/2000, XP are registered trademarks of Microsoft Corporation in the USA.
*3: Microsoft Excel is registered trademarks of Microsoft Corporation in the USA.
-1-
Page 5
INST.No.INE-394-0P2 Software version 1.3
l
M
y
d
I
K
A
pply
n
Yes
y
d
t
,
Y
l
l
L
2. Installing and Uninstalling
2.1 Installing your software program
2.1.1 Automatic setup program
1) Insert the software CD-R into your computer. (OS: Windows95/98/NT4.0/2000/XP)
2) The Set up Wizard will open automatically. Follow the instructions on your screen.
2.1.2 When the setup is not started autom atically
1) Insert the software CD-R into your computer. (OS: Windows95/98/NT4.0/2000/XP)
2) Click the [Start] button, point to [Settings], and then click [Control Panel].
3) Double-click [Add/Remove Programs].
4) After clicking [Install] in the following screen, the Setup Wizard will open automatically.
Follow the instructions on your screen.
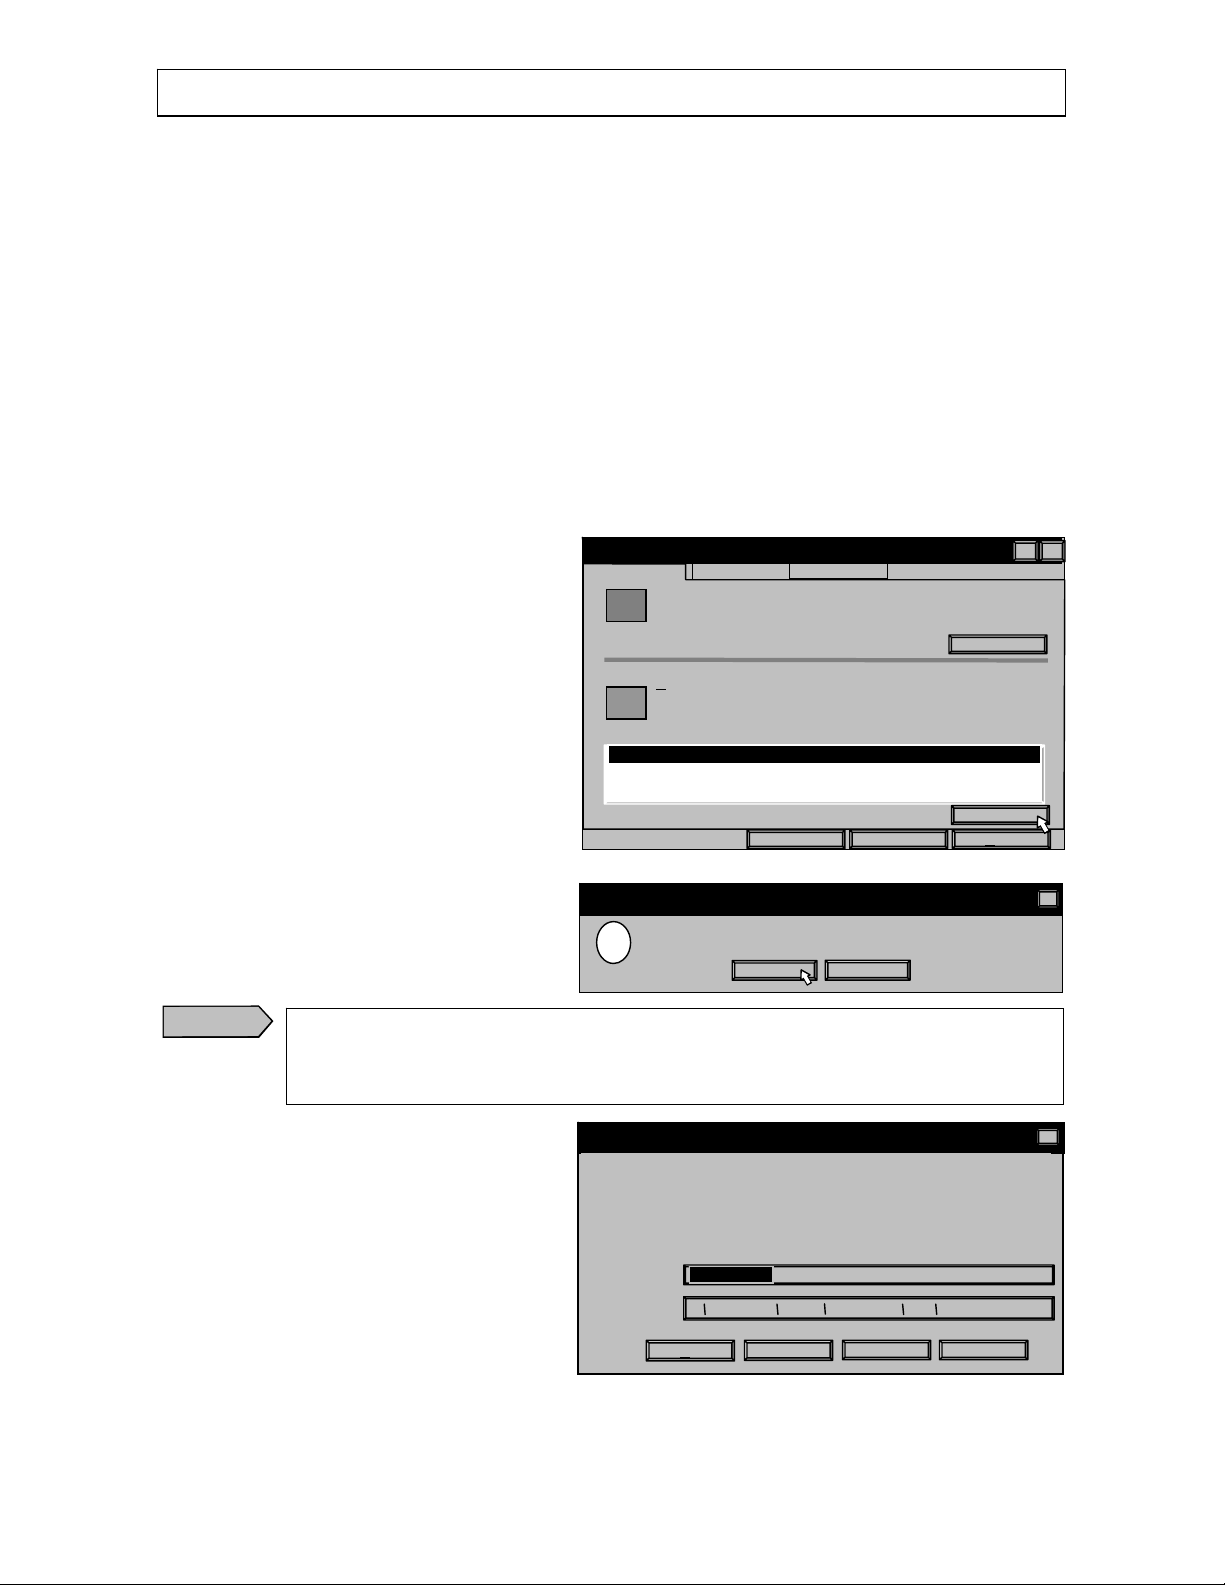
2.2 Uninstalling your software program
1) Click the [Start] button, point to [Settings],
and then click [Control Panel].
2) Double-click [Add/Remove Programs].
3) Select the application software from the list
in the right screen and click [Add/Remove
Programs].
4) Click the [Yes] button in the following screen.
Caution
The following screen may appear depending on computers. If there may be other application
using the file or if you are not sure, click the [No] button, and if you are sure there are no other
application using it, click the [Yes] button.
Add/Remove Programs Properties
O
Yes To Al
Startup Disk
nstall…
Add/Remove
Cancel
No
No No To Al
Install/Uninstal
ir vxg1e
Confirm File Deletio
?
Remove shared File ?
This system indicates that the following shared file is no longer used b
any programs. If any programs are still using this file and its remove
components, those pr ograms ma y not func tion. Are you s ure you w an
Leaving this file will not harm yo ur system .If you are not s ure what to
do
it is suggested that you choose to not remove this shared
File Name:
Located in:
Windows Setup
To install a new program from a floppy disk or CD-RO
drive, click Install.
The following software can be automatically removed b
Windows. To remove a program or to modify its installe
components, select it from the list and click Add/remove.
Are you sure you want to completely remove the selected
application, and all of its components?
IDAPI32.DL
C: program Files Borland Common Files BDE
es
-2-
Page 6
INST.No.INE-394-0P2 Software version 1.3
s
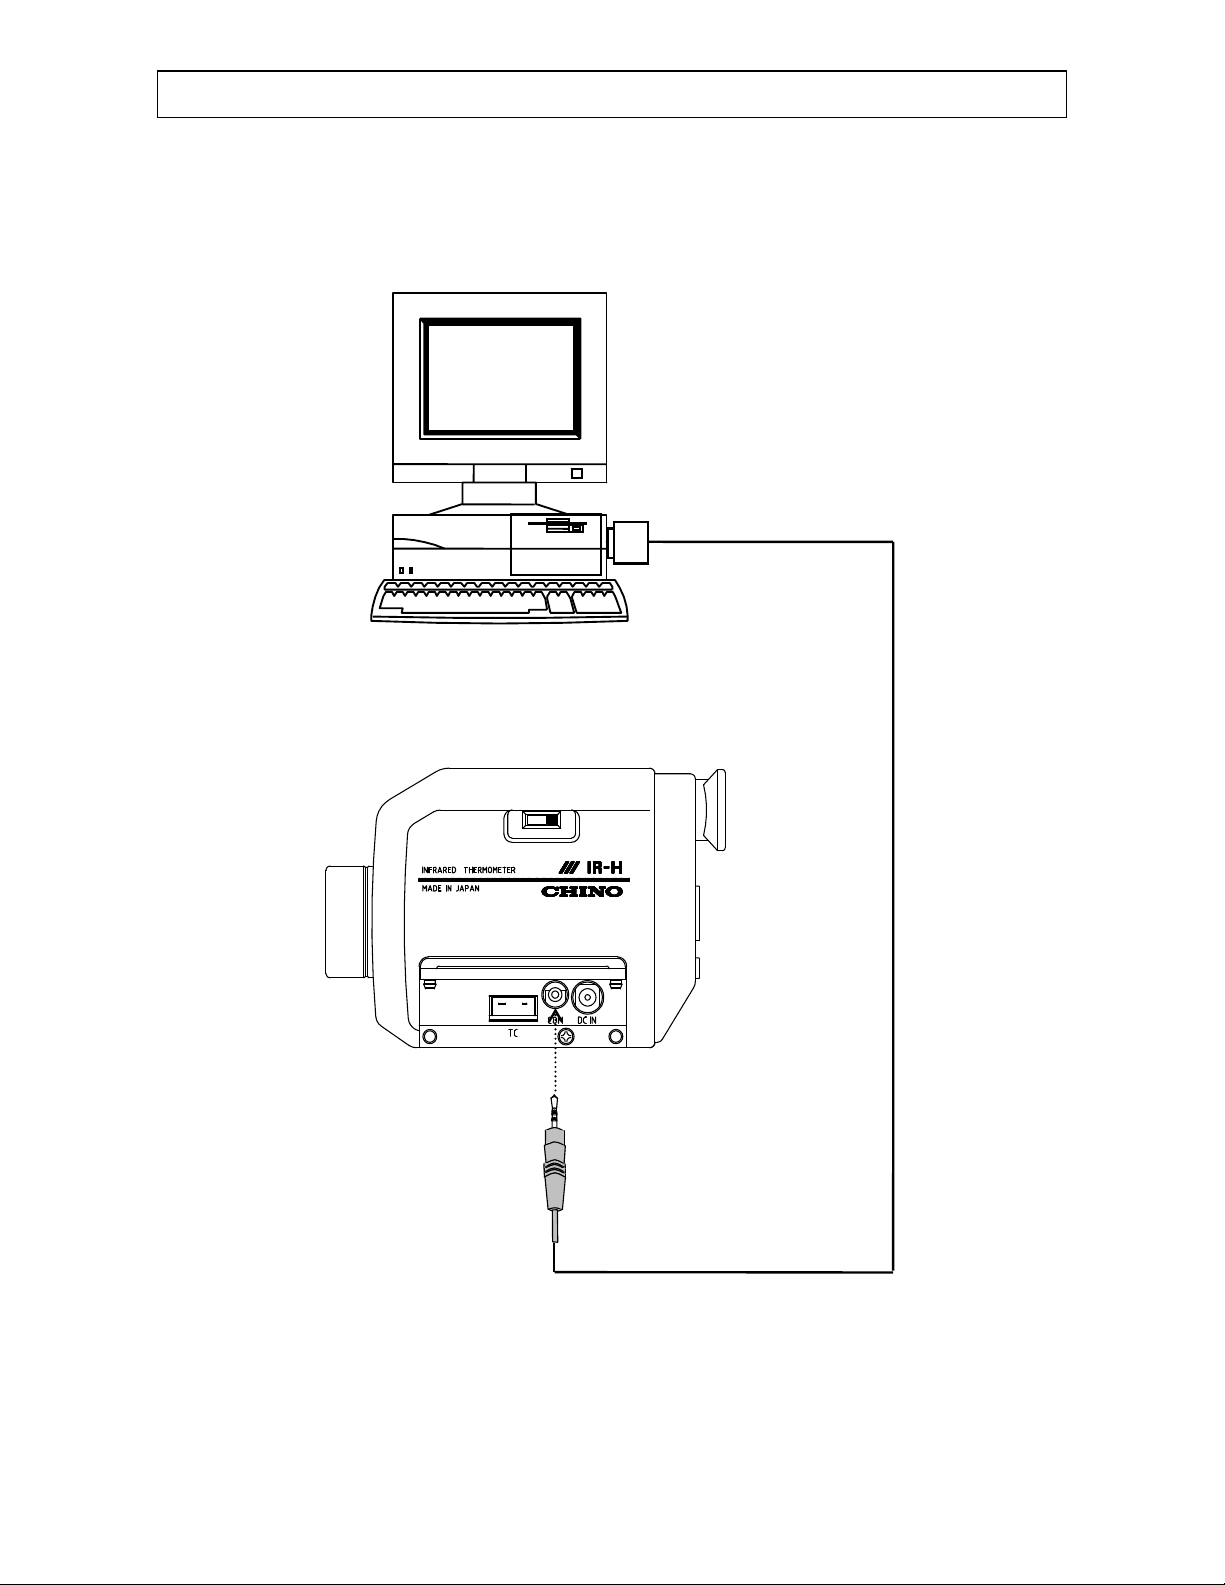
3. Connections with IR-H serie
Connect your IR-H series and your personal computer with the RS-232C cable (Model for IR-VHC) attached
with this software package.
[Personal computer]
D-SUB 9pin
RS-232C cable
(Model for
IR-VHC)
[IR-H series]
-3-
Page 7
INST.No.INE-394-0P2 Software version 1.3
t
e
n
s
R
-
e
m
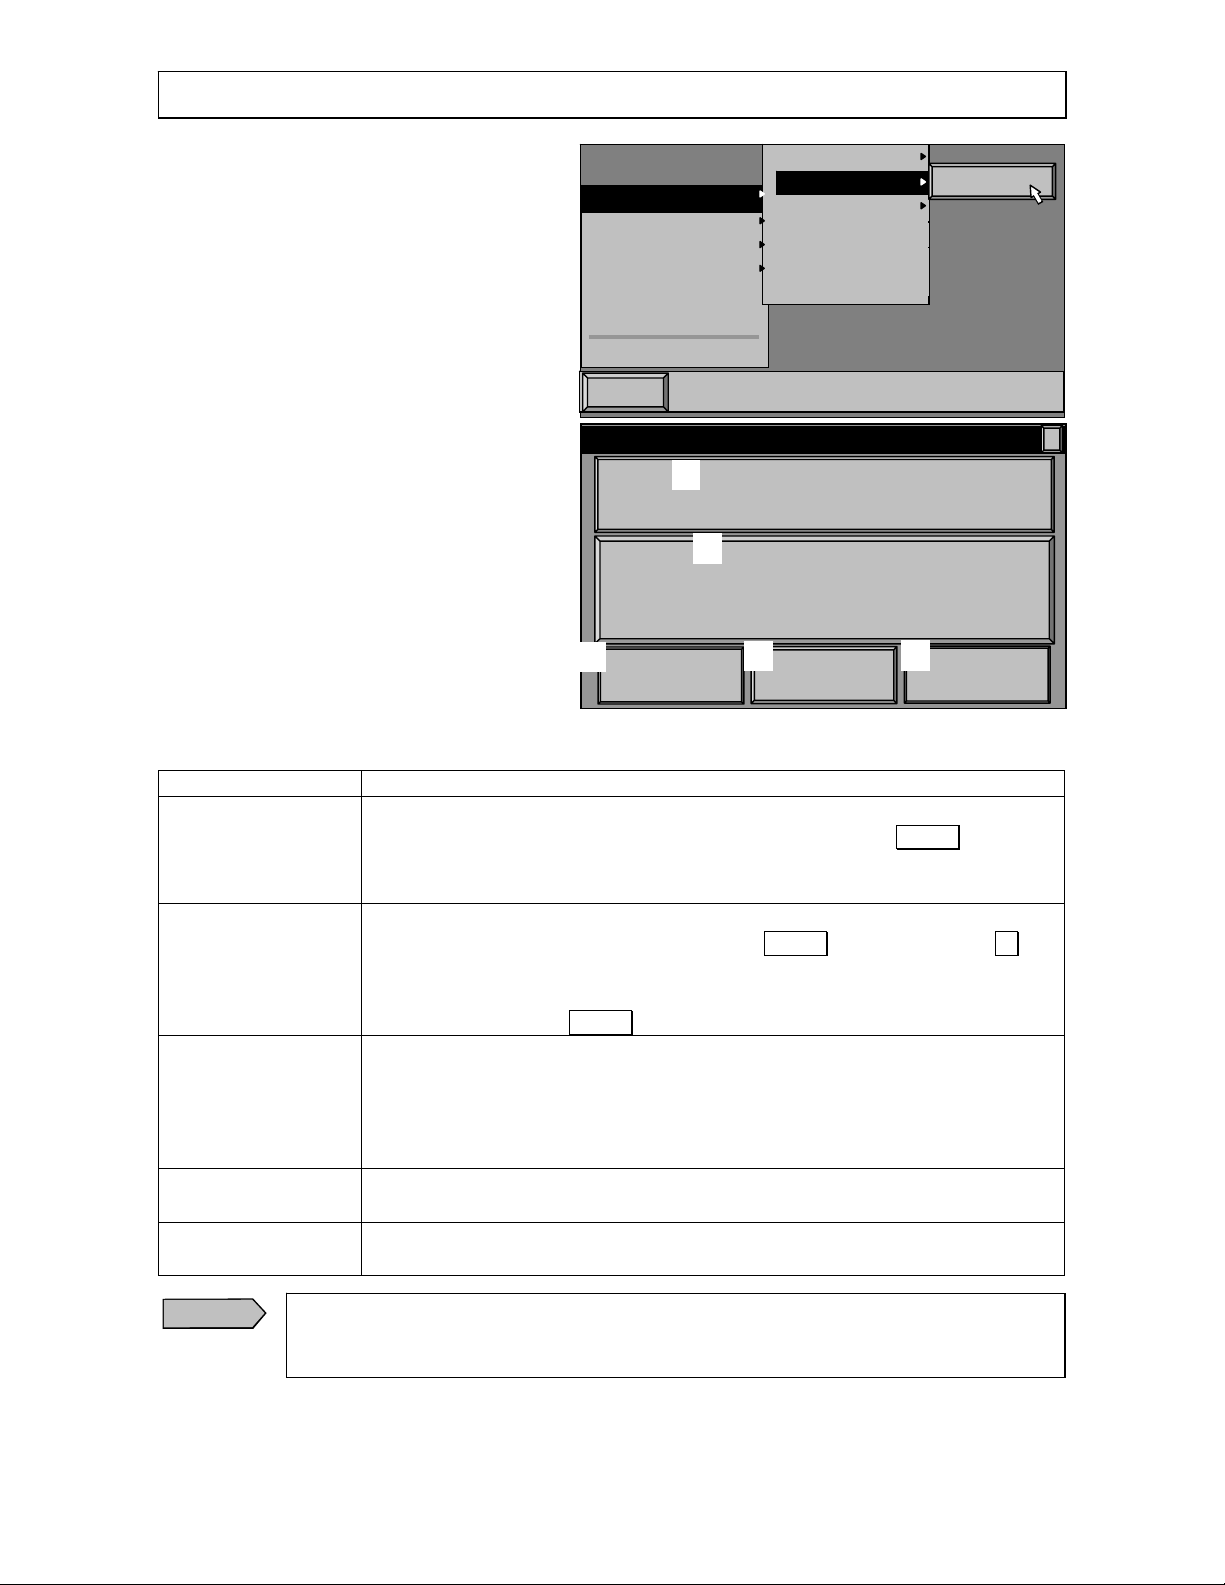
4. Operation
4.1 Start up
1) Click [Start] button, point to [Program],
point to [ir_vxg1e], and then click
[IR_H_E], or click [IR_H_E .exe] in the
folder being installed on Explorer.
2) [IR-H Data Logging Software] splash
window will appear for a while and then the
menu screen will appear.
3) The menu screen has two large buttons and
three small buttons. You can enter into each
mode by clicking a button.
Star
I
H Data Logging Softwar
[1]
Push the MEAS key to turn the powe r supply of the thermo-
meter on and set the communica tion mode to "Co
[2]
Push the MEAS key while pressi ng the CONT key to
turn the power supply on. Afte r setting the communic ations
mode to the "trns" mode, start the measurement.
Accessories
ir_vxg1
StartUp
Microsoft Exchange
MS-DOS Prompt
Windows Explorer
Historical Data and Trend
Real-time Trend
IR_ H_E
" mode.
[3]
Communications/
Engineering
Units
4.1.1 Kinds of buttons and contents in the menu sc reen
Kinds of buttons Contents
[1] Historical data and
Trend
[2] Real-time trend
[3] Communications/
Engineerin g units
[4] Emissivity table
[5] Version
Caution
.
Make sure to set the communicatio
[Communications/Engineering Units] button prior to recall stored data or start a
measurement.
It is the mode for recalling the data being stored in your IR-H series. If you select
this mode, you are not able to return to the menu screen. Press MEAS k ey to turn
the power supply of your IR-H series on. Then set the communications mode of
your IR-H series to "com".
It is the mode for measuring temperature in real-time. If you select this mode, you
are not able to re turn to the menu s c reen. Pr ess MEAS k ey whil e pressing ▽ key
to turn the power supp ly of your IR-H series on. (The IR-H series bec omes the
continuous measurement mode.) Set the communications mode of your IR-H series
to "trns" and then press MEAS key again to start a measurement.
For the communications, select the serial port, COM1 or COM2, of your personal
computer.
For the engineering unit, select C or F. (It should conform to the engineering unit
being set on you r IR-H series. )
Click OK button. The screen will return to the menu screen.
The emissivity table is displayed for your reference. (Click a tab for the wavelength
of your IR-H series .) Click [OK] button to return to the menu screen.
The version number is displayed. By clicking [OK] button to return to the menu
screen.
[4]
Emissivity
[5]
Version
port and the engineering unit by
-4-
Page 8
INST.No.INE-394-0P2 Software version 1.3
K
?
Read
S
-
p
e-p
o
m
m
ge
m
m
e
)
)
IR-H D
d
m
l
-
d
/
y
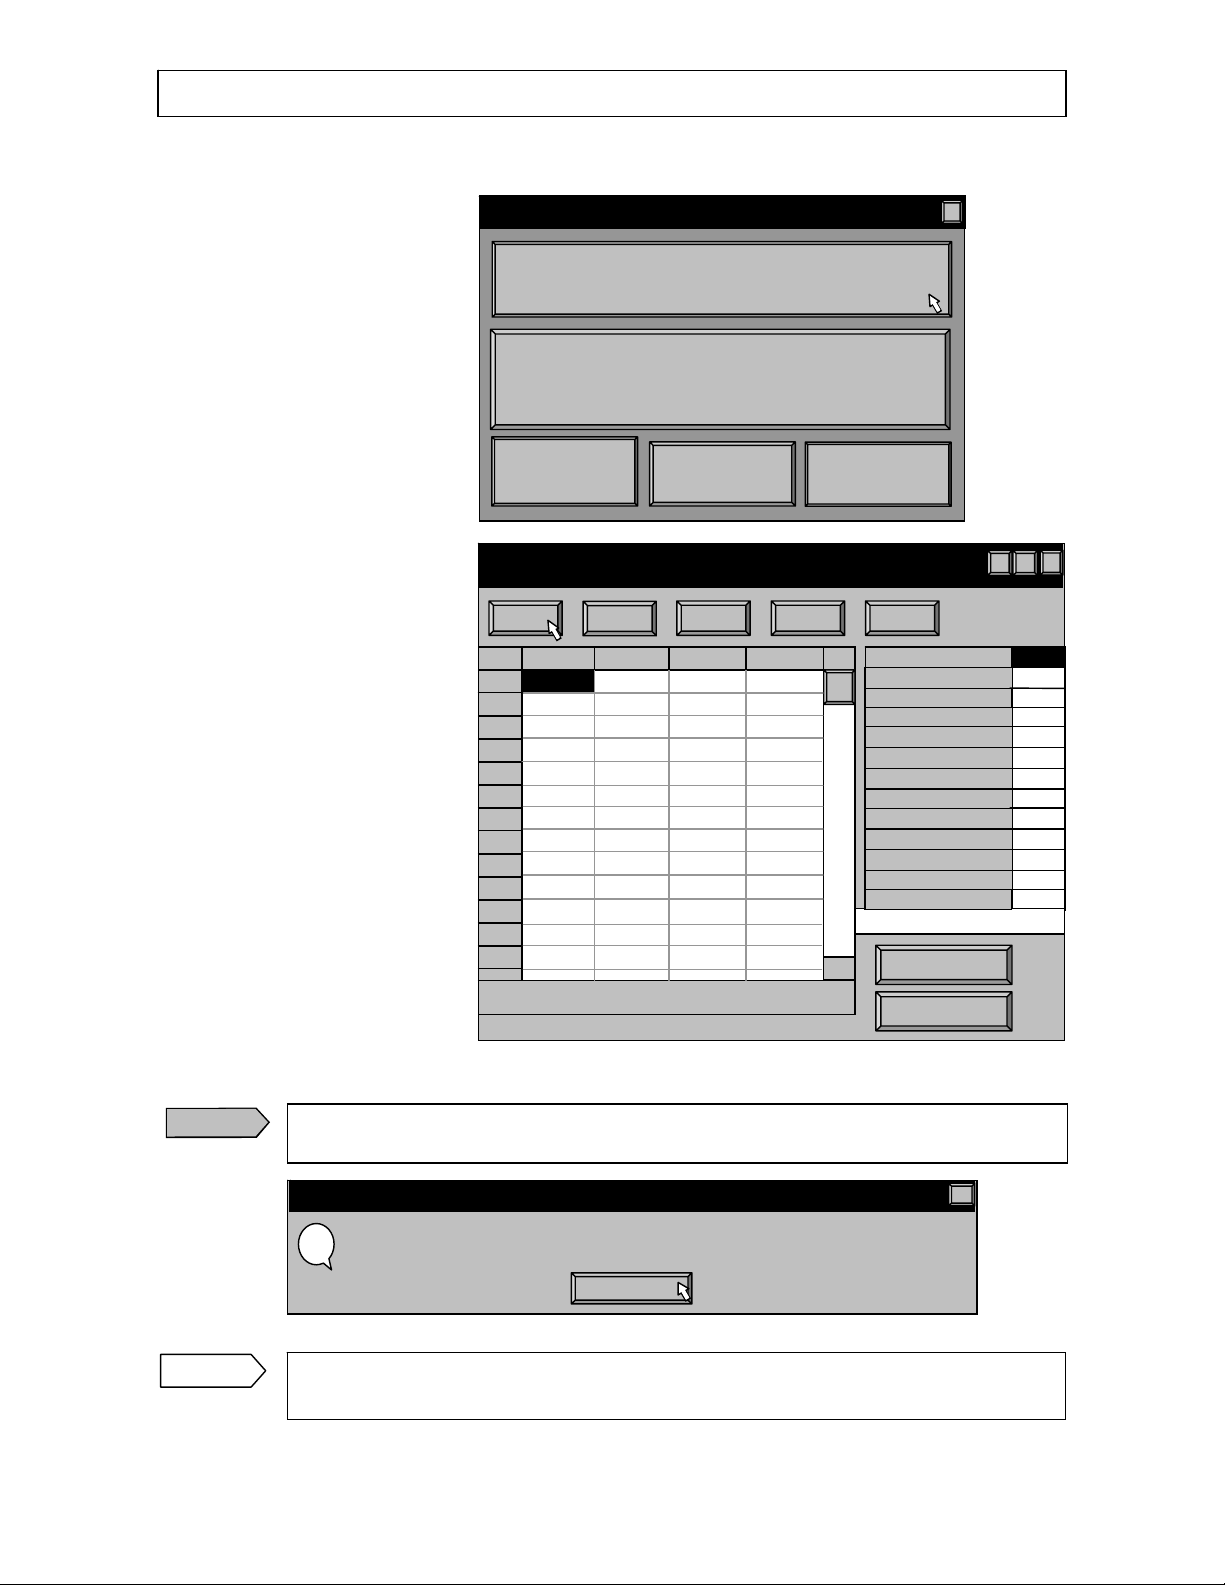
4. Operation
4.2 Recalling stored data
1) Connect your thermometer and
your personal computer.
2) By clicking [Historical Data
and Trend] button in the menu
screen, [Read data] dialog box
will appear.
3) Turn the power supply of your
thermometer on, and click
[Rea d] button.
4) If the communications is normal,
data will be filled in the table on
the right side (From [Day of
readout] to [Number of
Data]) and then the displays of
[Now readi ng…],
[Progress s tatus display bar],
and [ seconds remains]
will appear on the lower panel.
Next, data will be fi lled in the
table on the left side and finally
the remaining data for the table
on the right side (From [# of
effective data (IR)] to [# of
effective data (TC)]) will be
filled in.
Caution
If the communications is not normal, the message box shown below will appear.
Click [OK] button and follow the instructions in the m essage box.
Confirm
Communications abnormal !!! Check the settings and connection of thermometer. If you
cancelled the communications, turn the power supply of the thermometer on again.
Remarks
As the data recalling is one time only during this program runs, you need to start up this
program each time you recall data from a file or through communications.
ata Logging Software
Push the MEAS key to turn the power supp ly of the thermo-
meter on and set the communication mode to "Co
Push the MEAS key while pressing the CONT key to
turn the power supply on. After sett ing the communications
mode to the "trns" mode, start the m easurement.
Communications
Engineering Unit s
Read Data
N
Status
1
2
3
4
5
6
7
8
9
10
11
12
13
Historical Data and Tren
Rea
time Tren
Emissivit
Table
ave
Emissivity
Thermometer
O
Thermocouple
" mode.
Version
Day of readout
Time of readout
Model
Engineering units
Number of data
# of effective data (IR
Maximu
Minimu
Avera
Maximu
Minimu
Averag
# of effective data (TC
Multi
On
(IR)
(IR)
(IR)
(TC)
(TC)
(TC)
oint
oint
-
□
-5-
Page 9

INST.No.INE-394-0P2 Software version 1.3
s
e
l
K
s
l
4. Operation
4.3 Saving the stored data
Save the data in the table into Excel or a file if necessary.
1) By clicking [Excel] button (or by
pressing [E] key on your
keyboard), [Save as…] dialog
box will appear. Enter a file
name and click [Save] button.
The file extension "xls" will be
assigned automatically.
Then the data will be exported to Excel with the displays of [Now exporting…] and
[Progress status displ ay bar].
Caution
This function cannot be executed if Excel has not been installed. If Excel ha s not been
installed, [Failed to export. Confirm if Excel97 is installed.] message box will appear.
2) By clicking [Save] button (or by
pressing [S] key on your
keyboard), [Save as…] dialog
box will appear. Type a file
name and click [Save] button.
Then the data will be saved with
the displays of [Now saving…]
and [Progress status display
bar]. The file extension "ahc"
will be assigned automatically.
This file is used in the process of
replaying the stored data as
shown in the next paragraph.
3) By clicking [Open] button (or by
pressing [O] key on your
keyboard), the message box
shown below will appear. Click
[OK] button and then [Open]
dialog box will appear. Select a
file name with the file extension
"ahc" and click [Open ]button.
The stored data in the file
selected will be displayed.
To return to the original scr een,
click [Cancel] button.
Read Data
Read Excel Save Open Close
Save A
Save in:
File name:
Save as type: IR-H File (*.xls)
Save A
Save in:
File name:
Save as type:
Confirm
Are you sure to clear the data being displayed?
My Document
My Document
|
|
IR-H File (*.ahc)
O
Cancel
□
-
Sav
Cance
Save
Cance
?
?
-6-
Page 10

INST.No.INE-394-0P2 Software version 1.3
r
d
K
l
K
l
4. Operation
4.4 Display of Multiple-point monitoring and O ne-point Historical Trend
By using the read data, you can select multiple point monitoring or on e point historical trend display.
On the multiple-point monitoring, the sequential measured data by corresponding measured number and
measured ob jects are accu mulated in a d atabase tab le, and displayed in a report of table format or graph
format.
On the one point historical trend, data is displa yed in a graph format as a trend of same measu red object.
4.4.1 Display of Multiple-point monitoring
1) By clicking [Multiple-point monitor] button on the lower right
(or by pressing [M] key on your keyboard), [Multi-point
Monitor (30 points)] screen will appear.
2) By clicking [Close ] button or X button (or by pressing [C] key
on your keyboard), the message box shown below will appear.
By clicking [OK] button, the program will quit and the screen
will return to the menu screen of Windows.
By clicking [Cancel] button, the message will disappear.
Multiple point monitor
One point tren
Confirm
Are you sure to quit the program?
O
Cance
4.4.2 Display of One-point Historical Trend
1) By clicking [One-point Trend] button (or by pressing [T] key on
your keyboard), [One-point Historical Trend] screen will
appear.
2) By clicking [Close ] button or X button (or by pressing C key on
your keyboard), the message box shown below will appear. By
clicking [OK] button, the program will quit and the screen will
return to the menu screen of Windows.
By clicking [Cancel] button, the message will disappear.
Multiple point monito
One point trend
Confirm
Are you sure to quit the program ?
O
Cance
-7-
Page 11

INST.No.INE-394-0P2 Software version 1.3
Close
Name
-
p
t
-
p
i
-
O
bj
s
0
e
□
-
o
D
C
G
e
p
(4
)
5. Multi-point monitoring
5.1 Operation
Mult
1) By clicking [Objects[ button (or by pressing
[O] key on your keyboard) on [Multi-point
Monitor (30 points)] screen, [Objects]
dialog box will appear.
2) Enter names of measuring objects or
monitoring places and enter high and low
alarm set-points.
Current
record
Enter a name
in this box.
Enter a high
alarm set
oint
Enter a low
alarm se
oint
3) There are navigating buttons at the upper
right of the screen. These buttons are to select
the records in the database table on the left
side. The name of the button is displayed
when the mouse is placed on that button for a
while. The functions are as follows.
point Monitor(30points)
ect
Date Time Point 01 Point02 P
Lastrecord
(3) Next record
(2) Prior record
Write Excel Delet
Point
Point 06 ~ 10
Point 11 ~ 15
Point 16 ~ 20
Point 21 ~ 25
Point 26 ~
R
(5) Post edit
(To store data)
ata
ort
Table
raph
lose
(1) First record
Point Name
Point 01
Point02
Point03
Point04
Point05
Point06
Point07
Point08
Point09
Point10
Point11
Point12
Point13
Point14
HighAlarm
LowAlarm
Point
High
Low
□-
Button name Function
(1) First record Selects the current record to the first
record (Point01).
(2) Prior
record
(3) Next
record
Selects the current record to the previous
record.
Selects the current record to the ne xt
record.
(4) Last record Selects the current record to the la st
record (Point30).
(5) Post edit Writes the changes in current record to
the database.
1~ 0 5
30
-8-
Page 12

INST.No.INE-394-0P2 Software version 1.3
s
Name
m
i
-
p
r
(30p
)
O
b
e
E
D
5. Multi-point monitoring
5.2 Operating the navigating buttons
The entering method of names and alarm setpoints is as follows.
However, you do not need to enter names and
alarm set-points if not necessary.
1) By selecting the current record to [Point01] (the default setting), "Point01" is displayed at [Point]
column in the first line of the panel on the right side (ash background).
2) Move the cursor to [Name] (white ground) column and enter a name through the keyboard. (up to 20
characters)
3) By pressing [Tab] key on your keyboard, the cursor will move to [High Alarm] column.
4) Enter a high alarm set-point in integers.
5) By pressing [Tab] key on your keyboard, the cursor will move to [Low Alarm] colum n.
Object
Point Name HighAlarmLowAlar
Point01
Point 01
Point02
Point03
Point04
Point05
-
Point Point01
□
6) Enter a low alarm set-point in integers.
7) By click [Post edit] button, the entered data will be stored.
8) Click [Next record] button to set the current record at [Point02].
9) Repeat the operation of from 2) to 7) for setting up to other Point num ber required.
5.3 Quit
By clicking [Close] button or [X] button (or by pressing [C] key on your keyboard), the screen will return t o
[Multi-poi nt Monitor (30 points)] screen.
5.4 Write
By clicking [Write] button (or by pressing [W]
key on your keyboard), the data having read
from your thermometer will be written to the
data table in sequence from [Poi nt01].
Remarks
Caution
If the number of stored data is less than 30, the data up to that number will be written.
Even if the number of stored data is more than 30, the data up to 30 will be added.
Only the stored data from number 1 to 30 in your thermometer are used.
Moreover, the stored data from an in-between number can not be written.
Mult
oint Monito
jects Writ
oints
xcel
-
elete
□
-9-
Page 13

INST.No.INE-394-0P2 Software version 1.3
b
j
0
e
l
C
(5) Delete d
(4)
5. Multi-point monitoring
5.5 Monitoring of the data in the table
The data in the table can be monitored by usin g the navigating buttons and a scroll bar.
1) The functions of navigating buttons are as foll ows.
Multi-point Monitor (30points)
(1) First record
O
ects
Writ
Date Time Point 01 Point02 Point03 Point04
Button name Function
(1) First record Selects the current record to the first record (First line).
(2) Prior record Selects the current record to the previous record.
(3) Next record Selects the current record to the next record.
(4) Last record Selects the current record to the last record (Newest data).
(5) Delete record Deletes the current record (for 1 line).
(6) Deletes all stored data. Deletes all records.
(2) Prior record
Exce
(6) Deletes all stored
-
Delete
Point 01 ~ 05
Point 06 ~ 10
Point 11 ~ 15
Point 16 ~ 20
Point 21 ~ 25
Point 26 ~ 3
Report Preview
Graph
lose
□
ata
Last record
(3) Next record
Scroll bar
-10-
Page 14

INST.No.INE-394-0P2 Software version 1.3
C
5. Multi-point monitoring
5.6 Report format of the stored data
The stored data can be created and displayed in a report format, a table format or a graph format.
5.6.1 Creation of table format
Multi-point monitor(30points)
Date Time Point 01 Point02 Point03 Point04
(1) Zoom to fit
(2)100%
-
lose
Button name Contents
(1) Zoom to fit Displays a report in whole page.
(2) 100% Displays a report in normal 100% size.
(3) Zoom to width Displays a repo rt in full ho rizontal wi dth of pape r.
(4) First page Displays the first page.
(5) Previous page Displays the previous page.
(6) Next page Displays the n ext page .
(7) Last page Displays the last page.
(8) Printer setup Sets up a table-format report.
(9) Print Executes printing.
(10) Save Report Stores a report.
(11) Load Report Recalls a stored report.
1) A report is group ed at every 5 points. Select the r equired group in
[Dat a] column.
2) Select the report format, table or graph, by pressing [Table] button or
[Graph] button. (Otherwise, press [T] key or G key on your
keyboard.)
3) A report preview will be displayed, print or store if necessary.
4) By clicking [Close] button or [X] button (or by pressing C key on your
keyboard), the scree n will return to [ Multi-point Monitor (30 points)]
screen.
□
Point 01 ~ 05
Point 06 ~ 10
Point 11 ~ 15
Point 16 ~ 20
Point 21 ~ 25
Point 26 ~ 30
Report Preview
(3) Zoom to width
(11) Load Report
(10) Save Report
(9) Print
(8) Printer setup
(7) Last page
(6) Next page
(5) Previous page
(4) First page
Table
Graph
-11-
Page 15

INST.No.INE-394-0P2 Software version 1.3
C
e
p
[
]
―
0
5. Multi-point monitoring
5.6.2 Creation of graph format
Point 26 -30 Historical Trend
Print
Print
Point 26:
Point 27:
Point 28:
Point 29:
Point 30:
ºC
erature
Tem
1) A report is grouped at every 5 points. Select the required group in [ Data]
column.
2) Select the report for mat, table or gr aph, by pressing [Table] bu tton or
[Graph] button. (Otherwise, press T key or G ke y on you r keyboa rd.)
3) The report preview will be displayed , print or store if necessar y.
-
los
― Point 26
― Point 27
― Point 28
― Point 29
Point 30
□
Data
Point 01 ~ 05
Point 06 ~ 10
Point 11 ~ 15
Point 16 ~ 20
Point 21 ~ 25
Point 26 ~ 3
Report Preview
Table
Graph
Button name Details
Print Executes printing.
4) By clicking Close button or X button (or by pressing [C] key on your
keyboard), the screen will return to [Multi-point Monitor (30 points)]
screen.
5.7 Quit of the Multi-point Monitoring
By clicking [Close] button or X button (or by pressing C key on your keyboard) on [Multi-point Monitor
(30 points)] screen, the screen will return to [Read Memory] screen.
-12-
Page 16

INST.No.INE-394-0P2 Software version 1.3
e
-
p
P
C
□
p
K
P
C
□
p
K
C
6. One- point historical trend
6.1 Operating the One-point historical trend
On
Point Historical Trend
1) By clicking [One-point Trend] button on
the lower right (or by pressing [T] ke y o n
00/04/20
your keyboard) on the [Read Memory]
screen, [One-point Historical Trend]
screen will appear.
Temperature[ºC ]
2) At first, all read data will be displayed in
graph format. (All points have been
selected in [Data] column on the upper
right.) You can display the data at every
Data Number
100 points or every 10 points on [Data]
column.
One-Point Historical Tr end
00/01/01
3) When [100 points] or [10 points] is
selected, a track bar for scrolling will
appear in the panel below. Drag the slider
by left-clicking the mouse for selection of
the required point.
Temperature [ ºC]
4) When [10 points] is selected, digital values
Data Number
are displayed with plotted data.
One-Point Historical Tren d
5) Type a title through your keyboard on
[Title] column. By pressing [Enter] key
on your keyboard and clicking [OK]
button, the title will be displayed on the left
side of date display in the upper part of
graph.
Temperature [ ºC]
Data Number
6) By clicking [Print] button (or pressing [P] key on your keyboard), one copy of the graph being displayed
will be printed in landscape orientation. Print the graph by specifying the printing orientation of your
printer to landscape. (You d o not need to cha nge other settings of your printer.) For printing several copies,
repeat the same operation up to the number of copies.
-
Data
All points
100 points
10
oints
rint
lose
Data
All points
100 points
10
oints
Title
O
rint
lose
□
-
Data
All points
100 points
oints
10
Title
O
Print
lose
6.2 Quit of the One-point historical trend
By clicking [Close] button or X button (or by pressing [C] key on your keyboard) on [One-point
Historical Trend] screen, the screen will return to [Read Memor y] scree n.
-13-
Page 17

INST.No.INE-394-0P2 Software version 1.3
0
0
0
g
K
l
[
7. Real-time measurement
7.1 Measurement preparation
Confirm the model numbe r
1) Connect your thermometer and your personal
computer.
2) By clicking [Real-time Trend] button in the
menu screen, [Real-time Trend] screen and
[Confirm the model number] dialog box
will appear together.
3) Following the message in [Confirm the
model number] dialog box, confirm that the
model number in [Model] column on [Real-
time Trend] screen is same as the model
number of your thermometer. After the
confirmation, by clicking [OK] button,
[Confirm the model number] dialog box
will disappear and [Real-time Trend]
screen will be active.
Remarks
If the model number is not same, click [Parameters] button (or press [M] key on your
keyboard). [Parameters] dialog box will app ear. Select the correct model nu mber listed in
[Model] column. By clicking [OK] button or X button, the screen will return to [Real-ti me
Trend] screen.
Remarks
In order not to show
[Confirm the model
number] dialog box, enter a
check in [Don't show this
dialog again ] check box. For
canceling the check, click at
the check box again.
The check can be also
cancelled by clicking
Cancel] button with the box
Remarks
Various para meters c an be set in [Parameters] dialog box. The setting function can be used
durin
measurement, too.
Confirm whether the model number being
displayed in down–right table is the same
model number of the thermometer you are
using. If not select the correct model number
by pressing the Parameters button in the aboveleft.
Don’t show this dialog again.
Parameters
Range
Maximum
Minimum
Alarm
High
Low
Confirm the model numb er
Confirm whether the model number being
displayed in down–right table is the same
model number of the thermometer you are
using. If not, select the correct model number
by pressing the Parameters button in the aboveleft.
200
60
200
600
Don’t show this dialog again.
Interval(s)
Day savings time
Model
IR-HI
IR-HS
IR-HQH
OK
OK
Cancel
1.0
O
Cance
-14-
Page 18

INST.No.INE-394-0P2 Software version 1.3
w
7. Real-time measurement
7.2 Setting
Various param eters ca n be set i n [Param eters] dia log box , except m odel num ber.
1) The temperature axis of display chart can be set in [Range] column.
The values displayed in [Maximum] and [Minimum] columns become
the maxi mum and minimu m of tempe ratur e axis. Se t the val ues by th e
up/down buttons on the right side of display window (10-degree
increment).
2) The measuring interval is able to set on your personal computer side by
the up/down buttons in [Interval(s)] column. The measuring interval can
set from the shortest 0.5 second to the longest 10 seconds by 0.1-second
increment. (Default value: 1.0 second)
3) If [Daylight savings time] check box is checked, the time axis of graph
becomes the daylight savings time.
4) The alarm set-points can be set in Alarm column. Set the values by the
up/down buttons on the right side of High and Low columns (10-degree
increment).
5) After you set necessary parameters, click either [OK] button or [X] button.
The screen will return to the [Real time trend] scree n.
6) Press MEAS key while pressing ▽ key to turn the power supply of your
IR-H on. (The IR-H becomes the continuous measurement mode.)
Press MEAS key again to start a measurement.
Range
Maximum
Minimum
Interval(s)
Interval(s)
Alarm
High
Lo
2000
600
1.0
Day savings time
1.0
Day savings tim e
-50
-15-
Page 19

INST.No.INE-394-0P2 Software version 1.3
C
p
p
[
]
º
(
º
7. Real-time measurement
7.3 Measurement
1) By clicking [Start] button (or by pressing A ke y
on your keyboard), the measurement will start.
Remarks
Remarks
When “uFL” is displayed in the
main display of your IR-H (when
the measured temperature doe s not
reach to the measuring range) or
when “oFL” is displayed (when the
measured temperature exceeds the
measuring range), the following
data will be displayed and plotted on
chart.
By your select ion of [on] (ena bled)
Model
IR-HI
IR-HS
IR-HQH
Real-time Trend
at [Thermocouple
enabled/disabled selection] with
the sub marker “Tc” (Ref. 5.6.5 in
the instruction manual for IR-H) of
your IR-H, the temperature
Parameters Start
measured by a thermocouple will be
displayed, too.When “uFL” is
displayed in the sub display (when
the measured data measured by a
thermocouple does not reach to 50ºC or -58ºF) or when “oFL” is
displayed (when the measured data
exceeds 1220ºC or 2228ºF), 99999
will be displayed and the data will
not be plotte d on char t. If yo u select
“oFF” (disabled), “99999” will be
displayed and the data will not be
plotted on chart, too.
2) You can change the chart moving speed by selecting a time per screen in
[Resolution/screen] column on the right side.
3) If the mea su r ed da t a ex cee ds the h ig h a la rm se t-po in t, [ High] column on
the upper right s ide is display ed in red color. If the measured d ata does
not reach to the low alarm setpoint, [Low] column is displayed in blue
color. The alarm log data (Day/time, measured temperature, alarm type)
is stored in the alarm summary automatically.
Remarks
Caution
Remarks
The maximum num ber of da ta is 10,0 00 data. When the number o f data beco mes 10,00 0 data,
the message shown below will appear and the data loggin g will be stopped forcibly.
[Out of data area !!! Measurement w as stopped. For restarting the measurement, click
Start button again after storing data.]
If the chart is not displayed in the screen after the measurement starts, check your thermom eter or
the connection of communications cable.
After the measurement stops, you can measure again. On data saving, the re-measured data is
stored in the same file. As the trend graph is displayed as a pol ygonal line graph, the data before
stopping measurement and the data after re-measurement a re displayed by connecting with
straight lines for the tim e period of no data logging.
Display list of IR-H “ UFL” “OFL”
Display
Underflow Overflow
1020 (ºC) or
1850
2020 (ºC) or
3650 (ºF)
3020 (ºC) or
5450 (ºF)
1
1 minute
5 minutes
10 minutes
1 hour
2 hours
Model
Emissivity
Data count
lose
Resolution/Screen
10 seconds
ºC
erature
Tem
280 (ºC) or
550 (
580 (ºC) or
1090 ( ºF)
380 (ºC) or
730 (ºF)
Sto
F)
Excel Open Save Print Alarm Summ
00:00:00
1 minute
5 minutes
10 minutes
1 hour
2 hours
Low High
Low High
F)
-
High
Resolution/
0 seconds
□
-16-
Page 20

INST.No.INE-394-0P2 Software version 1.3
e
[
]
C
lOp
S
P
m
Temperature[
℃
]
0
7. Real-time measurement
7.4 Stop, Save and replay
1) By pressing [Stop] button, the measurement
stops and Arrow (scroll) buttons will appear
on the lower right side. A historical data can
be traced and displayed by [Arrow] (scroll)
buttons. Click [Arrow] (scroll) buttons to
move the screen to the measured time you
want to display. The time axis will revert
back by clicking [Left arrow] and will
proceed forward by clicking [Right arrow].
When you want to see the historical data by
magnifying the time axis, move the screen to
the measured time roughly with the same
chart moving speed at the time of
measurement. Then, select a shorter range of
chart moving speed and make fine
adjustments by clicking either of [Arrow
(scroll)] buttons. You can also compress the
time axis. Click [Arrow (scroll)] buttons
after selecting a chart speed.
2) By clicking [Excel] button (or by press ing [E] key on your keyboard), [Save as] dialog box will appear.
Type a file name and click [Save ]button. The data will be exported to Excel worksheet application with
the display of [Now expo rting-- ] and [Progress status display bar]. The exporting data is day/time and
temperatures measured by your thermometer and b y a thermocouple.
Parameters Start Stop Excel Open Save Print Alarm Summ
Caution
This function cannot be executed if Excel has not been installed. If it has not been installed, the
message shown below will appear.
Fa iled to export. Confirm if Excel97 is installed.
3) By clicking Save button (or by pressing of [S] key on your keyboard), [Save as] dialog box wil l appear .
Type a file name and cli ck [Save]] button. The data is saved with the display of [Now saving…] and
[Progress status display bar]. The file ex tension "aht" will be assigned automatically. This file is used in
replaying the stored data as shown in the next paragraph.
Parameters Start Stop Excel Open Save Print Alarm Summ
4) By clicking Open button (or by pressing O key on your keyboard), the m essage shown below will appear.
[Are you s ure to clear the data being di splayed?]
If you want to replay stored data, click OK button for Open dialog box. Select a file name with the file
extension "aht" on Open dialog box and click Open button. The stored data will be displayed. The
display contents are date, number of data, maximum temperature, minimum temperature and average
temperature in addition to its trend graph. If you do not want to replay stored data, click Cancel button to
return to the original screen. You can select the data display range (time axis) of screen, Whole range or
Expand display.
Referenc
5) By clicking Print button (or pressing P key on your keyboard), one copy of the graph being displayed will
be printed in landscape orientation.
Remarks
If you select [Expand] display, you can use the chart speed selection and [Allow (scroll)]
buttons. You can export the replayed data to Excel worksheet application, too.
The data displayed in the screen will be printed wit h the same image as displayed.
Print the graph by specifying the printing orientation of your printer to landscape. (You do not
need to change other settings of your printer.) For printing several copies, repeat the same
operation up to the number of copies.
Real-time Trend
Parameters Start
StopExce
00:00:00
Time
□
-
en
ave
lose
rint Alarm Sum
Data
Whole
Expand
10 seconds
1 minute
5 minutes
10 minutes
1 hour
2 hours
Scroll
Model
Emissivity
1.0
961
-17-
Page 21

INST.No.INE-394-0P2 Software version 1.3
-
C
r
Save P
m
p
da
ta.
m
N
)
n
C
(1)
(
p
p
p
e
e
e
-
7. Real-time measurement
7.5 Alarm summary
1) By clicking [Alarm Summ] button (or pressing [L] key on your keyboard) in the Real-time trend screen,
[Al arm summary] screen will appear.
Real
time Trend
Paramete
Start Stop
Excel
Open
rintAlarmSum
Data
Whole
Expand
erature [℃ ]
Tem
00:00:00
Time
Reference
The latest 100 alarm
data are saved. If
the data exceeds
100 data, the latest
data is saved by
erasing the oldest
2) By clicking [Report] button (or
pressing [R] key on your
keyboard) in the Real-time
trend screen, the preview of
alarm summary report will
appear.
Model
Emissivity
Data coun
lose
Multi-point monitor(30points
Date Time Point 01 Point02 Point03 Poi
Button name Contents
(1) Zoom to fit Displays a report in whole page.
(2) 100% Di splays a report in normal 100% size.
(3) Zoom to width Displays a report in full horizontal width of paper.
(4) First page Displays the first page.
(5) Previous page Displays the previous page
(6) Next page Displaysthe next pag
(7) Last page Displays the last pag
(8) Printer setup Sets up a tabl
(9) Print Executes printing.
(10) Save Report Saves a report.
(11) Load Report Recalls a saved report.
□
t
961
Zoom to fit
format report.
Alarm Summary
Report Excel Delete Close
Date Temperat Alar
(2) 100%
(3) Zoom to width
-
lose
□
-
□
Deletes
all
stored
data
Delete
Record
Last
record
ext
record
Prior
record
First
record
(4) First
page
11) Load
ort
Re
10) Save
Re
9) Print
8) Printer
setu
7) Last
page
6) Next
page
5) Previous
page
ort
-18-
Page 22

INST.No.INE-394-0P2 Software version 1.3
K
l
7. Real-time measurement
3) By clicking [Excel] button (or by pressing E key on y our ke yboard), Save as dial og box will appear.
Type a file name and click Save button. The data is exported to Excel worksheet application with the
displays of [Now exporting…] and [Progress status display bar]. The exporting data is date/time,
temperature and alarm type.
Caution
4) The data in the table can be monitored by using navigator buttons and the scroll bars.
5) The functions of navigating buttons are as follows.
6) Maximized display (vertical orientation) is convenient for display of many data.
7) By clicking [Close] button or X button (or by pressing C key on your keyboard) on [Alarm Summary]
screen, the screen will return to [Real-time Trend] screen.
7.6 Quit of Real-time trend
1) By clicking [Close ] button or X button (or by pressing [C]
key on your keyboard) on [Real-time Trend] screen, the
message box shown below will appear.
By clicking [OK] button, the program will quit and the
screen will return to the menu screen of Windows. (In this
case, the data being displayed will be erased.)
By clicking [Cancel] button, the message will disappear.
Alarm Summary
Report
Excel Delete Close
-
□
This function cannot be executed if Excel has not been i nstalled.
Button name Details
First record Sets the current record at the first record (First line).
Prior record Sets the current record in the previous record.
Next record Sets the current record in the next record.
Last record Sets the current record in the last record (Latest data) .
Delete record Deletes the current record (for 1 line).
Deletes all stored data Deletes all records.
Confirm
Are you sure to quit the program?
O
Cance
-19-
Page 23

INST.No.INE-394-0P2 Software version 1.3
8. Parameters in saving
The following parameters are saved even after quitting the program.
You do not reset these parameters for your next m easurement or after, if you do not want to change them.
8.1 Common parameters
Select
Parameters Details
Serial Port For the RS-232C comm unications
Engineerin g
Units
port
The default is COM1.
For engineering unit for display
The default is C.
8.2 Parameters on real-time measurement
Parameters
(1)
(3)
Range
Maximum
Minimum
Alarm
High
Low
2000
600
2000
600
(2)
(4)
Interval(s)
Day saving time
Model
IR-HI
IR-HS
IR-HQH
OK
1.0
Serial
COM1 COM2
(5)
Resolution/Screen
10 seconds
1 minute
5 minutes
10 minutes
1 hour
2 hours
Engineering
C F
OK
Parameters Details
(1) Range For the measurement range of graph
The defaults are maximum 2000, m inimum 600.
(2) Interval(s) For the measuring interval
The defaults a re1.0 sec ond and the dayli ght savi ngs tim e not chec ked.
(3) Alarm For the alarm set-points
The defaults are 2000 for the high alarm set-point and 600 for the low alarm set-point.
(4) Model For the model number of thermometer for measurement
The default is IR-HS.
(5) Resolution
/Screen
For the chart speed
The default is 10 minutes.
-20-
Page 24

INE-383-1P0
32-8, KUMANO-CHO, ITABASHI-KU, TOKYO 173-8632
Telephone: +81-3-3956-2171
Facsimile: +81-3-3956-0915
Website: http://www.chino.co.jp/
INE-394-0P2 Oct-06 IR-H Date Logging Software IR-VXG1E(Software Ver.1.3) Printed in Japan.
 Loading...