


Arnoux
■■
■ THREE PHASE POWER QUALITY ANALYSER
■■
C.A 8332B
C.A 8334B
ENGLISH
User's manual
1
MEANING OF SYMBOLS USED IN THE INSTRUMENT
: WARNING ! Please refer to the User's Manual before using the instrument.
In this User's Manual, the instructions preceded by the above symbol, should they not be carried out as shown, can
result in a physical accident or damage the instrument and the installation.
: Earth
: Double insulation
: Conform to WEEE 2002/96/EC standard
Thank you for acquiring a C.A 8332B or C.A 8334B three phase power quality analyser.
To obtain the best possible service from your instrument :
■■
■ read these operating instructions carefully,
■■
■ comply with the precautions for use.
PRECAUTIONS FOR USE
■ Read carefully all the notes preceded by symbol.
■ If you don't use this instrument according the user's manual, you can compromise the safety, and you can go in dangerous
situation.
■ The safety of all the system which include this instrument is the system owner responsability.
■ For your safety, use only tests leads delivered with the instrument : they are conform to EN 61010-031 (2002) standard.
■ Before each use, check the good state of test leads.
■ For your safety, use only accessories delivered with the instrument or approuved by the supplier.
■ Respect the climatic conditions for use (see § 6).
■ This instrument can be used on category-IV installations for voltages not exceeding 600V (AC or DC) in relation to the earth
(as per EN 60664-1).
■ The use of accessorie (sensor) with lower category (CAT III for example) reduce the set use (Instrument with sensor) at this
category (CA T IV begin CAT III for example).
■ Ensure the measurement leads and sensors are disconnected before removing the battery.
■ Use battery packs supplied by the maker.
INSTALLATION CA TEGORIES
Definition of installation categories (cf IEC 664-1 publication) :
CAT III : CAT III circuits are power supply circuits that can support major transient overvoltage.
Example : industrial unit or machine power supply.
CAT IV : CA T IV circuits can support very hight transient overvoltage.
Exemple : power input.
WARRANTY
Our guarantee is applicable for three years after the date on which the equipment is made available (extract from our General
Conditions of Sale, available on request).
2

CONTENTS
1. INTRODUCTION....................................................................................................................................................................... 4
2. PRESENTATION....................................................................................................................................................................... 4
2.1 Unit .............................................................................................................................................................................. 4
2.2 Display ......................................................................................................................................................................... 5
2.3 Presentation of the different battery states.................................................................................................................. 6
3. INITIAL OPERATION ................................................................................................................................................................ 7
3.1 Configuration of the instrument ........................................................................................................................... 7
4. DISPLAY MODES ................................................................................................................................................................... 12
4.1 Waveforms Mode ............................................................................................................................................ 12
4.2 Harmonics Mode ............................................................................................................................................ 15
4.3 Power / Energy Mode ........................................................................................................................................ 17
4.4 Transient mode (on C.A 8334B only) ............................................................................................................. 19
4.5 Alarms Mode ........................................................................................................................................................ 21
4.6 Recording Mode ............................................................................................................................................... 22
4.7 Screen Memorisation .................................................................................................................................... 25
4.8 Printing .............................................................................................................................................................. 26
4.9 Help ...................................................................................................................................................................26
4.10 Logiciel "QualistarView" ............................................................................................................................................ 26
5. GENERAL SPECIFICATIONS ................................................................................................................................................27
5.1 Dimensions and weight ............................................................................................................................................ 27
5.2 Power supply ............................................................................................................................................................. 27
5.3 Climatic conditions .................................................................................................................................................... 27
5.4 Compliance with international standards ................................................................................................................. 27
6. FUNCTIONAL CHARACTERISTICS ..................................................................................................................................... 28
6.1 Reference conditions ................................................................................................................................................ 28
6.2 Electrical specifications ............................................................................................................................................. 28
6.3 Specifications of the sensors (with C.A 8332B/34B) ................................................................................................ 32
7. MAINTENANCE ..................................................................................................................................................................... 37
7.1 Recharging the battery .............................................................................................................................................. 37
7.2 Cleaning the housing ................................................................................................................................................ 37
7.3 Calibration testing ..................................................................................................................................................... 37
7.4 Repairs ...................................................................................................................................................................... 37
8. TO ORDER.............................................................................................................................................................................. 38
9. APPENDIX.............................................................................................................................................................................. 40
9.1 Front view of the instrument ...................................................................................................................................... 40
9.2 Mathematical formulae used to compute the various parameters ........................................................................... 41
9.3 Setup DPU 414 printer .............................................................................................................................................. 47
3

1. INTRODUCTION
C.A 8332B and C.A 8334B are three phase power quality analysers which are compact and shock-resistant. Their ergonomic
design and the simplicity of their user interface make their use pleasant and intuitive.
They not only enable the user to obtain an instant image of a network’s principal characteristics but also to monitor their variation
over a period of time. Their multi-task measurement system simultaneously handles all the measurement functions of the various
magnitudes, detection, continuous recording: and their display without any constraints.
They are intended for the technicians and engineers of the test and maintenance teams working in industry and the administration,
for measurements, enabling them to carry out checks and diagnostic work on single phase, two phase or three phase low voltage
networks.
The principal measurements made are:
- Measurement of AC rms voltages up to 480V (phase-to-neutral) or 960V (phase-to-phase) for two-wire, three-wire or four-wire networks.
- Measurement of alternating RMS currents up to 6500A rms.
- Measurement of the frequency of 50Hz, 60Hz (10Hz to 70Hz) networks.
- Calculation of neutral current by vector summing of phase current for star configurations.
- Calculation of peak factors for currents and voltages.
- Calculation of the K factor for currents (transformers).
- Calculation of short-term flicker for voltages.
- Calculation of the phase unbalance for voltage and current (three-phase networks only).
- Measurement of harmonic angles and rates (with respect to fundamental value) for voltage, current or power (C.A 8334B only),
up to level 50. Calculation of overall harmonic distortion factors.
- Measurement of active, reactive and apparent power per phase and their aggregate.
Calculation of the power, shift and tangent factor .
Total amount of energy generated and received from a moment chosen by the operator.
- Monitoring of the average value of any parameter, calculated over a period running from 1 sec to 2 hours. Storage of values
over an unlimited period in the instrument memory.
- Recording, time stamping and characterisation of disturbance: Swells, dips and interruptions, overrun of power and harmonic
thresholds...
- Detection of transients and recording of the associated waveforms (C.A 8334B only).
2. PRESENTA TION
2.1 Unit (see § 9. Appendix)
➀ Display on a LCD colour screen with graphic representation of network parameters in the mode chosen using the keys ➄
(see § 2.2).
➁ 6 variable function keys to modify the current display mode
➂ 4 keys which allow the user to:
access the instrument configuration parameters (see § 3.1)
memorise the current screen and access screens already stored in the memory
print the measurement results on an external pr inter (see “To order” paragraph)
obtain assistance on the current display mode functions in the language chosen by the user
➃ ON / OFF key
➄ Keys for choosing the display mode at any time:
Transients: display of waveforms, motor startup current (Inrush) and interruption (C.A 8334B only).
Harmonics: - representation of the harmonic ratios of voltage, current and power (C.A 8334B only), order by
order,
- determination of harmonic current produced by non-linear loads,
- analysis of the problems caused by harmonics according to their order (heating of neutrals,
conductors and motors, etc.) (C.A 8334B only)
Waveforms : representation of voltage and current waveforms or vector representation (Fresnel diagram) used for:
- the identification of signal distortion signatures,
- the display of amplitude and phase unbalance for voltage and current
- the checking of connections in the correct phase order
4

Power / Energy: - the display of power levels and the associated parameters (power factor, displacement and
11
12
tangent),
- energy metering,
- Four quadrants measurement to discern produced /consumed active energies
and inductive / capacitive reactive energies.
Recording: - time-related representation as bar charts or curves, of mean power levels or of the mean value of any
other parameter,
- mains voltage stability check,
- management of power consumed and generated (most economical choice with energy distributor),
- monitoring of harmonic variations,
Alarms: - a list of the alarms recorded according to the thresholds programmed during configuration,
- logging of supply network interruption with half-period resolution (Vrms, Arms, Urms),
- determination of energy consumption overruns,
- checking of compliance with energy supply quality contract.
➅ 4 keys: and which enable movement of the cursor, browsing or the selection of data.
➆ Validation key
➇ Network supply connector
➈ IR RS232 bidirectional optical output for transferring data to a PC (bidirectional) or printing to a dedicated printer (DPU 414 - SEIKO).
➉ 4 voltage inputs situated on the top of the instrument
3 current inputs on the top of the instrument to enable the use of ammeter sensors (MN clamp, C clamp, AmpFLEX, PAC
clamp.)
Protective case
2.2 Display
Measurement values associated with curves Important parameters concerning the instrument:
- Display mode
- The frequency of the measured network
- The proportion of memory occupied for certain modes
- The current date and time
- The battery charge status (see § 2.3)
Selection of the curves to display by pressing on the
keys :
- 3U displays the three compound voltages U12, U23, U31,
- 3V displays the 3 phase-to-phase voltages V1N, V2N, V3N,
- 3A displays the three phase currents and 4A with the
neutral current of a three-phase system,
- L1, L2 or L3 display the current and voltage in turn on phase
1, 2 or 3.
Nota : the stability of the display requires the first measured
magnitude of each selection.
Instant values of signals at an instant “t”, at the intersection
of the cursor and the curves. The cursor is moved along the
time scale with the keys .
Selection of the measurement type using the variable function keys ➁, situated below the screen:
RMS True RMS measurement
THD Overall harmonic distortion factor
CF Crest factor
max/min Extreme and average values
Simultaneous display of the various measurements
Fresnel diagram of signals
The calculation of the DPF, Tan, KF, φ, UNB, Min, Max, VAR, Harmonics, PST, and DF parameters and the frequency
measurement can only be performed if Ch 1, with voltage V1, is connected to the network.
5

2.3 Presentation of the different battery states
1. Battery charging
20% The battery sign and percentage are blinking
Percentage of the total capacity already charged (between 0 and 99%)
Battery capacity level in proportion to the actual charge
2. Battery full (End of charge or begin of discharge
100% The battery sign and percentage are fix
3. Battery discharging
20% The battery sign and percentage are fix
Percentage of the remain capacity
Battery capacity level in proportion to the remain percentage
4. Battery empty discharging
0% The battery sign and percentage are fix
5. New battery charging
? The battery sign and percentage are blinking
Interrogative point showing unknown capacity level
Fix battery capacity level
6. New battery discharging
? The battery sign and percentage are fix
Interrogative point showing unknown capacity level
Fix battery capacity level
6
3. INITIAL OPERATION
The instrument is initially started up by pressing on the key, the startup screen indicates the instrument software version and
its serial number.
If there is no AC mains supply, the instr ument can operate with batteries only, provided they are correctly charged.
The instrument’s batteries are charged when it is connected to the AC mains supply.
Note: When the equipment is stopped using the key, a confir mation is requested if the equipment is in the process of
recording.
3.1 Configuration of the instrument
The instrument must be configured the first time it is used and then whenever necessary. The configuration is saved in the
non-volatile memory when the instrument is switched off (with key).
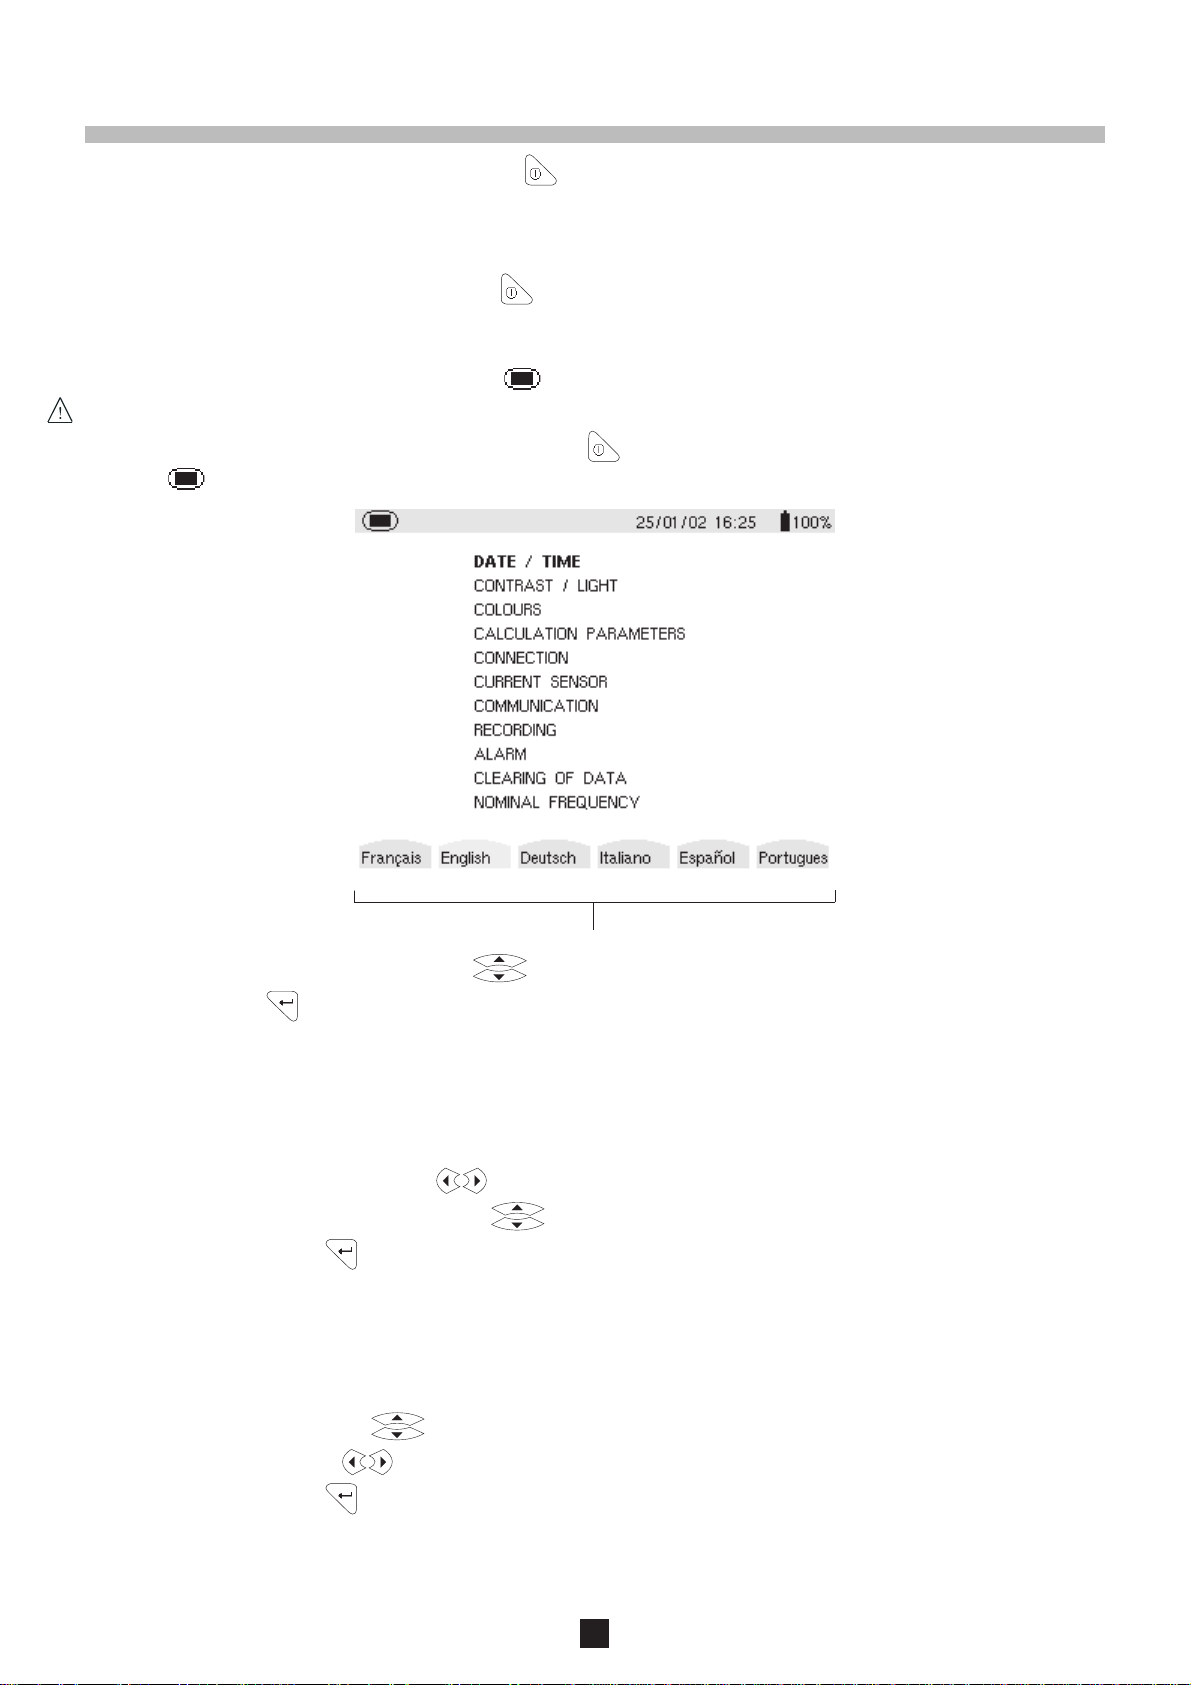
When the key is pressed, the following choices appear:
- Choose the language used with the variable function keys ➁, situated just below the screen.
- Select the other configuration settings with the keys
- Validate with the key
The settings available are presented in the following paragraphs.
3.1.1 Date / Time
10/10/2000 16:45
- Select the number to be modified with the keys, it will appear in bold type.
- Modify the value of the number selected with the keys
- Validate the setting with the key, the Configuration menu will once again be displayed on the screen.
Note: The time and date systems may be chosen by the user.
3.1.2 Light / Contrast
T wo bargraphs appear in this display
- Choose Light or Contrast with the keys
- The setting is chosen with the keys and the setting level indicated on the bargraph.
- Validate the setting with the key, the Configuration menu will once again be displayed on the screen.
7

3.1.3 Colours
3.1.4 Calculation parameters
- Choose the channel concerned with the keys
- Choose the colour with the keys
- Validate the setting with the key, the Configuration
menu will once again be displayed on the screen.
Reactive energy calculation < Without harmonics > Choice of calculation with or without harmonics
- Choose the method with the keys
- Validate the setting with the key, the Configuration menu will once again be displayed on the screen.
8

3.1.5 Connection
- Choose the connection with the and keys
Validate the setting with the key, the Configuration
menu will once again be displayed on the screen.
Single phase or two-phase , the neutral current is not measured or calculated.
3-wire, three phase :
1. Three phase, triangle network: only power totals are representative of the actual situation
2. Three-phase star network: the neutral current is not calculated. It is necessary to connect neutral to obtain representative
power levels per phase.
4-wire three-phase : the neutral current is calculated and its value and waveform are displayed.
V1 must be connected in any type of connection since the display is synchronised from V1 and the network frequency
measured by V1.
■■
■ Synchronisation of the display of curves in “Waveform” mode
■■
Display selection Reference channel
(vertical right menu) for synchronisation
3U U1
3V V1
4A / 3A A1
L1 V1
L2 V2
L3 V3
9

3.1.6 Current sensor
- Choose the sensor with the keys
- Validate the setting with the key, the Configuration
menu will once again be displayed on the screen.
From 1 to 2999A, nominal value of primar y current
Secondary current value (5A or 1A)
make the cursor appear/disappear and move.
allow the current required to be determined.
Current transducer ratio
3.1.7 Communication
Transmission speed 57600 BDS
- Choose from the values: 300, 2400, 4800, 9600, 19200, 38400, 57600 or 115200 bauds with the keys
- Validate the setting with the key, the Configuration menu will once again be displayed on the screen.
For the transfer of data between Qualistar and a PC, the communication speeds must be identical at both ends.
3.1.8 Recording
1. Choose the recording configuration using the keys
2. Move through the chosen field using the keys and
validate the parameters using the keys; the field to
be modified is shown in bold
3. Validate the setting with the key, the Configuration
menu will once again be displayed on the screen.
If these lines are not validated, all the harmonic orders will be
recorded.
Four different recording configurations can be stored
10
3.1.9 Alarm
A programmed alarm must be set to ON to be taken into account (general activation or deactivation of alarms is generated in
mode).
■■
■ Alarm programming
■■
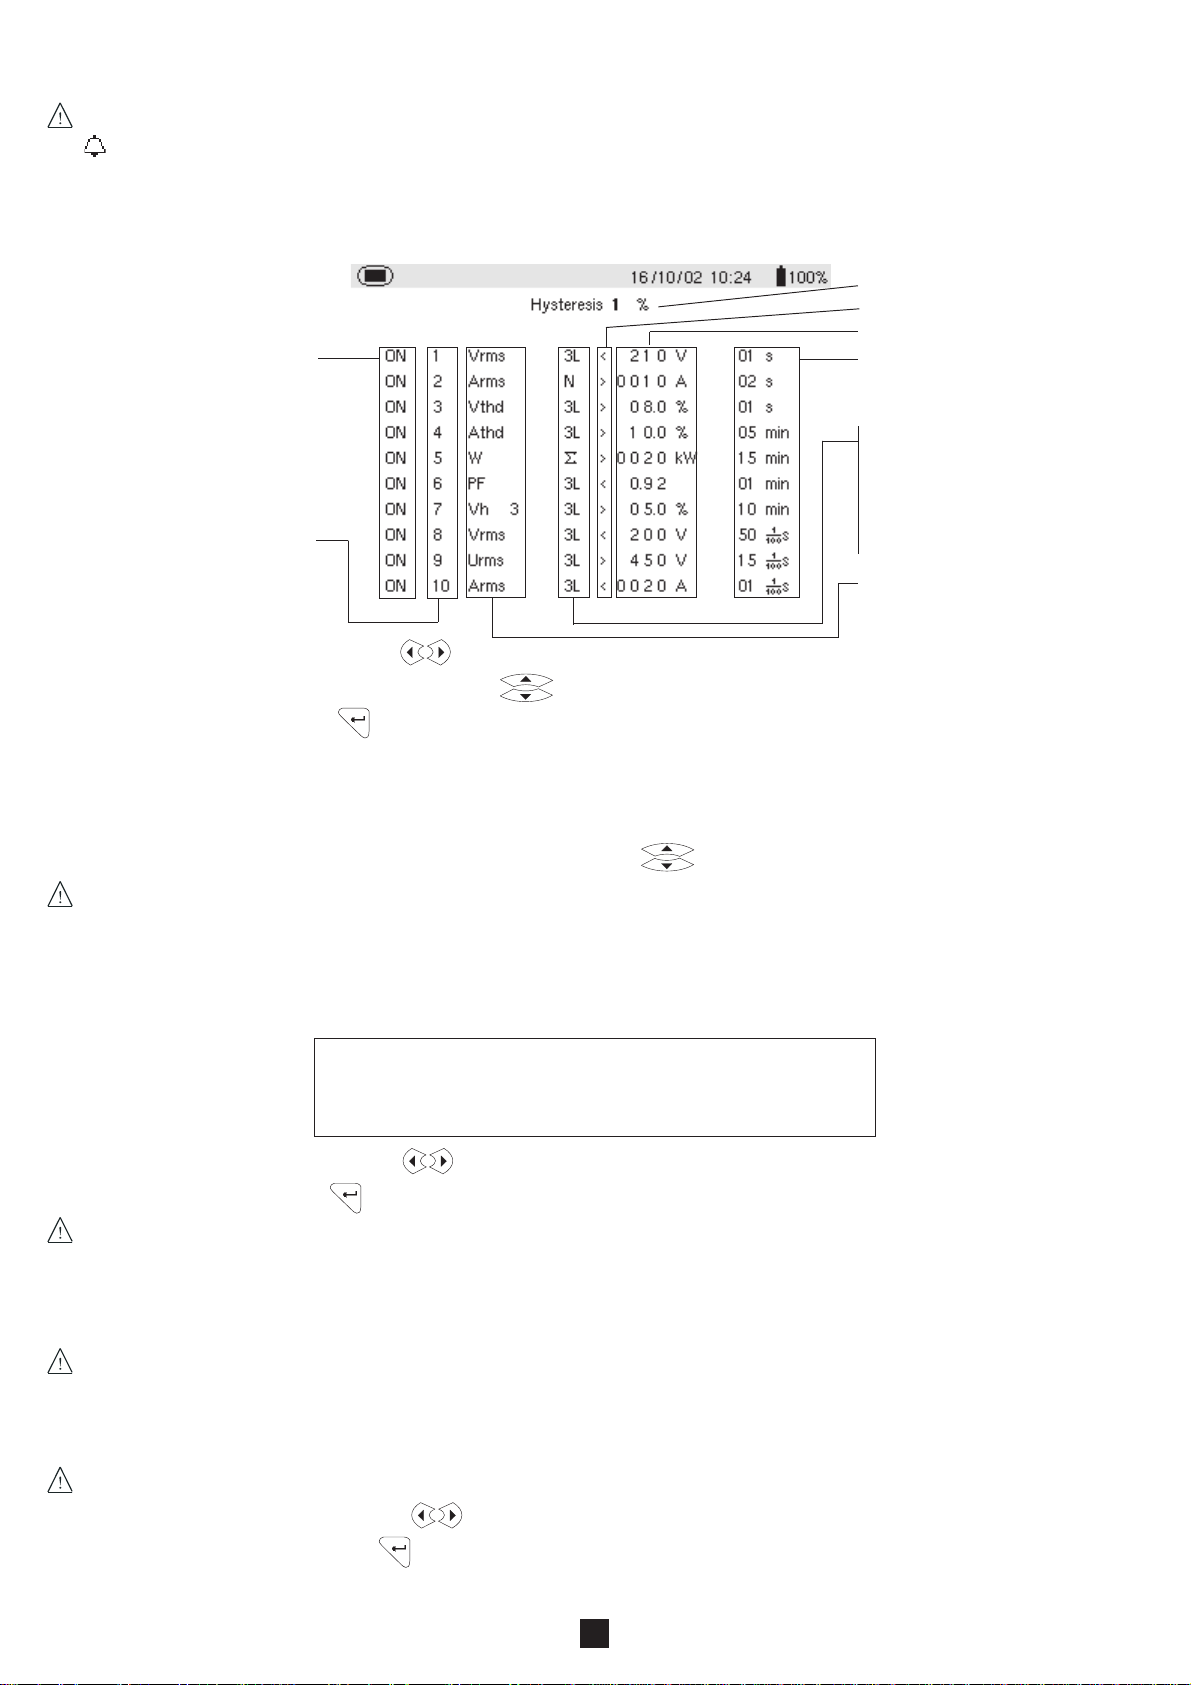
Choose the parameters associated with an alarm from the parameters proposed; phases survey, threshold value and minimum
duration filtering can be programmed
NB: The programmed hysteresis is common to all alarms.
Hysteresis (see §9.2)
< or >
Threshold value
Alarm activation Minimum duration from
beginning threshold
detection to store the alarm
3L : capture of each 3 phases
N : Neutral capture
Σ : Total power capture
Browser column
1. Select the modifiable field using the keys.
Σ/3: Average value of three-
phase capture
Capture parameter
2. Activate or adjust the threshold values using the keys; the field to be modified appears in bold
3. Validate the setting with the key, the Configuration menu will once again be displayed on the screen.
NB : When an alarm is "OFF":
1) The parameters previously used are kept in the memory and reappear if the alarm is selected again.
2) To move quickly from one programmed alarm to another:
simply position the cursor on the alarm numbers column and use .
Modifying one or several characteristics of an alarm set to ON switches it automaticall y to OFF.
NOTA : Only alarms on VRMS, URMS and ARMS (except for neutral current) can be programmed with a minimum threshold overrun
duration of up to 1/100s.
3.1.10 Recorded data delete
When data delete is selected, the following question is displayed:
Are you sure you want to delete all the data?
Yes No
- Choose the relevant answer with the keys
- Validate the setting with the key
When the data is deleted, the instrument configuration returns to the default setting (maker’s configur ation) and the follo wing are
deleted:
- all detected alarms,
- all screen photos taken,
- all the captured transient states (on C.A 8334B only),
- and all recordings made.
The instrument will automatically switch itself off once the data have been deleted.
3.1.11 Rated frequency
Rated frequency of network: 50 Hz or 60 Hz
This parameter determines the correction coefficients used for calculating power and energy, with AmpFlex sensor.
- Choose the rated frequency using the keys
- Validate the adjustment using the key: the screen displays the “Configuration” menu again.
11
4. DISPLAY MODES
4.1 Waveforms Mode
- Press on the display mode key
- The following screen is displayed:
■■
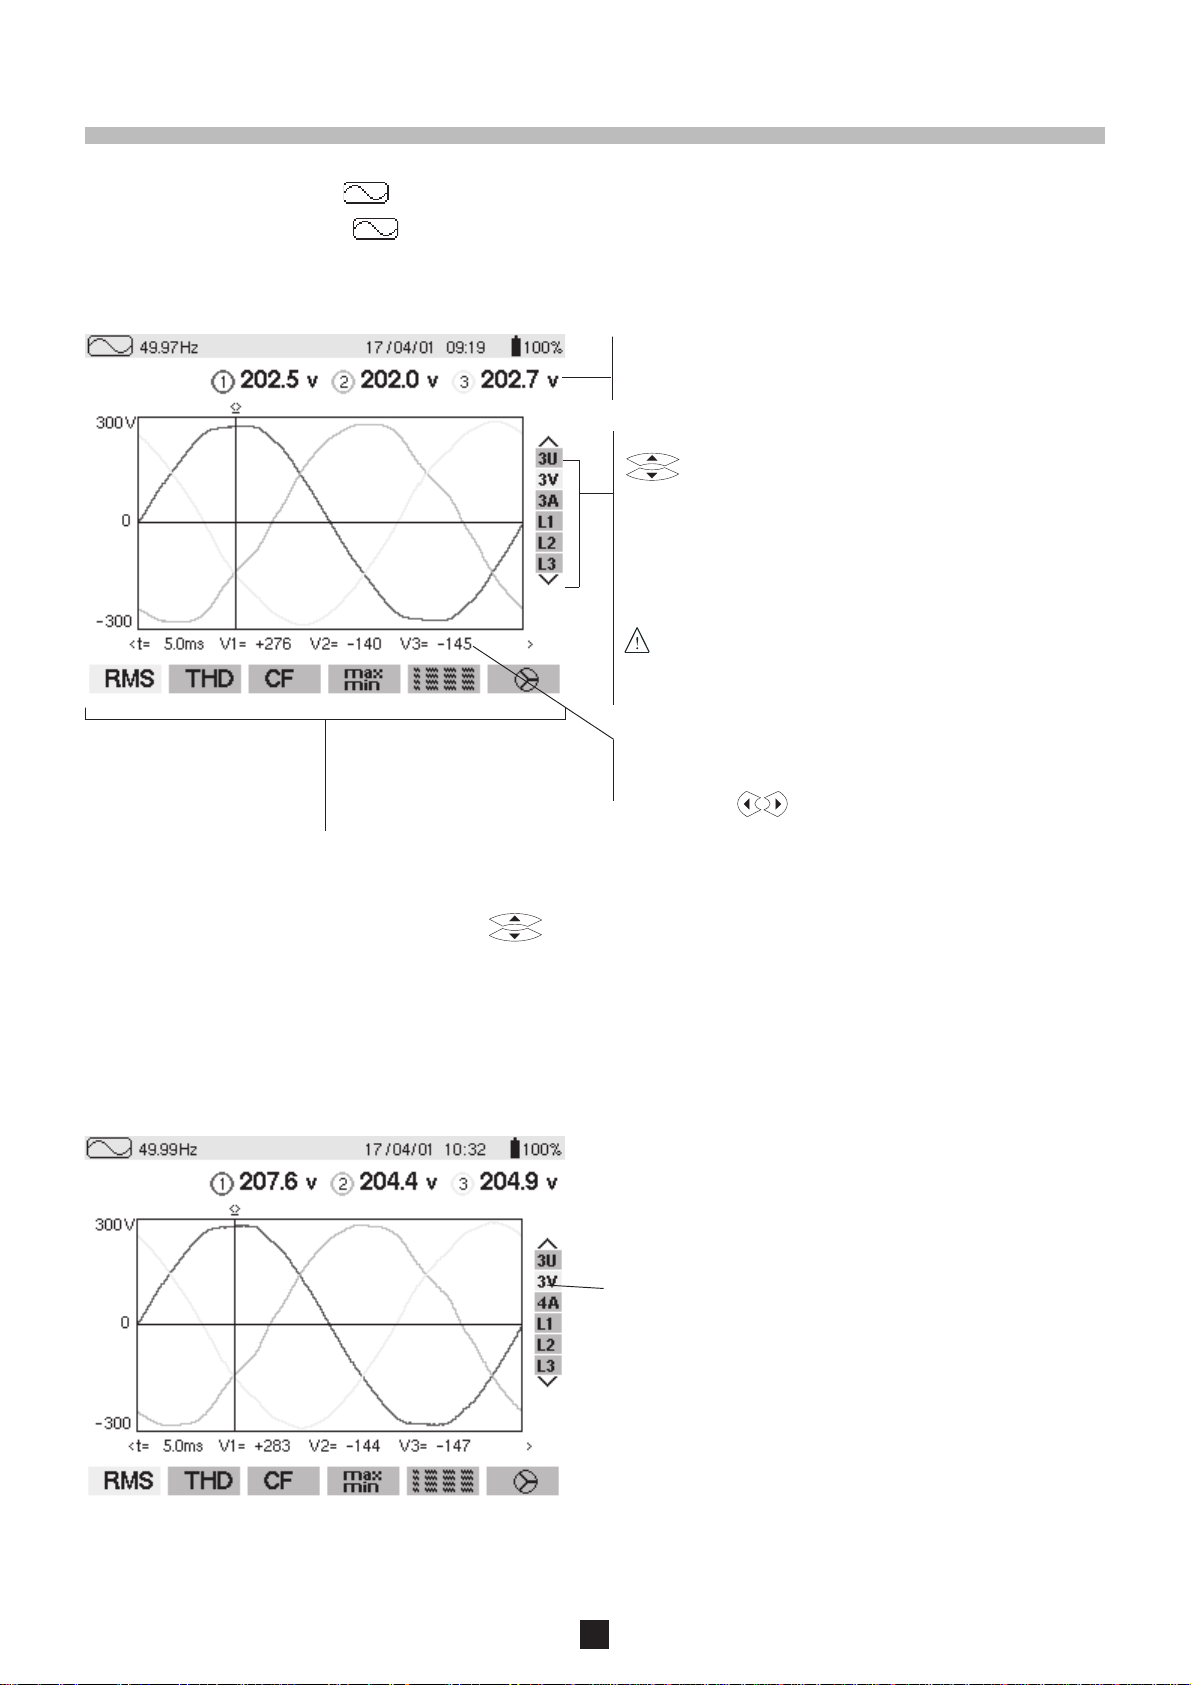
■ Measurement of rms voltage on a three phase system:
■■
Values measured for each curve every second (same colour),
according to the measurement type chosen with the variable
function keys ➁, situated directly below the screen.
The curves to be displayed are selected by pressing on the
keys:
- 3U displays the three phase-phase voltages of a three
phase system,
- 3V displays the three single voltages of a three phase
system,
- 3A displays the three phase currents of a three-wire, three
phase system,
The neutral current is not a direct measurement but
the resulting total of the 3 currents measured.
- L1, L2 and L3 respectively display the current and voltage
on phases 1, 2 and 3.
Instant values of signals at an instant “t”, at the intersection of
the cursor and the curves. The cursor is mo ved along the time
scale with the keys.
The measurement type is selected using the variable function keys ➁, located beneath the screen.
All these measurements are valid in 3U, 3V, 3A, L1, L2, L3
Important: The choice of curves to be displayed ( keys) depends on the type of connection (see § 3.1.5):
- 4-wire, three phase: 3U, 3V, 4A, L1, L2, L3
- 3-wire, three phase: 3U, 3V, 3A, L1, L2, L3
- Two-phase: 2V, 3A, L1, L2
- Single phase: No choice (L1)
This comment is valid for all display modes.
■ Measurement of phase to phase RMS voltages on the 3 phases
Selection of 3 V
12
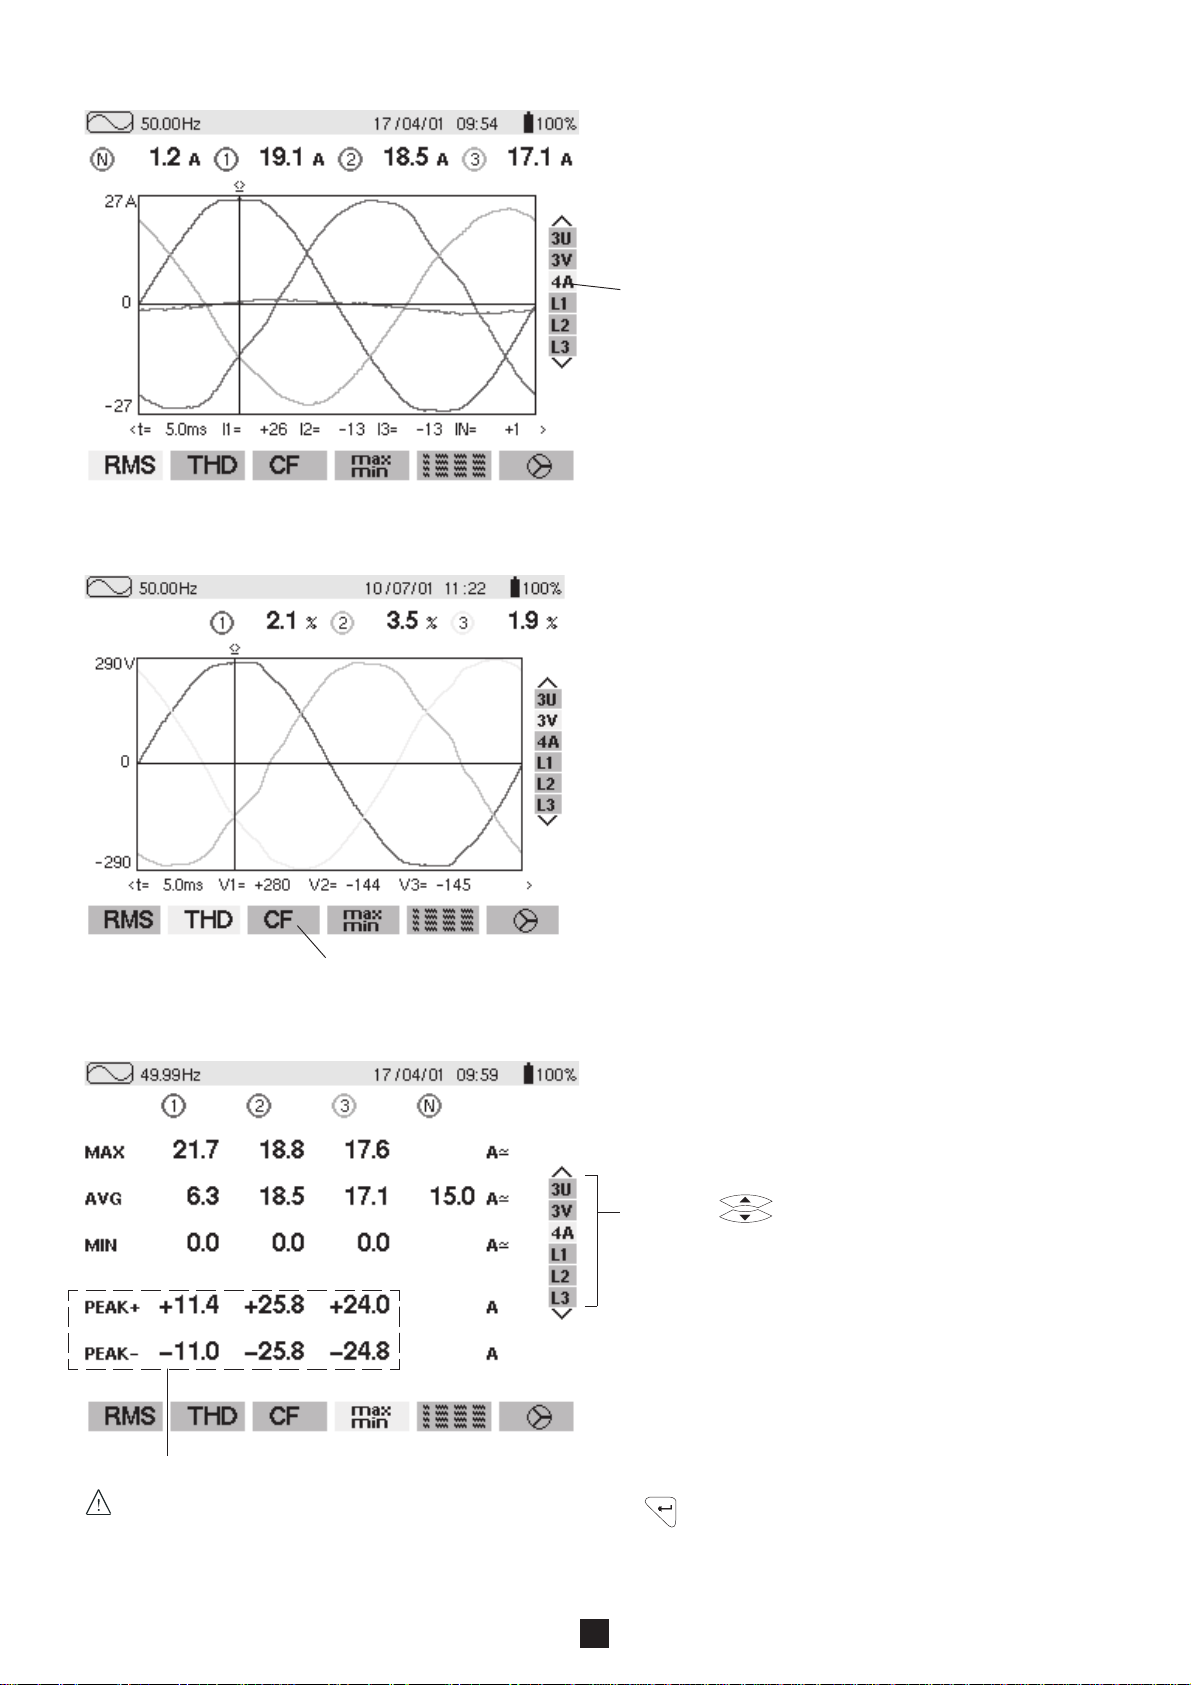
■ Measurement of RMS current on the 3 phases and the neutral of a 4-wire three phase system
Selection of 4 A
■ Measurement of overall harmonic distortion factors for voltage
Measurement of the crest factor
■ Measurement of extreme and average current values
Select with 3 V or 4 A to obtain the Min, AVG, Max,
peak + or peak – values for current or voltage (see §9.2)
Peak values refreshed every 250ms but calculated every second.
Max and Min values are measured from the power on or the last key pressed
Nota : The Max and Min measurements are calculated every half period (e.g. : every 10ms for a 50Hz signal). The Avg
measurements are calculated every second. However, the Max, Avg and Min measurements are refreshed every 250ms.
13
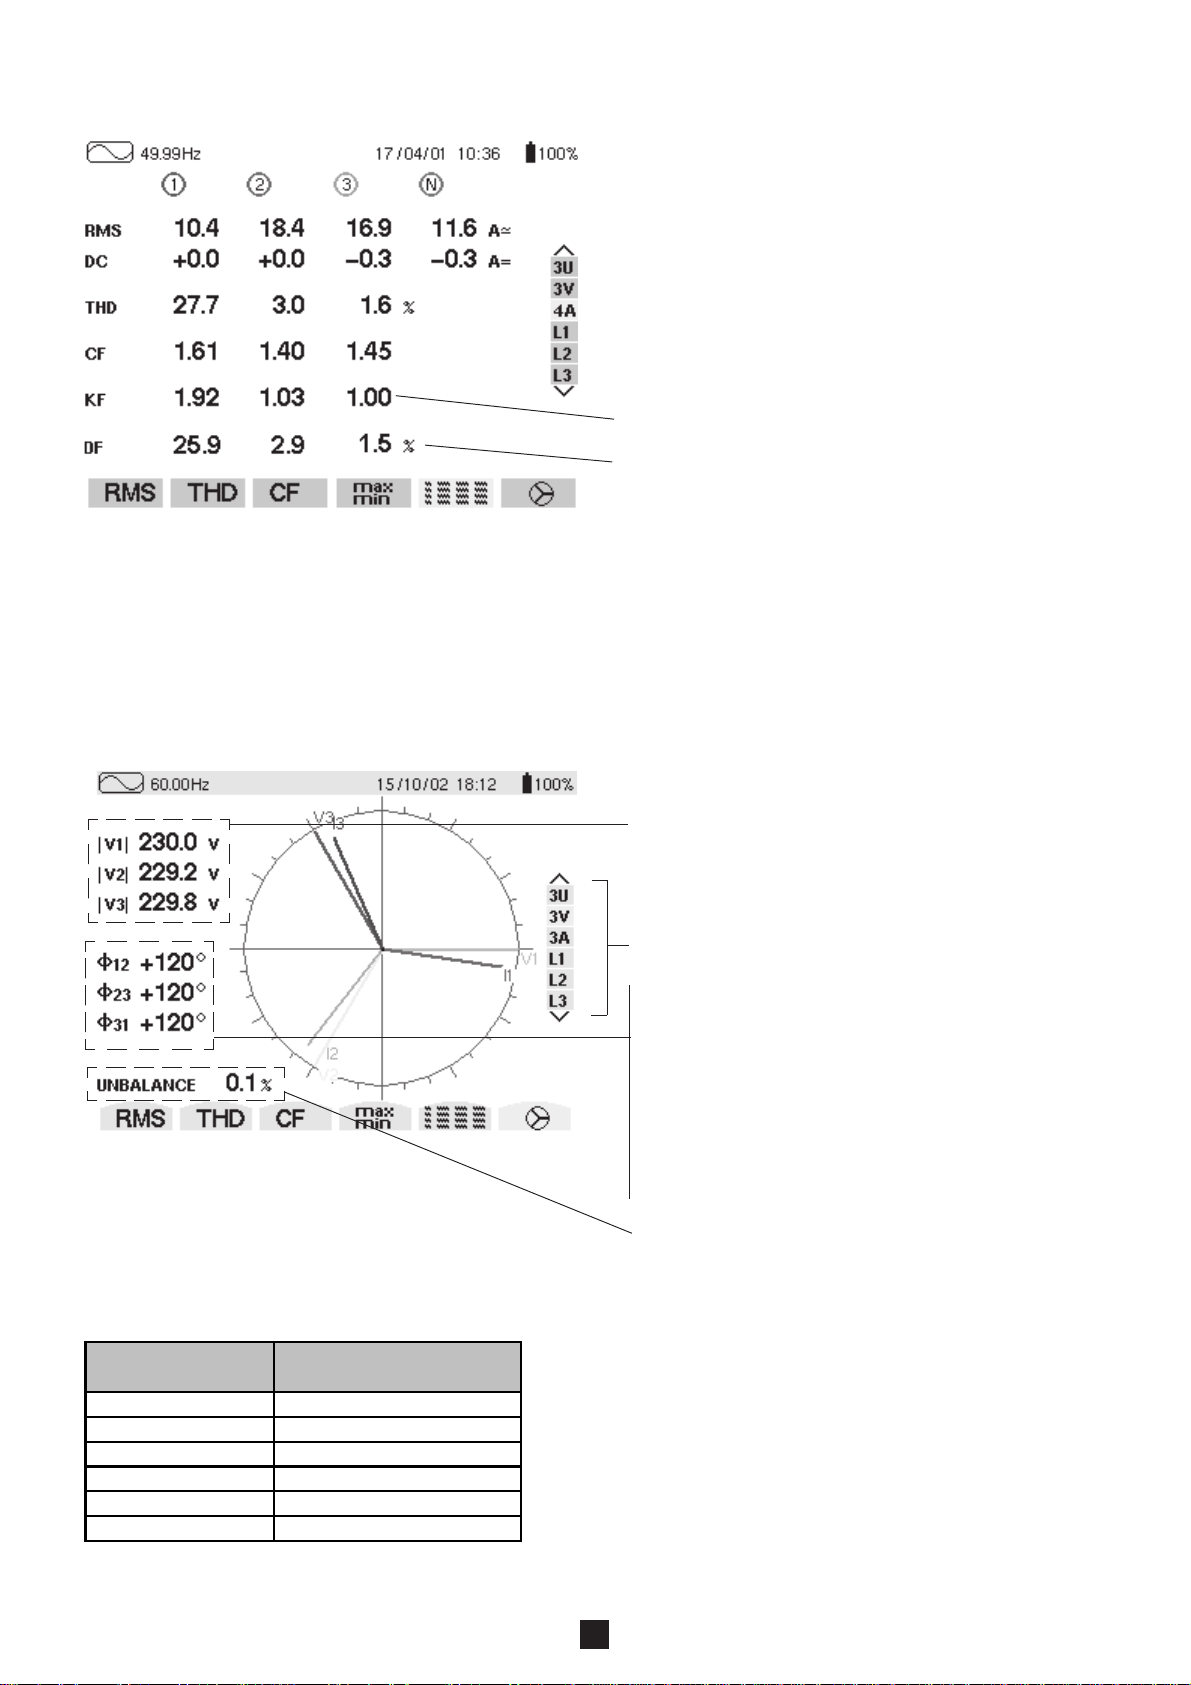
■ Simultaneous display of all the different current measurements
Display Filter
(RH vertical menu)
Reference vector for the
Fresnel
diagram
3U U1
3V / 2V V1
4A / 3A / 2A
A1
L1 A1
L2 A2
L3 A3
Summary of RMS, DC, THD, CF and KF parameters
Calculation of the K factor for transformer downgrade
Distortion factor
Note: The K factor only concerns current.
Similarly, the flicker value only concerns voltage.
3V → PST, flicker calculated on short term
3A and 4A → KF factor
L1, L2 and L3 flicker and KF factor
DC current values only for the PAC 93 clamp
■■
■ Display of the Fresnel diagram or vector diagram
■■
On each phase L1, L2, L3: display of Vn and An on a Fresnel diagram.
Absolute value or modulus of voltage of current at
fundamental frequency.
Select the Fresnel diagram display choice
Φ12 corresponds to the phase shift of channel 1 compared
to 2
Φ23 corresponds to the phase shift of channel 2 compared
to 3
Φ31 corresponds to the phase shift of channel 3 compared
to 1
NB: This is valid for current (4A and 3A) and for single
voltage (3V).
When the user chooses to look at a specific phase (L1, L2
or L3) ΦVA is the phase angle of V in relation to A.
Current unbalanced ratio:
For this 3 V selection, it is the voltage unbalanced value.
14
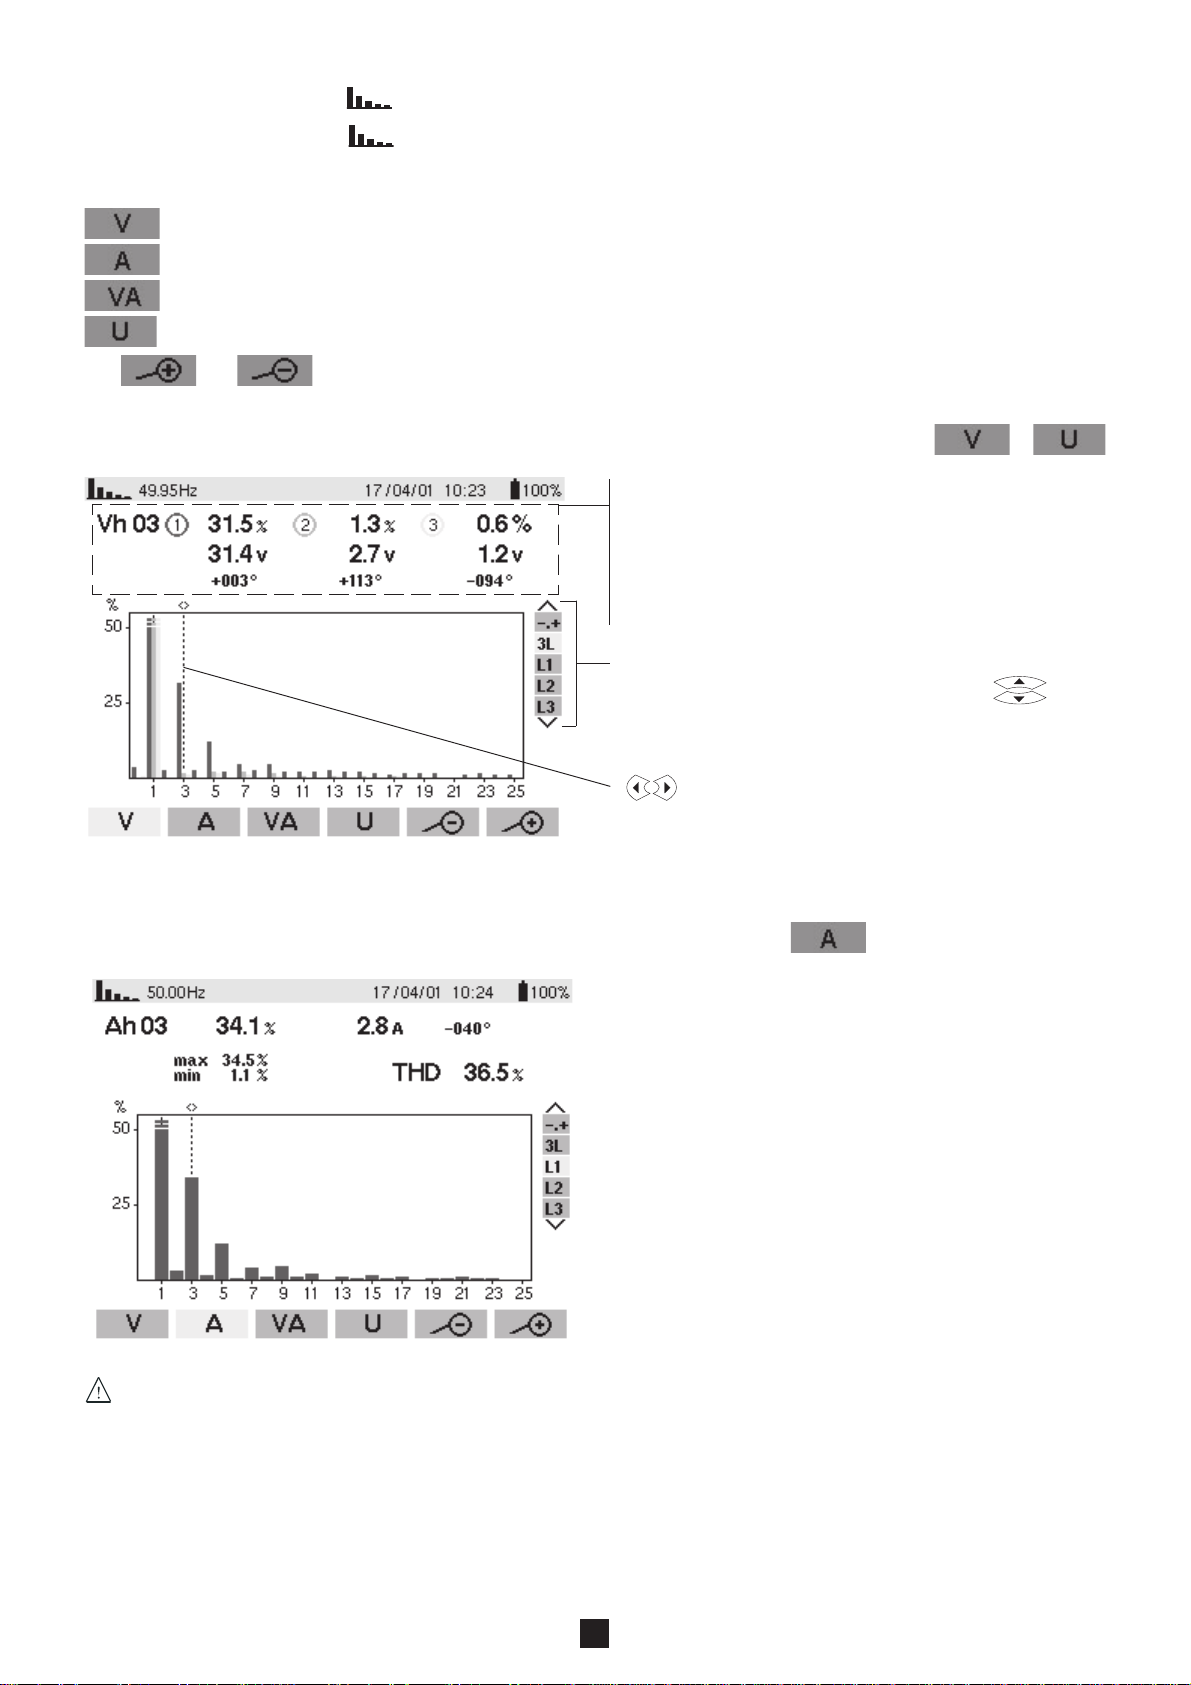
4.2 Harmonics Mode
- Press on the display mode key
- The following screen is displayed:
Selection of harmonic analysis measurement using the variable function keys located directly under the screen:
Single phase voltage analysis
current analysis
apparent energy analysis
Phase to phase voltage analysis
The and keys allow the user to zoom in both directions (2%, 5%, 10%, 20%, 50% and 100%)
1. Harmonic analysis of the phase-phase or single voltages of the three phases of a three phase network or
Values measured for each phase (harmonic N°3: Vh03):
- Percentage in relation to the fundamental
- RMS value,
- Phase angle in relation to the fundamental,
according to the measurement type chosen (V) with the
variable function keys situated just below the screen.
Selection of expert mode -0+ (see 4. in § 4.2), for the three
phases 3L or L1, L2 or L3 by pressing on the keys.
Cursor enabling selection up to harmonic order 50, with the
keys, as soon as order 25 is reached, the 25 to 50
range appears (order 0 represents the DC component).
2. Harmonic analysis of the current of one of the phases of a three phase network
On phases L1, L2, L3 display of:
■ the THD ,
■ and the parameters concerning the harmonic order under
consideration:
- percentage in relation to the fundamental
- RMS value and phase angle in relation to the
fundamental component
- MIN and MAX values of the percentage to fundamental
Min and Max values are reset each time the cursor position is changed.
15
 Loading...