

Page 1

Manual No.9449-6
This document contains technology under
The export jurisdiction of the U.S. Department
Of Commerce, Export Administration Act of
1979, as amended, Title 50, U.S.C., App
2401 et seq and EAR 15 CFR 730
ECCN: 9E990
U.S. Schedule B: 4906-00-0000
Model8500C/8500C+
Operators Manual
April 26, 2 001
Model 8500C/C+ Balancer/Analyzer System
Chadwick-Helmuth
Company, Inc.
Page 2

Copyright Notice
Copyright © 2001 by Chadwick-Helmuth Company, Inc.
All Rights Reserved
Sixth Ed i tion, A p ri l 2001
Printed in the U.S.A.
This M an ua l i s su p p l i e d to the User unde r licen se , subject to change without notice and/or recall by
Chadwick-Helmuth Company, Inc., at any time. The Manual at all times remains the property o
Chadwi ck-He lmuth Co mpan y, Inc. The information contained in this Manual is cons idered
confidential. No part of t his Manual is to be cop ie d o r re pro d u ce d or transm itted in any form whatever
(including orally or by electronic transmission), nor is any information in this Manual to be disclosed
in any form w h atever (including orall y or by ele ctronic tran sm i ssion) t o anyone other than an
authorized representative of the User's employer who also shall agree not to disclose same, without
express prior written consent of Chadwick-Helmuth Company, Inc.
Chadwi ck-He lmuth Co mpan y, Inc.
4601 N . Ar d en D rive
El Mon te, CA 91731
(626) 575-6161
Fax: (626) 350-423 6
BBS: (6 26) 350-9697
E-mail: [email protected]
Manual N o . 9449-6
ii
Chadwic k-Helmuth Company , I nc.
Page 3

Contents
List of Figures . . . . . . . . . . . . . . . . . . . . . . . . . . . . . . . . . . . . . . . . . . . . . . . . ix
List of Tables. . . . . . . . . . . . . . . . . . . . . . . . . . . . . . . . . . . . . . . . . . . . . . . . xiii
Chapter 1. Introduction . . . . . . . . . . . . . . . . . . . . . . . . . . . . . . . . . . . . . . . 1-1
1.1 About This Manual. . . . . . . . . . . . . . . . . . . . . . . . . . . . . . . . . . . . . . . . . . . . . . . . . . 1-1
1.1.1 Organization . . . . . . . . . . . . . . . . . . . . . . . . . . . . . . . . . . . . . . . . . . . . . . . . . . 1-1
1.1.2 Document Conventions . . . . . . . . . . . . . . . . . . . . . . . . . . . . . . . . . . . . . . . . . . 1-2
1.1.3 Formats . . . . . . . . . . . . . . . . . . . . . . . . . . . . . . . . . . . . . . . . . . . . . . . . . . . . . . 1-2
1.1.4 Inserts, Changes, and Revisions . . . . . . . . . . . . . . . . . . . . . . . . . . . . . . . . . . . 1-3
1.2 Reference Documentation . . . . . . . . . . . . . . . . . . . . . . . . . . . . . . . . . . . . . . . . . . . . . 1-3
1.3 Technical Support . . . . . . . . . . . . . . . . . . . . . . . . . . . . . . . . . . . . . . . . . . . . . . . . . . . 1-4
1.3.1 Fax Service . . . . . . . . . . . . . . . . . . . . . . . . . . . . . . . . . . . . . . . . . . . . . . . . . . . 1-4
1.3.2 Internet Service . . . . . . . . . . . . . . . . . . . . . . . . . . . . . . . . . . . . . . . . . . . . . . . . 1-4
Chapter 2. Overview and Basic Theory . . . . . . . . . . . . . . . . . . . . . . . . . .2-1
2.1 About the Mo del8500C . . . . . . . . . . . . . . . . . . . . . . . . . . . . . . . . . . . . . . . . . . . . . . 2-1
2.2 Theory of Operation . . . . . . . . . . . . . . . . . . . . . . . . . . . . . . . . . . . . . . . . . . . . . . . . . 2-2
2.2.1 Characteristics of Balancing . . . . . . . . . . . . . . . . . . . . . . . . . . . . . . . . . . . . . . 2-2
2.2.1.1 Track Imbalances . . . . . . . . . . . . . . . . . . . . . . . . . . . . . . . . . . . . . . . . . . 2-6
2.2.1.2 Blade Sweep. . . . . . . . . . . . . . . . . . . . . . . . . . . . . . . . . . . . . . . . . . . . . . 2-7
2.2.2 Balance Charts . . . . . . . . . . . . . . . . . . . . . . . . . . . . . . . . . . . . . . . . . . . . . . . . 2-7
2.2.2.1 Paper Balance Charts. . . . . . . . . . . . . . . . . . . . . . . . . . . . . . . . . . . . . . . 2-8
2.2.2.2 Theory of Chart Creation and Correction . . . . . . . . . . . . . . . . . . . . . . . 2-9
2.3 System Architecture . . . . . . . . . . . . . . . . . . . . . . . . . . . . . . . . . . . . . . . . . . . . . . . . 2-10
2.3.1 Digital Subsystem . . . . . . . . . . . . . . . . . . . . . . . . . . . . . . . . . . . . . . . . . . . . . 2-10
2.3.2 Analog Subsystem . . . . . . . . . . . . . . . . . . . . . . . . . . . . . . . . . . . . . . . . . . . . . 2-12
Chapter 3. Unpacking and Installation . . . . . . . . . . . . . . . . . . . . . . . . . . .3-1
3.1 Model8500C/C+ and Installation. . . . . . . . . . . . . . . . . . . . . . . . . . . . . . . . . . . . . . . 3-1
3.2 Signal Selector and Installation. . . . . . . . . . . . . . . . . . . . . . . . . . . . . . . . . . . . . . . . . 3-2
Chapter 4. Getting Started . . . . . . . . . . . . . . . . . . . . . . . . . . . . . . . . . . . . . 4-1
4.1 Display . . . . . . . . . . . . . . . . . . . . . . . . . . . . . . . . . . . . . . . . . . . . . . . . . . . . . . . . . . . 4-1
4.2 Keypad . . . . . . . . . . . . . . . . . . . . . . . . . . . . . . . . . . . . . . . . . . . . . . . . . . . . . . . . . . . 4-3
4.2.1 Auto-Repeat. . . . . . . . . . . . . . . . . . . . . . . . . . . . . . . . . . . . . . . . . . . . . . . . . . . 4-4
4.2.2 Arrow Keys and Cursor. . . . . . . . . . . . . . . . . . . . . . . . . . . . . . . . . . . . . . . . . . 4-4
4.2.3 Soft Keys . . . . . . . . . . . . . . . . . . . . . . . . . . . . . . . . . . . . . . . . . . . . . . . . . . . . . 4-5
Model 8 500C/8500C+ Operators Manual
iii
Page 4

Contents
4.2.3.1 HELP Key. . . . . . . . . . . . . . . . . . . . . . . . . . . . . . . . . . . . . . . . . . . . . . . . 4-6
4.2.3.2 SHOW/HIDE Key . . . . . . . . . . . . . . . . . . . . . . . . . . . . . . . . . . . . . . . . . 4-7
4.2.3.3 MORE KEYS Key . . . . . . . . . . . . . . . . . . . . . . . . . . . . . . . . . . . . . . . . . 4-7
4.2.3.4 SETUP Key . . . . . . . . . . . . . . . . . . . . . . . . . . . . . . . . . . . . . . . . . . . . . . 4-7
4.2.3.5 STATUS Key . . . . . . . . . . . . . . . . . . . . . . . . . . . . . . . . . . . . . . . . . . . . . 4-8
4.2.3.6 BALANCE Key . . . . . . . . . . . . . . . . . . . . . . . . . . . . . . . . . . . . . . . . . . . 4-8
4.2.3.7 SPECTRUM Key . . . . . . . . . . . . . . . . . . . . . . . . . . . . . . . . . . . . . . . . . . 4-8
4.2.3.8 TRACK Key. . . . . . . . . . . . . . . . . . . . . . . . . . . . . . . . . . . . . . . . . . . . . . 4-8
4.2.3.9 START Key . . . . . . . . . . . . . . . . . . . . . . . . . . . . . . . . . . . . . . . . . . . . . . 4-8
4.2.3.10 STOP Key. . . . . . . . . . . . . . . . . . . . . . . . . . . . . . . . . . . . . . . . . . . . . . . 4-8
4.2.3.11 PRINT Key. . . . . . . . . . . . . . . . . . . . . . . . . . . . . . . . . . . . . . . . . . . . . . 4-9
4.2.3.12 ANNOTATE Key. . . . . . . . . . . . . . . . . . . . . . . . . . . . . . . . . . . . . . . . . 4-9
4.2.3.13 LOAD Key . . . . . . . . . . . . . . . . . . . . . . . . . . . . . . . . . . . . . . . . . . . . . . 4-9
4.2.3.14 STORE Key . . . . . . . . . . . . . . . . . . . . . . . . . . . . . . . . . . . . . . . . . . . . . 4-9
4.2.3.15 Numeric Keys. . . . . . . . . . . . . . . . . . . . . . . . . . . . . . . . . . . . . . . . . . . . 4-9
4.3 On-line Help . . . . . . . . . . . . . . . . . . . . . . . . . . . . . . . . . . . . . . . . . . . . . . . . . . . . . . . 4-9
4.3.1 Scrolling Help Topics and Text . . . . . . . . . . . . . . . . . . . . . . . . . . . . . . . . . . . 4-10
4.3.2 Help Menu . . . . . . . . . . . . . . . . . . . . . . . . . . . . . . . . . . . . . . . . . . . . . . . . . . . 4-10
4.3.3 Exiting the On-line Help . . . . . . . . . . . . . . . . . . . . . . . . . . . . . . . . . . . . . . . . 4-10
4.4 Printer and Disk Drive . . . . . . . . . . . . . . . . . . . . . . . . . . . . . . . . . . . . . . . . . . . . . . . 4-10
4.4.1 Printer. . . . . . . . . . . . . . . . . . . . . . . . . . . . . . . . . . . . . . . . . . . . . . . . . . . . . . . 4-10
4.4.2 Disk Drive . . . . . . . . . . . . . . . . . . . . . . . . . . . . . . . . . . . . . . . . . . . . . . . . . . . 4-10
4.5 Booting Up the 8500C/C+ . . . . . . . . . . . . . . . . . . . . . . . . . . . . . . . . . . . . . . . . . . . . 4-12
4.5.1 Starting the 8500C/C+ . . . . . . . . . . . . . . . . . . . . . . . . . . . . . . . . . . . . . . . . . . 4-12
4.5.2 Restarting the 8500C/C+ . . . . . . . . . . . . . . . . . . . . . . . . . . . . . . . . . . . . . . . . 4-13
Chapter 5. Balance Measurement and Solutions . . . . . . . . . . . . . . . . . . 5-1
5.1 Getting Balance Solutions: Introduction . . . . . . . . . . . . . . . . . . . . . . . . . . . . . . . . . . 5-1
5.2 Balance Charts . . . . . . . . . . . . . . . . . . . . . . . . . . . . . . . . . . . . . . . . . . . . . . . . . . . . . . 5-2
5.2.1 Measurements Only Chart . . . . . . . . . . . . . . . . . . . . . . . . . . . . . . . . . . . . . . . . 5-2
5.2.2 Smart Charts. . . . . . . . . . . . . . . . . . . . . . . . . . . . . . . . . . . . . . . . . . . . . . . . . . . 5-2
5.2.3 Working With Balance Charts. . . . . . . . . . . . . . . . . . . . . . . . . . . . . . . . . . . . . 5-3
5.2.3.1 Scanning Charts on Disks. . . . . . . . . . . . . . . . . . . . . . . . . . . . . . . . . . . . 5-3
5.2.3.2 Loading Charts From Disk. . . . . . . . . . . . . . . . . . . . . . . . . . . . . . . . . . . 5-4
5.2.3.3 Renaming Charts . . . . . . . . . . . . . . . . . . . . . . . . . . . . . . . . . . . . . . . . . . 5-4
5.2.3.4 Storing Charts to Disk . . . . . . . . . . . . . . . . . . . . . . . . . . . . . . . . . . . . . . 5-5
5.2.3.5 Clearing Chart Memory . . . . . . . . . . . . . . . . . . . . . . . . . . . . . . . . . . . . . 5-5
5.2.3.6 Displaying Chart Information. . . . . . . . . . . . . . . . . . . . . . . . . . . . . . . . . 5-6
5.3 Parameter Setup. . . . . . . . . . . . . . . . . . . . . . . . . . . . . . . . . . . . . . . . . . . . . . . . . . . . . 5-7
5.3.1 Balance Frequency . . . . . . . . . . . . . . . . . . . . . . . . . . . . . . . . . . . . . . . . . . . . . . 5-7
5.3.2 Frequency Units . . . . . . . . . . . . . . . . . . . . . . . . . . . . . . . . . . . . . . . . . . . . . . . . 5-8
5.3.3 Balance Multiplier . . . . . . . . . . . . . . . . . . . . . . . . . . . . . . . . . . . . . . . . . . . . . . 5-8
5.3.4 Balance Type . . . . . . . . . . . . . . . . . . . . . . . . . . . . . . . . . . . . . . . . . . . . . . . . . . 5-8
5.3.5 Auto/Manual Stop . . . . . . . . . . . . . . . . . . . . . . . . . . . . . . . . . . . . . . . . . . . . . . 5-8
5.3.6 Angle Units . . . . . . . . . . . . . . . . . . . . . . . . . . . . . . . . . . . . . . . . . . . . . . . . . . . 5-8
5.3.7 Vibration Units. . . . . . . . . . . . . . . . . . . . . . . . . . . . . . . . . . . . . . . . . . . . . . . . . 5-9
5.3.8 Signal Selector Pickup Input Channel . . . . . . . . . . . . . . . . . . . . . . . . . . . . . . . 5-9
5.3.9 Signal Selector Velocimeter Channels. . . . . . . . . . . . . . . . . . . . . . . . . . . . . . . 5-9
iv
Chadwic k-Helm uth Company , I nc.
Page 5

Contents
5.4 Balance Measurement . . . . . . . . . . . . . . . . . . . . . . . . . . . . . . . . . . . . . . . . . . . . . . . . 5-9
5.4.1 Initiating Strobex Measurement . . . . . . . . . . . . . . . . . . . . . . . . . . . . . . . . . . . 5-9
5.4.2 Magnetic Pickup/Photocell Measurement . . . . . . . . . . . . . . . . . . . . . . . . . . . 5-11
5.5 Solution Presentation . . . . . . . . . . . . . . . . . . . . . . . . . . . . . . . . . . . . . . . . . . . . . . . 5-12
5.5.1 Initiating a Test Move (Chart Correction). . . . . . . . . . . . . . . . . . . . . . . . . . . 5-13
5.5.2 Alternate Solutions . . . . . . . . . . . . . . . . . . . . . . . . . . . . . . . . . . . . . . . . . . . . 5-13
5.5.3 Exiting the Solution Screen . . . . . . . . . . . . . . . . . . . . . . . . . . . . . . . . . . . . . . 5-13
5.6 Additional Features . . . . . . . . . . . . . . . . . . . . . . . . . . . . . . . . . . . . . . . . . . . . . . . . . 5-14
5.6.1 Balance Histories. . . . . . . . . . . . . . . . . . . . . . . . . . . . . . . . . . . . . . . . . . . . . . 5-14
5.6.1.1 Initiating a Balance History . . . . . . . . . . . . . . . . . . . . . . . . . . . . . . . . . 5-14
5.6.1.2 Displaying Histories. . . . . . . . . . . . . . . . . . . . . . . . . . . . . . . . . . . . . . . 5-15
5.6.1.3 Storing Histories to Disk . . . . . . . . . . . . . . . . . . . . . . . . . . . . . . . . . . . 5-16
5.6.1.4 Clearing Histories . . . . . . . . . . . . . . . . . . . . . . . . . . . . . . . . . . . . . . . . 5-17
5.6.2 Chart Corrections. . . . . . . . . . . . . . . . . . . . . . . . . . . . . . . . . . . . . . . . . . . . . . 5-17
5.6.2.1 Performing Chart Corrections . . . . . . . . . . . . . . . . . . . . . . . . . . . . . . . 5-18
5.6.2.2 Storing Corrected Charts to Disk. . . . . . . . . . . . . . . . . . . . . . . . . . . . . 5-18
5.6.2.3 Clearing Chart Corrections . . . . . . . . . . . . . . . . . . . . . . . . . . . . . . . . . 5-19
5.6.3 Using Measurements Only . . . . . . . . . . . . . . . . . . . . . . . . . . . . . . . . . . . . . . 5-19
5.6.3.1 Balance Solutions. . . . . . . . . . . . . . . . . . . . . . . . . . . . . . . . . . . . . . . . . 5-19
5.6.3.2 Paper Chart Creation . . . . . . . . . . . . . . . . . . . . . . . . . . . . . . . . . . . . . . 5-20
5.6.3.3 Paper Chart Correction. . . . . . . . . . . . . . . . . . . . . . . . . . . . . . . . . . . . . 5-20
5.6.4 Balancing Fixed-wing Aircraft . . . . . . . . . . . . . . . . . . . . . . . . . . . . . . . . . . . 5-21
Chapter 6. Blade Track Observation. . . . . . . . . . . . . . . . . . . . . . . . . . . . .6-1
6.1 Blade Track: Introduction . . . . . . . . . . . . . . . . . . . . . . . . . . . . . . . . . . . . . . . . . . . . . 6-1
6.2 Vertical Balancing. . . . . . . . . . . . . . . . . . . . . . . . . . . . . . . . . . . . . . . . . . . . . . . . . . . 6-2
6.3 Visual Track Parameter Setup. . . . . . . . . . . . . . . . . . . . . . . . . . . . . . . . . . . . . . . . . . 6-2
6.3.1 Number of Blades . . . . . . . . . . . . . . . . . . . . . . . . . . . . . . . . . . . . . . . . . . . . . . 6-3
6.3.2 Track Typ . . . . . . . . . . . . . . . . . . . . . . . . . . . . . . . . . . . . . . . . . . . . . . . . . . . . 6-3
6.4 Performing a Visual Trac . . . . . . . . . . . . . . . . . . . . . . . . . . . . . . . . . . . . . . . . . . . . 6-4
6.4.1 Initiating a Visual Track . . . . . . . . . . . . . . . . . . . . . . . . . . . . . . . . . . . . . . . . . 6-4
6.4.2 The (NO)SPREAD Soft Key. . . . . . . . . . . . . . . . . . . . . . . . . . . . . . . . . . . . . . 6-6
6.4.3 Normal and Surround Mode Observations . . . . . . . . . . . . . . . . . . . . . . . . . . . 6-6
6.4.4 Blade Sweep . . . . . . . . . . . . . . . . . . . . . . . . . . . . . . . . . . . . . . . . . . . . . . . . . . 6-7
6.4.5 Tail Rotor Tracking. . . . . . . . . . . . . . . . . . . . . . . . . . . . . . . . . . . . . . . . . . . . . 6-7
Chapter 7. Spectrum Analysis. . . . . . . . . . . . . . . . . . . . . . . . . . . . . . . . . .7-1
7.1 Spectrum Analysis: Introduction. . . . . . . . . . . . . . . . . . . . . . . . . . . . . . . . . . . . . . . . 7-1
7.2 Data Acquisition and Storage . . . . . . . . . . . . . . . . . . . . . . . . . . . . . . . . . . . . . . . . . . 7-2
7.2.1 Spectral Frequency Plots . . . . . . . . . . . . . . . . . . . . . . . . . . . . . . . . . . . . . . . . . 7-2
7.2.2 Aborting Data Acquisition. . . . . . . . . . . . . . . . . . . . . . . . . . . . . . . . . . . . . . . . 7-2
7.2.3 Storing Spectral Data. . . . . . . . . . . . . . . . . . . . . . . . . . . . . . . . . . . . . . . . . . . . 7-3
7.3 Spectrum Setup Operations. . . . . . . . . . . . . . . . . . . . . . . . . . . . . . . . . . . . . . . . . . . . 7-3
7.3.1 Using the Spectrum Setup Screen . . . . . . . . . . . . . . . . . . . . . . . . . . . . . . . . . . 7-4
7.3.1.1 Maximum Frequency . . . . . . . . . . . . . . . . . . . . . . . . . . . . . . . . . . . . . . . 7-4
7.3.1.2 Frequency Units. . . . . . . . . . . . . . . . . . . . . . . . . . . . . . . . . . . . . . . . . . . 7-4
Model 8 500C/8500C+ Operators Manual
v
Page 6

Contents
7.3.1.3 Seek Amplitude . . . . . . . . . . . . . . . . . . . . . . . . . . . . . . . . . . . . . . . . . . . 7-4
7.3.1.4 Vibration Units . . . . . . . . . . . . . . . . . . . . . . . . . . . . . . . . . . . . . . . . . . . . 7-4
7.3.1.5 Repetition Mode . . . . . . . . . . . . . . . . . . . . . . . . . . . . . . . . . . . . . . . . . . . 7-4
7.3.1.6 Seek Peak Function . . . . . . . . . . . . . . . . . . . . . . . . . . . . . . . . . . . . . . . . 7-4
7.3.1.7 Signal Selector Velocimeter Channel(s). . . . . . . . . . . . . . . . . . . . . . . . . 7-5
7.3.2 Using Spectrum Setups . . . . . . . . . . . . . . . . . . . . . . . . . . . . . . . . . . . . . . . . . . 7-5
7.3.2.1 Saving Setups . . . . . . . . . . . . . . . . . . . . . . . . . . . . . . . . . . . . . . . . . . . . . 7-5
7.3.2.2 Recalling Setups . . . . . . . . . . . . . . . . . . . . . . . . . . . . . . . . . . . . . . . . . . . 7-6
7.3.2.3 Renaming Setups . . . . . . . . . . . . . . . . . . . . . . . . . . . . . . . . . . . . . . . . . . 7-6
7.3.2.4 Deleting Setups. . . . . . . . . . . . . . . . . . . . . . . . . . . . . . . . . . . . . . . . . . . . 7-7
7.3.2.5 Loading Setups From Disk. . . . . . . . . . . . . . . . . . . . . . . . . . . . . . . . . . . 7-7
7.3.2.6 Storing Setups to Disk . . . . . . . . . . . . . . . . . . . . . . . . . . . . . . . . . . . . . . 7-7
7.4 Data Analysis. . . . . . . . . . . . . . . . . . . . . . . . . . . . . . . . . . . . . . . . . . . . . . . . . . . . . . . 7-7
7.4.1 SEEK ON/SEEK OFF Soft Key . . . . . . . . . . . . . . . . . . . . . . . . . . . . . . . . . . . 7-8
7.4.2 Select Setup Function. . . . . . . . . . . . . . . . . . . . . . . . . . . . . . . . . . . . . . . . . . . . 7-8
7.4.3 List Peaks Function . . . . . . . . . . . . . . . . . . . . . . . . . . . . . . . . . . . . . . . . . . . . . 7-8
7.4.4 Setting the Balance Frequency. . . . . . . . . . . . . . . . . . . . . . . . . . . . . . . . . . . . . 7-9
7.4.5 SINGLE/MULTIPLE Soft Key . . . . . . . . . . . . . . . . . . . . . . . . . . . . . . . . . . . . 7-9
7.4.6 Scaling Spectral Plots. . . . . . . . . . . . . . . . . . . . . . . . . . . . . . . . . . . . . . . . . . . . 7-9
7.4.7 Harmonics Mode . . . . . . . . . . . . . . . . . . . . . . . . . . . . . . . . . . . . . . . . . . . . . . 7-11
Chapter 8. Using Printouts . . . . . . . . . . . . . . . . . . . . . . . . . . . . . . . . . . . . 8-1
8.1 Printouts With the 8500C/C+ . . . . . . . . . . . . . . . . . . . . . . . . . . . . . . . . . . . . . . . . . . 8-1
8.2 Reading 8500C/C+ Printouts. . . . . . . . . . . . . . . . . . . . . . . . . . . . . . . . . . . . . . . . . . . 8-2
8.3 Annotating Printouts . . . . . . . . . . . . . . . . . . . . . . . . . . . . . . . . . . . . . . . . . . . . . . . . . 8-5
8.3.1 Printout Annotation Screen . . . . . . . . . . . . . . . . . . . . . . . . . . . . . . . . . . . . . . . 8-5
8.3.2 Alpha and Numeric Editing Modes . . . . . . . . . . . . . . . . . . . . . . . . . . . . . . . . . 8-6
8.3.3 Moving the Curso . . . . . . . . . . . . . . . . . . . . . . . . . . . . . . . . . . . . . . . . . . . . . . 8-7
8.3.4 Modifying Annotations . . . . . . . . . . . . . . . . . . . . . . . . . . . . . . . . . . . . . . . . . . 8-7
8.3.5 Saving Annotations . . . . . . . . . . . . . . . . . . . . . . . . . . . . . . . . . . . . . . . . . . . . . 8-7
8.3.6 Restoring Annotations . . . . . . . . . . . . . . . . . . . . . . . . . . . . . . . . . . . . . . . . . . . 8-7
8.3.7 Clearing Annotations . . . . . . . . . . . . . . . . . . . . . . . . . . . . . . . . . . . . . . . . . . . . 8-7
8.3.8 Editing Annotation Templates . . . . . . . . . . . . . . . . . . . . . . . . . . . . . . . . . . . . . 8-8
8.4 Renaming Balance Charts . . . . . . . . . . . . . . . . . . . . . . . . . . . . . . . . . . . . . . . . . . . . . 8-8
Chapter 9. Status Screen Operation. . . . . . . . . . . . . . . . . . . . . . . . . . . . . 9-1
9.1 Status Screen: Introduction . . . . . . . . . . . . . . . . . . . . . . . . . . . . . . . . . . . . . . . . . . . . 9-1
9.2 Screen Data Fields and Functions . . . . . . . . . . . . . . . . . . . . . . . . . . . . . . . . . . . . . . . 9-2
9.2.1 Time and Date . . . . . . . . . . . . . . . . . . . . . . . . . . . . . . . . . . . . . . . . . . . . . . . . . 9-2
9.2.2 Pickup Pulse Rate. . . . . . . . . . . . . . . . . . . . . . . . . . . . . . . . . . . . . . . . . . . . . . . 9-2
9.2.3 Firmware Version Number . . . . . . . . . . . . . . . . . . . . . . . . . . . . . . . . . . . . . . . 9-2
9.2.4 Prints Waiting. . . . . . . . . . . . . . . . . . . . . . . . . . . . . . . . . . . . . . . . . . . . . . . . . . 9-2
9.2.5 Paper Status . . . . . . . . . . . . . . . . . . . . . . . . . . . . . . . . . . . . . . . . . . . . . . . . . . . 9-2
9.2.6 Output Storage Device. . . . . . . . . . . . . . . . . . . . . . . . . . . . . . . . . . . . . . . . . . . 9-2
9.2.7 Memory Free . . . . . . . . . . . . . . . . . . . . . . . . . . . . . . . . . . . . . . . . . . . . . . . . . . 9-2
9.2.8 Disk Unit Status . . . . . . . . . . . . . . . . . . . . . . . . . . . . . . . . . . . . . . . . . . . . . . . . 9-3
9.2.9 Disk Status . . . . . . . . . . . . . . . . . . . . . . . . . . . . . . . . . . . . . . . . . . . . . . . . . . . . 9-3
vi
Chadwic k-Helm uth Company , I nc.
Page 7

Contents
9.2.10 Screen Functions . . . . . . . . . . . . . . . . . . . . . . . . . . . . . . . . . . . . . . . . . . . . . . 9-3
9.3 Review Featur . . . . . . . . . . . . . . . . . . . . . . . . . . . . . . . . . . . . . . . . . . . . . . . . . . . . . 9-3
9.3.1 Selecting the Data Type. . . . . . . . . . . . . . . . . . . . . . . . . . . . . . . . . . . . . . . . . . 9-4
9.3.2 Selecting a New Review Item . . . . . . . . . . . . . . . . . . . . . . . . . . . . . . . . . . . . . 9-4
9.3.3 Storing Review Items to Disk . . . . . . . . . . . . . . . . . . . . . . . . . . . . . . . . . . . . . 9-4
9.3.4 Clearing Review Items . . . . . . . . . . . . . . . . . . . . . . . . . . . . . . . . . . . . . . . . . . 9-5
9.3.5 Analyzing the Selected Item . . . . . . . . . . . . . . . . . . . . . . . . . . . . . . . . . . . . . . 9-5
9.4 Status Parameter Setup . . . . . . . . . . . . . . . . . . . . . . . . . . . . . . . . . . . . . . . . . . . . . . . 9-5
9.4.1 Setting the Time and Date . . . . . . . . . . . . . . . . . . . . . . . . . . . . . . . . . . . . . . . . 9-6
9.4.2 Setting Pickup Pulse Rate Units . . . . . . . . . . . . . . . . . . . . . . . . . . . . . . . . . . . 9-6
9.4.3 Setting the Output Storage Device . . . . . . . . . . . . . . . . . . . . . . . . . . . . . . . . . 9-6
Chapter 10. Printer and Disk Drive . . . . . . . . . . . . . . . . . . . . . . . . . . . . .10-1
10.1 Using the Printe . . . . . . . . . . . . . . . . . . . . . . . . . . . . . . . . . . . . . . . . . . . . . . . . . . 10-1
10.1.1 General Operation . . . . . . . . . . . . . . . . . . . . . . . . . . . . . . . . . . . . . . . . . . . . 10-1
10.1.2 Paper Roll Replacement . . . . . . . . . . . . . . . . . . . . . . . . . . . . . . . . . . . . . . . 10-1
10.2 Using the Disk Drive. . . . . . . . . . . . . . . . . . . . . . . . . . . . . . . . . . . . . . . . . . . . . . . 10-3
10.2.1 Loading Disk Files. . . . . . . . . . . . . . . . . . . . . . . . . . . . . . . . . . . . . . . . . . . . 10-3
10.2.2 Storing Data to Disk or Memory. . . . . . . . . . . . . . . . . . . . . . . . . . . . . . . . . 10-4
10.2.3 Storing Balance Charts to Disk . . . . . . . . . . . . . . . . . . . . . . . . . . . . . . . . . . 10-5
10.2.4 Copying Balance Charts . . . . . . . . . . . . . . . . . . . . . . . . . . . . . . . . . . . . . . . 10-6
10.2.5 Formatting Disks . . . . . . . . . . . . . . . . . . . . . . . . . . . . . . . . . . . . . . . . . . . . . 10-6
10.2.6 Disk Drive Care. . . . . . . . . . . . . . . . . . . . . . . . . . . . . . . . . . . . . . . . . . . . . . 10-7
Chapter 11. Model 8520C Signal Selector . . . . . . . . . . . . . . . . . . . . . . .11-1
11.1 Signal Selector: Introduction. . . . . . . . . . . . . . . . . . . . . . . . . . . . . . . . . . . . . . . . . 11-1
11.2 Signal Selector Operation . . . . . . . . . . . . . . . . . . . . . . . . . . . . . . . . . . . . . . . . . . . 11-2
11.3 Channel Selection . . . . . . . . . . . . . . . . . . . . . . . . . . . . . . . . . . . . . . . . . . . . . . . . . 11-4
Appendix A. Specifications . . . . . . . . . . . . . . . . . . . . . . . . . . . . . . . . . . . A-1
Appendix B. Spectral Data File Format. . . . . . . . . . . . . . . . . . . . . . . . . . B-1
Appendix C. Balance History Files . . . . . . . . . . . . . . . . . . . . . . . . . . . . . C-1
Appendix D. Quick Reference Guide . . . . . . . . . . . . . . . . . . . . . . . . . . . D-1
Model 8 500C/8500C+ Operators Manual
vii
Page 8

Contents
viii
Chadwic k-Helm uth Company , I nc.
Page 9

List of Figures
Figure 2-1. Ideal Rotor With Weight And Supporting Springs . . . . . . . . . . . . . . . . . . . 2-2
Figure 2-2. Shaft Wobble Induced By Mass Imbalance . . . . . . . . . . . . . . . . . . . . . . . . . 2-2
Figure 2-3. Displacement in an Imbalanced Rotor . . . . . . . . . . . . . . . . . . . . . . . . . . . . 2-4
Figure 2-4. Displacement, Velocity, and Acceleration in an Imbalanced Hub . . . . . . . 2-5
Figure 2-5. Strobex Strobe Tracker. . . . . . . . . . . . . . . . . . . . . . . . . . . . . . . . . . . . . . . . . 2-6
Figure 2-6. Sample Paper Balance Chart . . . . . . . . . . . . . . . . . . . . . . . . . . . . . . . . . . . . 2-8
Figure 2-7. 8500C System Block Diagram. . . . . . . . . . . . . . . . . . . . . . . . . . . . . . . . . . 2-10
Figure 2-8. 8500C Digital Subsystem Block Diagram . . . . . . . . . . . . . . . . . . . . . . . . . 2-11
Figure 2-9. 8500C Analog Subsystem Block Diagram. . . . . . . . . . . . . . . . . . . . . . . . . 2-12
Figure 3-1. Mode l8500C/C+ Balancer/Analyzer. . . . . . . . . . . . . . . . . . . . . . . . . . . . . . 3-2
Figure 3-2. Model 8520C Signal Selector. . . . . . . . . . . . . . . . . . . . . . . . . . . . . . . . . . . . 3-3
Figure 4-1. Model 8500C/C+ Balancer/Analyzer. . . . . . . . . . . . . . . . . . . . . . . . . . . . . . 4-2
Figure 4-2. Model 8500C/C+ With Display and Soft Keys . . . . . . . . . . . . . . . . . . . . . . 4-6
Figure 4-3. Sample Setup Screen . . . . . . . . . . . . . . . . . . . . . . . . . . . . . . . . . . . . . . . . . . 4-7
Figure 4-4. Help Screen . . . . . . . . . . . . . . . . . . . . . . . . . . . . . . . . . . . . . . . . . . . . . . . . . 4-9
Figure 4-5. Help Menu Scree . . . . . . . . . . . . . . . . . . . . . . . . . . . . . . . . . . . . . . . . . . . 4-10
Figure 4-6. Power-up Message Screen . . . . . . . . . . . . . . . . . . . . . . . . . . . . . . . . . . . . . 4-12
Figure 4-7. Start-up Message Screen . . . . . . . . . . . . . . . . . . . . . . . . . . . . . . . . . . . . . . 4-12
Figure 5-1. Balance Start-up Screen . . . . . . . . . . . . . . . . . . . . . . . . . . . . . . . . . . . . . . . . 5-2
Figure 5-2. Balance Chart Menu. . . . . . . . . . . . . . . . . . . . . . . . . . . . . . . . . . . . . . . . . . . 5-3
Figure 5-3. Balance Chart Disk Scan . . . . . . . . . . . . . . . . . . . . . . . . . . . . . . . . . . . . . . . 5-4
Figure 5-4. Balance Chart Edit Screen . . . . . . . . . . . . . . . . . . . . . . . . . . . . . . . . . . . . . . 5-5
Figure 5-5. Chart Information Screen. . . . . . . . . . . . . . . . . . . . . . . . . . . . . . . . . . . . . . . 5-6
Figure 5-6. Balance Setup Screen . . . . . . . . . . . . . . . . . . . . . . . . . . . . . . . . . . . . . . . . . . 5-7
Figure 5-7. Strobex Activation Screen . . . . . . . . . . . . . . . . . . . . . . . . . . . . . . . . . . . . . 5-10
Figure 5-8. Strobex: No Balance Frequency Signal Error Screen . . . . . . . . . . . . . . . . 5-10
Figure 5-9. Magnetic Pickup/Photocell: No Synchronization Signal Error . . . . . . . . . 5-11
Figure 5-10. Magnetic Pickup/Photocell Phase Meter Display . . . . . . . . . . . . . . . . . . 5-11
Figure 5-11. Solution Screen for Balance. . . . . . . . . . . . . . . . . . . . . . . . . . . . . . . . . . . 5-12
Model 8 500C/8500C+ Operators Manual
ix
Page 10

List of Figure
Figure 5-12. Balance Run Start-up Screen . . . . . . . . . . . . . . . . . . . . . . . . . . . . . . . . . . 5-13
Figure 5-13. Balance Run Start-up Screen, Additional Soft Keys . . . . . . . . . . . . . . . . 5-15
Figure 5-14. Balance History Measurements Screen . . . . . . . . . . . . . . . . . . . . . . . . . . 5-16
Figure 5-15. Balance History Move Line Screen . . . . . . . . . . . . . . . . . . . . . . . . . . . . . 5-16
Figure 5-16. Correction Solution Screen. . . . . . . . . . . . . . . . . . . . . . . . . . . . . . . . . . . . 5-18
Figure 5-17. Balance Chart Correction Screen . . . . . . . . . . . . . . . . . . . . . . . . . . . . . . . 5-19
Figure 5-18. Measurements Only/Strobex Balance Start-up Screen. . . . . . . . . . . . . . . 5-20
Figure 5-19. HSGI Start-up Screen . . . . . . . . . . . . . . . . . . . . . . . . . . . . . . . . . . . . . . . . 5-21
Figure 5-20. HSGI First Run Measurements. . . . . . . . . . . . . . . . . . . . . . . . . . . . . . . . . 5-21
Figure 5-21. HSGI Move Line Calculation . . . . . . . . . . . . . . . . . . . . . . . . . . . . . . . . . . 5-22
Figure 6-1. Track Startup Screen. . . . . . . . . . . . . . . . . . . . . . . . . . . . . . . . . . . . . . . . . . . 6-1
Figure 6-2. Track Setup Screen. . . . . . . . . . . . . . . . . . . . . . . . . . . . . . . . . . . . . . . . . . . . 6-3
Figure 6-3. Sample Rotor With Four Blades . . . . . . . . . . . . . . . . . . . . . . . . . . . . . . . . . . 6-4
Figure 6-4. Visual Track Screen . . . . . . . . . . . . . . . . . . . . . . . . . . . . . . . . . . . . . . . . . . . 6-5
Figure 6-5. Visual Track, Normal mode . . . . . . . . . . . . . . . . . . . . . . . . . . . . . . . . . . . . . 6-5
Figure 6-6. Visual Track, Surround Mode. . . . . . . . . . . . . . . . . . . . . . . . . . . . . . . . . . . . 6-6
Figure 7-1. Spectral Frequency Plot . . . . . . . . . . . . . . . . . . . . . . . . . . . . . . . . . . . . . . . . 7-2
Figure 7-2. Spectrum Start-up Screen . . . . . . . . . . . . . . . . . . . . . . . . . . . . . . . . . . . . . . . 7-2
Figure 7-3. Spectrum Setup Screen . . . . . . . . . . . . . . . . . . . . . . . . . . . . . . . . . . . . . . . . . 7-3
Figure 7-4. Spectrum Setup Selection Menu. . . . . . . . . . . . . . . . . . . . . . . . . . . . . . . . . . 7-6
Figure 7-5. Spectrum Setup Selection Menu. . . . . . . . . . . . . . . . . . . . . . . . . . . . . . . . . . 7-6
Figure 7-6. Setup Edit Screen . . . . . . . . . . . . . . . . . . . . . . . . . . . . . . . . . . . . . . . . . . . . . 7-7
Figure 7-7. Spectral Frequency Plot Soft Keys. . . . . . . . . . . . . . . . . . . . . . . . . . . . . . . . 7-8
Figure 7-8. List of Spectral Peaks Sorted by Amplitude . . . . . . . . . . . . . . . . . . . . . . . . . 7-8
Figure 7-9. List of Spectral Peaks Sorted by Frequency . . . . . . . . . . . . . . . . . . . . . . . . . 7-9
Figure 7-10. Spectral Plot With Scaling Mode Soft Keys. . . . . . . . . . . . . . . . . . . . . . . . 7-9
Figure 7-11. Spectral Plot With Scaling Bounds. . . . . . . . . . . . . . . . . . . . . . . . . . . . . . 7-10
Figure 7-12. Scaled Spectral Frequency Plot . . . . . . . . . . . . . . . . . . . . . . . . . . . . . . . . 7-10
Figure 7-13. Spectral Frequency Plot With Harmonics Cursors. . . . . . . . . . . . . . . . . . 7-11
Figure 8-1. Solution Printout (Par t1) . . . . . . . . . . . . . . . . . . . . . . . . . . . . . . . . . . . . . . . 8-2
Figure 8-2. Solution Printout (Par t2) . . . . . . . . . . . . . . . . . . . . . . . . . . . . . . . . . . . . . . . 8-3
Figure 8-3. Sample Printout With Annotation. . . . . . . . . . . . . . . . . . . . . . . . . . . . . . . . . 8-5
Figure 8-4. Printout Annotation Screen. . . . . . . . . . . . . . . . . . . . . . . . . . . . . . . . . . . . . . 8-5
Figure 8-5. Additional Printout Annotation Screen Soft Keys . . . . . . . . . . . . . . . . . . . . 8-6
Figure 8-6. Annotation Template Screen. . . . . . . . . . . . . . . . . . . . . . . . . . . . . . . . . . . . . 8-8
x
Chadwic k-Helmuth Company , I nc.
Page 11

List of Figures
Figure 8-7. Balance Chart Edit Screen . . . . . . . . . . . . . . . . . . . . . . . . . . . . . . . . . . . . . . 8-8
Figure 9-1. Status Screen . . . . . . . . . . . . . . . . . . . . . . . . . . . . . . . . . . . . . . . . . . . . . . . . 9-1
Figure 9-2. Status Review With Balance History . . . . . . . . . . . . . . . . . . . . . . . . . . . . . . 9-4
Figure 9-3. Status Review With Spectral Frequency Plot. . . . . . . . . . . . . . . . . . . . . . . . 9-4
Figure 9-4. Status Setup Screen . . . . . . . . . . . . . . . . . . . . . . . . . . . . . . . . . . . . . . . . . . . 9-5
Figure 10-1. 8500C/C+ Printer Mechanism . . . . . . . . . . . . . . . . . . . . . . . . . . . . . . . . . 10-2
Figure 10-2. Front and Rear View of a 3.5-in. Floppy Disk . . . . . . . . . . . . . . . . . . . . . 10-3
Figure 10-3. Balance Chart Edit Screen . . . . . . . . . . . . . . . . . . . . . . . . . . . . . . . . . . . . 10-5
Figure 10-4. Format Disk Warning Screen. . . . . . . . . . . . . . . . . . . . . . . . . . . . . . . . . . 10-6
Figure 11-1. Signal Selector . . . . . . . . . . . . . . . . . . . . . . . . . . . . . . . . . . . . . . . . . . . . . 11-2
Figure 11-2. Model 8520 System Block Diagram . . . . . . . . . . . . . . . . . . . . . . . . . . . . 11-3
Figure 11-3. Balance Setup Screen With Model Signal Selector Support . . . . . . . . . . 11-4
Figure 11-4. Balance Setup With Two 8520 velocimeter Channels. . . . . . . . . . . . . . . 11-4
Model 8 500C/8500C+ Operators Manual
xi
Page 12

List of Figure
xii
Chadwic k-Helmuth Company , I nc.
Page 13

List of Tables
Table 1-1. Reference Documentation . . . . . . . . . . . . . . . . . . . . . . . . . . . . . . . . . . . . . . . 1-3
Table 4-1. Model8500C/C+ Function Keys. . . . . . . . . . . . . . . . . . . . . . . . . . . . . . . . . . 4-3
Table 8-1. Special Character Keys . . . . . . . . . . . . . . . . . . . . . . . . . . . . . . . . . . . . . . . . . 8-6
Table B-1. Spectral Data File Format and Contents . . . . . . . . . . . . . . . . . . . . . . . . . . . . B-1
Table C-1. Balance Data File Format and Contents . . . . . . . . . . . . . . . . . . . . . . . . . . . . C-1
Model 8 500C/8500C+ Operators Manual
xiii
Page 14

List of Tables
xiv
Chadwic k-Helmuth Company , I nc.
Page 15

Chapter 1
1.
Introduction
This chapter introduces you to the basic characteristics of this manual and important related
documentation, as well as the Chadwick-Helmuth Mode l 8 500C/C+ Balancer/Analyzer and its system.
The chapte r also con t ai n s i n fo rmation about contacting customer se rv i c e, in case you need any help
with the product. Chapter 1 includes the following topics:
Section 1.1 About T h is M a nual..... .. .... .. .... .. .... .. .... .. .... .. .... .. .... .. .... .. .... .. .... .. .... .. .... .. .............1-1
Section 1.2 Re ference Do c u men t ation ......... .. .... .. .... .. .... .. .... .. .... .. .... .. .... .. .... .. .... .... .. ............1-3
Section 1.3 Technical Support ............ .. .... .. .... .. .... .. .... .. .... .. .... .. .... .. .... .. .... .. .... .. .... .. .............1-4
1.1 About Th is Manual
This manu al is the gui de t o operating t he Model85 00 C/C+ Ba lan cer/An aly zer (from now on called th
8500C/C+), that is, h ow t o us e the u n i t and its syst e m, as w e ll as how to interpret t he information it
gives you. Thi s document co n tain s procedures for installing an d running the 8500C/C+, as w ell as
instruct ions on how to interpre t the information prese nted whil e it is in operation.
1.1.1 Organization
This manual explains t h e operation of the 850 0C /C + in det ail. B r ief ly , it s chap ters cov er t h e following
subjects:
Chapter 1. Introduction -
also te lls y o u how to con t a ct Customer Service.
Chapter 2. Overview and Basic Theory -
theory of operation f o r the 8500C/C+.
Chapter 3. Unpacking and Installation Chapter 4. Getting Started -
function ke y s i n detail, defines terminology used t h roughout the rest of the manual, and introduces
general o perating proced ures.
Chapter 5. Balance Measurement and Solutions -
features of the 8500C/C+. It expl ai n s the procedures for lat eral and vertical balancin g of vibrating
rotor systems, including the analysis of balance data and implementation of balance solutions.
Chapter 6. Blade Track Observation -
C+. It explains the pr ocedures fo r v i su al tracking of rotor bla de s an d techniques for d etermining
out-of-track elements .
Chapter 7. Spectrum Analysis -
provides detail s on acquiri n g, d is p laying, and analyzin g vibrat ion spectra.
Chapter 8. Using Printouts -
8500C/C+.
An introductio n t o th i s manual, as well as a list of additional re ferences;
Gives a general system overview and explains the basic
Describes how to unpack and in stall th e 8500C/C+.
An introd u c tion to using the 8500C/ C+. It de s c r ib es t h e display and
Explains the balance measurement and solution
Describes the blade track observation feature of the 8500C/
Describes the spectrum analysis features of the 8500C/C+. It
Describes how to read and annotate printouts that are printed by the
Mode l8500C/8500 C+ Operators Manual
1-1
Page 16

Chapter 1
- Introduction
Chapter 9. Status Screen Operation -
for modifyi n g t h e dat e and time, re view i n g othe r work, formatting dis ks, and o t her 8500C/C+
status-related features.
Chapter 10 Printer and Disk Drive -
them to create printouts and to load and store data from a disk.
Chapter 11.Model8520C Signal Selector -
Signal Selector and its use with the 8500C/C+.
Explains the 8500C/C+ S t at us s cr ee n, a nd e x pl a in s p rocedures
Describes the 8500C/C+ printer and disk drive, and how to use
Gives details on the Chadwick- He lmuth M od el8520C
1.1.2 Document Conventions
This m an ua l u se s the following text a nd format conventions:
• Keys on the Mod el8500 are shown in
example,
keys see Section 4 .2 “Keypa ” on pa ge4-3.
• Keys on your PC keyboard are shown in boldface and italic. For exampl e, the “Shift” key is shown
Shift
as
combination.
both tog e ther.
• Take care to distinguish between the number 1 and the letter I. The text tr ie s t o help you out as
much as possible in this regard.
• Text on a display screen, for example, the Mo del8500 screen, i s shown in
represents text in this guide exactly as it appears on screen. When you see the instruction, “Typ
this text
• Important
at the start of the l ist e nt r y i n boldface, for e xa mple,
• Titles of chapters or sectio ns are in quotation marks, for example, “Docum en t Conve n tions,” but
the section numbers are not, for example, see Sect ion1.1.2 “Document Conventions” on pa ge1-2.
• MS-DOS fil e and direct ory names ar e shown in all-c apital lette rs. For example,
AUTOEX EC.BAT and C:\DOS\ COM MA ND . COM. The lett er s after the dot a re called the file
extension
extension, for example, *.COM means all files with the COM extension.
PRINT
and the “Enter” (or Return) key is shown as
,” it tells you to type the text as it appears, then press the
. An a s te ri sk (*) followed by a dot an d a file ext ension means
. Soft keys are in italic type, for example,
Ctrl+F1
Ctrl~F1
topics or terms
Product Name -
means hold down the “Control” key and press the “F1” (Function one) key,
means to press the t w o k e y s i n succession , one at a time.
are in italics. Defin iti on lists h ave the fi r st ter m or so f tware menu option
The Mode l8500C/C+ Balancer/Analyzer
boldface
type. Dedicated keys ar e in regula r type, for
ENTER
Enter.
Sometimes keys are used in
. For detai l s o n th e 850 0 C/C+
monospacedtype
Enter
key.
files with that
all
. This
1.1.3 Formats
In many places i n t he ma n u a l, sp eci al notices app ea r. T h eir headings an d formats h a ve the following
meanings:
• NOTE: Here is additi onal useful in f o rm at ion pe rtaining to the curre nt subject.
• CAUTIO N: Be careful w it h the curre n t procedu re s or items bec au se of p o ssible damage to
equipment or loss of data.
• WARNING: Exercise extreme c ar e with c ur re n t pr oc ed ures be ca us e of pos si ble personal injury.
Special notices appear in the format you see here, with the heading in capital letters and the rest of the
notice next, after a c olo n, with the entire paragr aph set in boldfa ce italic type.
1-2
Chadw i ck-Helmuth Company, Inc.
Page 17

Referen ce Documentation
1.1.4 Inserts, Changes, and Revisions
This publication is the s i xth edition of this man ual. Chang es an d/or later editions w i ll be issued as
needed because of hardware changes and/or firmware upgrades.
NOTE: Th i s manual is written for 8500C/C+ fir mware Ver s io n4.00.
1.2 Reference Documentation
This manual utilizes the reference or additional documentation listed in the table ( Table1-1) below.
Table 1-1. Reference Documentation
Document Name Stock No. Publisher
Model8500C/C+ System Maintenance
Manual
Model135M-12 Strobex Operation and
Maintenance Manual
TM
FasTrak
The Smooth Propeller (Versi on2) 9511-2 Chadwick-Helmuth
The Polar Coordinate Chart: Balanc
Chart Making in the Real World
Universal Balance Ch art Worksheet 3659 Chadwi ck -H elmuth
Application user guide for the subject
aircraft
The part numbers in the p r e v ious list indic a te Chad w ick -He lmu th d o c umen tat ion. U se the numbers
shown i n t he list for or dering purpose s. Each or a ny Ap pli c at i on Note has its own order number. You
may cal l Cu s t omer Service for a list of additio n al av ai l able docume nt a ti on. See Se ction1.3 Technical
Suppor t” on page 1-4 for details. You may also wish to have other rel ev a n t documentatio n on hand, for
example aircraft maintenance manuals, as needed.
Operators Manua 13011-1 Chadwick-Helmuth
10902-2 Chadwick-Helmuth
9076 Chadwick-Helmuth
AW8016 Chadwick-Helmuth
Contact
Customer
Support
Chadwick-Helmuth
NOTE: For p a rt numb ers of a ll 8500C/C+ pa rts and/or other or d er information, see the
Mode l8500C/C+ System Maintenance Manual.
Mode l8500C/8500 C+ Operators Manual
1-3
Page 18

Chapter 1
- Introduction
1.3 Technical Support
In the United States you m ay reach an 8500 tec hi ca l r e pre se n ta t ive for Chadwic k -H el m u th’s Technical
Support by dialing the number below,
(626) 575-6161
Call this number Monday through Friday between 8:00a.m. a nd 4:30p.m. Pacific Time. If at all
possible, pl ease fax a copy o f y our customer su ppo rt report in car e 8500 su pport before calling.
1.3.1 Fax Service
You may send a fax detailing your questions or comments at any time, by dialing the 24-hr number
below.
(626) 350-4236
1.3.2 Internet Service
Chadwi ck -H elmuth also has a n Inter ne t e- ma i l box. M a ke sure you send any messages to the attention
of Customer Support. Our e-mail address is
Our Web site address is
www.chadwick-helmuth.com
For more det ai ls o n this or any of our other suppo r t s e rvi ces, plea se contact an 85 0 0 C/C+ technical
represent ati ve at Ch ad wick-H elm uth’s Technical Support number.
1-4
Chadw i ck-Helmuth Company, Inc.
Page 19

Chapter 2
2.
Overview and Basic Theory
The Model8500C/C+ Balancer/Analyzer contains a number of different components. This chapte
gives yo u summarie s of wh a t they a r e and how th ey oper at e. Chapter2 provid e s a general system
overview and the 8500C/C+’s basic theory, under the following topics:
Section 2.1 About t he Mod el8500C/C+ . .. .... .. .... .. .... .. .... .. .... .. .... .. .... .. .... .. .... .. .... .. .... .. .........2-1
Section 2.2 Theo r y of Operation..... .. .... .. .... .. .... .. .... .. .... .. .... .. .... .. .... .. .... .. .... .. .... .. .... .. ...........2-2
Section 2.3 Sy ste m Archite cture...... .... .. .... .. .... .. .... .. .... .. .... .. .... .. .... .. .... .. .... .. .... .. .... .. .............2-10
2.1 About the Model 8 5 00C/C+
The 8500C/C+ is a portable, microprocessor-based instrument specifically designed for the acquisition
and analysis of rotor system vi bration data. It is intended for use with systems such as helicopters and
airplane propellers, where the identification and suppression of rotor vibrations are essential to correct
perform an ce and mainte na nce. The unit in corporat es stat e -of-the-a rt di gi t al techn o logy in its design.
The result is a family of instruments that achieves a high level of performance and is at the same time
both versatile and easy to use.
The 8500C/C+ supports a broad range of functions that provide for sophisticated and detailed analyses
of target rotor systems. For exa mp l e, t h e 8500C/C+ may be used as an a nalyzer to
• Perform on-site maintenance through vibration trend analysis
• Generate documentation both before and after maintenance
• Display an d record vibr atio n pr of i le s of new or overhauled aircraft
You may also use the 8500C / C+ as a b alanc e r/tracker to
• Track and balance helicopter main and tail rotors
• Balance propellers
• Balance shaft s and blowers
• Balance high-bypass jet fans
• Perform all ba la nc i ng and tracking on the aircraft
In addition, the 8500C/C+ provides for
• Hard-copy reproductions of graphics, text, and dat
• Floppy d i s k stora ge for softwa re ba lance charts , s pe ct r al s et ups, and data
For a detaile d functiona l d e scr i pti on of the 850 0 C/C+ system , s e e t he Model8500C/C+ System
Maintenance Manual.
NOTE: For p a rt numb ers of a ll 8500C/C+ pa rts and/or other or d er information, see the
Mode l8500C/C+ System Maintenance Manual.
Mode l8500C/8500 C+ Operators Manual
2-1
Page 20
Chapter 2
- Overview and Basic Theory
2.2 Theory of Operation
This se cti o n gi ves an overvi e w o f the b a si c theory of the 8 500C/C+’s operation.
2.2.1 Characteristics of Balancing
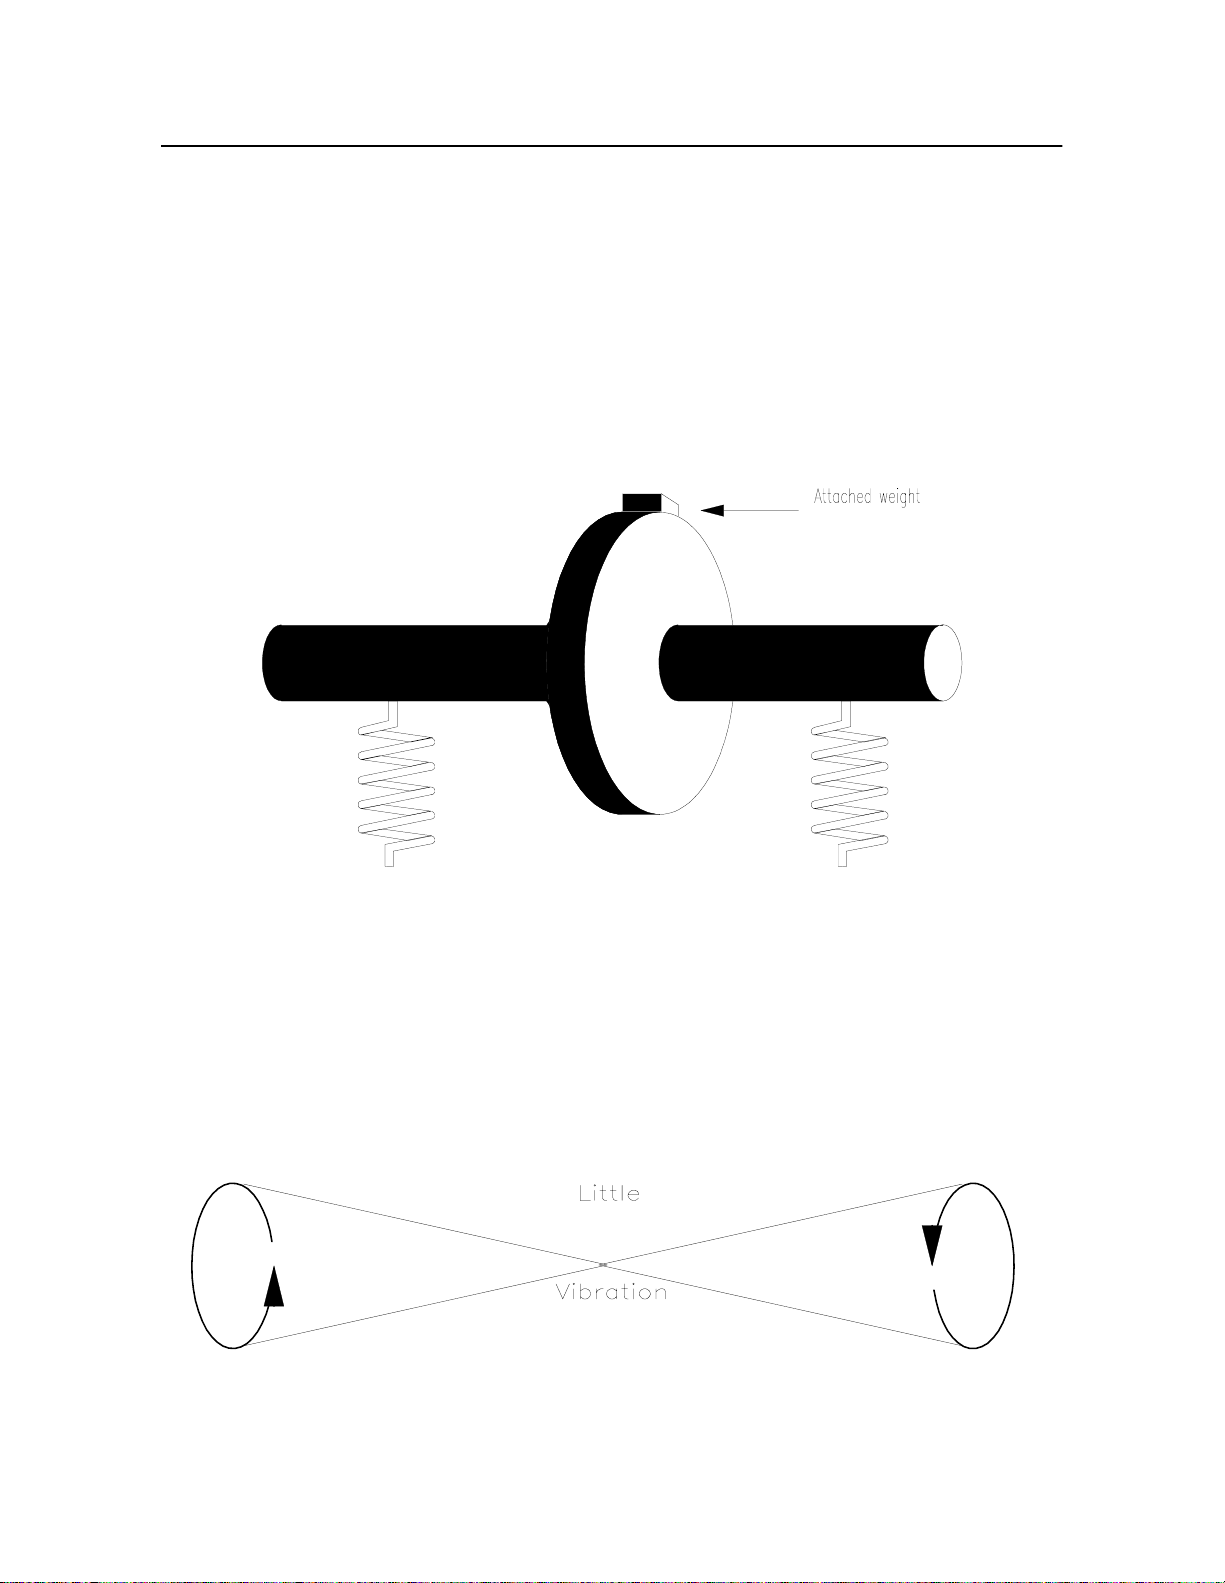
If a perfectly balanced circular disc is mounted on a rigid center spindle and rotated, the outward
centrifugal forces created are constant everywhere along the edge of the disc (see F igure2-1).
Consequently, the disc edge appears to maintain a perfectly stable circular orbit around the spindle axis
with no unev en or extr an eous forces be ing tran sm itted to the surrou nd in g environment.
Figure 2-1. Ideal Rotor With Weight And Supporting Springs
Now if a weight is added to the edge of the disc, the increased centrifugal force created there when th
disc is rotated perturbs its orbit, in d u cing a ma ss i mb al ance around the center o f rot a tion and a wobble
along the spinning shaft (see F igure2-2). A supporting spring placed under the shaft at the point of
maximum wobbl e wou l d accord i n gly feel the effects of t h is im ba lance, exp er i encing an up-and-down
vibration once per revolution as the weighted disc edge passes through the top and bottom of its rotary
trajectory. This effect is called a lateral mass imbalance because the direction of the vibration is
aligned with (that is, parallel to) the rotor system's plane of rotation.
Figure 2-2. Shaft Wobble Induced By Mass Imbalance
2-2
Chadw i ck-Helmuth Company, Inc.
Page 21

The ory of Oper at i on
The vibrational forces created by a lateral mass imbalance are transferred with equal intensity to th
opposite e nd o f the spinn in g shaft and f ro m the re t o a n y compone n ts t he w obbling spindle may
contact. In large, rapidly spinning rotor systems such as helicopters and propeller airplanes, this
phenomenon may be felt by pas se ngers and cr ew as an uncomfor ta ble, resonating “buzz” caused by
the propagation of vibrations through the air frame and cabin. A second consequence is far more
serious, tha t is, damag e to sys te m har dware. If an excessive rot o r imbala nce is left untre ated,
components that are continually subjected to the associated vibrational energies can, over a period o
time, suffer wear, abrasion, fa tigue, or even breakage. Such damage is at best costly in terms of aircraft
maintenance, and at worst dangerous to the ship and its occupants.
How ca n we loc ate and neutra lize a lateral mass im ba lance in a rapidly spin ni ng disc? Since we know
that the we i gh t ed ed ge o f the ro tating disc m ust be a t the top of its rotary tr a v el when the vibrating
spring reac he s t he point of maximum expansio n (pos itive amplitude), and at the bott o m of its arc when
the spring reaches the point of maximum contraction (negative amplitude), it follow s that the location
of the weight ca n be determine d from the spring pos i ti o n al o ne. T hat is, if w e coul d stop the spinning
disc at the point of maximum vibrational amplitude, the weighted edge would appear at the top of its
trajectory.
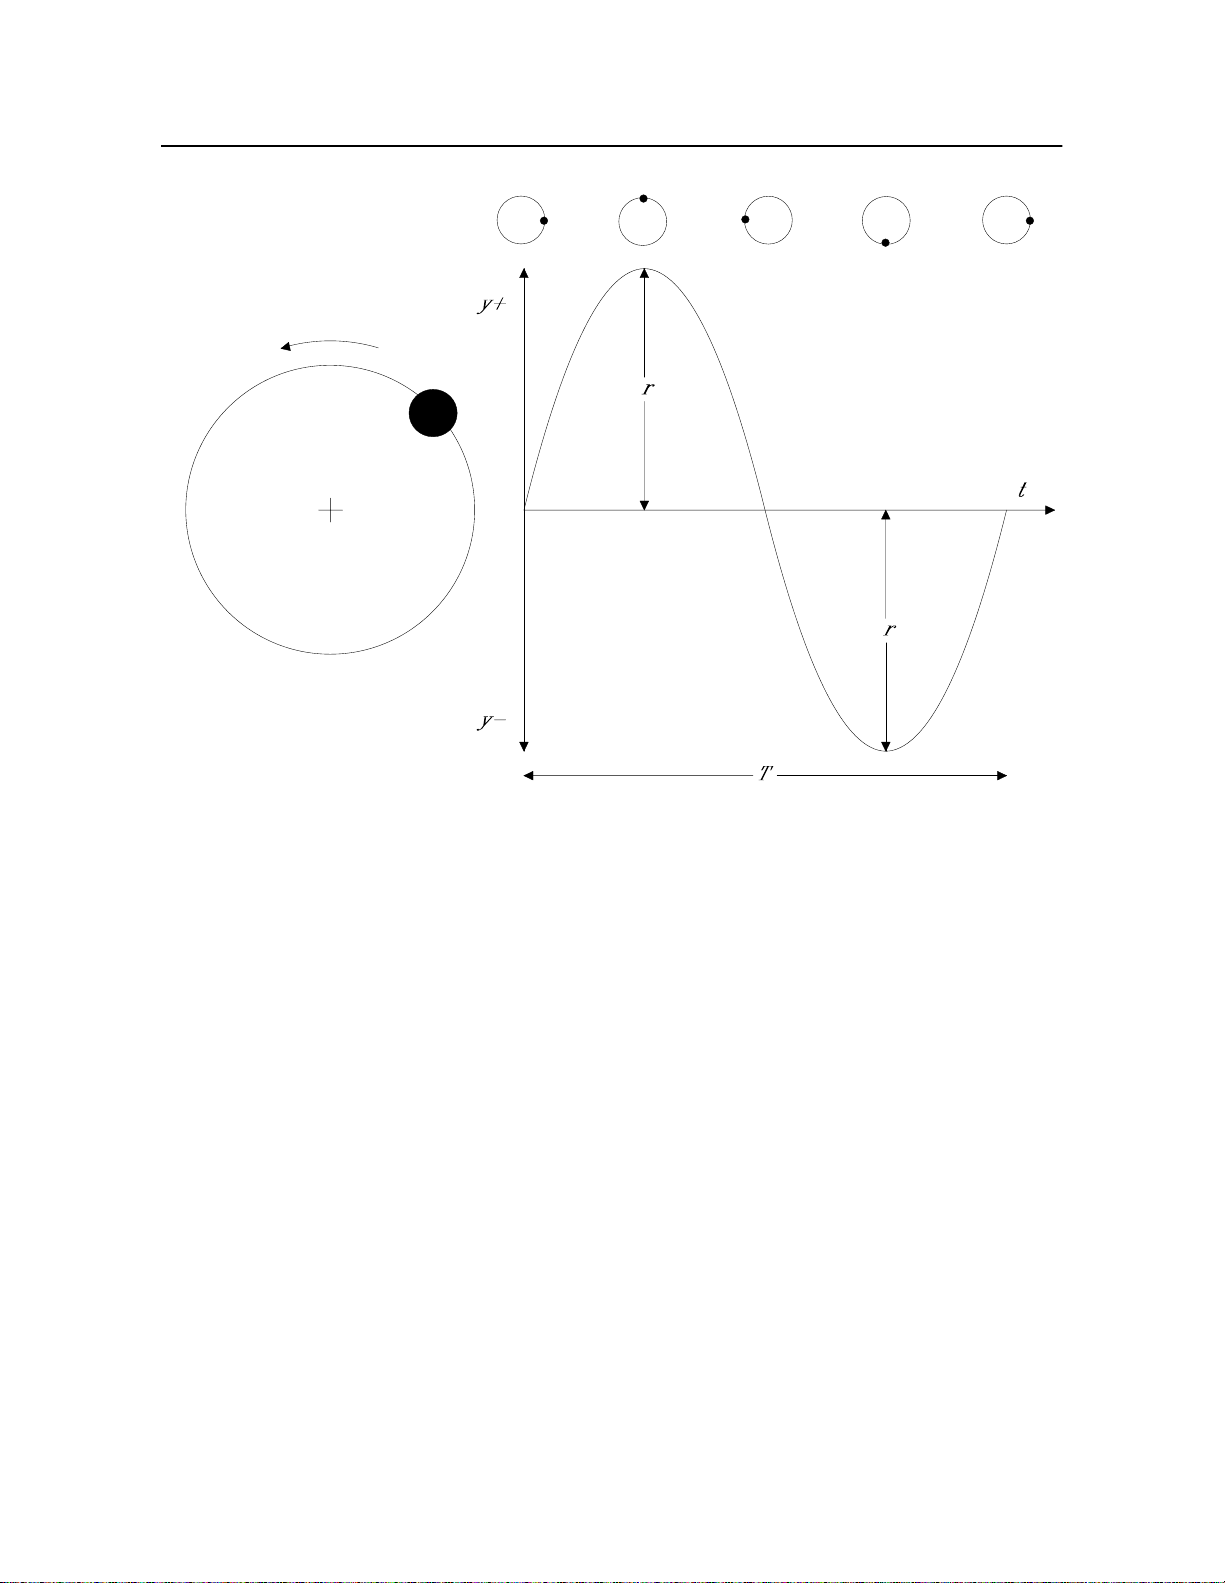
The expansion and contraction of the spring can be measured as positive and negative vibration
amplitude, respectively, and plott e d in terms of displ a cemen t v e rsus time (se e Figur e2- 3 on page2-4).
The position of the disc at any given moment is called its
angular position
(expressed in either phas
angle or clock angle). Angular position is a measure of the relationship between a given point on th
edge and some fixed artificial reference (also called
azimuth
) and is computed in terms of the central
angle subtended by the two points. The angular position of the disc thus tells us exactly where th
destabilizing mass is located. Moreover, the magnitude of the vibrational amplitude, that is, the amount
of expansion and contraction seen in the spring, is directly related to the weight of the mass.
With this inform ation , we can now pinp oi nt the sourc e of the imbalanc e and eithe r remove the
app ropr iate amount of we i g ht or add a cou nterb alanci ng we ig h t to th e oppo s i t e e d g e o f the disc. Either
action ca n correct t he out-of-bal anc e condition.
Mode l8500C/8500 C+ Operators Manual
2-3
Page 22
Chapter 2
- Overview and Basic Theory
0
Figure 2-3. Displacement in an Imbalanced Rotor
The plot in Figur e2-3 actually describ es a simple harmonic oscillator (sine curve) with time period
and f requency f, whose displacement, y, may be described mathematically by the equation
()
yrθsin=
d
In this equation, r is the amplitude of vibration and θ the phase angle.
T
2-4
Chadw i ck-Helmuth Company, Inc.
Page 23
The ory of Oper at i on
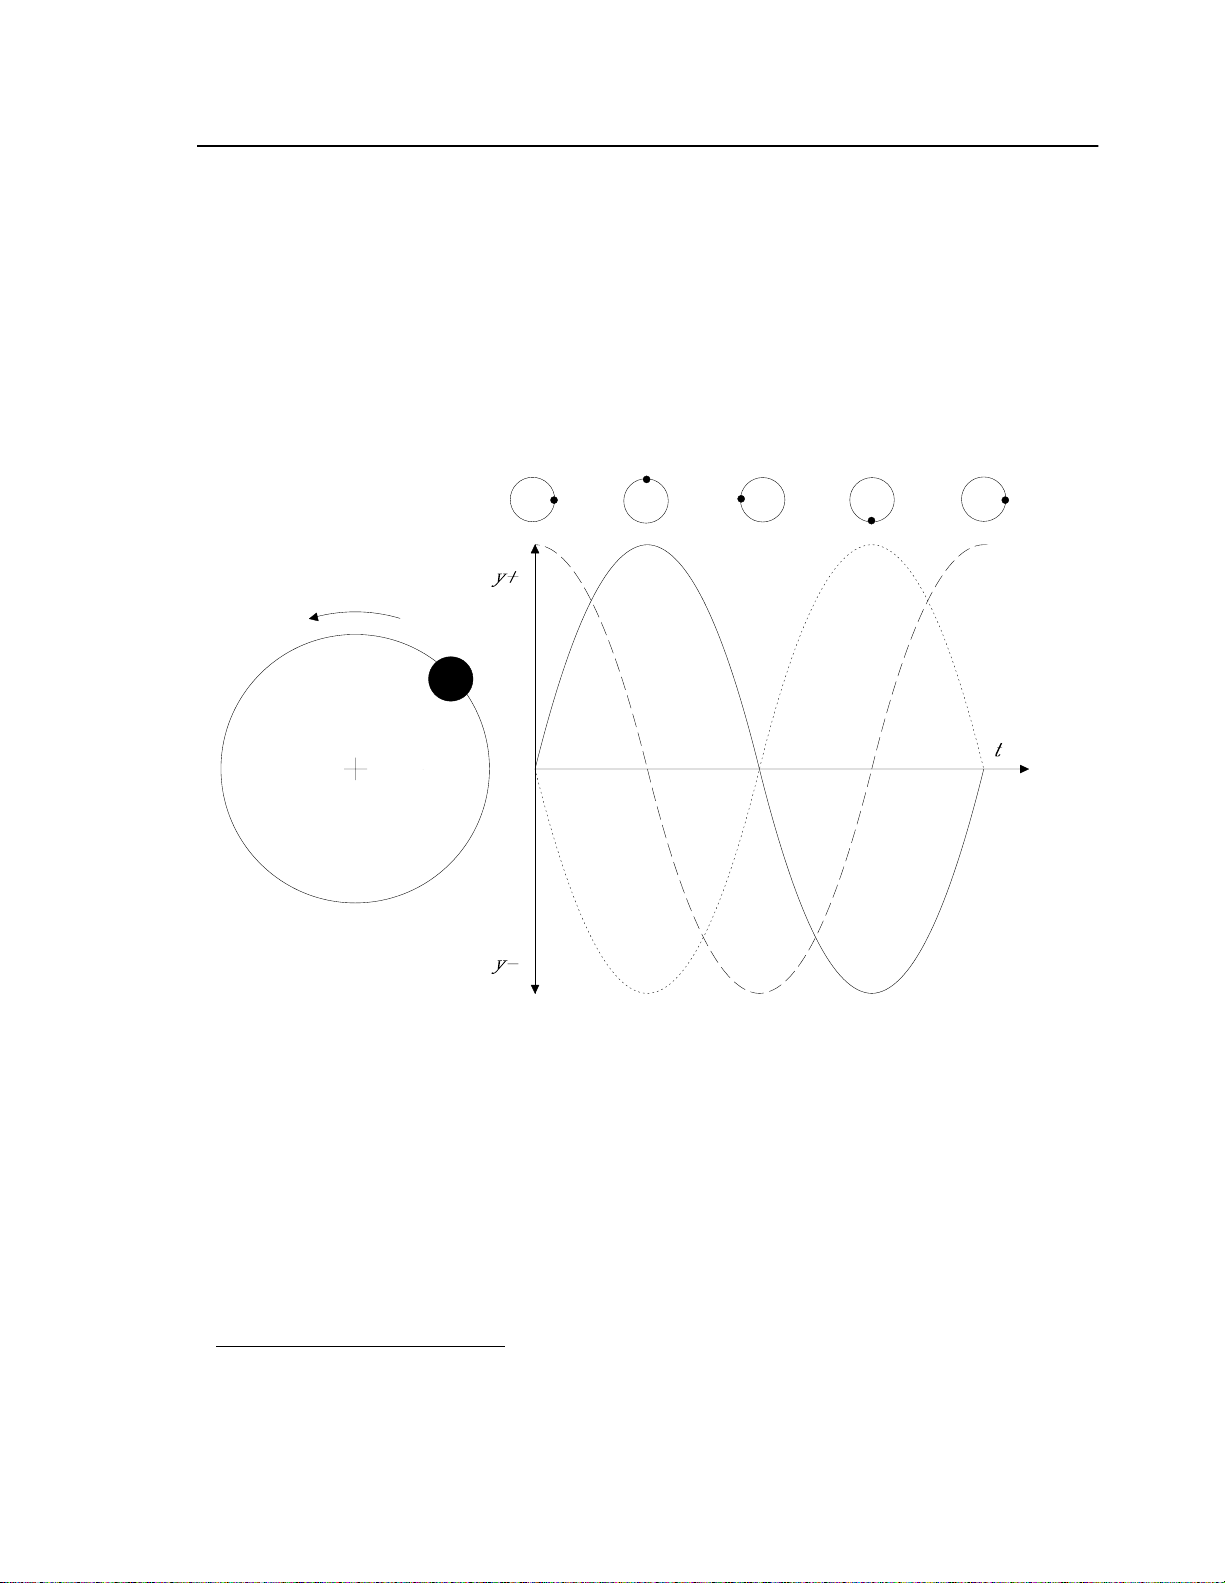
The 8500C/C+ determines the angular position and vibrational amplitude of an unbalanced rotor with
the help of a device called a
electroni
transducer
that meas ures displacement velocity, that is, t he rate of cha nge of displacement
velocimete
. The Chadwick-Helmuth Mode l 7 310 Velocimeter is a
with respect to time. The velocity, v, of a simple harmonic oscillator can be expresse d mathematically
by
v2πfrθcos=
In this equation, f is the frequency of rotation, r the amplitude of vibration, and θ the phase angle. The
waveform produ c e d b y this equation can be seen in Fig u r e 2- 4. N o te the 90°phas e shift from th
displacement w a veform.
Displacement
Velocity
0
Acceleration
Figure 2-4. Displacement, Velocity, and Acceleration in an Imbalanced Hub
A velocimeter is usually attached directly to a rotor system's support structure and oriente d in th
direction of the vibration. It generates an electrical signal whose voltage varies from plus to minus as
the support stru cture moves up and do w n during e a ch r e vol u t i o n . T h is v ar ying vo lt age is directly
proportio n a l t o th e am p li tude of vibrat ion and ac tu all y re p r e se nts t he physical motio n of the point
where the velocimeter is attached. The 8500C/C+ samples this signal and transforms it, using fast
Fourier tran sf o rm (FFT) software techniques. Then, the 8500C/C+ extracts the frequency component
of the vibration, otherwise called th
balance frequency
of the system.
1
1. Out- o f - ba la nce rotors are often subjected to sever a l differ e nt kinds of vibra tion. Th e 85 0 0C/C+
extracts a profile of these different vibration amplitudes across a broad range of frequencies and
display s th e values in a p lot o f fre q u e ncy against ampli tud e. T he largest of t h e peaks is usual l y the
balance freque nc y o f the la ter al mass imb alan ce . Th i s frequ e nc y must be select ed b y t he use r before
the balance can continue.
Mode l8500C/8500 C+ Operators Manual
2-5
Page 24
Chapter 2
STROBEX
MODEL 135M-12
CHADWICK HELMUTH
E L M O N T E , C A L I F O R N I A
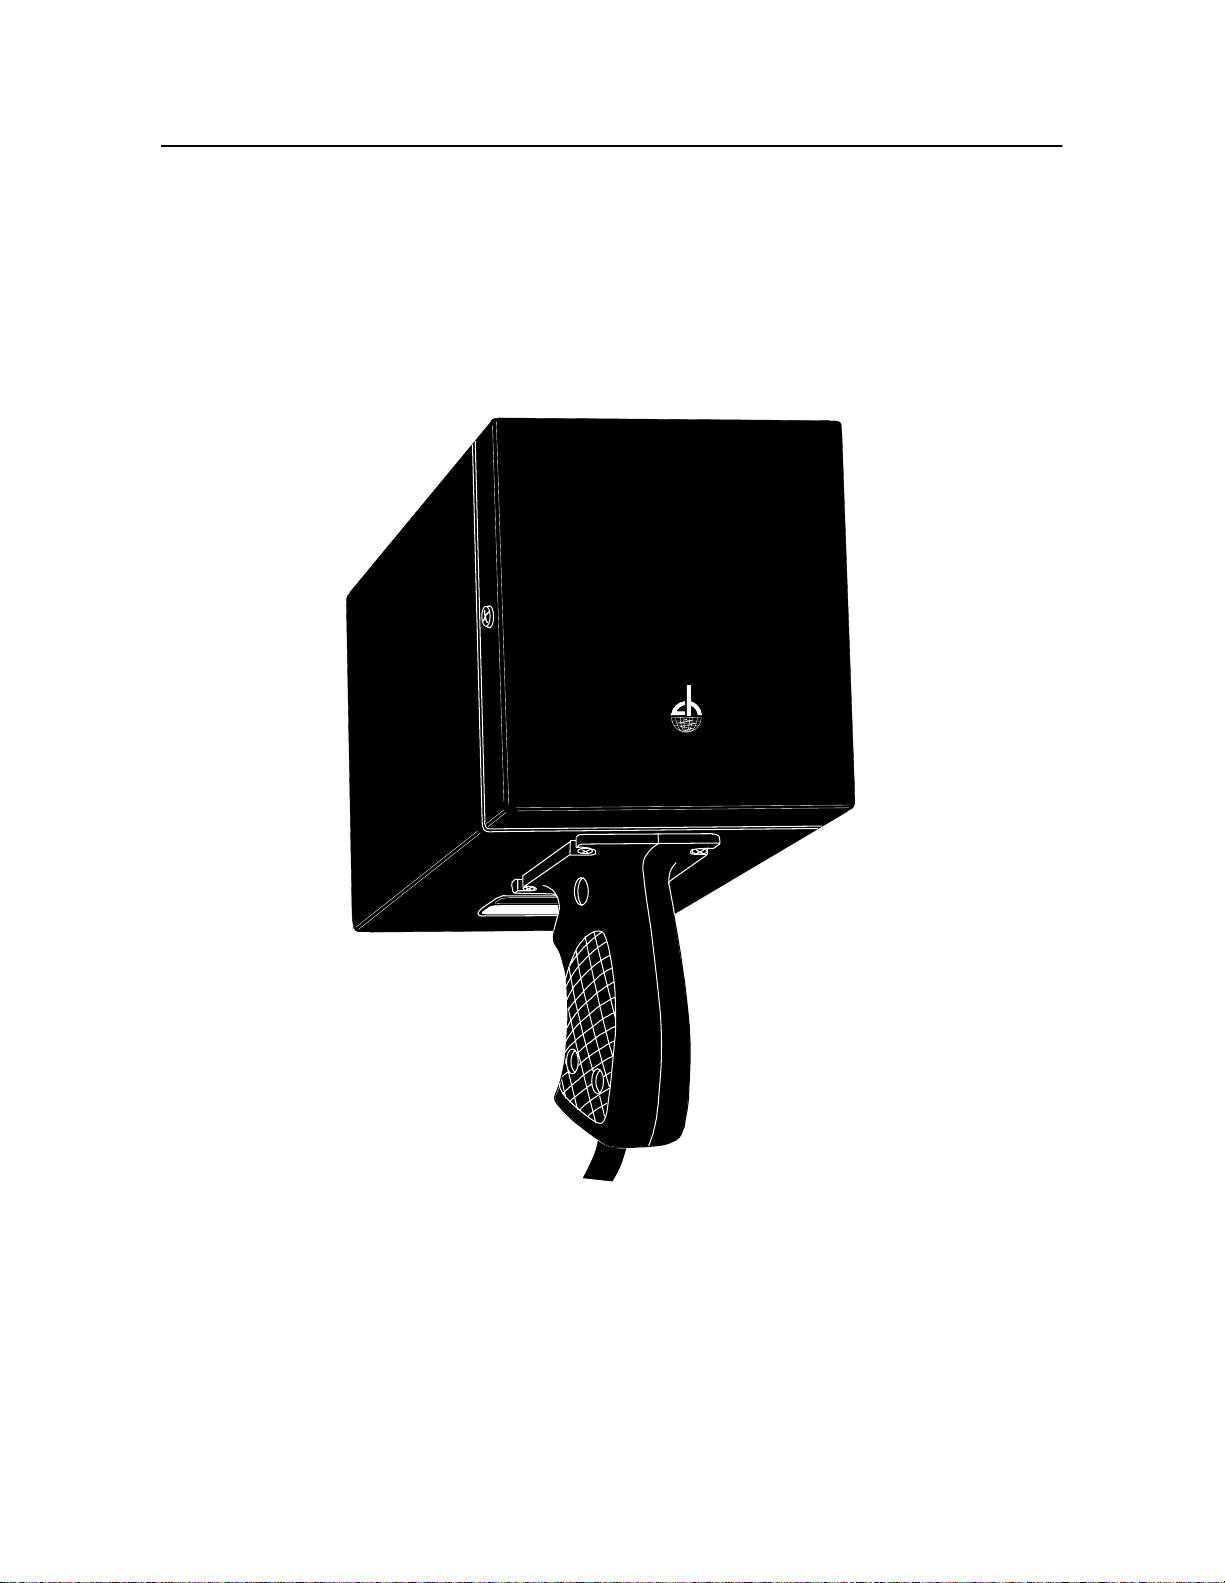
In one approach, the Balance Frequency is used to time a one-per-revolution triggering pulse to th
Chadwi ck-He lmuth M ode l 1 35-M12 Strobe x Tracker (see Fi gure2- 5). The Strobex flashes a
strobosco pic light with each trigger, and if it is aimed at a sp ecial retro -r ef le ctive target attached to the
spinning rotor, the target appears fro zen at some angular po s i t ion. Thi s angular position indicates th
exact location of the mass im b al a n ce . The 8500C/C+ can mo dul at e t he Strobex trigger so you can
visually move the target t owa rd the rotor's reference azimu th . Wh e n the two points converge, the
8500C/C+ fix es the exac t ang ula r pos it ion and a mp litu de of vibratio n th en c omp utes the balance
solution.
- Overview and Basic Theory
Figure 2-5. Strobex Strobe Tracker
The Strobex is one w a y t o lo cat e a lat eral mass im balance. You may al so use the Chadwick-Helmuth
Mode l3030 Magnetic Pickup and interrupter or Chadwick-Helmuth Photocell System and reflectiv
target to ge ner ate a one-per - rev olution refere nc e si gn a l fo r th e s pinning rotor. If the interrupter or
reflective targe t has been secured t o a known poi n t on t he spinning rot or , the 85 00 C /C+ can compare
this signal agai n st th e veloc imeter outpu t to c om p ut e the a n gular posit ion of the out-of-balance
element.
2-6
Chadw i ck-Helmuth Company, Inc.
Page 25

The ory of Oper at i on
2.2.1.1 Track Imbalances
A rotor system's track describes the geometry of the circular path made by the blades as they rotate. A
blade that is out of track may follow a slightly different path because its alignment in the plane o
rotation is ske wed. The result is a one-per- revol utio n vi bra tion whose directi on is per pendicular to the
plane of rotation. We can analyze this condition either by measuring the amplitude and frequency of
vibration or by visually characterizing the track to determine the extent of the imbalance. The former
techniqu e is ca ll ed a track or vertical balance and empl o ys principals and procedu r es nearly identical
to those u se d to correct a lateral mass imbal ance. The latter techn ique is call e d a visual track and uses
the Strobex or FasTrak
rotate. In both cases, the goal is to match the aerodynamic qualities of all the blades and thereby
elimina te the vertical vibrati ons caused by an out-of- track condition.
The major differenc e betwee n v ibr ati o n s generated by a lateral mass imbalance and those generated by
a track or vertical imbalance is the direction of the vibrational forces. Otherwise, the principals
governing them are nearly identical. To solve a track imbalance, we therefore have only to orient the
velocim et er perpendicul ar to the plane of rot ati o n . The 8500C/C+ ex t racts from the veloci m e t er signal
the amplitude of vibration and balance frequency and uses a reference s ignal from a magnetic pickup
or Photocell to determine the phase angle of the out-of-track vibration. With this information it can
then co mp u te a s o l uti on based on the adjustment o f tr im tabs o r pitch links t hat physical l y modify the
blade's track.
Tm
Optical Track er t o illuminate the rel a ti v e position of the blade s as they
In a visual track the one-per-revolution signal from a magnetic pickup or Photocell is used to drive th
Strobex flash. If each rotor blade has secured to it a retro-reflective target, we can identify each target
as it is illuminated by the Strobex flash. In a perfectly tracked system, the images line up precisely
along the planar path of rotation established by all the blades. The extent to which any blade image
deviates from the path is an indication of the relative degree of track imbalance. Adjustments to th
aircraft' s trim tabs and/or p it c h links can usually bring the anomalous bl a de back in t o alignment.
2.2.1.2 Blade Sweep
Blade sweep
rotation. Blad e sp a c i ng t h a t is no t equi an g ul ar c an cause si g ni fi can t perturbations to the system's
lateral balance. For this reason, balance solutions for some helicopters call for modification of the
rotor's b la d e sw eep rathe r th an addition or s ubtraction of weights.
Visual tracking a l low s yo u to gau g e the relative amount o f separation betwe en S tr o be x- illuminated
blade images. This separation is indicative of the relative angular spacing between the actual blades.
The FasTrak
or
lead-lag
TM
Optical Tracker is able to exactly determine the Lead-Lag of the target rotor.
refers to the angle of separatio n between in di v i du al blades within the plane of
2.2.2 Balance Charts
We have seen how the 8500C/C+ can identify the vibrational characteristics of a rotor system by
providing two essential me a surements, vibration amplit ude and a n g ula r posi tion. But in order to
compute an actu al ba la nce solution, that is, h ow much weight t o add or subtrac t, and w h ere to apply
the changes , th e o pe r ator first n e e d s t o know something about the relationshi p between the physical
balance points of th e sy s tem a nd values for am p litu d e and position. In particula r , on e needs to be able
to predi ct h o w v ibr a tio n amplit u de a nd angular po si t io n change wh en one makes specific adjustments
at the balance poin ts. T his in formation has be en experimentally determined f or most aircr aft types and
organized into a unique form called a
balance chart
.
Mode l8500C/8500 C+ Operators Manual
2-7
Page 26
Chapter 2
- Overview and Basic Theory
Each balance chart contains data that describe a single rotor element from a particular aircraft type. In
the 8500C/C+, related balance charts are stored digitally in a balance chart file. They may also b
represented graphically and can be found in almost any Chadwick-Helmuth paper balance chart. Paper
balance charts provide a simple way to visually fix a balance measurement and calculate the weight
adjustments requ ire d t o balance th e rotor. Although the 8500C/C+ does n ot require the use of paper
balance charts, it does use the information they contain. It is therefore important for purposes of ou
discussio n to unde rs t and s ome of the the or y behind t hem.
2.2.2.1 Paper Balance Charts
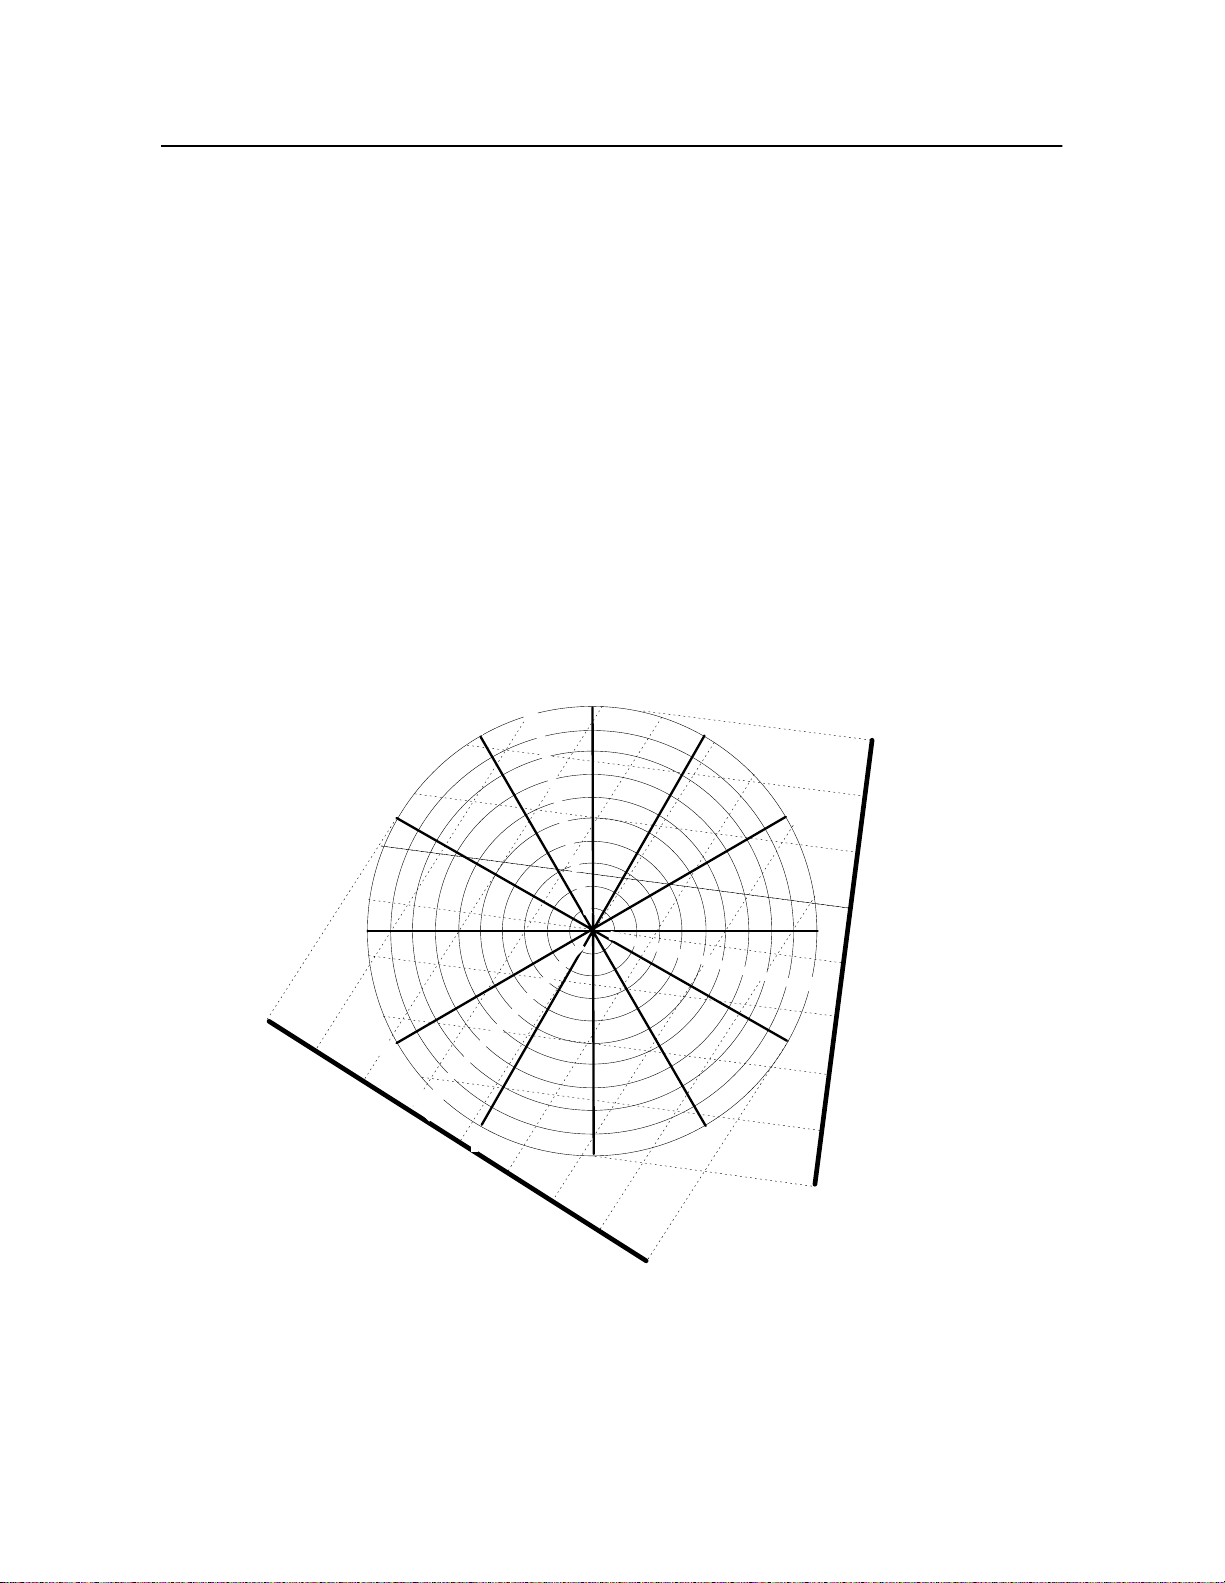
A paper bal an ce chart con s i sts o f a clock face who se 12radial li nes represent the clock angle of th
balance mea s ur ement (see Figur e2-6). C on c en tr ic cir cl es draw n a round the cen te r of the clock face
delimit diff er ent va lue s of vibration amplitude . Finally, a graph is l a id o ve r the clock face. The graph’s
axes re p res en t the geometrical relat ion s hi p b et ween the weight att a chmen t p oints of the aircraft. If, for
example, the attachment points are 9 0 °apart, as on a four-blade rotor, the axes of the graph are
perpendi cular to each other. The axes are labeled with weight amounts, and their values are inversely
proportio n a l to the le n g t h o f the moment arm f o r me d by the cen ter of rotation and the weight
attachment point (a weight has more effect t he further o u t i t i s pl a ced along a bl ad e, so smaller
amounts are needed).
12
"
S
P
I
"
0
.
1
11
10
9
1
6
1
2
S
u
b
t
r
a
c
t
f
-
r
o
r
A
-
d
d
t
o
A
8
8
o
m
4
C
W
E
I
P
i
t
c
h
-
G
R
A
M
8
.
.9
0
1.
S"
P
"I
7
0
G
H
T
a
t
L
i
n
k
S
-
9
.
8
.
7
.
6
.
5
.
4
.
3
.
2
.
1
.
.
1
.
2
.1
2
.
.3
.4
.5
6
.
.7
4
6
8
S
1
u
b
A
d
2
t
r
a
c
t
1
f
-
r
o
r
-
d
t
o
C
6
o
m
A
1
4
B
T
m
E
o
2
3
2
G
r
R
f
A
T
r
t
o
c
o
-
a
t
r
t
d
b
d
u
A
S
1
.
3
.
4
.
5
.
6
.
7
.
8
3
W
E
I
G
H
0
1
.
"
9
.
I
0
P
S
"
T
A
T
T
I
-
G
P
R
A
M
S
-
1
T
4
5
E
G
R
A
2
T
B
m
o
-
o
r
r
t
f
o
-
d
t
3
4
d
c
A
a
r
t
b
u
S
2-8
Chadw i ck-Helmuth Company, Inc.
Figure 2-6. Sample Paper Balance Chart
Page 27

The ory of Oper at i on
A balanc e m ea s urement reading allows the operator to plo t t h e intersectio n of vibration a mplitude and
phase angle on the clock face. Extrapolation of this point to the axes of the graph determines the
location and mag n itu de of the requir ed adjustments. In most c as es, a balance p o i n t indic a t es two
correctiv e move s , one for ea c h blade w h os e axis encom pa ss es the balan c e point. The exact procedur
required t o balance the r o to r depends on the cha rt be ing used.
2.2.2.2 Theory of Chart Creation and Correction
Individua l rotor s ys t em s o f a parti cula r typ e rarely exhibit i d en t ic al v i b rat i onal ch aracteristi cs.
Differences i n manufact ure and repair, as well as variations in ai r f rame stiffne s s and resonant
frequency often call for different balance solutions. The uniqueness of each system's mechanical
response thus precludes using a single set of ideal parameters to build balance charts. As a result,
charts d o not exemp lify ab st r ac t theoretical m od e l s of rotor per for m an ce . Inst ead, the y are created by
carefully averaging many exp eriment al m easurements of a pa r tic ular rotor type. This approach means
that ch art s may not al ways accord w i th actual ro tor measurem e nt s , i n some cases d ive rging enough to
prevent p ro per ba la nc i ng.
We can compensate for these inherent biases by using the 8500C/C+ to correct individual balanc
charts, mo d if ying them so tha t each chart can be tuned to th e u niqu e phy si cal ch ara c t er istics of
individual systems.
Chart c o rrections compare the actual effe ct s of wei gh t on vibr ati on amplitu d e and clock angle against
the change s predicted by the chart. We can quantify th e compariso n by mea n s of a special calculation,
the
move line
balance char t i t is i de nt i f ie d by the straigh t li n e dra wn between two balance point s. Normally, the
direction of the move li ne ch ange s in a predict ab le manner as one makes t h e we i g h t adju stments
prescrib ed by the chart . If, for example, both correctiv e moves are mad e, th e move line goes toward o
through the center of the chart. If only one move is made, the move line runs parallel to the fine lines
extending fr om the axis of the unmodif i ed bl ade. In other words , the weight on this b la d e has not been
changed. T he d iffere nce between the obser ve d d irection and the exp ec te d directi on i n d icates the
amount o f phase an gle c orrection t ha t must b e appl ie d to su bs equent measurem ents. This correction is
usually accomplished by rotating the clock face or writing new clock numbers around the paper chart.
In the 8500C/C +, a correction f ac t or fo r phase is computed and a d d ed to the bal ance ch ar t database.
This correction fa ct o r i s th ere after applied to al l calculations involving the phase angle.
. The move line is the vector differen ce between two balance measurements. On a paper
The magnitud e of the move lin e (t h at is, its l ength) also signifies a particula r vibrat i on level or
amplitude. It should al so chang e i n a predictab le man ner as we make the w eig h t a d justments
prescrib ed by th e chart. Makin g on ly o ne of the corr ective moves bri ng s the move line directly to the
zero w ei ght c ha ng e ax is for that bla de. In o the r wo r ds, t h e weigh t change requi r e d b y t hi s blade has
been imp l emented. T h e len gth o f the move line is therefor e directly rel at e d to the size o f the w eight
adjustment. The ratio of the observed magnitude to the expected magnitude indicates the percentag
weight correction, as well as the percentage amplitude adjustment, which must be applied to
subseque n t meas ur emen t s. F or example, if t h e move line is too long , too muc h we i g ht has been added.
If it is t o o shor t, not enou g h wei g ht has been u s ed . In t he 850 0C/ C+, this rat i o becomes the correction
factor f or v i bra t ion amplitud e . It is ad d ed to th e balance chart dat abase and the re a f te r applied to all
calculations of weight adjustment.
Mode l8500C/8500 C+ Operators Manual
2-9
Page 28
Chapter 2
- Overview and Basic Theory
2.3 System Architecture
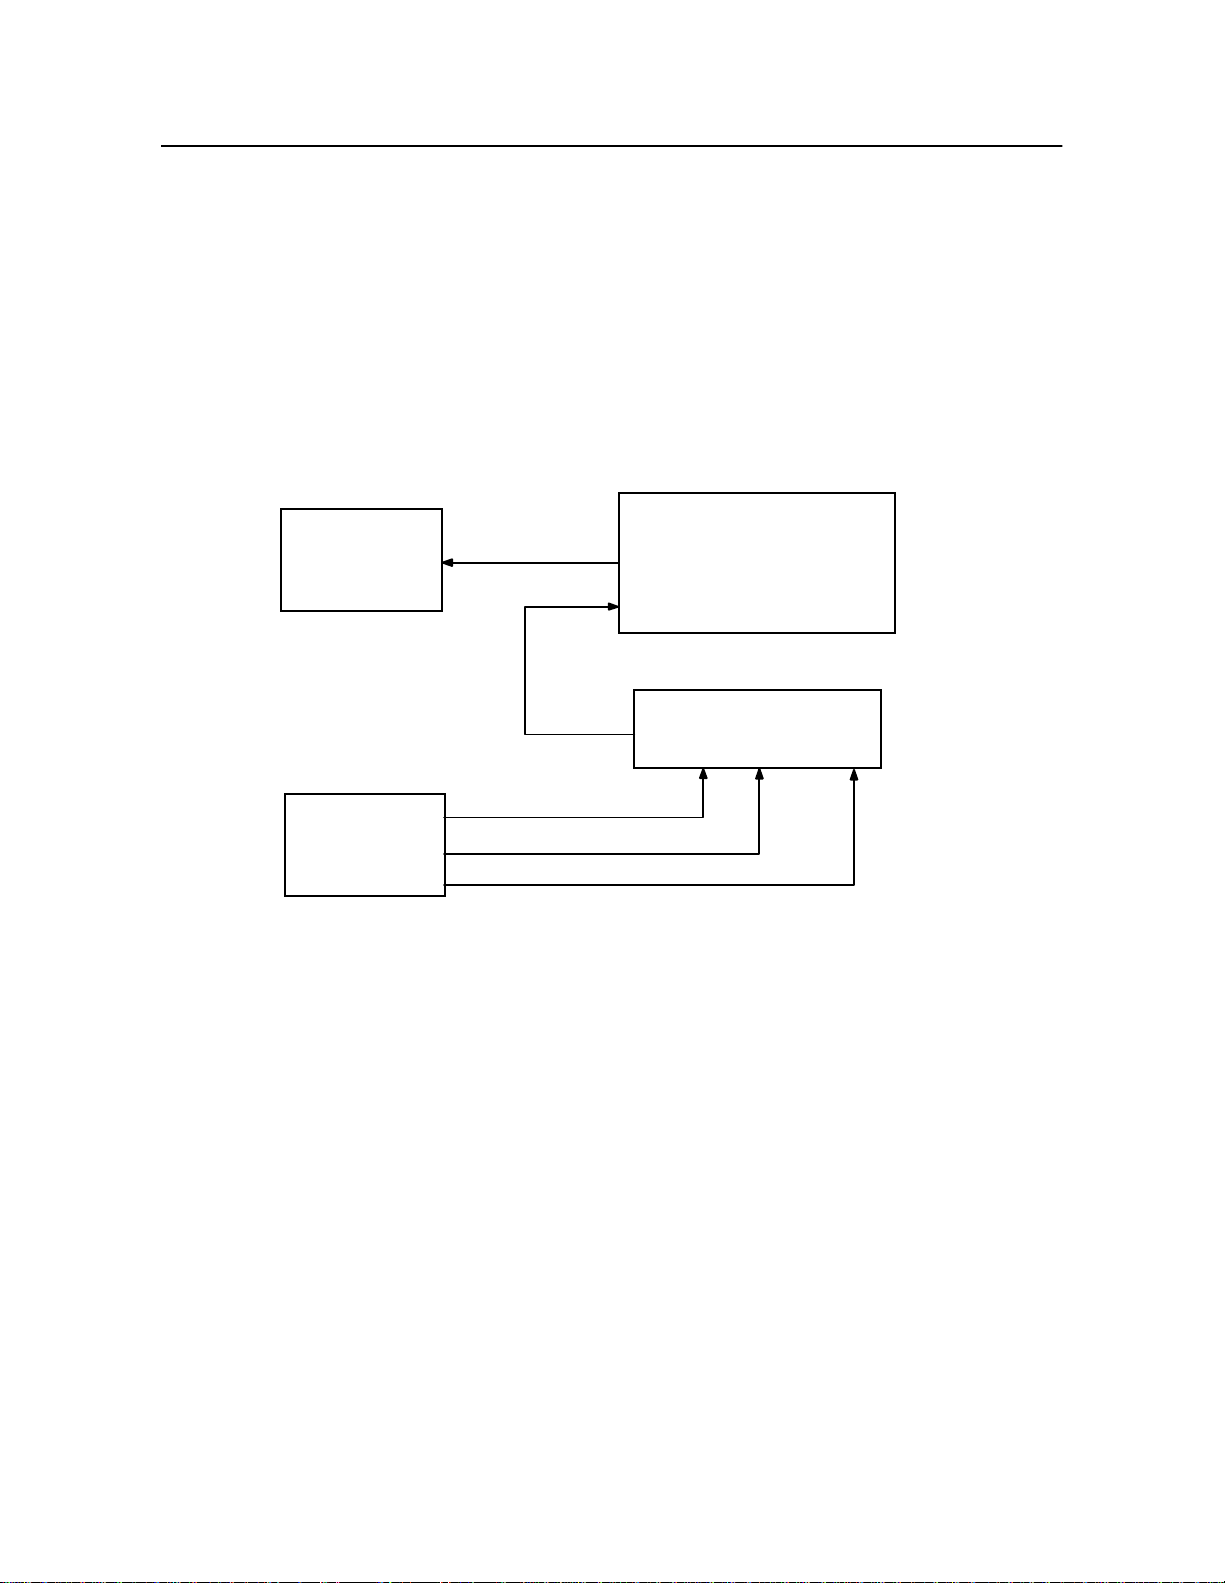
Figur e2-7 below s hows an overal l bl o ck diagram for the 8500C/C+ s y st em . The 8500C/C+ itself can
be divided into the following major logical components:
• Digital subsyst em, conta inin g me mory, microprocessor, communications contr olle rs, and clock
chips
• Data acquisition or analog subsystem, containing analog inputs, waveform generator, input
multiple xor, analo g -t o-digital co nverter, programmable gain stage , an ti alia sing filt er, and clip
detector
Model 8500C/C+
Strobex
28 VDC
Balancer/Analyzer
Main Unit
28 VDC
Model 8520C
Signals
Signal Selector
28 VDC
Aircraft
Under Test
Figure 2-7. 8500C/C+ System Block Diagram
Vibration Input
Magnetic/Photocell Pickup Input
8500SYBK.DS4
2.3.1 Digital Subsyste
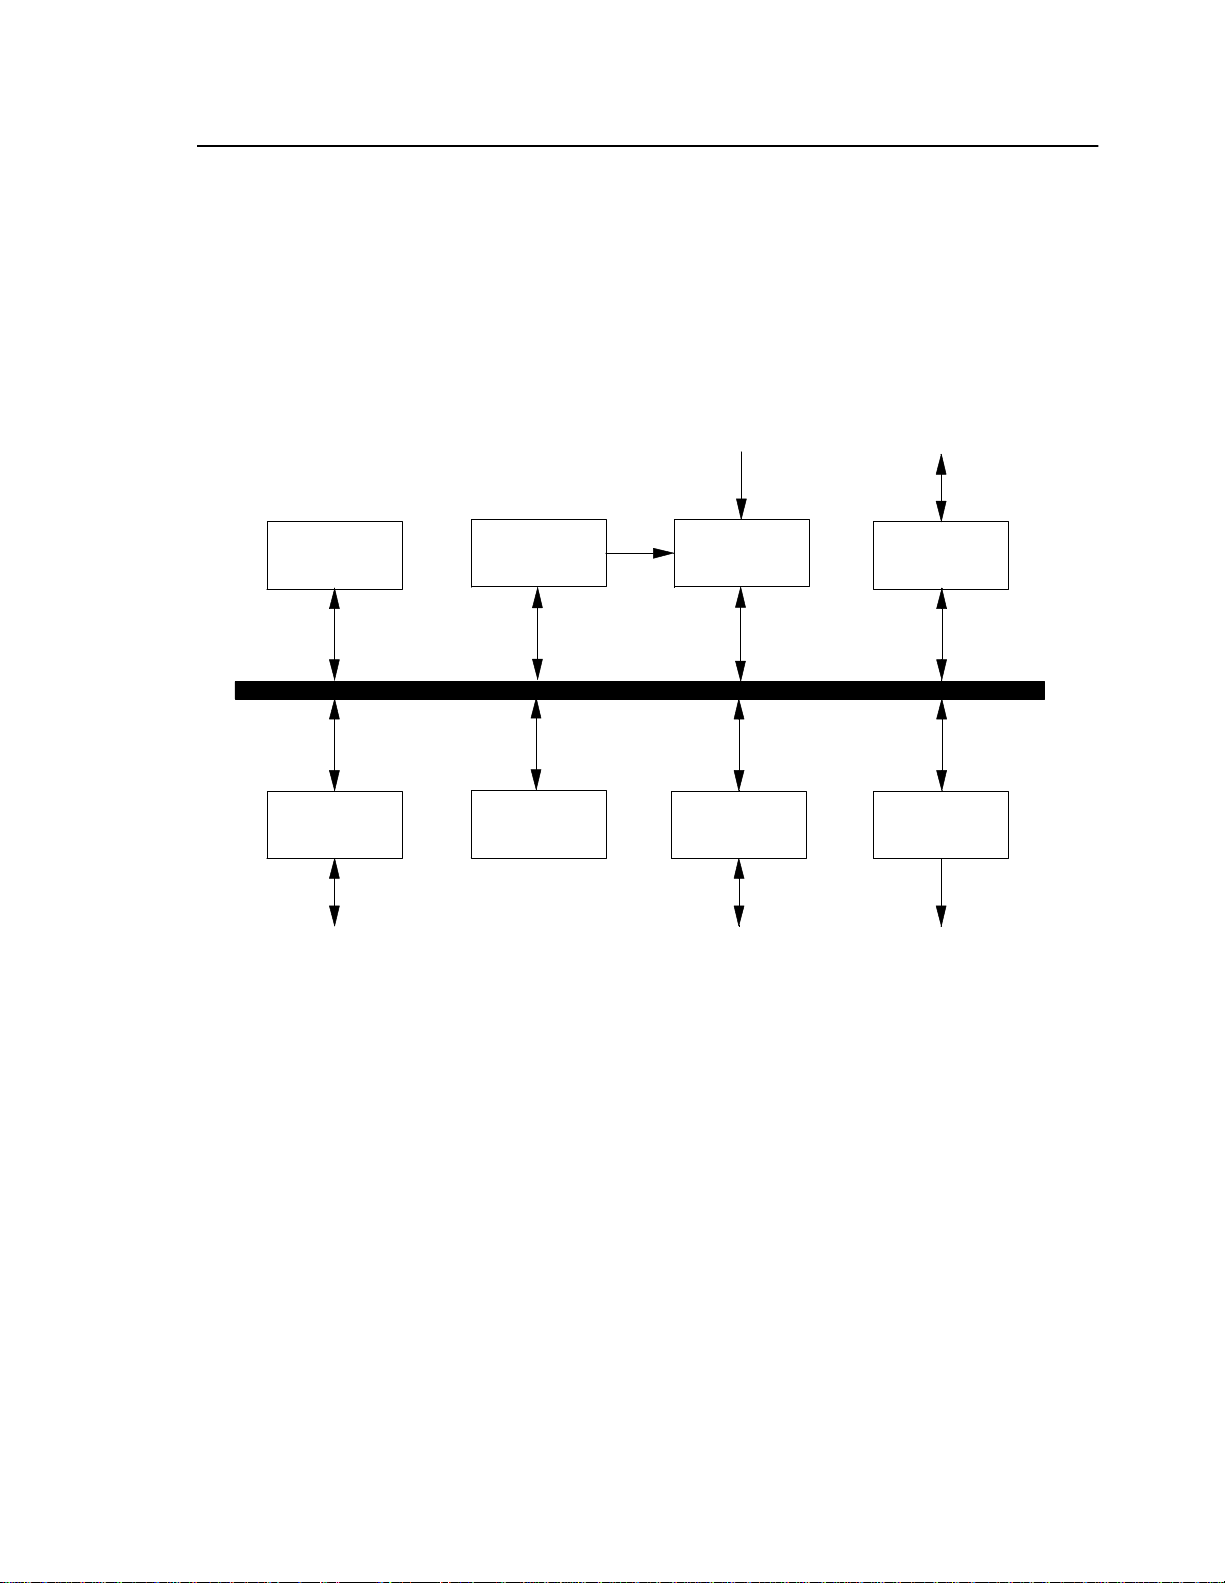
The 8500C/C + d i gita l s ubsy stem is m ad e u p of e ig h t maj o r fu nctional bl ocks , as depic t e d in the block
diagram in Figur e2-8 on pag e2-11. All components communicate over a high-speed system bus, with
each block controll ing its peripherals dire ctly t hr ou g h de dicated interfaces.
2-10
Chadw i ck-Helmuth Company, Inc.
Page 29
System Ar chitectu re
The microprocessor controls the entire system by communicating with the other blocks over the
system bus. Instructions and data used by the microprocessor are stored in memory. The memory block
itself is d i vided into th e foll owing sections:
• Program memory in the form of the read-only memory (ROM) that stores the system's software
• Temporary data memory in the form of dynamic random-access memory (DRAM
• P ermanent data memory in the form of nonvolatile static RAM
Sensor
Input
Disk Unit
Micro-
Processor
System
Bus
Parallel
I/O
Operator
Keypad
Timing
Controller
Memory
Acquisition
Serial I/O
Printer
Unit
Controller
Display
Control
Operator
Display
Figure 2-8. 8500C/C+ Digital Subsystem Block Diagram
The timing co ntrol l er is t h e system timing master. It gen e r at es t h e t im i n g si g n als used to con trol maj o
functions, such as analog-to-digital conversion, external synchronization, and strobe triggering. Th
timer dri ve s the Strobex trig ger by co n n e c tin g to it throu g h an opto-isol at or at the strobe interface.
Timer counters ar e completely under program co n tro l , and the mic ro pr oc essor communicates with
them over the system interface.
The serial in pu t-o utput (I/O) block controls th e var io us s erial i nterfac es, as well as th e clock interface
and a portion of the analog data acquisition interface. The clock interface communicates with
dedicate d real-time cloc k t ha t ma i n ta i n s t he s y s tem date, day, and time. The disk controller block
mediates d ata flow be tween the rest of the syste m and the 8500C/C+’s 3.5-in . floppy disk drive. The
keyboard c on t ro ll e r bl ock reads keyboa r d inpu t thr ough the key board interface, and the display
controller bloc k direct s the liqu id-c r y st a l d i sp l ay (LCD) outp u t thro ugh the display inte rface.
Mode l8500C/8500 C+ Operators Manual
2-11
Page 30
Chapter 2
- Overview and Basic Theory
2.3.2 Analog Subsyste
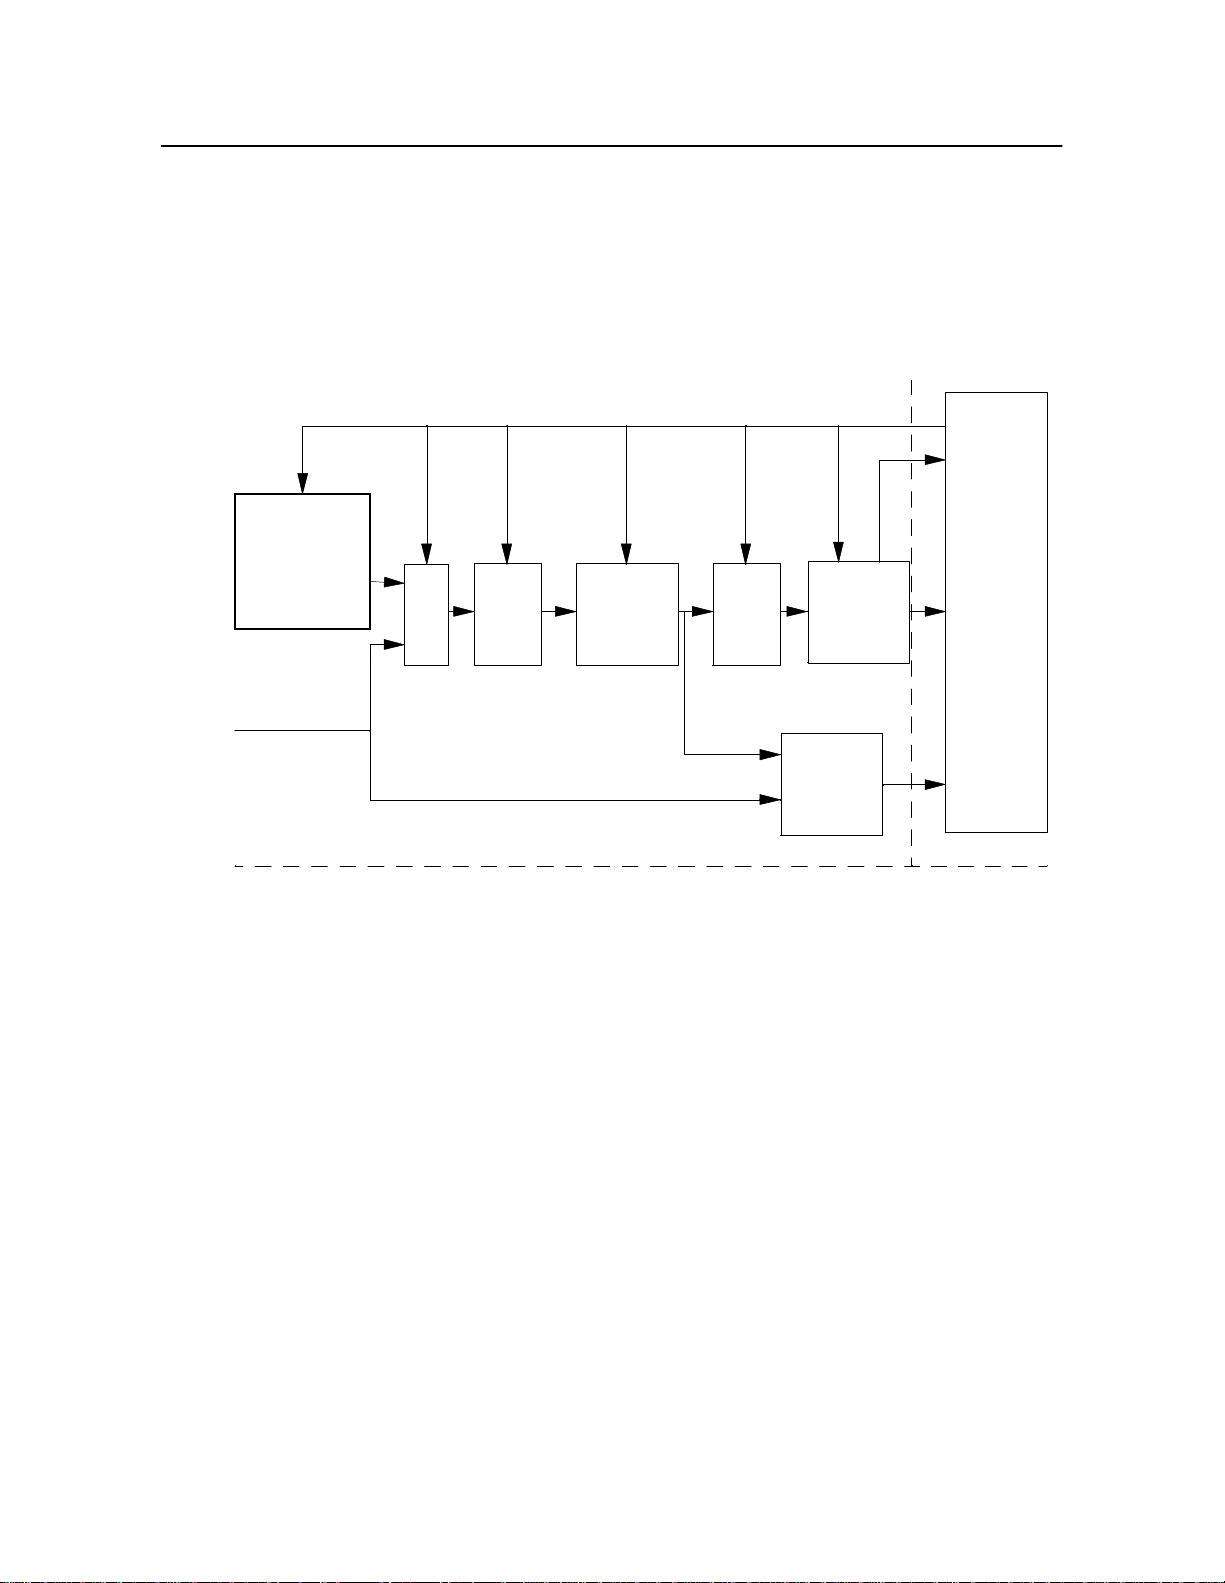
The analog subs ys te m reads anal og input si gna ls di rectly f rom the v el ocim eter or wave for m generator,
filters them, sampl es t hem , and converts th e m t o d ig i ta l f o r m th r ou gh t he a na log -t o-digital converter
(see Figur e 2 - 9 below). The ti ming controller p ro v i de s p rogramma bl e c l oc k signals that synchronize
this process. The digitized data are output to the microprocessor over the system bus where they are
stored in me mory for anal ysis and display by the executi ve software.
Auto-c a libratio n
Test Wave form
Generator
Vibration
Sensor Input
Mux
Anti-
Alias
Filter
Stage 1 Stages 2-5
Programm ed
Gain
AntiAlias
Filter
A/D
Converter
Clip
Detector
Bus
Inter face /
Timing
Controller
Analog Board
Digital Board
Figure 2-9. 8500C/C+ Analog Subsystem Block Diagram
The analog subsystem includes a high-performance antialiasing filter to reduce spurious signals
introduced b y the sampling process. A vari ab le g ain sta g e in the analo g inp u t signal pat h am plifies the
analog signal so that a high signal-to-noise ratio can be maintained over a wide dynamic range of
signal amplitudes. The gain is under program control and is set by the microprocessor through a
digital-to-analog converter. The on-board waveform generator provides known reference signals fo
calibrat ion ver if ica ti on and te s t o f the analo g subsystem. A multi plexer select s ei the r th e velocimeter
input or the intern a l waveform generator a s the i n p u t t o th e analog signa l pa th . Finally, a clip detector
circuit ensures that no input sign al amplitudes exceed a fixed reference voltage level.
For a detaile d functional description of the 8500C/C+’s system arch ite c ture, see t he Model8500C/C+
System Maintenance Manual.
2-12
Chadw i ck-Helmuth Company, Inc.
Page 31

Chapter 3
3.
Unpacking and Installation
The Model8500C/C+ Balancer/Analyzer is a self-contained kit packed in a rugged case. All the
accessor ie s needed for opera t ion are includ e d i n th e kit . Com pl et e u n packi n g i ns t ruct ions for the kit
are included in the Mod el8500C /C + S ystem Mainten ance Manual. The information in this chapter is a
brief summ ary. Chapt er 3 gives you unpacking and ins t al lation informa ti o n , under the following
topics:
Section 3.1 Mo de l8500C/C+ a nd Ins t allation.......... .. .... .. .... .. .... .. .... .. .... .. .... .... .. .... .. ..........3-1
Section 3.2 Sign a l Sel ector and Inst a llation........... .. .... .. .... .. .... .. .... .. .... .. .... .. .... .... .. .... .........3-2
3.1 Model 8 5 00C/C+ and Installation
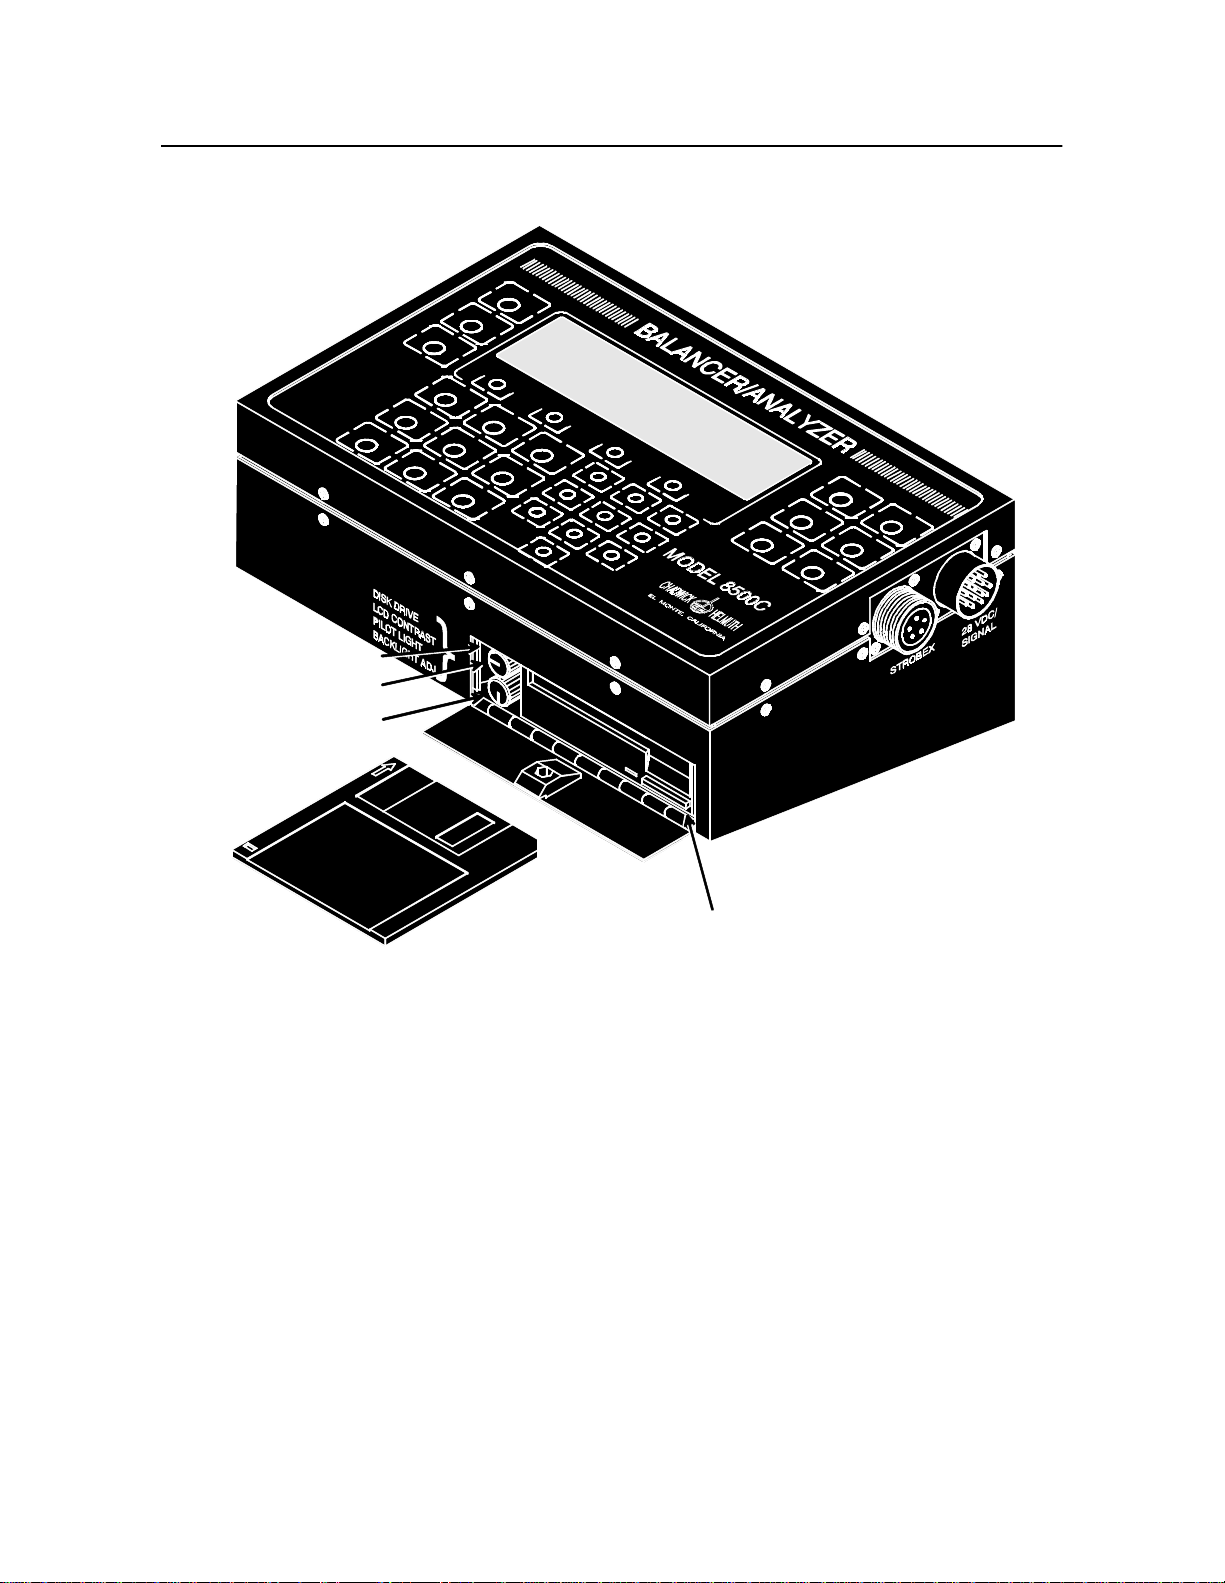
Figur e3-1 on page3-2 s hows a top and front view of the 8500C/C+ . The Mode l1 35M-12 Strobex and
28-Vdc power/ s ig nal connectors are on the right side. The l i quid - c rys t a l di s pl ay (LCD) co ntrast
adjustment is on the left . The di sk drive do or i s on the fro n t of the unit.
CAUTIO N: The 8500C/C+ can o nl y ope rate fr om a 2 8 -Vd c power supply. Plugging the
8500C/C+ int o a p ower sour ce o ther t han 28Vdc m ay cause severe damage to the
instrument.
Mode l8500C/8500 C+ Operators Manual
3-1
Page 32
Chapter 3
W
POWER INDICATOR
(ABOVE KNOBS)
LCD CONTRAST ADJ.
- Unpacking and Installation
BACKLIGHT ADJ.
M
O
D
E
L
8
5
0
0
C
K.DR
85CD
FILE:ISO
DISK EJECT
Figure 3-1. Model8500C/C+ Balancer/Analyzer
3.2 Signal Selector and Installation
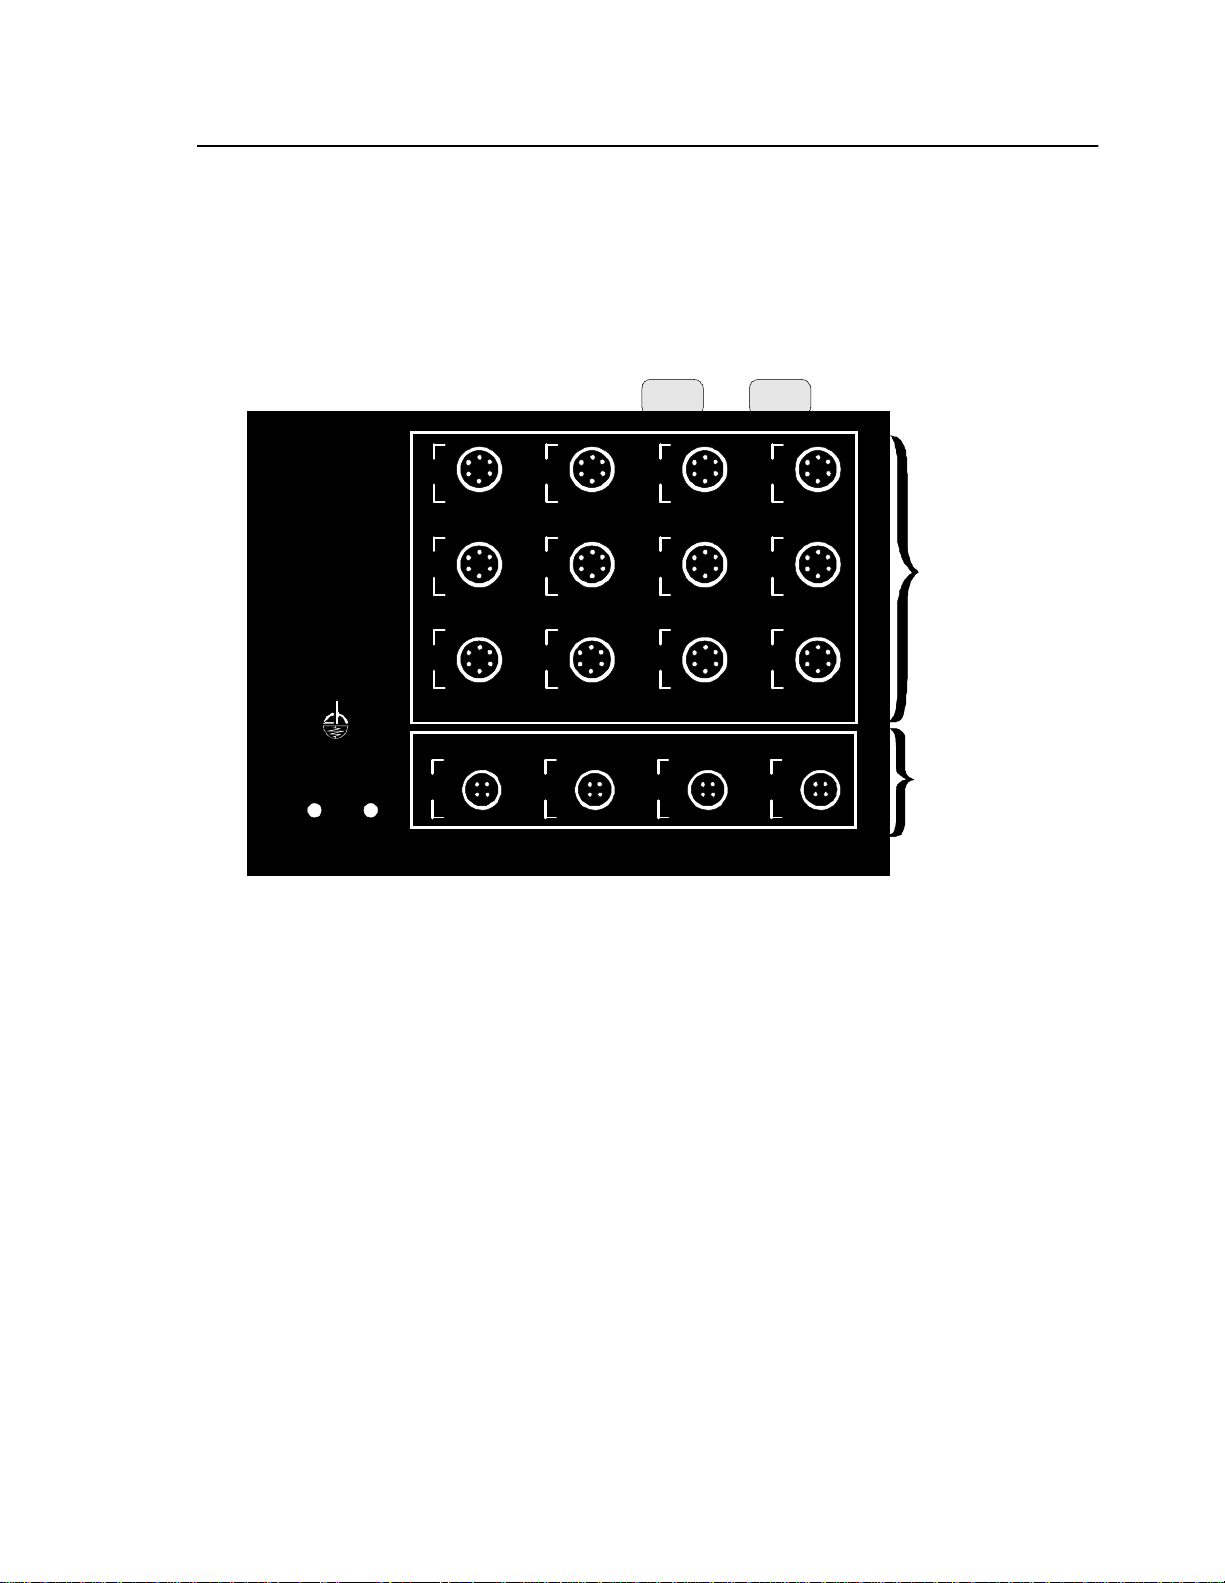
The Model8520C Signal Selector (see Figure3-2 on page 3-3) multiplexes vibration and pickup
signals from several sources and allows a host processor (8500C/C+) to select any pair of signals fo
analysis . Up t o t w en t y Mode l7310 Ve locimeter inputs and 4 S yn ch or Model11800 FasTrak Optical
Tracker, Mode l3030 Magnetic Pickup, and/or Photocell inputs may be connected at a time. The
8500C/C+ h a s th e abil ity to au to ma tica lly determi ne t he presence of a Si gn a l Selector, and to read the
input channels selected by the operator. See C hapter11 Mode l8520C Signal Selecto ” for a more
detailed description of the S ig nal Selec t or and its us e with the 8500C/C+.
3-2
Chadw i ck-Helmuth Company, Inc.
Page 33
Signal Selector and Instal lation
The Signal Selector is part of the 8500C/C+ kit. Although it is not required in order to make full use o
the 8500C/C+, it may be required for those applications that read input signals from more than on
velocimeter or magnetic pickup at a time.
SIGNAL
1
4
7
10
SELECTOR
MODEL 8520C
2
5
8
11
VIBRATION
CHANNELS
12
D
AZIMUTH
CHANNELS
CN_8520..DRW
CHADWICK-HELMUTH
E L M O N T E , C A L I F O R N I A
POWER
VELO
SHORT
3
AB
6
VELOCIMETER CHANNELS
MAGNETIC PICKUP/PHOTOCELL CHANNELS
9
C
Figure 3-2. Model 8520C Signal Selector
Signal Se lector signal chan n els are la beled on the front pane l of the unit. Cha nnels N o.1 through12
accept velocimeter i nputs , and channe lsA thr oughD ac ce pt FasT ra k, ma gn e tic p i cku p or Photocell
inputs. Also on the right of the front panel are the power conn ector (28Vdc ) and a power/output
connector f o r attac h ment to an 8500C/C+. Note that when used togethe r with th e 8500C/C+, the Signal
Selector supplies all power and communications signals to the 8500C/C+. It is therefore essential that
only a 2 8Vdc powe r supply be us e d t o opera t e the Si gnal Selector. Plugging the Signal Se l ec t or into a
power source other than 2 8Vdc may cause severe damage to the instrument.
Mode l8500C/8500 C+ Operators Manual
3-3
Page 34
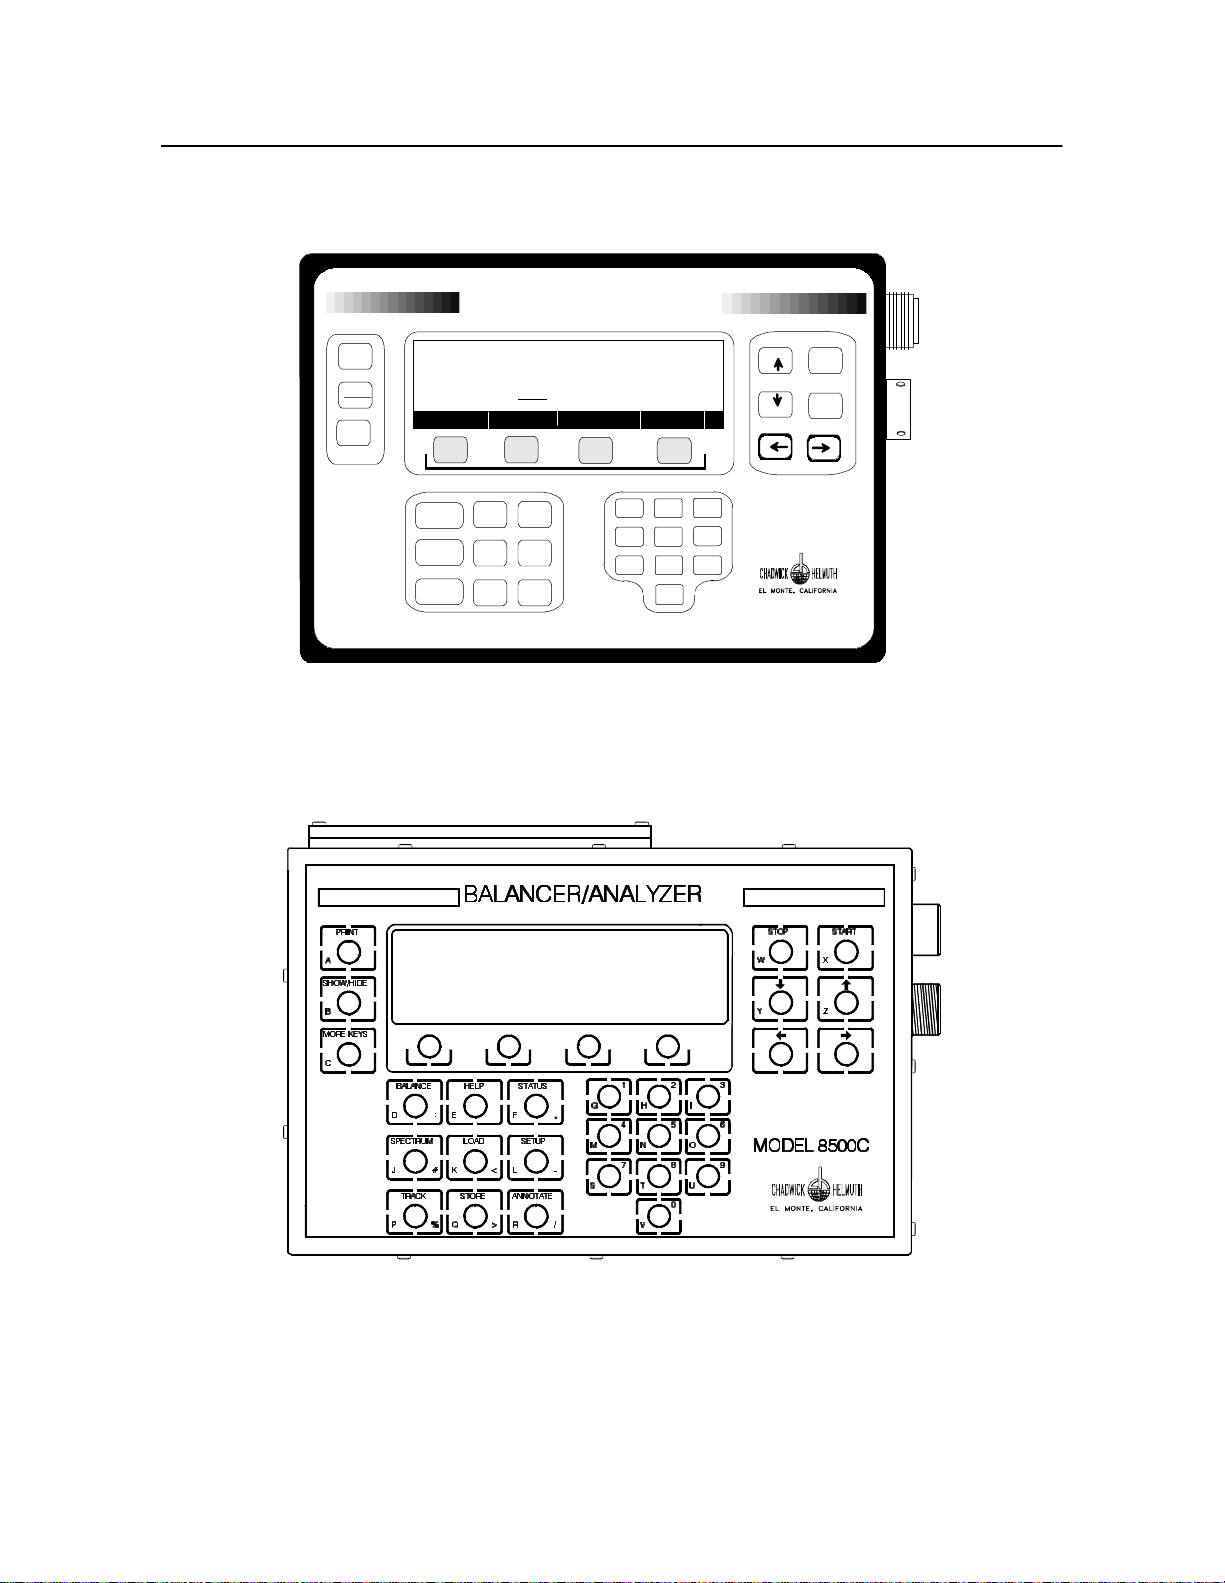
Chapter 3
- Unpacking and Installation
BALANCER/ANALYZER
Print
Show
Hide
More
Keys
CURRENT BALANCE MEASUREMENT FOR
RUN NUMBER: 1 FREQUENCY: 480 RPM
PHASE ANGLE: 2:42 VIB LEVEL: 0.870 IPS
REDO MEAS SEL CHART < RIGHT > SOLUTION
Balance
Spectrum
Track
BAe ATP (RIGHT) #123ABCXA
TO BEGIN NEXT RUN
PRESS START
Help
Status
Setup
Annotate
.
!!!!
:
Load
Store
12
5
4
8
7
0
""""
%%%%
####
&&&&
$$$$
''''
,,,,
++++
Start
*
*
Stop
3
6
MODEL 8500
9
((((
))))
****
NOTE: Inform a t ion i n th is manual pe rtains to all versio n of 8500 Balancer/Analyzer
(8500-6, 8500C/C+), as applicab le, depend ent of firm w are version.
3-4
Chadw i ck-Helmuth Company, Inc.
Page 35

Chapter 4
4.
Getting Started
This chapter intro du c es you t o the major fun ctional aspec t s of the M ode l85 00C /C+ Balancer/
Analyzer. It also introduces you to some gene ral operating procedures, as well as the relevant terms
and definitions used t hr oug h out this manual. Ch apter4 tells you how to get starte d with t he 8500C/C+,
under the following topics:
Section 4.1 Di spl ay ....... .... .. .... .. .... .. .... .. .... .. .... .. .... .. .... .. .... .. .... .. .... .. .... .. .... .. .... .. .... .. .............4-1
Section 4.2 Key p ad ................. .... .. .... .. .... .. .... .. .... .. .... .. .... .. .... .. .... .. .... .. .... .. .... .. .... .. ...............4-3
Section 4.3 On -l ine Help...... .. .... .. .... .. .... .. .... .... .. .... .. .... .. .... .. .... .. .... .. .... .... .. .... .. .... .. ..............4-9
Section 4.4 P r int e r an d D i sk D ri ve .. .. .. .. .. .. .. .. .. .. .. .. .. .. .... .. .. .. .. .. .. .. .. .. .. .. .. .. .. .. .. .. .. .. .. .. .. ..........4-10
Section 4.5 Bootin g Up the 8500 C /C+ .......... .... .. .... .. .... .. .... .. .... .. .... .. .... .. .... .. .... .. .... ............4-12
4.1 Display
The 8500C /C + l i quid-crysta l d ispl ay (LCD) i s located on the f ro nt pa n e l of the instrument . The LCD
has a resolut i on of 256 horizont al by 6 4 vertic a l pixel s and i s us ed to di sp l ay g r aphical information, as
well as text. The 8500C/C+ LCD is back-lighted to provide a superior display under adverse viewing
conditions.
Figur e4-1 on pag e4-2 shows th e LCD and keypad on the 8500C/C+ unit.
Mode l8500C/8500 C+ Operators Manual
4-1
Page 36
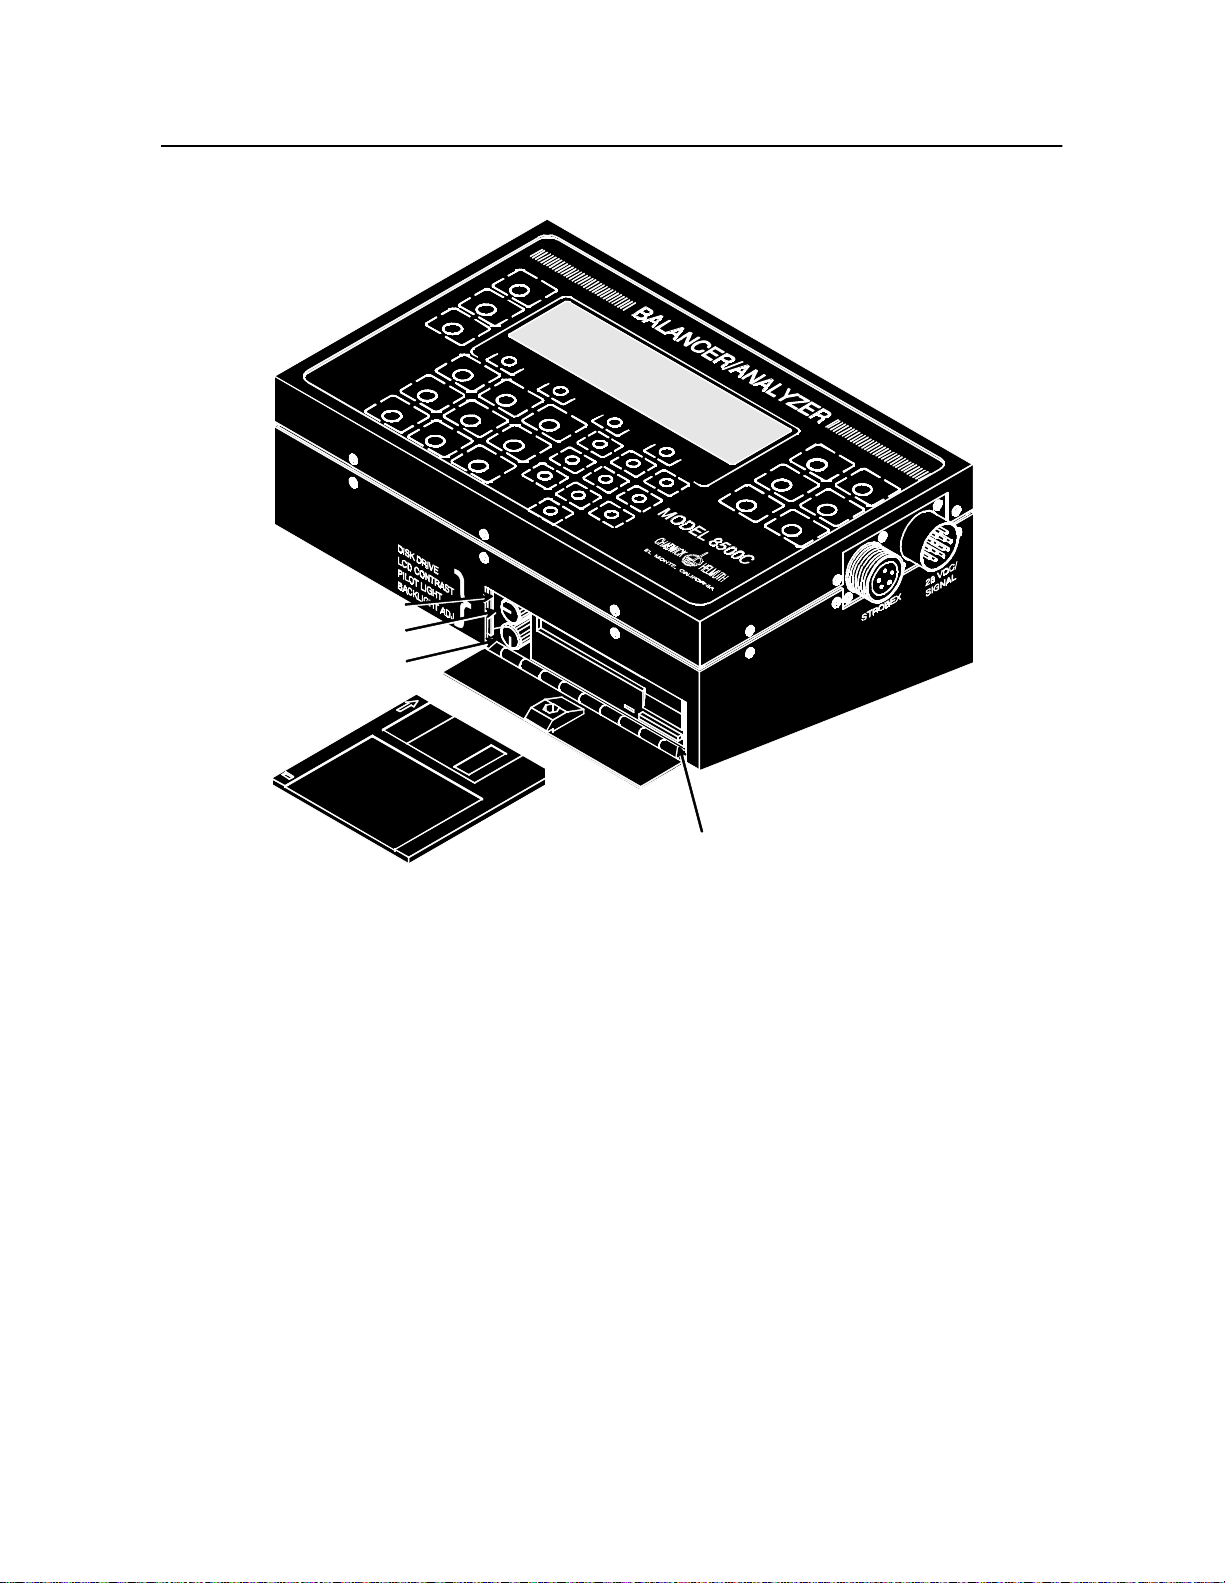
Chapter 4
W
- Getting Started
POWER INDICATOR
(ABOVE KNOBS)
LCD CONTRAST ADJ.
BACKLIGHT ADJ.
M
O
D
E
L
8
50
0
C
FILE:ISO85CDK.DR
DISK EJECT
Figure 4-1. Model 8500C/C+ Balancer/Analyzer
There is a display contrast adjustment knob located inside the disk drive access door. It is used to
adjust t he v ie w i ng an g le of the LCD. If turne d com pl etely i n the cloc kw ise dir ection, the di splay
appears blank. If it is turned completely counter-clockwise, the display becomes completely dark. You
may adju s t LCD co n tra s t for o pt i m um v iewing, though ad j ustment is most often requ i red when power
is first applied to the instrument. See the Mod el8500C/C+ System Maintenance Manual for complete
operating temperature range specifications.
In the 8500C/C+ the L CD cont rast adjus tm en t is the top m ost con tr ol knob in side the disk drive door.
An adj ust ment kno b to co n t rol backlig h t brightne ss is l o c a ted ju s t below it.
The 85 00C / C+ sh ou ld nev er be exp ose d to exc e ss iv e hea t o r su nl ig h t. Ov er he at i ng may cause the LC
to turn completely dark. It usually recovers when cooled, but permanent damage may result. Similarly,
the 8500C/C+ must never be exposed to excessive cold. Otherwise, screen changes and transitions
become noticeably slower. If conditions are severe enough, the LCD may shut down completely.
Information displayed on the LCD is called a screen. A screen may consist of a list or menu, a
collection of data fields, a plot or drawing, or some combination thereof. A single screen may contain
more data than can fit o n the L C D, a n d the portion that can b e en seen is called a wind o w . In most
cases, the data withi n a windo w may be sc rolle d u p or down with th e Arrowkeys to reveal different
areas of t he screen.
In this manual , fie l d s o n th e LC D screen are shown in the text as monos p ac ed type, for example,
FREQUENCY
4-2
Chadw i ck-Helmuth Company, Inc.
Page 37

Keypad
4.2 Keypad
The 8500C/C+ accepts commands and data through the keypad on the unit's front panel. There ar
32 keys, and most o f th e m sup p or t more than on e function or ch ara ct er d e p e nding on th e state of the
instrumen t or the combi na t ion of keys pressed in concert (see F igure 4 - 1 on page4-2).
Throughout this manual, 8500C/C+ function keys are indicated with special typefaces in this manual
and in user guides, in or de r to h el p you bet te r d ist ing uish them, a s fo l lows:
•
START -
ENTER -
•
The basic fea t ure s of the keyp ad are explai n e d in the r est o f this section. Fo r the most par t , i ndividual
keys are described in detail in the appropriate chapt ers of this manual.
Table 4-1, startin g below, shows the ba si c functio ns or values and the keys and char acte rs assigned to
each function.
Dedicat ed ke y s, that i s , th o se keys w hose functions ar e printed on the key.
Soft key s, w h o se fun cti ons are bound to the f o u r grey k e ys beneath the LCD.
Table 4-1. Model8500C/C+ Function Keys (Sheet 1 of 2)
Key Function/Value Character
Start Start d at a ac q uisition X or *
Stop Terminate data acquisition Z or *
←
↑
↓
→
Balance Select Bala n ce mode D or :
Move c urs or le ft
Move cursor up W
Move c ur s or d own Y
Move c urs or right
Spectrum Select Spe ctr u m mode J or #
Track Select Track mode P or %
Help Display on-line help E
Load Load data from disk K or <
Store Store data to disk/memory Q or >
Status Display/change system status F or .
Setup Enable parameter entry L or Annotat Annotate printe r output R or /
11 G
44 M
77 S
Mode l8500C/8500 C+ Operators Manual
4-3
Page 38

Chapter 4
- Getting Started
Table 4-1. Model8500C/C+ Function Keys (Sheet 2 of 2)
Key Function/Value Character
22 H
55 N
88 T
33 I
66 O
99 U
00 V
Print P rint displ ay A
Show/hid Display/hide soft ke ys B
More keys Display more soft keys C
Soft key Soft function key 1
Soft key Soft function key 2
Soft key Soft function key 3
Soft key Soft function key 4
4.2.1 Auto-Repeat
Some keys, such as the Arrow keys, support an auto-repeat feature, that is, pressing the key for more
than ha lf a secon d causes the f unction to be repeated f o r as long as the key is held down.
4.2.2 Arrow Keys and C ursor
The four Arr owkeys allow the display
display ed , the curso r appears as a b lack, high lig hting r ec t angle. It may be moved around the screen to
select an item f ro m a list o r me nu, o r to sele ct a data field w h os e c on t ents are to be modifie d . Moving
the cursor above or below the current window scrolls the window in the appropriate direction. If th
beginning or end of the screen has been re a ch ed , the cursor wraps around t o th e window containing the
bottom or top portion of th e screen.
When a spectral plot is displayed, the cursor appears as a special cross-hair that highlights th
intersection of the X-coordinate (frequency) and Y-coordinate (amplitude) o n the X-and Y-axes. Th
spectrum cu rsor may be m ov e d wit h the Ar rowkeys, but does not wrap ar oun d w he n th e beginning or
end of the axes has been reached.
to be moved in the desired direction. When text is
cursor
4-4
Chadw i ck-Helmuth Company, Inc.
Page 39

Keypad
4.2.3 Soft Keys
The four grey soft function keys are located just below the display (see Fig u re4-5 on pa ge4-10). They
differ from th e o the r ke y s i n th a t the ir fun c tion s va ry according to the stat e of the 8500C/C+. This
feature pr ovides easy acc e ss to any sp ec ial functi on s t o b e us ed while t he i n s t ru men t is in a particular
state or mode. If a soft key is operational, its function is defined in a label at the bottom of the display,
directly above the key. Note that if a soft key label is hidden from v ie w its fun c t ion may still be
invoked by p r es sing the key. In o the r words , labels do not h av e to be vi sible in orde r to execute a soft
key function. See the explanation of th
SHOW/HIDE
page 4-7.
There are two types of soft function keys, as follows:
•Action
•Mode
soft keys typically change th e displ ay and initiate a maj or t ran sit i on or action . Action soft key
Action
labels appear with solid black rectangles. In Figure4- 5 on page4-10 th
SOLUTION
and
soft keys are action soft keys.
key in Section 4.2.3.2 “SHOW/HIDE Key” on
RED OMEAS, SEL CHA RT
,
The secon d ty pe o f so ft k e y i s the
soft key. A mode s of t ke y d efin es a number of use r- se le c table
Mode
operating modes . They a re e na ble d b y t o g g l in g th e soft key, which then sele cts a new mode and
display s the new setting i n t he s of t ke y labe l. M ode soft keys have a diamond- sh a pe d l abel contained
in a thin black border.
Mode l8500C/8500 C+ Operators Manual
4-5
Page 40
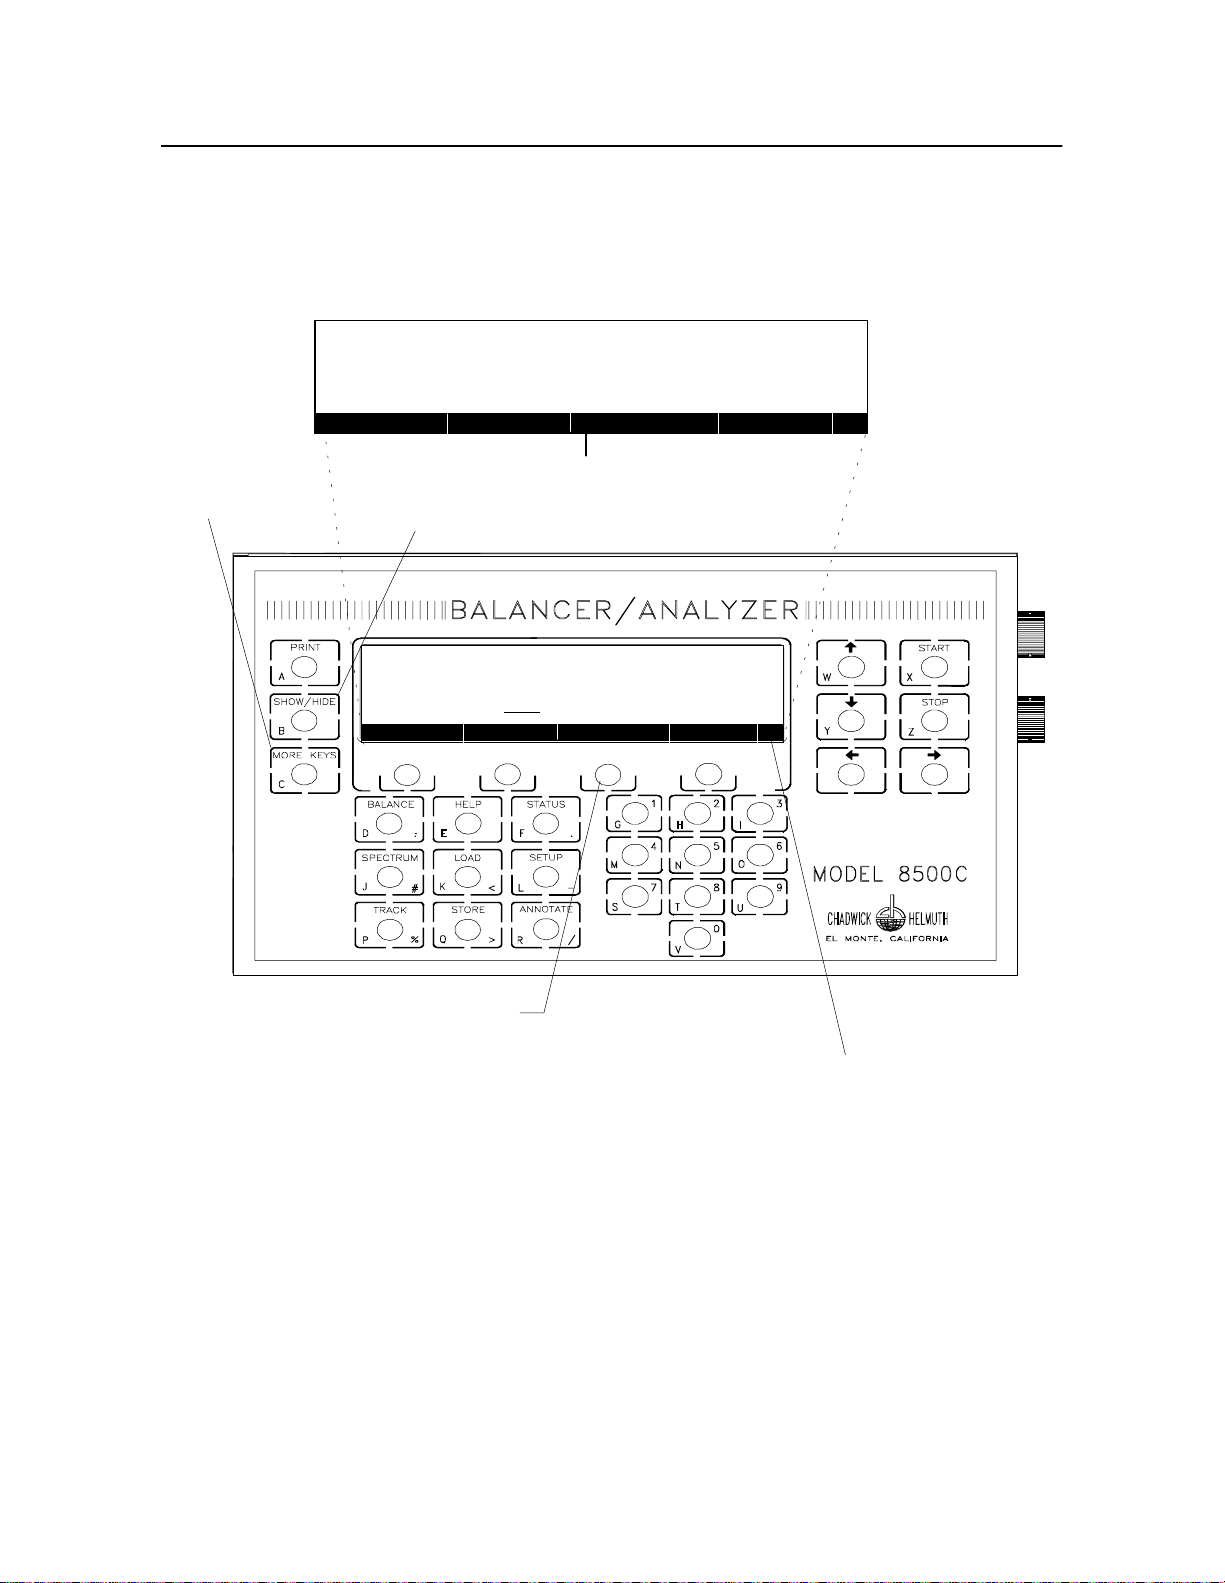
Chapter 4
- Getting Started
In Figur e4-2 the
<RIGHT>/<LEFT>
soft key is a mode soft key. Toggling the
changes the engin e for the selected bala n ce chart. If the soft key is
engine is displayed. If the soft key is
CURRENT BALANCE MEASUREMENT FOR
RUN NUMBER: 1 FREQUENCY: 480 RPM
PHASE ANGLE: 2:42 VIB LEVEL: 0.870 IPS
REDO MEAS SEL CHART < RIGHT > SOLUTION
MORE KEYS
SHOWS/HIDES SOFT KEY LABELS
RUN NUMBER: 1 FREQUENCY: 480 RPM
PHASE ANGLE: 2:42 VIB LEVEL: 0.870 IPS
REDO MEAS SEL CHART < RIGHT > SOLUTION
<LEFT>
BAe ATP (RIGHT) #123ABCXA
PRESS START TO BEGIN NEXT RUN
, data for the left engine is displayed.
SOFT KEY LABELS
CURRENT BALANCE MEASUREMENT FOR
BAe ATP (RIGHT) #123ABCXA
PRESS START
TO BEGIN NEXT RUN
<RIG H T>
*
*
<RIGHT>/<LEFT>
key
, the data for the right
+
SOFT KEYS
ASTERISK INDICATES
MORE LABELS ARE
AVAILABLE WHEN MORE
KEYS IS PRESSED
Figure 4-2. Model 8500C/C+ With Display and Soft Keys
4.2.3.1
The
HELP
See the section on the H elp facility below for a co mp le te de s cri pt ion. For help on an individual chart,
press the
HELP
Key
key enabl es t he on-line help facility, which prov ides operator assistance for the 8500C/C+.
CHAR TINFO
soft key.
4-6
Chadw i ck-Helmuth Company, Inc.
Page 41
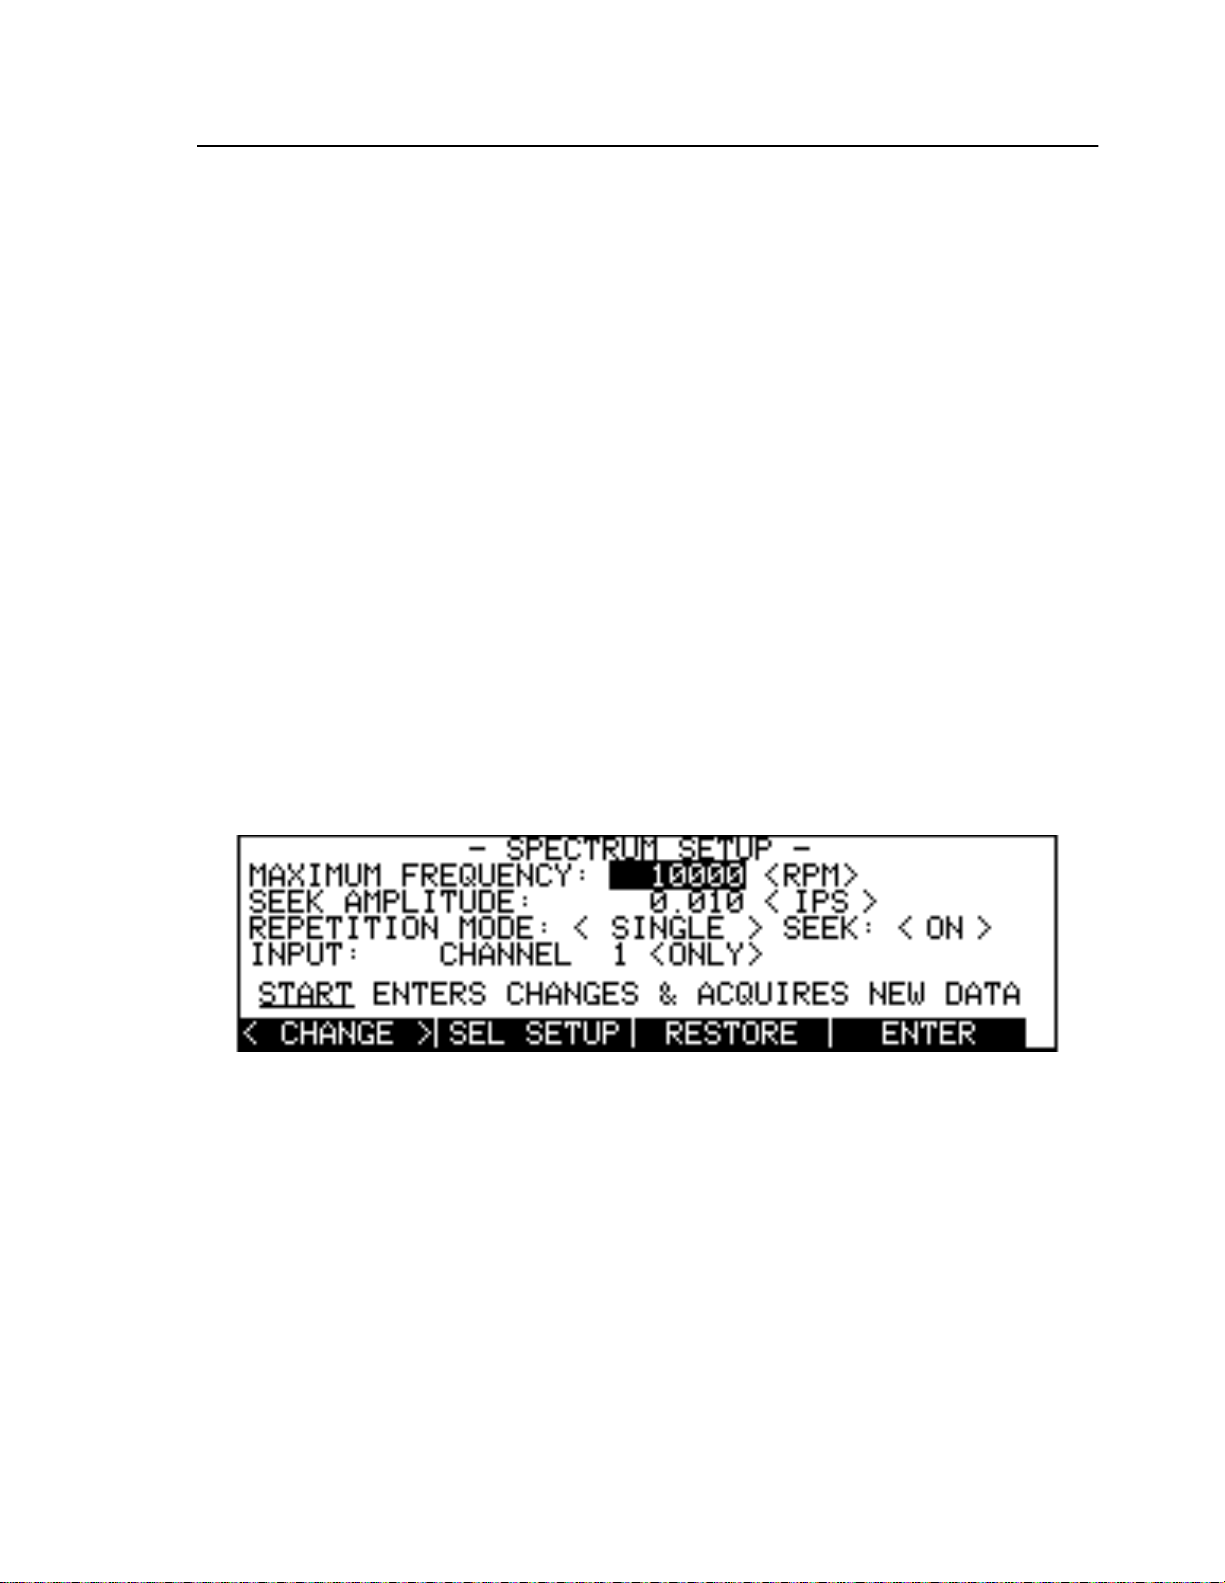
Keypad
4.2.3.2
Soft key labels can sometimes hide or obscure portions of the LCD that contain text, graphics, or a
plot. To view this inf o rma tion , pres s the
the hidden sections. Pressing
positions. Soft keys can be pressed whether the label is visible or not, that is, using
SHOW/HIDE
4.2.3.3
In some modes, the 8500C/C+ provides more soft functions than there are soft function keys. Th
presence of an asterisk (*) in the bottom right corner of the LCD indicates there are soft keys available,
which are not currently displayed. To enable the additional soft keys, press
the current s et of soft key la bels and di sp l a y s the next group. The soft keys thems e lv e s n ow take on the
functions i ndicated by the ne w labe ls. P re ssing
until the original set of soft keys is restored.
4.2.3.4
The
SETUP
Status mode s of operation. Pressing
showing current values for the appropriate parameters. These values appear as part of data fields that
contain the instr umen t setting s t o be se lected or chang e d . The Ar rowkeys can then be used to position
the cursor over the desired parameter. Once selected in this manner, a parameter may be modified,
either by pressing t he appropriat e soft key or en t er in g a value from the numeric keypad (s ee Figure4-3
below).
SHOW/HIDE
to hide soft key la bels does not affect the actual soft key or its function.
MORE KEYS
SETUP
key allows y o u to modify basic param e te rs governing the Balance, Spectrum, Track, and
Key
Key
SHOW/HIDE
SHOW/HIDE
Key
SETUP
key. It removes a ll so ft ke y la bels and d is plays
a second time restores the soft key labels to their previous
MORE KEYS
MORE KEYS
while in one of these m o de s ac cesses a
again enables the next group, and so on,
. It removes
Setup screen,
Figure 4-3. Sample Setup Screen
Setup screens allow for two types of display fields. Those that are enclosed by angle brackets are
called
have no brackets and accept only numeric input from the keypad. Digits are shifted to the left as they
are entered a nd decimal p o i n ts a u tomatically i nserted where ne cessary . Most numeric f i elds impose a
range of acceptable value s. E ntering an im pro pe r value causes a n error message screen display, and the
original value to be restored to the field.
Changes t o t he dis p la y fi e lds of the e nt ire Setup screen can be remove d and the orig in a l contents
restored by pressing the
operation are lost.
After making all desired changes to the display fields, press the
quit the Se t u p sc re en, and resu me opera ti ons. Alternatively, any key that quits the Setup screen
executes an implicit
stored in nonvolat ile memory. Consequently, they are always prese rved, even if the 8500C/C+ has
been turned off.
fields. Their contents are changed by pressing the
mode
RESTORE
ENTER
soft key. Only those values changed since the last
before performing its intended function. Setup screen data fields are
<CHANGE>
ENTER
Mode l8500C/8500 C+ Operators Manual
soft key.
soft key to enable the changes,
Numeric
ENTER
fields
4-7
Page 42

Chapter 4
- Getting Started
4.2.3.5
Pressing the
current da te and time, soft war e versio n number, and pickup puls e rat e . Some o f these items can be
modified by pressing
Status information i s n ot available whi le error messages a re being displaye d , o r while the 850 0 C/C+ is
perform ing certain time-criti ca l actions, suc h as data acquisition o r flas h in g the Model135M-12
Strobex Tracker.
See Chapte r9 “Status Screen Operation” for a complete explanation of the
4.2.3.6
Pressing the
the following basic op erational modes:
Balance -
•
Spect rum -
•
Track -
•
Once in the Balance mode, you can initiate a lateral or track balance for the target rotor system. See
Chapter 5 “Balance Measurement and Solutions” for a complete explanation of balance measurement
and solutions. These primary operating modes are set in first-letter-cap in the manual and user guides,
for example, Balance mode, to distinguish them from other 8500C/C+ modes.
STATUS
STATUS
BALANCE
BALANCE
For balancing systems
For using the
For using the Strobex or M odel11800 Fa s Tr ak Opti cal Trac ker for tr ack operations
Key
key displays general information about the state of the 8500C/C+, such as the
SETUP
to access the Status Setup screen.
STATUS
function.
Key
key puts the 850 0 C/ C + int o its Balance mode of opera ti on . Th e 8500C/C+ has
spectrum analysis
feature
4.2.3.7
Pressing the
Spectrum mode, you can acquire, display, and analyze vibration signals from the target rotor system,
that is, use the 8500C/C+’s spectrum analysis feature. See Chapte r7 Spectrum Analysis” for a
complete explanation of this feature.
4.2.3.8
Pressing the
you can i niti ate visual tracking for the tar get ro tor system. Pres s ing the T rac k ke y wh i le running a
Smart Chart that supports the FasTrak will allow you to initiate either visual or FasTrak tracking. Se
Chapter 6 “Blade Track Observation” for a complete explanation of visual tracking.
4.2.3.9
The
START
modes, such as self-test,
printout annotation (see Chap ter8 “Using Printouts”), the
beginning of the previous data field.
4.2.3.10
The
STOP
modes su ch as self-test,
annotation (see Chapt er8 “Using Printouts”), the
beginning of the next data field.
SPECTRUM
SPECTRUM
TRACK
TRAC
START
key is u se d t o i n itia te da ta acquisition in Bala nce, Spe ctrum, and Tr ack mod es. In some
STOP
key is u se d t o t erminate da ta acq uis iti o n in Balance, Spectr um, and Track modes. I n some
key puts the 8500C/C+ into its Track mode of operation. Once in Track mode,
Key
Key
Key
key puts the 8500C/C+ into its Spectrum mode of operation. Once in
Key
START
STOP
may be used to select or beg i n a par ti c ula r fu nc tion. W hen edi ting the
START
may be used to a bo rt a part i cul ar oper a ti o n. When editing the p rintout
key is used to move the cursor to th
STOP
key is used to move the cursor to th
4-8
Chadw i ck-Helmuth Company, Inc.
Page 43
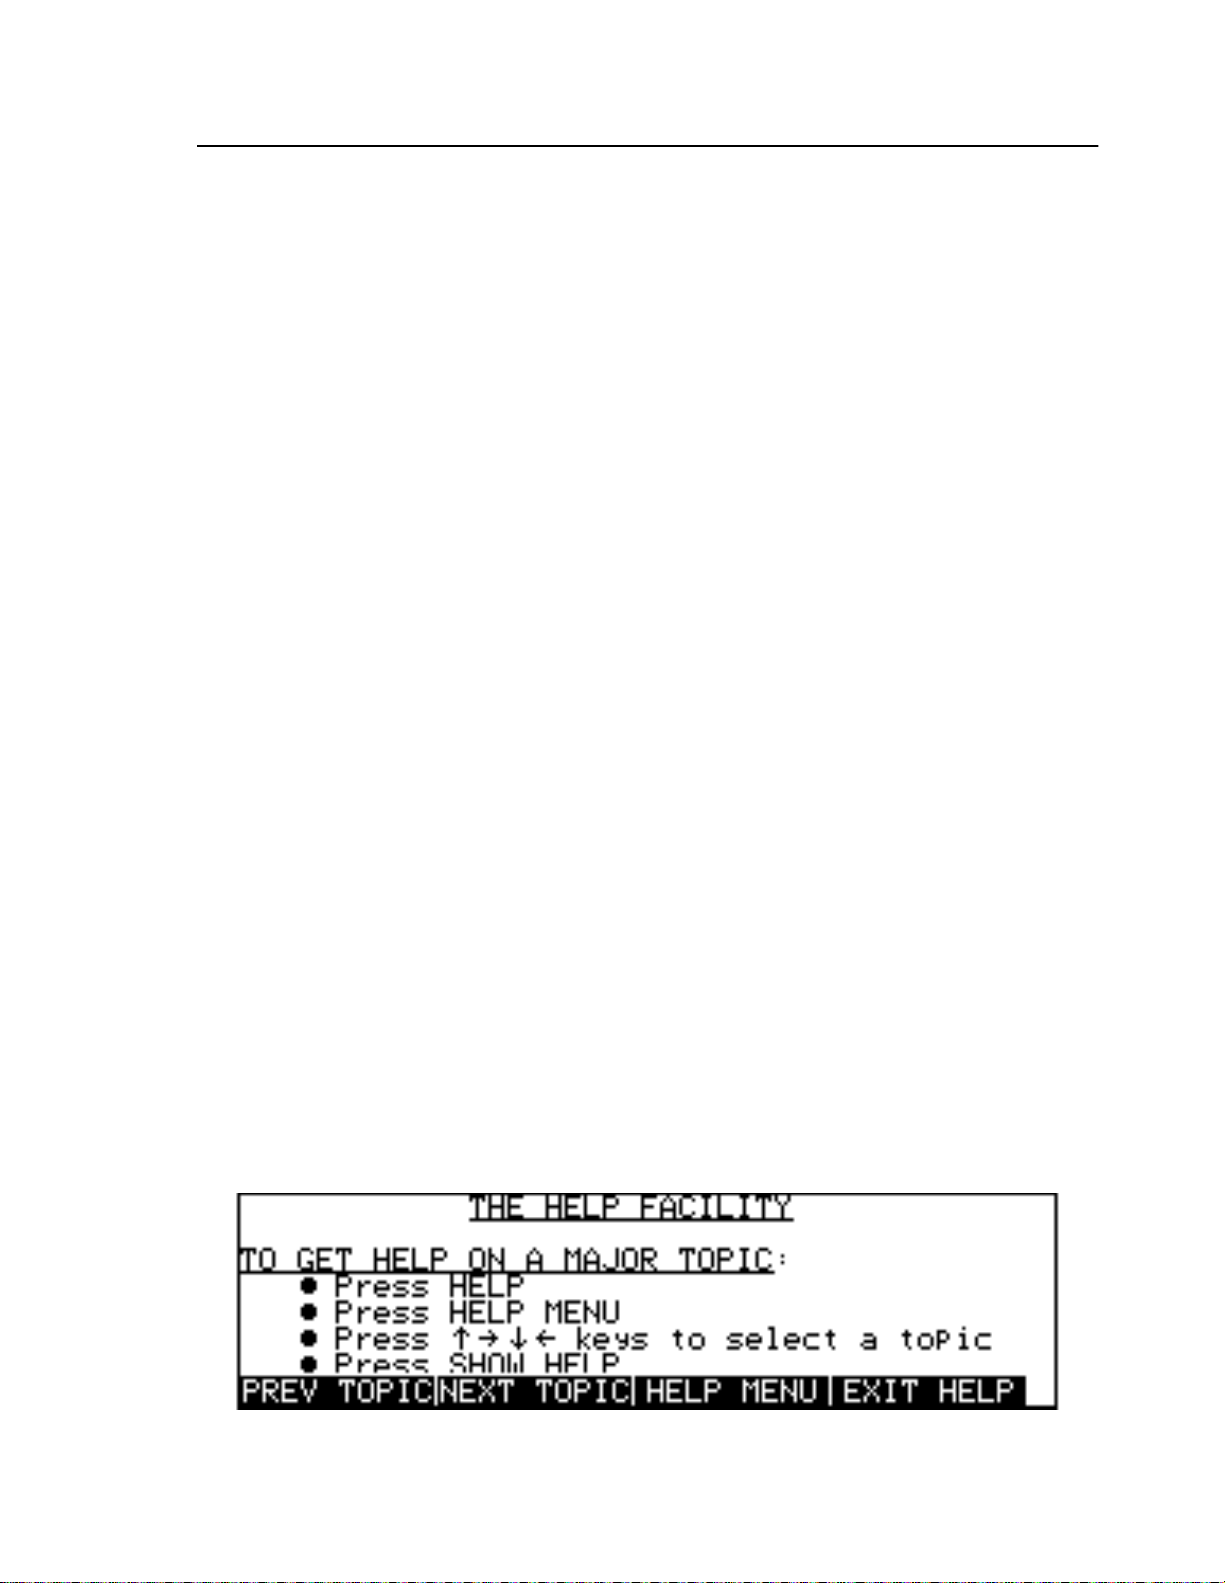
On-line Help
4.2.3.11
Pressing the
thermal dot matrix printer. Printing in the 8500C/C+ proceeds as a background task, which means you
may co n tin ue t o op er a t e the inst ru m e n t wh i le th e p rin t e r is w o rk i ng. Successi ve u se of the
saves the additional printouts and q ueues the m so they are prin te d in the ord er they were requested. Up
to 2 0printouts may be qu eue d at one time. Each pri ntou t ta kes about 30sec to complete.
4.2.3.12
Printouts are always appended with annotation information that aids in describing and documenting
the printout contents. The annotation data and their labels may be edited by pressing the
key, which puts the 8500C/C+ into its edit mode of operation. See Chapt er8 “Using Printouts” for a
complet e discu s s ion of annotation e diting.
4.2.3.13
The
LOAD
See Chapte r5 “Balance Measurement and Solutions” for a complete discussion of the
4.2.3.14
The
STORE
solution s t o 850 0 C/ C+ static memory or the 85 0 0 C / C + di sk drive. S ee Chapter10 Prin t er and D i sk
Drive” for a detaile d discussion of the
PRINT
PRINT
ANNOTATE
LOAD
key is used to loa d balance charts from the 8500 C /C + d i s k dr ive to nonvol atile memory.
STORE
key is used to store spectral da ta sets, ba la nce c har t s, and balanc e measu re m ents and
Key
key sends a hard -c opy reproduct ion of the current LCD window t o the 8500C/C+
PRINT
key
Key
ANNOTATE
Key
key.
LOAD
Key
STORE
key.
4.2.3.15 Numeric Keys
There are ten numeric keys, labeled 0 through 9. They are typically used to enter numeric data, in
particular when modifying Setup screens or editing the printout annotation.
4.3 On-line Help
Pressing the
running the 850 0C / C+ (see Fig ure4-4). T he he lp fac i l ity is context sensi tive, t h a t i s, it knows the
current s t at e of th e inst ru ment and dis p la y s t he appropr ia te t e x t when
available during certain time-critical operations su c h a s data acquisi ti o n or blade t r ac k i ng. Otherwise,
may be pressed at any time.
HELP
Press the
HELP
key enabl es t h e on- line he l p f ac ility, which p r ov i de s va l ua ble as sistance while
HELP
is pressed.
HELP
key twice to get help on instrument basics.
HELP
is not
Figure 4-4. Help Screen
Mode l8500C/8500 C+ Operators Manual
4-9
Page 44
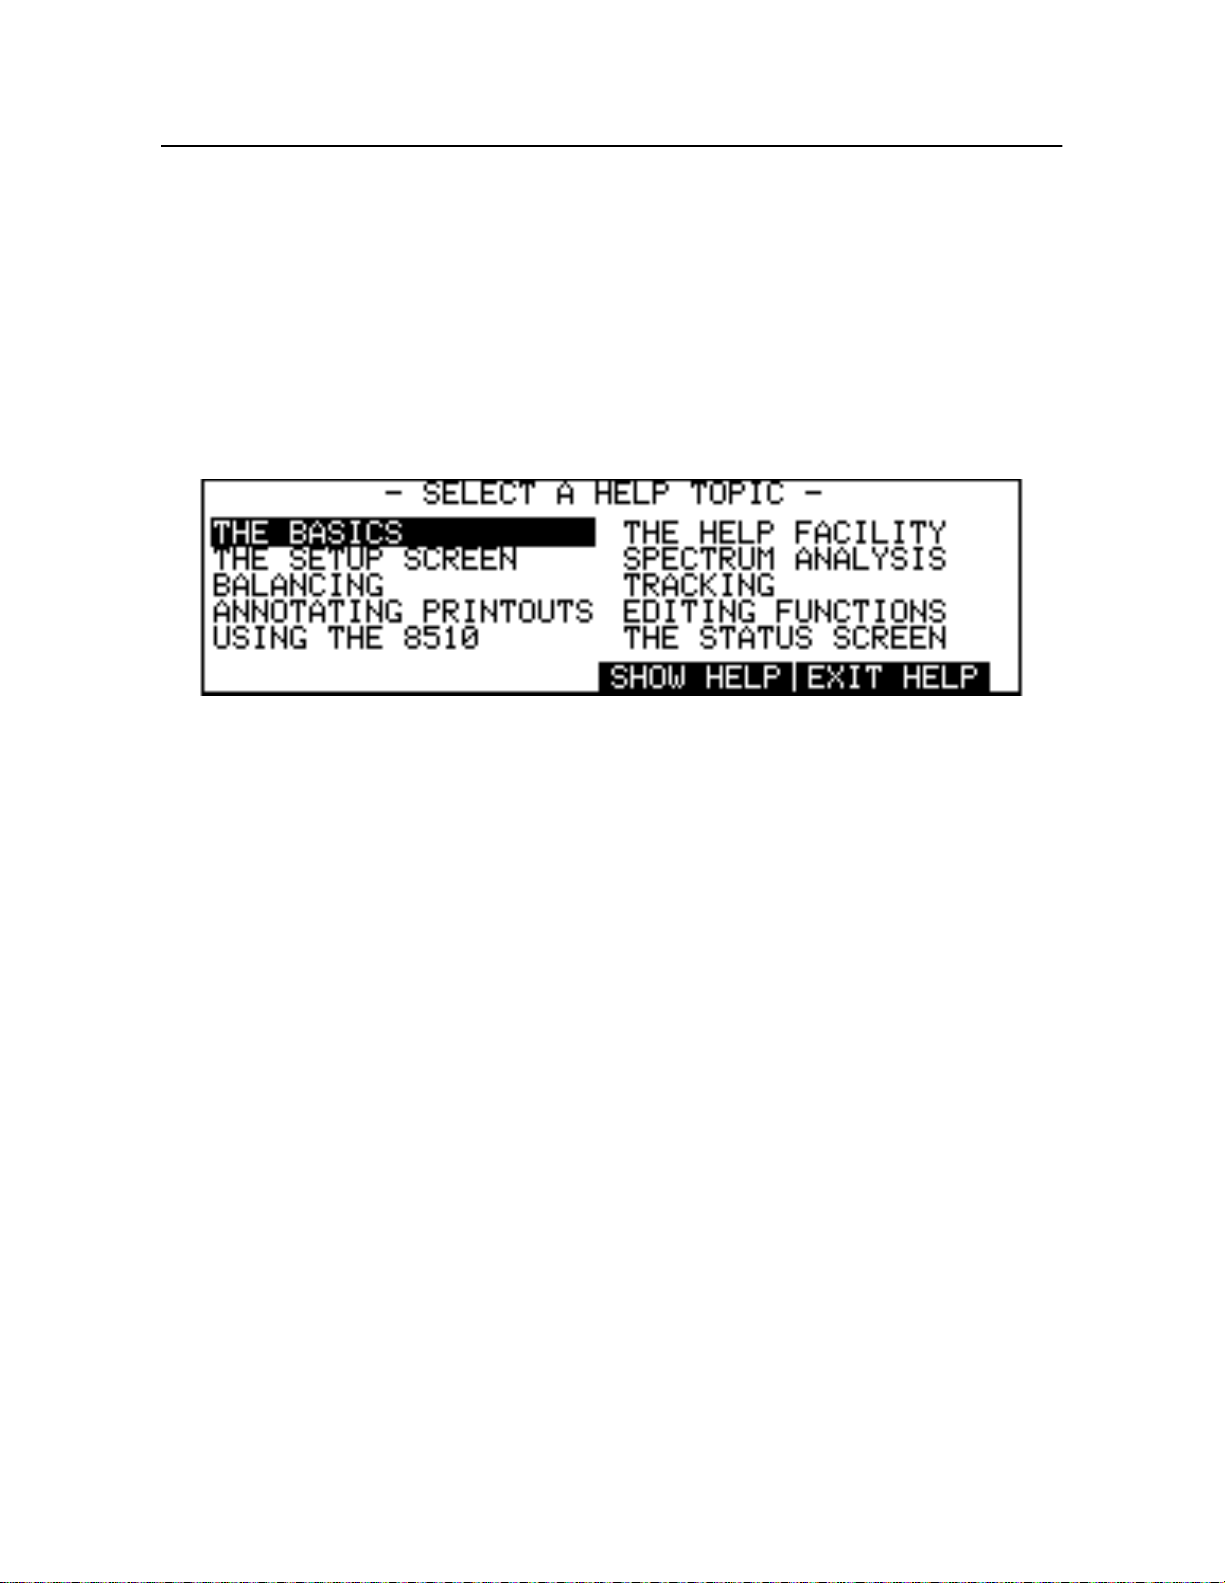
Chapter 4
- Getting Started
4.3.1 Scrolling Help Topics and Text
Press the
respectively, to a new subtopic. Alternately, you may use the Up a nd Dow nArrowkeys to scroll th
help te xt a line at a time in the desired di r ection.
PRE VTOPIC
NEX TTOPIC
or
soft keys to scroll the Help screen window up or down,
4.3.2 Help Menu
HELP MENU
The
Arrow keys to select a topic; press
soft key displays the menu of available help topics (see F igure4-5). Use th
SHOW H ELP
to display help tex t ab o ut t h at topic.
Figure 4-5. Help Menu Screen
4.3.3 Exiting the On-line Help
Press the
EXIT HELP
soft key to quit the help facility and resu me operations.
4.4 Printer and Disk Drive
The 8500C/C+ co n ta i n s a 3.5- i n. disk dr ive and thermal printer within the main unit (see Fig ure 3-1 on
page 3-2).
4.4.1 Printer
The printer is a thermal dot-matrix printer capable of creating hard-copy reproductions of the current
LCD wi ndow. Printing can be in i tia t e d b y pressing the
on pa ge4-9).
PRINT
4.4.2 Disk Drive
The 8500C/C+ disk drive uses double-sided, double-de nsity (720KB) 3.5-in. diskettes. The 8500C/
C++ disk drive acc epts, in addition to 720 KB diskette s, High-D ensity 1.44 MB diskettes. It can read
and write any diske ttes that h a ve been fo r matted on a pers o na l computer (PC) runn ing PC- or
MS-DOS , Versio n3.2 or late r or the Mic roSoft WindowsTM Operating System . Diskettes are used to
store aircraft chart information as well as spectral and balance data acquired by the instrument.
Diskette s may be freely interchanged b etween th e 8500 C/ C+ an d appro priately configure d PCs. This
key (see Section 4.2.3.11 “PRINT Key”
4-10
Chadw i ck-Helmuth Company, Inc.
Page 45

Printer and Disk Drive
compati bility p ro v i d es t he user with the ability to subje ct t he a cquire d data to more rigorous postprocessing and analysis. See Chap ter10 “Printer and Disk Drive” for more information on using the
8500C/C+ disk drive.
Mode l8500C/8500 C+ Operators Manual
4-11
Page 46
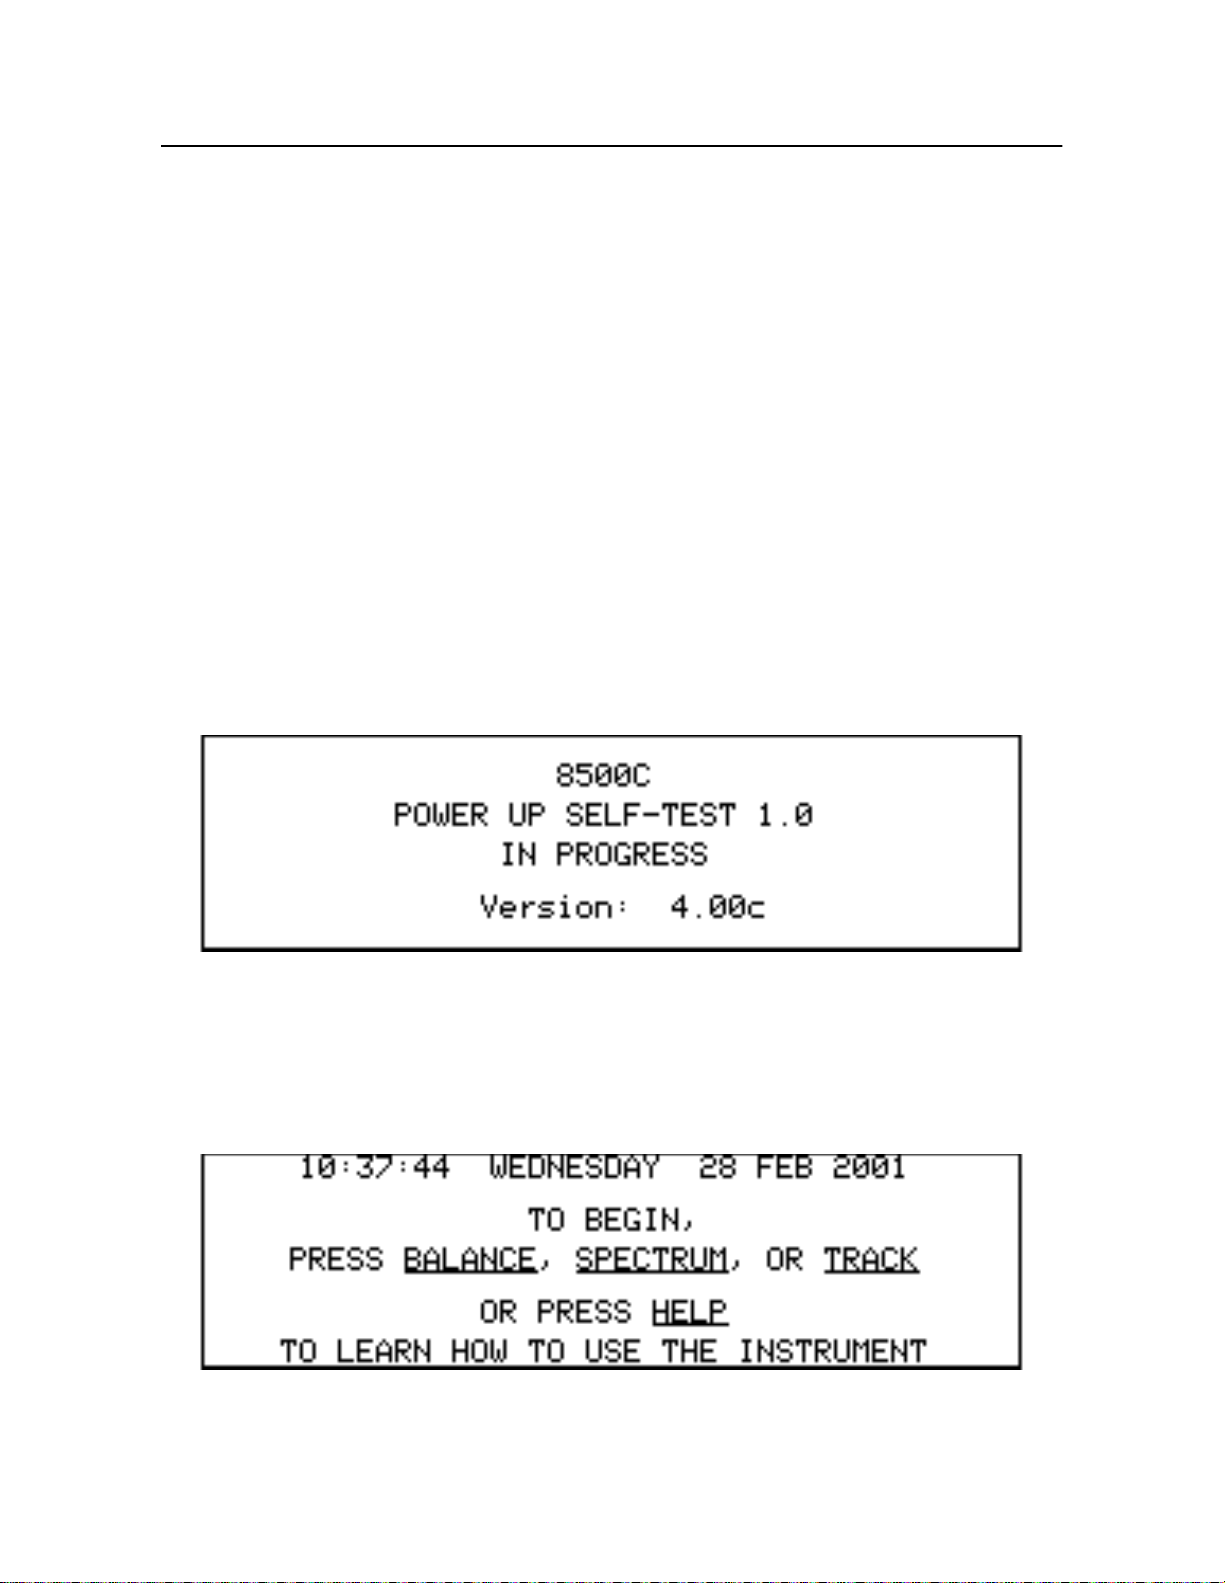
Chapter 4
- Getting Started
4.5 Booting Up the 8500C/C+
This section explains how to boot up the 8500C/C+, either as from a cold start or a soft reset situation.
4.5.1 Starting the 8500C/C+
The 8500C/C + a utoma tic al ly starts up when power is app lied to the i nst rum en t. During this period, a
suite of diagnostic programs run to verify the operational integrity of the hardware and software. These
diagnostic s in c lu de tests o f the m ac hine' s memory and an a ut om atic verification of t he analog circuitry
calibrat ion . T he e nti r e set of tests may take up to 45s ec to complete. You may use t his time to adjust
the LCD d isp l ay contrast so that t h e po wer-up me ss age s c r e en is clear ly v isible.
Any problems o r failures a re reporte d on the disp lay (s e e Fig u re4-6 bel ow). In the event th e power-up
diagnostic s do not complete suc ce ssfully, the instrum ent must b e consi dered unrel ia b le and unusable.
Further us e may produce erroneous res ults and is therefore strongly discouraged.
NOTE: If you receive the
attempt by pressing
If the 8500C/C+ does rep o rt a failure (other than the Power Up Self -tes t), re p la ce the unit wit h a spare
and return the 8500C/C+ to Chadwick-Helmuth for assistance.
Power Up Self-test Failure 3.X or 4.X
TRYAGAIN.
In this case, a retry may be successful.
message, t ry a second
Figure 4-6. Power-up Message Screen
CAUTIO N: The 8500C/C + onl y op e ra t es from a 28-Vdc power supply. Pl ugging the 8500C/
C+ into a power source other than 28 Vdc may cause severe damage to the instrument.
Upon su cc es s fu l completion of the pow er-up seque nc e, a n introd uc t ory Start-up screen displays
(Figur e 4 -7). The 8 5 00 C/C+ is now fully operational a n d ready to use.
4-12
Chadw i ck-Helmuth Company, Inc.
Figure 4-7. Start-up Message Screen
Page 47

Booting Up the 8500C/C+
4.5.2 Restarting the 8500C/C+
In the event of an instrument malfunction or lock-up, a manual reset can be performed by temporarily
removing power to the 8500C/C+. This action resets the machine without clearing the memory.
If this procedure fails, you mu st clear the memory by doing a cold start (hard reboot). To do this
procedure, remove the power, hold down th
approximately 5se c before releasing the
NOTE: Disconnecting t he power suppl y while the 8 500C/C+ is in status mode may dis rupt
the time-of-day clock’s normal functioning.
START
START
key, and reconnect the power. Wait
key.
Mode l8500C/8500 C+ Operators Manual
4-13
Page 48

Chapter 4
- Getting Started
4-14
Chadw i ck-Helmuth Company, Inc.
Page 49

5.
Balance Measurement and Solutions
Chapter 5
This chapter desc ri be s t h e m et h o ds an d procedures f or acquiring
computing/using
how to take balance measurements and get solutions, under the following topics:
Section 5.1 Ge ttin g B al an ce So lut io ns : Introduction ......... .. .... .. .... .. .... .. .... .. .... .. .... .. .... .......5-1
Section 5.2 Bala nc e Charts.. .. .... .. .... .. .... .. .... .. .... .. .... .. .... .. .... .. .... .. .... .. .... .. .... .. .... .. .... ............5-2
Section 5.3 Para m e te r Setup... .. .... .. .... .. .... .. .... .. .... .. .... .. .... .. .... .. .... .. .... .. .... .. .... .. .... .... ...........5-7
Section 5.4 Bala nc e Measureme nt. .. .. .... .. .... .. .... .. .... .. .... .. .... .. .... .. .... .. .... .. .... .. .... .. .... .. ..........5-9
Section 5.5 Soluti on P resenta tion.... .. .... .. .... .. .... .. .... .. .... .. .... .... .. .... .. .... .. .... .. .... .. .... .. ............5-12
Section 5.6 Addition a l F e atures...... .... .... .. .... .. .... .. .... .. .... .. .... .. .... .. .... .. .... .. .... .. .... .. .... ...........5-14
balance solutions
with the Model85 00C/C+ Balancer/Analyzer. Chapter 5 explains
balance measurements
and
5.1 Getting Balance Solutions: Introduction
Balance mea s ureme nt is simi la r t o spectral dat a acqu i sit i on i n th a t both opera tions collect spectral
frequency data from the rotor system being tested. Balance measurement, however, focuses on data
from a particular vibration signal, with the goal of providing a solution to the vibration problem. Two
types of ou t -o f- ba lance conditions may b e an al yzed here, lateral mass imbalances and vertical track
imbalan ces. Lateral imbalances c reate vibrations that are oriented parallel t o the plane of rotation.
Vertical imb alance s s tem from track m i sal i g n m e n ts in t he r ot or bl ad es a n d pro duc e vibrations that ar
perpendi c ul ar t o t he pl a ne of rotation. The correct sol uti o n to b o th problems o nly requires that the
appropriate balance chart be used and that the Mode l7310 Velocimeter's cylindrical axis be oriented in
the same direction as the vibrational forces.
The solutio n is base d on the u n iq ue characterist i cs of t he r otor system be in g balanced and is presented
in terms of prescribed adjustments to the rotor hardware. These adjustments include
• Incremental addition or removal of weights at the balance points of the aircraft
• Adjustments to the sweep of the blades
• Adjustments to the trim tabs
• Adjustments to the pitch links
WARNNG: Due to the complex interaction between vertical and lateral vibrations, it is
essential that an aircraft's track be adjusted and verified before performing a lateral
balance (for more information, see Chapte r6 “Blade Track Observation”).
Mode l8500C/8500 C+ Operators Manual
5-1
Page 50
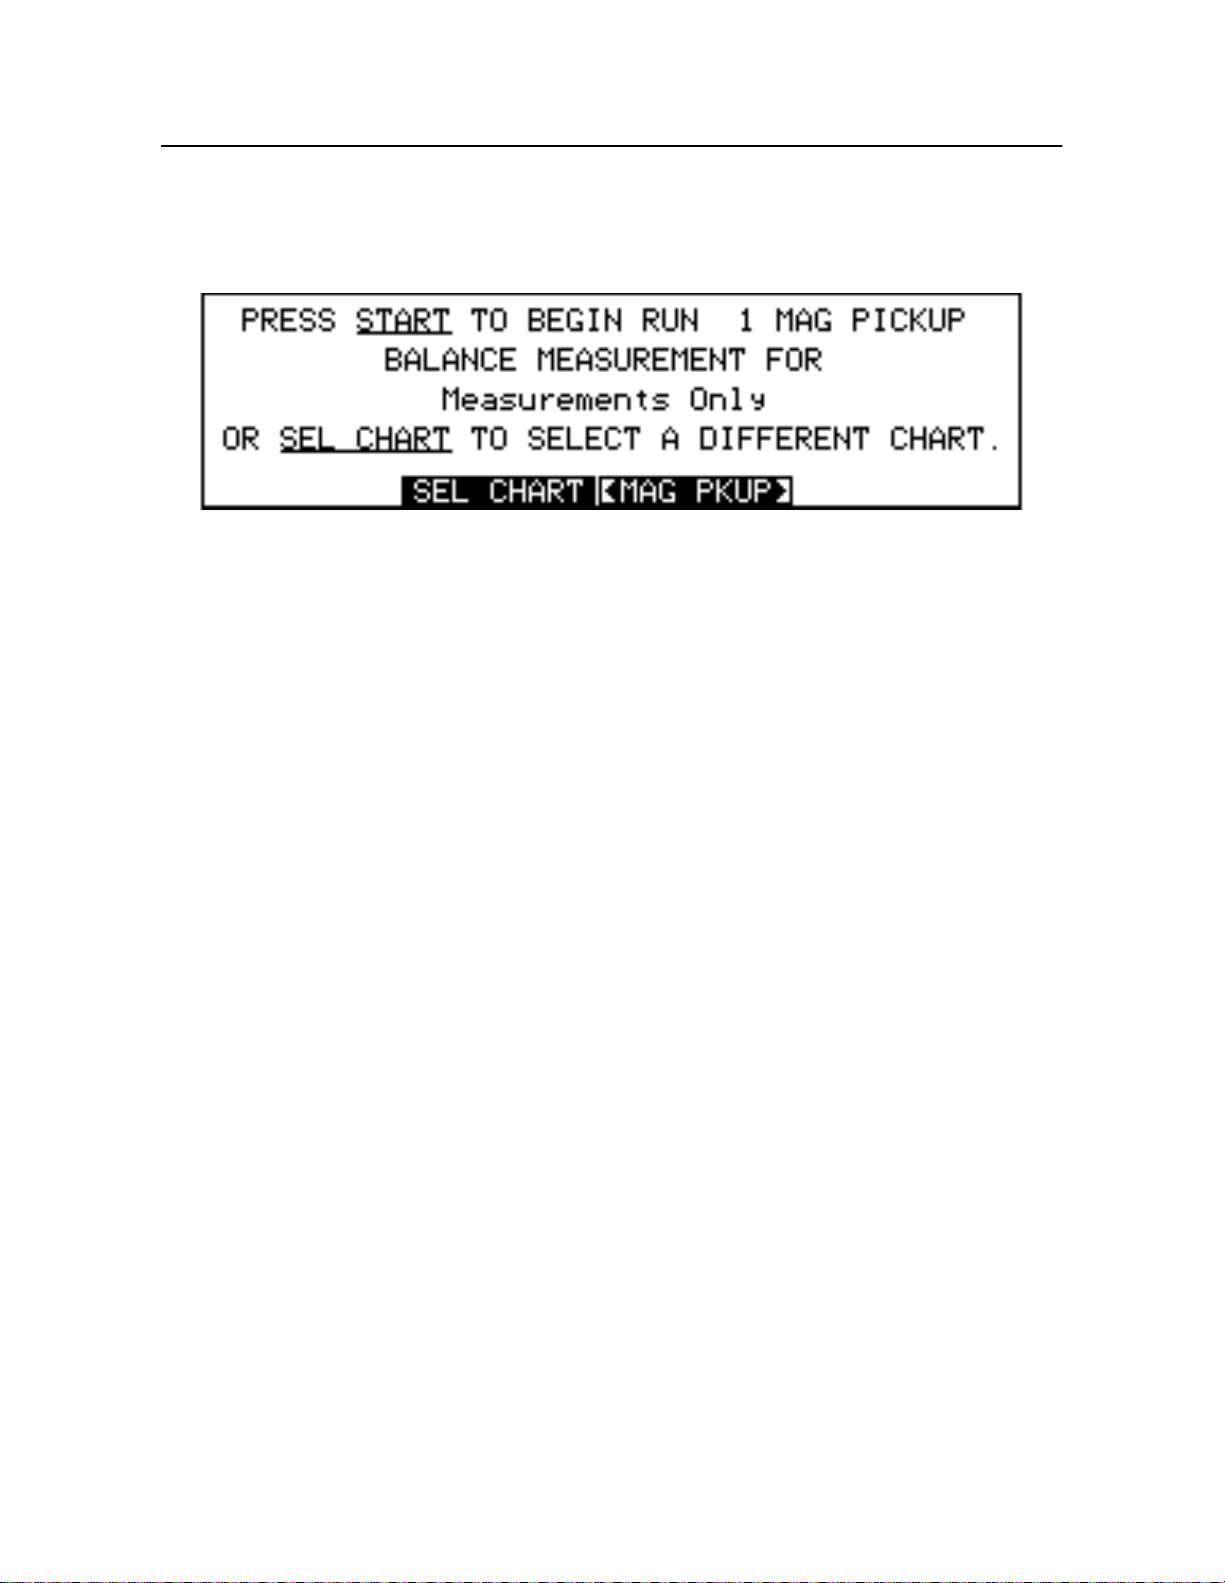
Chapter 5
- Balance Measurement and Solutions
Selecting the Balance Mode
To put the 8500C/C+ into its Balance mode of operation, press th
Start-up screen di s pl a ys a l o n g w i t h tw o soft keys,
SEL C HA RT
and
Figure 5-1. Balance Start-up Screen
NOTE: If the 8500 C/C+ is currently performing o ther time-critical function s, it may b
necessary to press
to terminate the function before the Balance mode can be entered.
STOP
5.2 Balan c e Cha r ts
BALANCE
CHAR TINFO
key. A Balance Mode
(see Figure5-1)
Aircraft balance characteris tics are m ai n ta i n e d in d is c rete data sets called
chart contains data that describes a single rotor element from a particular aircraft type. Charts for the
constituent rotor elem en t s t hat comprise an aircra ft are typically gr o u pe d tog ethe r in one or more
balance char t files. Ba la nce chart files are stored on PC c omp a tibl e di sk et tes for safekeeping, and
loaded into 8500C/C+ memory as required. The distribution disk chart files provided by Chadwick
Helmuth are write-protected and must be copied to another disk before they may be modified o
overwritte n . See Chapt er1 0 Printer and Disk Dr i ve ” for more infor mat i o n o n di sk usage.
balance charts
. A balance
5.2.1 Measurements On ly Chart
Without the appropriate balance chart, the 8500C/C+ cannot present balance solutions for an out-of
balance rotor system. A special chart, th
measure ments of vi b rat i on amplitude and phase ang le . No bal anc e solutions are eve r presented.
However, solutions can easily be determined by hand with the Measurements Only chart and the
appropriate paper chart from Chadwick-Helmuth. In addition, the Measurements Only chart can be
used to collect the data needed to create new paper balance charts for individual systems. Se
Secti on5.6.3 “Using Measurements Only” on pa ge5-19 for more details.
The Measurements Only chart is permanently stored in the 8500C/C+. It is always available for use
and always presented as the first chart in the bal an ce chart men u of t he Select Chart screen.
Measurements Only chart
, allows you to see only the balanc
5.2.2 Smart Charts
Chadwi ck -H elmuth has de ve l op ed a uniq ue ch ar t software technolo g y f o r smooth ing r otors. The 8500
runs the following types of chart programs:
Standard -
•
Smart -
•
5-2
Chadw i ck-Helmuth Company, Inc.
Single-type adjustment charts
Multi-type adjustment charts
Page 51
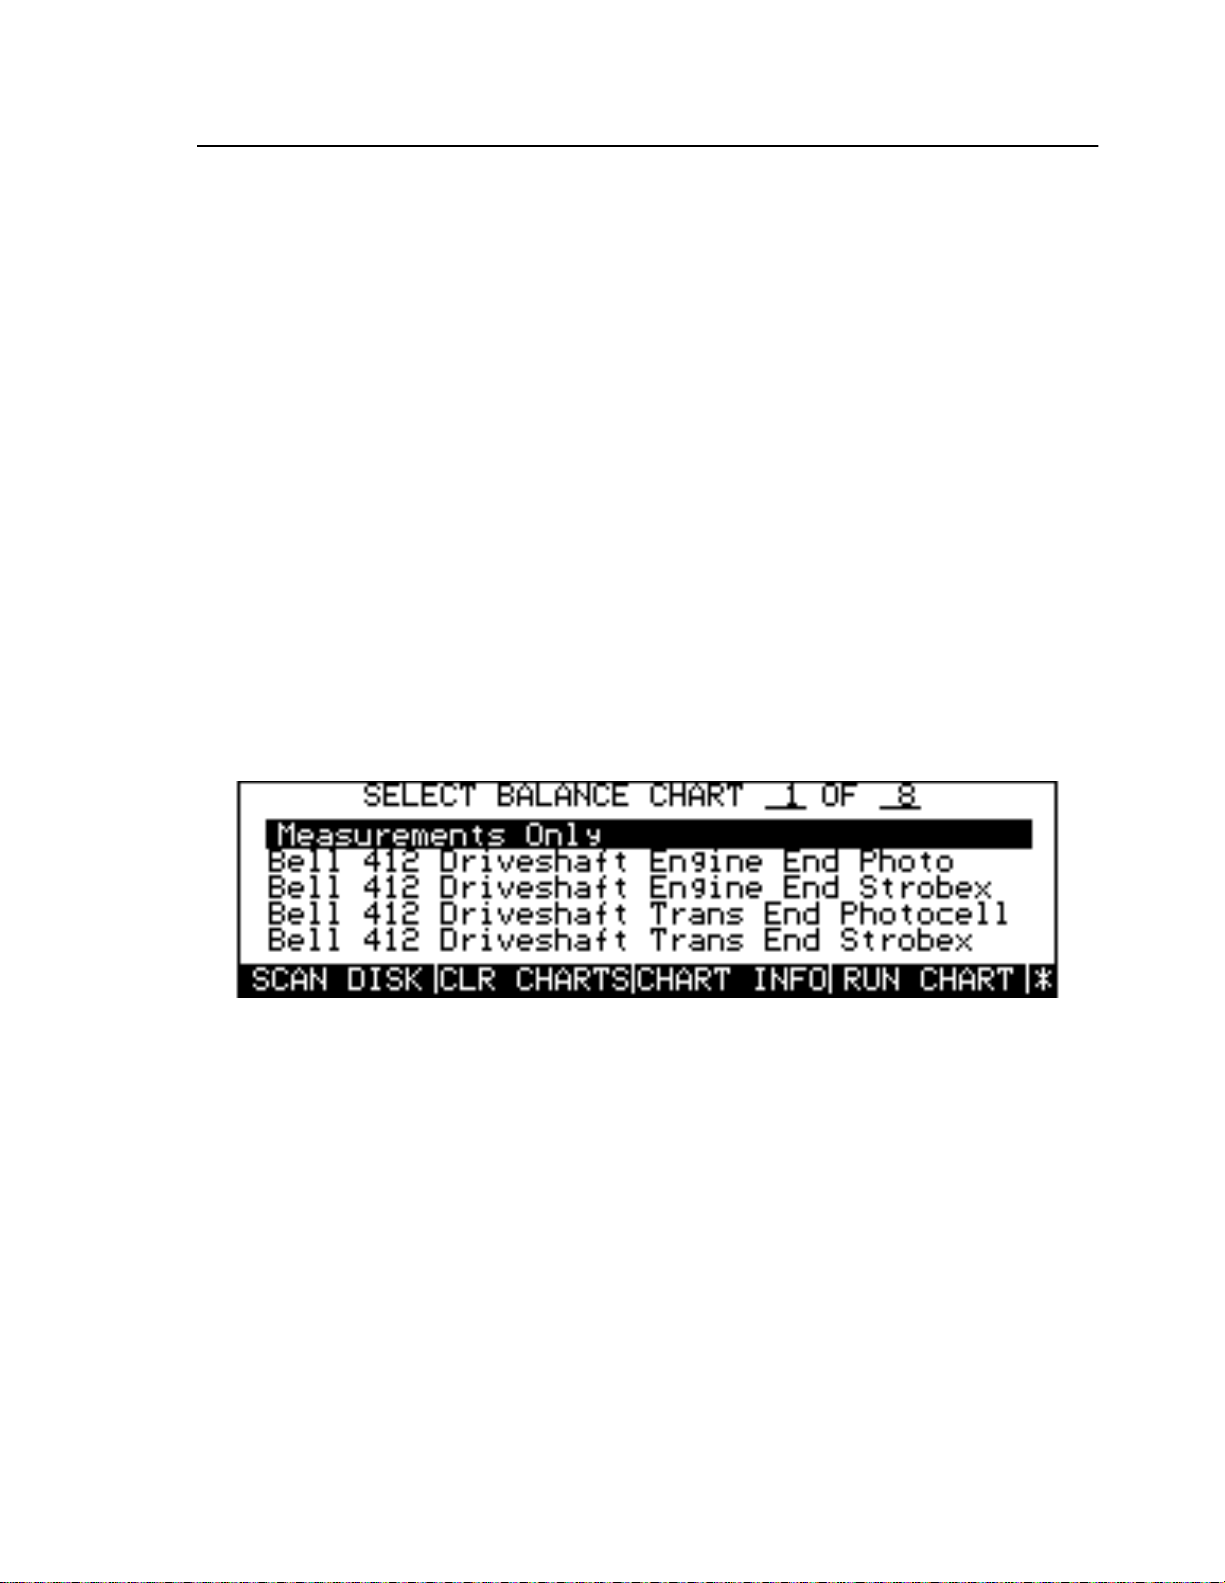
Balance Charts
A
Smart Chart
unique bala nce char acte ris tics an d requir eme nts. As t he name implies, a Smart Chart is intelligent. It
is, in fact, a stand-alone softwar e program that r uns on a host 85 0 0C/C+, u si n g it as a platf orm to work
the target aircraft.
You may treat a Smart Chart just like any other (standard) balance chart. However, when a Smart
Chart is run, it ty pi cally demands that a special set of pro ce du r es an d flight regimes be followed. T h
exact pro gram sequen c e varies f r om o ne Sma rt Chart t o anot h e r a n d so i s bey ond t h e scope of this
manual. For detailed descriptions of specific Smart Charts, see the appropriate 8500C/C+ application
user guide for your subject aircraft.
represents a special class of balance chart designed to work with rotor systems having
5.2.3 Working With Balance Charts
Pressing the
available balance charts (see Figur e5-2). Charts are always listed in alphabetical order, except for the
Measur ements On ly chart, w h i ch i s l i ste d fir s t. U se t he Ar r owkeys t o select a cha r t by moving the
cursor to t h e des ir ed entry. Should the re be more charts t h an the screen c an h o ld, con ti nu ed cursor
movements automatically scroll the window to display them. When you have selected the desired
chart, press
paramet ers filled in. A l ter na te ly, pressin g any key that e x its th e ba lance chart men u s c re en then reads
the selected chart before continuing. Pressing
acquisition.
SEL CHART
RUN CHART
soft key shown on the Balance Mode Start-up screen displays a menu of
to run it. Ch ar t da ta is automatically re ad and the appr opr i at e balance
START
, for example, reads the chart and begins data
Figure 5-2. Balance Chart Menu
5.2.3.1 Scanning Charts on Disks
Balance charts m ay be loade d i nto memor y th r ough t he 8500C / C + di sk drive. Call up the balance chart
selection menu with the
drive. P ress
checkin g t he d i s k, it pre se n ts a menu of the balance chart file s found there. Note th a t some balance
SCA NDISK
SEL CHA RT
to view the char ts o n th e d i sk (see Fig ure5-3). When
soft key and in ser t the appropriate bala nc e chart dis k i n th e disk
Mode l8500C/8500 C+ Operators Manual
SCA ND ISK
finishes
5-3
Page 52
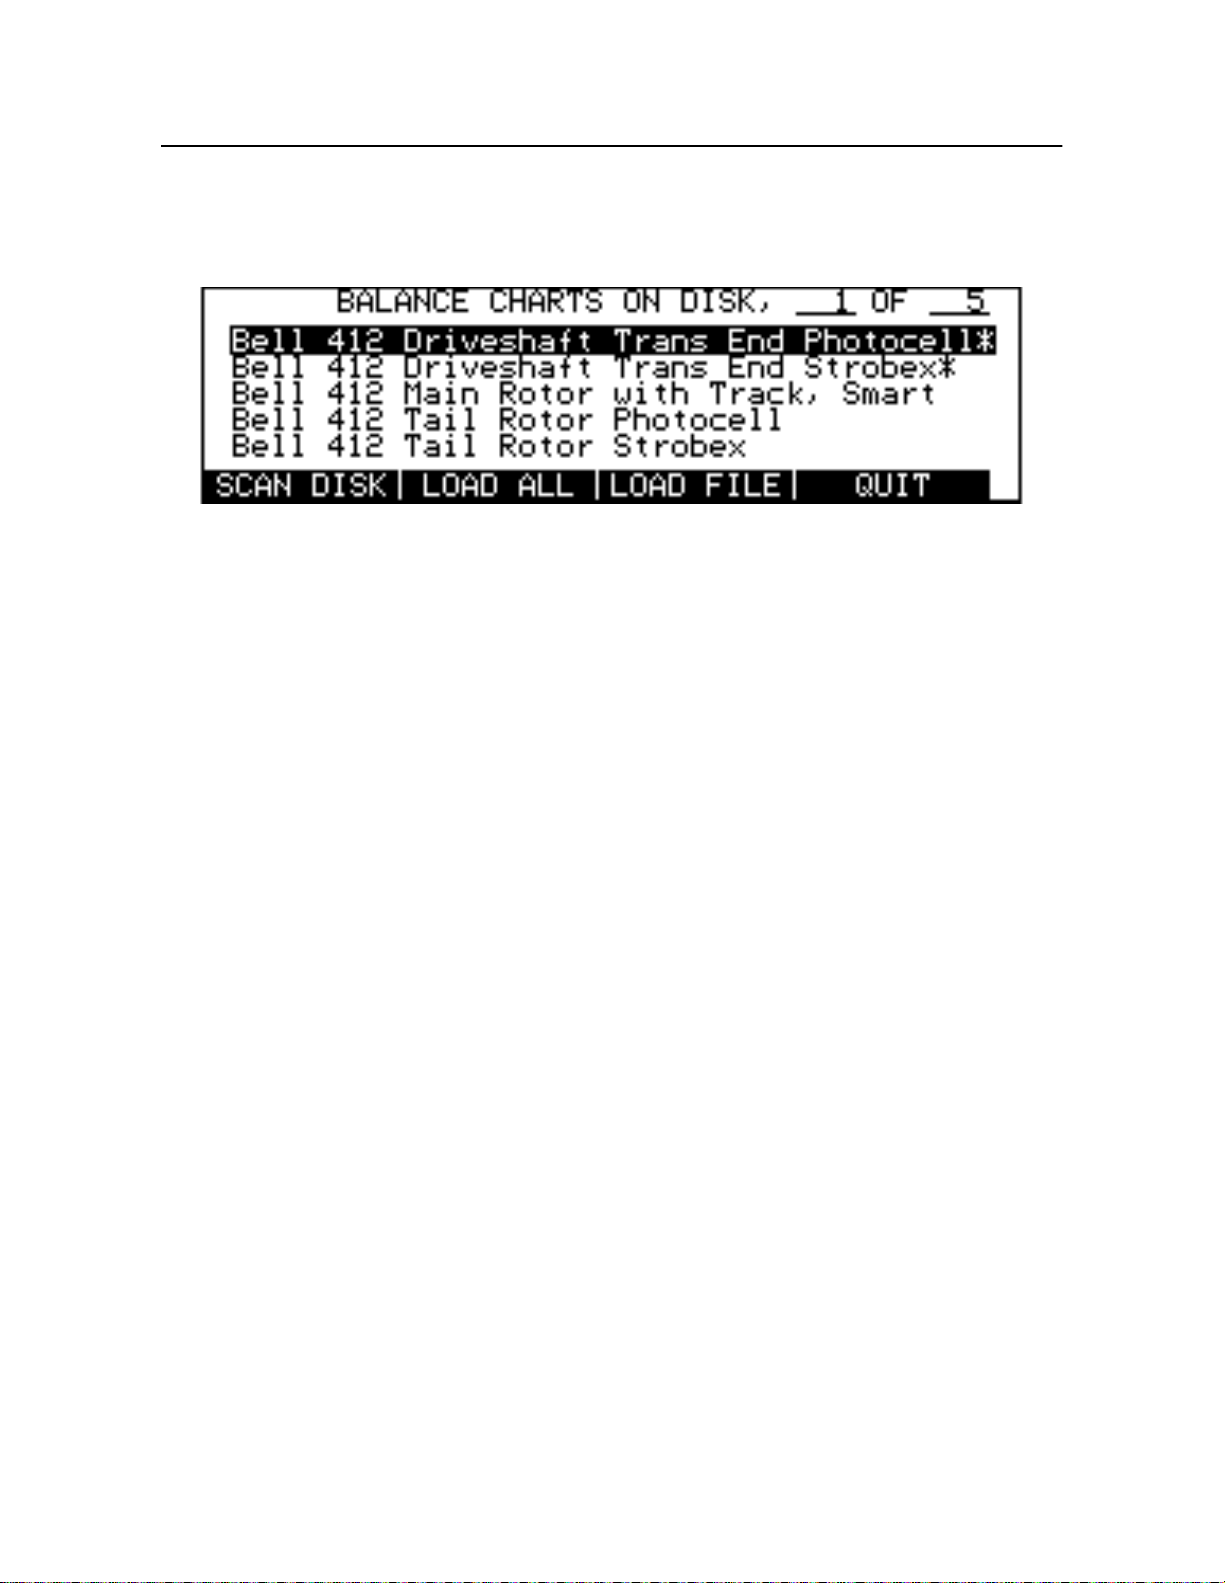
Chapter 5
- Balance Measurement and Solutions
chart file s may contain more than one chart . Fo r such files,
SCA NDISK
lists the first chart contained in
the file and appends an asterisk to the end of the chart name to indicate the presence of additional
charts within that file.
Figure 5-3. Balance Chart Disk Scan
To bypass the disk scan and im m ed ia t e l y loa d all the charts found on the disk, press
LOAD
.
5.2.3.2 Loading Charts From Disk
SCA NDISK
After
presents the menu of charts on disk, press
8500C/C+’s m em or y or use the Arrow keys to sele c t a si ng le chart file. Then press
the selected chart to memory.
When t h e lo ad operation is complete, t he char t selection m e n u displa y s alo ng with the ne w chart(s).
Note that the loadin g of du pl ic ate charts does not overw r ite existing copi es already in memory. They
are simply added to the menu and sorted accordingly.
LOAD ALL
to load all the charts into the
LOAD FILE
to load
See Sectio n10.2.1 “ L o ad i ng Disk Files” on page 10-3 f or a comp l et e des cri p t ion of l oa d i ng ba lance
charts from a disk.
5.2.3.3 Renaming Charts
Balance charts can be renamed and stored to disk or kept in memory. Charts that are specific to a
particular aircraf t may be renamed in order to better identify them. This i s espe ci all y important for
correcte d ba lance chart s, since the correct io n fa ctor s th at have been added t o the chart are applied to all
subsequent balance measurements (see Sect ion5.6.2 “Chart Corrections” on page 5-17).
To rename a chart, press the
RENAME CHT
and displays the Balance Chart Edit screen (see Figu re5-4). The soft keys and procedures used here
are nearly identical to those used to edit the printout annotation. The only exceptions are the use of th
START
and
keys tha t tab fiv e sp ac es to the left an d r ight , res p ectively. S e e Section8.3
STOP
“Annota tin g Print outs ” on pa ge8-5 for a compl ete d escri pti on of the edit m od e. When you have
finished renaming the chart, press th
name of the chart is then updated accordingly on the menu of available charts.
soft key. The 8500C/C+ enters its edit mode of operation
ENTER
soft key t o enter the new name and exit edit mode. The
5-4
Chadw i ck-Helmuth Company, Inc.
Page 53
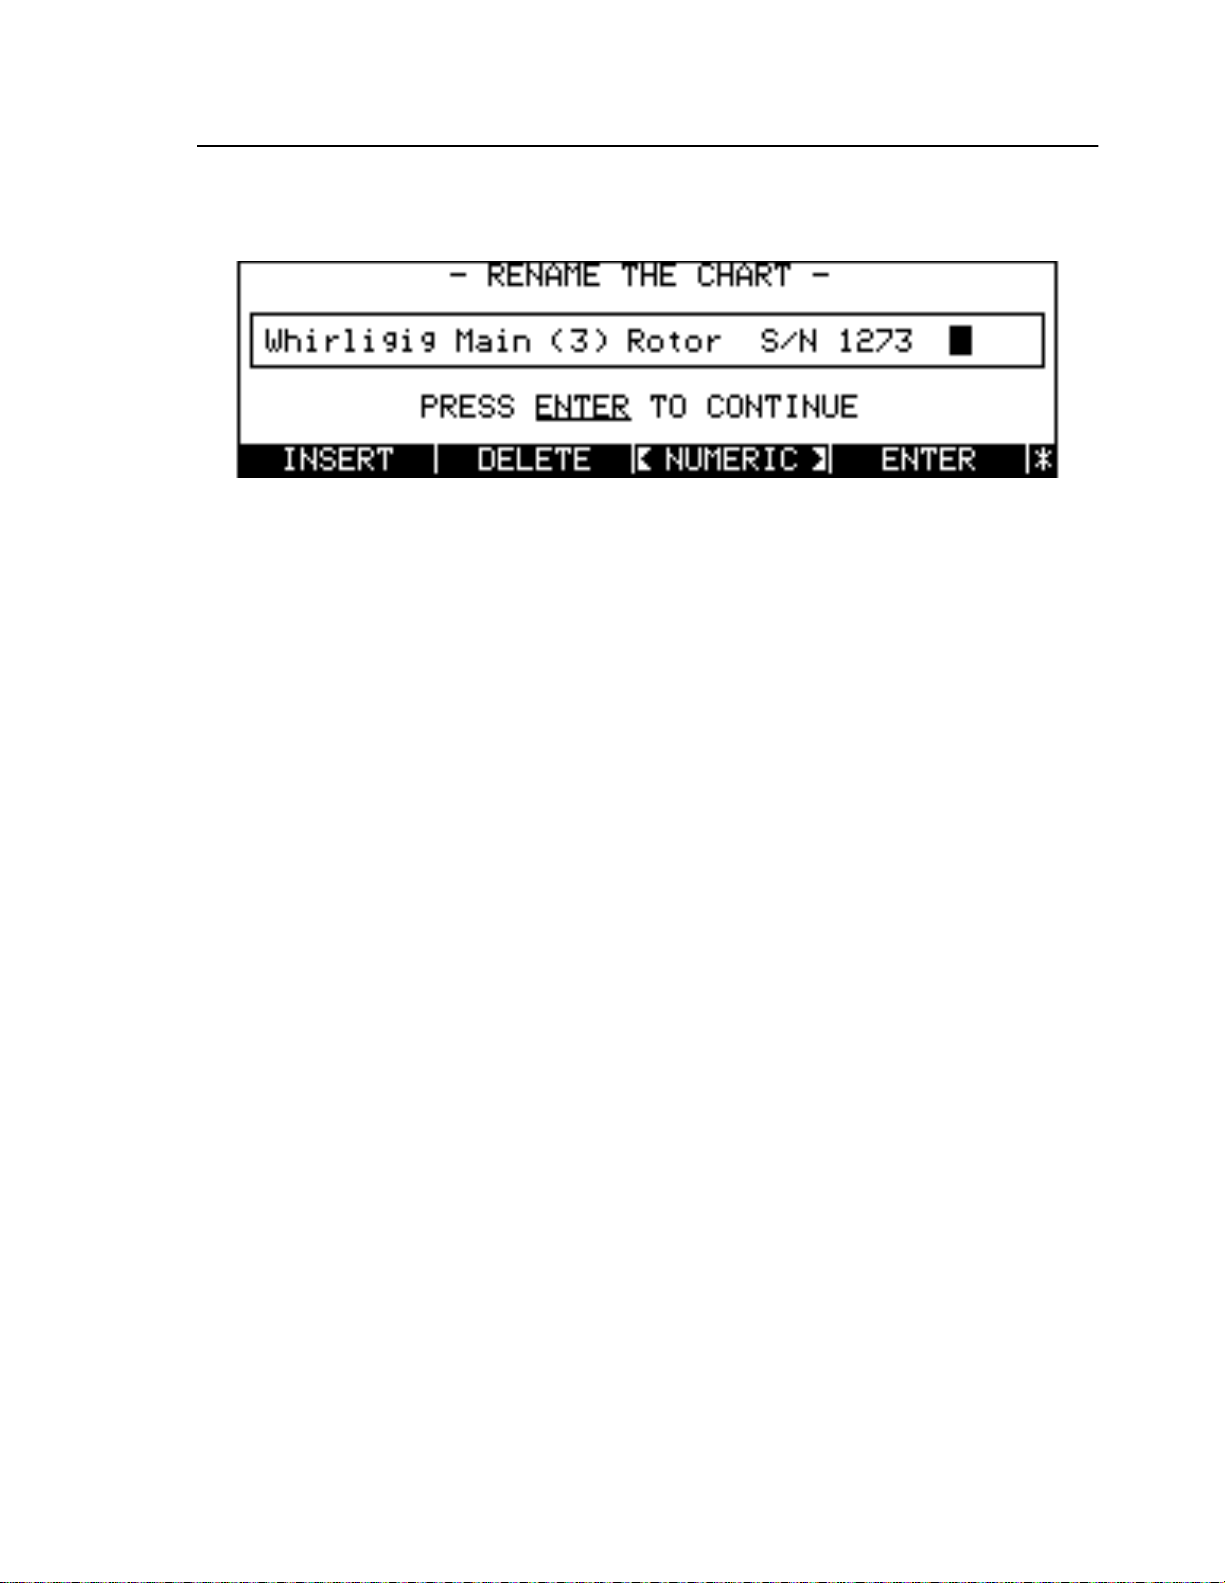
Balance Charts
Note that for the
RENAM ECHT
soft key,
ENTER
does not store the renamed chart to disk (see the next
Secti on5.2.3.4 Storing Charts to Disk”).
Figure 5-4. Balance Chart Edit Screen
5.2.3.4 Storing Cha rts to Disk
Balance charts may be stored f r om memory to disk th r ou gh the 8500C / C+ d isk drive. Call up the
balance chart selection menu with th
drive. Select the desired chart with the Arr owkeys and press
charts that ca n n ot b e stored to disk: The Measurements O n ly chart and Sma rt Charts. Sin c e most charts
are specific to a pa rtic u lar aircraft, you a re first asked t o giv e the chart a new name before it is actually
written t o d i sk. M ak e sure the name you supply provi des a unique identif i c ation for the chart, for
example, the rotor type and the tail number of the aircraft. When a chart is stored to disk, a balance
chart file is created containin g the renamed chart plus the other charts a ss oc ia t e d with t he file . The new
chart file then replaces an existing chart file with the same name.
SEL CHART
soft key and i nsert the appropriate dis k in the disk
STORE
. Note that there are two kinds of
NOTE: Balance histor ies are never written to disk during a char t store operation. This
action must be done explicitly by the user (see Section5.6.1.3 “Storing Histories to Disk” on
pa ge5-16).
To store all the charts listed on the balance chart selection menu, press
STORE ALL
soft key.
STORE ALL
stores all the charts currently in 8500C/C+ memory to the
MORE KEYS
and th
appropriate chart file(s) on disk. Charts are written as is without renaming, so you are not asked to
create new names.
When you press
STORE
(but not
STORE ALL
), the 8500C/C+ enters its edit mode of operation and
displays the Balance Chart Edit screen (see Fi gure5-4 o n page5-5). The soft keys and procedures used
here are identical to those used to edit the printout annotation. See Se ction8.3 “Annotating Printouts”
on pa ge8-5 for a complete expl a na t io n. Wh en you h a v e finish e d renam ing the chart, p ress the
soft ke y to st or e th e chart to disk and exit edit mode. Press
MORE KEYS
and
CANCEL
to undo any
ENTER
editing changes and ca ncel the store operat ion. Whe n th e sto re o pera t ion is co mpl e te, the menu is
redisplay ed, a nd the name of the store d c ha r t update d acco rd ingly.
See Sectio n10.2.3 “Storing Balance Charts to Disk” on pa ge10-5 for a complete explanation o
storing balance charts to disk.
5.2.3.5 Clearing Chart Memory
Balance charts that have been loaded into the 8500C/C+ are stored in the machine's static memory. Th
use of static memory ensures that balance charts (and any other data stored there) do not have to b
reloaded. They are always available, even if power to the instrument is turned off. Data associated with
each chart, such as chart corrections and balance histories, are also stored in static memory. These
Mode l8500C/8500 C+ Operators Manual
5-5
Page 54
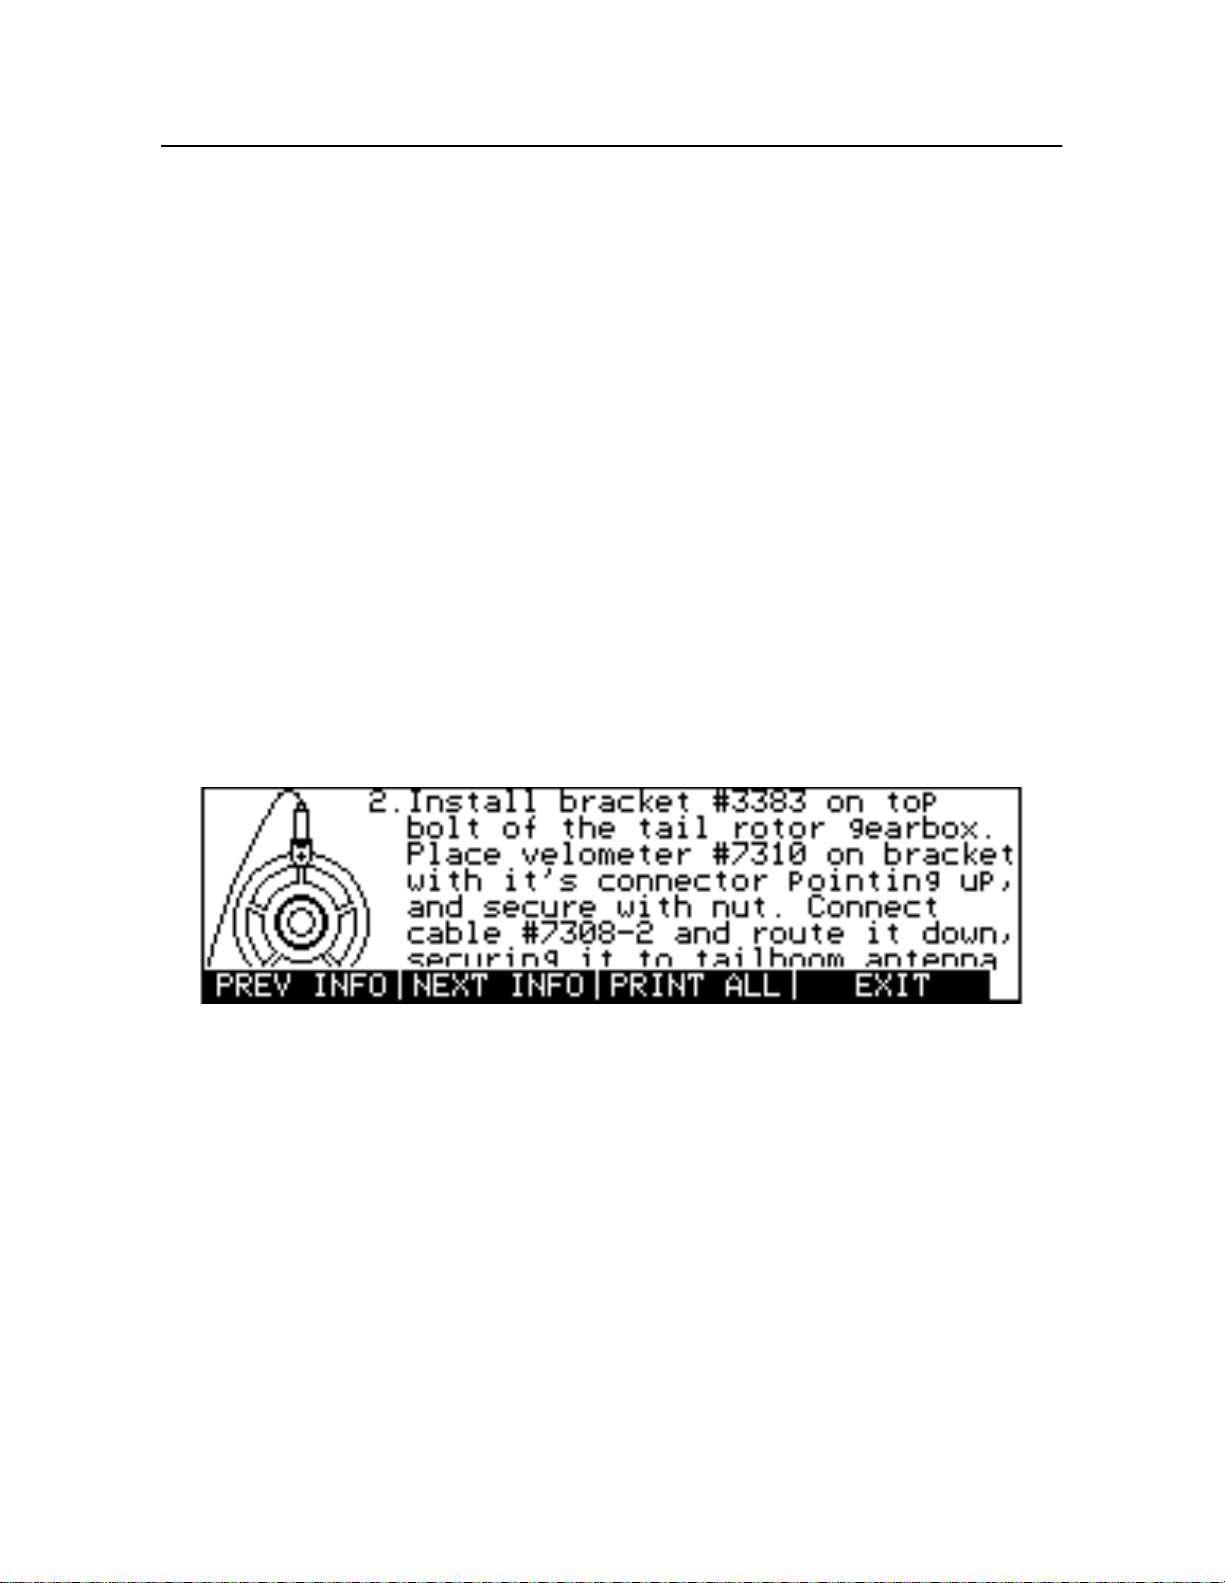
Chapter 5
- Balance Measurement and Solutions
items continue to be added to static memory until the available space is exhausted. Thus, it may
become necessary from time to time to clear out some items from static memory and purge the data
accumulated there.
To clear out the portion of static memory containing balance charts and histories, press
CLR CHARTS
Balance cha rt s, chart co rrections, and balance hi st o ries are th e n d el eted from static memory, and all
chart names removed from the menu in the Select Chart screen. Since the Measurements Only chart is
perman ent, it cannot be de l e ted.
5.2.3.6 Displaying Chart Information
CHAR TINFO
The
such as the l o ca t ion of system bal ance po in ts, the insta l l ation of vib r ation transd ucer s and retro
reflective targets, and the orientation of the reference azimuth for determining phase angle (se
Figur e5-5 on pag e5-6).
CAUTION: This information is essential to the correct setup of the system prior to
balancing. Be sure to read it thoroughly and follow any given instructions.
PRE VNFO
The
information screen or the one that follows. Similarly, the Upand Dow nArro wkeys can be used to
scroll inf ormation scr eens as well. Th e last i nf orm ation sc r een di splays the correspond i ng paper chart
number (if one exists) and the balance chart version number. Press
To print the complete t e x t with illus tra tions, press the
soft key displays important information about the currently selected rotor system,
NEX TINFO
and
soft keys scroll up and do wn, respectively, to the previous
EXIT
to quit the display.
PRINT ALL
soft key.
.
5-6
Chadw i ck-Helmuth Company, Inc.
Figure 5-5. Chart Information Screen
Page 55
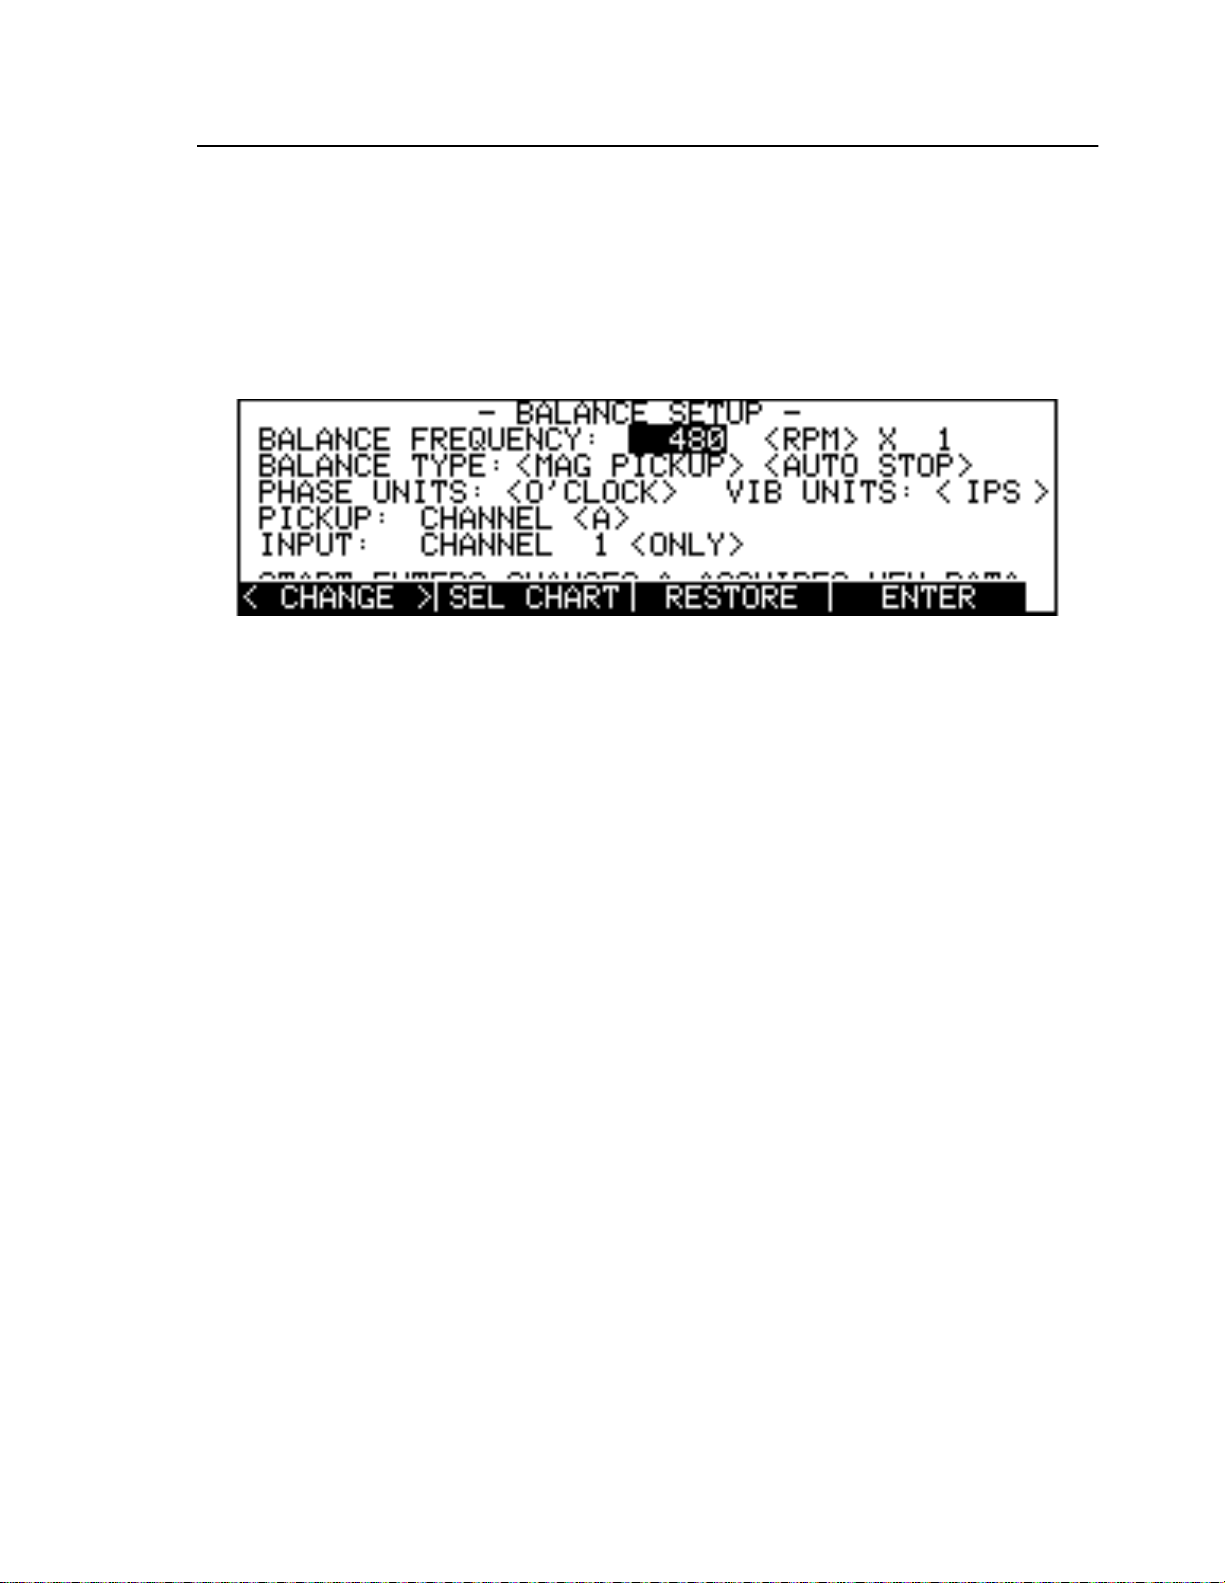
Parameter Setup
5.3 Parameter Setup
The 8500C/C+ supports the modification of several important parameters used to control data
acquisition a nd displ ay during the b al a n c e measure ment p roce ss. In g enera l, the se para m eters are
automatically set when a balance chart is selected. They may, however, be overridden by pressing
SETUP
Key” on pag e4-7 for more information on Setup screens.
, which in turn displays the Bal ance Setup screen (Fi g ure5- 6). See Se ction4.2.3.4 “S ET UP
Figure 5-6. Balance Setup Screen
Use the Arro wkeys to select the field whose contents are to be modified, and th
or the numeric ke yp a d to effect the desired changes . Th
resumes operatio n in Bala nce mode. Th
set by t h e most recent
Once the Balance Setup screen parameters have been modified, you may alternately press
to save the cha ng es and return to Balan ce mode, or
measure ment. In effe ct, both of these keys exec u te an implicit
respe c t ive functions.
The following sec tions de scr ibe in gr eater detai l the various Ba lance Setu p scree n fields.
ENTER
.
RESTORE
ENTER
soft key restores to all fields the values that were
START
soft key saves the changes and
to save the changes and begin a balanc
ENTER
before performing their
<CHANGE>
BALANCE
soft key
5.3.1 Balance Frequency
The
balance frequency
of a vibration si gn al, it u su a lly appear s as a we ll defined peak whose vibratio n amplitude and
frequency characteristics were generated by an out-of-balance rotating element. During balanc
measurement acquisition, the 8500C/C+ attempts to lock onto a vibration signal at the balance
frequency and analyze it.
Set the balance frequency by entering the desired value from the numeric keypad. Balance frequency
can also be set in Spec trum mode w i th the
selected, the current balance frequency value is automatically overridden with a default value from the
chart. This val u e mus t b e withi n range of the rotor syste m' s a c tu al vibration sig nal ±6 .25percent o f the
designated value. Otherwise, the 8500C/C+ is not able to locate the vibrational peak during balance
measurement. If a balance acquisition fails, take a spectral plot before a new balance measurement is
begun in order to s et the balance fre q u ency t o a known ac t ual v alue. S ee Section7. 4.4 Setting th
Balance Frequen cy ” on pa ge7-9 for det ails on acqu ir ing spect ra l fre qu en cy plots and setting the
balance frequency with th
is the frequency at which a rotor balance is to be performed. On a spectral plot
BA LFREQ
BAL F REQ
soft key.
soft key. Note that when a balance chart is
Mode l8500C/8500 C+ Operators Manual
5-7
Page 56

Chapter 5
- Balance Measurement and Solutions
5.3.2 Frequency Units
The balance freq ue nc y may be displaye d i n e ither r evo l uti ons per minu te (RPM) or cyc les per second
(Hertz). Use the
parameter is set, all other displays of frequency data are made in these units. The default is RPM. This
paramet er is n o t o v e rr id d en w h en a balance cha rt i s sel ected.
<CHANGE>
soft key t o convert the fre qu ency from one for m to t he other. Once this
5.3.3 Balance Multiplier
The balance multiplier factor is an integer value by which the balance frequency is multiplied before a
balance mea s ur ement is ta ke n . It i s t yp i c al l y us ed t o analyze n-per-revol uti o n vib r a t ion signals that
may be present in the spectrum. The default value i s1 (one per revolution). For example, a balanc
frequency of 3 00RPM and a balance multipl ier of2 causes the 8500C/C+ to acquire a balanc
measurement at the two-per-revolution frequency (600RPM). Set the balance multiplier by entering
the desired value from th e nu me r ic keypad.
5.3.4 Balance Type
Balance type describes the particular system used to measure the phase of the vibration signal. Th
8500C/C+ currently supports the following balance type settings:
Photocell
•
Mag pickup
•
Strobex
•
The Photocell and the Strobex are optional with the 8500C/C+ kit. The magnetic pickup can be
purchase d se parately. Use the
chart is selected, the current balance type is automatically overridden with the type stored in the chart.
(Photocell System)
(Mode l3030 Magnetic Pickup)
(Model 135M-12 Strobex Tracker)
<CHANGE>
soft key to toggl e betwe e n them. Note that wh en a ba l ance
5.3.5 Auto/Manual Stop
If a Photocell or magnetic pickup balance is being performed, the 8500C/C+ can be directed to
automat ic al ly terminate ba lance da ta acquisition when a satisfact o ry measureme nt has been obtained
(auto-stop mode). Manual stop mode, on the other hand, requires you to press the
measurement. Note that if you use the manual stop mode, the 8500C/C+ must have a satisfactory
average of balance data points before it can accept the measurement as valid. Use the
key to toggle between the two modes. The default mode is auto-stop.
key to end th
STOP
<CHANGE>
soft
5.3. 6 Angle Units
The phase angle is a measure of the phase of the velocimeter signal relative to a fixed reference point
on the rotor s y s tem . It correspo n d s t o the central ang l e sub ten de d by the two vectors, and is given
either by the position of a reflective target illuminated with the Strobex, or through the phase meter
display o n the 8500C/ C + liqui d- c ry stal d i sp lay (LCD).
Phase angle units may be displa ye d in ei th er degrees or clock a ng l e units. Use the
to con ve rt the units fr om one form to the other. Once this parameter is set, all oth e r di s pl ay s of phase
measurement data are made in these units. This parameter is not overridden when a balance chart is
selected.
5-8
Chadw i ck-Helmuth Company, Inc.
<CHANGE>
soft key
Page 57

Balance Measurement
5.3.7 Vibration Units
Vibrations may b e displaye d i n uni ts of veloci t y (inches per second or IPS , 0-pk ) acceleration (g’s or
in./sec2), or displacement (mils, DA). Use th
to the other. Once this parameter is set, all other displays of vibration data are made in these units. This
paramet er is n o t o v e rr id d en w h en a balance cha rt i s sel ected. One mil equals 0.001in.
<CHANGE>
soft key to co nvert the unit s from one form
5.3.8 Signal Selector Pickup Input Channel
If a Mode l852 0C Signal Selecto r is attached to the 8500 C/ C+, this field all o w s y o u to select the Signal
Selector magnetic pickup or Photocell (azimuth) channel to be analyzed. Use th
to choose the desired channel. See Chapter11 “Model8520C Signal Selector” for a complete
description of this instrument.
NOTE: If a Signal Selector is not attached to the 8500C/C+, this field does not appear.
<CHANGE>
soft key
5.3.9 Signal Selector Vel oc im et er Chan n els
If a Signal Se lector is attached to the 8500C/C+, th i s field a l l ows you to ch oose the Si gna l Selector
velocimeter channel(s) to be analyzed. Use th
either + (to add signals), or - (to subtract signals), or
selected b y pos i t ioni n g the screen cursor over th e channel number to be c hanged and entering a ne
value from the numeric keypad. See Chapt er11 “Mode l8520C Signal Selector” for a complete
description of this instrument.
<CHANGE>
ONLY
soft key to select an operato r symbol,
(to select one channel only). Channels ar
NOTE: If a Signal Selector is not attached to the 8500C/C+, this field does not appear.
5.4 Balan c e Measurem ent
The manner in which a balance measurement is made greatly depends on the rotor system and balanc
type selec te d. Bef ore attempting an y of the bala nce proced u re s ex p laine d in this section, be sure that
the selected c ha rt i s th e correc t cha rt for the target rotor system and that all para me t er s hav e be en set to
appropriate values. Be sure that all information available through th
read. Follow any direction s gi v en there. Also ma ke sure to chec k th e hardware. Th e power/sign al input
cable must be properly secured to its connector at the rear of the 8500C/C+, all cables neatly tied and
dressed , an d t he appropria te s i gn a l input devic es (v e locimeter, Photocell, and/or magnetic pickup)
correctly mounted and in good working order.
5.4.1 Initiating Strobex Measurement
Strobex balance requires that the Strobex be connected to the 8500C/C+ through the dedicated adapter
at the rear of the unit. A re tr o-reflective ta rget must also be attac hed to the target bla d e gr i p. Put the
8500C/C+ into Balan c e mode and make sure th e b a l an c e type is set to Strobex. With the rotor system
running at the appropriate speed, press
START
. The 8500C/C+ then attempts to acquire a vibration
CHAR TINFO
soft key has been
Mode l8500C/8500 C+ Operators Manual
5-9
Page 58
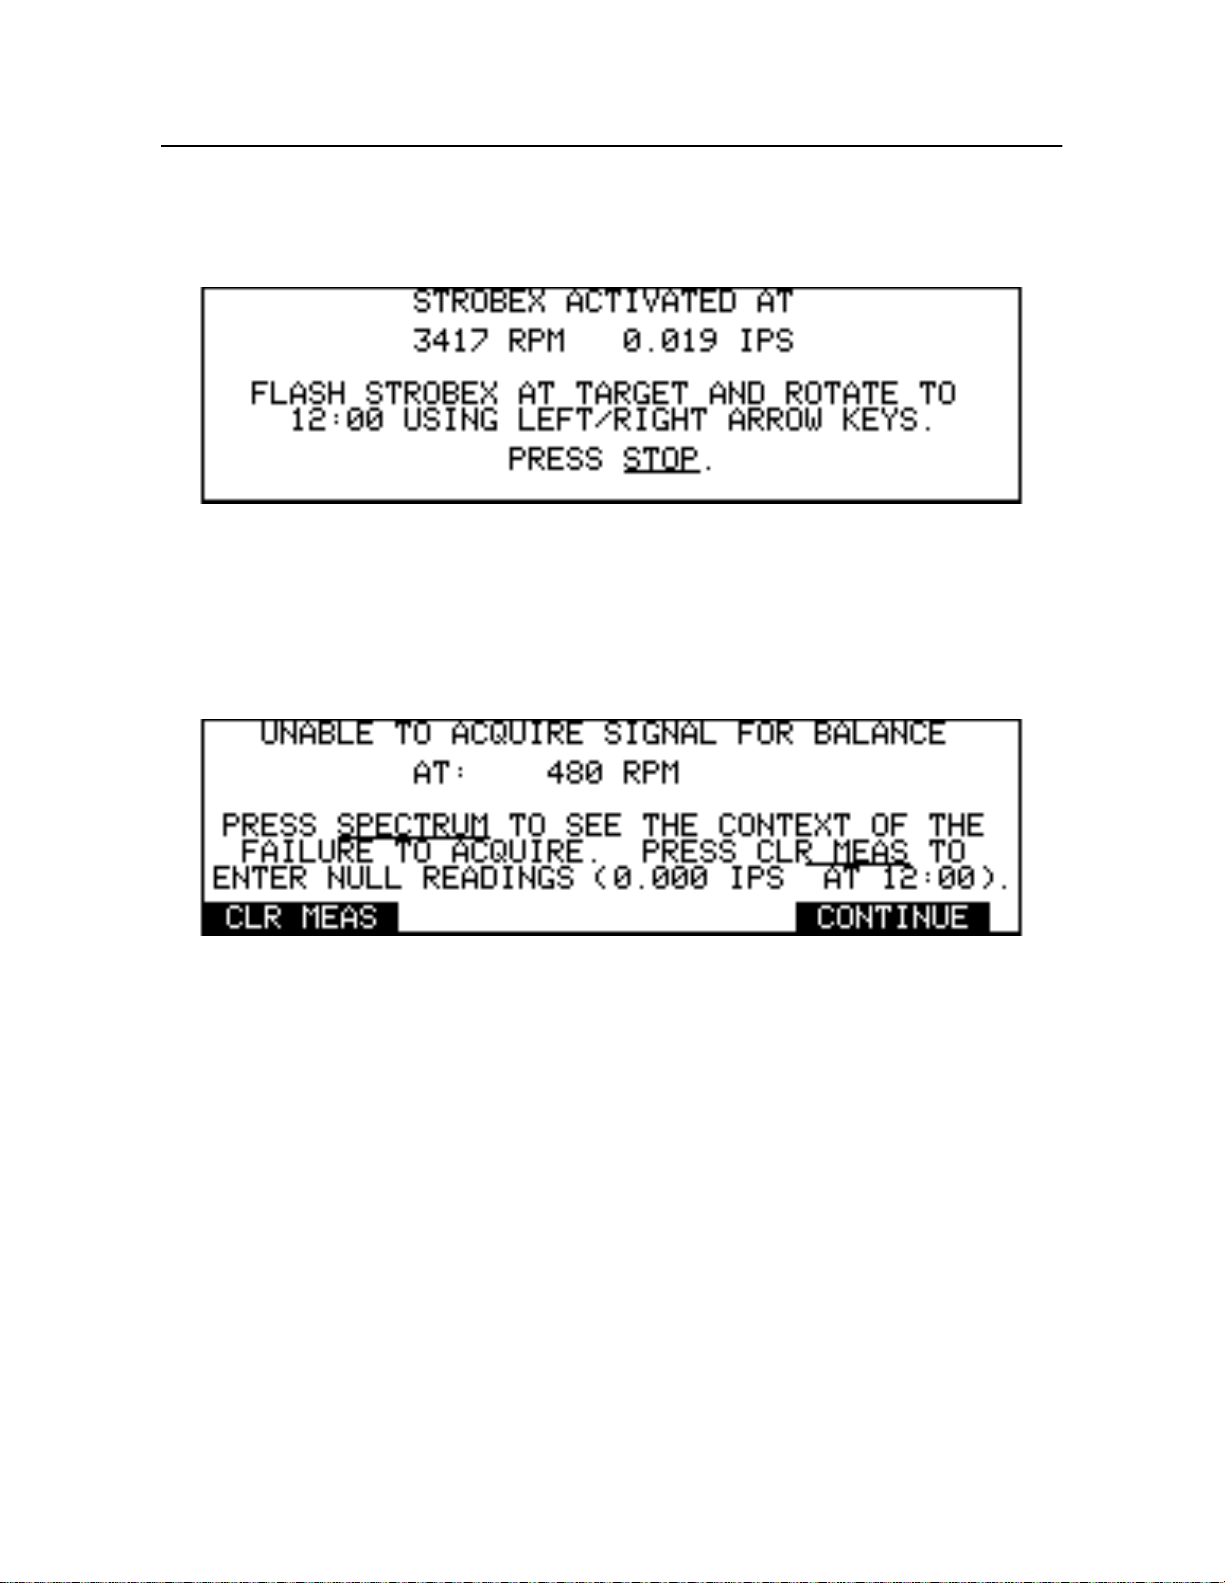
Chapter 5
- Balance Measurement and Solutions
signal b y lo c k i ng o nt o the velocim eter p ul se a t the desi gnated bal an ce freq u e nc y. If a vibration signal
is acqui re d, the 8500C/C+ t h en indi c a te s tha t the St r o bex has been activa te d and that the balance
measurement may continue (see Figure 5-7).
Figure 5-7. Strobex Activation Screen
If a vibration signal is not present, the measurement terminates, and an error message is displayed
(Figur e 5 -8). In this case, use the
SPECTRUM
determine the cause of the failure. Usually, the problem is a preset balance frequency that is not within
range o f the ac t ua l v i bra t ion sign al. The 850 0 C/ C+ can onl y an al y z e those frequenc ies that are within
±6.25 percent of this designated value.
key to displa y the acqui red spectral bala nc e dat a to help
Figure 5-8. Strobex: No Balance Frequency Signal Error Screen
If the 8500C/C+ indicates that a vibration signal has been found, press the Strobex trigger and aim it at
the rotor disc. The r et ro -reflective tar g et then appear s frozen at some ang ular positi on or clock angle,
relative to t h e r o tor's reference a z imuth. The azimuth is u su ally at12:00, and the actual position is
usually i ndic at ed o n th e bal ance c ha rt. Use the Lef tand Ri g htArr owkeys t o mo du l a te the Strobex
pulse rate so that the target appears to rotate toward the azimuth. A single keystroke changes the target
positio n by one degree. Holding t he ke y do w n changes it more quickly. The ta rget m a y be rotated in
either the clockwise or counter-clockwise direction. When the target stabilizes at the designated
position, press the
has been pressed, the
STOP
the balance me a surement. The pl o t is a utomatically cente r ed a b o ut th e balance frequency.
NOTE: When the retro-reflective target has been visually moved to its designated position, it
may appear to fluctua t e or “ j i tter ” without ever be coming com pl et ely s t able. This
fluctuat io n do es not affect th e balance sol ut i on. If the m e a n positi on of the target can be
judged to be st able, the com pu t e d so lution does not suffer any apprec iabl e loss of accuracy.
5-10
Chadw i ck-Helmuth Company, Inc.
key to complete the balance measurement and display the solution. Onc
STOP
SPECTRUM
key can be us e d t o d ispl a y t h e spec tr a l dat a acq ui red during
Page 59
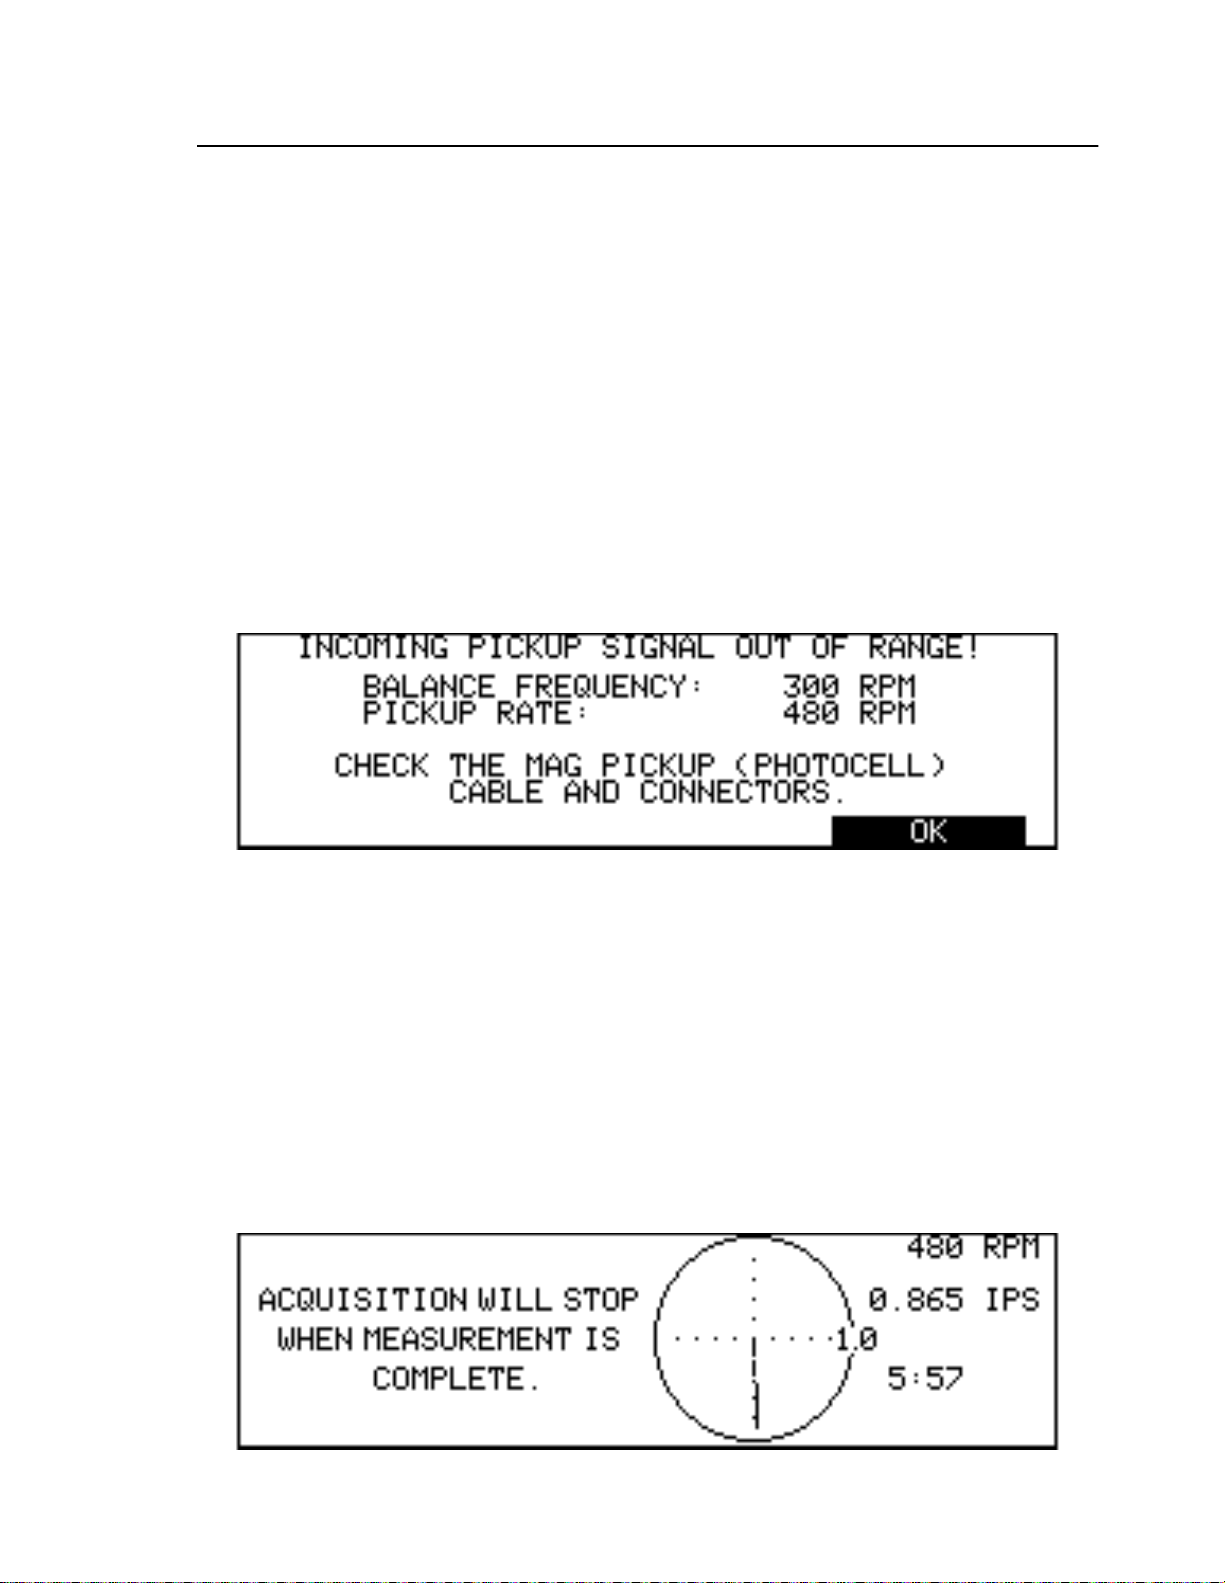
Balance Measurement
5.4.2 Magnetic Pickup/Photocell Measurement
The procedures for magnetic pickup or Photocell balance measurement are nearly identical, except fo
the input devices employed. The Photoce ll k i t requires the installation of a retro-r ef le ctive target on the
root of the target blade, whereas the magnetic pickup requires the installation of a magnetic interrupter
on the target rotor. Put the 8500C/C+ into the Balance mode and make sure the balance type is set to
Photocell
press
START
onto the p ic kup pulse at the designa te d bala nc e frequency.
If no azimu th puls e is found at the bala n ce f requency, the m easure me nt t e r minat es and an error
message is dis p la ye d (F i gu re5-9) . A t this p oint, ve rify tha t the magnet ic p i ck up/Photo cell cables are
correctly co nn ec t ed , an d t ha t the de vices themselve s a re c o r r ec t ly installe d an d in good working order.
You may also wish to veri fy that the des ignate d balan ce frequency is wi th in range of the actual
vibration signal. To do this action, take a spectral frequency plot via the
magnetic picku p rate i s alway s di sp l a y ed on th e Status screen. Display this scre e n by pressing the
STATUS
Mag Pickup
or
. As in a Strobex bal an ce, the 8500C/C+ attempts to ac qu ire a vibration signal by l ocking
key (see Chapter 9 “Status Screen Operation”).
, which ev er applies. With the r ot o r syste m run n i ng a t the ap pr op r iate speed,
SPECTRU
key. The current
Figure 5-9. Magnetic Pickup/Photocell: No Synchronization Signal Error
If a vibration signal is acquir e d, th e 8500C/ C+ d is plays a graphic represe n ta tion of an analog phas
meter, a four-quadrant circle whose radius delimits a maximum vibration amplitude (see Fi gure5-10
on pa ge5-11). During the course of the me asurement, a line vector is drawn from the origin and
continuously up da t ed . Its magnitude represents the curren t v i bration am pli tu de , and th e central angle
subtended by it and th e az i muth represe n ts the current phase an gl e. N um e ri ca l va lu es for the current
frequency, vibration amplit ud e, and phas e are continuously disp la yed and updated.
If the auto-stop mode has been selected (see Se ction5.3.5 “Auto/Manual Stop” on pag e5-8), th
8500C/C+ automatically completes the measurement itself and displays the computed balanc
solution. If manual stop mode has been selected, wait for the vector to stabilize, then press
terminat e the mea s urement and generate t he bala n c e solution. A ga i n, th e vect or n e ed no t b
complet el y s t at ionary to ob t ai n a n accurate solution.
STOP
to
Figure 5-10. Magnetic Pickup/Photocell Phase Meter Display
Mode l8500C/8500 C+ Operators Manual
5-11
Page 60
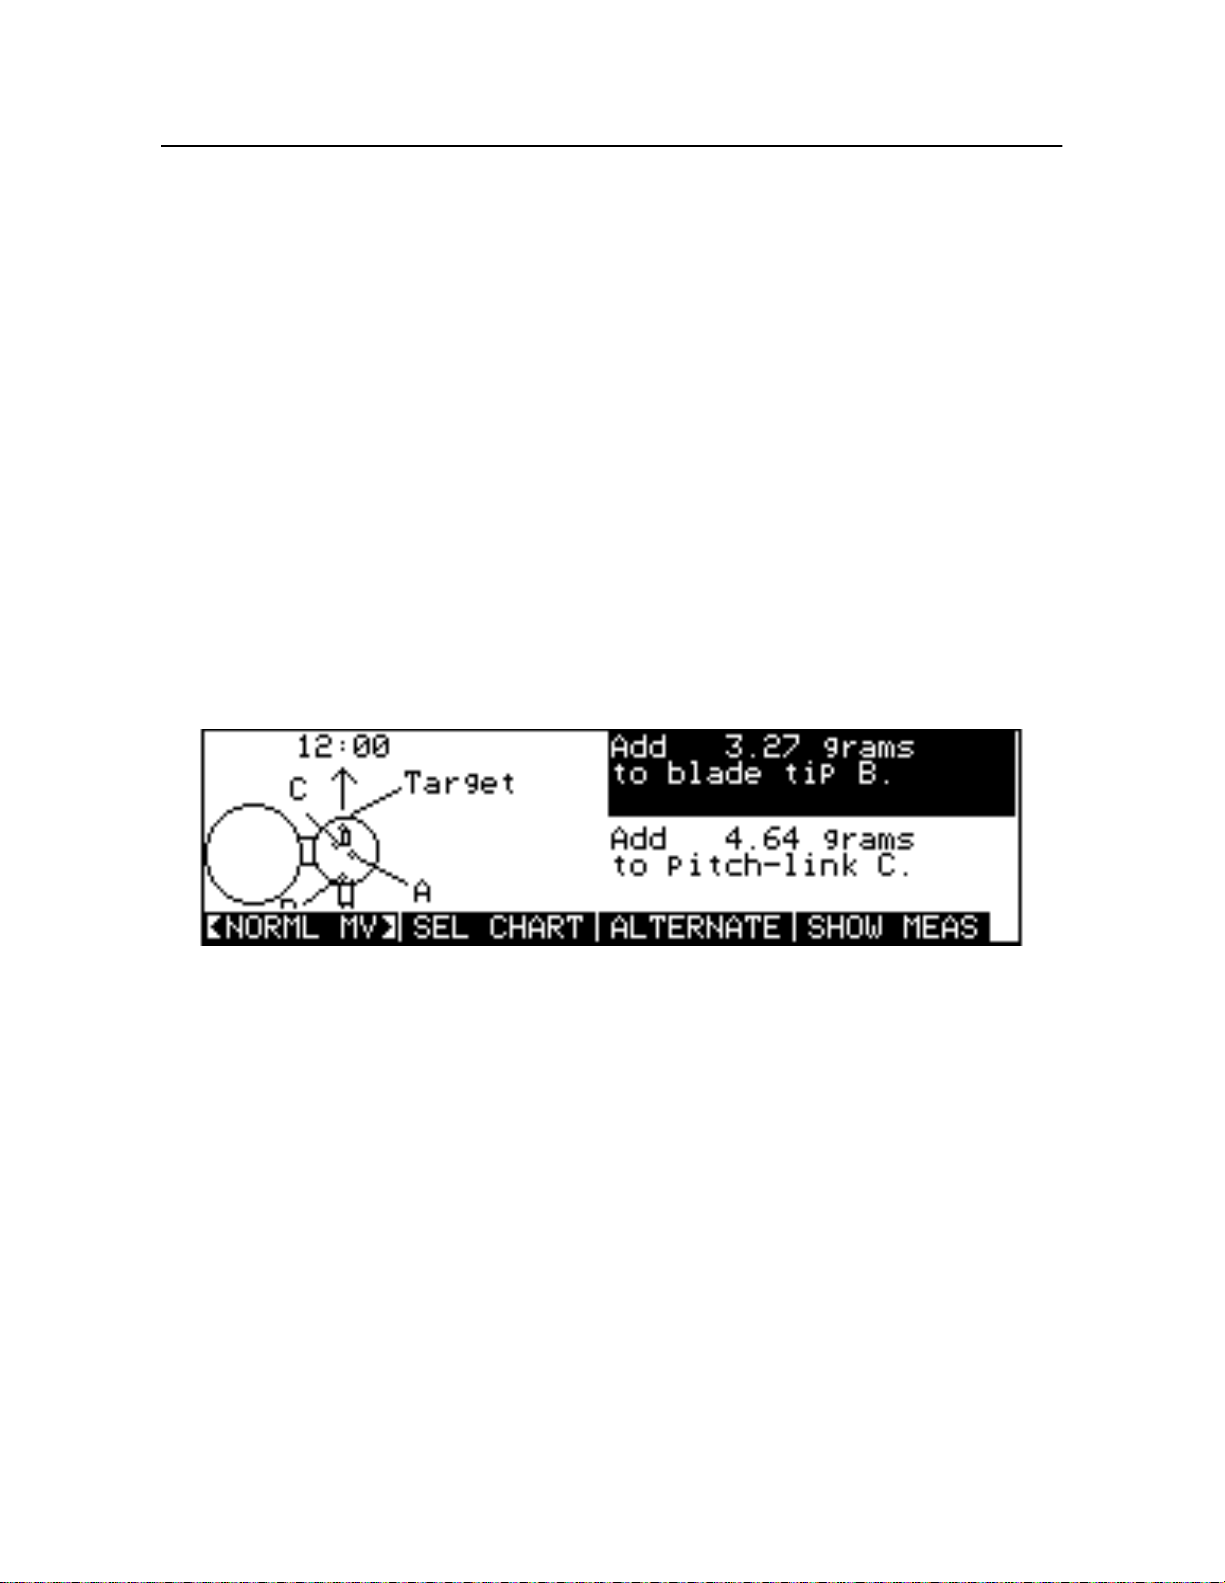
Chapter 5
Occasi on ally, the vibrat ion amplitu de on the phase meter displ ay may appear as five asterisks (*****),
which in d ic at e s th a t t he a mpl it ude value is out of range. This i s usually due to the action of the analog
clip detector and progr am ma b le gain s tage, whic h may h av e been set too high w he n the measurement
began. If th e 8500C / C+ encounter s th es e amp li t ude valu e s, i t automatically begins t o a d ju st the gain
until a c orrect a m pli tude si g nal is seen.
- Balance Measurement and Solutions
CAUTIO N: If the 850 0 C / C + is in manual stop mo de, do not press
are displayed, since this causes the 8500C/C+ to display an error message when th
measurement ends. Instead, wait for the 8500C/C+ to stabilize the internal gain and
produce a r e ada b le v i bra ti on a mp l it ude before termin a t ing the measurement.
while the asterisks
STOP
5.5 Solution Presentation
After a balance measurement has been terminated with the
problem is computed and displayed on the LCD (see Figur e5 -11). The left side of the screen shows
schematic drawing of the rotor system (if one is available), with its balance points, targets, and azimuth
labeled for clarity. The balan ce s o l u tion appears to the right and consists of two instructions or
correctiv e move s , on e of w hi ch is hi ghl ig hted b y a bl oc k c u rsor.
aircraft if a full rotor balance is being performed.
key, a solution to the vibration
STOP
Both moves must be applied to th
Figure 5-11. Solution Screen for Balance
Note that the f irst balan ce solutio n al w ay s c o nsi sts o f two add mov es. Fo r sys tems w i th an odd number
of blades, such a so lut ion ca n n ot be the most effic i ent o r o ptimal one, th at i s, requiring the smallest
adjustments to the balan ce p o i nts. It may, however, prove optimal for s y st em s w i th an even number of
blades. You may w i s h t o e xamine alte rn at e move s t o d etermine the mo st eff ic i ent se t of balance
adjustments (seeSecti on5.5.2 “Alternate Solutions” on pa ge5-13).
Three soft keys, labeled
available. The rest of this section explains these keys.
CAUTIO N: In order to correctly implement a full ba l a nc e sol ut ion, both co rrective actions
must be carried out. Performing one action without the other adds significantly to the
number of runs required to achieve a successful balance.
5-12
Chadw i ck-Helmuth Company, Inc.
<NORML MV>/<TEST MOV>, ALTERNATE
SHOW MEAS
, and
are also
Page 61
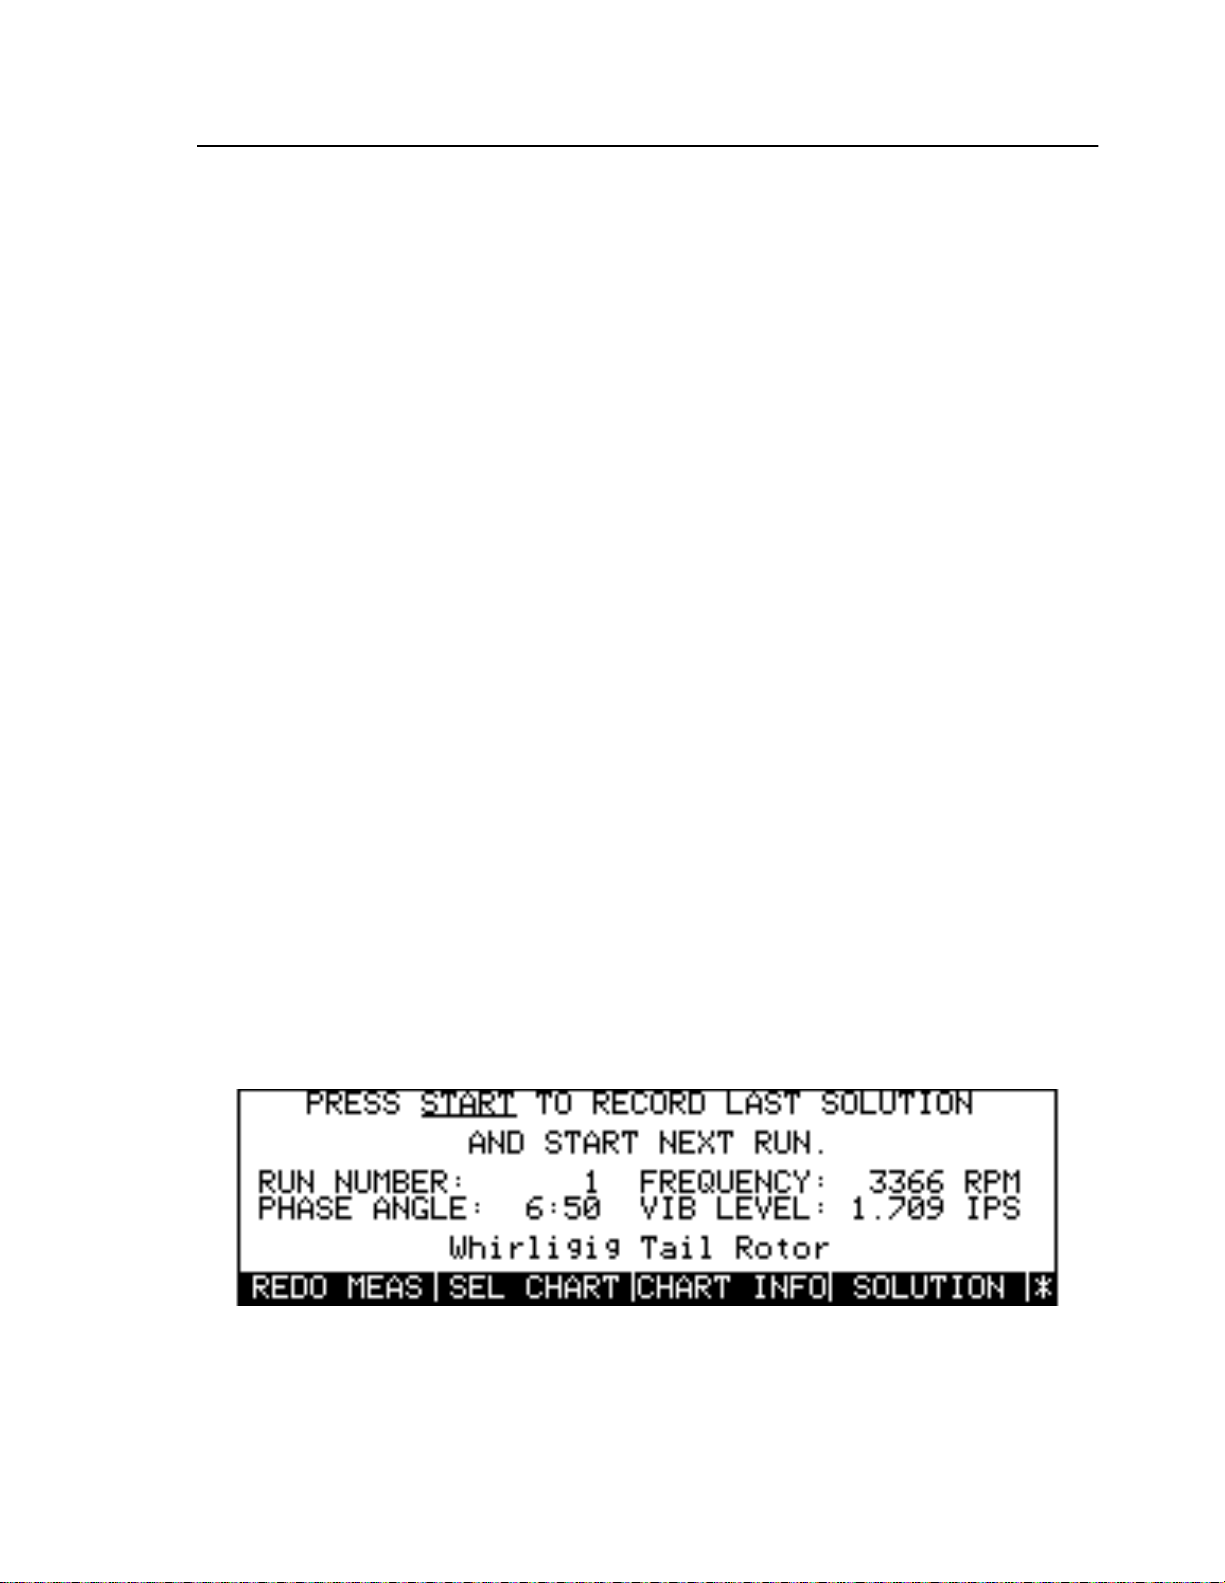
Solution Presentation
5.5.1 Initiating a Test Move (Chart Correction)
<NORM LMV>/<TEST MOV>
The
screen a n d the s i ngle-move ba la nce ch art correction s creen. If
move solution is presented. Toggling the key to
the 8500C/C+ se lect s only one corrective mo ve to be carried out before the next run. See S e cti on5.6.2
“Chart Correc t ions” on pa ge5-17 for a co mp le te description o f the chart correc tion procedure.
Once the test move is performed, the chart has been corrected for that particular aircraft. At any time
before the 8500C/C+ memory is cleared, this corrected ch art may be saved to disk for the next time
this aircraft is bala nc ed (instructio ns in Se ction5.6.2.2 “Storing C orrected Charts to Di sk” on
page 5-18). Before another aircraft is balanced, clear the 8500C/C+ memory of this corrected chart
CLR CHARTS
(
) and start fresh with an uncorrected chart.
soft key is used to toggle between the two-mov e balance solution
<TEST MOV>
<NORM LMV>
displays the correction screen, in which
is displayed, the two-
5.5.2 Altern ate Solut i ons
The first so l uti o n th a t is presen ted may not alw ay s be optimal , requiring larger adj u s t m ents to the
balance points than theoretically possible. You may, however, view alternate balance solutions by
using the Arrow k eys to position the block cu rsor over any of th e solution moves. Pr e ssing the
ALTERNATE
substituted for the selected text. Pick the optimal solution or the one that best suits your particular
situation. N ot e th a t some sol uti ons may pr o v e impractic al , such as req u i r ing t h e re mo va l of weights
where there are none to remove.
soft key causes one of several alternative, yet equivalent, balance instructions to be
5.5.3 Exiting the Solution S creen
When you are satisfied with the balance solution presentation and have carried out the required
corrective moves, press
balance data, including balance history, charts and c hartinformation, corrections, and so on, or repeat
the measurement before starting the next run, press
SHOW MEAS
Figur e5-12). To view the Solution screen again, press th
returns you t o the Balanc e R un St ar t -up screen.
At this po int , yo u m ay w i s h to repeat the bala nce measurement to verify that your actions were correct.
With the Balance Run Start-up screen displayed, press th
measure ment. Not e, h o we ver, that the curren t balance da t a is overwrit ten i n th e process.
displays a Balance Run Start-up screen, containing the latest balance measurements (see
START
to initiate the next balance run. If you woul d l ike to review the current
SHOWMEAS
SOLUTION
.
soft key.
SHOW MEAS
Figure 5-12. Balance Run Start-up Screen
RED OMEAS
soft key to initiate a new
always
Mode l8500C/8500 C+ Operators Manual
5-13
Page 62

Chapter 5
You may often find that additional balance runs are needed to fine-tune the results of a single balanc
measurement. Together, these runs may be viewed as a set of logically connected steps required to
reach a full balance solution. The 8500C/C+ supports the ability to store and analyze this set of balance
runs, calle d a
RED OMEAS
adds the result s t o pre v i o us ru n data al r e a dy st ored in the balanc e history. See S ection5.6.1 “Balance
Histories” below for a complete explanation of this feature.
- Balance Measurement and Solutions
balance histor
soft key.
. A ba la n ce his t or y i s crea ted by pressing
START
initiates a new balan ce measurement a nd gen er ates a new solution, then
START
instead of the
5.6 Additional Features
This section explains additional features associated with balance charts and the Balance mode. These
features are helpful in doing basic balance operations with the 8500C/C+. The following topics explain
these features:
• Secti on5.6.1 “Balance Histories” on pag e5-14
• Secti on5.6.2 “Chart Corrections” on pa ge5-17
• Secti on5.6.3 “Using Measurements Only” on pa ge5-19
• Secti on5.6.4 “Balancing Fixed-wing Aircraft” on page 5 -21
5.6.1 Balance Histories
Applying the c or r ective moves pres c r i b ed in the 8500C/C+' s S ol ution screen may no t always bring the
subjec t roto r system into f u ll ba lance. Adju st m ents to the system can affect other vibrational and
aerodyna mi c characteristics of the a ircraft, res u l t ing in sma l le r b ut p ro no unce d vi brat ion levels at the
balance frequency. In addition, individual rotor systems may exhibit vibrational characteristics that do
not agree precisely with the balance chart's predictions of system behavior (the result being slightly
inaccurate solutions). For these reasons, it may be necessary to execute several successive balance runs
before a satisfactory balance can be achieved. In the 8500C/C+, this iterative series of runs is called a
balance histor
and display all the moves and measurements required to reach full balance.
There is n o maximum li m it t o t h e number of balance runs t hat can be kept in a b al anc e history, and
there may be as few as on e . H i s to ry data are stored i n 8 500C/C+ s tatic memory. As a result , histories
are always available, even if power to the instrument is turned off. Each history is associated with the
balance chart that was in use when the history was created. Selecting that chart always invokes its
history (if one exists) and begins the balance from the last recorded run. Histories may be saved to
disk, but deletin g a chart from static memo ry also dele tes its history (s ee Se ction5.6.1.4 “Clearing
Histories”).
5.6.1.1 Initiating a Balance History
To begin a balance history, take a Strobex or magnetic pickup/Photocell measurem ent, as explained in
Secti on5.4 “Balance Measurement” on pa ge5-9, and implement the two-part balance solution (use
alternat e moves i f d esi red) . Pre ss the
(see Figur e 5 -12 on page 5 -13). This screen shows the current run number plus the phase angle,
balance acquisition frequency, and vibration level from the latest balance measurement, as well as
additional soft keys. The run number iden ti fi e s t he la te st bal a nce r un ta ken in th i s h is tory.
. Balance histori es are supported by severa l feat u re s th a t allow you to stor e, d ocument,
SHOW ME AS
soft key to displa y t he Balance Run Start -u p screen
5-14
Chadw i ck-Helmuth Company, Inc.
Page 63
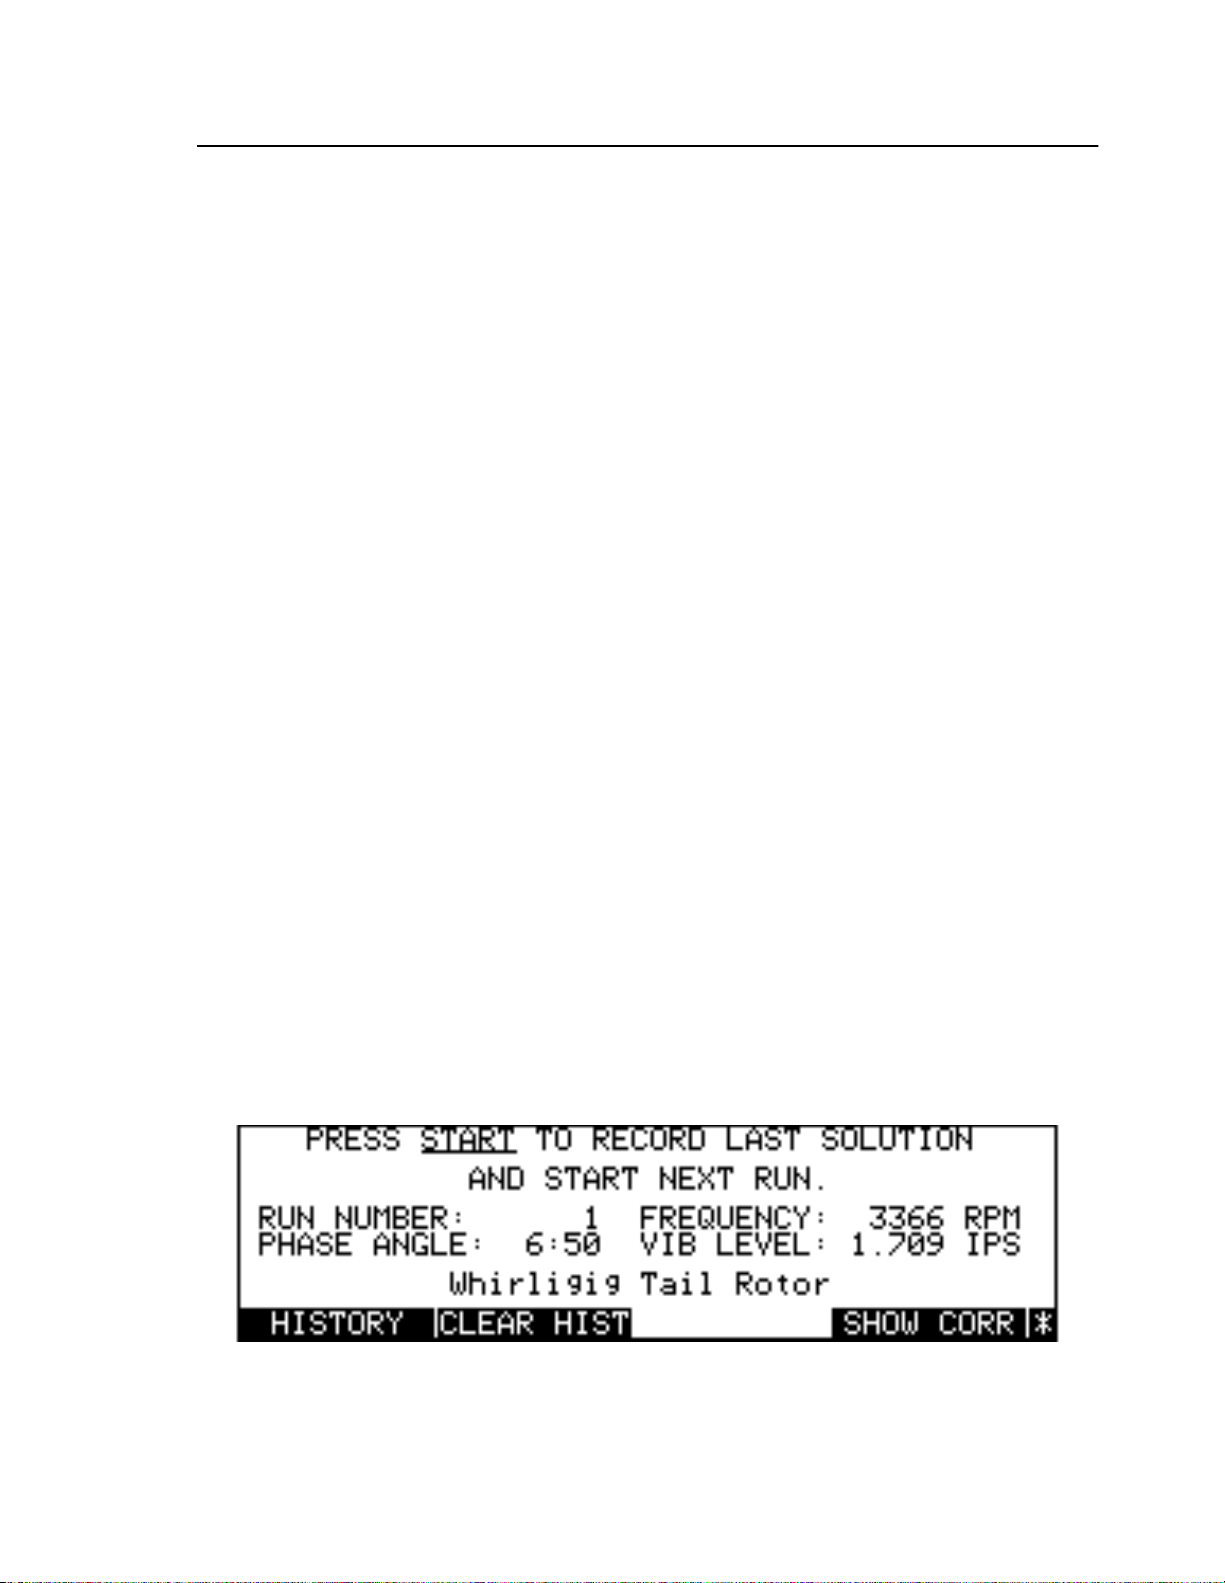
Additional Features
SOLUTION
The
balance charts, and
soft key redisplays the Solution screen.
CHAR TINFO
displays information about the current chart. See Se ction5.2.3
“Working With Balance Charts” on pa ge5-3 for a description o
“Displaying Chart Information” on page 5-6 for a description of
The
START
key initiates a new balance run in the current balance history.
SEL CHART
SEL CHART
CHAR TINFO
shows the list of available
and Sect ion5.2.3.6
.
START
first ensures that the
balance and solution data from the last run are preserved. The run number is then incremented and new
balance and solution data generated. These data are added to the balance history and are saved ther
unless the
REDO MEAS
soft key is used to overwrite them. Note that a balance history is an
iterativ
record, that is, each new run builds upon the results of previous runs. As a result, successive runs bring
you closer and closer to full balance. A successful hi story, however, depends upon the careful
implemen t at i on, after every run, of ea c h new ba lan c e solution.
Pressing the
RED OMEAS
increasing the run number or adding to the balance history.
soft key instead of
START
initiates a new balance me asurement without
RED OMEAS
simply causes the latest
balance an d sol u ti on data i n t he bala n c e hi s t or y to be ov e r w ri tte n with data from the new
measurement.
RED OMEAS
may be pressed instead of
START
at any point in the balance hist ory. It is
usually us e d to repeat a measu re m e nt or verify a solution impl em e ntation.
5.6.1.2 Displaying Histories
The balance history can be displayed and reviewed at the end of each balance run. The runs that
comprise the history are presented in chronological order, with the data for each run displayed on two
separate screens, one showing the vibration measurements from the run and another showing mov
line data and the effects of the balance solution. It is recommended that the balance history be regularly
examined throughout the balan ce pro ce s s . S te p p ing through t he c ol lect ed se t of history screens can
provide a clear, concise picture of how each run has contributed to the p rogress of the balance as
whole.
Viewing a balan ce his t or y require s the i m plemen tat ion of at least one balance s o l ution. As a result, a
minimum of
To display the b alance history, first press
additional sof t keys,
CLEA RHIST
“Clearing Histories” on pa ge5-17.
runs mu st be made before a balance h is to r y screen can be displa yed.
two
MORE KEYS
HISTORY, CLEAR HIST
, and
from the Balance Run Start-up screen; thre
SHOW CORR
, displa y (see Figur e5-13).
is used to clear a ba la n ce his t ory. This key i s described i n det a il in S ection5.6.1.4
SHOW CORR
is used to display and optionally clear chart
correctio n i nf ormation. T h is ke y i s de scribed in deta il in Sec tio n5.6.2.3 “Clearin g Chart C orrections”
on pa ge5-19.
Figure 5-13. Balance Run Start-up Screen, Additional Soft Keys
Mode l8500C/8500 C+ Operators Manual
5-15
Page 64
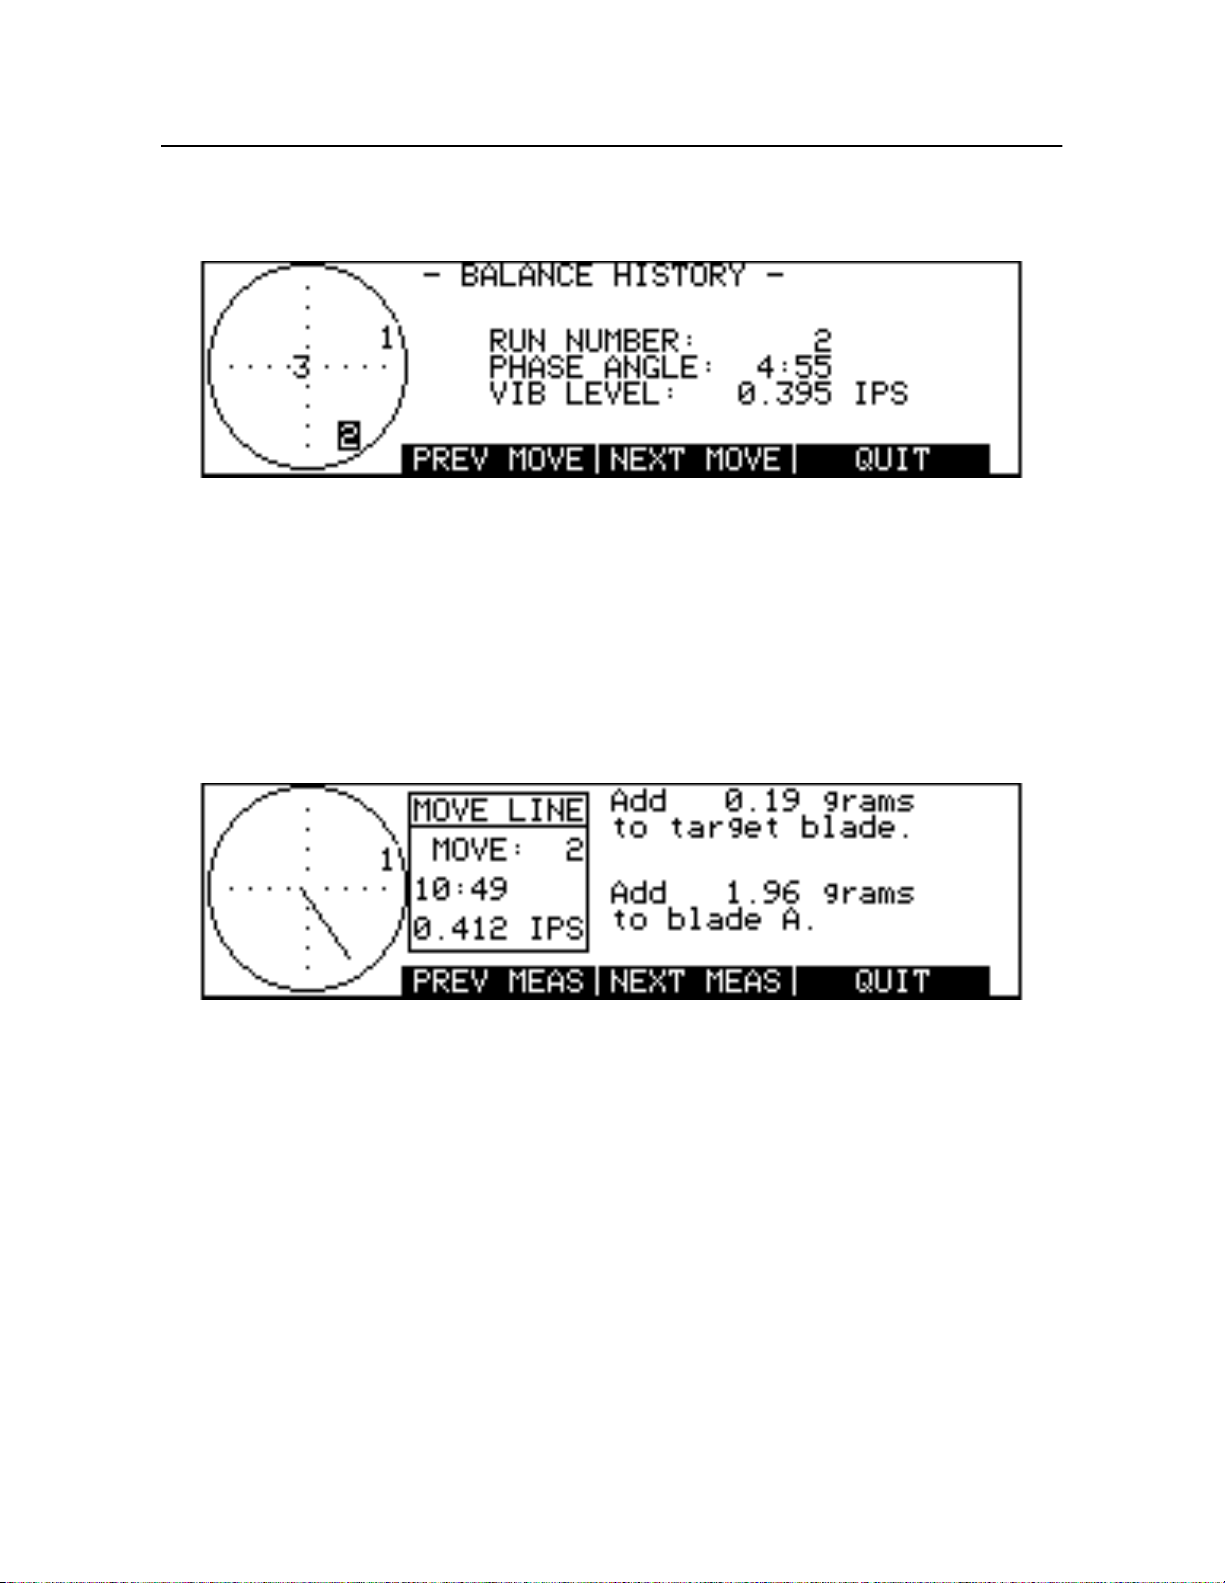
Chapter 5
The
- Balance Measurement and Solutions
HISTORY
soft key displays t he first screen of the first run of the current balance history. The phase
angle and vibr a t io n le ve l va lu es for the ru n a r e s how n on t h e rig ht side of the scre en (see Figure5-14).
Figure 5-14. Balance History Measurements Screen
The left sid e of the screen pl o ts all the runs in the h i s to ry on a graphic representat ion of a balance chart
clock face. The radius of the circle delimits a maximum vibration amplitude. Each run is identified by
number and plotted as a function of its phase angle (clock position) and vibration amplitude (distance
from the center of the circle). The run number whose measurements are being displayed is highlighted.
NEX TMOVE
The
soft key d i spla y s a new screen sho w i n g the balance solution for this r un and the
changes t ha t occurred afte r the corre ctive mo v es were im plemented (see Fi gure5-15). The move line
data shows the vector difference between consecutive runs, that is, the direction of the change and its
magnitu de ( inIPS). Th e move line vect or is dr aw n on the clock face at t h e left of the screen.
Figure 5-15. Balance History Move Line Screen
PRE VMOVE
The
soft key displays the Move Line screen for the previous balance run.
not available when viewing the Balance History screen for the first run.
NEX TMEAS
The
soft key di s pl ays t he measurements screen for the next ba lan ce run.
not available w he n viewing th e Move Line screen for the last balance run.
measurements screen for the previous balance run.
QUIT
When you ha ve finished ex amini ng t he b ala nce h istory, press
to return to the Balance Run
Start-up screen.
PREV MEAS
PRE VMOVE
NEXTMEAS
displays the
is
is
5.6.1.3 Storing Hi stories to Disk
A balance history may be saved as a file and stored to disk. First, make sure the
Status screen is set to
DISK
(see Sectio n9.2.6 “Output Storage Device” on page9-2). Otherwise, the
balance hist o ry i s sa ve d to memory only. With the Balance Run Start-up screen displ ay ed , inser t
formatted , w ri ta b le 3.5-i n. double-s id e d , doubl e -de n s i t y d i sk in the 8500 C / C+ d is k d rive and press
STORE
. The data is written to disk and given a unique file name based on the current date and time,
plus the extension *.BHI. Since this file also contains the current balance chart name, you may wish to
5-16
Chadw i ck-Helmuth Company, Inc.
Store To
field in the
Page 65

Additional Features
first ren ame the chart i n order to better identify t he history da ta (s ee S e c tion5.2.3.3 “Ren aming
Charts” on page 5-4). See Secti on10.2.2 “Storing Data to Disk or Memory” on pa ge10-4 for more
information on storing balance histories, as well as Appe nd ixC Balance History Files” for a
description of the balance history file format.
NOTE: It is best that 8500C/C+ distribution chart disks not be used to store balance
measurement and s o l ut io n d ata fi les . In st ead, use a backup copy of the chart disk and store
the origin a l chart d i s k i n a s a fe place. Instruction s for maki ng a backup d isk are located in
Secti on10.2.4 “Copying Balance Charts” on p age10-6.
5.6.1.4 Clearing Histories
Balance histories are stored in 8500C/C+ static memory. As a result, they are always available, even i
power to the instr ument is turned off. Only one balance h i st ory can be as so c i a te d with a particular
balance chart. Selecting that chart always invokes its history and begins the balance procedure from
the last run in the series. It may be c ome necessary, therefore, to discard historie s , either t o begin a new
History or to free up static memory for other balance data.
To clear a balance history, first select the balance chart whose history you wish to delete. Call up th
Balance Run Start-up screen and press
current chart (see Figur e 5 -13 on page 5 -15).
Since mu l tip l e balance ch arts can b e stored in static memory, it is a lso p ossible to store multipl
balance histories there as well. Histories can be deleted one at a time by selecting a chart and pressing
CLEAR HIST
the
Secti on5.2.3.5 Clearing Char t Memory” on pa ge5-5). Since a balanc e hi s t ory is a lw a ys as sociated
with a partic ular chart, rem o v i ng th at chart always re m o ve s the history.
soft key. They can also be deleted all at once by using the
MOREKEYS
. Press
CLEAR HIST
to clear the history for the
CLR CHARTS
soft key (see
NOTE: The
CLR CHART
soft key clear s a ll charts and all h istories from static memory.
5.6.2 Chart Corrections
As explained in Sectio n2.2.2 Balance Charts” on pa ge2-7, balance charts represent an experimental
averaging of vibrational characteristics for a particular type of rotor system. Actual rotors within the
group, ho wever, ofte n vary f r om i nd i vidu al to individual. Consequently, som e systems may exhibit
characteristics that deviate from the balance chart predictions for that rotor type. The 8500C/C+ has
the ability to detect these differences, and through the technique of chart correction, modify th
balance chart to more accurately reflect the state of the individual rotor system.
Chart c o rrection co mpares the expected beha vior of a vibrating rotor system, as predicted by its
balance char t, w ith i ts o bserved b eha vior , as mea sure d by the 8500C/C+. You can simplify this
comparison by making a single adjustment at a single test point then analyzing the differences between
the expected and observed behaviors. Using
for example, provides a (theoretical) solution for that particular blade, that is, balancing it so that no
more adjustments are required. Consequently, the next run produces a move line whose direction
(ph ase angl e) and magnitude ( vibration am p litude) acc o rd with the solution. For an uncorrected chart,
however, the move line values for direction and magnitude that are actually measured very likely differ
from the values that were predicted. The 8500C/C+ uses these differences to calculate correction
factors f o r phase angle and vibratio n amplit ude . T he corre c t ion is add ed to the bala nce chart and used
to adjus t al l fu rther me asurements of phase angl e and v ibr a tion amplitude.
of the adjustments that appear in the Solution screen,
one
Mode l8500C/8500 C+ Operators Manual
5-17
Page 66
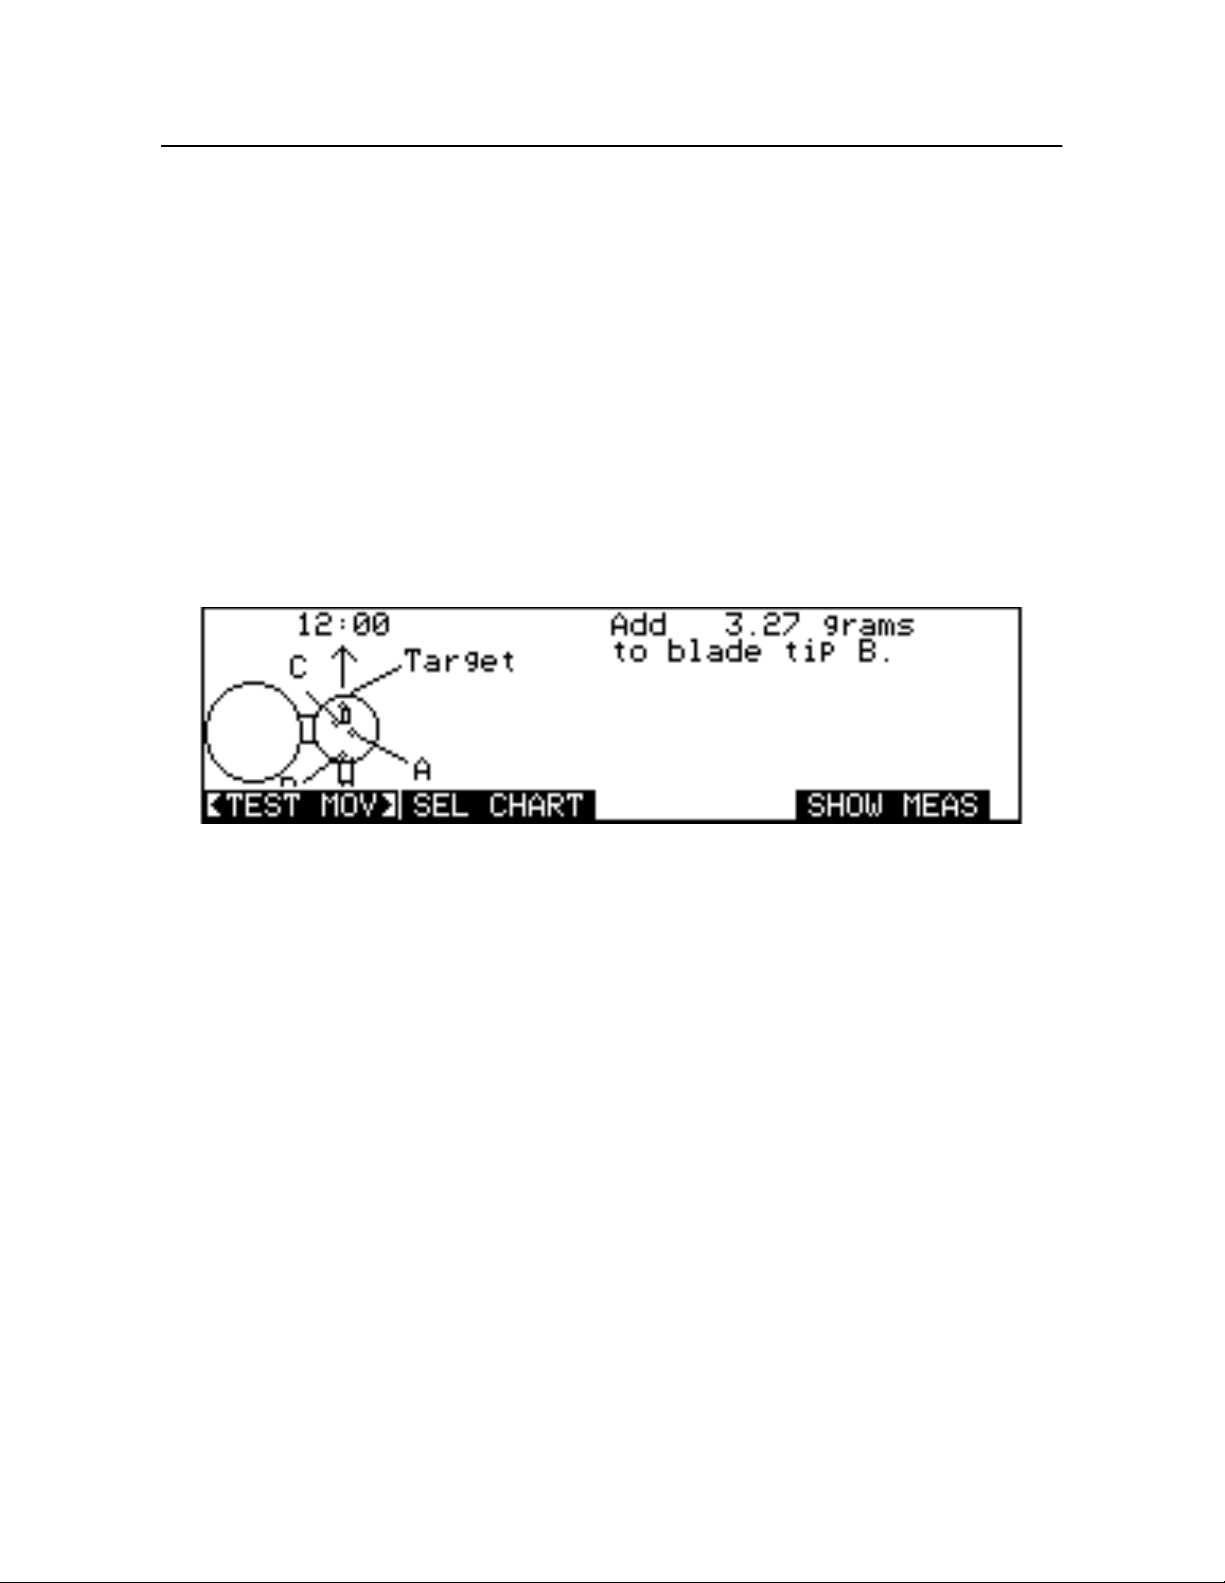
Chapter 5
- Balance Measurement and Solutions
5.6.2.1 Performing Chart Corrections
To correct a balance chart, take a Strobex or ma g ne t ic p i ck up/Photocell measur e me nt as explained in
Secti on5.4 “Balance Measurement” on pag e5-9. With the Solution screen displayed (see F igure5-11
on pa ge5-12), press the
<TEST MOV>
soft key.
the right of the screen and displays it in their place (Figure 5-16). The select e d mo v e is the move tha
produce s the long est mo ve line, regar dless of di rect ion . The predi cted move lin e is t hen compared
against the actual measured move line to determine the amount of correction required. If the prescribed
test move ca nn ot be impleme nted , for examp l e, remo vi n g weights whe r e th ere are no ne t o remove,
press the
(using the
<NORMA LMV>
ALTERNATE
soft key) that results in a practical test move (see Secti on5.5.2 Alternate
soft key to return to the Solution screen. Then, select an alternate move
Solutions ” on pa ge5-13). When you are satis fi ed with the test move pre sen tation, press
to retu rn t o t h e Balan ce Run St ar t- u p s cr een . Im plement th e te st move and b e g in the next run, as
describe d i n Secti on5.6.1 “Balance Hist or ie s ” on pa ge5-14. The n ex t run comp u tes corrections fo
phase angle and vibration amplitude and adds them to the balance chart. Afterward, all balance
measure men ts ma de with this chart is cor rect ed, a ccording t o the values stored there.
<TEST MOV>
selects one of the corrective moves at
SHOW ME AS
Figure 5-16. Correction Solution Screen
NOTE: Correc te d Char t s may be co rre ct ed as of t en a s required.
Balance histories are kept for chart correc t ion runs, just a s th ey are for full balance runs . You may wish
to displ a y t he bala nc e histo r y in order t o s e e ex a c t ly how the test move affecte d the move line.
After the chart correction has been calculated, more (corrected) balance runs may be taken if you
desire to bring the system to full balance. In this case, subsequent runs require the application of
both
corrective moves.
A correc ted ba lan ce chart sign if ic ant ly re duces the nu mber of runs required t o bala nce the rotor.
Moreover, you can achieve a greater reduction of the overall vibration level as well.
For these reasons ,
it is best t hat the cha r t for a new or overhauled a irc r aft first be corrected and that the corrected chart
be used thereafter to balance that particular aircraft.
5.6.2.2 Storing Cor rected Charts to Disk
Once a bal an ce chart has been c orrected, it may be sto r e d to di sk for fu t ur e use. Firs t, ma ke s ure the
Store To
field in the Status screen is set to
page 9-2). Otherwise, the co rrected c har t is saved to memory. From the Balance Run Sta r t-up screen,
SEL C HA RT
press
in use) is hi ghligh t ed. Press the
to display the list of available balance charts. The corrected chart (the one currently
STORE
Charts to Disk” on page 5-5” and be sure to rename the chart before writing it to disk. Include th
aircraft number in the chart name. This action provides the chart with a unique name and helps you to
better identify it.
DISK
(see Secti on9.2.6 “Output Storage Device” on
key and follow the p roce dures in Section 5 .2.3.4 “Storing
5-18
Chadw i ck-Helmuth Company, Inc.
Page 67
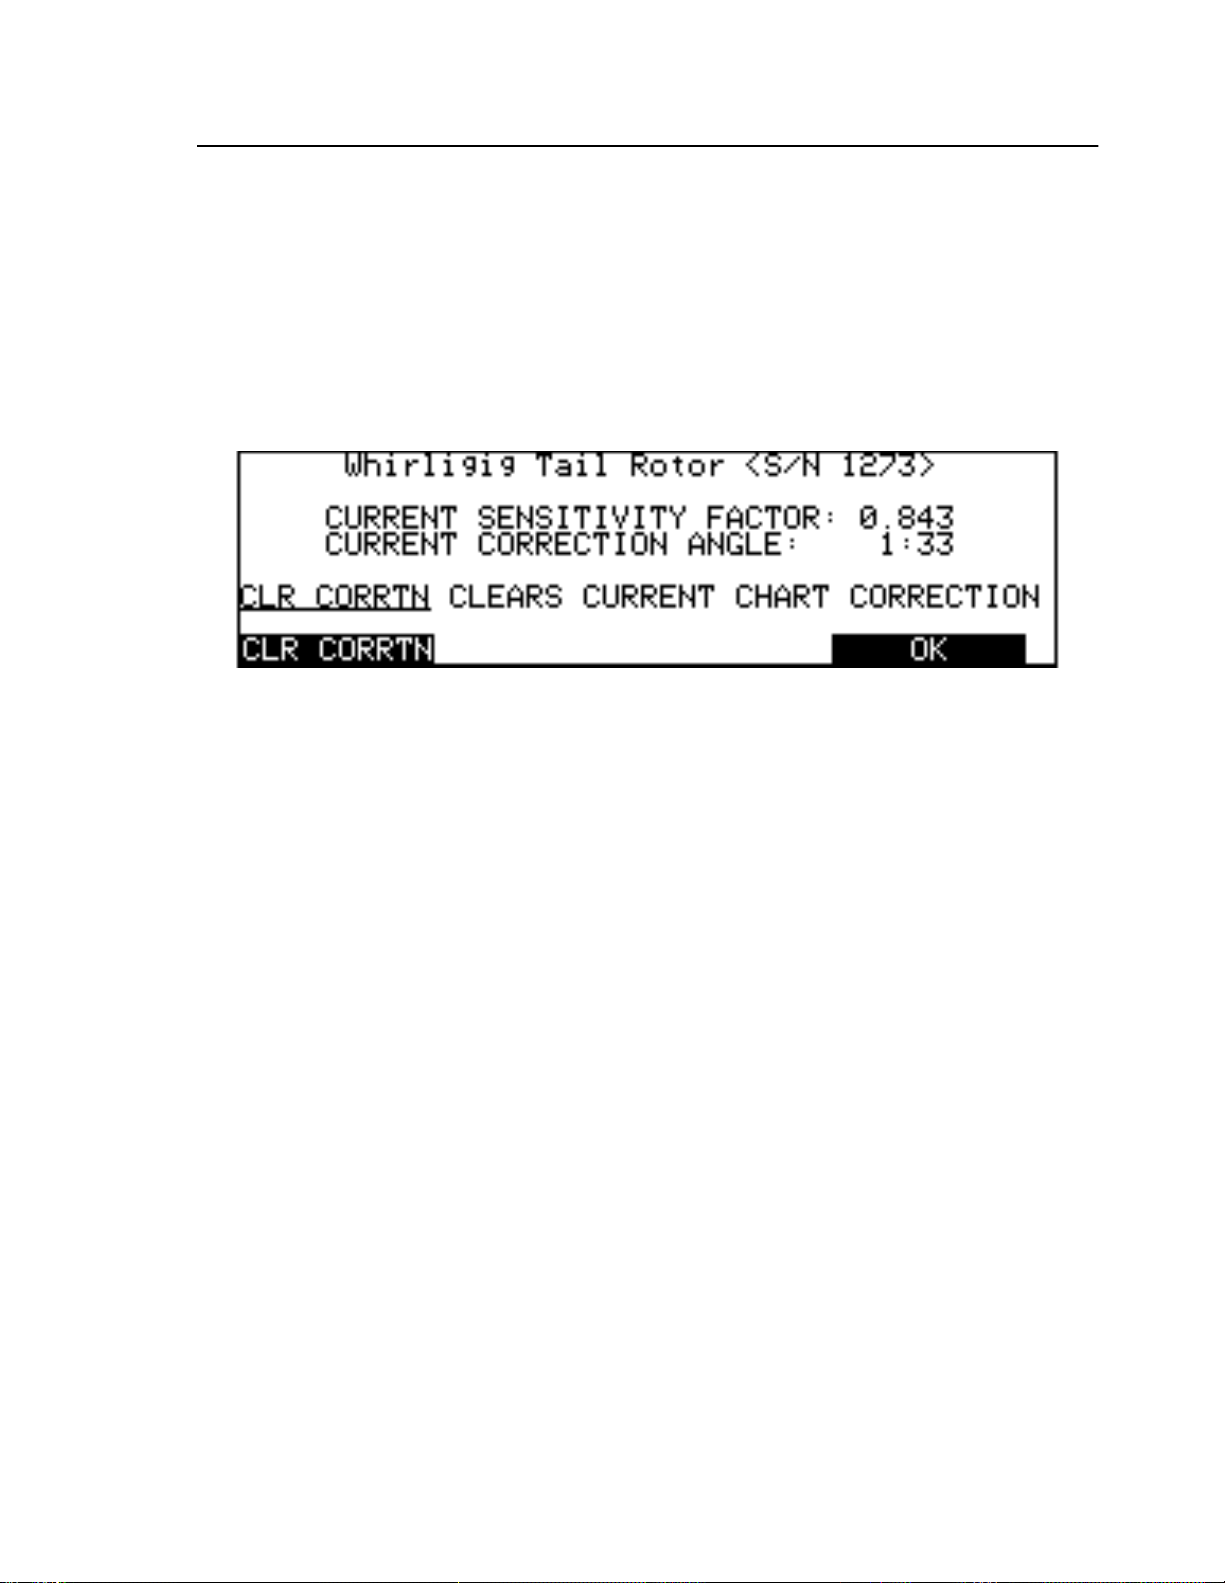
Additional Features
5.6.2.3 Clearing Chart Corrections
Pressing
factors for the current chart (see Fi gure5-17 on page5-19). The sensitivity factor corrects for vibration
amplitude. It is multiplied by the measured or raw vibration amplitude to obtain the corrected
amplitude. The correction angle corrects for phase angle. It is added to the measured phase angle to
obtain t he corrected ph a se angle. A cl ea r ed o r uncorrect ed ch art has a s ensitiv i ty factor of1 and a
correctio n angle of 12:00, which effectively l eav es the raw me asure me nts unchanged.
clears th e correction.
no longer valid. You can then perf or m a new chart correction to bring t he c hart up to date.
MORE KE YS
SHOW CORR
and
CLR CORRTN
from the Balance Run Start-up scr e en d is p l a ys the correction
is a good method for clearing a chart whose status is unknown or
Figure 5-17. Balance Chart Correction Screen
CLR CORRT
CANCEL
Press
to quit the Co rre ction sc r e en w ithout cle ar ing the correction.
5.6.3 Using Measurements Only
The Measurements Only chart allows you to see only the balance measurements of vibration amplitud
and phase angle. No balance solutions are ever presented. However, you can easily determine solutions
by hand w ith the Measu rements Only chart a n d t h e app ro pr iate paper balance cha rt f r om ChadwickHelmut h. In addition, the Meas ure ments Only chart ca n be used to collect data for creating new paper
balance charts for individual systems.
5.6.3.1 Balance Solutions
With the 8500C/C+ i n Balance m o de , se lect the Measurements O nly chart an d beg in a Strobex,
magnetic pic k up, o r Phot oc el l b a lance operation. If you choo se to perform a Strobex balance, an
additional sof t key,
Toggling the
either clockwise or counter-clockwise. Be sure to select the appropriate direction before starting the
balance (see Figu re5-18 on page5-20). When you press the
<TURNS
<TURNS
[clockwise arrow]>, appear s o n the Balance Mode Start-up scr een.
[counterclockwi searrow]> soft key indicates the direction of the spinning rotor,
key, the 8500C/C+ displays th
STOP
Mode l8500C/8500 C+ Operators Manual
5-19
Page 68
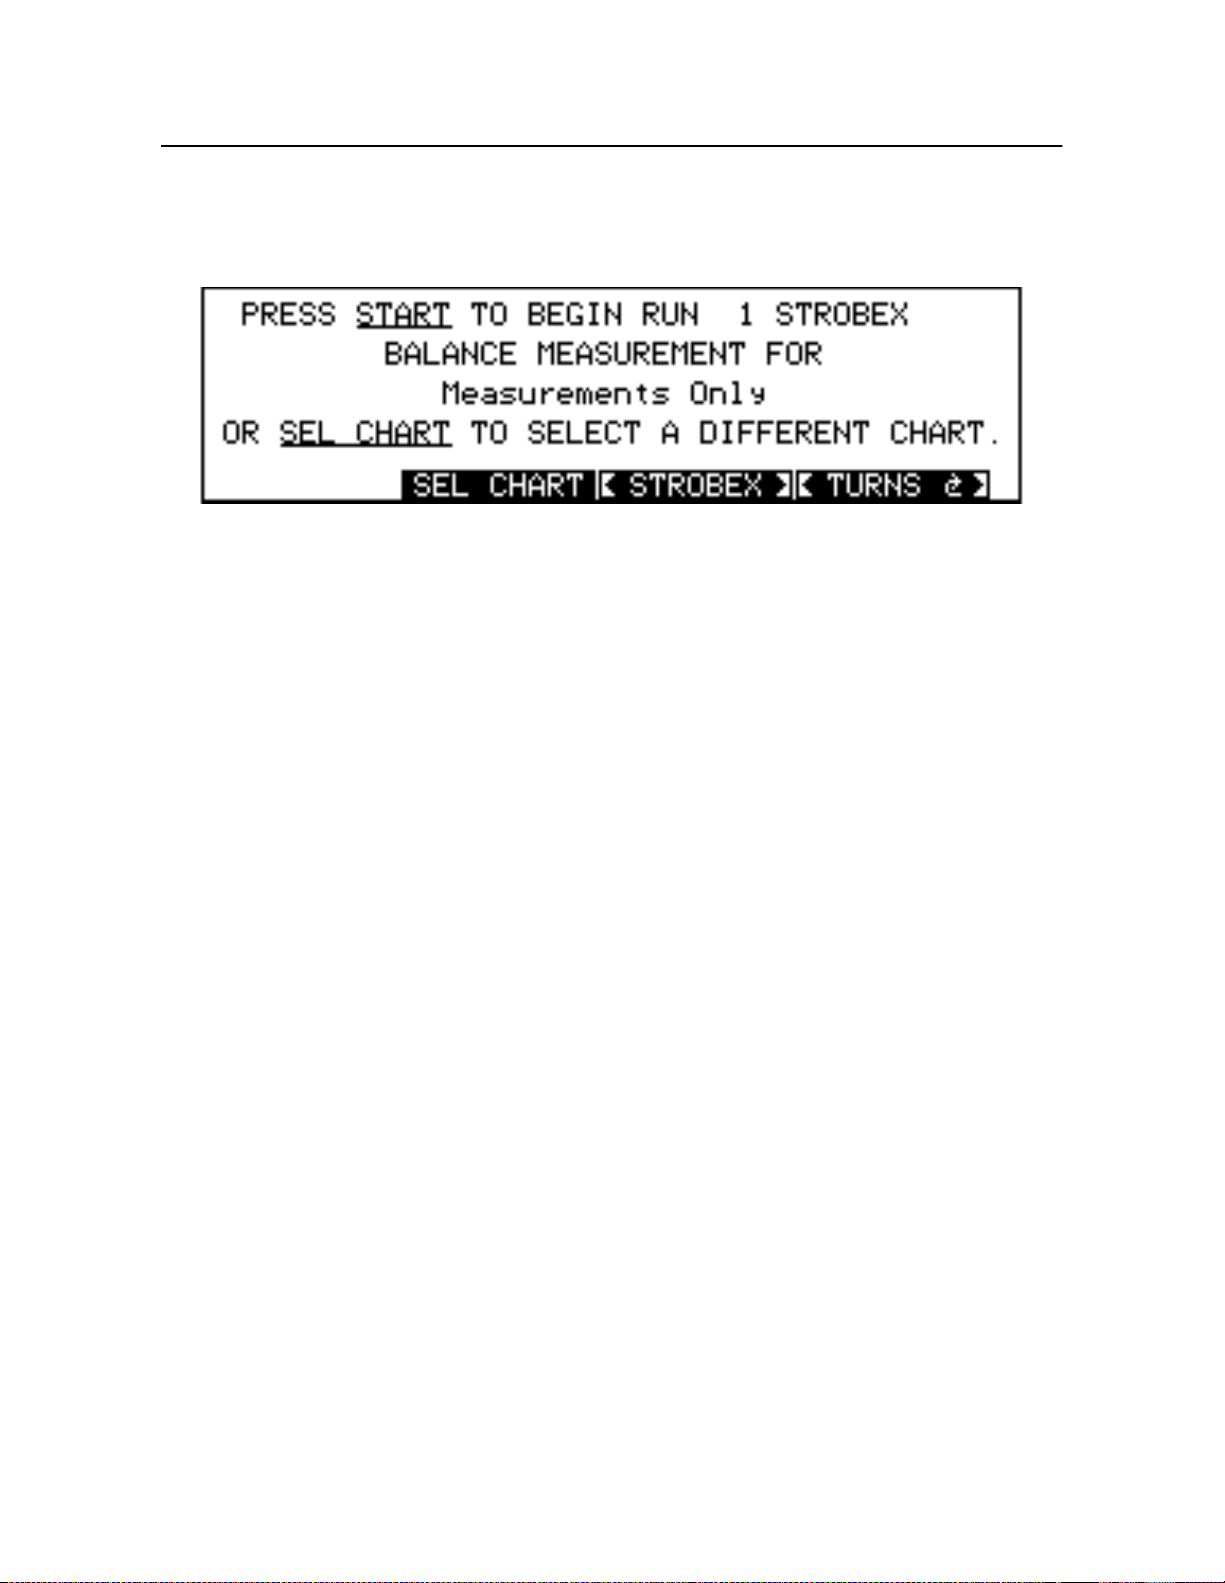
Chapter 5
balance frequency, the vibration amplitude, and the clock angle. Plot the amplitude and clock angle on
the appropriat e pape r char t f r om C ha d wic k- Helmuth a nd f ol low a ny instruct i o n s given there for
determin i n g t he correct sol u tion.
- Balance Measurement and Solutions
Figure 5-18. Measurements Only/Strobex Balance Start-up Screen
5.6.3.2 Paper Chart Creation
To create a new balan ce chart, use the Measurements Onl y cha rt t o plot the vib ration amplitude and
clock angle of the system on the clock face of a Universal Balance Chart Worksheet. Repeat th
measure ment with a prec i se amount of w eight adde d to one o f the system's balanc e points. As you
move the we i ght aro und to each o f the balance points and repe at the procedure using different weight
amounts, you can extrapolate the orientation and calibratio n of the superimposed graph. The geometry
of the graph has a lre ad y b ee n determined by the num be r of blad e s and the rela t ive po s ition of the
balance points.
5.6.3.3 Paper Chart Correction
The accura c y of a new c ha r t i s biased b y any inh erent out -o f- balance conditions that might have
existed before the chart was created. The technique of chart correction removes these biases, as well as
those that may be othe r w is e due t o the u n iq ue physical charac te r istics of the aircra ft. Se e Section5.6.2
“Chart Correct ions” on pa ge5-17 for more detail s on cha rt corrections.
Chart c o rrections compare the actual effe ct s of weigh t on vibr ati on amplitu d e and clock angle against
the changes predicted by the chart. We can quantify the comparison by means of a move line
calculat ion . T he diff er en ce b et w ee n the observed dir ection and the expected di re ction indicates the
amount of ph a se angle correc tio n th at must be app li e d t o s ub se q uent measur eme n t s . This action is
usually a cc om p l is h ed by rotatin g th e c lo ck face or wr i ti ng new clo c k nu mbe rs around the chart.
The magnitude (length) of the move line signifies a particular vibration level or amplitude. The length
of the move line i s directly rel at e d to the size of the w eigh t a dj us t men t , and th e ratio of the observed
magnitu d e to th e ex pe cted ma gni t u de in d i ca tes the perc en t age weight corre ctio n that mu st be applied
to subsequent measurements. For example, if the move line is too long, too much weight has been
added, b ut i f it is too sh ort, not eno u gh weight has been used.
For more information about paper charts, the Chadwick-Helmuth publication “The Polar Coordinat
Chart: Ba la nce Chart Ma k i n g i n the R eal World” contains an o v e rv i ew of balancin g with pape r charts.
5-20
Chadw i ck-Helmuth Company, Inc.
Page 69
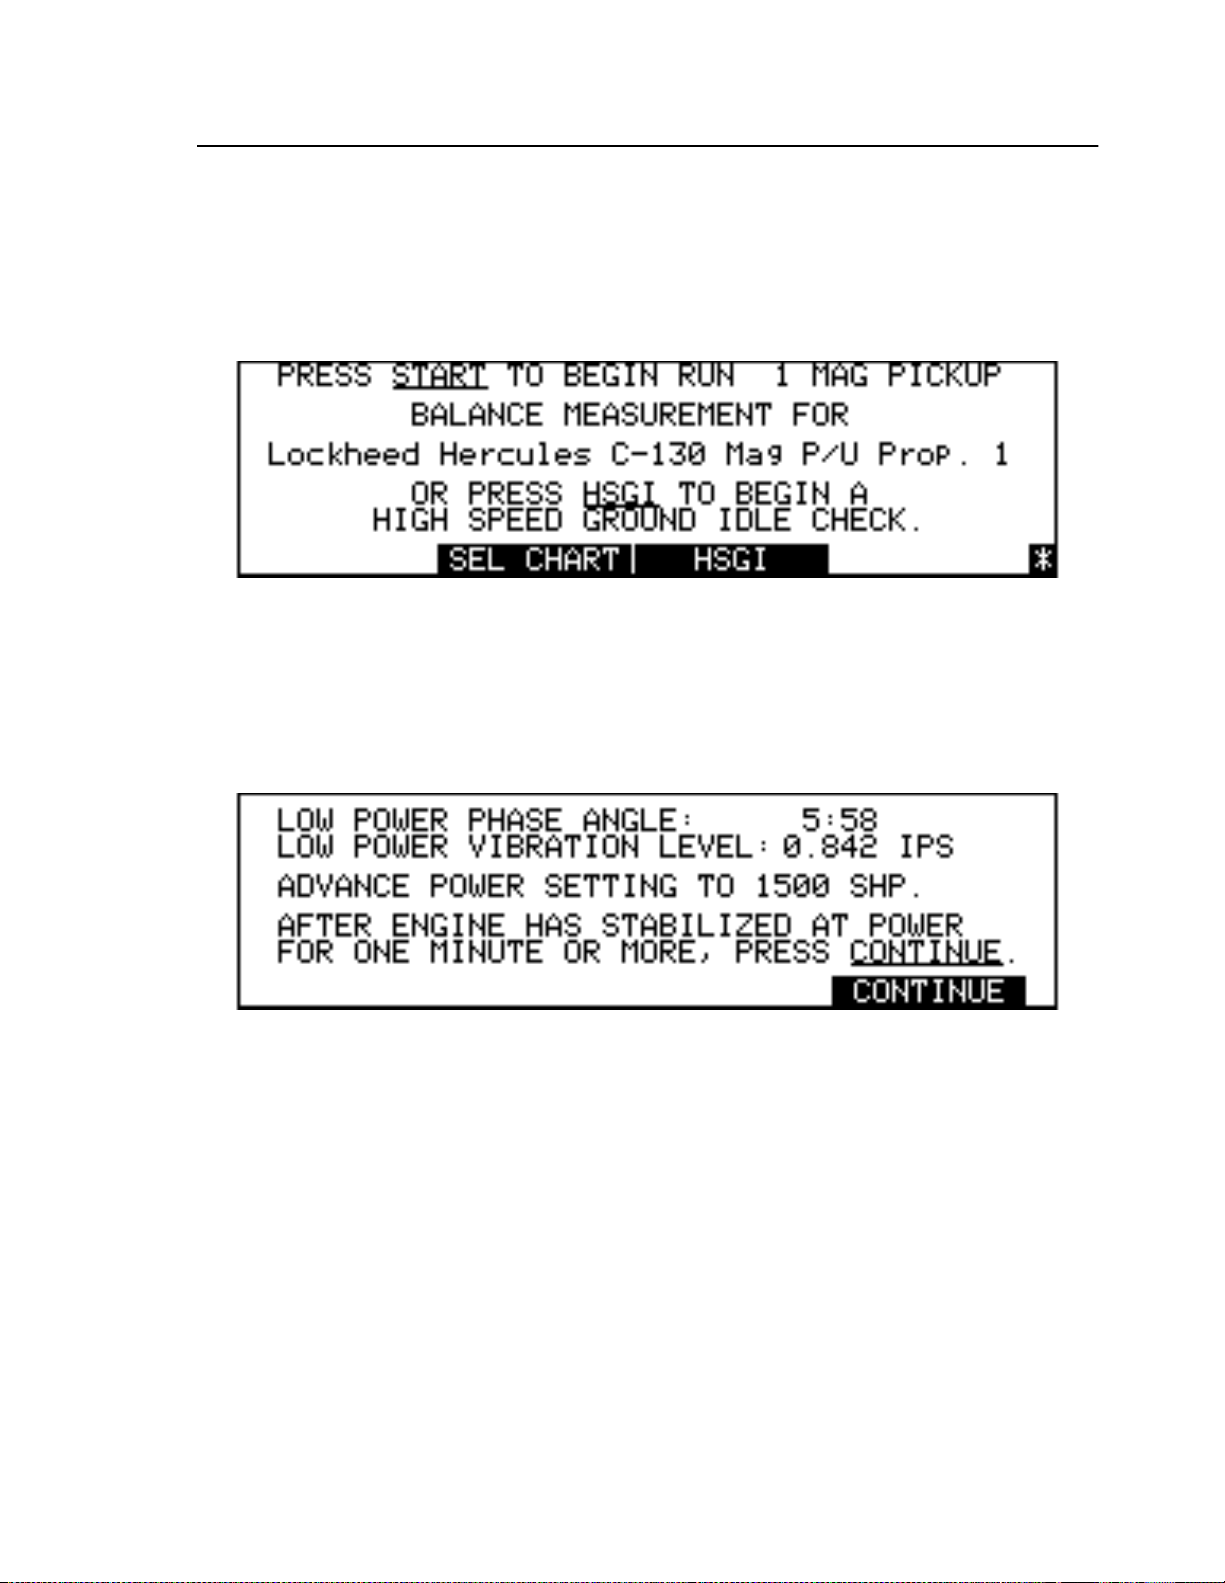
5.6.4 Balancing Fixed-wing Aircraft
Additional Features
If a fixed-wing aircraft chart has been selected, the
CHAR TINFO
soft key is replaced with the
HSGI
(high-spe ed groun d idl e) soft ke y ( se e Fi gure5-19). The balance type may still be chan ged through the
Balance Setup screen (th
SETUP
key). Two additio nal soft keys,
SHOW CORR
CHAR TINFO
and
, are
available on the second and third row of soft keys, respectively.
Figure 5-19. HSGI Start-up Screen
HSGI
The
wing propeller systems. Pressing
low power and on e w hi l e it is at high power. After the first run the 8500C/C+ disp l ays the current
HSGI measurements. After this run, advance the engine to the next power setting (see Figure5-20).
Press
soft key i s used pr i or to b al an c i n g in o r d er to prov id e some p rel im in a r y ana lysis for fixed-
HSGI
initiates tw o bal ance runs, o ne wh i le the engine is running at
CONTINUE
to begin t he se cond balance run.
Figure 5-20. HSGI First Run Measurements
After the HSG I bal an ce runs have been analyze d, a move line calcula t ion is presented instead of a
balance solu t ion ( see F ig ure5-2 1 on page5- 22 ). T he di re c t io n and mag n itu de (length) of the move
line indicates whether the system's vibration characteristics can submit to a full balance, or are due to
more significant har dware problems and not correctabl e through further balanci ng. If the move line
Mode l8500C/8500 C+ Operators Manual
5-21
Page 70
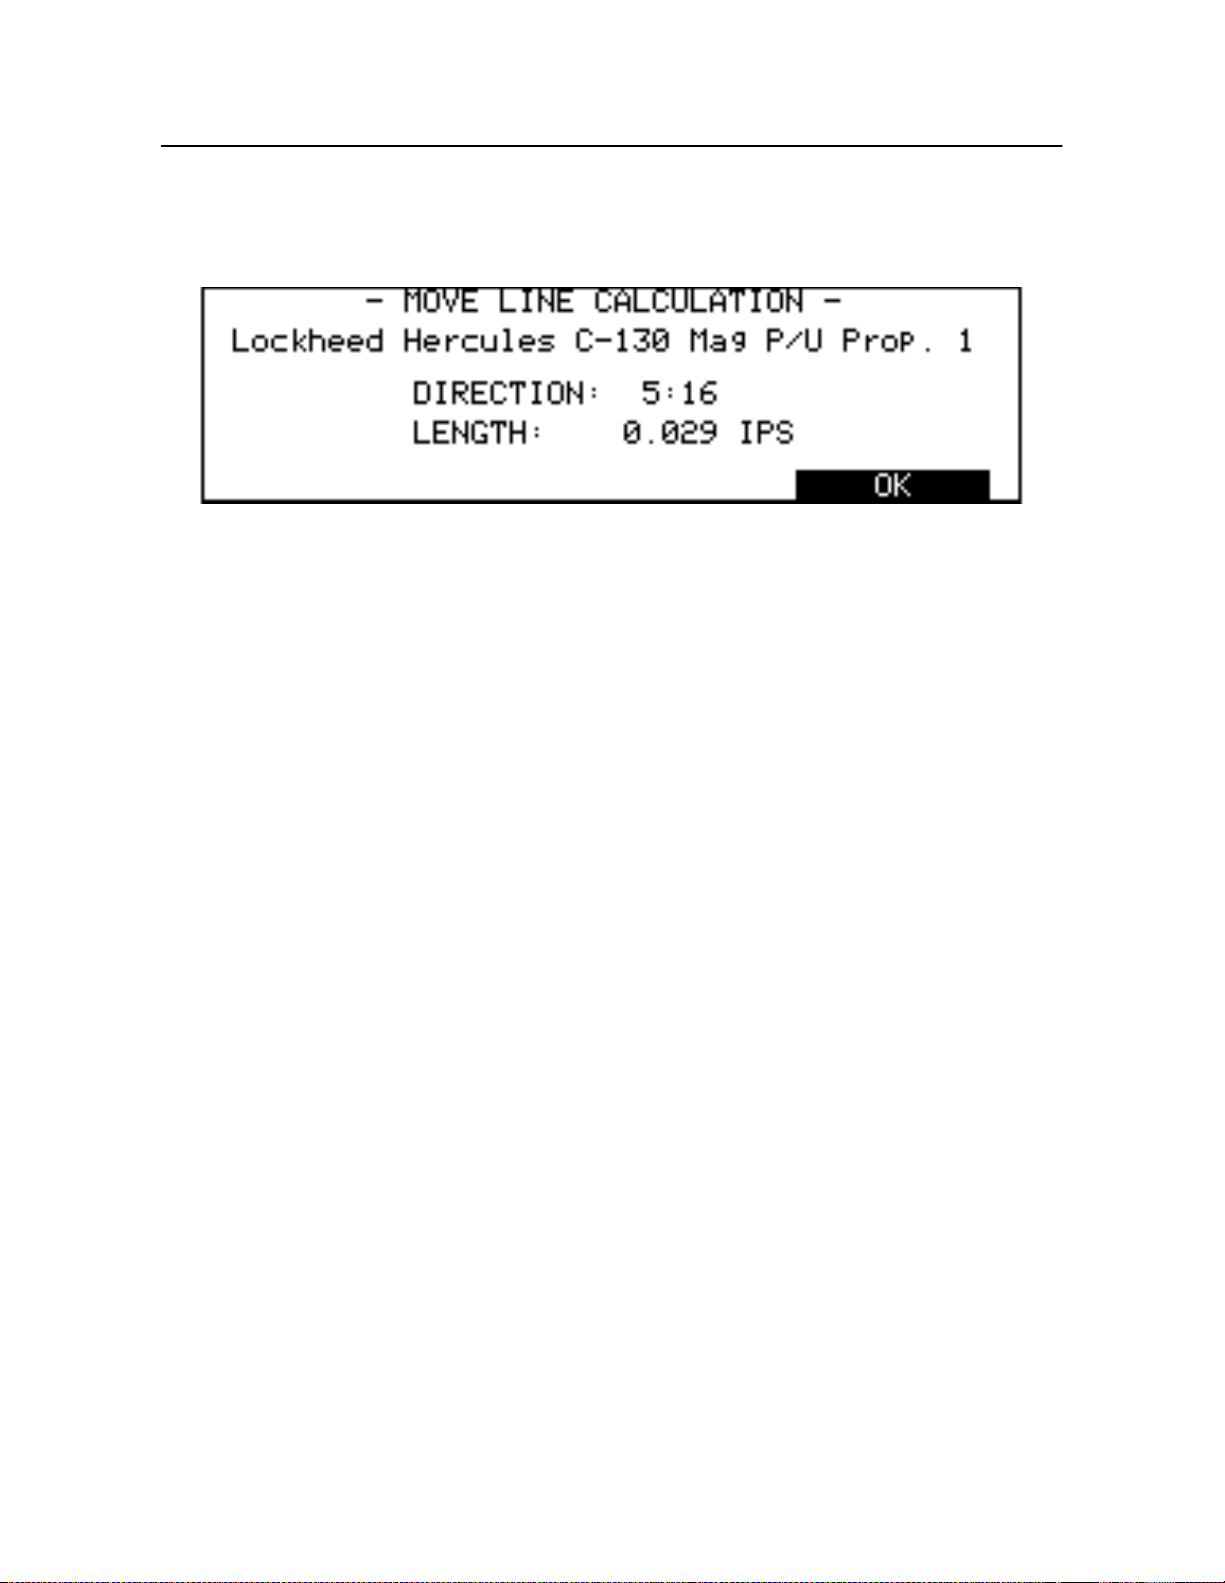
Chapter 5
- Balance Measurement and Solutions
length i s be l o w 0 . 4IPS, a full balance can be justified , an d the 85 00C/C+ pr esen ts the move line
calculat ion . For values greater than 0. 4IPS, the 8500C /C + presents a different s cre en, indicatin g that a
full balance is not warr a nt ed . Press OK to display the Balance Run Start-up screen.
Figure 5-21. HSGI Move Line Calculation
If the move line length is below 0 .4IPS, proceed with the balance according to the directions for th
and
HSGI
particular aircraf t and balance type . Note tha t t he Balan ce Run Start-up scree n su bstitute s the
soft key for
MOVE LINE
CHART INFO
MOVE LINE
. Use
and provides a third row of soft keys containing
to view th e move line ca l cu lation.
CHART INFO
Balance histories are recorded for fixed-wing aircraft just as they are for other rotor systems. Note that
the second (high-power) HSGI balance run is saved as the first balance run in the aircraft's balanc
history.
5-22
Chadw i ck-Helmuth Company, Inc.
Page 71
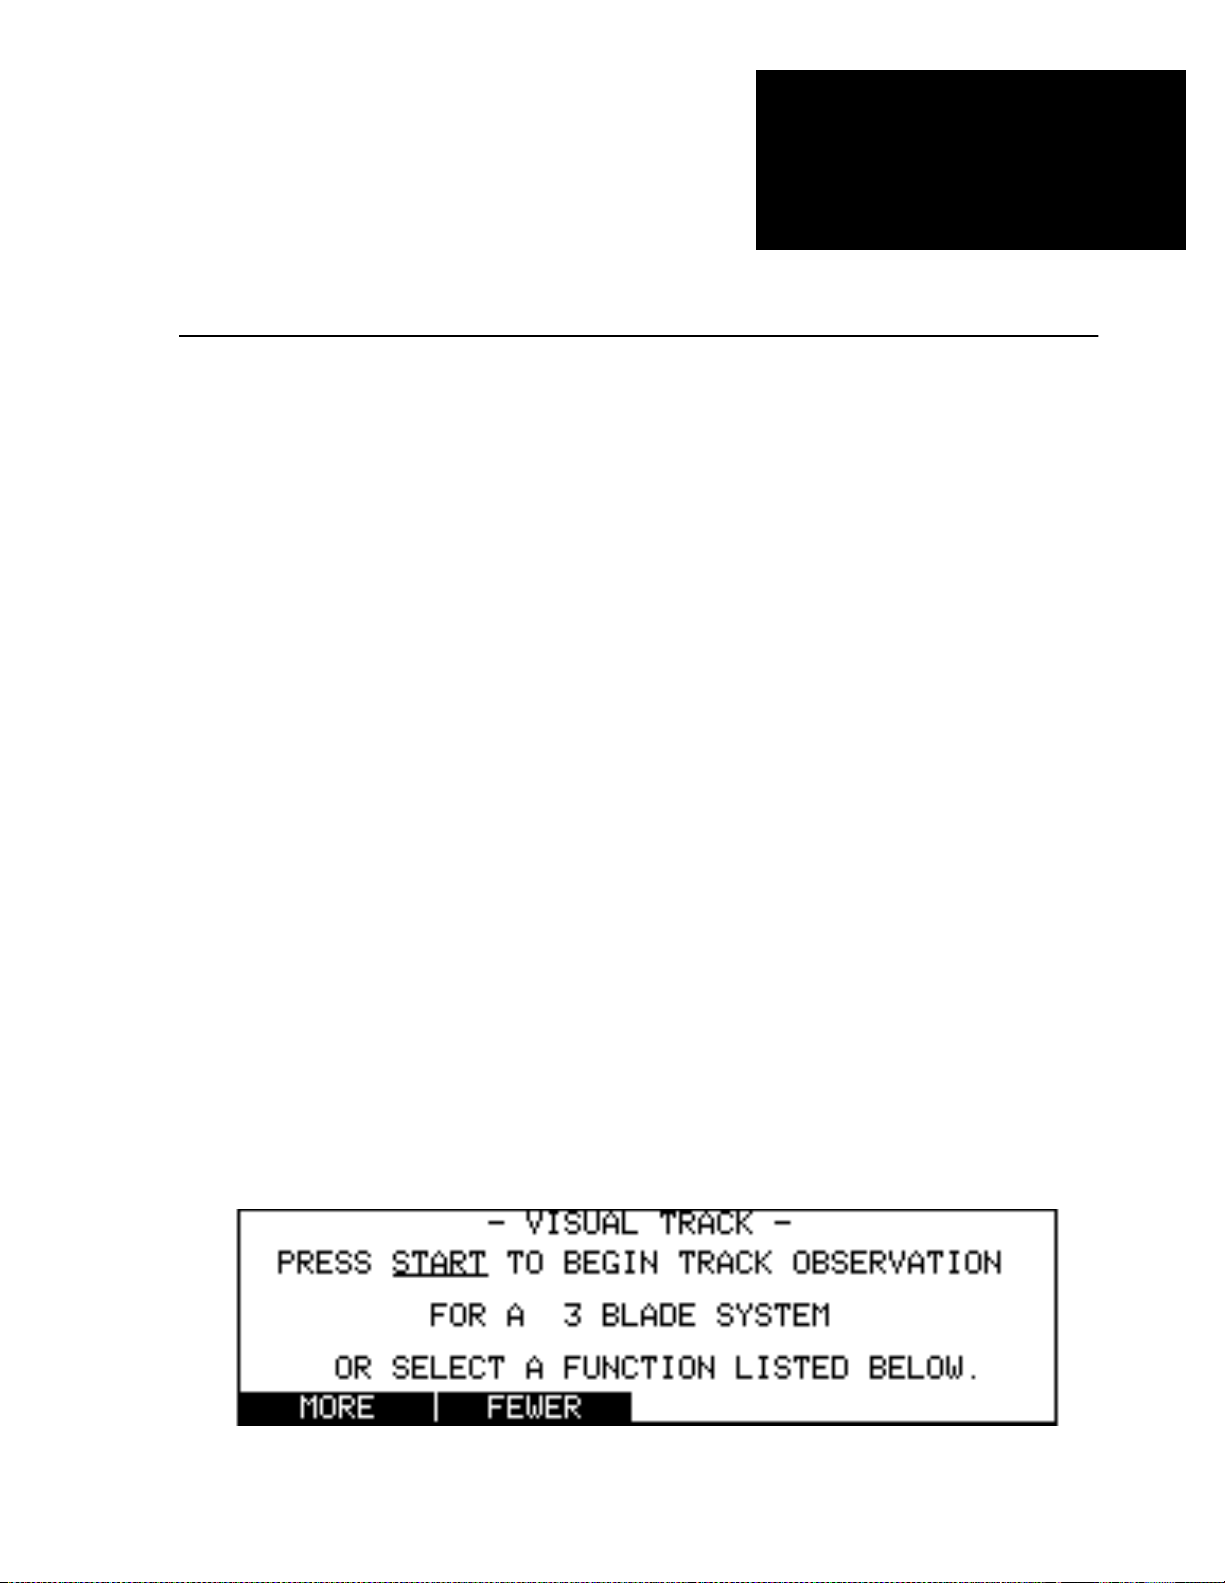
Chapter 6
Blade Track Observation
6.
You can use th e Mod e l 8500C/C+ Balancer/ A n al y zer to correct b o t h la teral ma ss and vertical track
imbalances, as described in earlier chapters. Chap ter6 explains vertical imbalances in more detail and
describes how the 8500C/C+ can be used to correct them using an alternative method,
under the following topics:
Section 6.1 Blade Track: Introduction ................. .. .... .. .... .. .... .. .... .. .... .... .. .... .. .... .. .... .. ..........6-1
Section 6.2 Vertical B alan c ing.. .... .. .... .. .. .... .. .... .. .... .. .... .. .... .. .... .. .... .. .... .. .... .. .... .. .... .. ...........6-2
Section 6.3 Visual Track Parame ter S etup .................... .... .. .... .. .... .. .... .. .... .. .... .. .... .. .... .........6-2
Section 6.4 Performing a Visual Track..... .... .. .... .. .... .. .... .. .... .. .... .. .... .. .... .. .... .. .... .. .... .. ..........6-4
6.1 Blade Track: Introduction
visual tracking
,
A rotor system's
blade that is out of track may follow a slightly different path because its alignment in the plane of
rotation is skewed. The result is a one-per-revolution vibration whose direction is perpendicular to the
plane of rota tio n. We ca n analyze t h is c ondit ion eith er b y me a s u ring the amp lit ud e and frequency of
vibration or by visually characterizing the track to determine the extent of the imbalance. The former
technique is called
used to co rrect a lateral mass imba la nc e . Th e latter techn iq u e is called a visual or optical t rac k and uses
the Mode l135M-12 Strobex Tracker to illuminate the relative position of the blades as they rotate. In
essence, the goal in both cases is to match the aerodynamic qualities of each blade in the system.
WARNIN G: Due to the comple x in te r ac t io n between vertica l a n d la t er a l v ibr at ions, it is
essential that an aircraft's track be adjusted and verified before a lateral balance is
attempted (see Chapt er5 “Balance Measurement and Solutions”).
describes th e geometry o f the circular path ma de b y th e bl ades as they rotat e. A
track
vertical balance
and employs principa ls and procedu res nearl y identical to those
Selecting the Track Mode
A visual track may be started by putting the 8500C/C+ into its Track mode of operation. This is done
by pressing the
TRACK
key (see Figure 6-1).
Figure 6-1. Track Startup Screen
Mode l8500C/8500 C+ Operators Manual
6-1
Page 72

Chapter 6
- Blade Track Observation
NOTE: If the 8500C/C+ is currently performing other time-critical functions, it may be
necessary to press
STOP
to terminate the function before Track mode can be entered.
6.2 Vertica l Balancing
A vertical ba la nce attempts to analyze the vertical (t hat is, per pendi c ular to the plan e of rotation)
vibration amplitude caused by an out-of-track ro tor blade. Essentially, the only difference between
these vibrat ion si gn a ls and those gener ated by a lateral mas s imbala nc e are th e ir o r i e n tation to the
plane of rotation. Analysis of the problem otherwise involves very similar principles. The technique
used to sol ve a vertical imba lance is therefore nearly ident i c a l to the technique of solving a l ate ral mass
imbalance (see Secti on5.4 Balance Measurement” on page 5 -9). The only differences to note are
• Orienta tio n of th e Mo del7 31 0 Vel ocimeter. Its cylindric a l axis must be a lign ed in the direction of
the out-of-track vibration
• Type of balance chart selected
Chadwi ck -H elmuth s u p pli es charts for vertical or track ba lancing of many he li c opter rotor systems.
Otherwise, you must closely adhere to the procedure for deriving balance solutions, as explained in
Chapter 5 “Balance Measurement and Solutions” in this manual.
In general, the refined electronic measurements taken during a vertical balance provide a mor
sophisticated balance solution than visual tracking. However, in those situations where a vertical
balance has been performed, visual tracking can be used to independently verify the balance solution.
Moreover , performing a visual track
track c ha racteristics of each bl ade. This in formation can then b e use d du ri ng ve r ti ca l bala nce to help
select t he best alterna te bala nc e sol ution.
a vert ica l bal ance provi des importa nt informati on about the
before
6.3 Visual Track Parameter Setup
The 8500C/C+ supports the modification of several important parameters used to control data
acquisiti o n and d i sp la y du r in g a visua l t ra ck. On e of these parameters, the number of blades to track, is
automat ic al ly se t w he n a bala nc e c hart is se le ct ed from balanc e mode.
All pertinent Track mode parameters can be modified by using the soft keys at the bottom of the Track
Start-up screen (see Fig ure6-1 on page6-1).
blades to track, respectively (see Secti on6.3.1 “Number of Blades” on pag e6-3).
MORE
and
FEWER
increase and decrease the number of
6-2
Chadw i ck-Helmuth Company, Inc.
Page 73
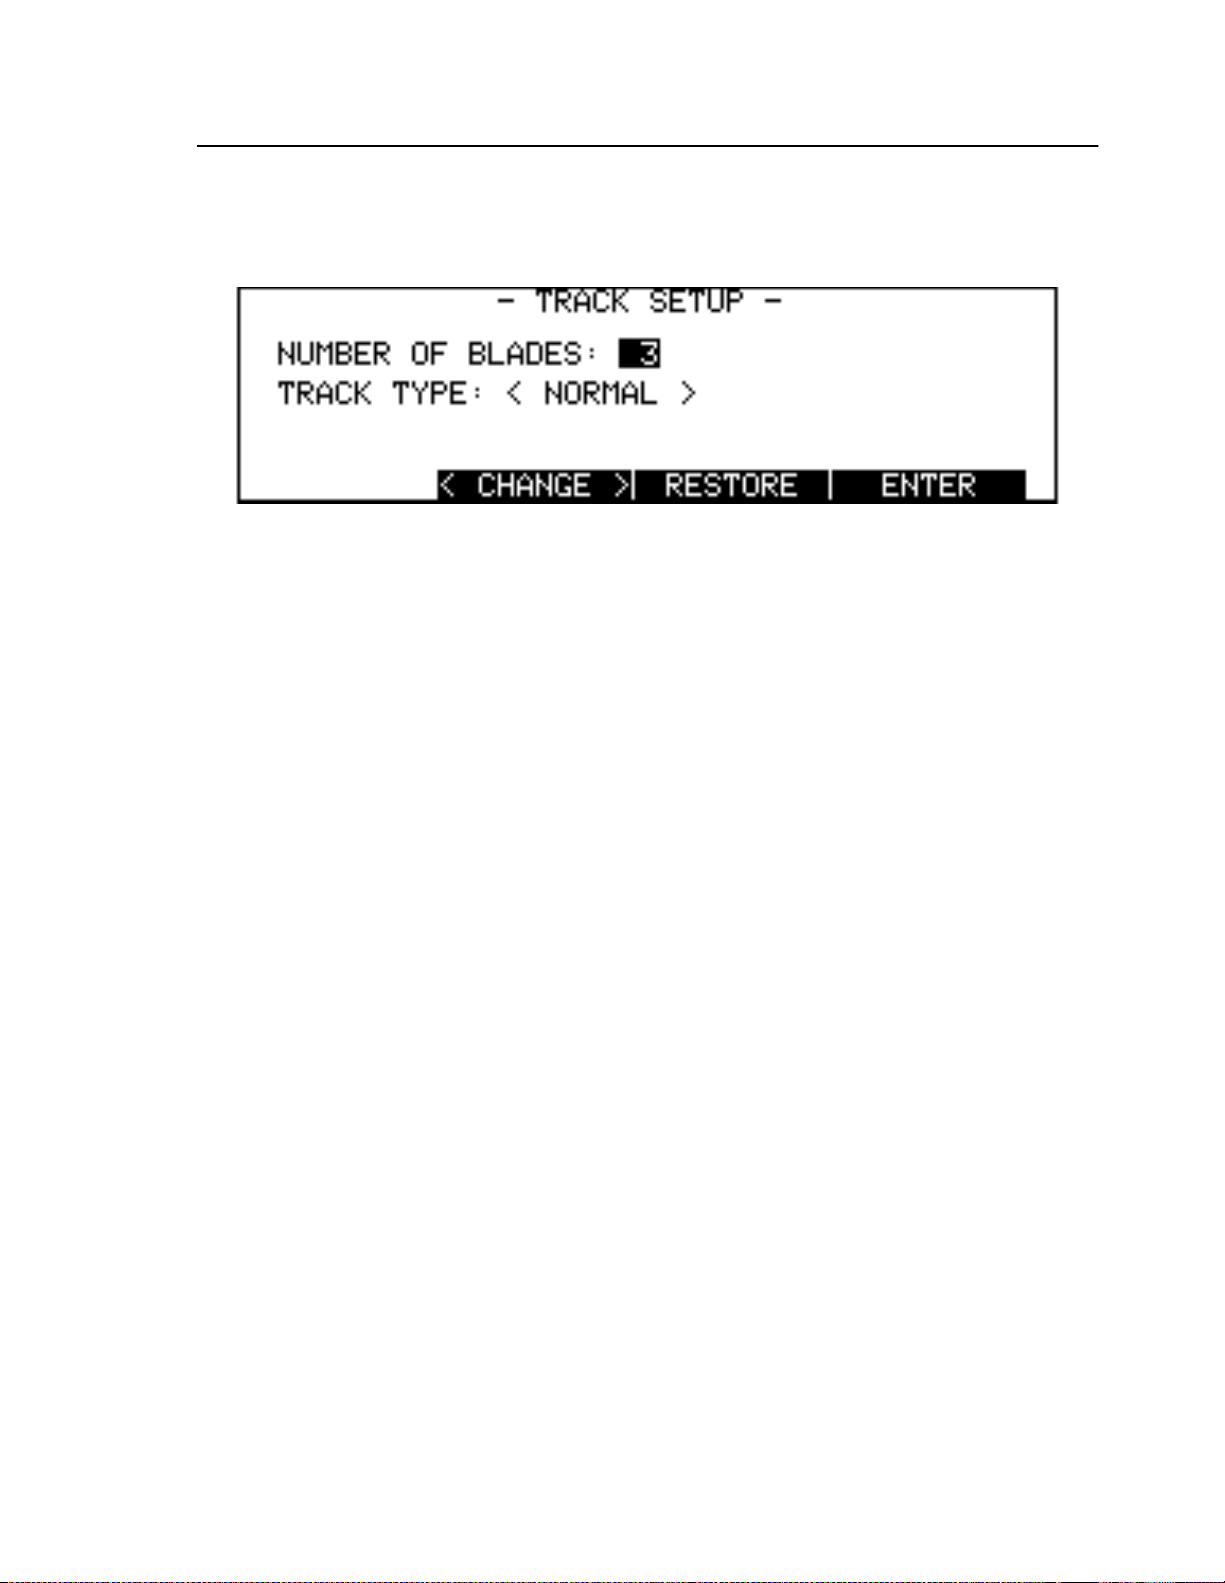
Visual Track Parameter Setup
Track paramete rs ma y also be modified by pressing
screen (Figu re6-2). See the explanation of th
SETUP
SETUP
, which in tu rn d i s pl a ys t he Track Setup
key in Section 4.2.3.4 “SETUP Key” on
page 4-7 for more information on Setup screens.
Figure 6-2. Track Setup Screen
Use the Arro wkeys to select the field whose contents are to be modified, and the
or the numeric keypad to effec t th e de sir ed changes. The
res umes opera t ion in the Track mode . The
set by t h e most recent
ENTER
.
RESTORE
ENTER
soft key saves the changes and
soft key restores to all fields the values that were
Once the Track Setup screen parameters have been modified, you may alternately press
the changes and return to the Track mode, or
procedure . In effect, both of these keys execute an implicit
START
to save the changes and begin the track
ENTER
before performing their respective
functions.
<CHANGE
TRAC
soft key
to save
The rest of this section explai n s i n g re ater d et ail the various Track Setup screen fields.
6.3.1 Number of Blades
The number of bl a de s on the target rotor system i s automatically set i n the Balanc e mode when a chart
is selected. Use the numeric keypad to change this value, if required.
MORE
The number of blades may be changed through the Track Mode Start-up screen. Use the
key to increase the displayed value, and th
FEWER
soft key to decrease it.
soft
The number of blades that can be entered ranges from two to sixteen.
6.3.2 Track Type
Visual tracking may be perfor med in either
normal
the Strobex to ill um i na te each t ip target once per revolution. Y o u can then ascert ai n whic h blades are
out of track by observing the relative alignment of the images. Surround mode tracking modulates the
Strobex trigger so that the trailing target, that is, the one farthest away from the master blade in th
order of rotation, appears twice, once at either end of the group of images. Illuminating the trailing
target in this way provides a line of reference so that the exact blade tip path plane may be mor
accurately gauged.
The track type may be changed by selecting the type in the Track Setup screen and pressing th
<CHANGE>
soft key.
or
surround
modes. Normal mode tracking causes
Mode l8500C/8500 C+ Operators Manual
6-3
Page 74
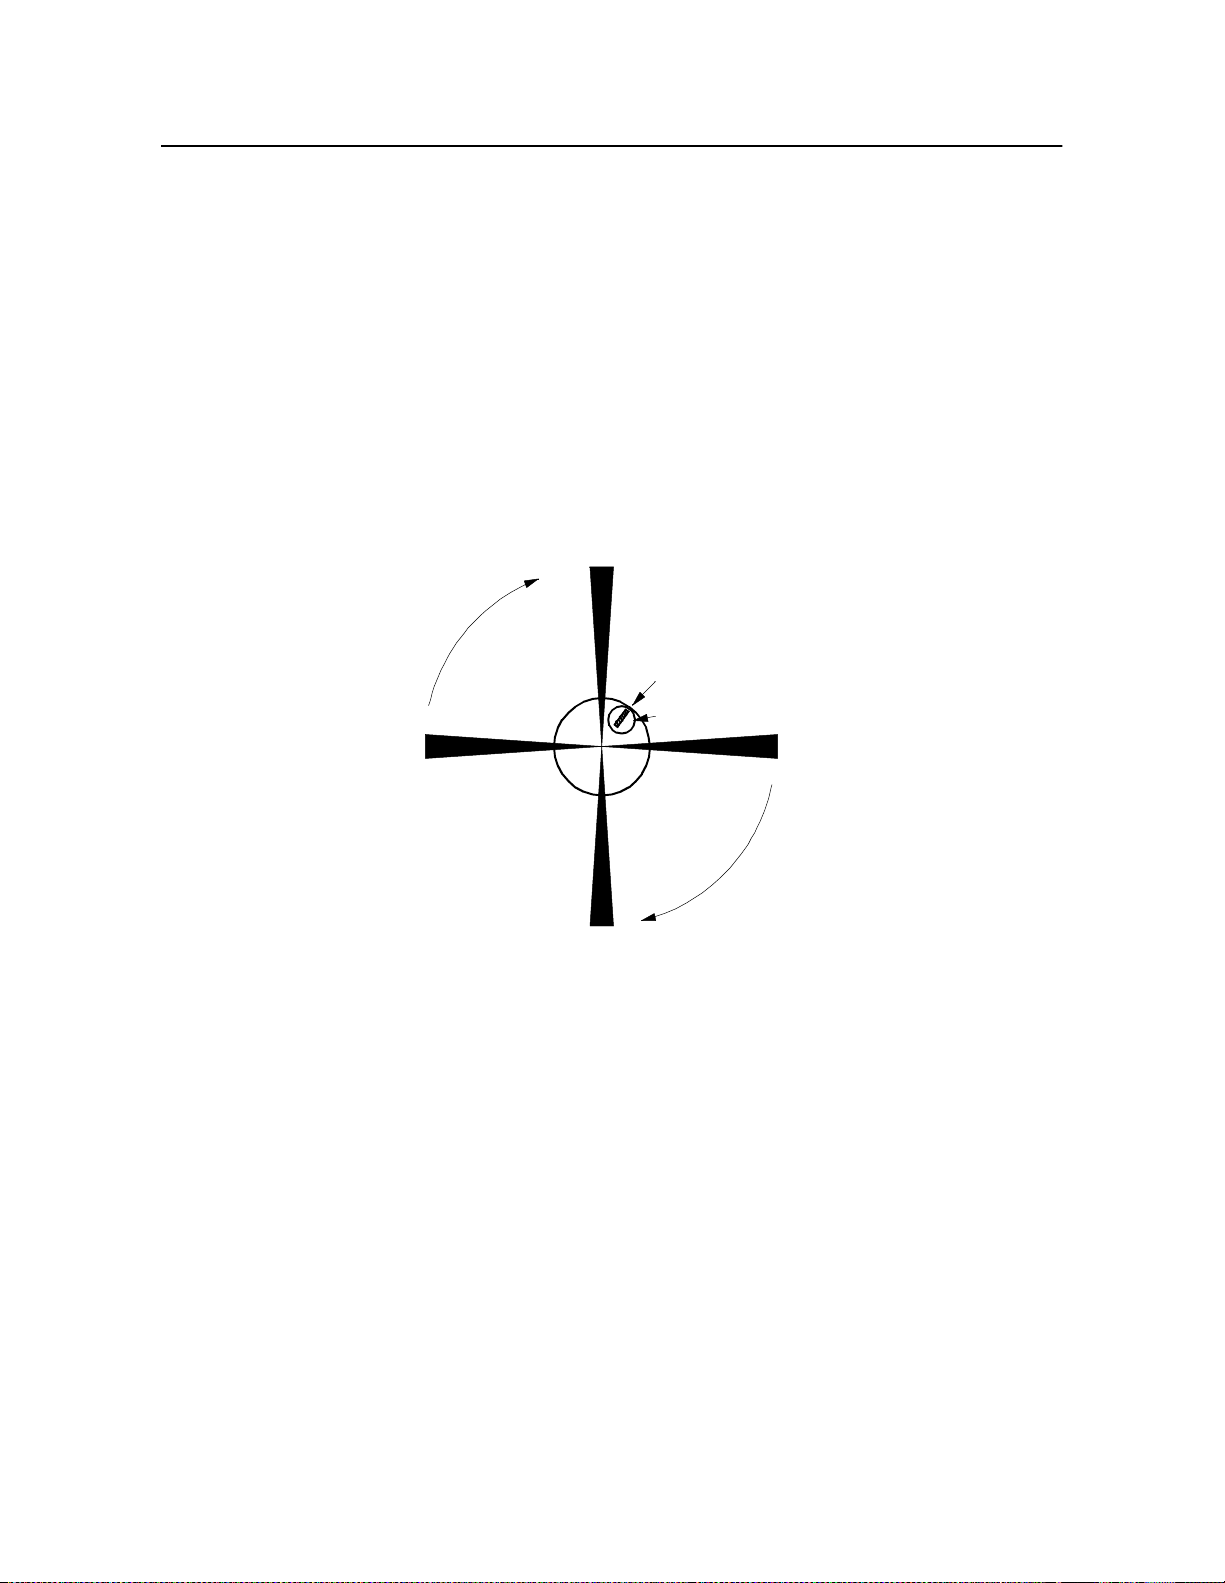
Chapter 6
- Blade Track Observation
6.4 Performing a Visual Track
A visual tr ack illu min ate s target s on the rotating blade tips and fixe s their relative positions. The lead
blade in this configuration is cal l e d th e mast er or target blade. Thi s is a blade whose orient a t i on to the
source of the Strobex t ri gger (Mod e l3030 Magneti c Pickup or Pho toce l l S ys t em) is always known.
Typically, it is designat e d as t ha t bl a d e wh i ch is located at t he f ron t of the aircraft wh en t he in t errupter
trips th e m ag netic pickup or w hen the re tr o-reflective target pa s s es i n front of the Photocell (see
Figur e6-3).
The master bl ad e can usually be found on the schematic drawing th a t i s di sp l a yed when the
CH ARTINFO
soft key is pressed in Balance mode (see Sect ion5.2.3.6 “Displaying Chart
Information” on page 5 -6).
M
In te rru pte r
Magnetic Pickup
2
3
4
Figure 6-3. Sample Rotor With Four Blades
6.4.1 Initiating a Visual Track
Visual tracking requires the installation of either a magnetic pickup and interrupter or Photocell and
reflective target. The S tr obe x m ust a l so be co n nect e d t o the 8500C/C+ through the dedicated adapter.
In addition, special reflective targets must be installed on the blade tips according to the aircraft
manufacturer's dir e cti ons . C onnect the Strobex and powe r/ s i gnal input cables to the 8500C/C+ and
check that they are correctly secured to their connectors at the rear of the 8500C/C+. All cables must
be neatly tied and dressed, and the appropriate signal input device, Photocell or magnetic pickup,
correctly mounted and in g o od working order. Fi na l l y , bring the aircr af t u p t o s pe ed in the desired
6-4
Chadw i ck-Helmuth Company, Inc.
Page 75
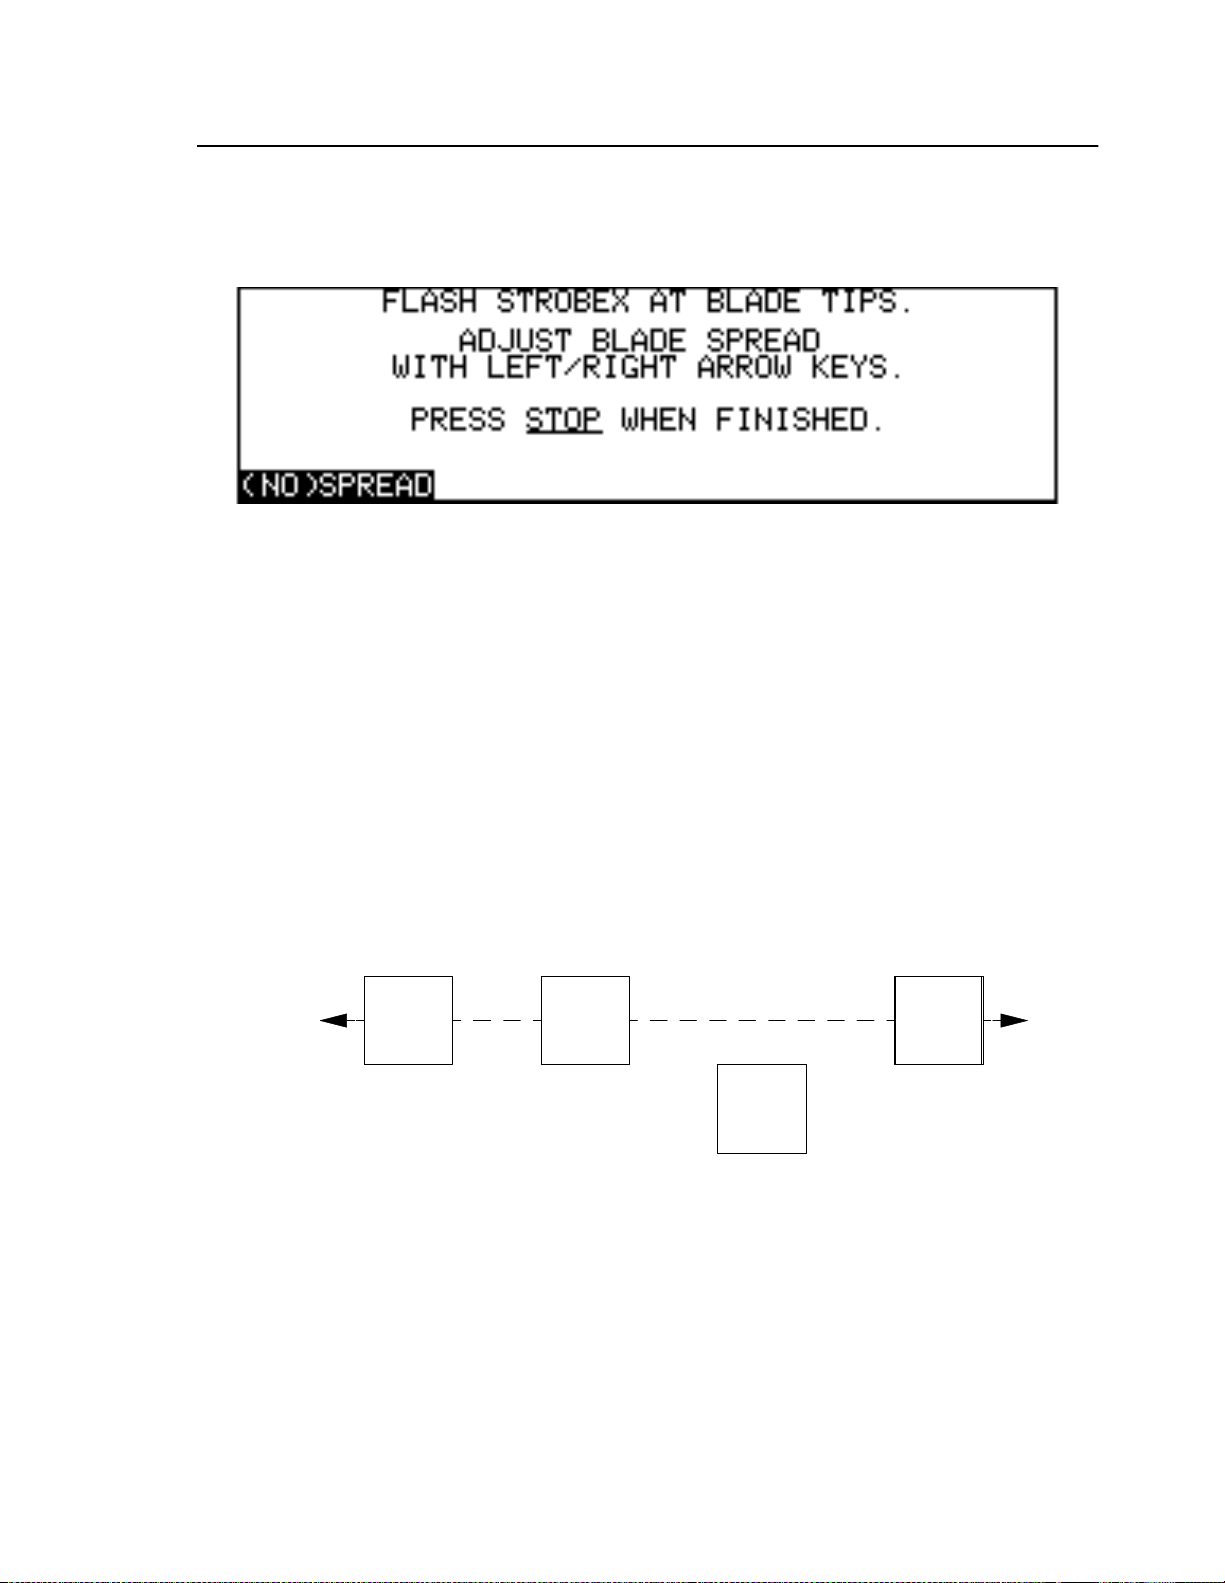
Performing a V isual Tra ck
flight regime. With the rotor system running at the appropriate speed and the 8500C/C+ in Track mode,
START
press
soft key (see Figu re6-4).
. The 8500C/C+ the n activates the Strobex and disp l a ys one soft key, th
(NO) SPREAD
Figure 6-4. Visual Track Screen
Flash the Strobex at the maste r blade tip and observe the relative positions of the illuminated t argets.
At first the image s may b e supe r imposed and diffi c ult to d ist i ng uish visu all y. T heir positions can b
adjusted by pressing the L eftArrow key, which modulates the Strobex trigger and spreads the target
images. Pressing the Rig htArrow key moves them closer together. Alternately, you may use th
(NO) SPREAD
system' s track. Blade images are orient ed with th e master bl a de at t he mo st advanc e d pos i t i o n in the
direction of rotation . The other bla d e imag es f ollow in the ord er of rotation. The ext e n t to which any
blade image deviates from the mean planar path established by the other blades is an indication of the
relative degree of aerodynamic imbalance (see Figure6-5). You can verify your observations by using
the Righ tArrow key (or
stacking reveals the relative vertical al ignm e nt of the ima ge s. In a correctly tracked s y st em all blades
should stack perfectly. Out-of-track blades, however, do not s tack correctly, an d m u st be adjusted until
aligned.
soft key (see late r in t h i s se c tion ) . A sp r ead image gives a c learer pict ur e of the
(NO) SPREAD
soft key) to superimpose or stack the target images. Blad
43
Figure 6-5. Visual Track, Normal m ode
When you are satisfied with the observation, press
may press
mode.
SPECTRUM
BALANCE
or
to terminate the Track mode and ent er that particular operating
M
2
STOP
to terminate visual track. Alternately, you
Mode l8500C/8500 C+ Operators Manual
6-5
Page 76
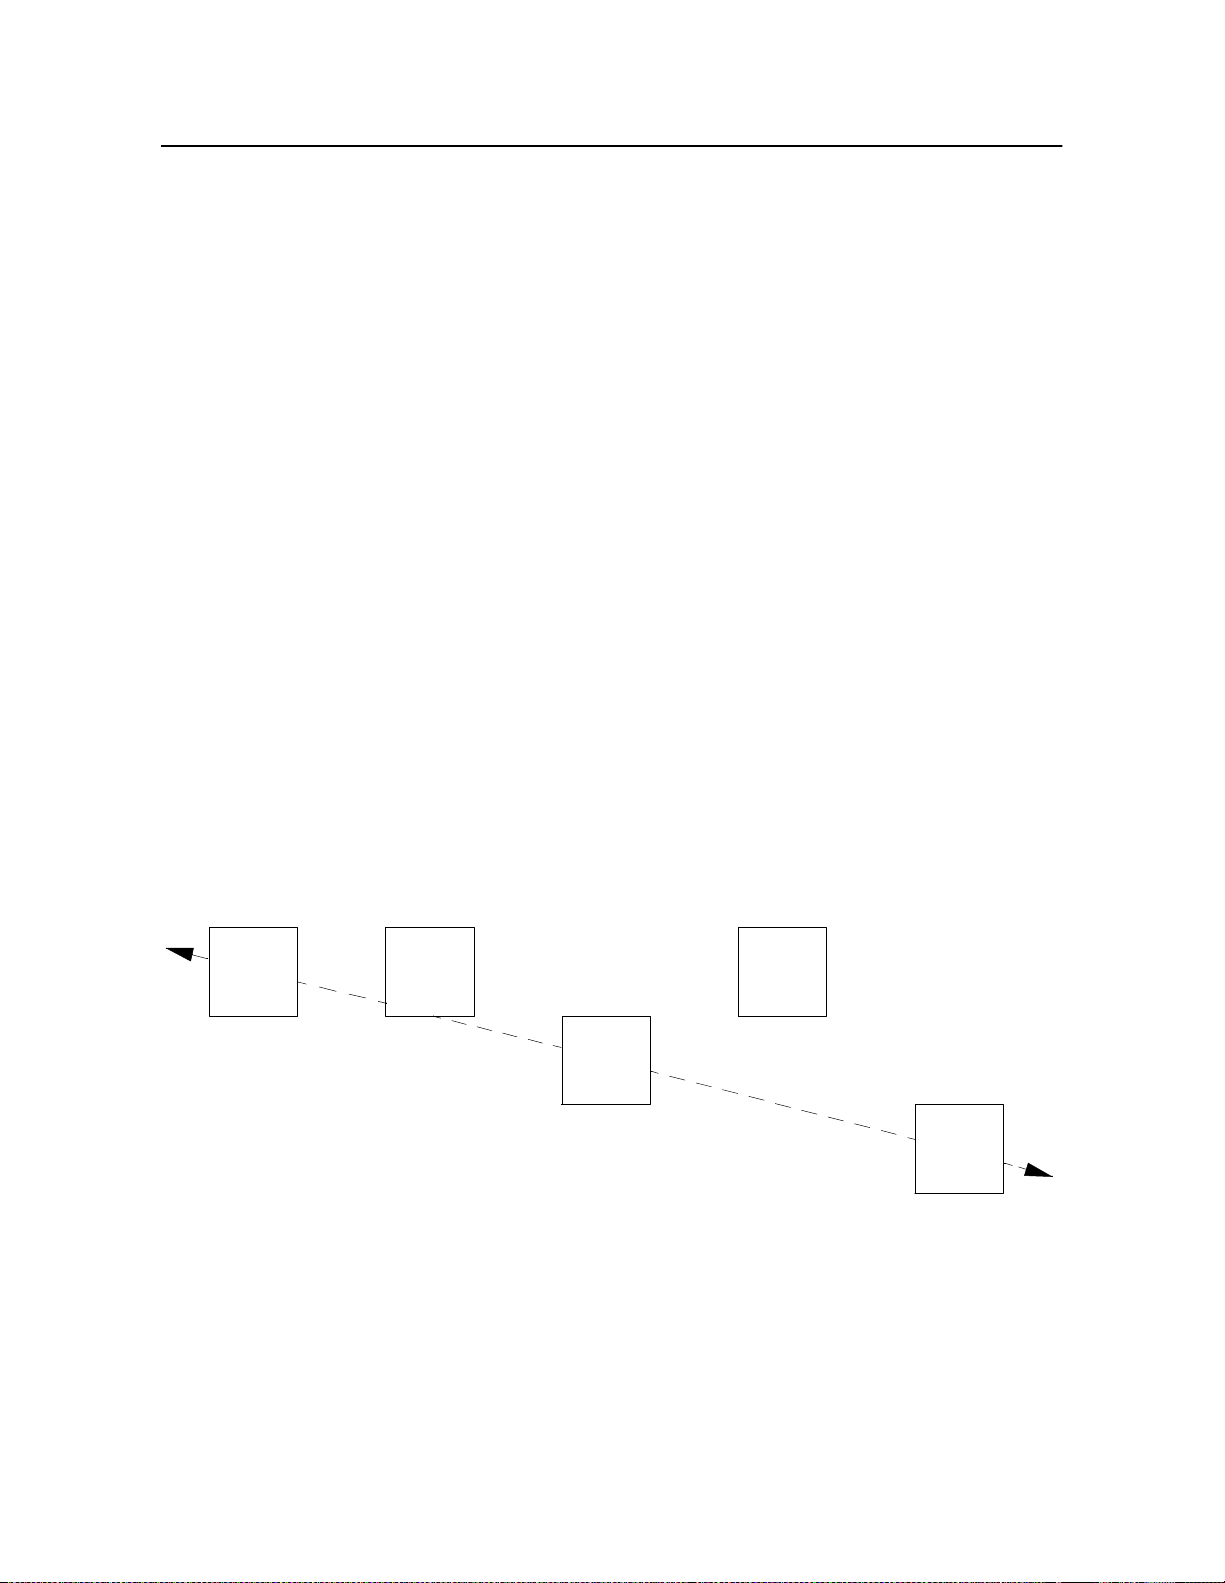
Chapter 6
- Blade Track Observation
6.4.2 The
(NO) S PREAD
The
key stroke. This feature also provides a me a ns b y w hi c h th e 850 0 C/C+ can save and restore blade
spread amounts across different tracking operations. The ability to restore a blade spread eliminates th
need to recreate the sp rea d with the Arro wkeys when re pe at e d track observations are performed.
Pressing the
record ed b y th e 8500C/C+ . If n o blade spread has be en performed,
maximum p os sib le spread and records it. Pressing
is, reduces the blade spread to zero, but does not affect the previously recorded spread. Pressing
(NO) SPREAD
soft key toggles the spread/stack or spread/no spread modes until the track is terminated. For each new
track observa tion,
Alternately, the U pand Do wnArrow keys may be used to spread and stack the blades, respect ively.
(NO)SPREAD
soft key allows you to effect maximum and minimum blade spread with a single
(NO) SPREA
again restores the reco rd e d bl ad e spre a d. Each subs equen t press of the
(NO) SPREAD
soft key during a track observation restores the most recent blade spread
is initialized to res tore the most recently r eco rd ed blade spread.
Soft Key
(NO) SPREAD
(NO) SPREAD
a second time stacks the blades, that
effects the
(NO )SPREAD
6.4.3 Normal and Surround Mode Observations
It is best that you always repeat your track observations in the surround mode. The surround mod
displays the trailing blade twice, thereby providing a line of reference for the true blade tip path. This is
important in c as e th e rotor plane is som e how til ted re lative t o t he az i m uth. Fi gure6- 5 on page6-5 and
Figur e6-6 illustrate the difference between normal and surround mode observa tions. Figure6-5 shows
a Normal mode track, in which blade N o.2 appears to fall outside the blade tip pat h. Figure6-6 repeats
the visual tr ac k i n Surr o und m ode. T he posi t io n of the second trailing b l a de (blade No.4) establishes
the true blade tip path. As you can see, blade N o.2 is in fact correctly aligned, but both the maste
blade and blade No.3 are not.
43
M
2
4
Figure 6-6. Visual Track, Surround Mode
If a track imbala nc e can be identified, adjust the aircraft 's trim ta b s or pitch li nk s a c c o r ding to the
aircraft manufac t urer's direction s and repeat the procedure until all blades are properly aligned.
Visual tracking must be performed at several different forward air speeds before making adjustments to
the aircraft's blades. By taking into account the track characteristics over the range of observations, you
can often determine whether the imbalance is caused by misaligned trim tabs or pitch links. In general,
a track profile th at remai ns c o nst an t at all air speeds indic at es a d j us tm e n t s t o th e pitch l i nks are
6-6
Chadw i ck-Helmuth Company, Inc.
Page 77

Performing a V isual Tra ck
necessary, but a variable or changing profile suggests trim tab adjustments. Having determined the typ
of adjustment that is necessary, pitch link or trim tab, a vertical balance can be performed using the
appropriate balance chart.
6.4.4 Blade Sweep
Blade sweep
equiangular can cause subtle perturbations to the system's lateral balance. Visual tracking allows you
to view the bl a de s pacing and gauge the r e lative sepa ration be tw e en them. B al anc e sol ut io n s for some
aircraft requir e modifications t o t he rotors' blade s we e p , w hi c h i n tu rn alters s pac i ng in an attempt to
redress la teral im ba l ance.
By stack i ng the bla de images durin g a v i s ua l tra ck it is possible to determine the am ount of separation
between adjacent pairs of blades. The extent to which these distances vary from blade to blade is an
indication of the relative angular separation b e tween them. Follow the aircraft manufacturer's
directions to align rotor blades that are not equiangular.
or
lead-lag
refers to the angle of separation between individual blades. Blades that are not
6.4.5 Tail Rotor Tracking
Tail rotor tra ck can be perf o rme d with the Strobe x an d th e Me as u r e m e n ts Only chart. First, following
the instructi ons fo r a tail rotor bala nce, mount an v el ocimet e r and apply reflective blade tip ta r gets to
the ends of the blades. Put the 8500C/C+ into the Balance mode and select the Measurements Only
chart. Set the balance type to Strobe x and set the balance frequenc y to the tail rotor's balance frequency
multipli e d b y the n u mbe r of bl ades. For example, a two-b la de d ta il rotor with a frequency of
33 00revolutions per min ute (RPM) r equ ires a balance fr eq ue ncy of 2times 33 0 0, or 6600RPM.
Operate the airc raft at the setting u se d fo r tail rotor ba lance and press
(see Section 5.4.1 “Initiating Strobex Measurement” on pa ge5-9). When the Strobex is activated (see
Figur e5-7 on pag e5-10) flash it at the tail rotor blade tips. Position the targets for better viewing by
pressing t he Lef tand Righ tArrow keys. Press
STOP
to termin at e the trac k operation.
START
to acquire bala nc e data
See Sectio n5.2.1 “Measuremen t s O n l y Chart” on pa ge5-2 for more i nf ormation on th is chart.
Mode l8500C/8500 C+ Operators Manual
6-7
Page 78

Chapter 6
- Blade Track Observation
6-8
Chadw i ck-Helmuth Company, Inc.
Page 79

Chapter 7
Spectrum Analysis
7.
The Model8500C/C+ Balancer/Analyzer has the ability to capture, display, and analyze vibration
signals gene rate d by a rotor sys tem. For so me bala nce oper ati ons, it may first be necessary to perform
a
spectru m a na l ysis
spectrum analy sis feature, u nder the following top ics:
Section 7.1 Spec tr um A n a lys is: Introduction........ .. .... .. .... .. .... .. .... .... .. .... .. .... .. .... .. .... .. .........7-1
Section 7.2 D ata Acquisition and Storage ........ .. .... .. .... .. .... .. .... .. .... .. .... .. .... .. .... .. .... .. ...........7-2
Section 7.3 Spec tr um S e tu p O perat i ons.......... .. .... .. .... .. .... .... .. .... .. .... .. .... .. .... .. .... .. .... .. .........7-3
Section 7.4 Da ta A nalysi s .............. .. .... .. .... .. .... .. .... .. .... .. .... .. .... .. .... .. .. .... .. .... .. .... .. .... ............7-7
7.1 Spectrum Analysis: Introduction
Spectr al da ta acquisition r equ ires that a Model7310 Velocimete r be installed on the target rotor
system. It s cy lin dr ical axis must be o ri ent ed in the directi o n of the vib r a t i o ns you wi s h t o analyze. For
example, if you anticipate performing a main rotor lateral balance, the velocimeter must be aligned
parallel t o the rotor's pl ane of rotation. For a ve r tical bal an ce , th e v el ocimeter must be aligned
perpendicular to the plane of rotation.
before the actual balance can be started. Cha pter7 explains the 8500C/C+’s
Spectr al data can be collected a nd d isp la yed by pressing the
for collecting the data varies inversely with the maximum frequency selected through
the lower the maximum frequency, the greater the a cqu i si tion time). A hi g h maxi mu m frequency may
also prod uce unrelia ble amplitude valu es at the low end of th e r ange. As a r esult, be s ur e to select a
maximum frequency that is near the spectral area of interest.
START
key. Note that the time required
SETUP
(that is,
Selecting the Spectrum Mode
The analys is of v i bra t i o n s pec tra requires tha t the 85 0 0 C/ C+ be p ut into Sp e ct r u m mode. This is
accomplished by pressing th
operations, they ar e plotted on the l i quid-crystal d is pl ay (LCD). To collect a n d di spla y new data at any
time in Spectrum mode, press
NOTE: If the 8500C/C+ is currently performing other time-critical functions, it may be
necessary to press
SPECTRUM
START
STOP
to terminate the function before Spectrum mode can be entered.
key. If spectral data have been captured during previous
.
Mode l8500C/8500 C+ Operators Manual
7-1
Page 80
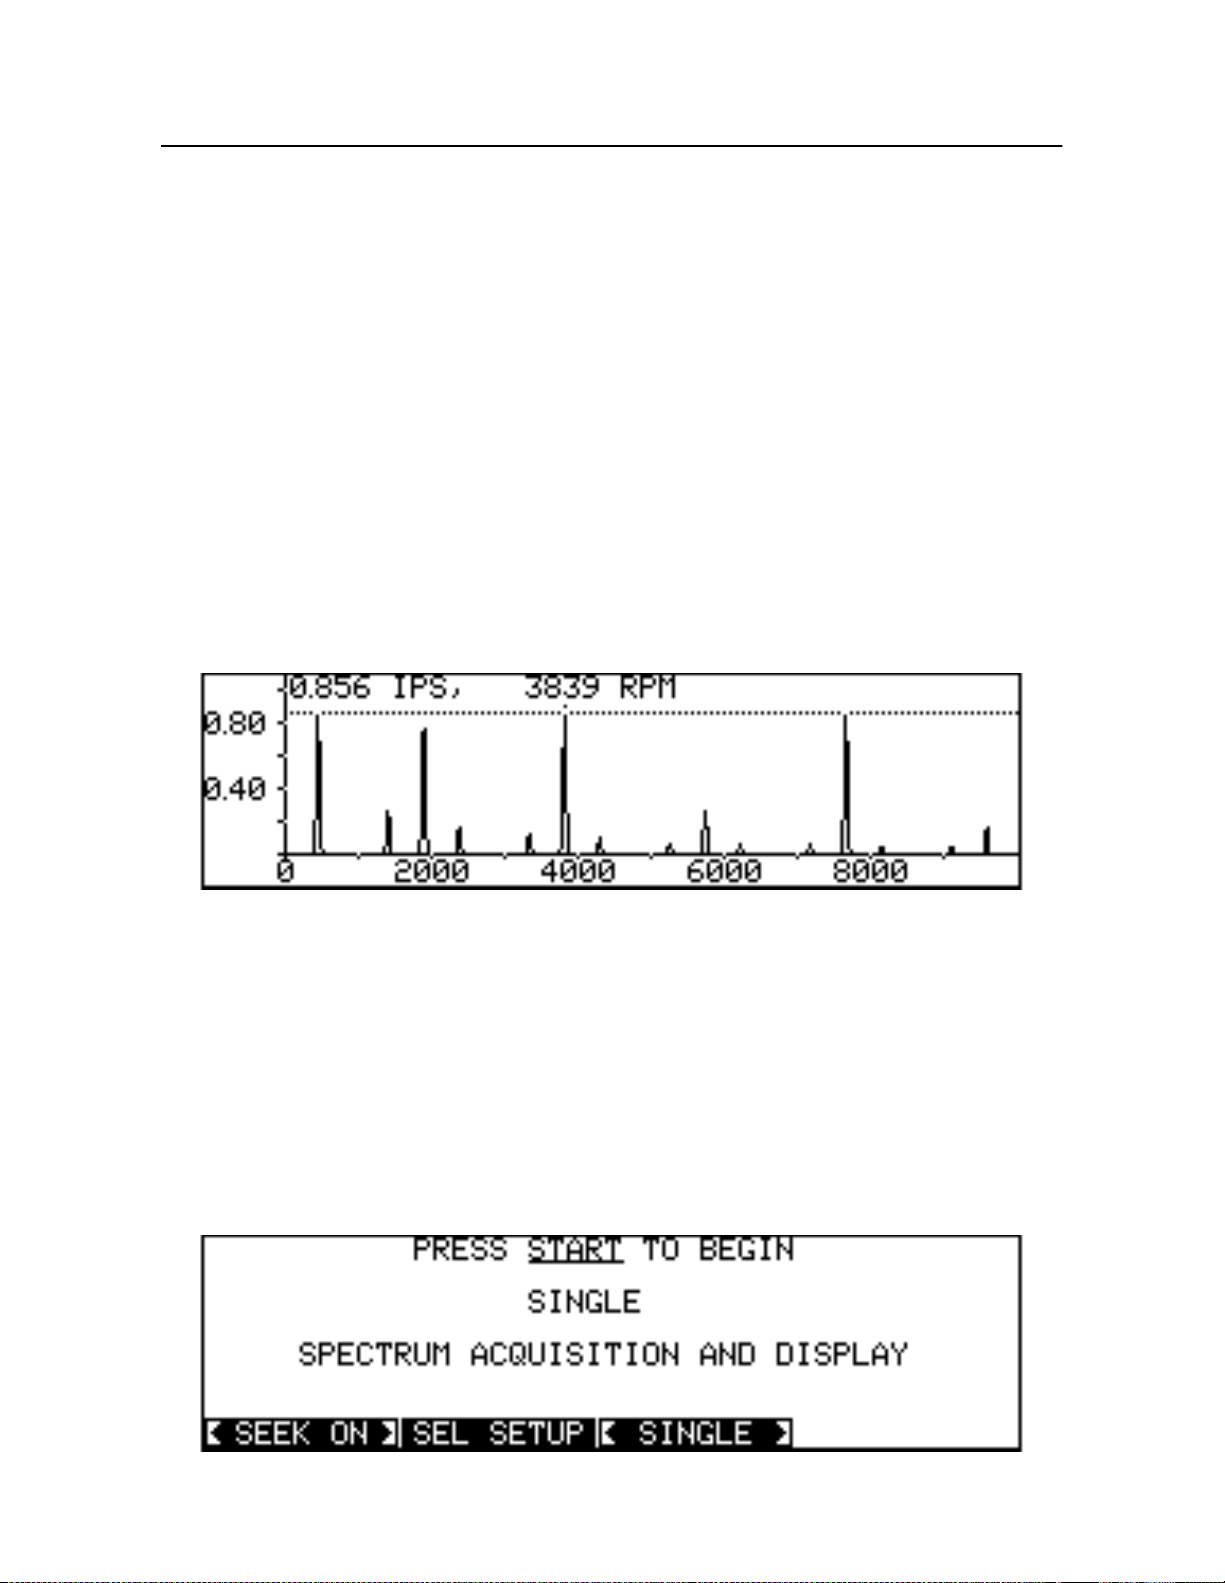
Chapter 7
- Spectrum Analysis
7.2 Data Acquisition and Storage
This section expla i ns how to operate the 8500C/C+ in Spectru m mode for th e purpose of collecting and
storing spectral data.
7.2.1 Spectral Frequency Plots
Once the spectral data set has been collected, it is immediately displayed as a fast Fourier transform
(FFT) spectral-frequency plot, with frequency di sp layed a lo ng the horizontal X-axis in revolutions per
minute (RPM) or Hertz (depending on the units selected), and vibration amplitude displayed along th
vertical Y-axis in inche s p er second (IPS). A s pe cial cross-hair cursor, highligh t i ng the intersection of
frequency and amplitude on the spectral plot, may be moved left or right with th e Arrowkeys (se
Figur e7-1). If the seek peak function has been enabled (using
spectral p eak to ano t her, subje c t t o the value of the seek am pl i tude thresho l d . No t e that in seek peak
mode, the cursor cannot be moved if no peak s exceed the seek amplitude level. Otherwise, if seek peak
has been disabled, the cursor has an unrestricted range across the frequency axis. In both cases, th
current cursor position is always shown in numerical form at the top left of the graph.
SE EKON
), the cursor jumps from one
Figure 7-1. Spectr al Frequency Plot
7.2.2 Aborting Data Acquisition
A data acquisition in progress may be aborted by pressing the
the 8500C/C + i s i n s in gl e mode, all existing spectra l data becomes l ost. I n t his case, a spectral
frequency plot cannot be g e ne rat e d. In stea d, a spec ial Start- up s c r e e n is d is p l a y ed with two soft
function keys, th e repe tit ion mode and seek mode keys ( see Sec tio n7.3.1.5 “Repetition Mode” on
page 7-4 and Sect ion7.4.3 “List Peaks Function” on pa ge7-8). The
you wis h to modify any o f the sp ec trum parameter s before in i tiating a new da t a acquisition (see
Figur e7-2).
START
key. If
SEL SETUP
Figure 7- 2. Spect rum Start -up Screen
STOP
is pressed while
key is available if
7-2
Chadw i ck-Helmuth Company, Inc.
Page 81
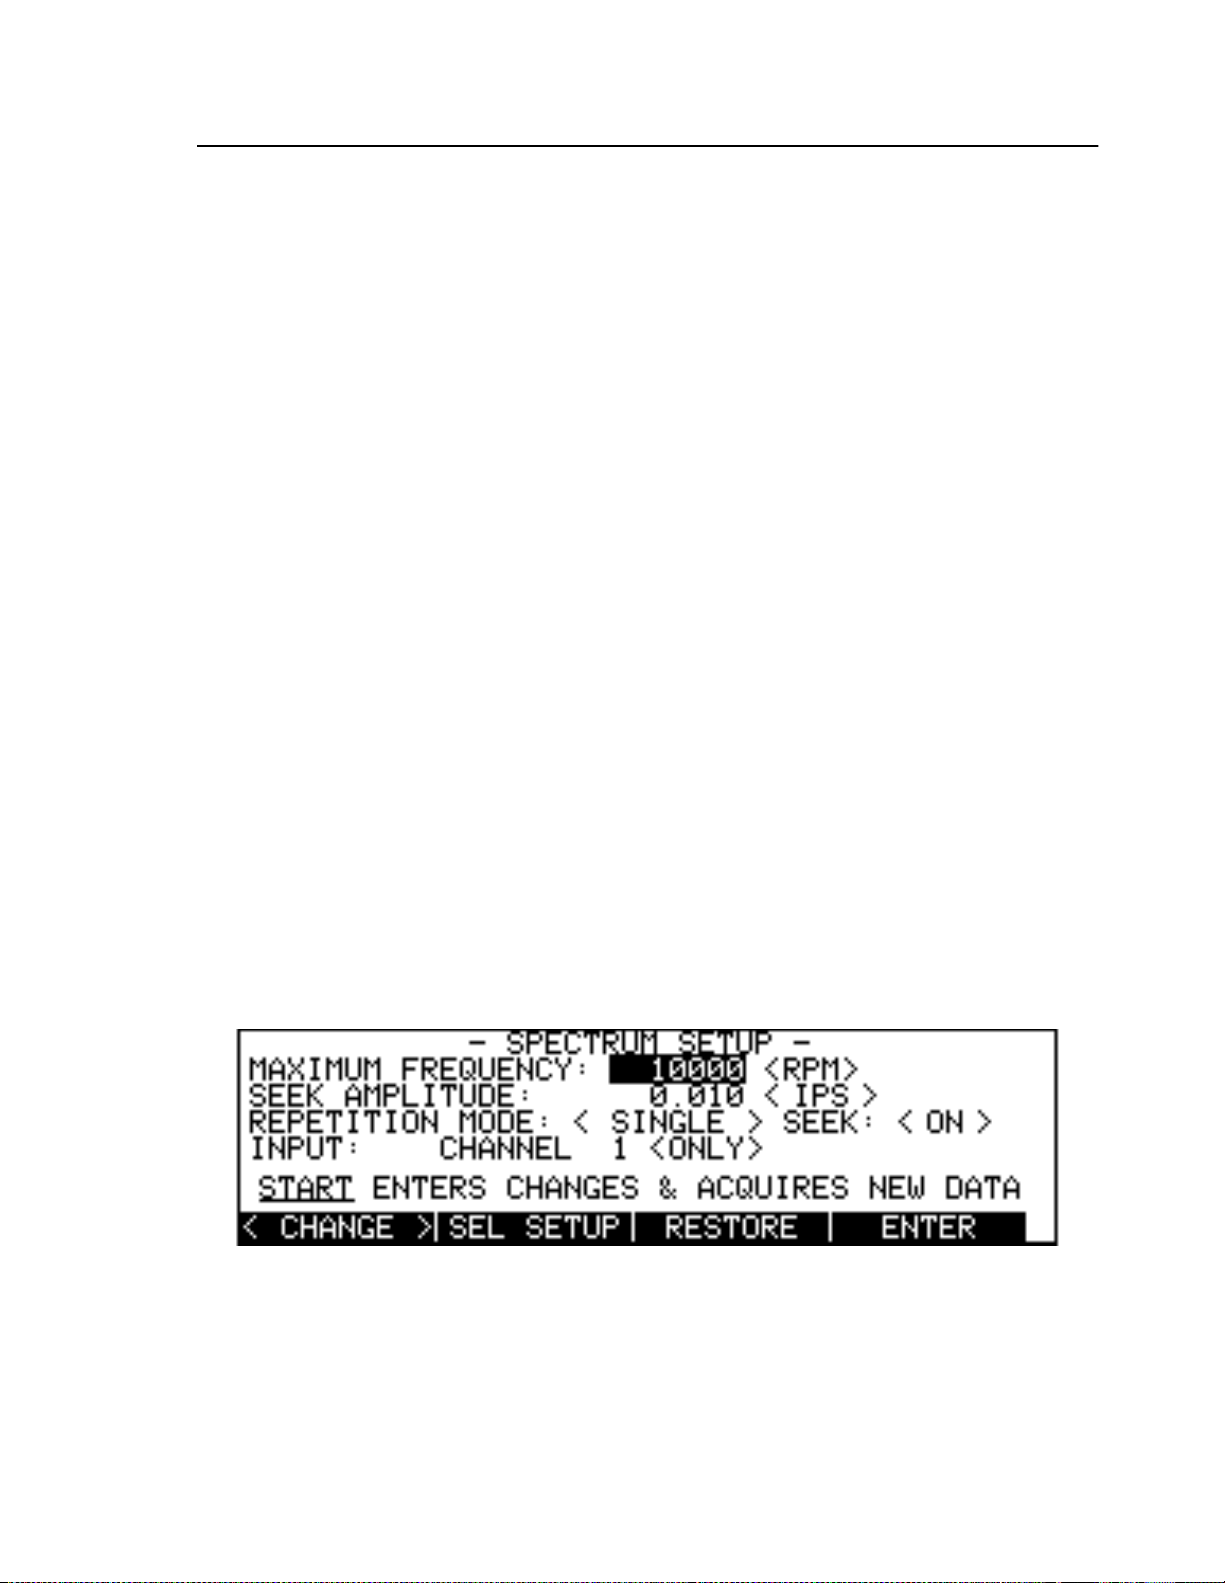
Spectrum Setup Operations
STOP
If
whole data set displayed. The spectral plot cursor is added, and th
screen repl aced with the current curso r position in vib rat ion am pli tu de (in IPS) and frequency (in RPM
or Hertz). The dis p la y i s es se n ti ally the same as if a si ngle mode spectral d a t a acquisition had been
allowed to run to completion (see the next Section 7.4 “Data Analysis”).
is pressed whil e the 8500C/ C + is i n mult i pl e mode, da t a acqu isi tio n is t er m in ated and the last
MULTIPLE
label at the top o
7.2.3 Storing Spectral Data
The current spectral data set may be saved and stored in 8500C/C+ memory or as a data file on disk.
First, press the
MEMORY
either
memory. To change the field, press
<CHANGE>
3.5-in. double-sided, double-density disk in the 8500C/C+ disk drive. In either case, press
write the data. If the data is written to di s k i t is giv e n a unique file name based on the curre nt date and
time, plus the extension *.SPC. See S e cti o n10.2.2 “S tori ng Data to Disk or Memory” on pa ge10-4 for
more information on storing spectral data and A ppendixB Spectral Data File Format” for a
descripti on of the spectral data file format.
STATUS
or
soft key, followed by
key to be sure that th
DISK
. If the field is set to
SETUP
ENTER
Write To
MEMORY,
, use the Arrow keys to highlight the field, and press th
DISK
. If
has been selected, insert a formatted, writable
field is set to the desired target device,
subsequent store operations write data to
STORE
to
It is strongly recommended that 8500C/C+ distribution chart disks
files. Inst ea d , u se a backup copy of the chart di s k and store th e original chart disk in a safe place.
Instructions for making a backup disk are located in Sect ion10.2.4 Copying Balance Charts” on
page 10-6.
be used to store spectral data
not
7.3 Spectrum Setup Operations
The 8500C /C + s up p o r ts the modification of several im portant pa r a meters tha t a re u se d t o control the
acquisition and analysis of spectral data. These parameters may be accessed by pressing
which in tur n displays the Spectrum Setup screen (Figu re7-3). See the description of the
in Secti on4.2.3.4 SETUP Key” on pa ge4-7 for more information on Setup screens.
SETUP
SETUP
,
key
Figure 7-3. Spectrum Setup Screen
Use the Arrow keys to select the field whose contents are to b e modifie d , an d use the
key or the numeric keypad to effect the desired changes. The
resumes operation in Spectrum mode. Th
set by t h e most recent
ENTER
.
RESTORE
soft key restores to al l fields the values that were
ENTER
Mode l8500C/8500 C+ Operators Manual
soft key saves the changes and
<CHANGE>
soft
7-3
Page 82

Chapter 7
- Spectrum Analysis
7.3.1 Using the Spectrum Set up Screen
Once the Spectrum Setup screen par am eters have bee n modified , you may alter na t ely press
SPECTRUM
begin spectral data acquisition. In effect, both of these keys execute an implicit
perform ing th ei r respective functions.
The rest of this section expla i n s i n g re ater d et ail the various Spec trum Setup screen fields.
to save the changes and return to the Spectrum mode, or
7.3.1.1 Maximum Frequency
The maximu m freque ncy is the highest frequency f o r wh i ch spectral d ata can be acqu ired. Use the
numeric keypad to en t er an approp ri ate va lue, which may range from 200 RPM (3.3 Hz) to
600, 000RPM (1 0KH z ). The default i s 10,000R PM (166.7Hz).
Note that, as the maximum frequency increa ses, ampl itude value s at the low end o f the spectrum suffer
a loss of resolution. Low-frequency res olut ion c an fall of f dramat ic a l ly w h en there is a large amount of
activity at low f re qu en ci es and the maximum range has been s e t h i gh (above 1 0 0,000RPM). In
general, the upp e r three -f o urth s of the ra ng e c o nta in the most valid dat a . Yo u must therefore sel ect
maximum frequency that is as close as possible to the area of spectral activity you wish to examine.
7.3.1.2 Freque ncy Units
The acquis i tio n frequency may be display ed i n either RPM or cyc les per seco n d (Hertz). Use the
<CHANGE>
all other displays of frequency data are made in the selected units. The default is RPM.
soft key to convert the frequency fr om one form to the other. Once t his pa rameter is set,
START
to save the changes and
ENTER
before
7.3.1.3 Seek Amplitude
If the seek peak function is enabled, the seek amplitude becomes the minimum vibration signal
amplitude that can be recognized by the spectral plot cursor. The allowable range is from 0.010IPS to
10.0 0IPS. The default i s 0 . 010IPS.
7.3.1.4 V ib ration Units
Vibrations may be displayed in units of velocity (IPS, 0-pk) acceleration (g’s or in./sec2), or
displacement (mils, DA). Use the
Once this parameter is set, all other displays of vibration data are made in these units. A mil equals
0.001in.
<CHANGE>
soft key to c o nvert the units from one form t o the other.
7.3.1 .5 Repetition Mode
The repetition mo d e parame te r i nd ic a t es whether si ngle or multi ple spectral data frames are to be
acquired. In single mode only one set of data is collected and displayed. The data are retained and can
be scaled and manipula ted , as described below. In multiple m od e , data sets are continuo usly collected
and displayed, p urgi n g the cu rrent set duri ng eac h pass. Th is proce ss co ntinu es indef initely until the
STOP
key is used to abort data acquisition. The multiple mode displays are always labeled with th
word
MULTIPLE
at the top of t he screen. The de fault repetition mode parameter is
SINGLE
.
7.3.1. 6 See k Peak Function
Enablin g th e seek p ea k fu nc tion confines the spectral plot cu r so r t o thos e poi nt s that exceed th
specified v ib ra tion ampl it u d e level. Otherwis e , th e cu rs or has free movement across the r ange of the
plot. Use the
<CHANGE>
soft key to turn the seek peak function on or off. The default is seek on.
7-4
Chadw i ck-Helmuth Company, Inc.
Page 83

Spectrum Setup Operations
7.3.1.7 Signal Selector Velocimeter Channel(s)
If a Model8520C Signal Selector is attached to the 8500C/C+, the velocimeter channel field(s) allow
you to se lec t the Signa l Se lec tor velo cime te r channe l(s ) to b e analyzed. Use the
to select an o pe r at o r sy mb ol, ei ther+ (to add s igna ls ), or - ( to su b t ra ct si gnals), or
channel o nl y). Ch an n els are selected by posit io n ing t h e screen cursor over the channel number to be
changed and enteri n g a new value from the nu meric keypad. See Cha pt er11 “Mode l8520C Signal
Selector” for a complete description of this instrument.
NOTE: If the Signal Selector is not a t t ached to the 8500C/ C+, th ese fi e lds do n ot appear.
<CHANGE
ONLY
(to select one
soft key
7.3.2 Using Spectr u m Setups
The Spectrum mode parameters displayed in the Spectrum Setup screen may be saved and recalled, as
desired. T h i s feature allows you to restore c omm on ly used par a met ers with out having to manually
re-enter the information.
chapter plus the current printout annotation (see S ection8.3 Annotating Printouts” on pa ge8-5 for
more details on p rin tout annota tions).
spectrum setup
7.3.2.1 Saving Setups
T o save a spectrum setup, call up the Spectrum Setup screen and press the
setup inf ormation is the n saved to me mory. If the
DISK
, the setup inf or ma ti o n is saved to disk, as we ll as memory.
thus consists of all the setup parameters explained in this
STORE TO
STORE
field in the Status screen has been set to
key. The current
NOTE: It is strongly recommended that 8500C/C+ distribution chart disks not be used to
store spec tral dat a files; i nst ead , use a backup copy of th e chart di sk and store the original
chart dis k i n a s a fe pl a ce . Instructions for making a bac k u p d is k ar e lo cated in
Secti on10.2.4 “Copying Balance Charts” on p age10-6.
When a spectr u m setup i s saved you are first asked to name it (s ee Fi gure7- 5 on page7-6). I f the name
of a spectrum setup is t he same as the n am e of a previously saved se t up, t h e 8500C/ C+ asks you to
rename the current setup before writing it (se e Section7.3.2.3 Renaming Setups” on pa ge7-6).
Saved spectrum setups are stored in 8500C/C+ battery-backed memory. Since the contents of batterybacked memor y are pre se rved when power to t h e in s t ru ment is turned off, it is not neces sary to reload
or recreate the same setups each time a restart occurs. These setups are always available when the setup
selection menu is displ ay e d . The o n l y li m i t to th e n u mb er of setu ps that may be kep t on-line in this
manner is the amount of available batt ery-backed memory. To clear spectrum setups from batteryback ed memo ry, u s e t he
Setups” on pa ge7-7.
CLEAR ONE
CLEAR ALL
or
soft keys explained in Sect ion7.3.2.4 “D eleting
Mode l8500C/8500 C+ Operators Manual
7-5
Page 84
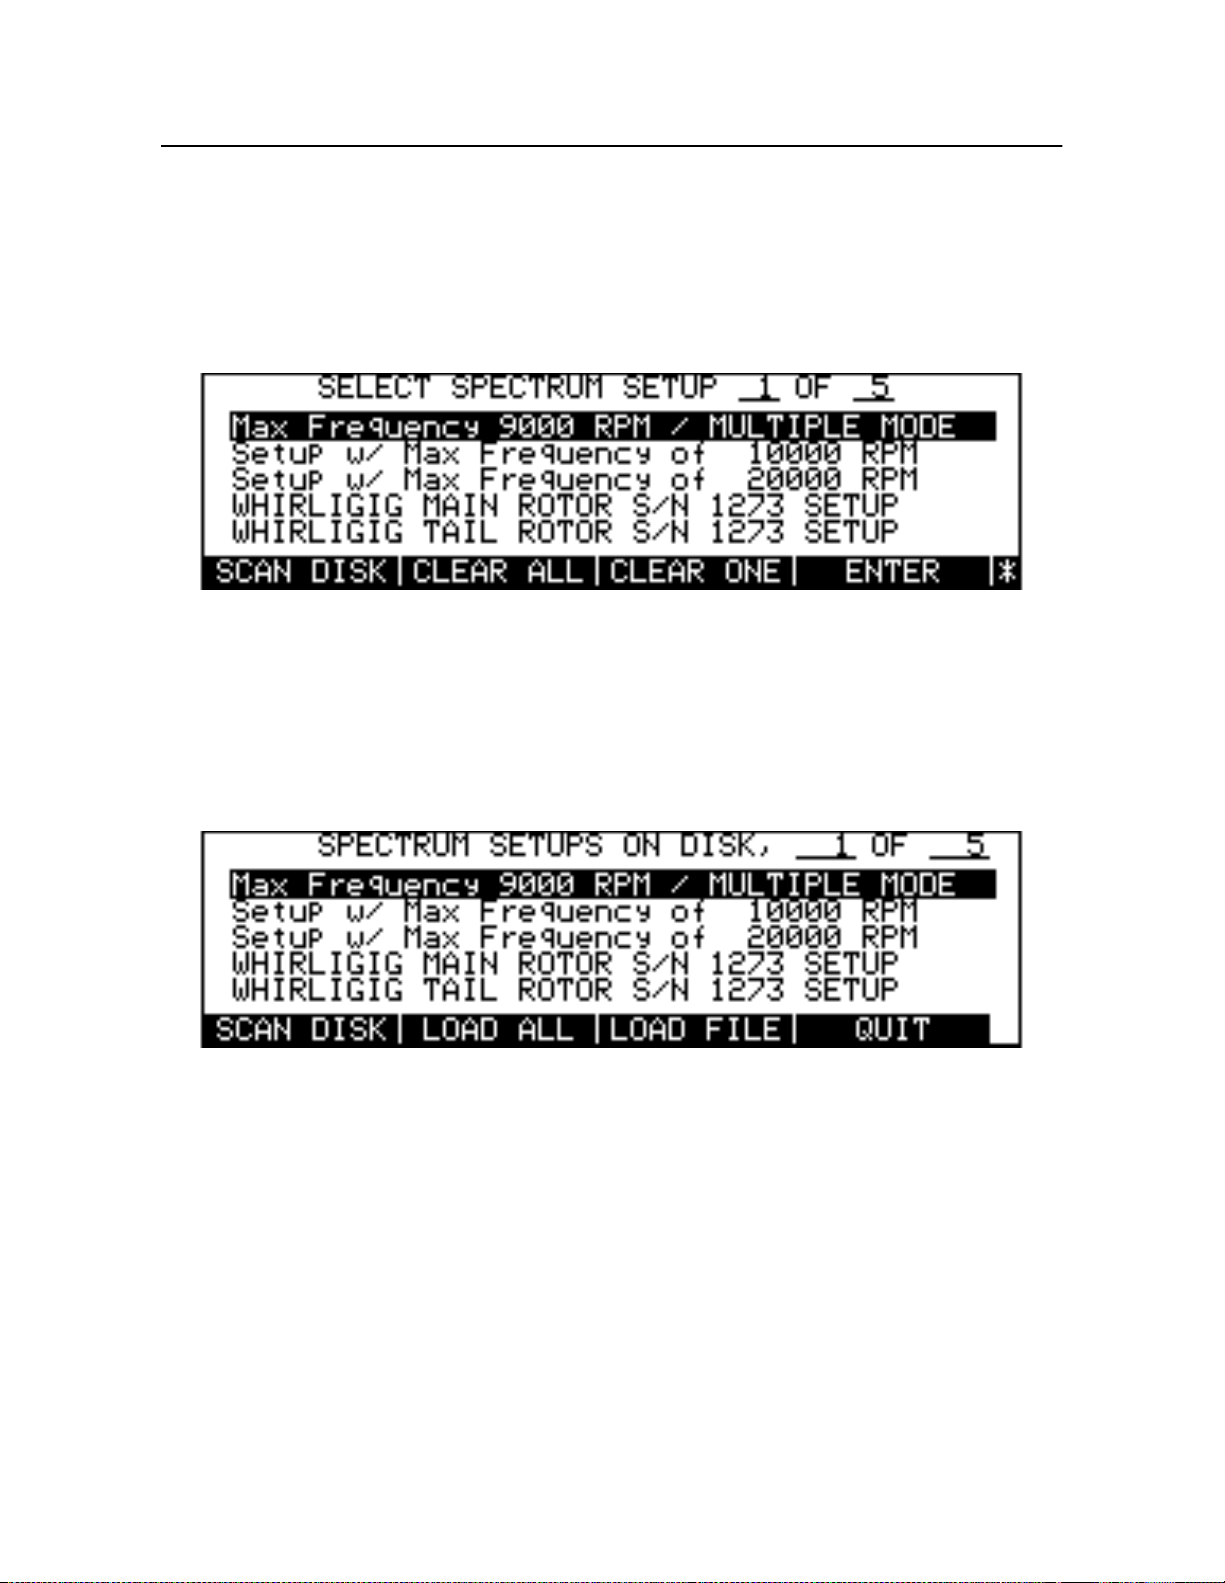
Chapter 7
- Spectrum Analysis
7.3.2.2 Recalling Setups
To recall a spect r um s et up, press the
Setup screen (s ee Fi gure 7-3 on pa ge7-3 and Fi gure7-2 o n page7-2).
available setups (see Figur e7-4). Select a setup by moving the screen cursor to the desired item and
ENTER
press
. The setup is restored and the spectrum parameters and printout annotation associated
with it b ec om e the curr e n t spectrum setup.
Figure 7-4. Spectrum Setup Selection Menu
SE LSETUP
soft key in the Spectrum Start-u p screen or Spectrum
SEL SETUP
displays a list of
Additional set ups can be loaded from disk by pressing
in the 8500C/C+ dis k drive. Press
SCA NDISK
to view the setups on the disk. When
SE LSETUP
and inserting the appropriate disk
SCAN DIS K
finishes checking the d i s k , it p resents a menu of the spectrum setup fi les found there (se e Figure7-5).
LOAD ALL
Press
setup file. Then press
loading t he desired se t up file( s) it a d ds them to the
to load all the setups to 8500C/C+ memory, or use the Arro wkeys to select a singl
LOAD FILE
to load th e sel ec te d s e tup to memory. When the 850 0C /C+ finishes
SEL SETUP
menu.
Figure 7-5. Spectrum Setup Selection Menu
7.3.2.3 Renaming Setups
To rename a saved spectrum setup, select a setup in th
SE LSETUP
menu and press
The 8500C /C + enters i ts e dit mode of operat ion and dis p l a ys the S e t u p Edit screen ( se e Figure7-6).
The soft keys and procedures used here are identical to those used to edit the printout annotation. Se
RENAM ESE
.
7-6
Chadw i ck-Helmuth Company, Inc.
Page 85
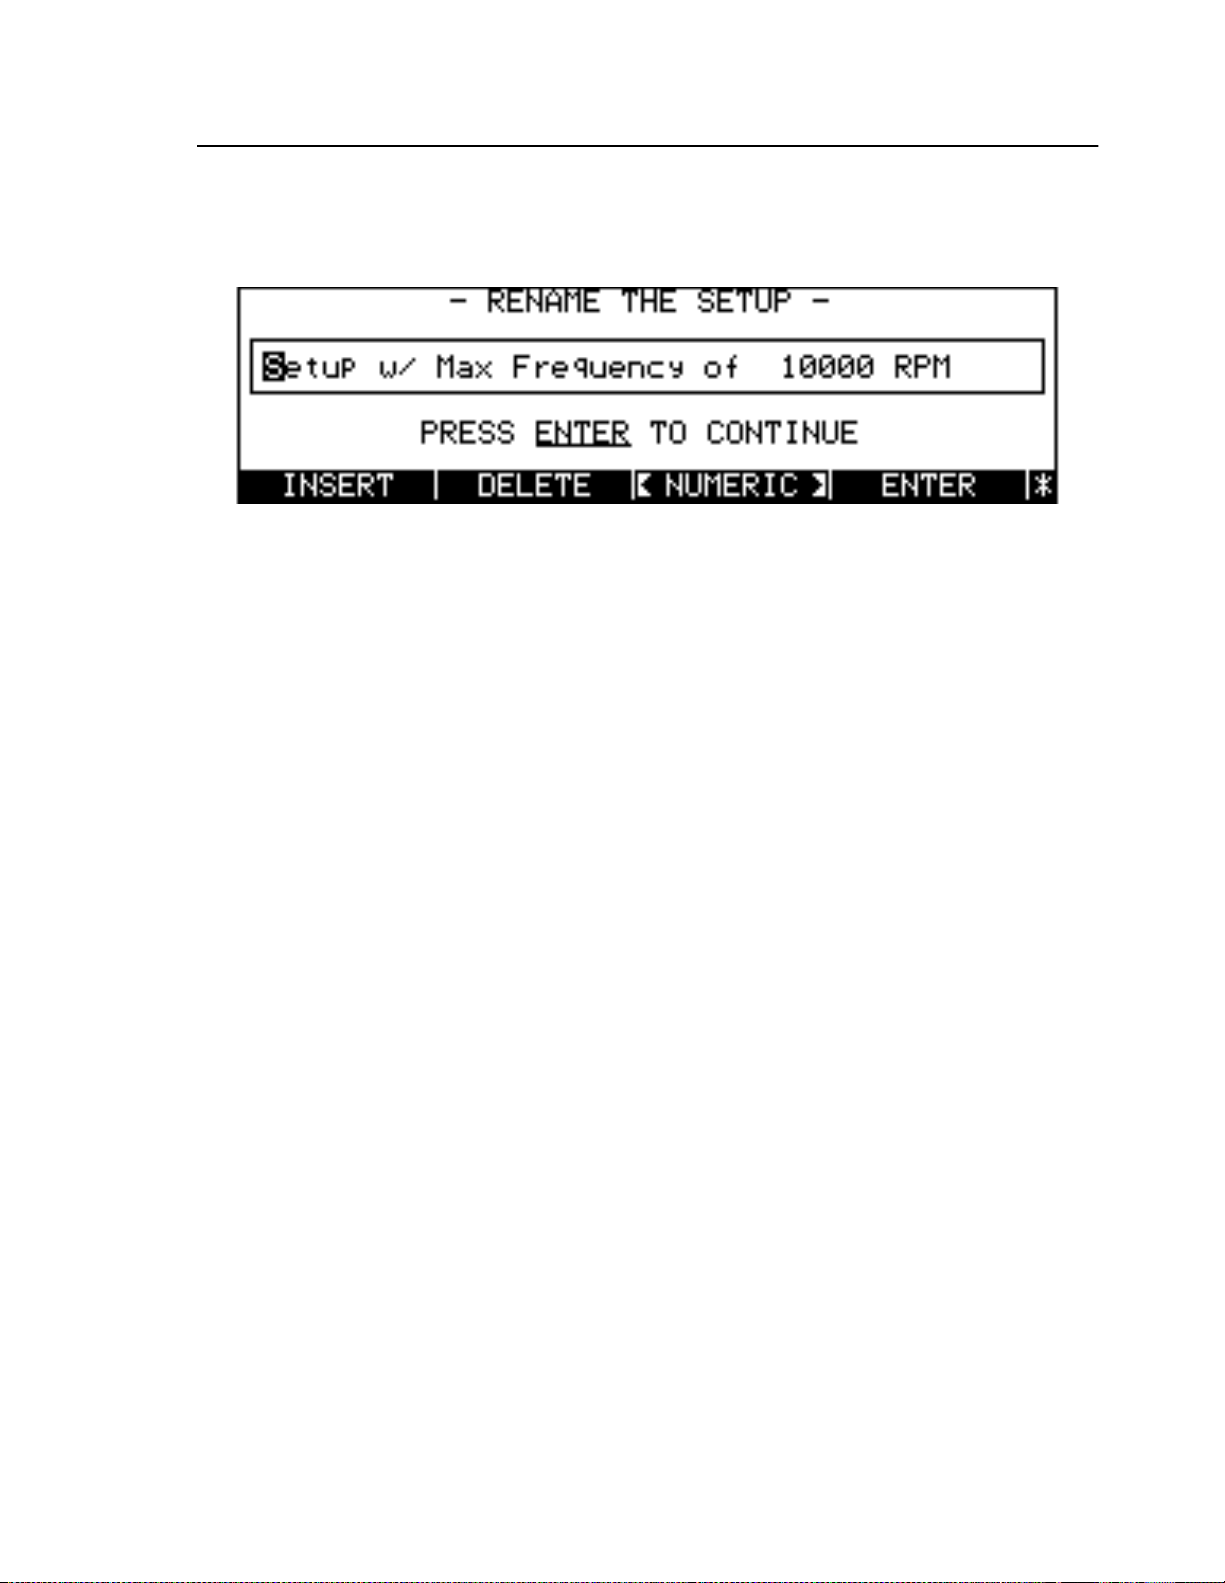
Data Analy si s
Secti on8.3.8 “Editing Annota tion Templates” on pa ge8-8 for a compl ete desc ription of edi t mode.
When you have finished renaming the set u p, pr e ss the
the edit mode. The name of the setup is u p dat e d acco rd ingly on the menu of available setups.
ENTER
soft key to enter the new name and exit
Figure 7-6. Setup Edit Screen
7.3.2.4 Deleting Setups
Spectrum setups may be deleted one at a time or all together. To delete a single setup, first use the
Arrow keys to select a setup in th
all the setups stored in memory, press th
SE LSETUP
menu, then press the
CLEAR ALL
soft key.
CLEAR ONE
soft key. To delete
7.3.2.5 Loading Setups From D i sk
Spectrum setup s th a t have been s tor ed to d isk ma y be lo a d ed into 8500C/C+ memory the n res t ored. To
load a Spectrum setup, invoke the
disk drive. Press
menu re d isp la y s a lon g with the new setu p s. N ot e that the loading of duplicat e setups does not
overwrite existing copies. D up li cat e setups are simply added t o the menu an d sorte d ac c ordingly.
LOAD
to load the setup files from disk. When the load operation is complete, th
SEL SETUP
selection menu and insert the appropriate disk in th
7.3.2.6 Storing Setups to Disk
Spectrum setup s stor e d in m em o ry ma y be stored all at o n c e t o d i sk with the
Fir st invoke th e
MORE KEYS
disk, regardless of the state of the
SEL SETUP
, followed by
selection menu and in ser t th e app ro pr iat e disk in the disk drive. Press
STORE ALL
. The 8500C/C+ copies all spectrum setups from memory to
STORE TO
field in the Stat u s screen.
STORE ALL
soft key.
7.4 Data Analysis
The spectr al da ta analysi s feature s o f th e 850 0C / C+ allow you to analyze coll e c ted v ib ration data by
manipul ati n g the ways in wh i c h the da ta are display ed . This acti on i s do n e thr ough the soft keys that
are enabled after a spectral p l o t ha s been trac ed (see Fi gure7-7). Initially, the soft key labels are
hidden. To view them, you must press
SHOW/HIDE
Mode l8500C/8500 C+ Operators Manual
7-7
Page 86
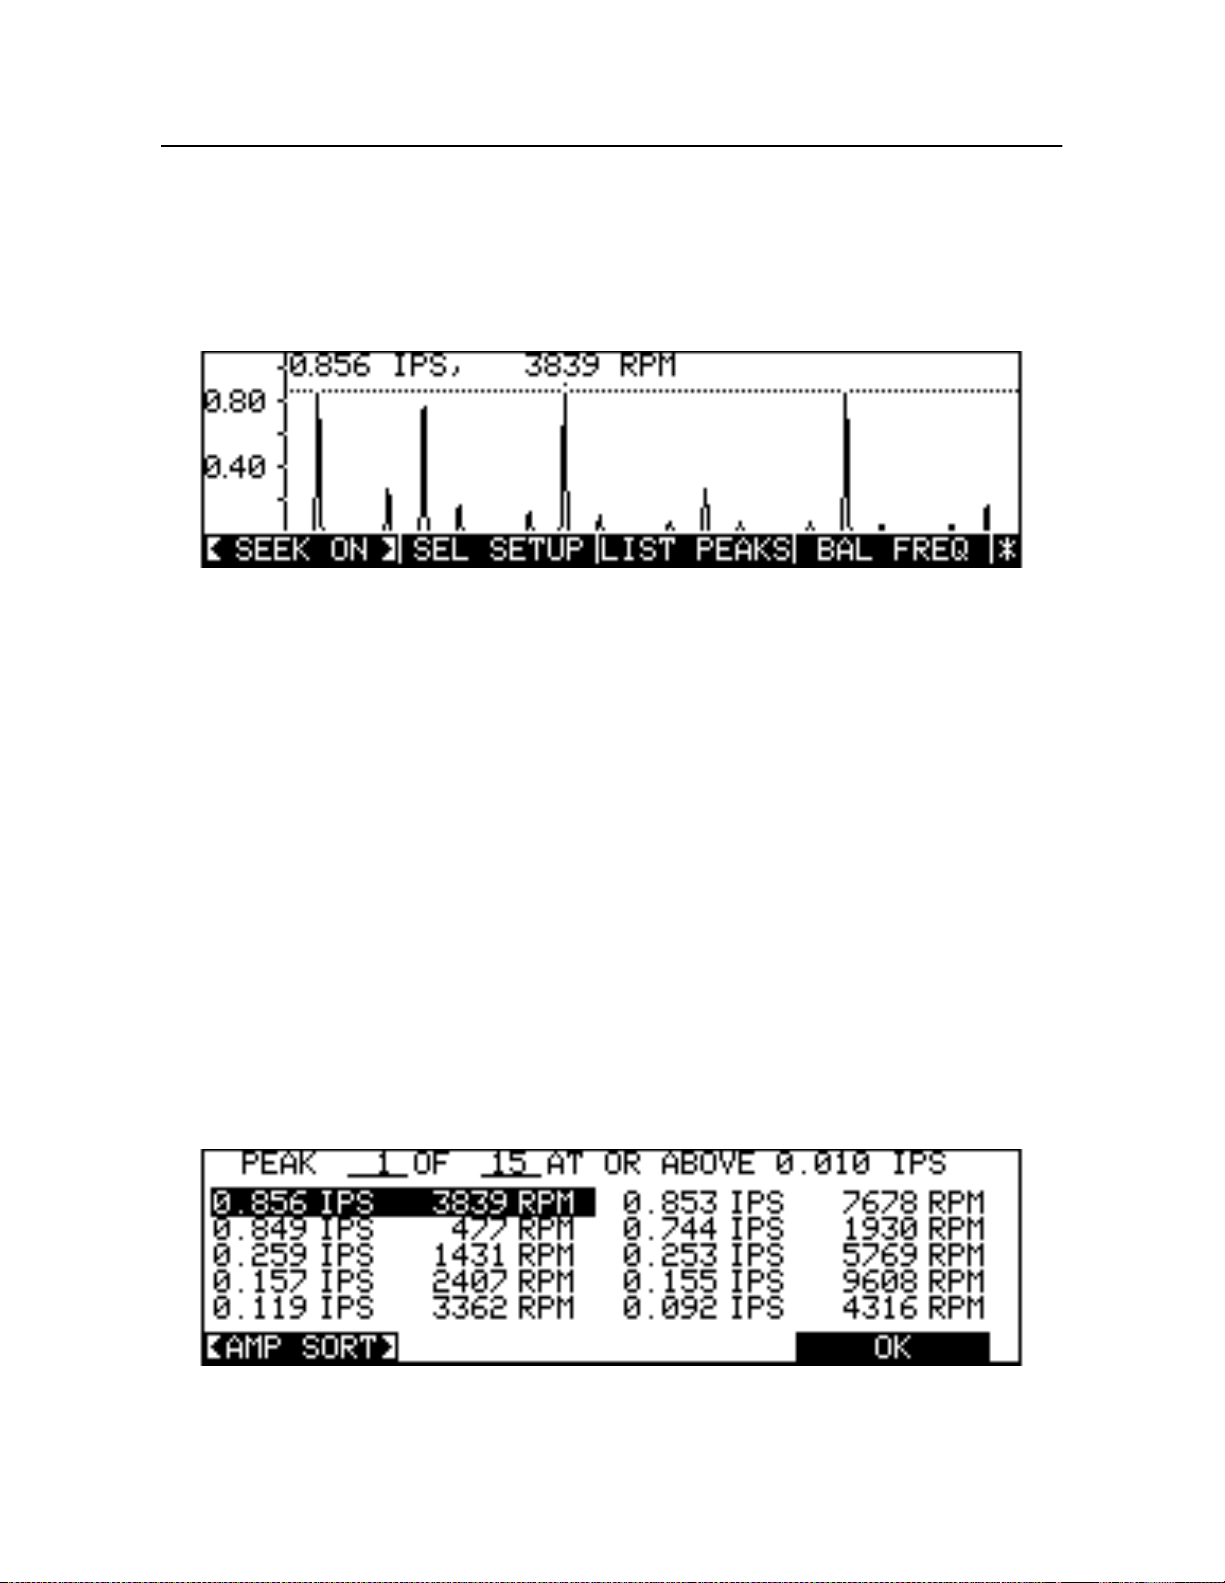
Chapter 7
- Spectrum Analysis
NOTE: A por tion of the LCD b ec omes obs c ur ed by the lab els until
again.
The last two soft keys,
enabled by pressing
analysis soft keys.
MORE KEYS
SCALE
<HA RMON>/<HA RMOFF>
and
. The rest o f this section explains t he func tio n s of th es e sp ectral data
are also hidden and can only b
SHOW/HIDE
Figure 7-7. Spectral Frequency Plot Soft Keys
7.4.1
Pressing the
functional l y i de n ti ca l t o the seek peak p ar ameter in th e Spec trum Setup screen.
SEEK ON/SEEK OFF
<SEEKON>/<SEEK OFF>
Soft Key
soft key turns the seek peak function on and off. It is
is pressed
7.4.2 Select Setup Function
SEL SETUP
The
See Sectio n7.3.2.2 “Recalling Setups” on pa ge7-6 for a complete explanation of
soft key displays a list of saved spectrum setups which may be recalled, as desired.
SE LSETU
.
7.4.3 List Peaks Function
LIST PEAKS
The
value (see Figu re7-8). Entries ar e li s t ed two to a line , with each entr y co nsis t ing of the amplitude and
frequency values for a sin gl e sp ectral p eak . The l ist cursor initi all y hig h li g h ts t h e entry whose position
on the spe ctral plot is neare st th a t of the spectral plot c ursor. U se the Arrowkeys t o scrol l through the
list.
soft key displays a list of the spectral p eaks at or above the seek amplitude threshold
Figure 7-8. List of Spectral Peaks S orted by Amplitude
7-8
Chadw i ck-Helmuth Company, Inc.
Page 87
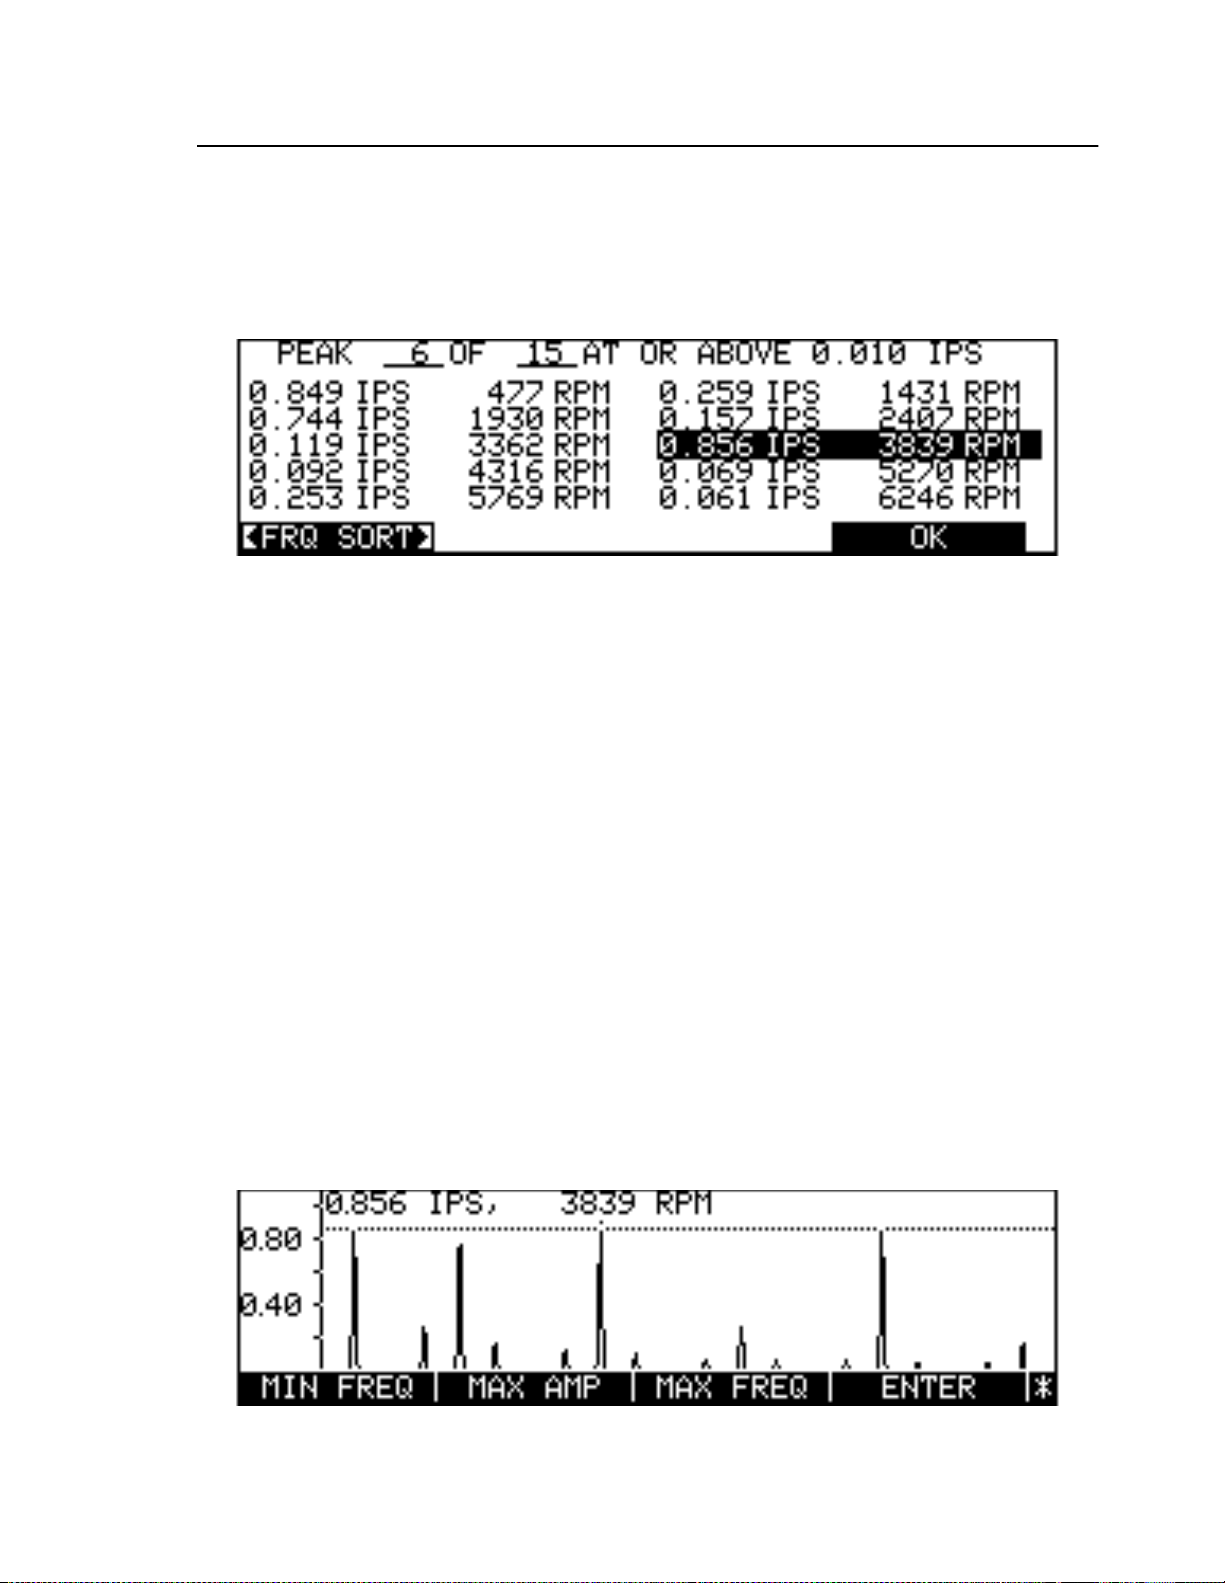
Data Analy si s
Entries can be sorte d w i t h the
the entries to be sorted by frequency, in ascending order (see Figure7-9).
amplitude , in descending order. In both cases the s or t order pr oceeds from lef t t o right, and top to
bottom. Peak s of equ al amplitude ap p e ar in the or d er of increasing frequency. Pressing OK returns to
the spectral p l o t an d po s iti o n s th e spectral cursor on the peak l a st selected in the t able.
<FRQ SORT>/<AMP SORT>
soft key. Selecting
<FRQ SORT>
<AMP SORT>
causes
sorts them by
Figure 7-9. List of Spectral Peaks Sorted by Frequency
7.4.4 Setting the Balance Frequency
BAL FREQ
The
perform ed . Move the spectral plot curso r t o th e des ir ed balanc e acquisition fre quency (usually at a
spectral peak generated by an out-of-balance rotor) and press
spectral plot, or
soft key allows you to display the frequency at which a rotor balance is to be
START
BAL FREQ
to begin ba l an ce data acquisition at the sele ct ed frequency.
. Press OK to return to the
7.4.5
Pressing the
single and multiple. It is functionally identical to the repetition mode parameter in the Spectrum Setup
screen.
SINGLE/MULTIPLE
<SINGLE>/<MULTIPLE>
Soft Key
soft key alternates the repetition mode parameter between
7.4.6 Scaling Spectral Plots
Selected portions of a spectral plot can be enlarged or reduced with the spectrum scaling feature.
Scalin g i s initiated b y p ressing
instrumen t into sca lin g mode an d en ables a ne w se t of soft ke ys (see F igure7-10) . Some of the new
soft key la b el s are ini tial l y h id den. Th ey can be enabled by pressing
MORE KEYS
, followed b y the
Figure 7-10. Spectral Plot With Scaling Mode Soft Keys
SCAL E
soft key, which i n t u rn p u t s the
MORE KEYS
.
Mode l8500C/8500 C+ Operators Manual
7-9
Page 88
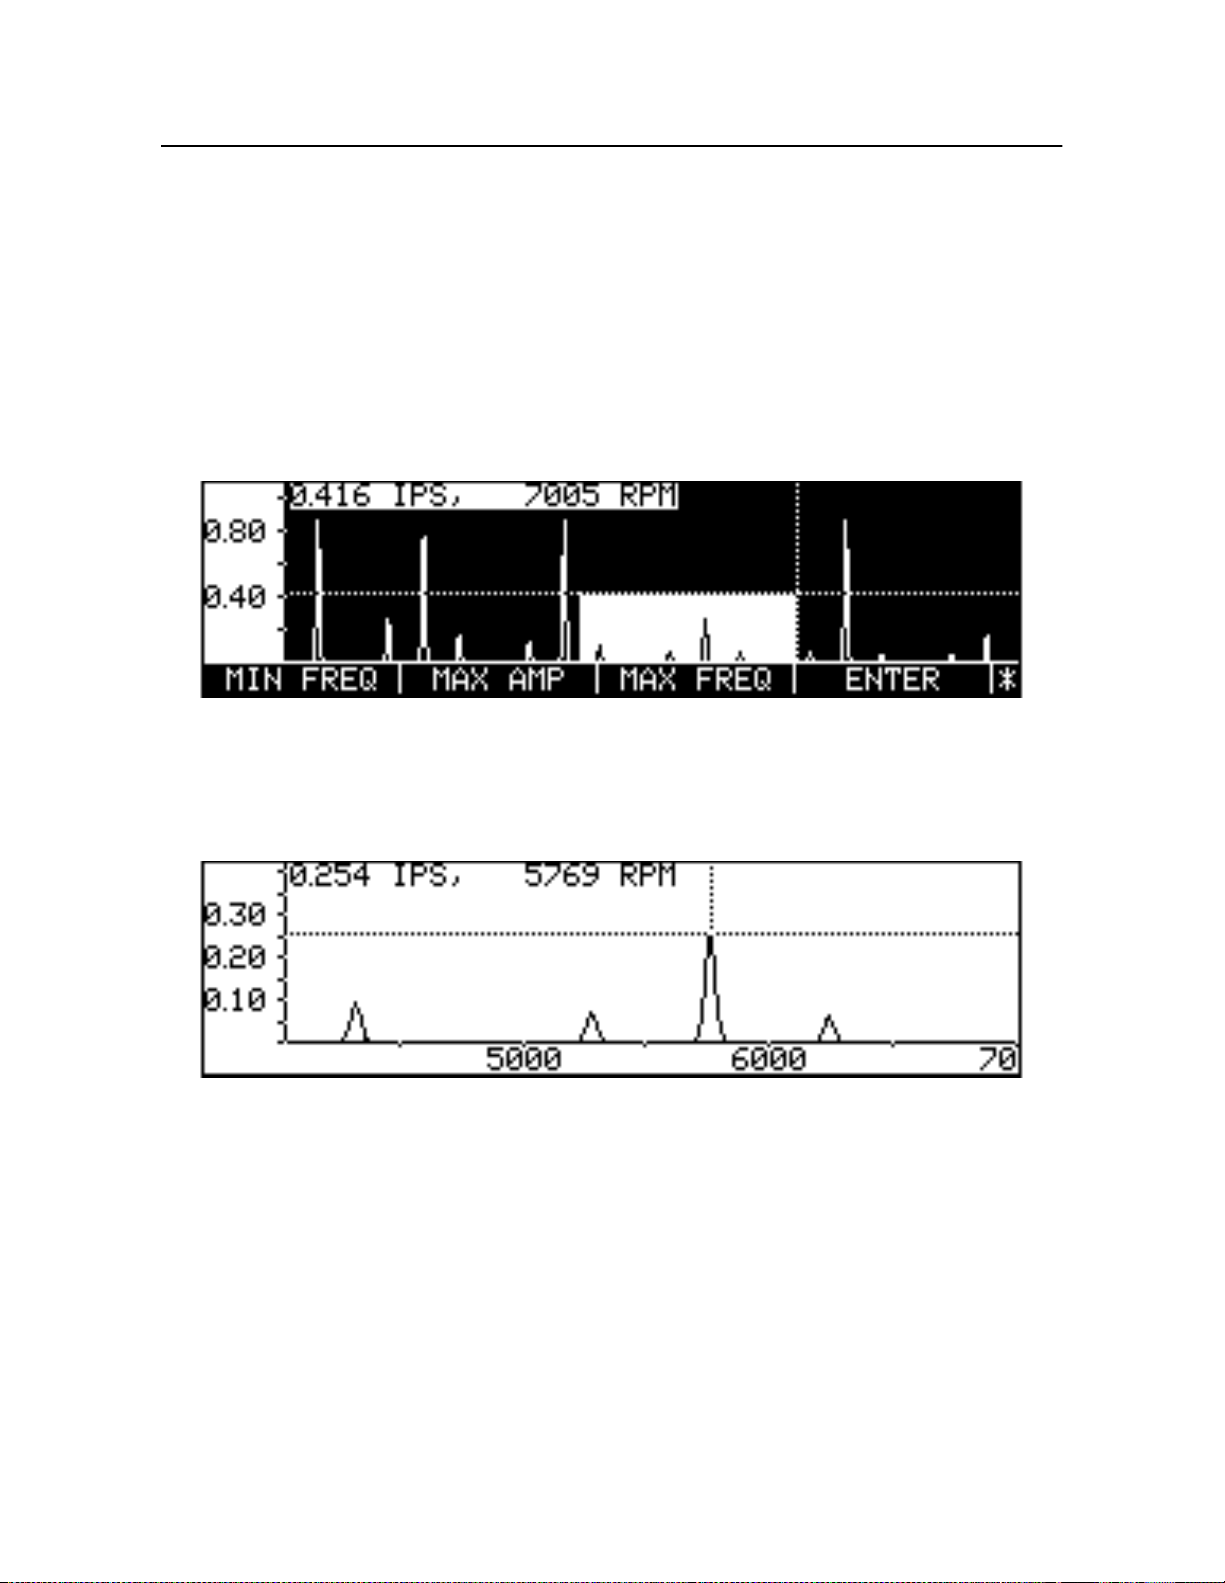
Chapter 7
- Spectrum Analysis
T o enlarge a region of the spectral plot, use the L eftand Righ tArrowkeys to move the cursor along the
X-axis to the m i nimum freque n cy wh ere the target region begins. Note th at m o v i n g th e cu rsor
automat ical ly hid e s t he s oft key labe l s. Press
SHOW/HIDE
to recreat e them. Press the
MIN FREQ
soft
key. The area between the cursor and the Y-axis darkens to indicate it has been deselected. Move th
cursor alon g th e X-a x i s t o the maximum frequ ency where the target region ends. The posi t ion of the
cursor for the maximum frequency must be greater than the minimum frequency. Press th
MAX FREQ
soft key to deselect the area to th e right. Now use t he Upan d Down Arro wke ys to move the curso
along the Y-axis to the maximu m vibr ation amplitude. Press
MAX AMP
to deselect the area above it.
Once these limits have been set, the area to be scaled becomes clearly defined by the darkened regions
that bound it. See F igure7-11 below.
Figure 7-11. Spectral Plot With Scaling Bounds
Press the
Figur e7-12). Note t hat the X-and Y-axes are automa ti cally rea nno ta ted to re fl ect the ne w scaling
parameters.
ENTER
soft key to display the scaled regi on and re-enable the spectrum soft keys (see
Figure 7-12. Scaled Spectral Frequency Plot
If you press
Figur e7-11 on pa ge7-10). This is a simple indication that scaling is currently in effect. Now the
Arrow keys may be used again to e n large t he p l ot s till further or redu ce it to a s m aller scale.
Pressing
removes all scaling and selects the entire spectral plot for viewing. Pressing
scaling mod e and re s tores the spec tra l analysi s soft keys.
SCALE
SCALE
again you see the original full-sized plot with its darkened bounding regions (se
followed by
MORE KEYS
enables an additional soft key,
FULL SCALE
FULL SCALE
, which
exits
7-10
Chadw i ck-Helmuth Company, Inc.
Page 89
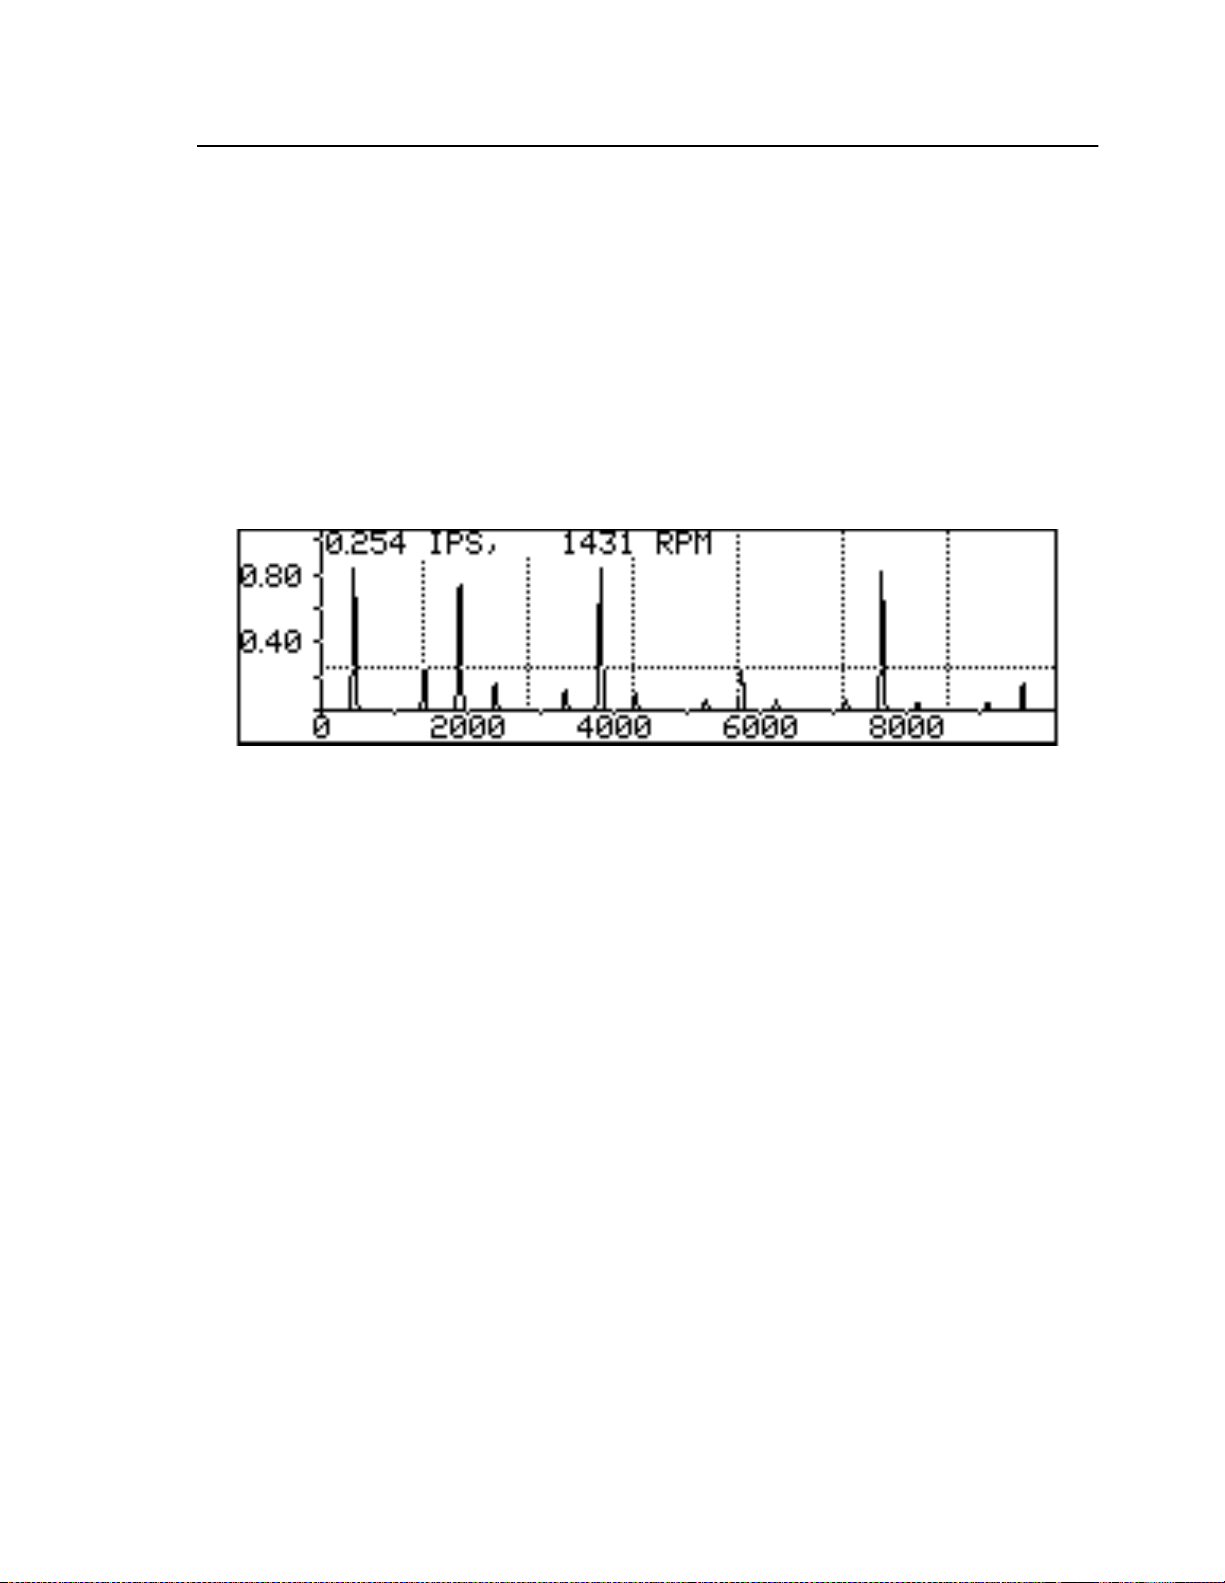
Data Analy si s
7.4.7 Harmonics Mode
The harmonics mode allows you to view spectral frequencies that are an integer multiple of the
cursor’s current frequency value. The id e ntifi ca tion of ha rm on ic freq u e n ci es is i m po rt ant to vibration
analysis b ecause many of these frequ en ci es t u rn out to be artifacts , t ha t is, seco ndary vibrations
generated by a primary vibration sou rce. Thus, correcting a pri mary vibration usua lly el iminates th
harmonic artifacts as well.
Pressing
identifying all harmonic frequencies in the given frequency-amplitude range (see Figure7-13). Th
annotated frequency and amplitude values at the top of the plot are always those of the primary (leftmost) cursor. The
cursors.
MORE KEYS
followed by the
<HAR MOFF
<HA RMON
soft key disab le s t he harmonics mod e and removes any secondary
soft key disp la y s ad ditional vertical cursors
Figure 7-13. Spectral Frequency Plot With Harmonics Cursors
Mode l8500C/8500 C+ Operators Manual
7-11
Page 90

Chapter 7
- Spectrum Analysis
7-12
Chadw i ck-Helmuth Company, Inc.
Page 91

Chapter 8
8.
Using Printouts
The Model8500C/C+ Balancer/Analyzer gives you printouts with balance solutions and other
important measurement information. This chapter explains how to read, annotate, and use these
printouts t o g ain maxim um benefits, un der the follow i n g t op ics:
Section 8.1 Pr int ou t s With the 85 00C/C+ ............ .. .... .. .... .. .... .. .... .. .... .. .... .. .... .. .... .. .... .........8-1
Section 8.2 Re ading 8500C /C + Prin touts ...... .... .. .... .. .... .. .... .. .... .. .... .. .... .. .... .. .... .. .... ...........8-2
Section 8.3 Annota t ing Pri n to u ts .. .... .. .... .. .... .. .... .. .... .. .... .. .... .. .... .. .... .. .... .. .... .. .... .. .... ...........8-5
Section 8.4 Re na ming B alan ce Charts .................... .... .. .... .. .... .. .... .. .... .. .... .. .... .. .... .. ............8-8
8.1 Printouts With the 8500C/C+
Along w i t h showi ng you track-and-balance solutions on its l iq u i d - cr y st al disp la y (LCD), the 8500C/
C+ prov i de s y o u wi t h pri nt o u ts that conta in import ant so lution and m e a su rement information. An
8500C/C+ p rin tout consis ts of a copy of the current di s p lay window, pl us s om e anno t ated data fields
that can provide additional information about the printout contents. By default, these data fields
include t he fo llo w i ng elements: ti me and d a te of t he pr intout, air sp ee d, pickup number, altitude, run
number, manufacturer /model number, identi fication number, an d a comme nt f ield.
If you are using the M odel11800 FasTrak Optical Tracker with a Smart Chart that supports it the
8500C/C+ also generates track printouts with FasTrak information. For detailed information on thes
printouts, se e th e FasTrak Op er a to rs Manual.
Use the 8500 C/C + solutio n p rintout as a hard-copy guide to im pl e menti ng yo ur current balance
solution. If you are not in the auto-print mode, you must press
Normally, in auto-pri nt m ode, the 8500C /C + a utomatica lly creates a s olut i o n print out at t he end of the
last flight regime. At the end of any regime, you may press the
interim s olu t ion . A t t he same time , th e 8500C/C+ a l s o dis plays a Solutio n sc ree n, as reproduced on the
printout.
See Sectio n10.1 Using the Printe ” on pa ge10-1 for additional information on the 8500C/C+ printer
and printouts. Th e rest of this chap ter explains ho w to read and use a n 8500C/C + solution printout.
PRINT
to create a solution printout.
SOLVE NOW
soft key to generate a n
Mode l8500C/8500 C+ Operators Manual
8-1
Page 92
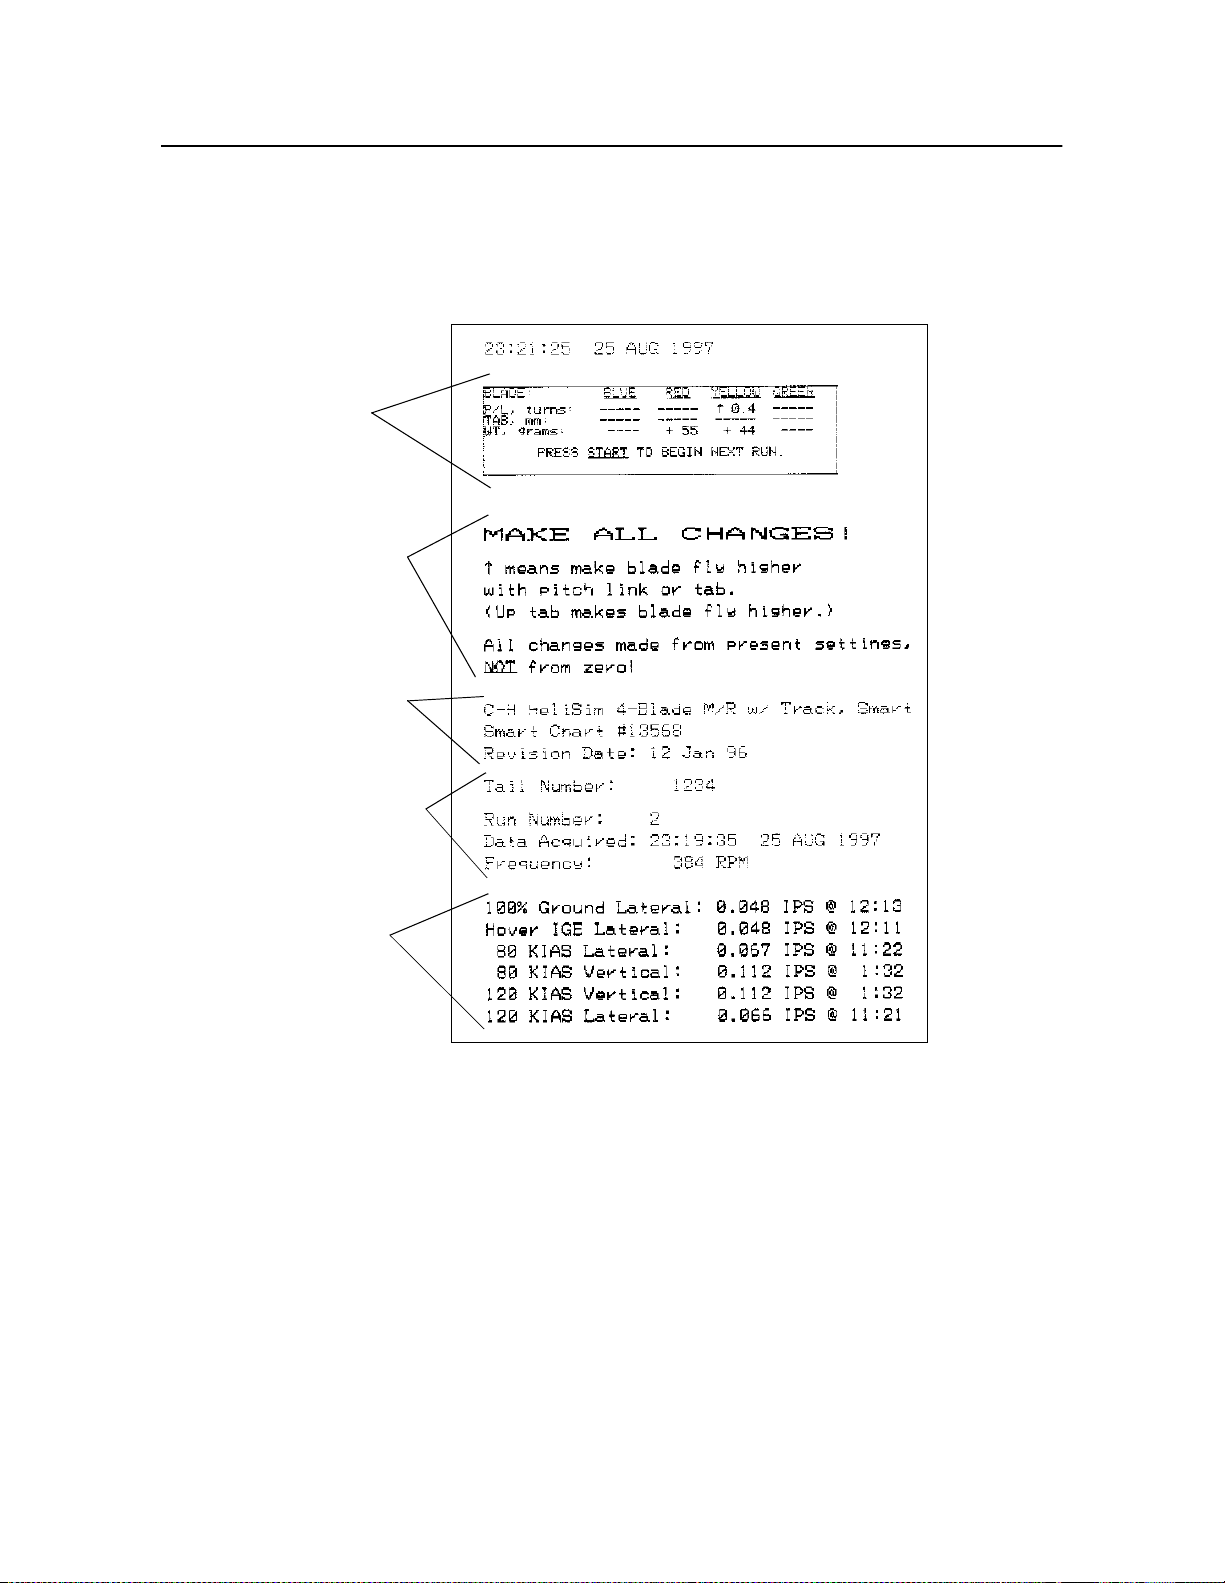
Chapter 8
- Using Printout
8.2 Reading 8500C/C+ Printouts
Figur e8-1 below and Fi gure8-2 o n page8-3 show a samp l e 8500C/C+ soluti on p ri nto u t. Refer to this
printout exa m pl e with the addition al ex p lanations given lat er in this section.
SOLUTION
SCREEN
DIRECTIONS
TO THE USER
BASIC CHART
INFORMATIO
N
TAIL AND RUN
NO., DATE, AND
AZIMUTH
VIBRATION
BALANCE
READINGS
FOR EACH
REGIME
Continued on the next page.
Figure 8-1. Solution Printout (Part1)
8-2
Chadw i ck-Helmuth Company, Inc.
Page 93
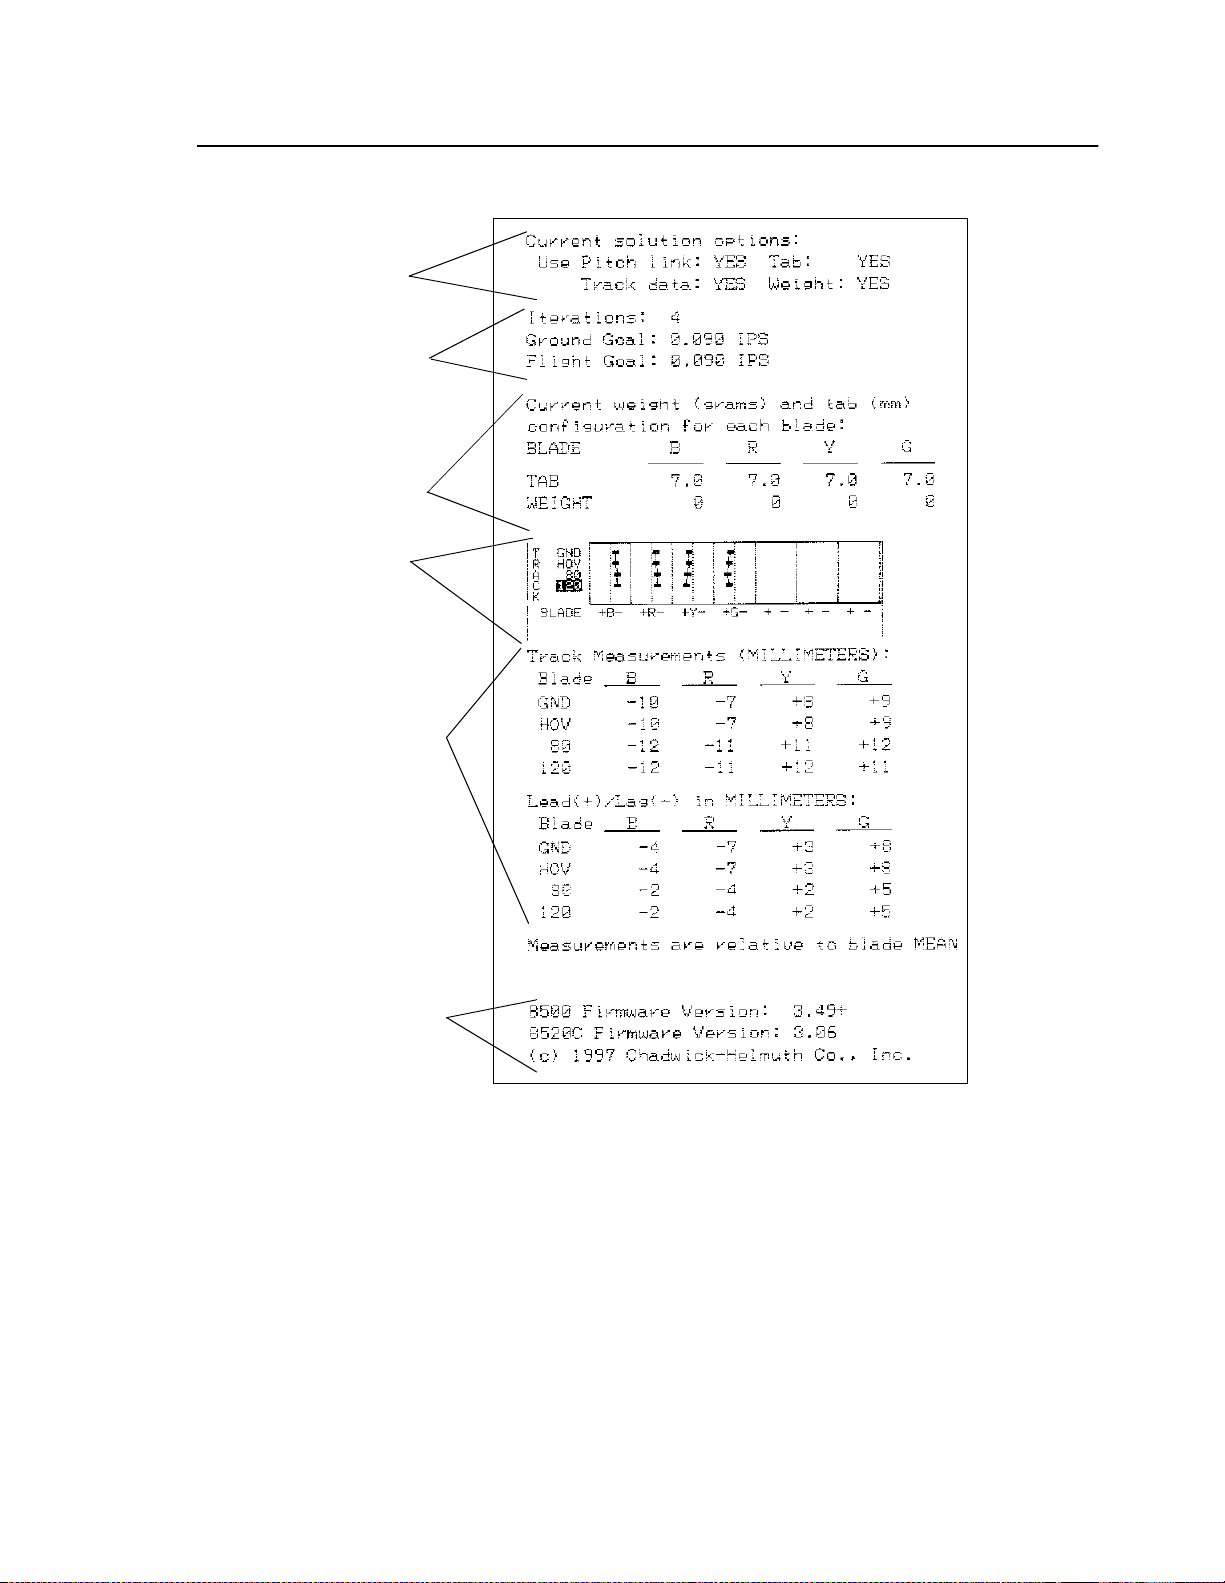
Continued from the last page.
SOLUTION
OPTIONS
ITERATIONS
AND GOALS
SWEEP,
WEIGHT, AND
TAB
SETTINGS
FASTRAK
TREND SCREEN
PRINTOUT
FASTRAK
MEASUREMENT
READINGS FOR
EACH BLADE
Reading 8500C/C+ Printouts
BASIC 8500C/C+
INFORMATION
Figure 8-2. Solution Printout (Part2)
Your current main rot or s o l uti on p r i nto u t may differ from t hi s ex a mple in mi no r re spects . Data varies,
depend ing on which chart settings, opt io ns, and/or chart version you are using.
Mode l8500C/8500 C+ Operators Manual
8-3
Page 94

Chapter 8
- Using Printout
Printout Explanation List
The followin g l ist e xp l ains th e call-out notes i n F i gu re8-1 o n page8-2 an d Figure 8 -2 on page8-3 in
greater detail:
Solution Screen
Directions to the User
Basic Chart Information
Tail and Run No.
Date
Azimuth
Vibration Balance Readings
Solution Options
Printout illust r ation reproduces fo r you a copy of the Solution screen
display ed o n th e 8500C/C+ at the t i m e the solution i s generated.
Gives you brief directions on how to read the printout solution
informat i on, i n cl u d ing s ym b o ls, terms, and how t o make ch anges.
Gives you the name, pa rt nu mber, and revision date of the current balance
chart.
Tells you the following information:
• Subject aircraft tail number
• Current r un number
The date and time the current data was collected.
Shows the azimuth frequency as measured by the magnetic pickup or
Photocell.
Gives you all the balance measurements acquired by the 8500C/C+ up to
the point when the current solution was generated. These measurements
are broken down by eac h channe l (as acqu ir e d b y each Model7310
Velocimeter) and each regime .
Tells you which s o luti on param eter s th e 8500C/C+ is tak in g into account
in calcu la t ing yo u r s olution.
YES
means the 8500C/C+ is assuming in its
calculat ion s, th a t you can change the item li s te d , f o r exa mp le tri m tab or
pitch link , in implementing your s olution. You may cha n g e the solution
options by accessin g th e Solution Op tion scree n (press
8500C/C+ de fau lt is all options set to
YES
.
SOLN OPTS
). The
Iterations and Goals
Settings
FasTrak Trend Screen
FasTrak Measurements
8500C/ C+ Inf orm ation
8-4
Chadw i ck-Helmuth Company, Inc.
Establish es the confide nce level of t he current set of s o lut ions. Iterations
refer to in t ern al calculation s within t h e 85 0 0C /C+. If the Flig h t Goal
figure is les s th a n th e highe st in-fli g ht vibra ti on b alance reading (see
above), then yo u r cur r e n t sol u ti o n is l i kely to achieve optim um balance
for the aircraft.
Lists the current weight and trim tab settings for each blade.
Gives you FasTrak trend information. See the FasTrak Operators Manual
for de tails .
Gives you track height and lead-lag information, as acquired by th
FasTrak.
Shows b asic 850 0C / C+ information , in c lud i ng t h e cur r en t 8 500C/C+ and
Mode l8520C Signal Selector firmware version numbers.
Page 95
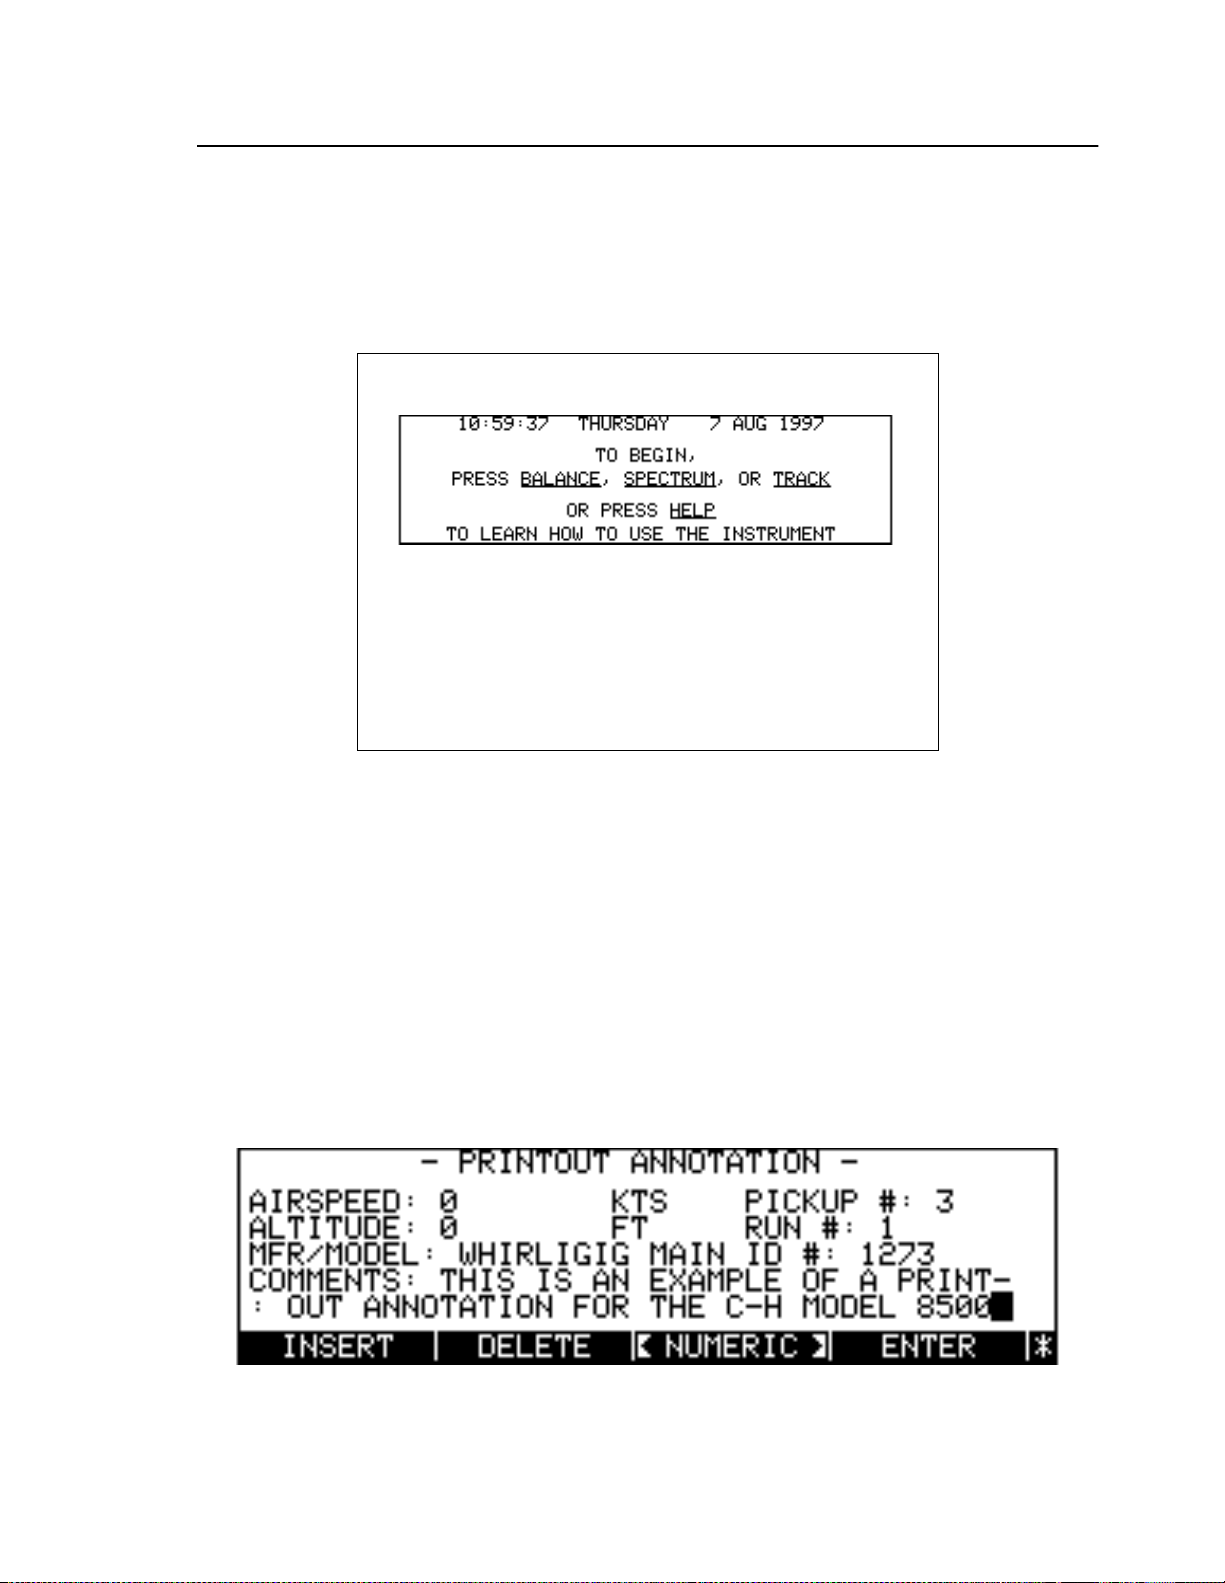
Annotating Pri ntouts
8.3 Annotating Printouts
In addition t o balanc e s olut ion and measure men t data, some 8500 C /C+ printout s a re further amended
to inclu de spec if ic i nf ormation per t i n e nt to the sc r ee n b ei ng pr i nted. Be sur e to read this i nformation.
See the print out annotati o n e xamp l e in Fi gure8-3 below.
13:30:18 7 Aug 97
AIRSPEED: 0 KTS PICKUP #: 3
ALTITUDE: 0 FT RUN #: 1
MFR/MODEL: WHIRLIGIG MAIN ID #: 1273
COMMENTS: THIS IS AN EXAMPLE OF A PRINTOUT ANNOTATION FOR THE C-H 8500C/C+
Figure 8-3. Sample Printout With Annotation
Adding the appropri a te informat i on to the annotation can b e ex tr e m e l y he lp f u l in identifying and
documen ting the work performed on a particular aircraft. You may wish to modify the existing
annotation fi e l d s or subs tit ut e on e or more new data fiel ds of yo u r own.
8.3.1 Printout Annotation Screen
To edit the printou t ann o ta t ion, press the
display s the Printo u t A n no tati on screen (see F igure8-4 bel o w a nd Figure8- 5 on page8-6). The
Printout Annotation screen shows the annotation data fields and labels, as they appear on each
printout. You may edit any of the fields and labels, as you wish.
ANNOTATE
key. The 8500C/C+ enters its edit mode and
Figure 8-4. Printout Annotation Screen
Mode l8500C/8500 C+ Operators Manual
8-5
Page 96
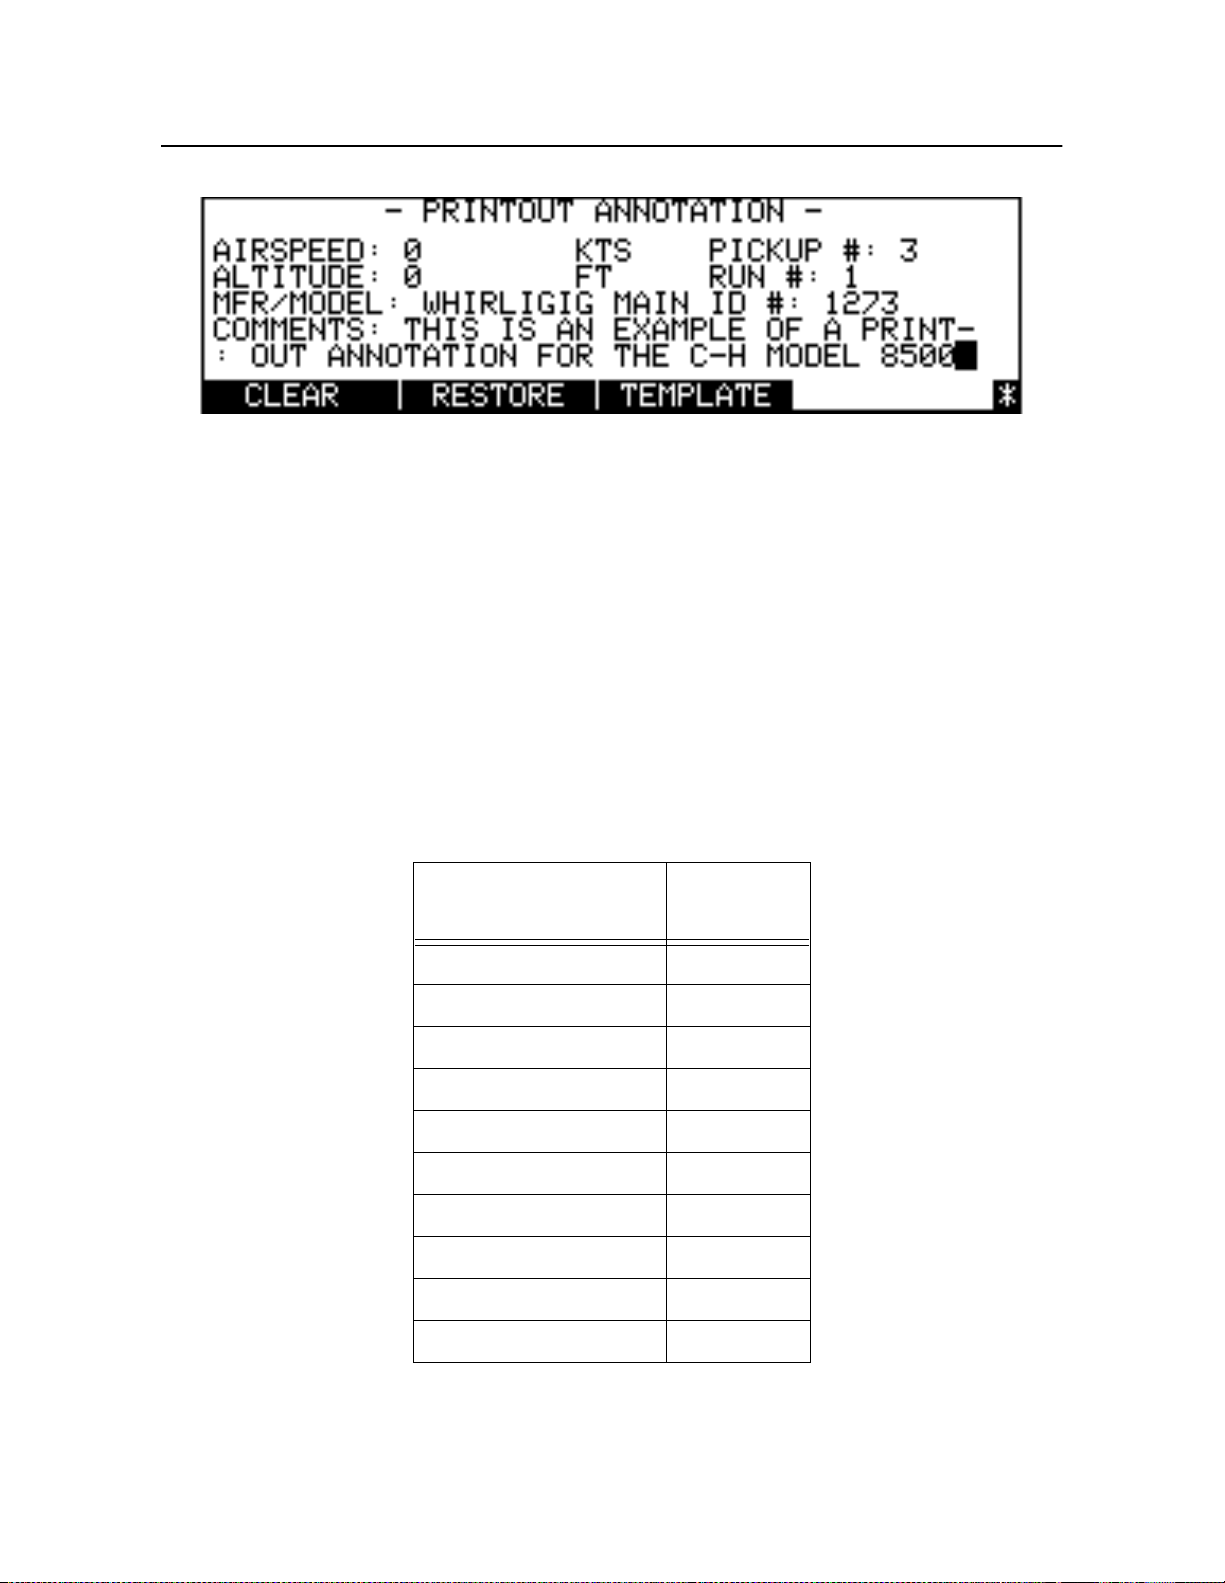
Chapter 8
- Using Printout
Figure 8-5. Additional Printout Annotation Screen Soft Keys
The rest of this section ex pla i ns ba s ic pr ocedures for editing 8 500C / C + printout annotations.
8.3.2 Alpha and Nume ric Editing Modes
The annotatio n editor can operate in one of two modes, each of which assign s different functions to the
8500C/C + keypa d k eys. In alp h a mode each key is mappe d to the v a lue o f the charact er printed on the
upper left corner of the key. Pressing the key displays the appropriate character at t he current curso
position.
In the numeric mode the numeric keypad keys assume the values of the printed numbers. Pressing the
key thus displays t h e appropr ia te number at the curr en t cursor position. The
PRINT
, and
MORE KEYS
keys revert back to their primary functions. Other keys are mapped to th
SHOW/HIDE, HELP
special characters printed on the lower right corner of the key (see Table8-1).
,
Table 8-1. Special Character Keys
Key
BALANCE
SPECTRUM
TRAC
LOAD
STORE
STATUS
SETUP
ANNOTATE
START
STOP
Toggle the
Note that in numeric mode there are several additional soft keys that may be accessed through the
MORE KEYS
<ALPHA>/<NUMERIC>
key.
soft key to switch between the alpha and numeric editing modes.
Special
Character
:
#
%
<
>
.
/
*
*
8-6
Chadw i ck-Helmuth Company, Inc.
Page 97

Annotating Pri ntouts
8.3.3 Moving the Cursor
The cursor may be positioned within a data field or moved to a new one. In the alpha mode only the
Left and Rig htAr rowkeys can move the cursor. If the cursor is moved beyond the range of th
selected fi el d , i t automatically goes to the beginning of th e ne arest field in the dir ec t ion i ndica t ed by
the Arro wkey.
In the numeric mode, the
Left and Rig h t Arr owkeys . The
The
START
the cursor up or do wn one line of the display.
key moves it to the beginning of the previous field. The Upand D ownAr rowkeys move
START, STOP
STOP
, and U pand Do wnArr owkeys can be used in addition to the
key advances the cursor to the beginning of the next data field.
8.3.4 Modifying Annotations
Characters may be entered as described above. In addition, th
between characters. Data field characters to the right of the space are moved in that direction. If the
entire templ ate is bei ng edited, the rest o f the line moves t o the right.
DELETE
The
right move to the left one space. If the entire template is being edited, the rest of the line moves left.
soft key delet es the c h ara c t e r at the curr en t curso r posi tion. Data field char act er s to the
INSERT
soft key inserts a space
8.3.5 Saving Annotations
After making all the desired changes to the annotation fields, press the
changes, quit the Setup screen, and resume operations. The saved annotation appears on all subsequent
printouts.
ENTER
soft key to enable the
8.3.6 Restoring Annotations
Changes t o t he dis p la y fi e lds of the ent ire annotat i on s cr een can be remov e d an d the last entered
ENTER
RESTORE
opera t ion ar e l ost.
RESTORE
soft key fr om numeric mode . Those
soft key restores the last entered
contents r estored by pressing
values tha t have been modified since the last
If the entire annotation template is being edited, the
template.
MORE KEYS
and the
8.3.7 Clearing Annotations
Changes t o t he dis p la y fi e lds of the ent ire annotat i on s cr een can be cleared by pr essing
and the
If the entire annotation template is being edited, the
enter a new template or press
CLEAR
soft key from the numeric mode. The field labels are preserved.
RESTORE
CLEAR
to restore the last entered template.
soft key clears the entire screen. You may
Mode l8500C/8500 C+ Operators Manual
MORE KEYS
8-7
Page 98
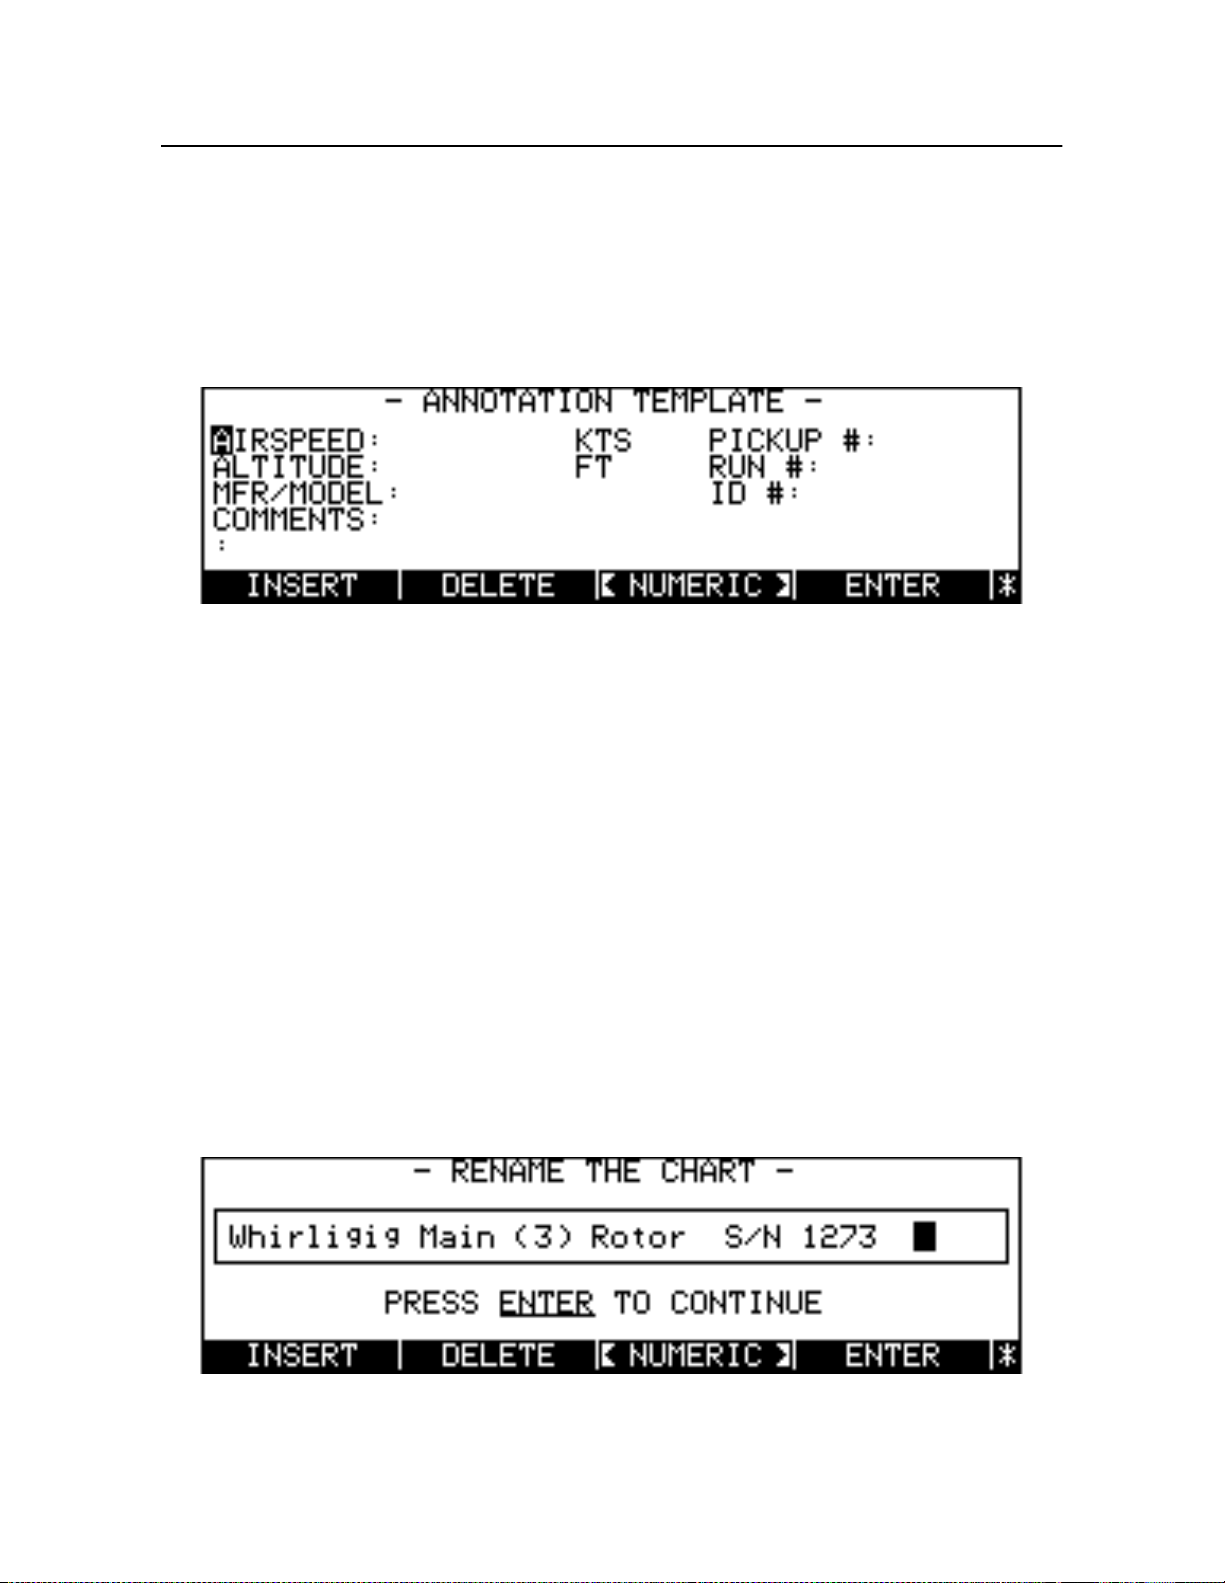
Chapter 8
- Using Printout
8.3.8 Editing Annotation Templates
TEMPLATE
The
appear before the data fields (see Figure8- 6). Editing functions now operate on all characters in th
display line, and the
In the numeric mode, the
respect iv ely.
NOTE: Lab els and t heir data fields are sepa r at ed by a colon (:). All new labels must be
similarly terminated.
soft key allows you t o modify the entire ann otation scr e en , including th e labels that
ENTER, CLEAR
START
and
RESTORE
, and
keys mov e the cu rs o r to the beginni ng an d end of the line,
STOP
soft key s on both t he data fields a nd the i r labels.
Figure 8-6. Annotation Template Screen
Pressing
permanent default template to be restored. Any modifications to the display fields and their labels ar
lost, as are all previously ent ered templates.
TEMPLATE
enables a new soft key, the
ORIGINAL
soft key. Pressing
ORIGINAL
causes th
8.4 Renaming Balance Charts
Since ba la n ce cha r ts may be sto red t o disk, y ou also have the optio n of re n ami n g the chart before it is
actually written. This option is especially important in the case of a corrected balance chart, where the
correction factors for phase angle and vibration amplitude now contained in the chart are specific to an
individual rotor system. To edit a balance chart name, press
charts. Highlight the chart to be renamed and press th
screen a n d put t he 8500C/C+ into the e d it mo de (see Figur e 8- 7 ). The soft keys a nd procedures used
here are nea rly identical to thos e us ed t o edit the pri nto ut annotation . T he only exc e ptions are the use
of the
START
and
keys, which tab five spaces to the left and right, respectively.
STOP
SEL CHA RT
RENAM ECHT
to display the list of ava il a ble
soft key to invok e th e Edit
8-8
Chadw i ck-Helmuth Company, Inc.
Figure 8-7. Balance Chart Edit Screen
Page 99

Renaming Balance Charts
The Balance Chart Edit screen displays the selected chart name, along with the
<ALPHA>/<NUMER IC>
CANCEL
chart name. The
soft keys. Use
CANCEL
editing soft keys. Pressing
CLEAR
and
RESTORE,
as described earlier, to clear and restore the balance
MORE KEYS
displays the
soft key undoes any modifications made during this editing session and exits
the edit mode.
INSER, DELETE
CLEAR, RESTORE
, and
, and
Mode l8500C/8500 C+ Operators Manual
8-9
Page 100

Chapter 8
- Using Printout
8-10
Chadw i ck-Helmuth Company, Inc.
 Loading...