

Page 1
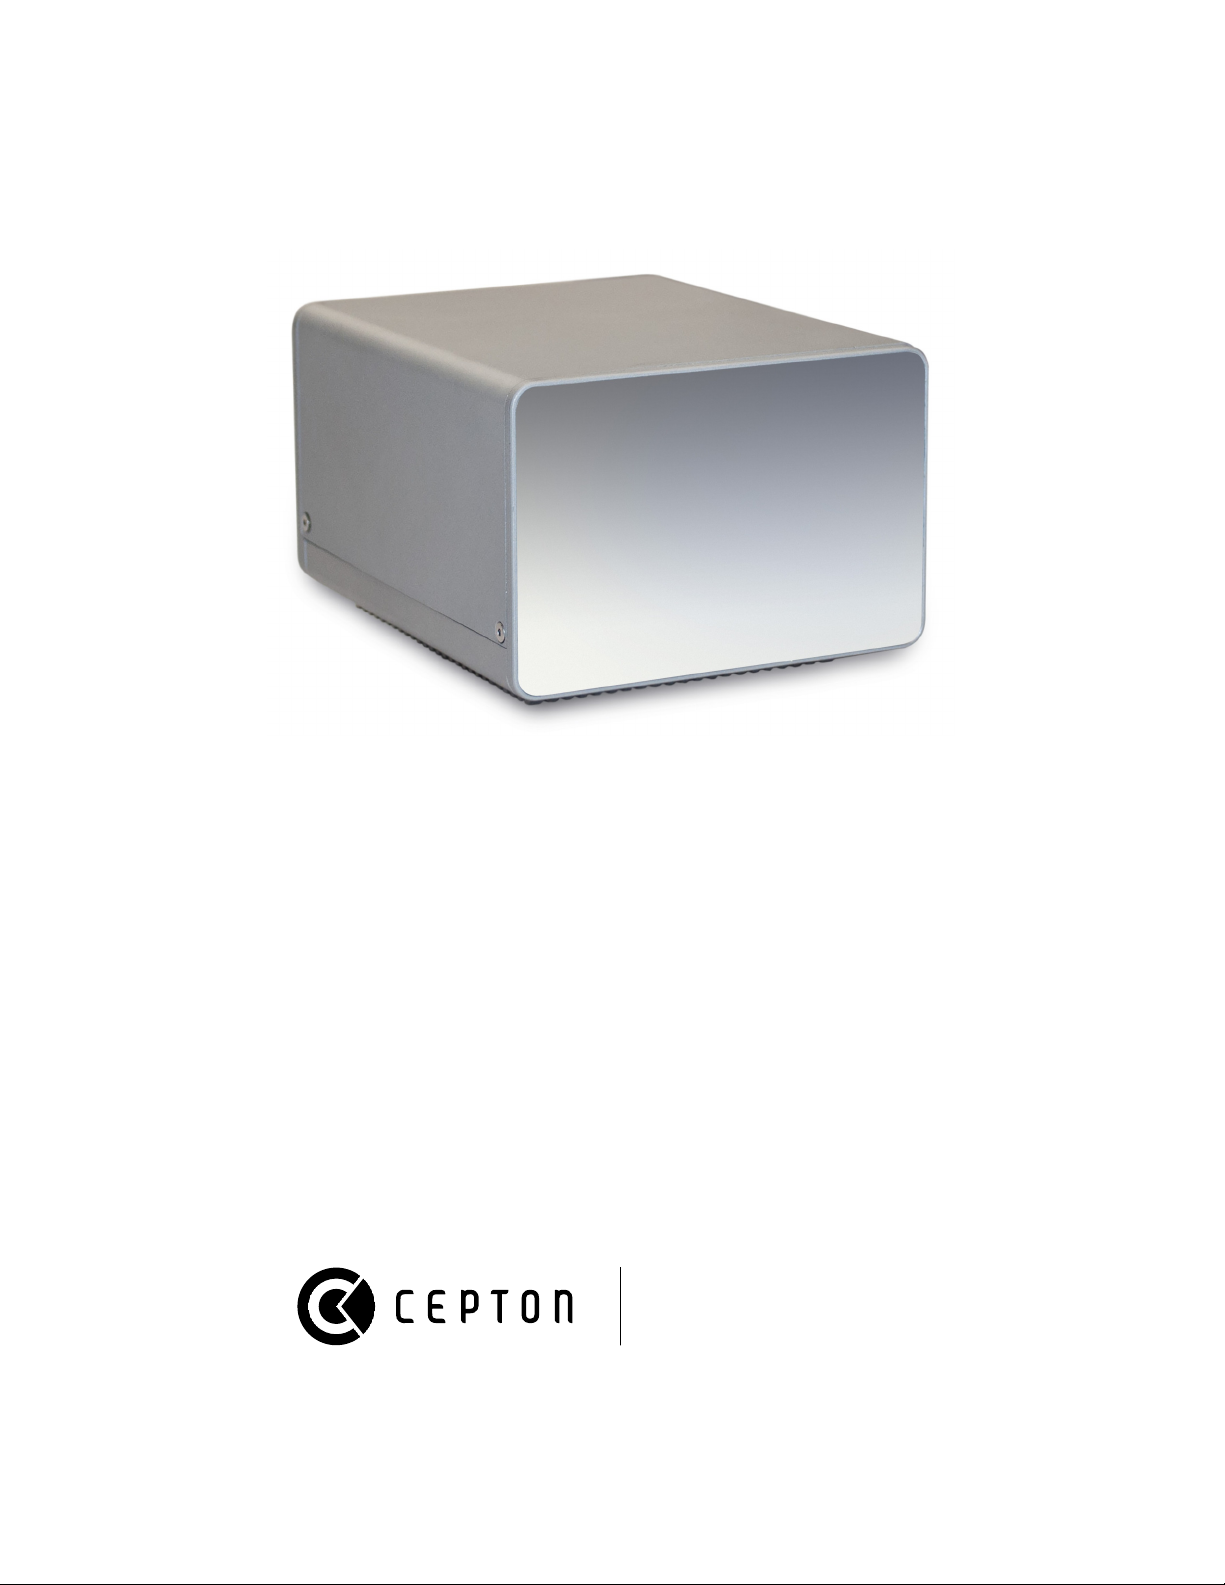
SORA 200
User Guide
Page 2

2
4
5
6
8
10
13
14
15
18
20
22
23
24
Table of Contents
Table of Contents
Revision History
Warnings
Specifications
Getting Started
CeptonViewer
Data Exporter
Configuration
SDK
ROS
Accessories
Troubleshooting
Cables
Drawings
Page 2 of 25
Page 3

Page 3 of 25
Page 4

Revision History
Date Version Description
14 Nov 2017 1.0 Initial Release
© 2017-2018 Cepton Technologies, Inc. All rights reserved.
Page 4 of 25
Page 5

Warnings
The sensor is Class 1 eye safe.
Page 5 of 25
Page 6
Specifications
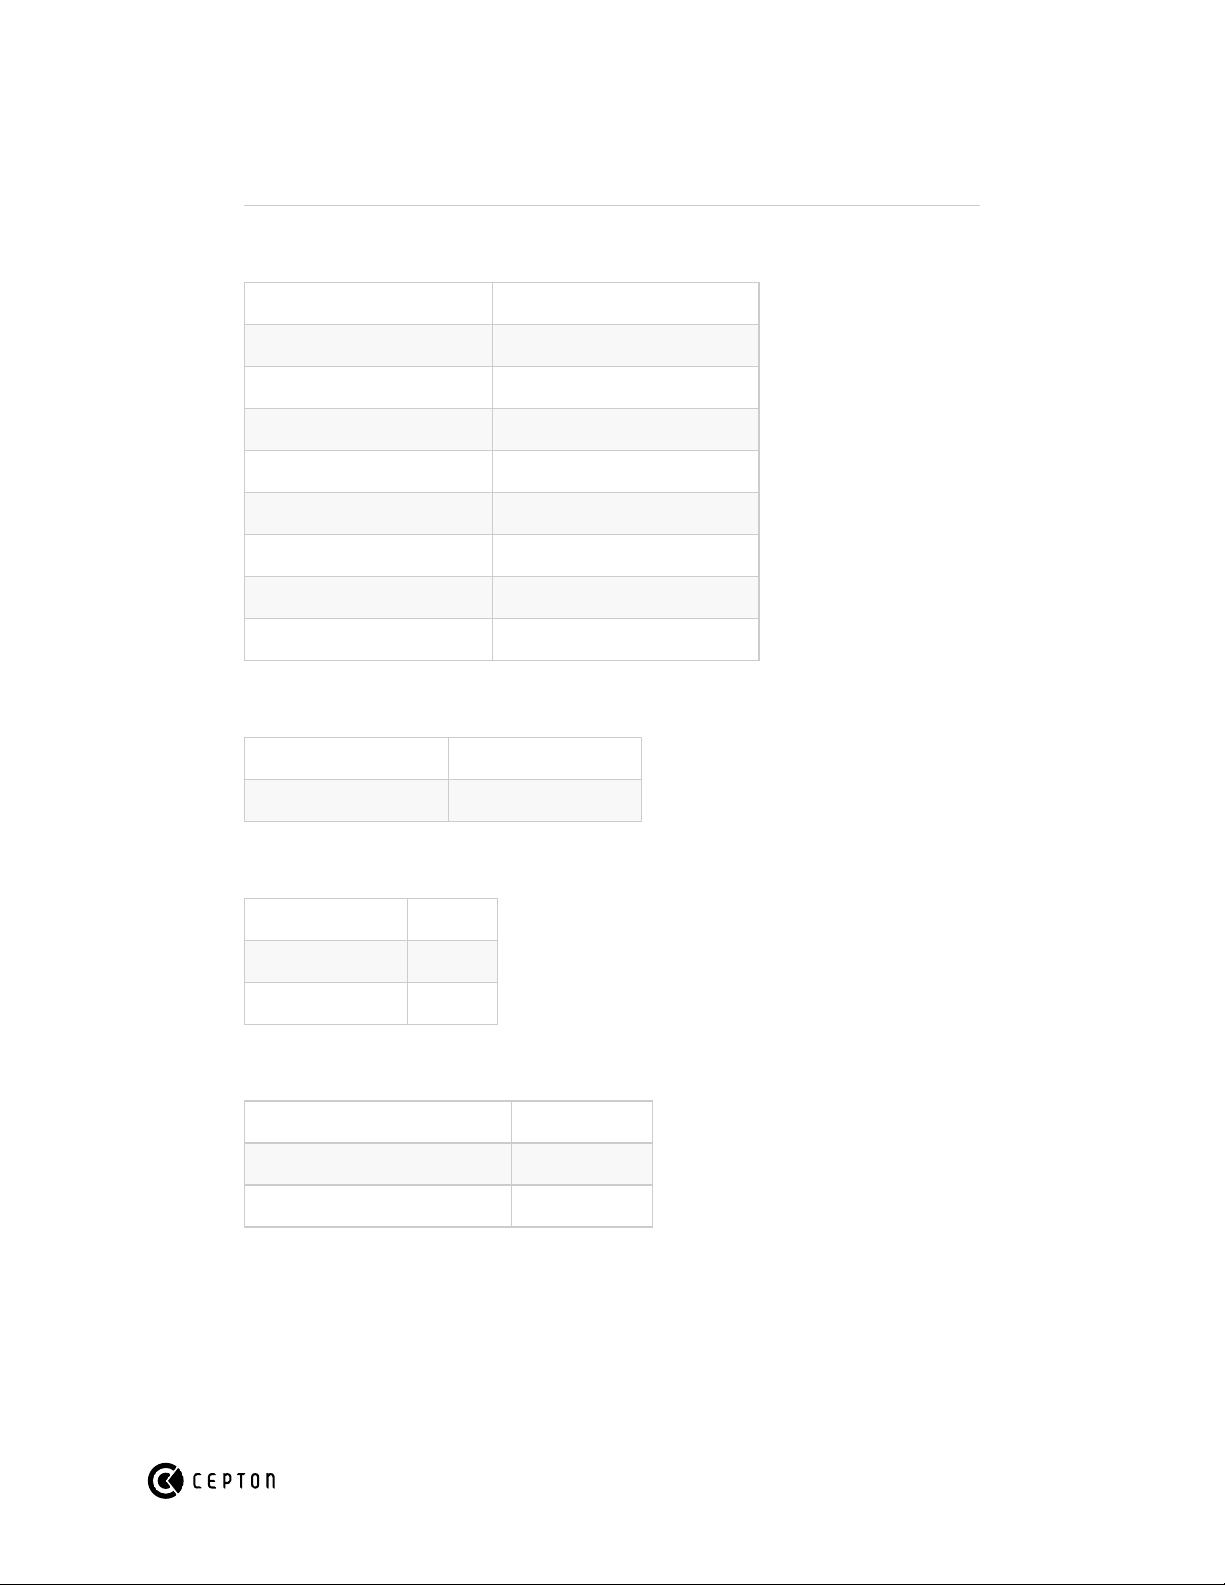
Performance
Angular Resolution (H x V) 0.2°
Data Rate (points per second) 102400
Detection Range 1m - 200m
FOV 60° x 18°
Frame Rate 200Hz
Lines (H x V) 300 x 2
Output 100 Mbps Ethernet, UDP Packet
PPS/NMEA Yes
Range Resolution 2.5cm
Mechanical
Dimensions (W x D x H) 8.9cm x 6.6cm x 10cm
Weight 550g
Electrical
Input Power 12W
Input Voltage 12V DC
Laser Wavelength 906nm
Environmental
Environmental Protection IP67
Ambient Vibration 2G
Ambient Operating Temperature -20°C to 65°C
Page 6 of 25
Page 7

Aerial Mapping
Given a SORA sensor mounted vertically on an aerial platform, moving perpendicular to the scanline
direction, the following equations estimate mapping point density:
height [m]: sensor height above ground
speed [m / s]: speed perpendicular to scanline direction
sweep [m]: ground sweep distance along scanline direction
density [points / m^2]: points per ground area
sweep = ± 0.58 ∗ height
density =
1e4
height ∗ speed
Page 7 of 25
Page 8
Getting Started
Website: http://www.cepton.com/
Developers: https://github.com/ceptontech/
Mounting the Sensor
The sensor vibrates during normal operation. If not properly mechanically isolated, it can cause
excessive audible noise or interference to other sensors that are sensitive to vibration. We
recommend mounting the sensor using vibration isolating rubber or foam. If using the sensor on a
tripod, ensure that the tripod is rigid and does not vibrate excessively when the sensor is powered on.
Connecting the Sensor
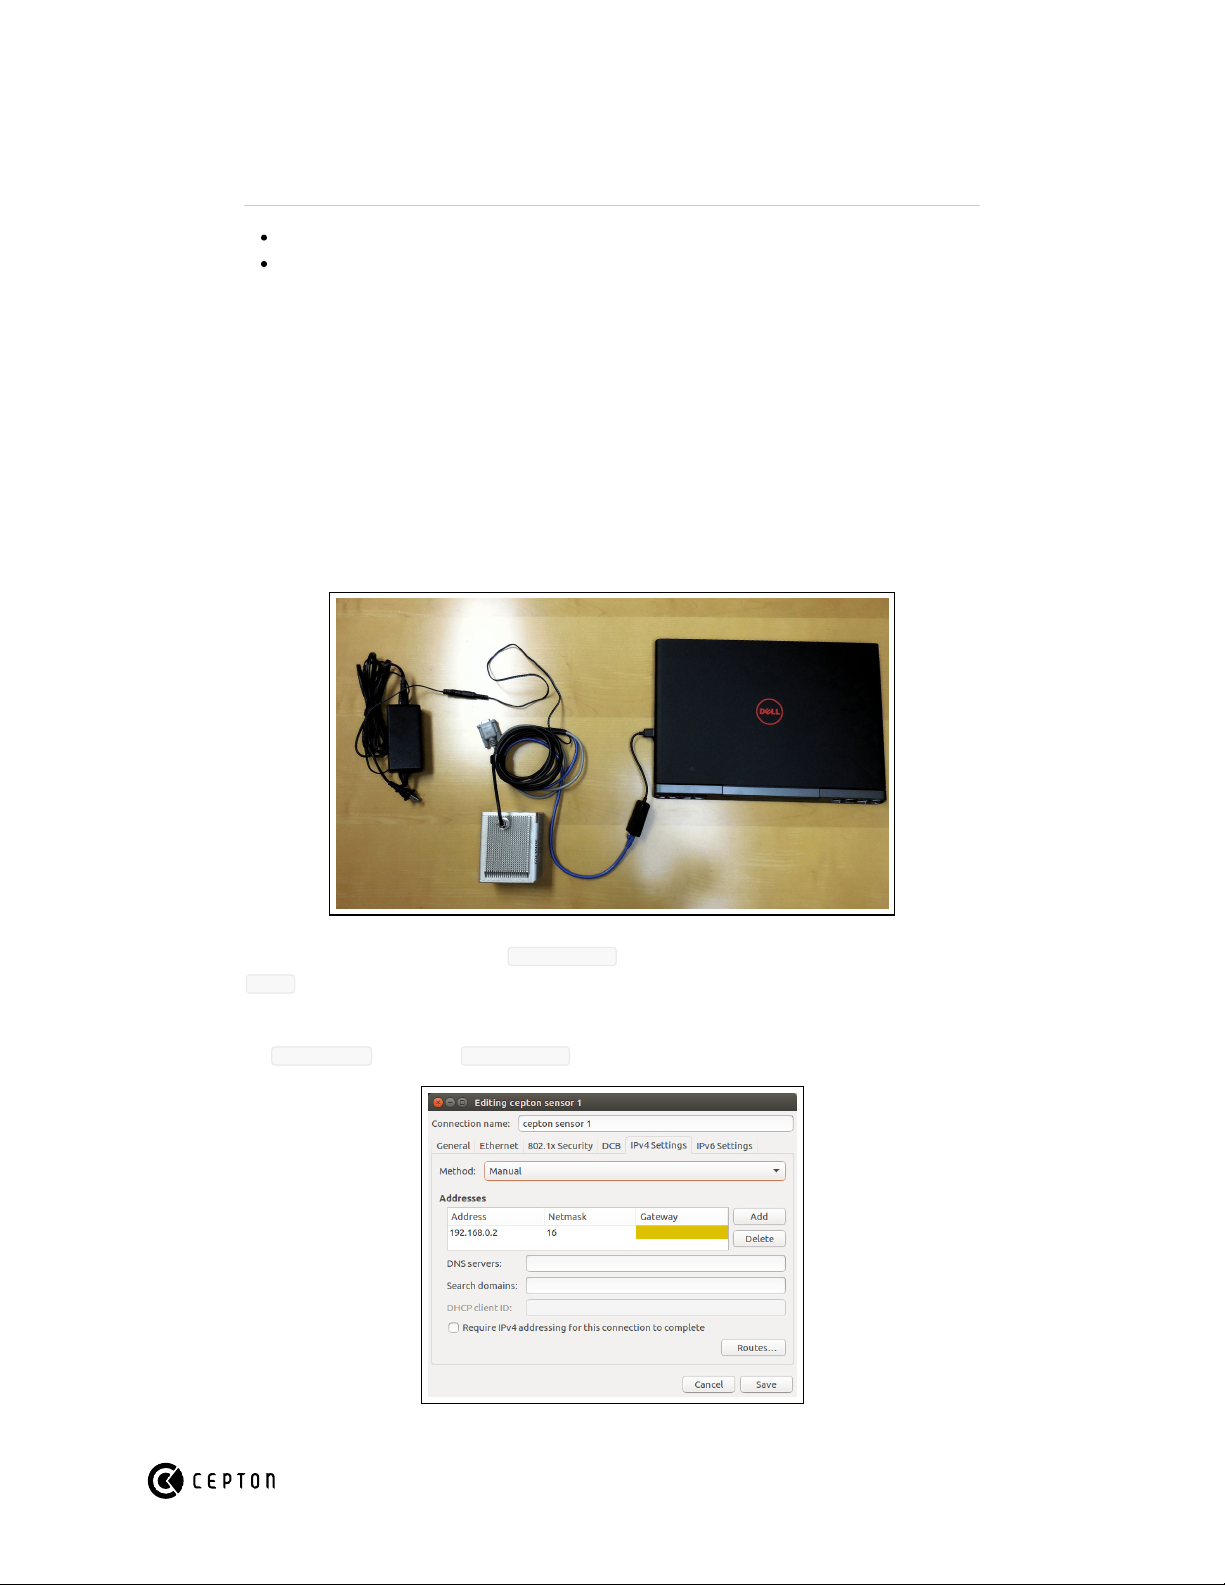
Connect the sensor's power cable (barrel plug) to the provided 12V power supply. Connect the
sensor's Ethernet cable to the host computer (we recommend using a USB -> Ethernet adapter).
The sensor IP address is of the form 192.168.*.* , and it sends UDP broadcast packets on port
8808 . The sensor will start sending packets as soon as the power is connected.
On Ubuntu, it is necessary to assign a static IP address to the host computer's Ethernet interface (e.g.
IP= 19.168.0.2 , Netmask= 255.255.0.0 ). This can be done through the NetworkManager GUI.
Page 8 of 25
Page 9

Visualizing the Data
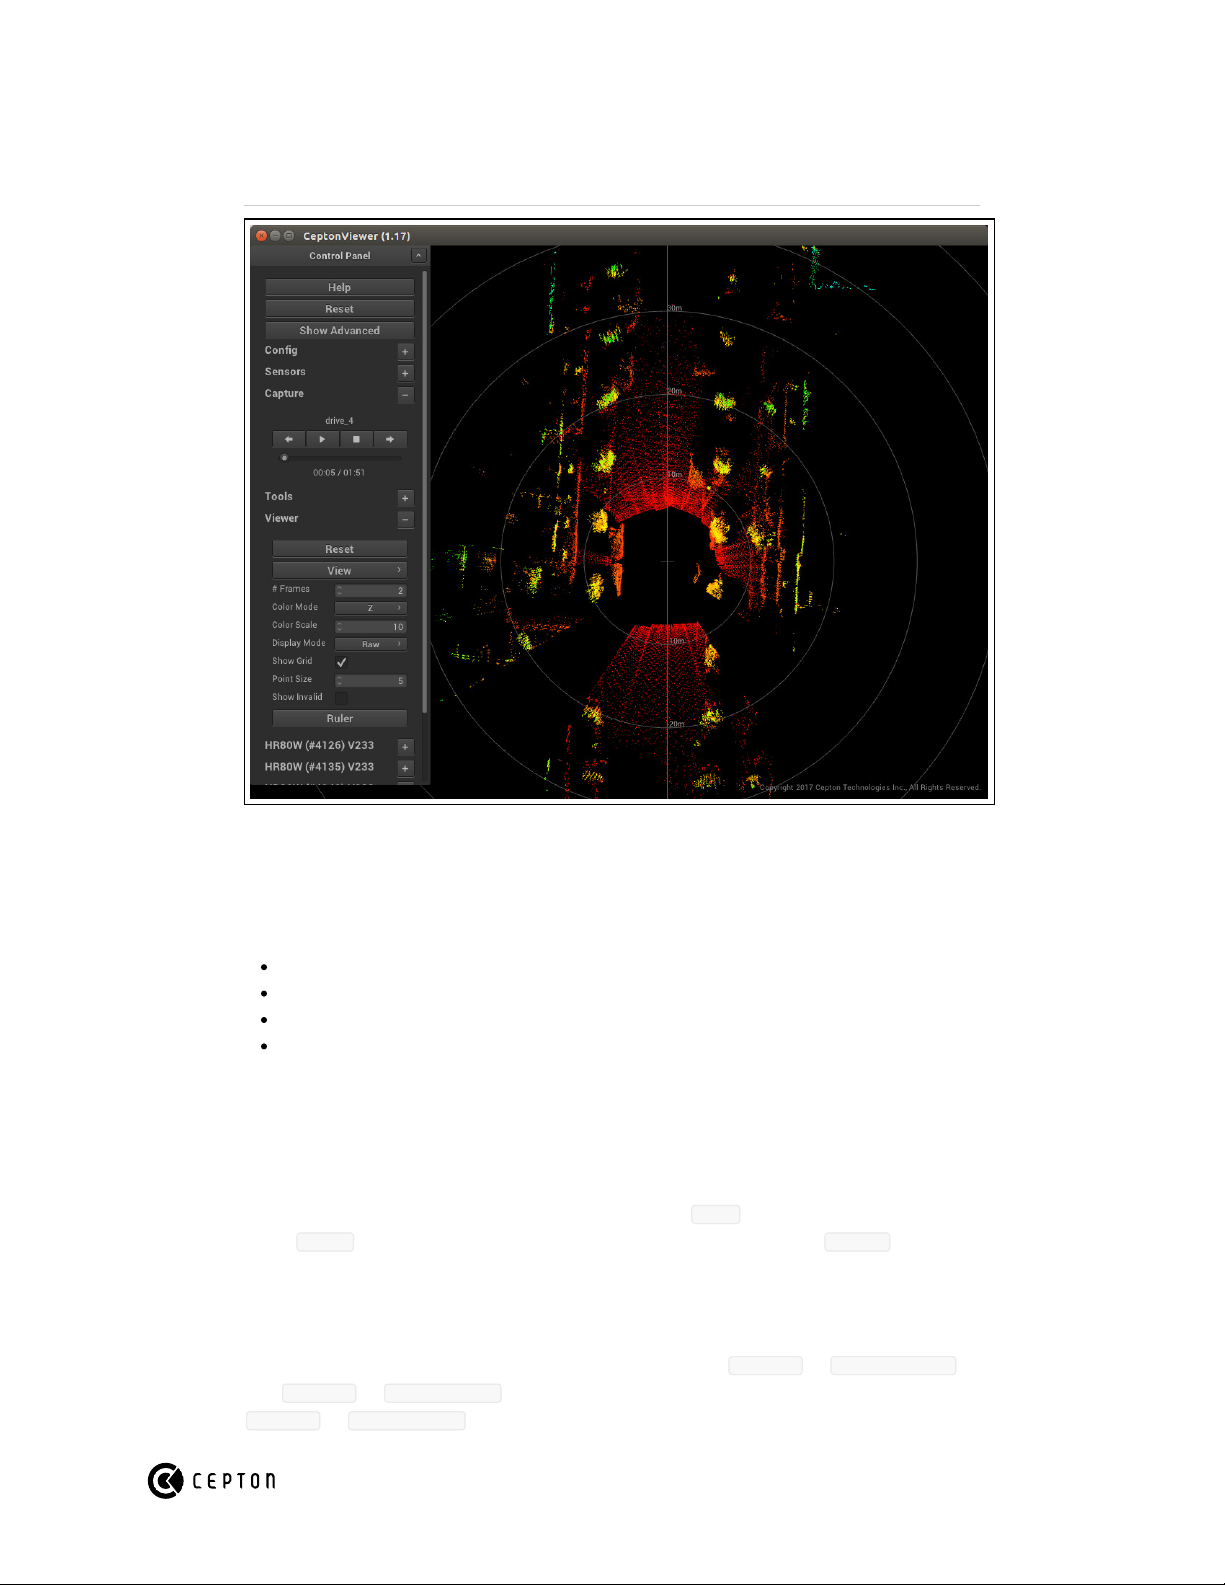
To start, download and run CeptonViewer. The sensor should appear immediately in the viewer. If it
doesn't, refer to Troubleshooting.
Capture
The Cepton tools support loading PCAP network capture files for reviewing sensor data offline. A
PCAP file can be saved using CeptonViewer, Wireshark, tcpdump, or any other network capture tool.
The PCAPNG file format is not supported.
To capture network traffic using tcpdump, run the following:
sudo tcpdump -i NETWORK_INTERFACE port 8808 -w OUTPUT.pcap
Page 9 of 25
Page 10
CeptonViewer
Downloads
CeptonViewer can be downloaded from our SDK repository:
https://github.com/ceptontech/cepton_sdk_redist.
Windows x64: cepton_sdk_redist/bin/win64/CeptonViewer.exe
Linux x64: cepton_sdk_redist/bin/linux-x86_64/CeptonViewer
Mac: cepton_sdk_redist/bin/osx/CeptonViewer
ARM x64: cepton_sdk_redist/bin/linux-aarch64/CeptonViewer
Getting Started
On Windows, a firewall popup will appear the first time CeptonViewer is launched. Select "Allow
access" for both private and public networks.
The main menu is located on the left side of the screen. Select Help to bring up a basic help menu.
Select Reset to reset the viewer. The visualization settings can be found in the Viewer sub
menu.
Capture
A PCAP network capture file can be saved in the viewer by clicking Capture -> Start Capture ,
then Capture -> Stop Capture when done. The capture file can then be loaded by clicking
Capture -> Load Capture or by dragging and dropping the capture file into the viewer.
Page 10 of 25
Page 11

Transforms
CeptonViewer has support for viewing multiple sensors either individually or combined. To view the
sensors combined, the sensor transforms must be specified. First, to enable transforms, ensure that
Show Advanced and Transforms -> Enable are both selected. The transforms can then be
either inputed directly in the viewer or loaded from a JSON file.
Viewer
To edit coordinate transforms in the viewer:
1. Open up the individual sensor menu at the bottom of the main menu. Select the Transform sub
menu, and edit the sensor's transform.
2. To save the transform to a JSON file, click Transforms -> File -> Save As... .
JSON
A JSON file can be loaded by clicking Transforms -> File -> Load .
Template:
{
"sensor_serial_number": {
"rotation": [x, y, z, w],
"translation": [x, y, z]
}
}
Sample:
{
"1": {
"rotation": [
-0.01264648623717563,
-0.0012783561222154416,
1.6168019276402304e-05,
0.9999192127017427
],
"translation": [
0.0,
0.0,
2.1087962181388047
]
}
}
Controls
GUI
Page 11 of 25
Page 12
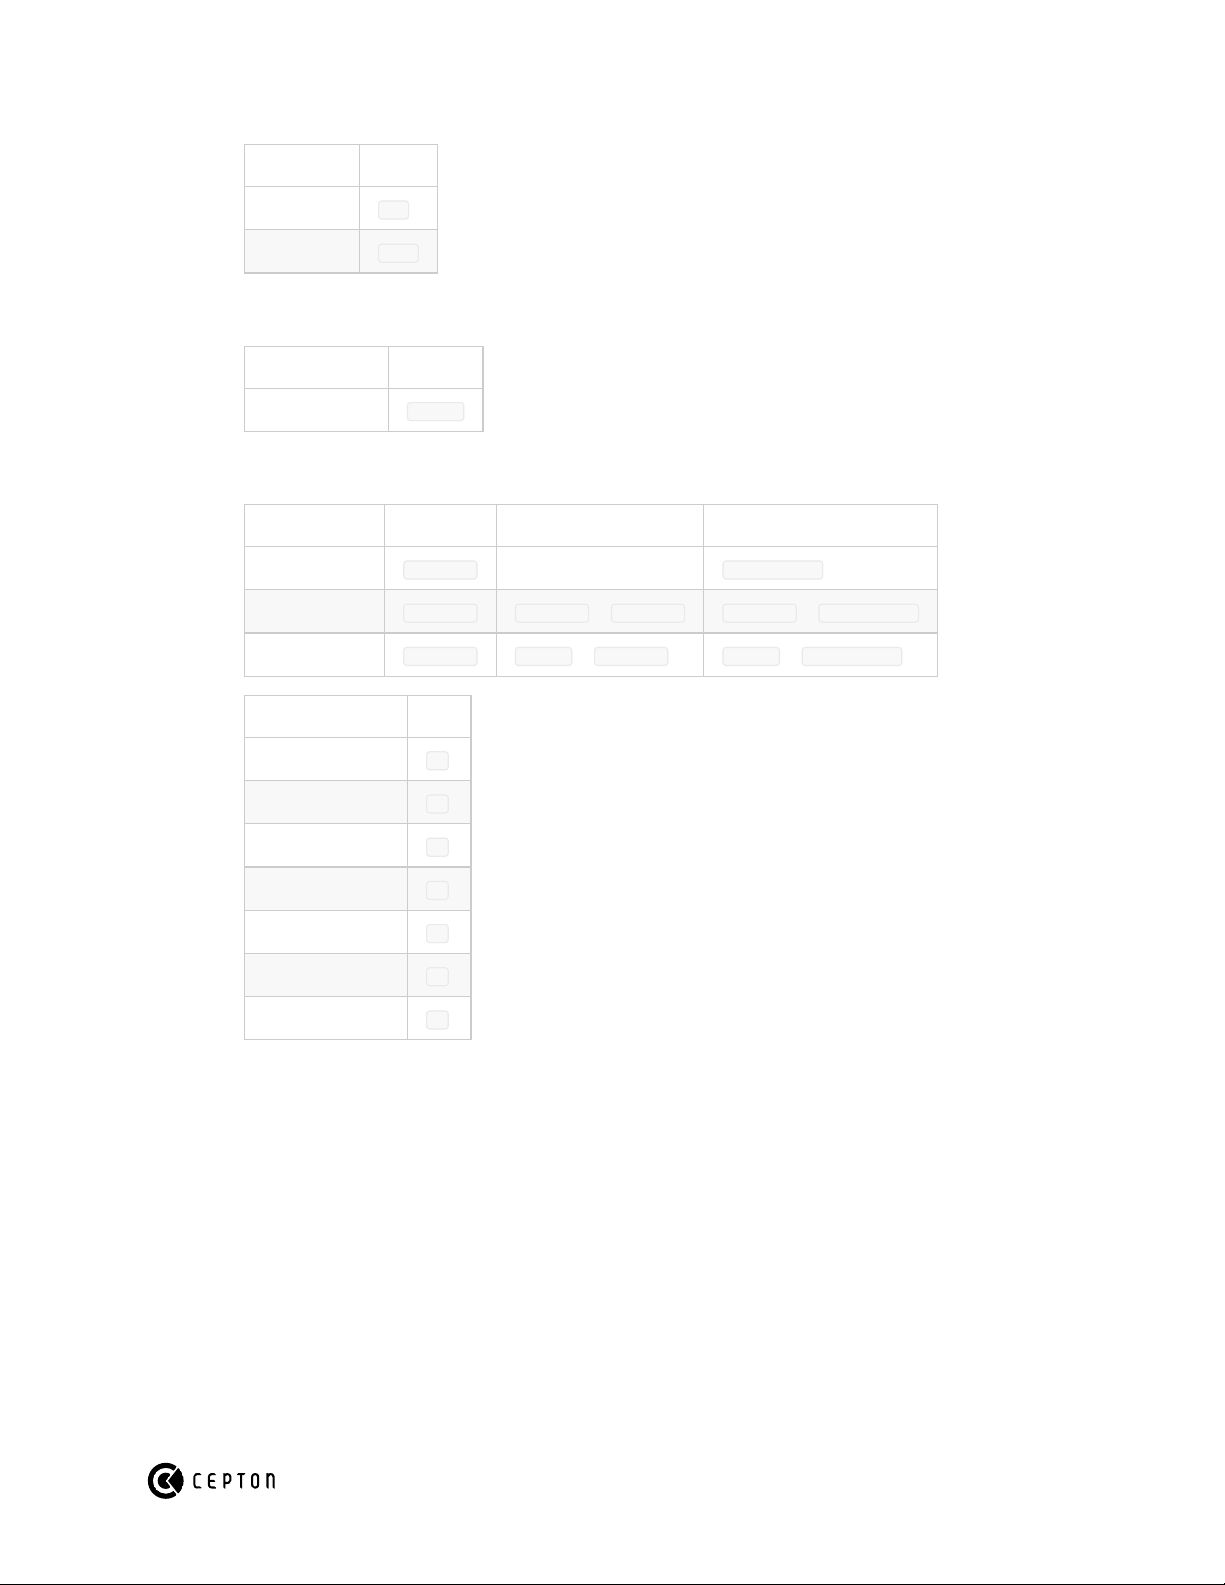
Command Key
Help F1
Hide GUI F11
Replay
Command Key
Pause/Resume SPACE
View
Command Mouse Keyboard + Mouse Keyboard
Rotate View LButton Arrow Keys
Translate View MButton Control + LButton Control + Arrow Keys
Zoom View RButton Shift + LButton Shift + Arrow Keys
Command Key
Reset View Origin O
Front View 1
Top View 2
Side View 3
Mirror M
Flip F
Perspective P
Page 12 of 25
Page 13

Data Exporter
Downloads
The data exporter can be downloaded from our SDK repository:
https://github.com/ceptontech/cepton_sdk_redist.
Windows x64: cepton_sdk_redist/bin/win64/data_exporter.exe
Linux x64: cepton_sdk_redist/bin/linux-x86_64/data_exporter
Mac: cepton_sdk_redist/bin/osx/data_exporter
ARM64: cepton_sdk_redist/bin/linux-aarch64/data_exporter
Usage
USAGE
data_exporter [OPTIONS] OUTPUT_FILE
DESCRIPTION
Exports Cepton LIDAR data to a file.
FORMATS
`csv`
CSV file format.
`bin`
Binary file format. Array of `CeptonSensorPoint` structs.
OPTIONS
-c CAPTURE_FILE
Load data from capture file.
-n N_FRAMES
Number of frames to capture. Default is 1.
-f FORMAT
Default is 'csv'.
--split
Create multiple output files with single frame per file.
Page 13 of 25
Page 14
Configuration
Serial Tool
The following sensor parameters can be configured:
Destination IP address (default: 255.255.255.255 )
Destination MAC address (default: ff:ff:ff:ff:ff:ff )
Destination port (default: 8808 )
Sensor IP address
Download the serial tool: http://cepton.com/downloads/cepton_serial_redist.py.
Install Python dependencies.
$ pip install ipaddress pyserial
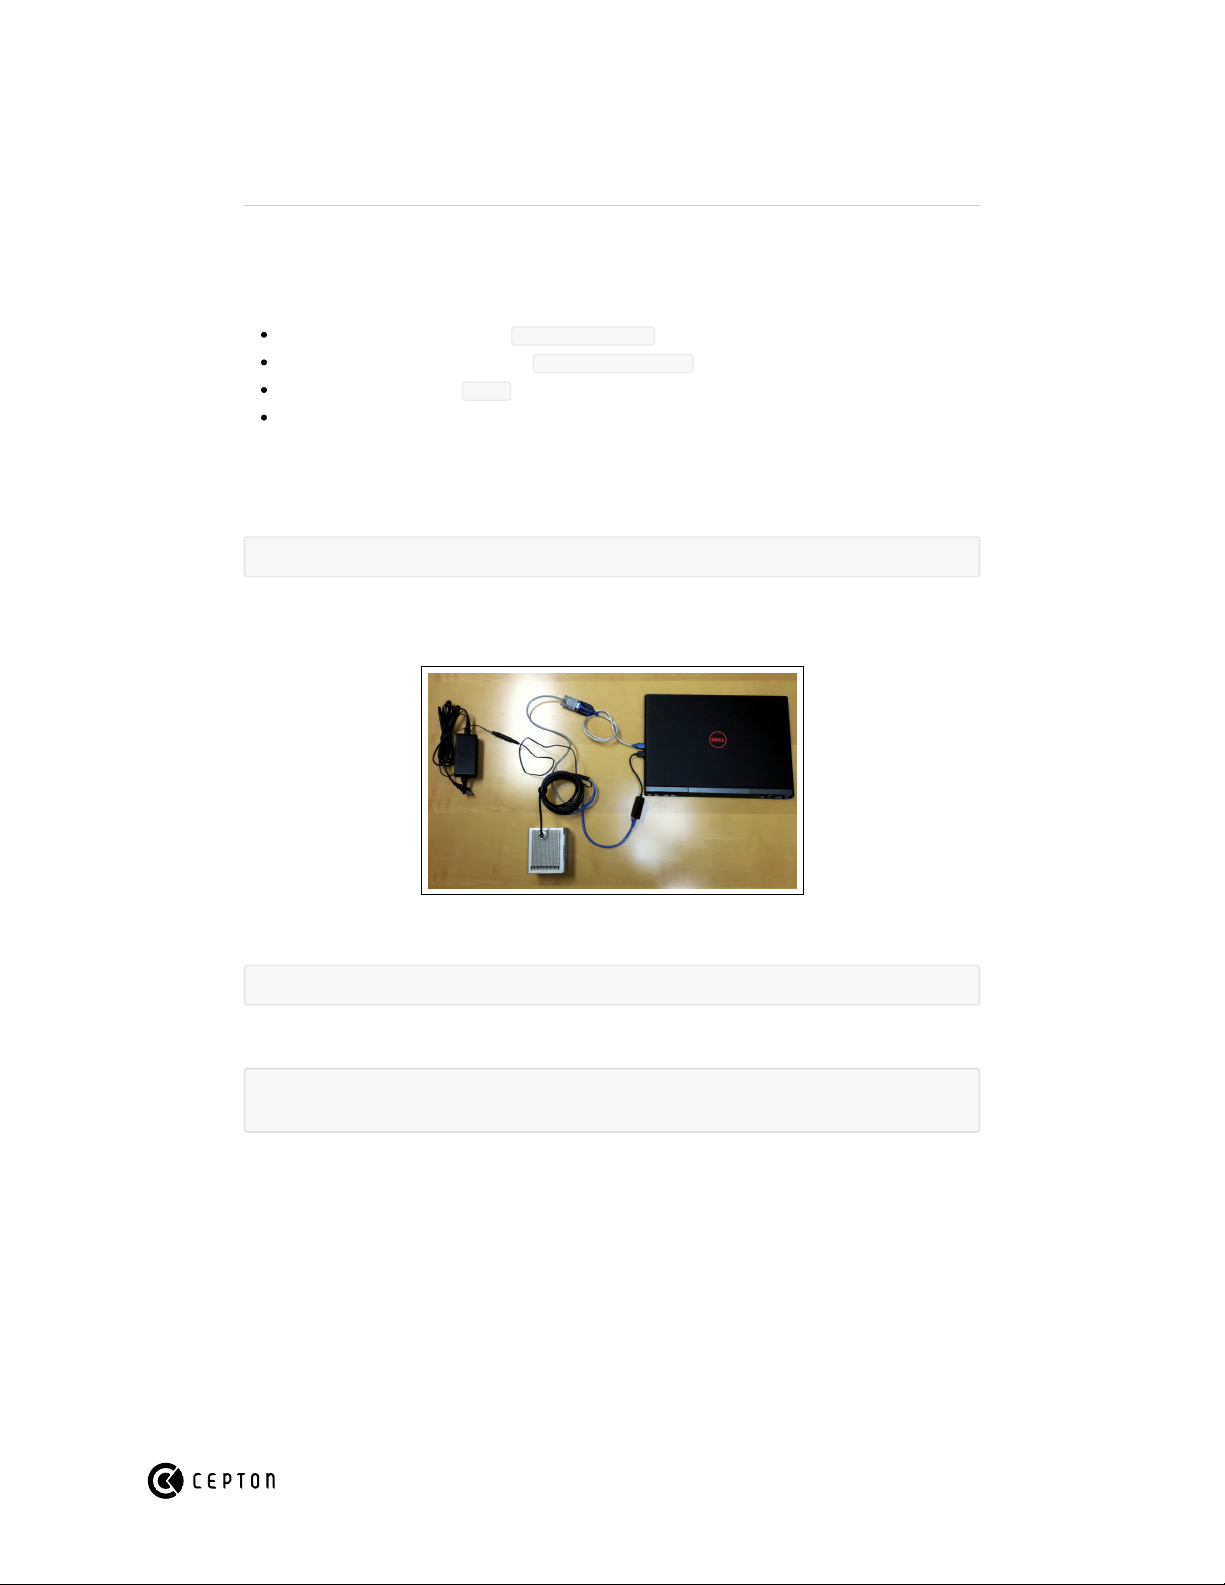
Connect the sensor's serial cable to the host computer using a serial -> USB cable. Connect the
sensor's power supply.
List the serial ports.
$ python cepton_serial_redist.py --list_ports
Run the serial tool.
$ python cepton_serial_redist.py --port PORT --serial SENSOR_SERIAL_NUMBER \
[OPTIONS]
Page 14 of 25
Page 15

SDK
Getting Started
Installation
Clone the Cepton SDK.
$ git clone --recursive [email protected]:ceptontech/cepton_sdk_redist.git
$ cd cepton_sdk_redist
Windows
$ mkdir build
$ cd build
$ cmake -G "Visual Studio 14 Win64" ..
$ start "cepton_sdk_redist.sln"
Unix
$ mkdir build
$ cd build
$ cmake ..
$ make
Basic Interaction
Initialization
To start interacting with the Cepton SDK, call cepton_sdk_initialize with an on_event
callback.
Page 15 of 25
Page 16

#include <cepton_sdk.h>
void on_event(int error_code, CeptonSensorHandle sensor,
struct CeptonSensorInformation const *p_info, int event)
{
if (error_code < 0) {
// Handle error
return;
}
switch(event) {
case CEPTON_EVENT_ATTACH:
// Handle new sensor
break;
case CEPTON_EVENT_FRAME:
// Handle new frame
break;
}
}
int main(int argc, char ** argv) {
cepton_sdk_initialize(CEPTON_SDK_VERSION, 0, on_event);
// Main code
cepton_sdk_deinitialize();
return 0;
}
Reference
Data
Timestamps
If your sensor has a GPS module connected, point timestamps will be based on the GPS clock,
otherwise they will be based on the host computer's clock.
Intensities
Intensity values are in the range [0.0, 1.0] . Intensity values default to 1.0 if unsupported by the
sensor/firmware.
Image Points
Image points are in camera image coordinates with a focal length of 1.0 . Sample code for
converting to 3D points can be found at samples/basic_interaction/point.hpp.
Notes
Page 16 of 25
Page 17

Multiple returns
To use multiple returns feature, the SDK needs to be initialized with
CEPTON_SDK_CONTROL_ENABLED_MULTIPLE_RETURNS control flag set.
Currently Cepton sensors only support up to 2 returns.
First return is always the strongest signal.
Second return is the last detectable signal if it is not the strongest. Otherwise it is the second
strongest signal detectable.
Second return can be empty if only one signal is detectable.
Some applications require the farthest return. Farthest detectable signal is guaranteed to be
always present in the list, compare the distance of the two returns to obtain it reliably.
Threading
Callbacks are invoked from a networking thread that is launched by cepton_sdk_initialize .
Callbacks should be short to avoid dropped packets. If you need more than ~1ms to handle a
callback, then the data should be handled asynchronously in another thread (e.g. through a
queue).
Callbacks are not re-entrant since they come from a single thread.
Page 17 of 25
Page 18

ROS
Getting Started
First, read the main Getting Started guide.
Installation
If you have not done so already, install ROS, and create a catkin workspace.
Change to the catkin workspace directory.
Clone the Cepton ROS driver.
$ git clone --recursive [email protected]:ceptontech/cepton_ros.git src/cepton_ros
Run catkin make.
$ catkin_make
Source the catkin setup script.
$ source devel/setup.bash
Running the demo
Ensure that the sensor is powered on and connected to the host computer.
Launch roscore .
$ roscore
In a separate terminal, launch demo_single.launch .
$ roslaunch cepton_ros demo_single.launch
A rviz window should popup showing the sensor point cloud.
Driver
To view the driver arguments pass the --ros-args option.
$ roslaunch --ros-args cepton_ros driver_single.launch
Using multiple sensors
Create a transforms JSON file (see Transforms). Launch the driver_multi.launch file.
$ roslaunch cepton_ros driver_multi.launch transforms_path:=TRANSFORMS.json
Page 18 of 25
Page 19
The driver will publish separate topics and transforms for each sensor. You must manually launch
rviz, and add the point clouds.
$ rosrun rviz rviz
Troubleshooting
First, try viewing the sensor in CeptonViewer to determine if the issue is related to ROS or the
sensor/network. Also, read through the main Troubleshooting guide. If it is a ROS issue, contact
Cepton for support.
Reference
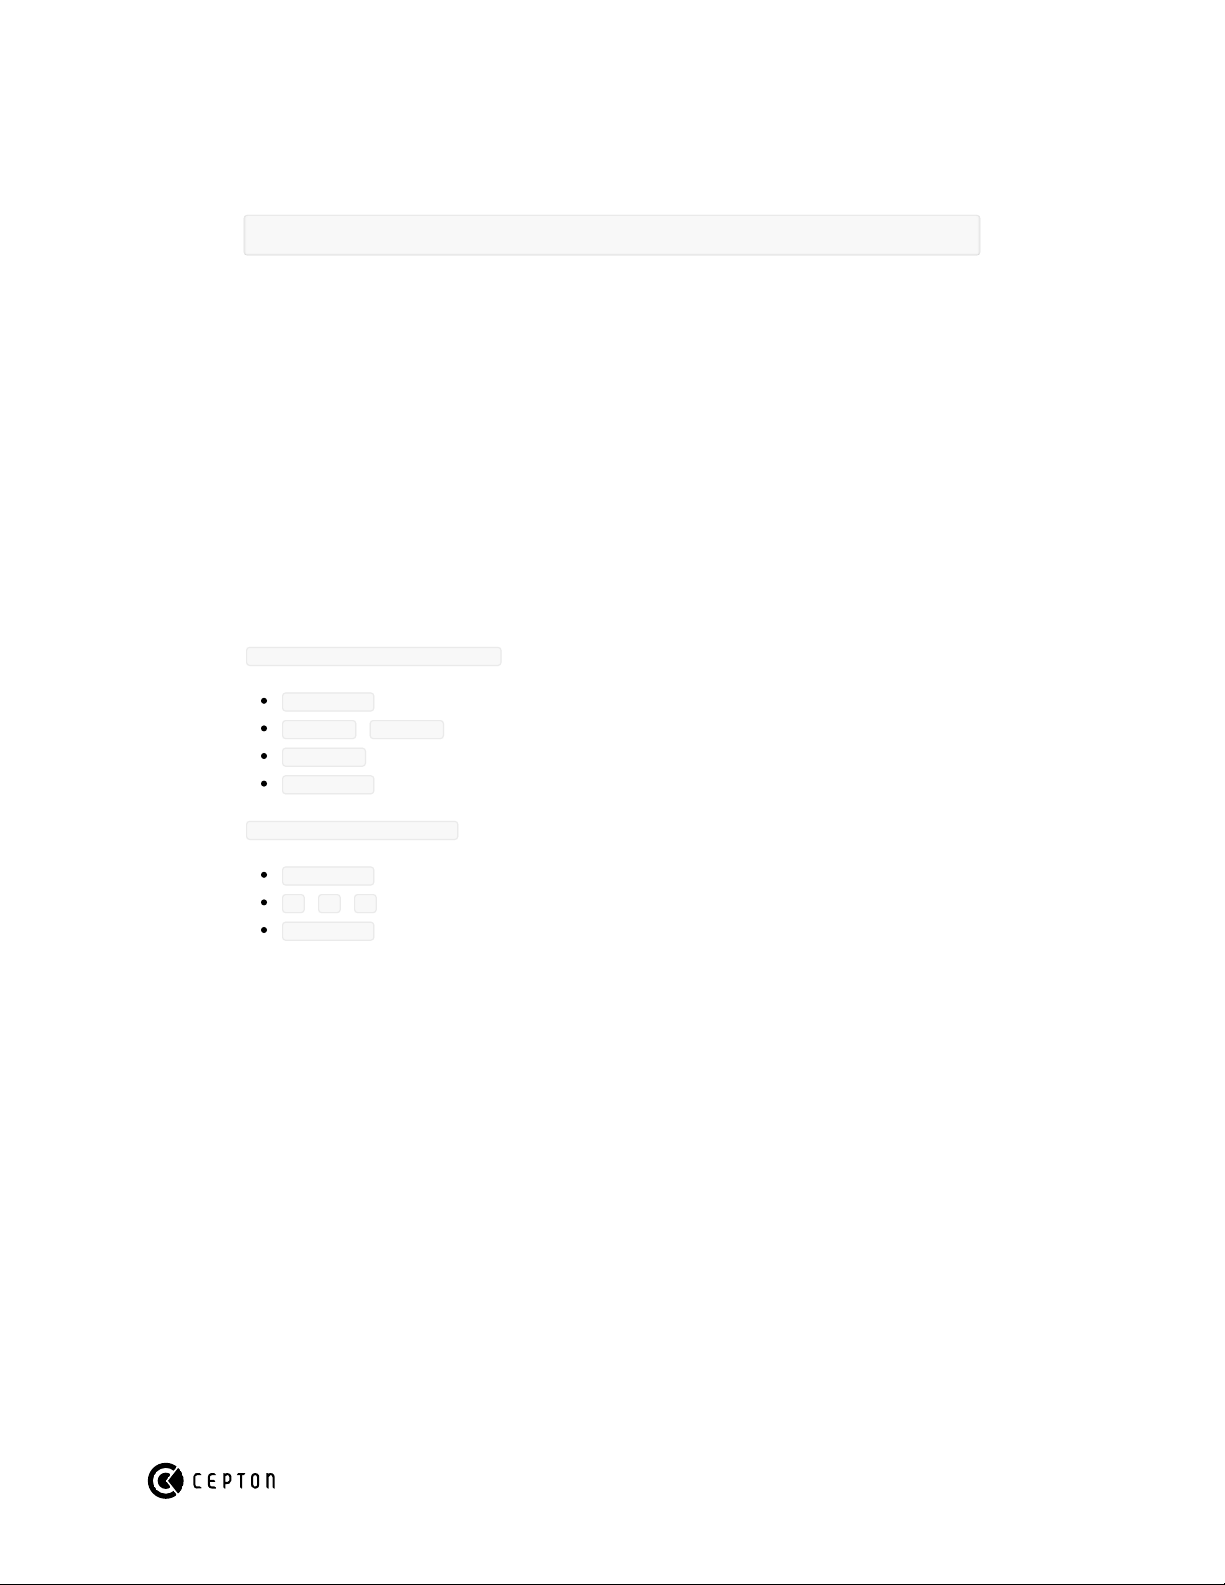
Driver Nodelet
The driver nodelet is a thin wrapper around the Cepton SDK. It publishes sensor messages and
PointCloud2 topics for each sensor. The point type definitions can be found in
include/cepton_ros/point.hpp.
cepton_ros::CeptonImagePoint
timestamp (uint64)
image_x , image_z (float)
distance (float)
intensity (float)
cepton_ros::CeptonPoint
timestamp (uint64)
x , y , z (float)
intensity (float)
Page 19 of 25
Page 20
Accessories
Interface Box
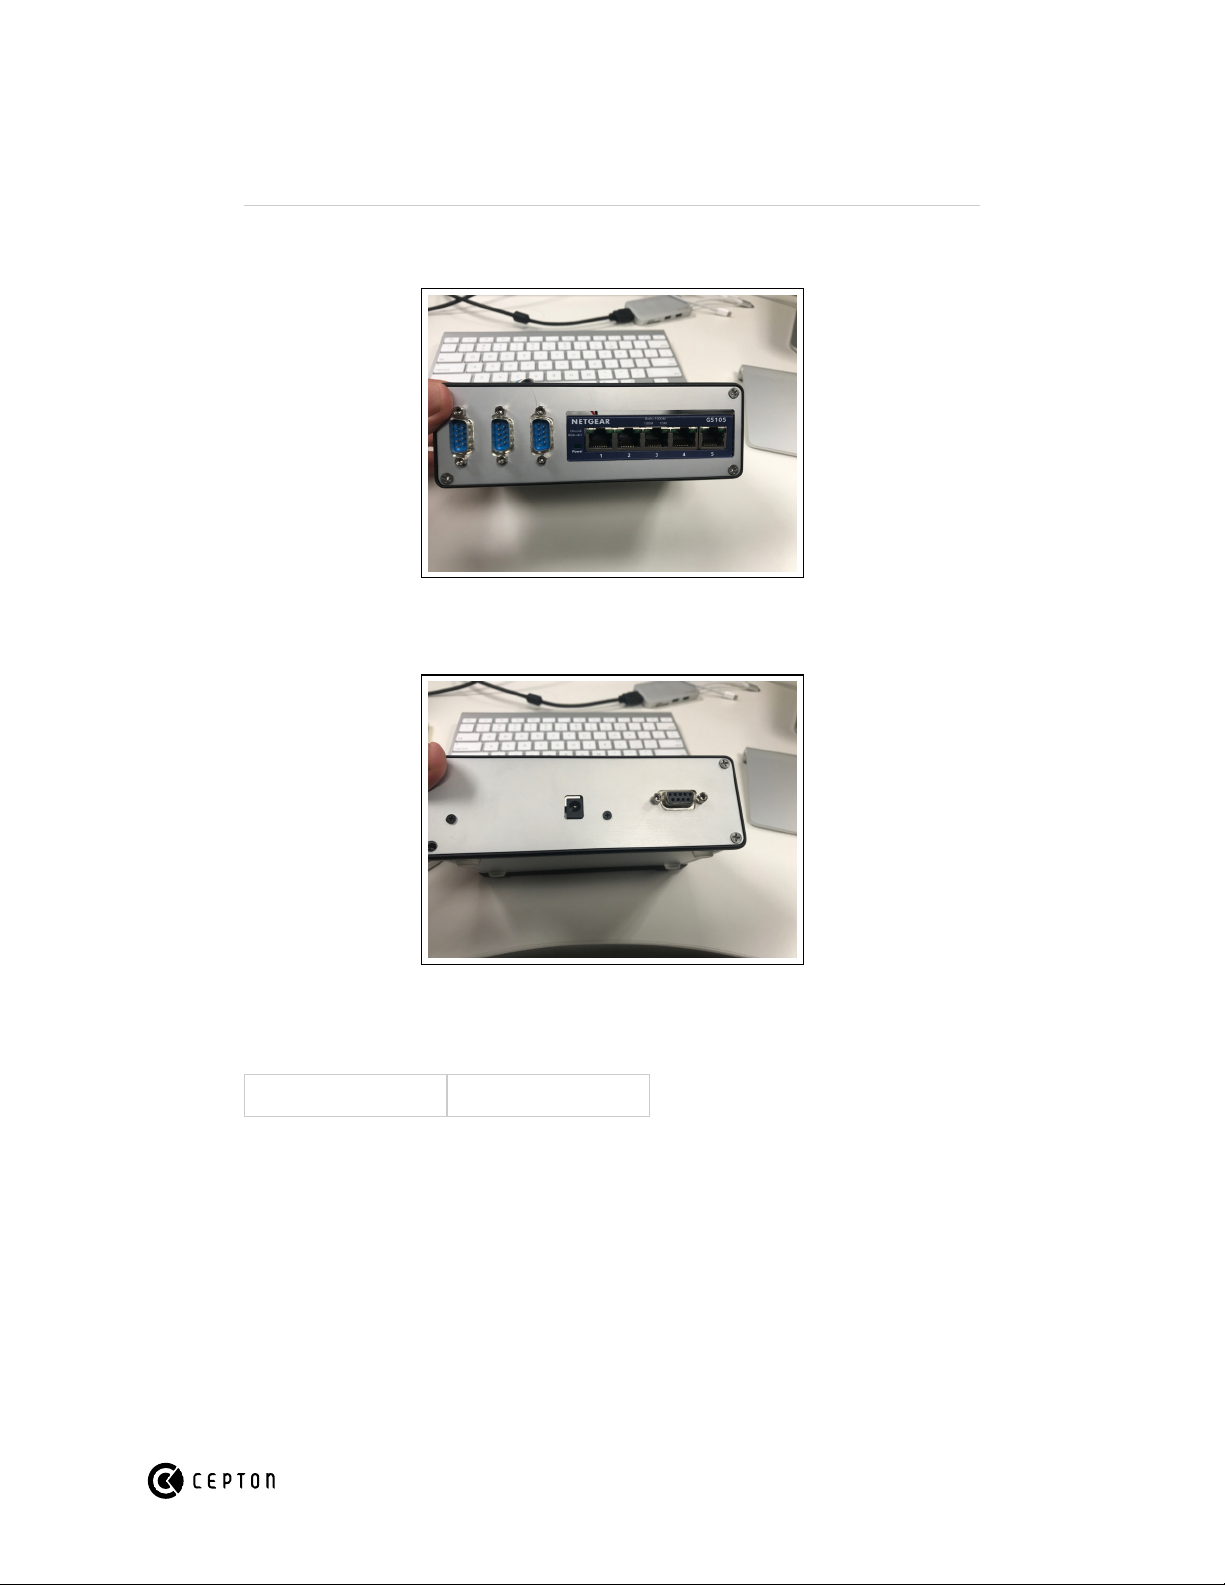
Interface box front.
Interface box back.
Specifications
Dimensions (W x H x D) 17cm x 11.5cm x 5.5cm
Getting Started
Connect the sensor serial cables to the serial ports on the front of the interface box. Connect the
sensor Ethernet cables to the Ethernet ports on the front of the interface box.
Connect the GPS serial cable to the serial port on the back of the interface box.
Connect the supplied power supply to the power port on the back of the interface box.
Connect the host computer's Ethernet to an Ethernet port on the front of the interface box.
Page 20 of 25
Page 21
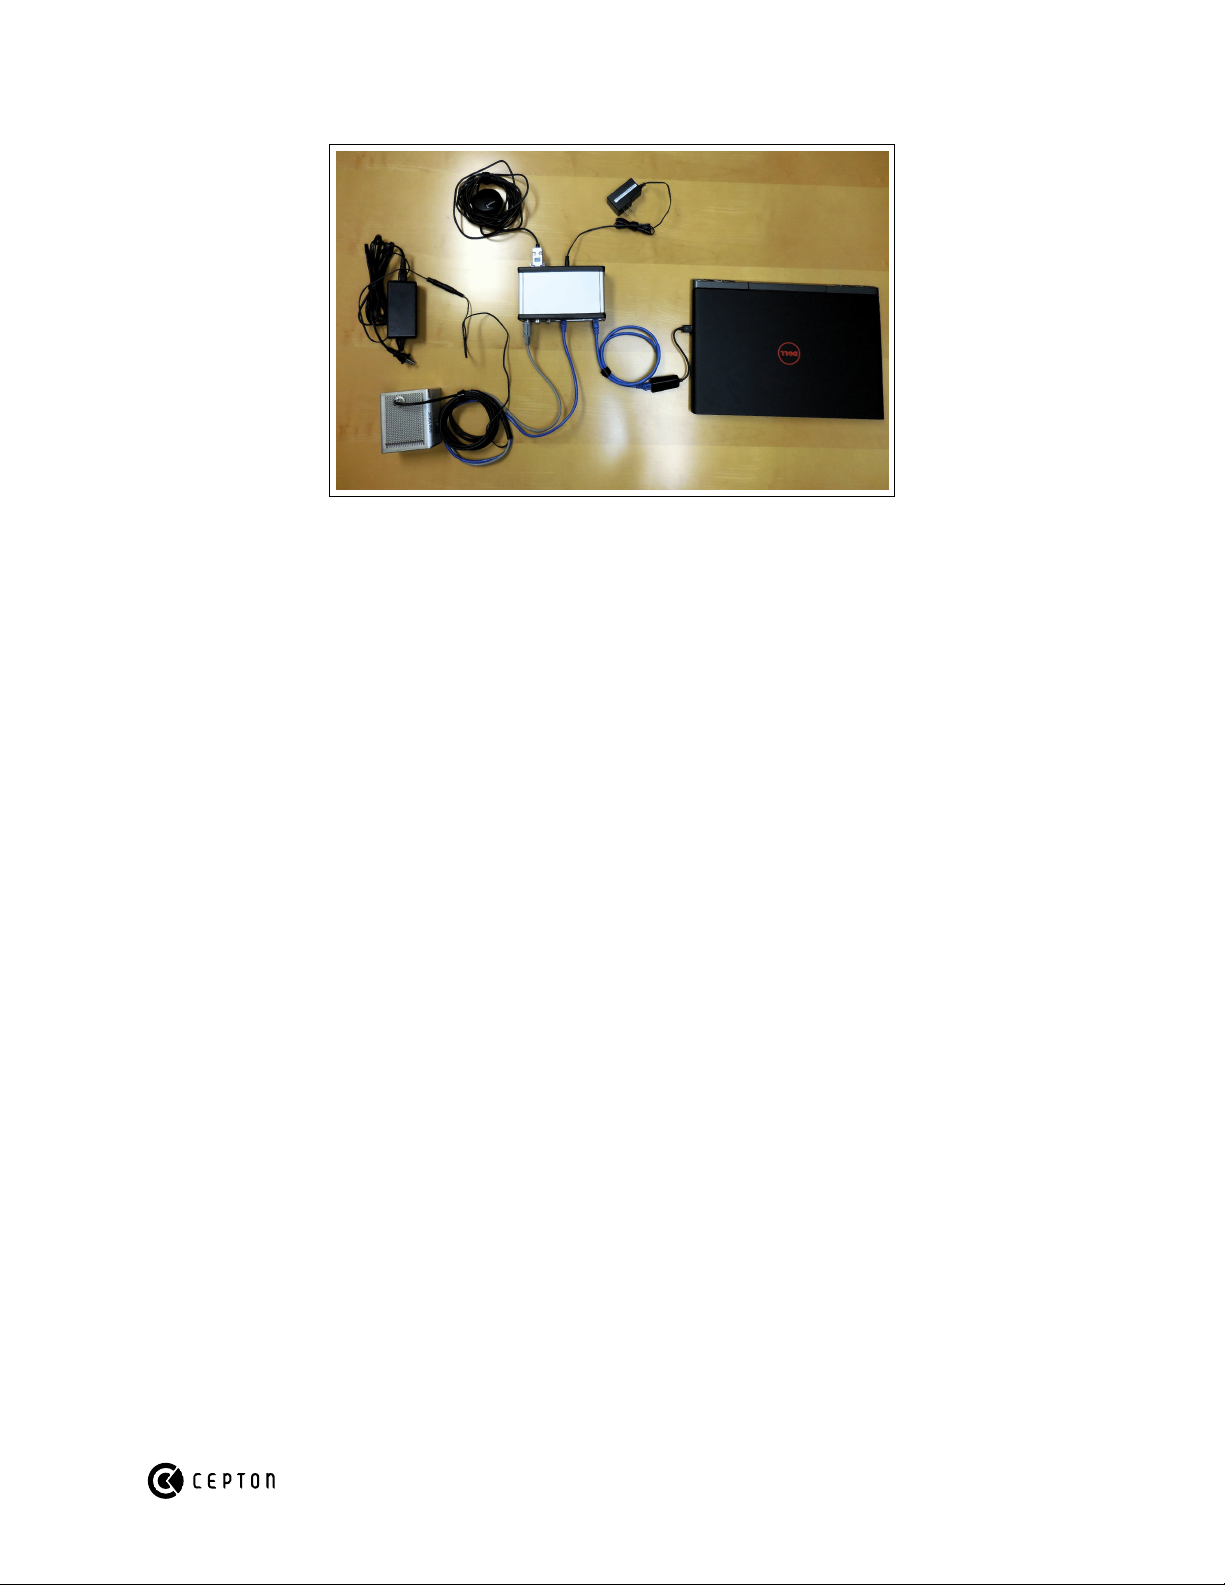
Cable connections.
Multiple Boxes
Each interface box only supports 3 sensors, so multiple interface boxes may be necessary. Use a DB9
splitter to connect the GPS unit to both boxes. Chain the Ethernet hubs together using an ethernet
cable. The host computer's Ethernet only needs to be connected to an Ethernet port on one box.
Page 21 of 25
Page 22

Troubleshooting
Audible Noise
If loud vibration noises are heard, first, ensure that the sensor is properly mechanically isolated (refer
to the Getting Started guide). You can hold the sensor in your hand to determine if the noise is coming
directly from the sensor. If loud vibration, knocking or buzzing noises are heard from the sensor,
contact Cepton for support.
Networking Issue
Download Wireshark , and check that you are receiving packets on port 8808 .
Linux
If you are not receiving packets in Wireshark , the most likely problem is that the network interface is
not assigned an IP address. Check that you have followed all the steps in the Getting Started guide.
Sensor does not appear in CeptonViewer
Check if the sensor is listed at the bottom of the main menu. If the sensor is not listed, read the
Networking Issue section.
Windows
If you are receiving packets from the sensor in Wireshark , the most likely problem is that the firewall
is blocking network access to CeptonViewer . To fix this, rename the CeptonViewer executable,
then reopen it. A firewall popup will appear. Select "Allow access" for both private and public
networks.
Page 22 of 25
Page 23
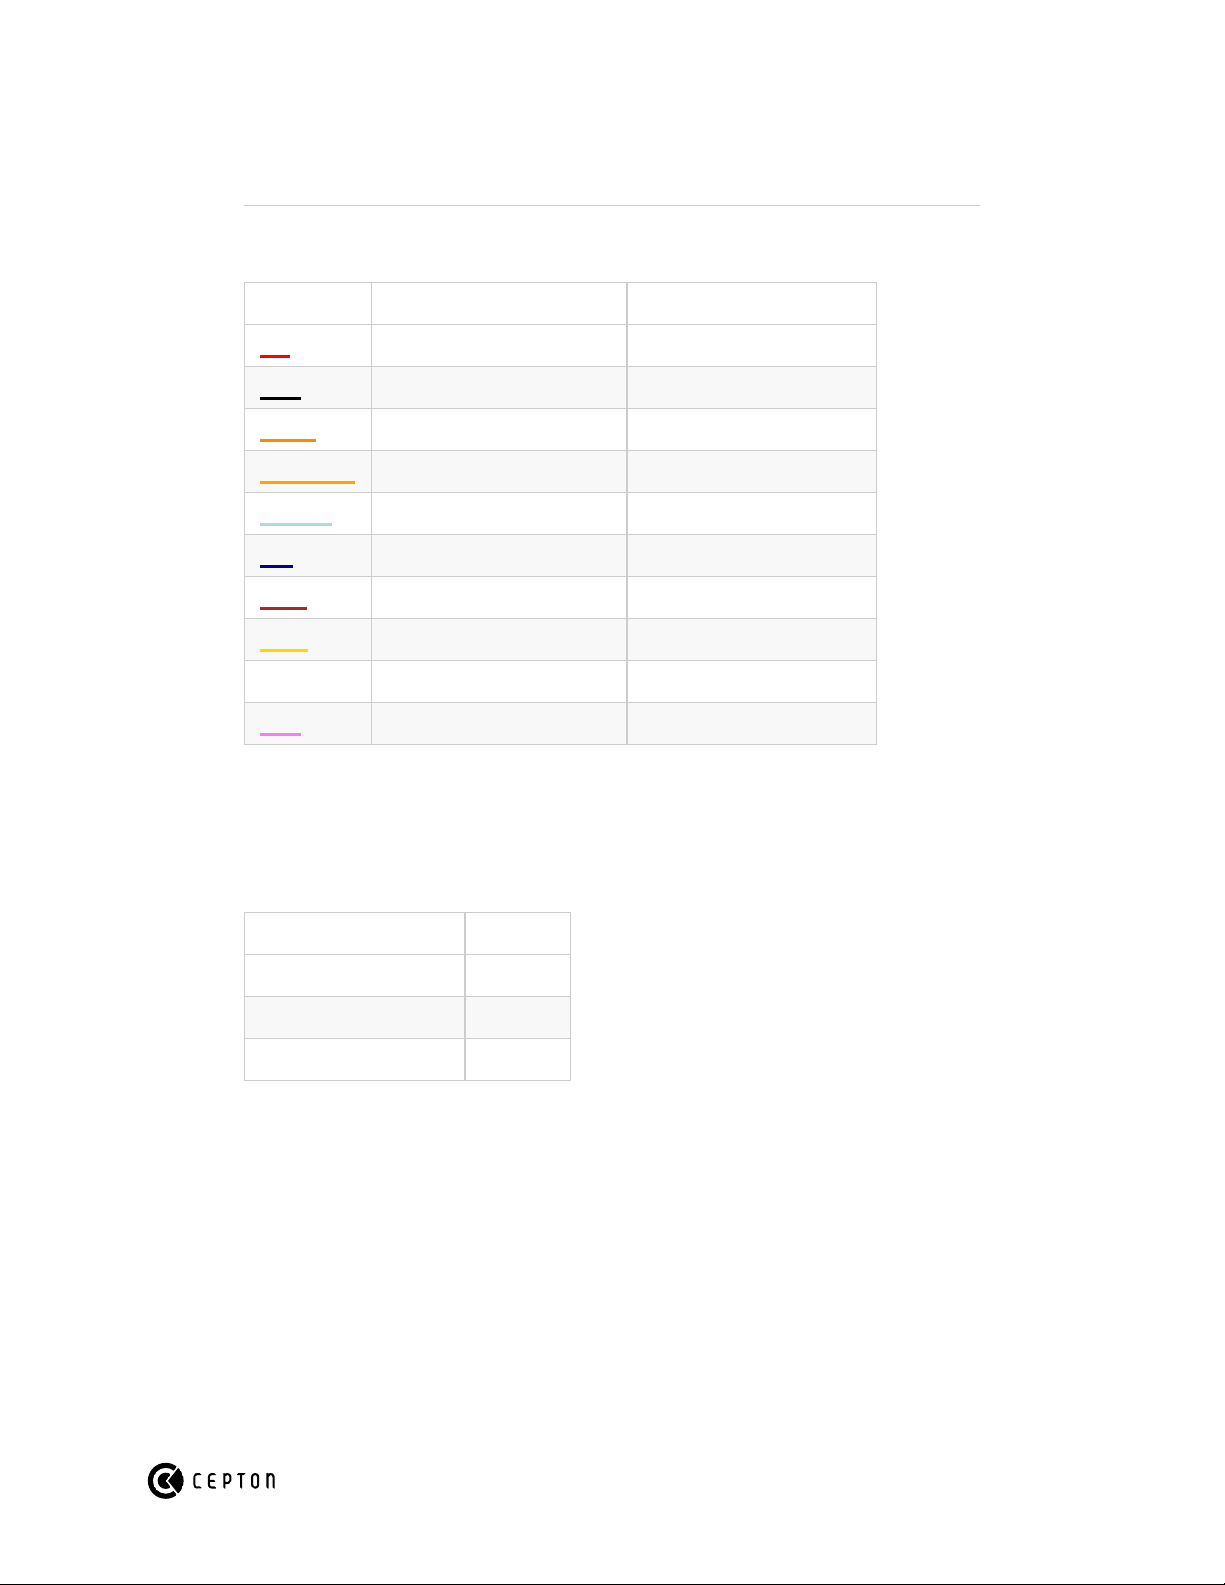
Cables
Sensor Pinout
Color Name Connector
Red 12V Input Barrel Jack Tip
Black GND DB9 Pin 5; Barrel Jack Sleeve
Orange Ethernet RX+ RJ45 Pin 3
Light Orange Ethernet RX- RJ45 Pin 6
Light Blue Ethernet TX+ RJ45 Pin 1
Blue Ethernet TX- RJ45 Pin 2
Brown RS-232 DCD; GPS Pulse Input DB9 Pin 1
Yellow RS-232 RXD; GPS RXD DB9 Pin 2
White RS-232 TXD DB9 Pin 3
Violet NC
GPS
A GPS unit can be connected to the sensor to provide GPS timestamp synchronization. The sensor
listens for the GPRMC NMEA sentence and the PPS signal. The following wires must be connected
between the GPS unit and the sensor:
GPS Sensor
Pulse Output (PPS signal) DB9 Pin 1
TXD (NMEA signal) DB9 Pin 2
GND DB9 Pin 5
Page 23 of 25
Page 24

Drawings
Case
Drawing: http://www.cepton.com/downloads/sora_200_drawing.pdf
CAD: http://www.cepton.com/downloads/sora_200.step
Page 24 of 25
Page 25
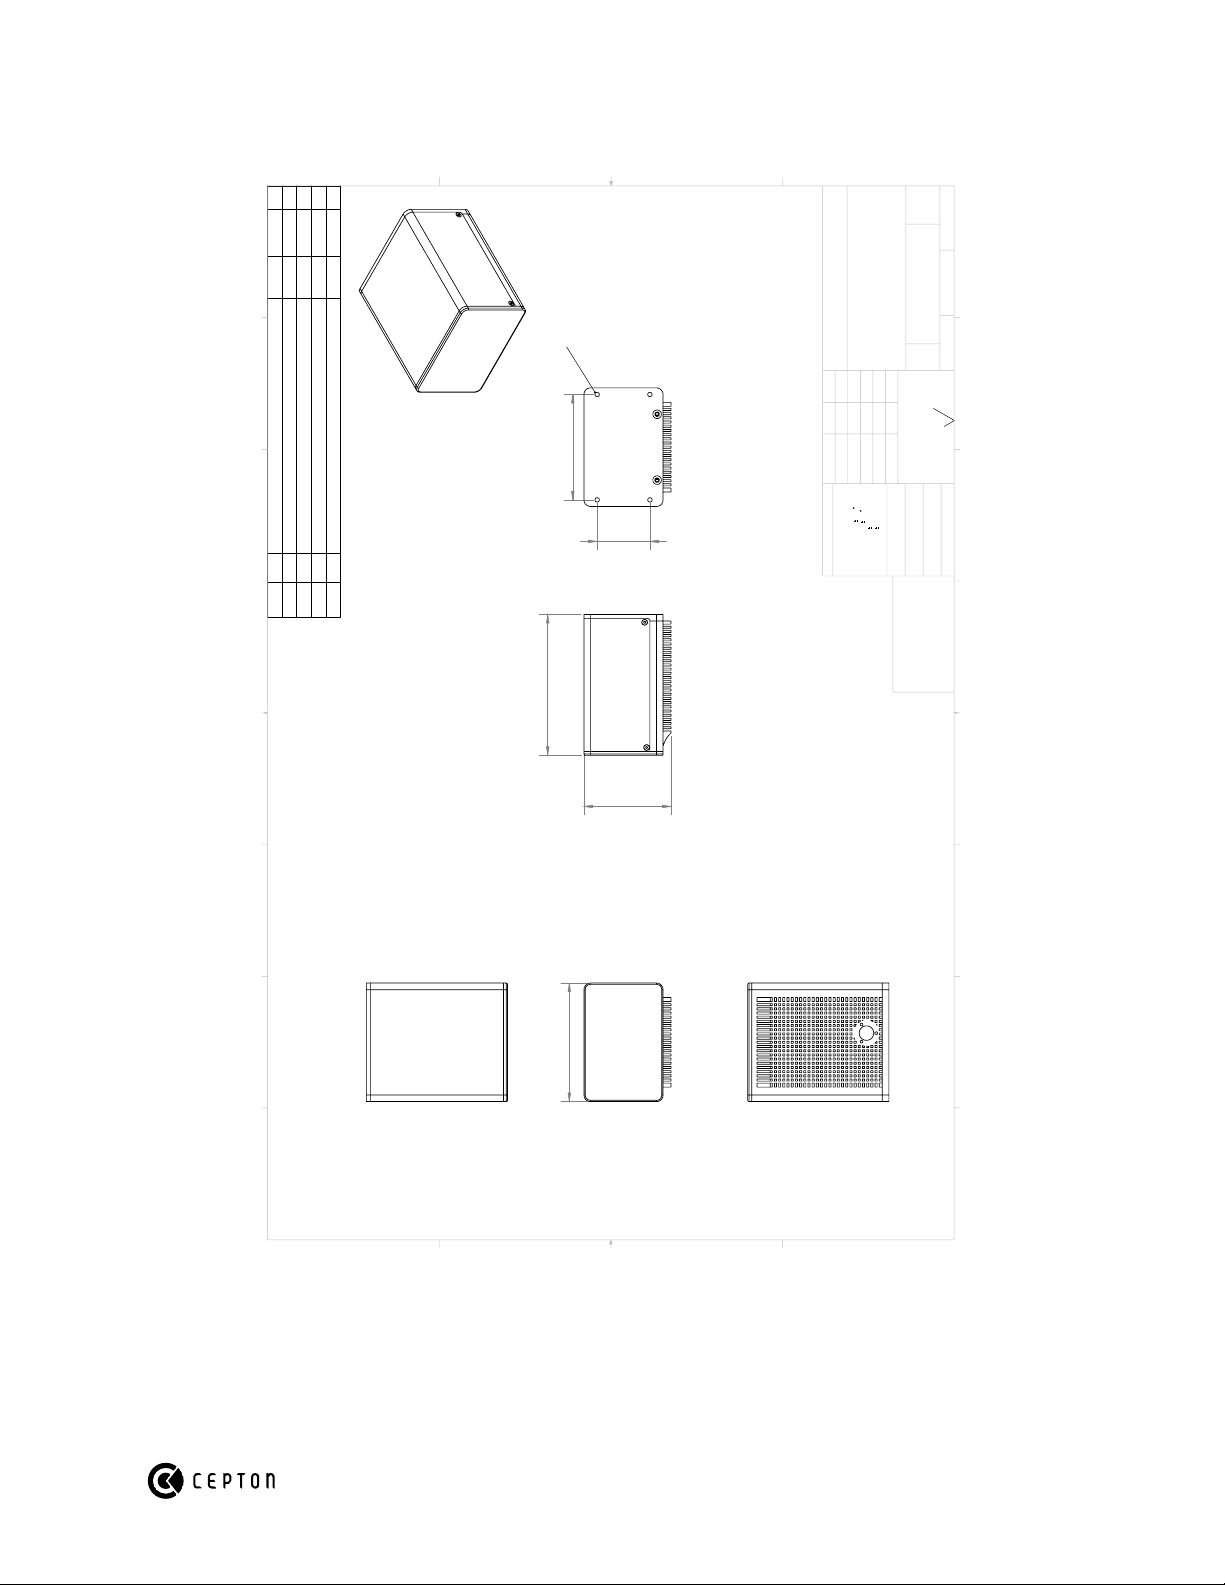
90.00
107.00
66.00
40.00
80.00
4X M4x0.7
ECN
REV
DESC RIPTION
BY
APPROVAL
DATE
D
C
B
A
A
B
C
D
1
2
3
4
5
6
7
8
8
7
6
5
4
3
2
1
THE INFORMATION CONTAINED IN THIS
DRAWING IS THE SOLE PROPERTY OF
CEPTO N TECHNOLOGIES,INC. ANY
REPRODUCTION IN PART OR AS A WHOLE
WITHOUT THE WRITTEN PERMISSION OF
CEPTO N TECHNOLOGIES,INC. IS
PROHIBITED.
PROPRIETARY AND CONFIDENTIAL
DIMENSIONS ARE IN MM [IN]
TOLERANCES:
ANGULAR: MA CH
0.5
BEND
1.0
DECIMAL .X
.25 [.01IN]
DECIMAL .XX
.13 [.005IN]
INTERPRET GEOMETRIC
TOLERANCING PER:
MATERIAL
FINISH
SEE NOTES
SEE NOTES
DRAWN
CHECKED
ENG APPR.
MFG APPR.
Q.A.
COMMENTS:
DATE
NAME
TITLE:
SIZE
B
DWG. NO.
REV
WEIGHT:
SC ALE: 1:2
UNLESS OTHERWISE SPECIFIED:
SORA DEMO MODEL
SHEET 1 OF 1
DO NO T SCALE DRAWING
SURFACE FINISH:
OR BETTER
1.6
NOTES:
MATERIALS:
1.
FINISH:
2.
BREAK ALL SHARP EDG ES.
3.
Cep to n Te c hno log ies, Inc .
Page 25 of 25
 Loading...