

Page 1
Histogram
Bar graph
and line graph
Pie chart
Rectangular
coordinates
Parameter
graph
Inequality
graph
�
STATISTICS
�
TRIGONOMETRY
�
GRAPHS
�
Regression
Other Features
Main Functions
*Comes with snap-on hard case
Performs calculations of paired-variable statistical data and graphs the result.
Standard Deviation Performs calculations of single-variable statistical data
and graphs the result.
Performs calculations for trigonometric & inverse trigonometric functions.
Draws the following types of graphs.
• Program function • Multi-replay function
• 2-line display • Fraction calculations
• Combination and permutation • Differential and
integration • Statistics (STAT-data editor,
Standard deviation, Regression analysis)
• Base-n calculations/conversions
• Logical operations • Complex number
calculations • 7 variables
• Plastic keys • Comes with snap-on hard case
Multi-replay Function, 2-line Display,
Perfect Algebraic Method
Two-way power
Button-type battery
242
FUNCTIONS
2-LINE
BIG
DISPLAY
10+2
DIGITS
MATRIX
• 2-line display shows formulas and results
simultaneously • Versatile program area
management: up to 1,103 program steps,
and 26 (standard) to 163 variables
• Program file system for storing multiple
programs • Replay function
• Engineering symbol calculations
• Formula memory • Integrations
• Statistics (Standard deviation, Regression
analysis)
• Base-n calculations/conversions
• Logical operations
2-line Display and Program File System
NATURAL
TEXTBOOK
28,500
bytes
Multireplay
MATRIX
Plastic
Keys
664
FUNCTIONS
10+2
DIGITS
• Program function • Matrix calculations
• Differential and integration • Recursions
• Solve function • Complex number calculations
•
Base-n calculations • Data transmission between
two fx-5800P calculators • 26 to 2398 variables
• Fraction calculations • 40 scientific constants
• 128 built-in formulas • Multi-replay function
• Statistics (List-based Statistics, Standard
deviation, Regression analysis) • Integrated hard
case swings back a full 360 degrees.
Natural Textbook Display and
MORE POWERFUL Program Functions
• Large display (80 × 48 dots)
• Graphic functions (Rectangular coordinate
graph, Parameter graph, Inequality graph,
Integration graph, Statistical graph, View
window memory, Trace, Box zoom, Sketch
function)
• Table and graph • list-based statistics
• Differentials
• Fraction function
• BASIC-like program functions
• Data communication (
requires optional
FA-124USB for connecting with PC
)
20,000
bytes
ICON
MENU
MATRIX
13
characters
6
lines
by
or
10
DIGITS
9 + 2
DIGITS
406
FUNCTIONS
406
FUNCTIONS
STATdata
Multireplay
MATRIX
Plastic
Keys
WT O
AW Y
OP E
W R
10+2
DIGITS
• Program function • Multi-replay function
• 2-line display • Fraction calculations
• Combination and permutation • 23 built-in
formulas • 40 scientific constants
• Statistics (STAT-data editor, Standard
deviation, Regression analysis)
• 7 variables • Plastic keys
• Comes with slide-on hard case
BASIC-like Program, Perfect Algebraic
Method, 2-line Display, Multi-replay Function
HKEAA
approved model
POWER GRAPHIC
A compact and slim body
with user-friendly design and interface
User-friendly Interface
• Large display (128 × 64 dots) • Graphic functions
• Dynamic graph • Dual graph • Conic section graph
• Regression graph • Graph solve • Integrations
• Differential and quadratic differential calculations
• Complex number calculations • Table and graph
• Recursion graph • List-based statistics
• Advanced statistics • BASIC-like program functions
• Linear equations from two to six unknowns
• Quadratic equations, Cubic equations
•
Matrix operations • Base-n calculations/conversions
• Financial function • Data communications
• High-resolution LCD • High-speed CPU
• Large-capacity 1.5MB Flash Memory
• Spreadsheet • eActivity • Add-in software
• Ready-to-use USB functions • Backlight
• Help and on-screen guidance
EA-200
EA-2
(Windows only)
Program-Link/Manager Software
OHP Projection Unit
(OH-9860)
•fx-9860GII Series
•fx-9860G Series
•fx-9750GII
•fx-9750G Series
•CFX-9850G Series
•fx-7400G Series
fx-9860GII SD
fx-9860GII
USB Cable
USB Cable
USB Cable
SB-62 Cable SB-62 Cable
SD
USB Cable
(OH 9860)
fx-9
fx
USB C
able
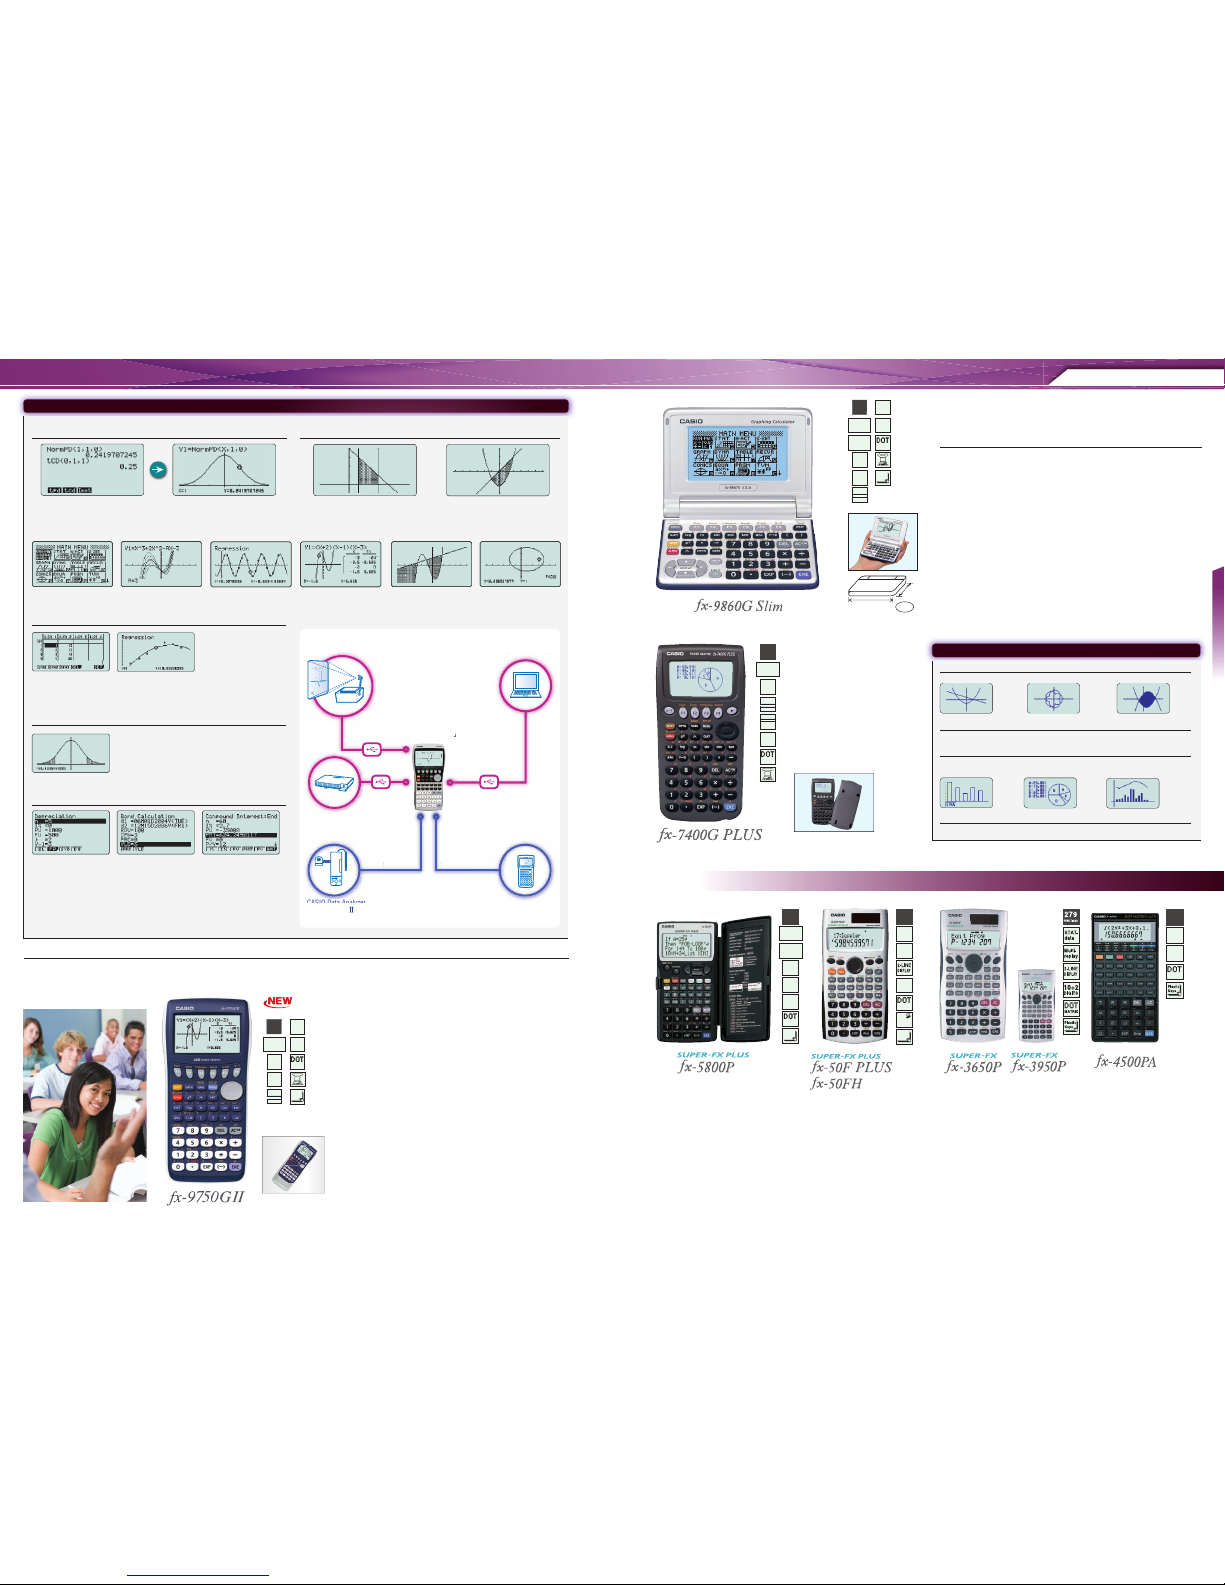
CASIO Data Analyzer (EA-200)
Motion Sensor (EA-2)
EA-2
00
EA-2
S
B-62 Cable
s
S
B-62 Cable
CASIO Data Projector
•Super Slim Series
(
)
Probe
Icon menu
Table & Graph
Regression graphDynamic graph
Integration graph Conic section graph
1-sample t-test graph
Perform tests, confidence interval, probability
distribution, and other calculations and graphing.
Store a list of values in memory for use when performing function and statistical
calculations, when drawing graphs, or when generating tables of numeric values.
Compound interest
Depreciation
Bond calculation
�
Probability
�
List-based Statistics
�
Advanced Statistics
�
Financial Calculations
�
Inequality Graphing
New support for graphing the inequality of an x=Constant graph and x =f(y)
graph allows study of the area for which the x-range is defined.
• Depreciation
• Bond calculation
• Simple interest
• Compound interest
• Investment appraisal (cash flow)
• Amortization
• Interest rate conversion
(annual percentage rate and effective
interest rate)
• Cost, selling price, or margin
• Day or date calculations
Peripherals
• Dot matrix display (64 × 128 dots) • Probability • Inequality Graphing
• Rectangular coordinate graphing, Polar coordinate graphing
• Integration graph• Parametric function graphing • Trace, Zoom (box
zoom, zoom in, zoom out, auto zoom) • Table and Graph • Dual Graph
(table and graph, graph and graph) • Sketch (tangent line, normal line,
inverse function) • Solve (root, minimum, maximum, intersection,
integration) • Dynamic graph • Conic section graph • Recursion graph
• List-based one-variable and two-variable statistical analysis • Statistical
regression calculations • Statistical plot (scatter plot, xy Line, normal
probability plot, histogram, box plot) • Statistical regression graphs (linear,
med-med, quadratic, cubic, quartic, logarithmic, exponential, power,
sinusoidal, logistic regression) • Advanced statistical calculations: tests
(Z-test, t-test, Chi square test, F-test, ANOVA), intervals (Z-interval, t-interval),
distributions • Pie chart • Bar graph • Power functions (square root, cubic
root, square, power, radical root) • GCD/LCM • Coordinate conversion (Pol,
Rec) • Combination/Permutation (nC r, nPr) • Factorial, Inverse, random
numbers, Fractions• Logical operations • Matrix calculations
• Complex number calculations • Base-n calculations/conversions
• List data calculations • Metric Conversion • Numeric equation solver,
simultaneous equations, polynomial equations • Programming • Icon menu
• User memory: 62,000 bytes • Data communication • USB port
SCIENTIFIC CALCULATORS
Programmable Models
200g
122
mm
89
mm
NATURAL
TEXTBOOK
63,000
bytes
1,000
FUNCTIONS
over
Multireplay
ICON
MENU
MATRIX
Plastic
Keys
21
characters
8
lines
by
10+2
DIGITS
Listbased
STAT
List-
based
STAT
List-
based
STAT
POWER GRAPHIC
62,000
bytes
2,800
FUNCTIONS
over
Multireplay
ICON
MENU
MATRIX
Plastic
Keys
21
characters
8
lines
by
10+2
DIGITS
List-
based
STAT
New features give you the tools to create outstanding
classroom presentations!
* Comes with slide-on hard case.
5 6
Normal distribution, student's t-distribution, and other often-used statistical
calculations are provided in function format for easier practical application.
 Loading...