

Page 1
Chapter
Conic Section Graphs
You can graph any one of the following types of conic sections
using the calculator’s built-in functions.
•Parabolic graph
•Circle graph
•Elliptical graph
•Hyperbolic graph
14-1 Before Graphing a Conic Section
14-2 Graphing a Conic Section
14-3 Conic Section Graph Analysis
14
Page 2
14-1 Before Graphing a Conic Section
kk
k Entering the CONICS Mode
kk
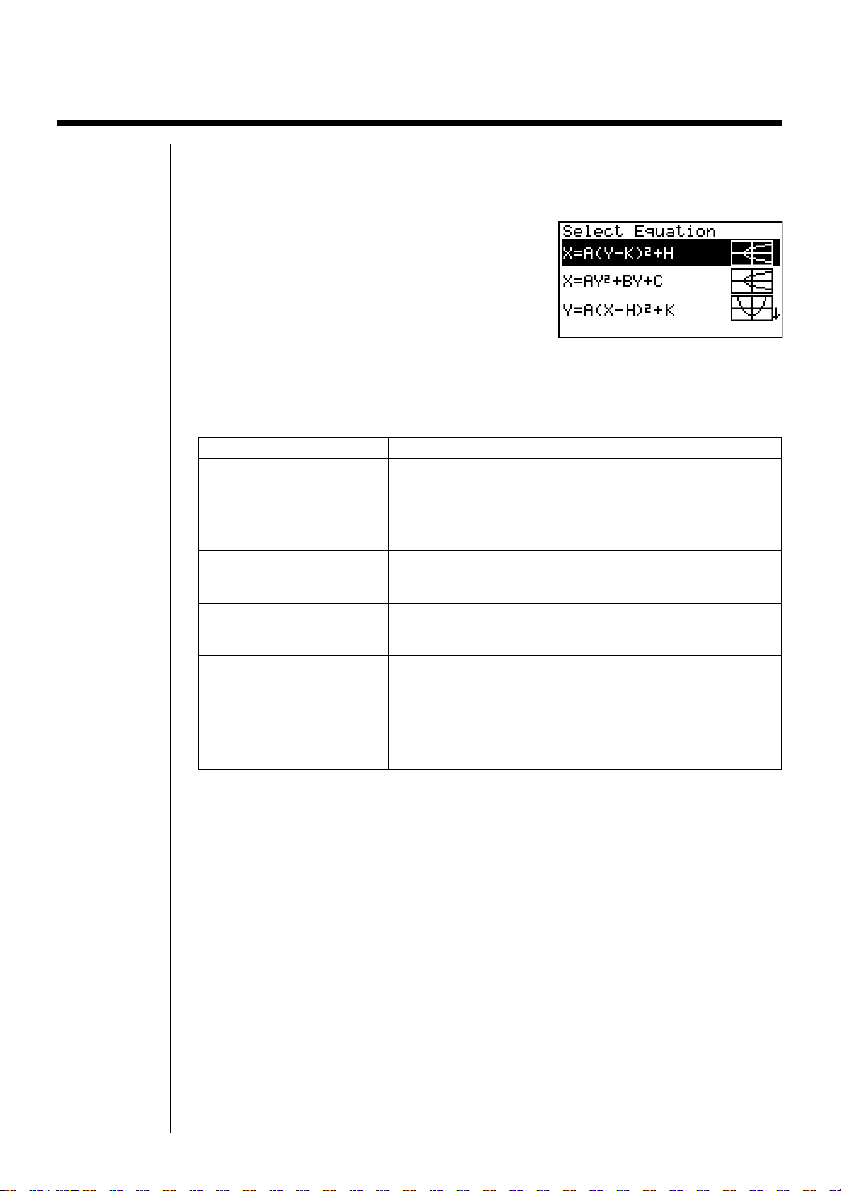
1. In the Main Menu, select the CONICS icon and enter the CONICS Mode.
When you do, the following built in function menu appears on the screen.
2. Use f and c to highlight the built-in function you want, and then press w.
The following nine functions are built in.
Graph Type Function
Parabola X = A (Y – K)2 + H
Circle (X – H)2 + (Y – K)2 = R
Ellipse (X – H)2(Y – K)
Hyperbola (X – H)2(Y – K)
X = AY2 + BY + C
Y = A (X – H)2 + K
Y = AX2 + BX + C
2
AX2 + AY2 + BX + CY + D = 0
–––––––– + –––––––– = 1
2
A
–––––––– – –––––––– = 1
2
A
(Y – K)2(X – H)
–––––––– – –––––––– = 1
2
A
2
2
B
2
2
B
2
2
B
194
Page 3
14-2 Graphing a Conic Section
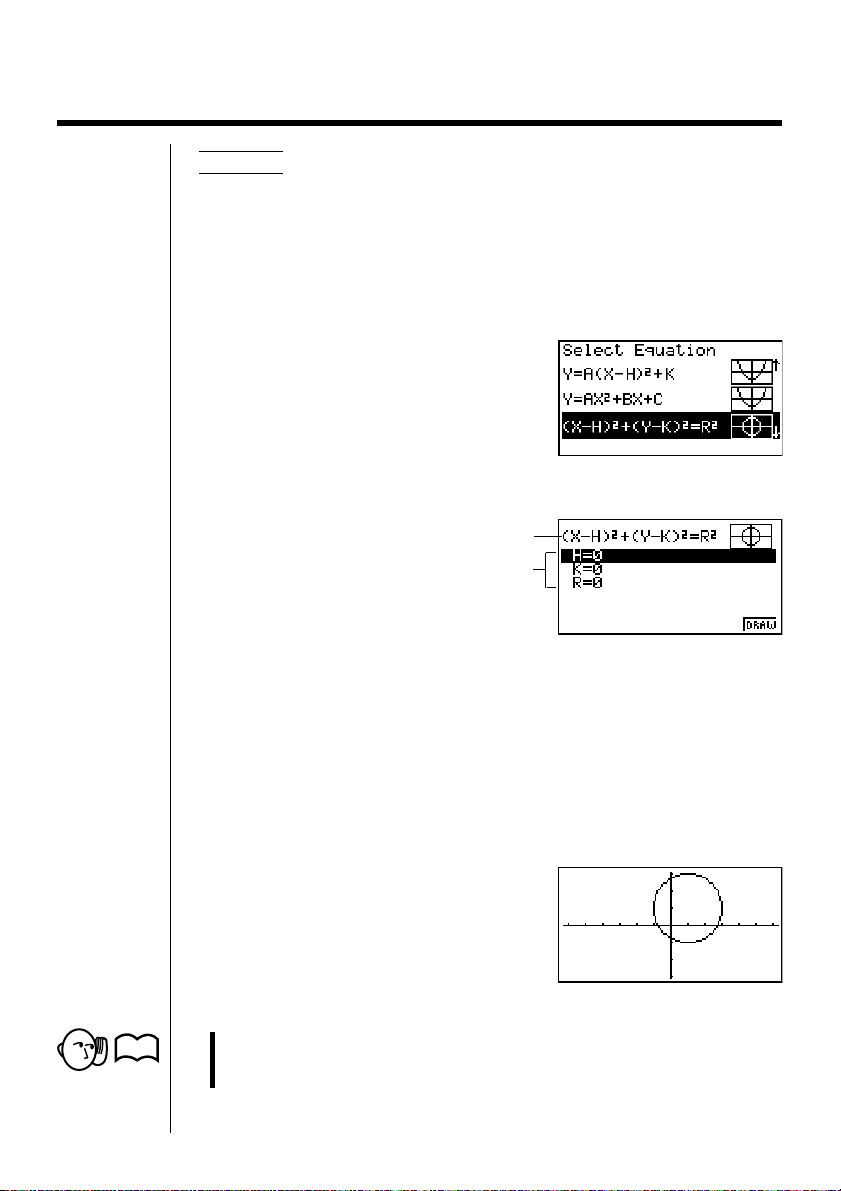
Example 1 To graph the circle (X – 1)2 + (Y – 1)2 = 2
Use the following View Window parameters.
Xmin = –6.3 Ymin = –3.1
Xmax = 6.3 Ymax = 3.1
Xscale = 1 Yscale = 1
1. Select the function whose graph you want to draw.
cccc
2. Press w and the variable input screen appears.
Graph function
Function variables
• The values that appear are the values currently assigned to each variable,
which are general variables used by the calculator. If the values include an
imaginary part, only the real part appears on the display.
2
P. 136
3. Assign values to each variable.
bwbwcw
•You can also use f and c to highlight a variable and then input a value.
4. Press 6 (DRAW) to draw the graph.
•Certain View Window parameters can make a circle graph come out looking
like an ellipse. When this happens, you can use the graph correction function
(SQR) to make corrections and produce a perfect circle.
195
Page 4
14 - 2 Graphing a Conic Section
2
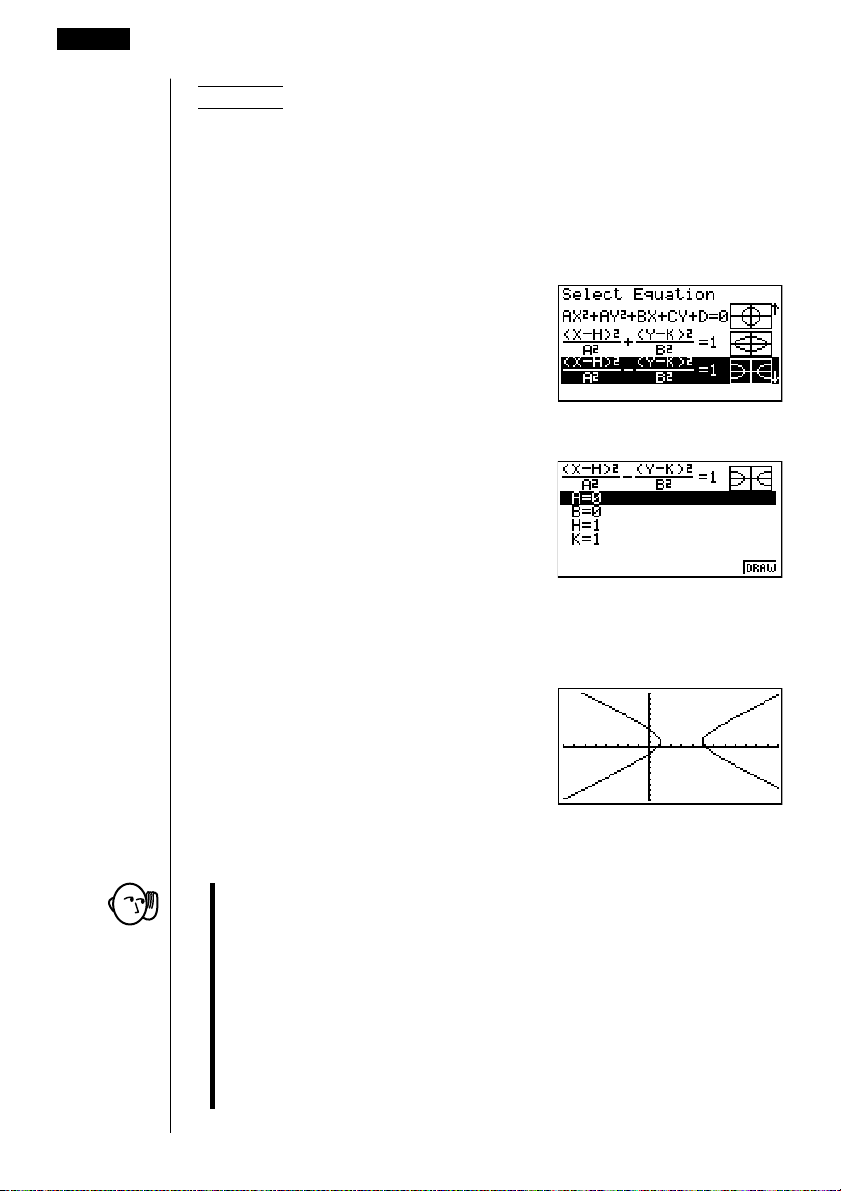
Example 2 To graph the hyperbola –––––––––– – –––––––––– = 1
(X – 3)
2
2
(Y – 1)
2
2
2
Use the following View Window parameters.
Xmin = –8 Ymin = –10
Xmax = 12 Ymax = 10
Xscale = 1 Yscale = 1
1. Select the function whose graph you want to draw.
ccccccc
2. Press w and the variable input screen appears.
3. Assign values to each variable.
cwcwdwbw
196
4. Press 6 (DRAW) to draw the graph.
kk
k Conic Section Graphing Precautions
kk
•Assigning the following types of values to variables contained in built-in
function produces an error.
(1) Parabola graph
A = 0
(2) Circle graph
R = 0 for (X – H)2 + (Y – K)2 = R
2
A = 0 for AX2 + AY2 + BX + CY + D = 0
(3) Ellipse/hyperbola graph
A = 0 or B = 0
Page 5
Graphing a Conic Section 14 - 2
CFX
•Conic section graphs can be drawn in blue only.
•You cannot overwrite conic section graphs.
• The calculator automatically clears the screen before drawing a new conic
section graph.
•You can use trace, scroll, zoom, or sketch after graphing a conic section.
However, a conic section graph cannot be scrolled while using trace.
•You cannot incorporate graphing of a conic section into a program.
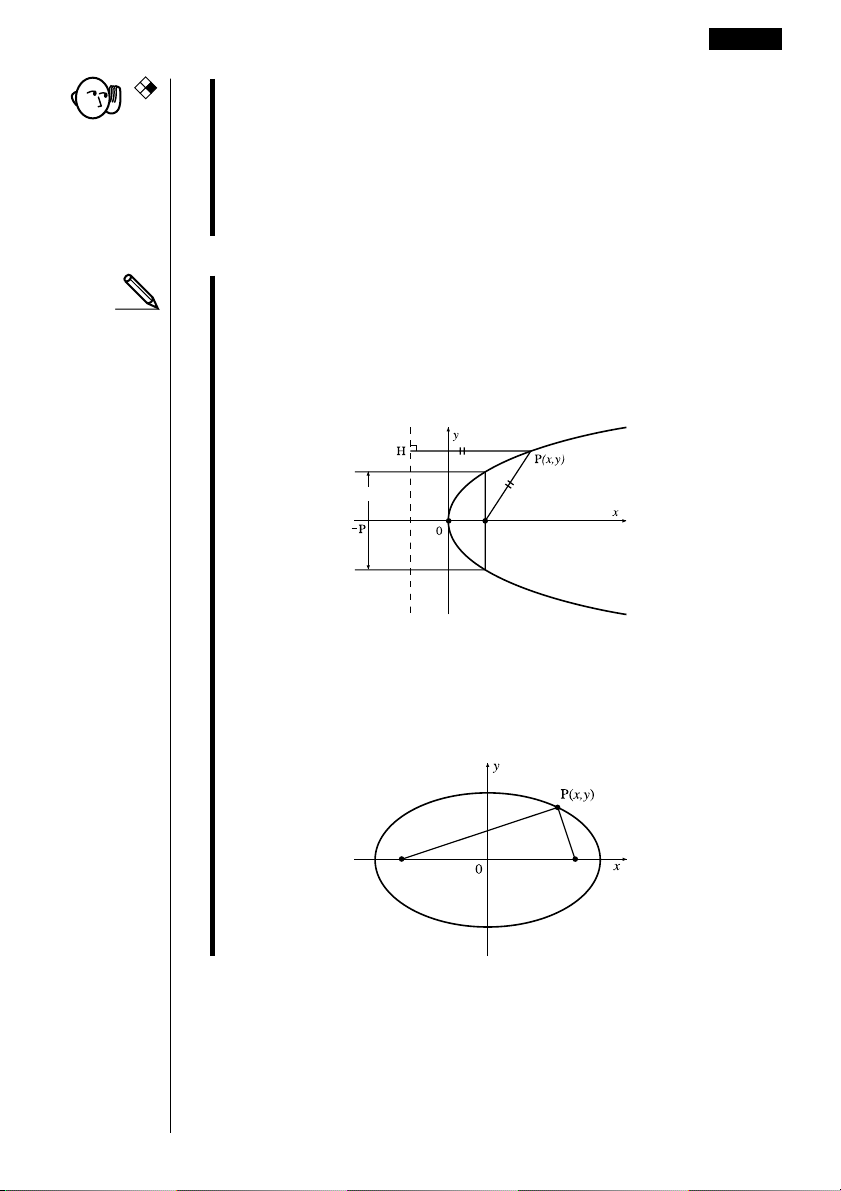
•A parabola is the locus of points equidistant from fixed line l and fixed point F
not on the line. Fixed point F is the “focus,” fixed line l is the “directrix,” the
horizontal line that passes through the focus directrix is the “axis of symmetry,” the length of a straight line that intersects the parabola, passes through
the locus, and is parallel to fixed line l is the “latus rectum,” and point A where
the parabola intersects the axis of symmetry is the “vertex.”
Directrix
l
Latus rectum
Axis of symmetry
Vert ex A
Focus F (p, 0)
•An ellipse is the locus of points the sum of the distances of each of which
from two fixed points F and F’ is constant. Points F and F’ are the “foci,”
points A, A’, B, and B’ where the ellipse intersects the x- and y-axes are the
“vertexes,” the x-coordinate values of vertexes A and A’ are called
x-intercepts, and the y-coordinate values of vertexes B and B’ are called
y-intercepts.
x
-intercept A’
y
-intercept B
Focus F’ Focus F
y
-intercept B’
x
-intercept A
197
Page 6
14 - 2 Graphing a Conic Section
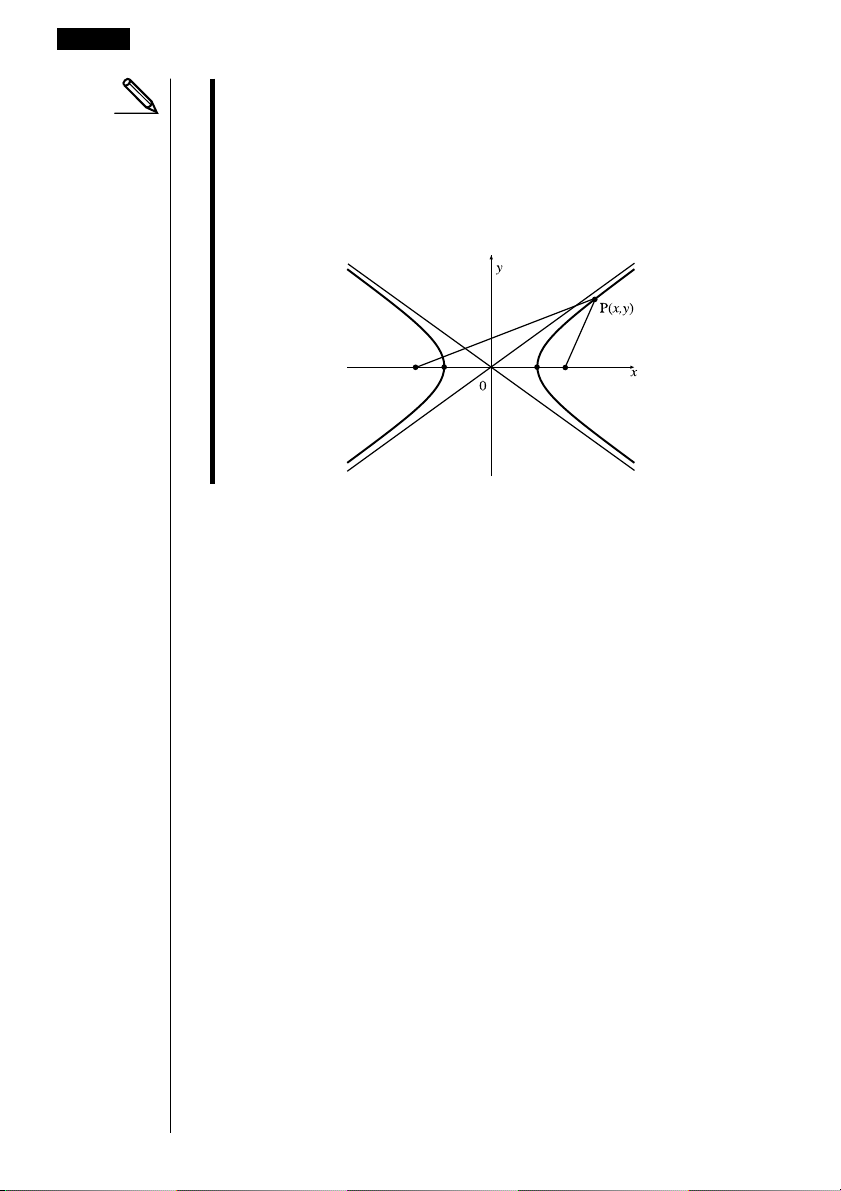
•A hyperbola is the locus of points related to two given points F and F’ such
that the difference in distances of each point from the two given points is
constant.
Points F and F’ are the “foci,” points A and A’ where the hyperbola intersects
the x-axis are the “vertexes,” the x-coordinate values of vertexes A and A’ are
called x-intercepts, the y-coordinate values of vertexes A and A’ are called y-
intercepts, and straight lines l and l' , which get closer to the hyperbola as
they move away from the foci are “asymptotes.”
Asymptote
Focus F'
Asymptote
l
Vert ex
A’
l'
Vert ex
A
Focus F
198
Page 7
14-3 Conic Section Graph Analysis
You can determine approximations of the following analytical results using conic
section graphs.
• Focus/vertex calculation
• Latus rectum calculation
•Center/radius calculation
• x-/y-intercept calculation
•Directrix/axis of symmetry drawing and analysis
•Asymptote drawing and analysis
After graphing a conic section, press 5 (G-Solv) to display the Graph Analysis
Menu.
Parabolic Graph Analysis
• {FOCS} ... {determines the focus}
• {SYM}/{DIR} ... draws the {axis of symmetry}/{directrix}
• {VTX}/{LEN} ... determines the {vertex}/{latus rectum}
Circle Graph Analysis
• {CNTR}/{RADS} ... determines the {center}/{radius}
Ellipse Graph Analysis
• {FOCS}/{X-IN}/{Y-IN} ... determines the {focus}/{x-intercept}/{y-intercept}
Hyperbolic Graph Analysis
• {FOCS}/{X-IN}/{Y-IN}/{VTX} ... determines the {focus}/{x-intercept}/{y-intercept}/
{vertex}
• {ASYM} ... {draws the asymptote}
The following examples show how to use the above menus with various types of
conic section graphs.
uu
uTo calculate the focus and vertex [G-Solv]-[FOCS]/[VTX]
uu
Example To determine the focus and vertex for the parabola
X = (Y – 2)2 + 3
Use the following View Window parameters.
Xmin = –1 Ymin = –5
Xmax = 10 Ymax = 5
Xscale = 1 Yscale = 1
199
Page 8
14 - 3 Conic Section Graph Analysis
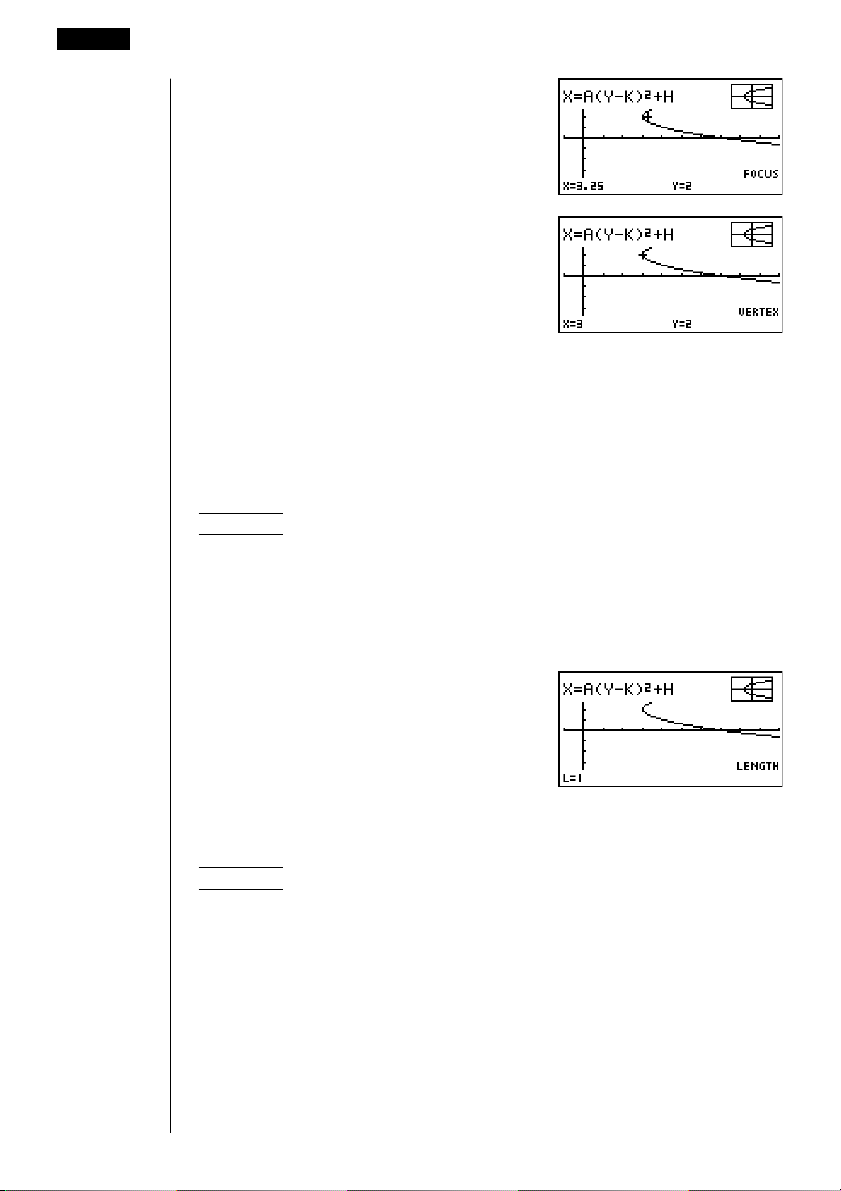
5 (G-Solv)
1 (FOCS)
(Calculates the focus.)
5 (G-Solv)
4 (VTX)
(Calculates the vertex.)
•When calculating two foci for an ellipse or hyperbolic graph, press e to
calculate the second focus. Pressing d returns to the first focus.
•When calculating two vertexes for a hyperbolic graph, press e to calculate
the second vertex. Pressing d returns to the first vertex.
uu
uTo calculate the latus rectum [G-Solv]-[LEN]
uu
Example To determine the latus rectum for the parabola X = (Y – 2)2 + 3
Use the following View Window parameters.
Xmin = –1 Ymin = –5
Xmax = 10 Ymax = 5
Xscale = 1 Yscale = 1
200
5 (G-Solv)
5 (LEN)
(Calculates the latus rectum.)
uu
uTo calculate the center and radius [G-Solv]-[CNTR]/[RADS]
uu
Example To determine the center and radius for the circle
X2 + Y2 – 2X – 2Y – 3 = 0
Use the following View Window parameters.
Xmin = –6.3 Ymin = –3.1
Xmax = 6.3 Ymax = 3.1
Xscale = 1 Yscale = 1
Page 9

Conic Section Graph Analysis 14 - 3
5 (G-Solv)
1 (CNTR)
(Calculates the center.)
5 (G-Solv)
2 (RADS)
(Calculates the radius.)
uu
uTo calculate the x- and y-intercepts [G-Solv]-[X-IN]/[Y-IN]
uu
Example To determine the x- and y-intercepts for the hyperbola
2
(X – 1)
–––––––––– – –––––––––– = 1
2
2
(Y – 1)
2
2
2
Use the following View Window parameters.
Xmin = –6.3 Ymin = –3.1
Xmax = 6.3 Ymax = 3.1
Xscale = 1 Yscale = 1
5 (G-Solv)
2 (X-IN)
(Calculates the x-intercept.)
5 (G-Solv)
3 (Y-IN)
(Calculates the y-intercept.)
•Press e to calculate the second set of x-/y-intercepts. Pressing d returns to
the first set of intercepts.
201
Page 10
14 - 3 Conic Section Graph Analysis
uu
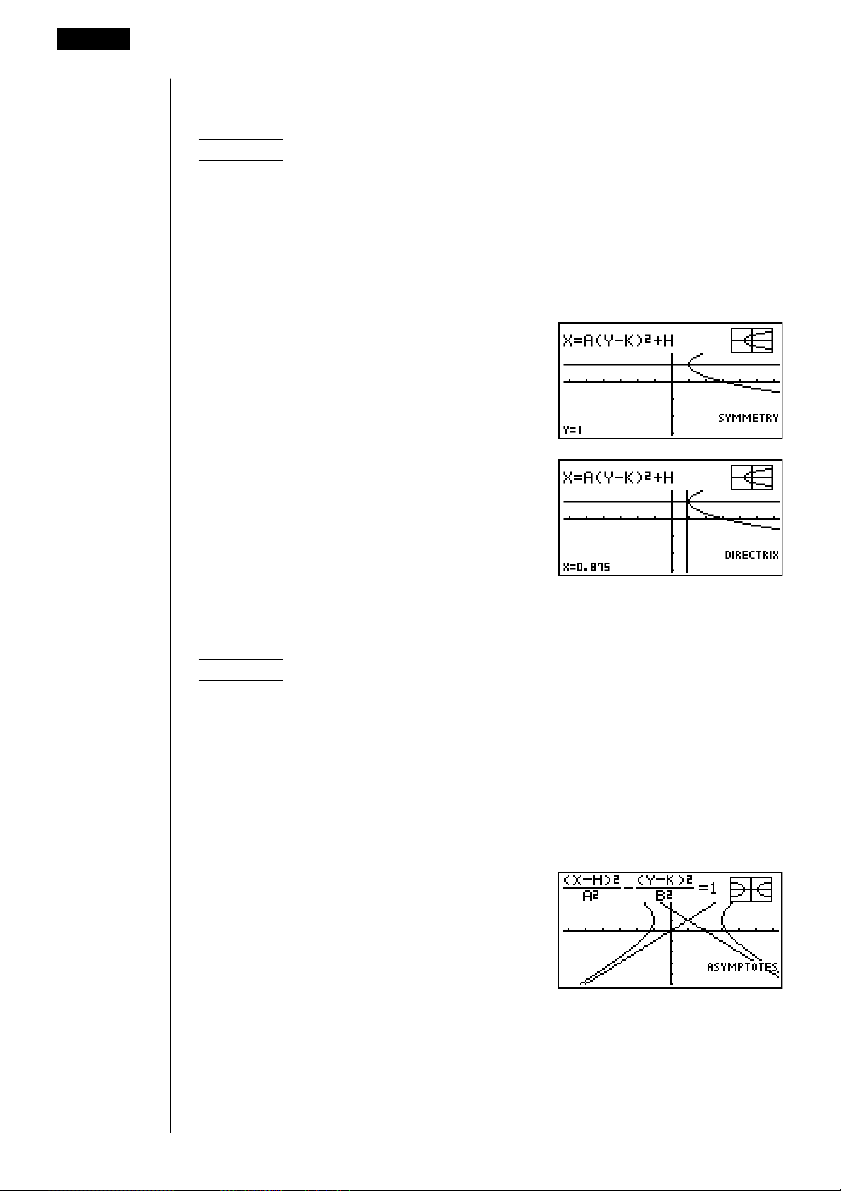
uTo draw and analyze the axis of symmetry and directrix
uu
Example To draw the axis of symmetry and directrix for the parabola
X = 2(Y – 1)2 + 1
Use the following View Window parameters.
Xmin = –6.3 Ymin = –3.1
Xmax = 6.3 Ymax = 3.1
Xscale = 1 Yscale = 1
5 (G-Solv)
2 (SYM)
(Draws the axis of symmetry.)
5 (G-Solv)
3 (DIR)
(Draws the directrix.)
[G-Solv]-[SYM]/[DIR]
202
uu
uTo draw and analyze the asymptotes [G-Solv]-[ASYM]
uu
Example To draw the asymptotes for the hyperbola
2
(X – 1)
–––––––––– – –––––––––– = 1
2
2
(Y – 1)
2
2
2
Use the following View Window parameters.
Xmin = –6.3 Ymin = –5
Xmax = 6.3 Ymax = 5
Xscale = 1 Yscale = 1
5 (G-Solv)
5 (ASYM)
(Draws the asymptotes.)
Page 11

Conic Section Graph Analysis 14 - 3
•Certain View Window parameters can produce errors in values produced as
graph analysis result.
• The message ”Not Found” appears on the display when graph analysis is
unable to produce a result.
• The following can result in inaccurate analysis results or may even make it
impossible to obtain a solution at all.
—When the solution is tangent to the x-axis.
—When the solution is a point of tangency between two graphs.
203
Page 12

204
 Loading...