

Page 1

STAT 2
(Advanced Statistics Application)
Statistical Calculation (STAT) Software for the ALGEBRA FX2.0
1. Modifications Made to ALGEBRA 2.0 by STAT2
2. Tests
3. Confidence Interval
4. Distribution
Page 2
2
MSE =
Σ
1
n – 4
i=1
n
(yi – (ax
i
3
+ bx
i
+ cx
i
+d ))
2
2
MSE =
Σ
1
n – 5
i=1
n
(yi – (ax
i
4
+ bx
i3
+ cx
i
+ dx
i
+ e))
2
2
1.Modifications Made to ALGEBRA 2.0 by STAT2
uu
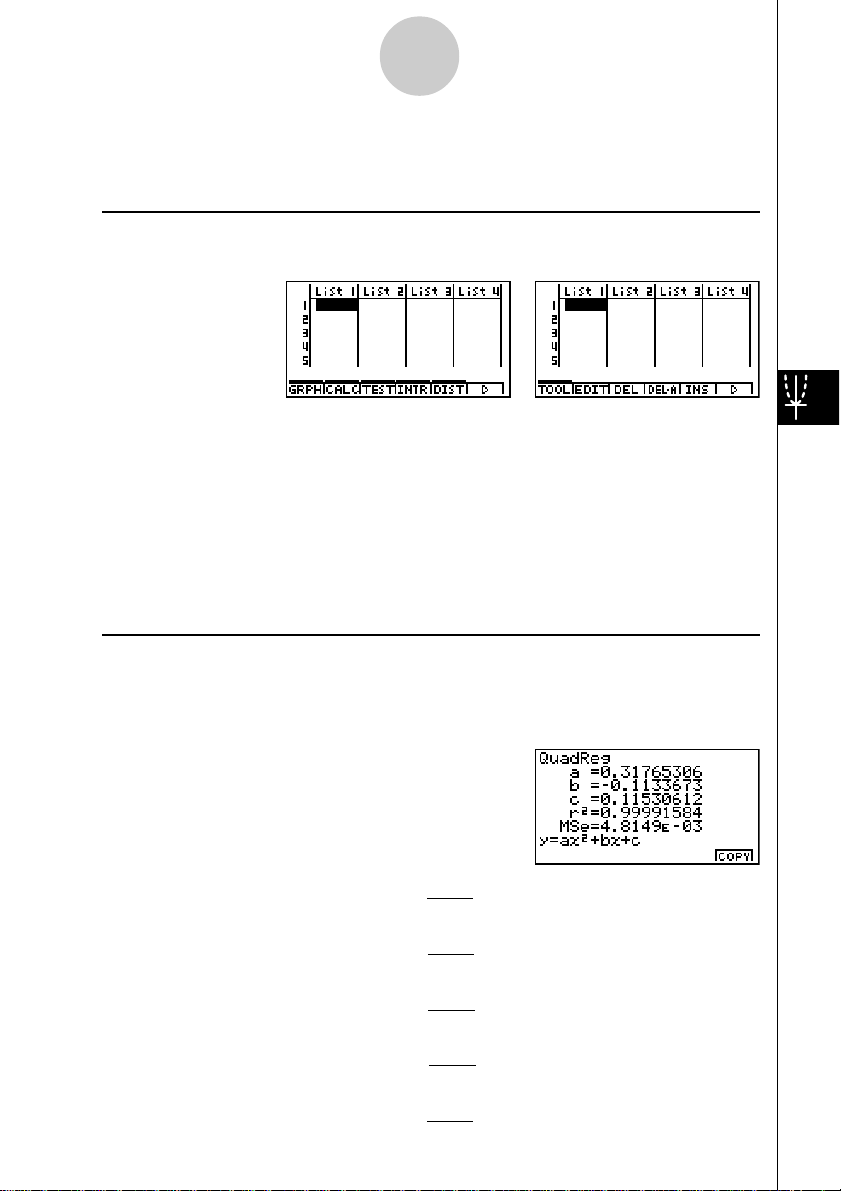
uChanges to the Function Menu
uu
Installing STAT2 changes the function menu of the STAT Mode list input screen (initial
screen) as shown below.
Pressing a function key that corresponds to the added item displays a menu that lets you
select one of the functions listed below.
• 3(TEST) ... Test (Chapter 2, page 6)
• 4(INTR) ... Confidence interval (Chapter 3, page 31)
• 5(DIST) ... Distribution (Chapter 4, page 42)
The SORT and JUMP functions available with ALGEBRA FX2.0 are moved to the TOOL
menu (6 and 1) by STAT2.
uu
uCalculation of the Coefficient of Determination (r2) and MSE
uu
STAT2 adds calculation of the coefficient of determination (r2) for quadratic regression, cubic
regression, and quartic regression. The following types of MSE calculations are also added
for each type of regression.
• Linear Regression ...
• Quadratic Regression ...
MSE =
MSE =
1
n – 2
1
n – 3
(yi – (axi+ b))
Σ
i=1
n
(yi – (ax
Σ
i=1
2
2
i
+ bxi+ c))
2
n
• Cubic Regression ...
• Quartic Regression ...
n
• Logarithmic Regression ...
MSE =
1
n – 2
(yi – (a + b ln xi ))
Σ
i=1
2
Page 3

• Exponential Repression ...
MSE =
Σ
1
n – 2
i=1
n
(ln yi – (ln a + b ln xi ))
2
MSE =
Σ
1
n – 2
i=1
n
(yi – (a sin (bxi + c) + d ))
2
• Power Regression ...
• Sin Regression ...
3
MSE =
1
n – 2
n
(ln yi – (ln a + bxi ))
Σ
i=1
2
n
• Logistic Regression ...
uu
uEstimated Value Calculation for Regression Graphs
uu
STAT2 adds a Y-CAL function that uses regression to calculate the estimated y-value for a
particular x-value after a paired-variable statistic regression graph is drawn.
The following is the general procedure for using the Y-CAL function.
1. After drawing a regression graph, press 62 (Y-CAL) to enter the graph selection mode,
and then press w.
If there are multiple graphs on the display, use f and c to select the graph you want, and
then press w.
• This causes an x-value input dialog box to appear.
2. Input the value you want for x and then press w.
MSE =
1
n – 2 1 + ae
Σ
i=1
yi –
2
C
-bx
i
• This causes the coordinates for x and y to appear at the bottom of the display, and moves
the pointer to the corresponding point on the graph.
3. Pressing v or a number key at this time causes the x-value input dialog box to reappear
so you can perform another estimated value calculation if you want.
4. After you are finished, press i to clear the coordinate values and the pointer from the
display.
· The pointer does not appear if the calculated coordinates are not within the display range.
Page 4

4
· The coordinates do not appear if [Off] is specified for the [Coord] item of the [SETUP] screen.
· The Y-CAL function can also be used with a graph drawn by using DefG feature.
uu
uRegression Formula Copy Function from a Regression Calculation Result
uu
Screen
In addition to the existing regression formula copy function that lets you copy the regression
calculation result screen after drawing a statistical graph (such as Scatter Plot), STAT2 also
adds a function that lets you copy the regression formula obtained as the result of a regression
calculation. This type of copy operation is performed by pressing 6(COPY).
kk
k Tests, Confidence Interval, and Distribution Calculations
kk
STAT2 adds functions for performing tests, confidence interval, and distribution calculations.
This manual fully describes each of these calculations in separate chapters: Chapter 2 Tests,
Chapter 3 Confidence Interval, and Chapter 4 Distribution.
uu
uParameter Settings
uu
The following describes the two methods you can use to make parameter settings for test,
confidence interval, and distribution calculations.
• Selection
With this method, you press the function key that corresponds to the setting you want to
select from the function menu.
• Value Input
With this method, you directly input the parameter value you want to input. In this case,
nothing appears in the function menu.
· Pressing i returns to the list input screen, with the cursor in the same position it was at
before you started the parameter setting procedure.
· Pressing ! i (QUIT) returns to the top of list input screen.
· Pressing w without pressing 1 (CALC) under “Execute” item advances to calculation ex-
ecution. To return to the parameter setting screen, press i, A, or w.
uu
uCommon Functions
uu
• The symbol “■” appears in the upper right corner of the screen while execution of a calcula-
tion is being performed and while a graph is being drawn. Pressing A during this time
terminates the ongoing calculation or draw operation (AC Break).
• Pressing i or w while a calculation result or graph is on the display returns to the param-
eter setting screen. Pressing ! i (QUIT) returns to the top of list input screen.
Page 5

5
· Pressing A while a calculation result is on the display returns to the parameter setting screen.
• Pressing u 5 (G↔T) after drawing a graph switches to the parameter setting screen
(G↔T function). Pressing u 5 (G↔T) again returns to the graph screen.
· The G↔T function is disabled whenever you change a setting on the parameter setting screen
, or when you perform a u 3 (SET UP) or ! K (V-Window) operation.
• You can perform the PICT menu's screen save or recall functions after drawing a graph.
· The ZOOM Function and SKETCH function are disabled.
The TRACE function is desabled, except for the geaph display of two-way ANOVA.
The graph screen cannot be scrolled.
• After drawing a graph, you can use a Save Result feature to save calculation results to a
specific list. Basically, all items are saved as they are displayed, except for the first line title.
· Each time you execute Save Result, any existing data in the list is replaced by the new
results.
 Loading...